Zip Codes with the Highest Percentage of Population Employed in Architecture & Engineering in Hamilton, OH
RELATED REPORTS & OPTIONS
Architecture & Engineering
Hamilton
Compare Zip Codes
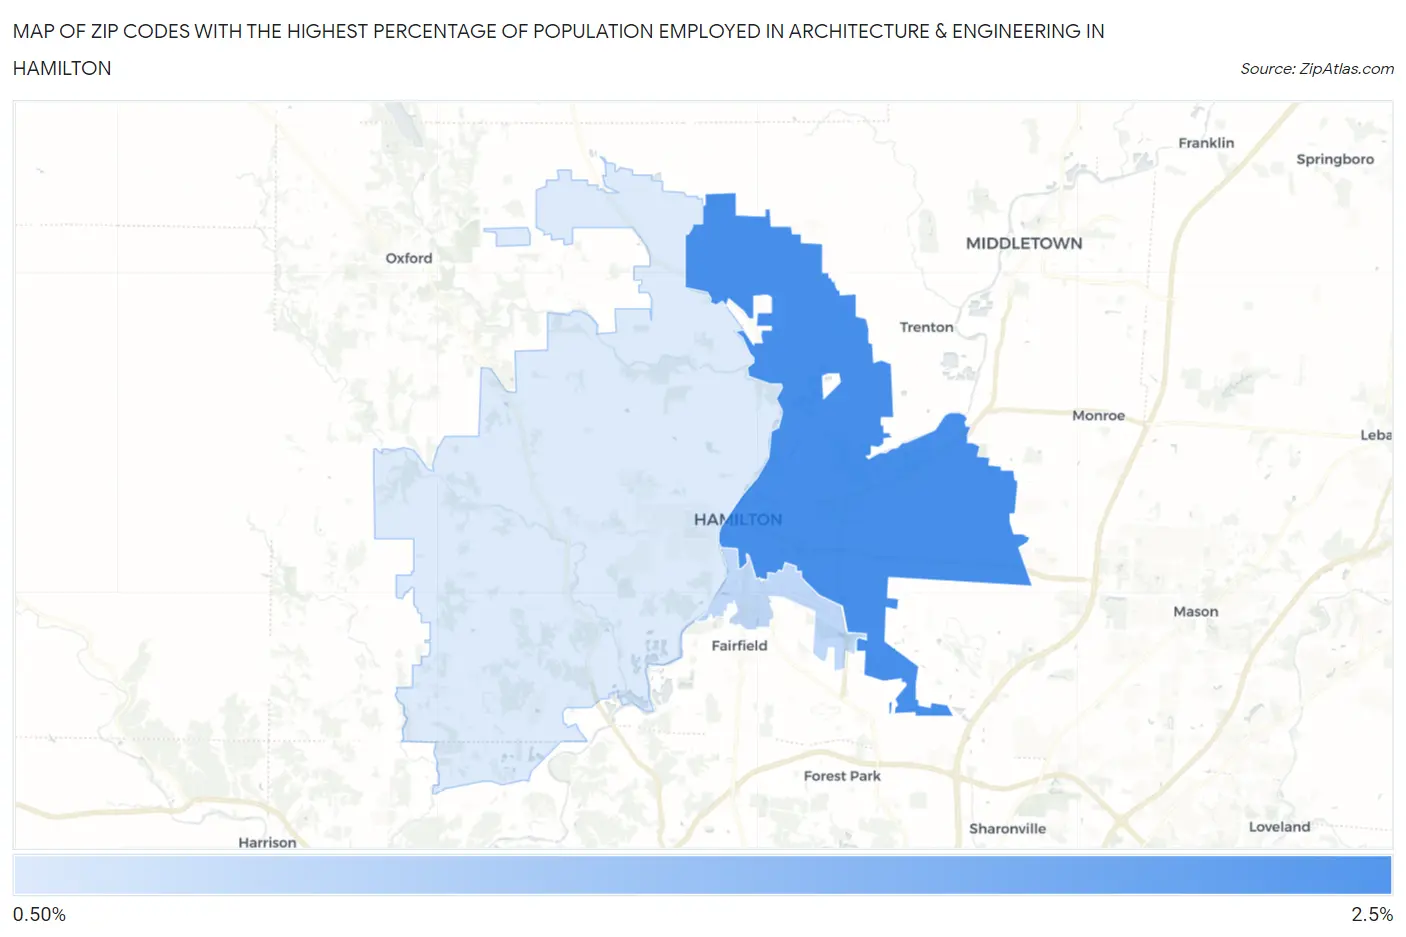
Map of Zip Codes with the Highest Percentage of Population Employed in Architecture & Engineering in Hamilton
1.1%
2.1%
Zip Codes with the Highest Percentage of Population Employed in Architecture & Engineering in Hamilton, OH
| Zip Code | % Employed | vs State | vs National | |
| 1. | 45011 | 2.1% | 2.1%(-0.003)#393 | 2.1%(-0.018)#8,863 |
| 2. | 45015 | 1.3% | 2.1%(-0.806)#607 | 2.1%(-0.821)#14,114 |
| 3. | 45013 | 1.1% | 2.1%(-1.01)#672 | 2.1%(-1.03)#15,700 |
1
Common Questions
What are the Top Zip Codes with the Highest Percentage of Population Employed in Architecture & Engineering in Hamilton, OH?
Top Zip Codes with the Highest Percentage of Population Employed in Architecture & Engineering in Hamilton, OH are:
What zip code has the Highest Percentage of Population Employed in Architecture & Engineering in Hamilton, OH?
45011 has the Highest Percentage of Population Employed in Architecture & Engineering in Hamilton, OH with 2.1%.
What is the Percentage of Population Employed in Architecture & Engineering in Hamilton, OH?
Percentage of Population Employed in Architecture & Engineering in Hamilton is 1.2%.
What is the Percentage of Population Employed in Architecture & Engineering in Ohio?
Percentage of Population Employed in Architecture & Engineering in Ohio is 2.1%.
What is the Percentage of Population Employed in Architecture & Engineering in the United States?
Percentage of Population Employed in Architecture & Engineering in the United States is 2.1%.