Cities with the Highest Percentage of Population Employed in Utilities in Ohio
RELATED REPORTS & OPTIONS
Utilities
Ohio
Compare Cities
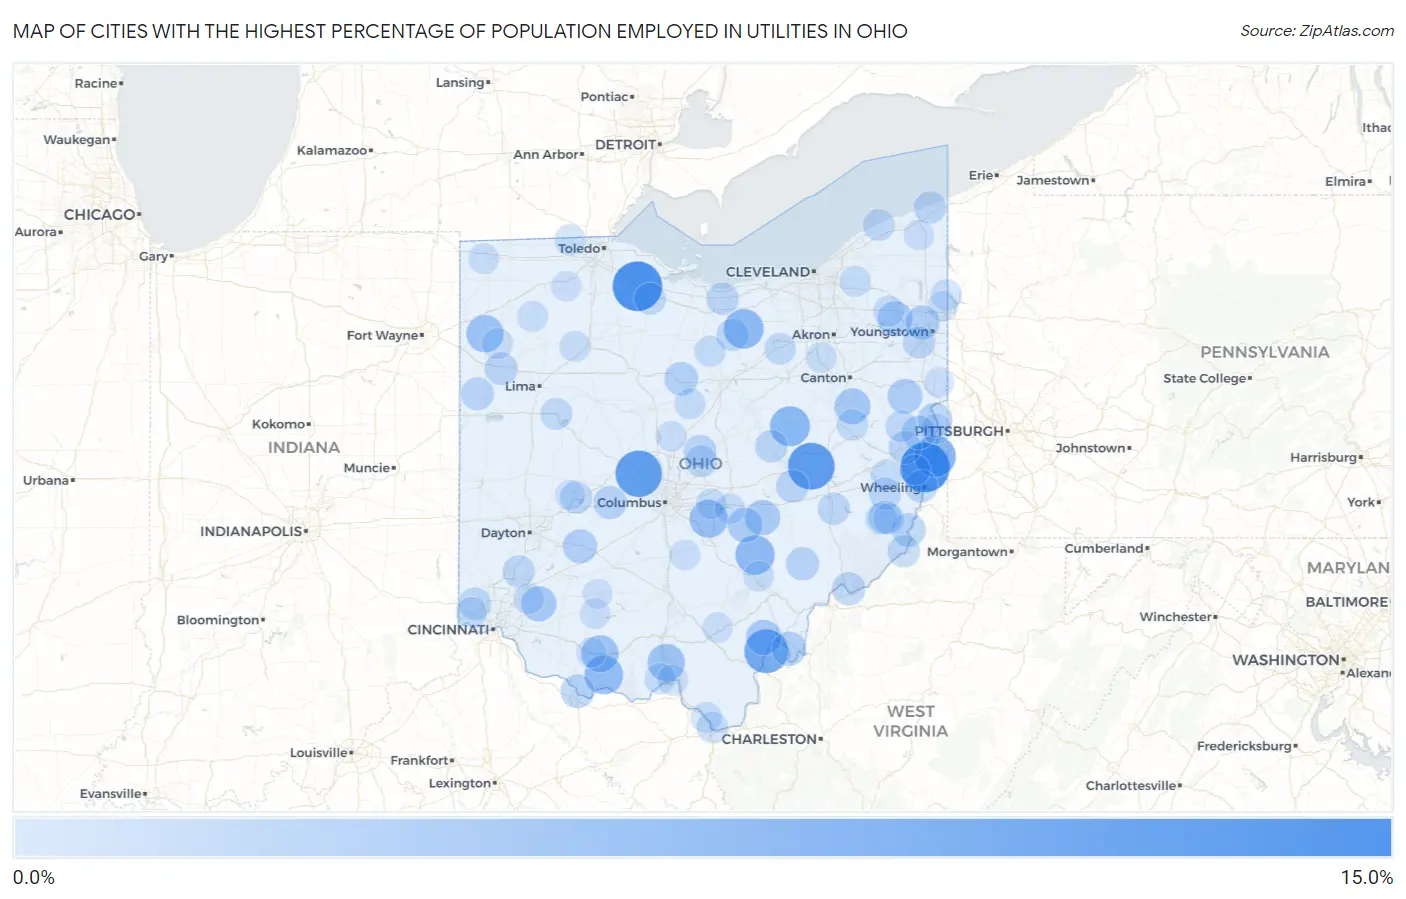
Map of Cities with the Highest Percentage of Population Employed in Utilities in Ohio
0.0%
15.0%
Cities with the Highest Percentage of Population Employed in Utilities in Ohio
| City | % Employed | vs State | vs National | |
| 1. | Connorville | 14.6% | 0.80%(+13.8)#1 | 0.84%(+13.8)#302 |
| 2. | Hessville | 14.6% | 0.80%(+13.8)#2 | 0.84%(+13.8)#303 |
| 3. | Plainfield | 12.9% | 0.80%(+12.1)#3 | 0.84%(+12.1)#360 |
| 4. | New California | 12.7% | 0.80%(+11.8)#4 | 0.84%(+11.8)#375 |
| 5. | Cheshire | 11.1% | 0.80%(+10.3)#5 | 0.84%(+10.3)#462 |
| 6. | Brilliant | 9.6% | 0.80%(+8.80)#6 | 0.84%(+8.77)#564 |
| 7. | Lake Buckhorn | 8.6% | 0.80%(+7.83)#7 | 0.84%(+7.80)#651 |
| 8. | Rochester | 8.5% | 0.80%(+7.65)#8 | 0.84%(+7.61)#675 |
| 9. | Shawnee | 8.2% | 0.80%(+7.42)#9 | 0.84%(+7.39)#694 |
| 10. | West Union | 7.8% | 0.80%(+7.03)#10 | 0.84%(+6.99)#751 |
| 11. | Baltimore | 7.5% | 0.80%(+6.71)#11 | 0.84%(+6.67)#791 |
| 12. | Latty | 7.0% | 0.80%(+6.24)#12 | 0.84%(+6.21)#853 |
| 13. | Lucasville | 7.0% | 0.80%(+6.18)#13 | 0.84%(+6.15)#864 |
| 14. | Seaman | 6.9% | 0.80%(+6.12)#14 | 0.84%(+6.09)#875 |
| 15. | Woodsdale | 6.9% | 0.80%(+6.08)#15 | 0.84%(+6.04)#888 |
| 16. | Mineral City | 6.1% | 0.80%(+5.30)#16 | 0.84%(+5.27)#1,080 |
| 17. | Rutland | 5.9% | 0.80%(+5.08)#17 | 0.84%(+5.05)#1,131 |
| 18. | Pleasant Plain | 5.8% | 0.80%(+5.02)#18 | 0.84%(+4.99)#1,156 |
| 19. | Fultonham | 5.8% | 0.80%(+4.99)#19 | 0.84%(+4.96)#1,169 |
| 20. | Somerset | 5.6% | 0.80%(+4.76)#20 | 0.84%(+4.73)#1,235 |
| 21. | Summitville | 5.6% | 0.80%(+4.75)#21 | 0.84%(+4.72)#1,242 |
| 22. | Newton Falls | 5.5% | 0.80%(+4.73)#22 | 0.84%(+4.69)#1,251 |
| 23. | Empire | 5.4% | 0.80%(+4.55)#23 | 0.84%(+4.52)#1,303 |
| 24. | Racine | 5.1% | 0.80%(+4.34)#24 | 0.84%(+4.31)#1,399 |
| 25. | Jamestown | 5.1% | 0.80%(+4.31)#25 | 0.84%(+4.27)#1,415 |
| 26. | Hilltop | 5.1% | 0.80%(+4.29)#26 | 0.84%(+4.25)#1,424 |
| 27. | Richmond | 4.9% | 0.80%(+4.07)#27 | 0.84%(+4.04)#1,519 |
| 28. | North Robinson | 4.9% | 0.80%(+4.07)#28 | 0.84%(+4.04)#1,520 |
| 29. | Clarington | 4.9% | 0.80%(+4.07)#29 | 0.84%(+4.04)#1,521 |
| 30. | Pekin | 4.9% | 0.80%(+4.06)#30 | 0.84%(+4.03)#1,528 |
| 31. | Aberdeen | 4.9% | 0.80%(+4.06)#31 | 0.84%(+4.03)#1,529 |
| 32. | Bass Lake | 4.7% | 0.80%(+3.88)#32 | 0.84%(+3.85)#1,612 |
| 33. | Choctaw Lake | 4.6% | 0.80%(+3.76)#33 | 0.84%(+3.73)#1,679 |
| 34. | Reno | 4.6% | 0.80%(+3.76)#34 | 0.84%(+3.72)#1,681 |
| 35. | Stockport | 4.5% | 0.80%(+3.74)#35 | 0.84%(+3.71)#1,696 |
| 36. | Wilson | 4.5% | 0.80%(+3.74)#36 | 0.84%(+3.71)#1,704 |
| 37. | Fort Mckinley | 4.5% | 0.80%(+3.70)#37 | 0.84%(+3.67)#1,724 |
| 38. | Adamsville | 4.4% | 0.80%(+3.60)#38 | 0.84%(+3.57)#1,788 |
| 39. | Centerburg | 4.4% | 0.80%(+3.58)#39 | 0.84%(+3.54)#1,798 |
| 40. | Hopedale | 4.4% | 0.80%(+3.57)#40 | 0.84%(+3.54)#1,806 |
| 41. | Rockford | 4.3% | 0.80%(+3.54)#41 | 0.84%(+3.51)#1,819 |
| 42. | Middle Point | 4.3% | 0.80%(+3.46)#42 | 0.84%(+3.43)#1,868 |
| 43. | Bridgeport | 4.2% | 0.80%(+3.44)#43 | 0.84%(+3.41)#1,876 |
| 44. | New Baltimore | 4.2% | 0.80%(+3.35)#44 | 0.84%(+3.32)#1,940 |
| 45. | Nellie | 4.1% | 0.80%(+3.32)#45 | 0.84%(+3.29)#1,957 |
| 46. | North Kingsville | 4.1% | 0.80%(+3.28)#46 | 0.84%(+3.24)#1,980 |
| 47. | Berlin Heights | 4.1% | 0.80%(+3.26)#47 | 0.84%(+3.23)#2,000 |
| 48. | Northridge | 4.0% | 0.80%(+3.19)#48 | 0.84%(+3.16)#2,043 |
| 49. | New London | 4.0% | 0.80%(+3.16)#49 | 0.84%(+3.13)#2,064 |
| 50. | Sardis | 3.9% | 0.80%(+3.13)#50 | 0.84%(+3.10)#2,091 |
| 51. | Buffalo | 3.9% | 0.80%(+3.11)#51 | 0.84%(+3.08)#2,102 |
| 52. | Hartford Croton | 3.9% | 0.80%(+3.11)#52 | 0.84%(+3.07)#2,108 |
| 53. | Canfield | 3.9% | 0.80%(+3.10)#53 | 0.84%(+3.07)#2,109 |
| 54. | Bethesda | 3.9% | 0.80%(+3.06)#54 | 0.84%(+3.02)#2,143 |
| 55. | Hunter | 3.8% | 0.80%(+3.03)#55 | 0.84%(+3.00)#2,170 |
| 56. | Ballville | 3.8% | 0.80%(+3.00)#56 | 0.84%(+2.97)#2,187 |
| 57. | New Hampshire | 3.7% | 0.80%(+2.95)#57 | 0.84%(+2.91)#2,234 |
| 58. | Roseland | 3.7% | 0.80%(+2.93)#58 | 0.84%(+2.89)#2,256 |
| 59. | North Perry | 3.7% | 0.80%(+2.93)#59 | 0.84%(+2.89)#2,257 |
| 60. | Amsterdam | 3.7% | 0.80%(+2.85)#60 | 0.84%(+2.82)#2,329 |
| 61. | Burbank | 3.6% | 0.80%(+2.85)#61 | 0.84%(+2.81)#2,334 |
| 62. | Jerusalem | 3.6% | 0.80%(+2.77)#62 | 0.84%(+2.73)#2,395 |
| 63. | South Point | 3.5% | 0.80%(+2.74)#63 | 0.84%(+2.71)#2,410 |
| 64. | Roswell | 3.4% | 0.80%(+2.64)#64 | 0.84%(+2.61)#2,499 |
| 65. | West Portsmouth | 3.4% | 0.80%(+2.62)#65 | 0.84%(+2.59)#2,516 |
| 66. | Berkey | 3.4% | 0.80%(+2.62)#66 | 0.84%(+2.59)#2,520 |
| 67. | South Russell | 3.4% | 0.80%(+2.61)#67 | 0.84%(+2.58)#2,529 |
| 68. | Flushing | 3.4% | 0.80%(+2.59)#68 | 0.84%(+2.56)#2,543 |
| 69. | Windham | 3.4% | 0.80%(+2.59)#69 | 0.84%(+2.55)#2,546 |
| 70. | Beallsville | 3.4% | 0.80%(+2.57)#70 | 0.84%(+2.54)#2,567 |
| 71. | Candlewood Lake | 3.4% | 0.80%(+2.56)#71 | 0.84%(+2.52)#2,581 |
| 72. | Coal Grove | 3.4% | 0.80%(+2.55)#72 | 0.84%(+2.52)#2,583 |
| 73. | Orangeville | 3.3% | 0.80%(+2.53)#73 | 0.84%(+2.50)#2,611 |
| 74. | Miamitown | 3.3% | 0.80%(+2.49)#74 | 0.84%(+2.46)#2,642 |
| 75. | Shiloh | 3.3% | 0.80%(+2.46)#75 | 0.84%(+2.43)#2,676 |
| 76. | Grover Hill | 3.2% | 0.80%(+2.42)#76 | 0.84%(+2.39)#2,721 |
| 77. | Benton Ridge | 3.2% | 0.80%(+2.41)#77 | 0.84%(+2.38)#2,731 |
| 78. | Suffield | 3.2% | 0.80%(+2.40)#78 | 0.84%(+2.37)#2,740 |
| 79. | New Boston | 3.2% | 0.80%(+2.39)#79 | 0.84%(+2.36)#2,751 |
| 80. | New Bavaria | 3.1% | 0.80%(+2.32)#80 | 0.84%(+2.29)#2,816 |
| 81. | Clinton | 3.1% | 0.80%(+2.30)#81 | 0.84%(+2.26)#2,831 |
| 82. | Buchtel | 3.1% | 0.80%(+2.27)#82 | 0.84%(+2.24)#2,865 |
| 83. | Mount Pleasant | 3.1% | 0.80%(+2.27)#83 | 0.84%(+2.24)#2,867 |
| 84. | Montpelier | 3.1% | 0.80%(+2.27)#84 | 0.84%(+2.23)#2,870 |
| 85. | Kirkersville | 3.1% | 0.80%(+2.26)#85 | 0.84%(+2.23)#2,873 |
| 86. | Maineville | 3.1% | 0.80%(+2.26)#86 | 0.84%(+2.23)#2,875 |
| 87. | Yankee Lake | 3.0% | 0.80%(+2.23)#87 | 0.84%(+2.19)#2,921 |
| 88. | Thornport | 3.0% | 0.80%(+2.20)#88 | 0.84%(+2.17)#2,943 |
| 89. | Toronto | 3.0% | 0.80%(+2.20)#89 | 0.84%(+2.17)#2,944 |
| 90. | Jefferson | 3.0% | 0.80%(+2.19)#90 | 0.84%(+2.16)#2,954 |
| 91. | Stoutsville | 3.0% | 0.80%(+2.19)#91 | 0.84%(+2.16)#2,955 |
| 92. | Ashley | 3.0% | 0.80%(+2.16)#92 | 0.84%(+2.13)#2,989 |
| 93. | Hillsboro | 3.0% | 0.80%(+2.15)#93 | 0.84%(+2.12)#2,998 |
| 94. | Grand Rapids | 2.9% | 0.80%(+2.14)#94 | 0.84%(+2.10)#3,012 |
| 95. | Wellston | 2.9% | 0.80%(+2.14)#95 | 0.84%(+2.10)#3,023 |
| 96. | Lake Tomahawk | 2.9% | 0.80%(+2.05)#96 | 0.84%(+2.02)#3,117 |
| 97. | Wilkshire Hills | 2.8% | 0.80%(+1.96)#97 | 0.84%(+1.93)#3,250 |
| 98. | Winchester | 2.8% | 0.80%(+1.96)#98 | 0.84%(+1.93)#3,257 |
| 99. | Tremont City | 2.8% | 0.80%(+1.95)#99 | 0.84%(+1.92)#3,267 |
| 100. | Highland | 2.7% | 0.80%(+1.94)#100 | 0.84%(+1.90)#3,297 |
Common Questions
What are the Top 10 Cities with the Highest Percentage of Population Employed in Utilities in Ohio?
Top 10 Cities with the Highest Percentage of Population Employed in Utilities in Ohio are:
#1
14.6%
#2
14.6%
#3
12.9%
#4
12.7%
#5
11.1%
#6
9.6%
#7
8.6%
#8
8.5%
#9
8.2%
#10
7.8%
What city has the Highest Percentage of Population Employed in Utilities in Ohio?
Connorville has the Highest Percentage of Population Employed in Utilities in Ohio with 14.6%.
What is the Percentage of Population Employed in Utilities in the State of Ohio?
Percentage of Population Employed in Utilities in Ohio is 0.80%.
What is the Percentage of Population Employed in Utilities in the United States?
Percentage of Population Employed in Utilities in the United States is 0.84%.