Sawyerwood, OH Map & Demographics
Sawyerwood Map
Sawyerwood Overview
$20,660
PER CAPITA INCOME
$56,696
AVG FAMILY INCOME
$50,625
AVG HOUSEHOLD INCOME
0.38
INEQUALITY / GINI INDEX
1,381
TOTAL POPULATION
604
MALE POPULATION
777
FEMALE POPULATION
77.73
MALES / 100 FEMALES
128.64
FEMALES / 100 MALES
54.2
MEDIAN AGE
3.3
AVG FAMILY SIZE
2.6
AVG HOUSEHOLD SIZE
571
LABOR FORCE [ PEOPLE ]
45.7%
PERCENT IN LABOR FORCE
23.3%
UNEMPLOYMENT RATE
Income in Sawyerwood
Income Overview in Sawyerwood
Per Capita Income in Sawyerwood is $20,660, while median incomes of families and households are $56,696 and $50,625 respectively.
| Characteristic | Number | Measure |
| Per Capita Income | 1,381 | $20,660 |
| Median Family Income | 357 | $56,696 |
| Mean Family Income | 357 | $61,117 |
| Median Household Income | 536 | $50,625 |
| Mean Household Income | 536 | $51,180 |
| Income Deficit | 357 | $0 |
| Wage / Income Gap (%) | 1,381 | 0.00% |
| Wage / Income Gap ($) | 1,381 | 100.00¢ per $1 |
| Gini / Inequality Index | 1,381 | 0.38 |
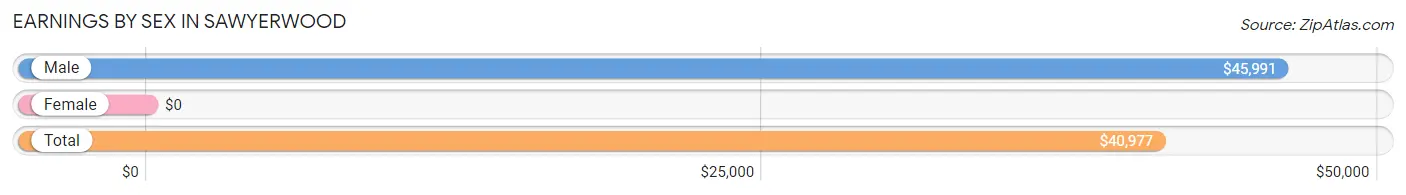
Earnings by Sex in Sawyerwood
| Sex | Number | Average Earnings |
| Male | 291 (55.5%) | $45,991 |
| Female | 233 (44.5%) | $0 |
| Total | 524 (100.0%) | $40,977 |
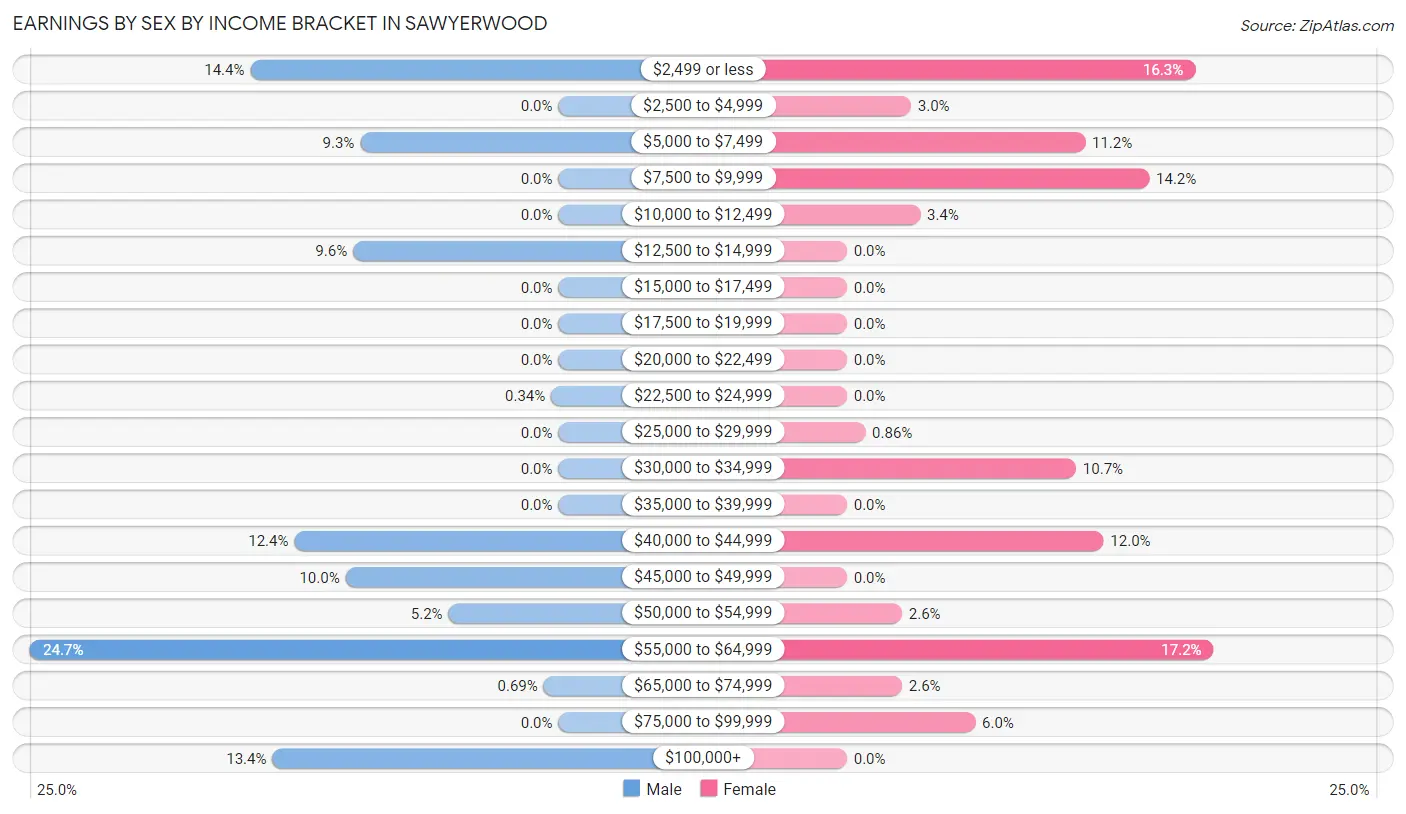
Earnings by Sex by Income Bracket in Sawyerwood
The most common earnings brackets in Sawyerwood are $55,000 to $64,999 for men (72 | 24.7%) and $55,000 to $64,999 for women (40 | 17.2%).
| Income | Male | Female |
| $2,499 or less | 42 (14.4%) | 38 (16.3%) |
| $2,500 to $4,999 | 0 (0.0%) | 7 (3.0%) |
| $5,000 to $7,499 | 27 (9.3%) | 26 (11.2%) |
| $7,500 to $9,999 | 0 (0.0%) | 33 (14.2%) |
| $10,000 to $12,499 | 0 (0.0%) | 8 (3.4%) |
| $12,500 to $14,999 | 28 (9.6%) | 0 (0.0%) |
| $15,000 to $17,499 | 0 (0.0%) | 0 (0.0%) |
| $17,500 to $19,999 | 0 (0.0%) | 0 (0.0%) |
| $20,000 to $22,499 | 0 (0.0%) | 0 (0.0%) |
| $22,500 to $24,999 | 1 (0.3%) | 0 (0.0%) |
| $25,000 to $29,999 | 0 (0.0%) | 2 (0.9%) |
| $30,000 to $34,999 | 0 (0.0%) | 25 (10.7%) |
| $35,000 to $39,999 | 0 (0.0%) | 0 (0.0%) |
| $40,000 to $44,999 | 36 (12.4%) | 28 (12.0%) |
| $45,000 to $49,999 | 29 (10.0%) | 0 (0.0%) |
| $50,000 to $54,999 | 15 (5.1%) | 6 (2.6%) |
| $55,000 to $64,999 | 72 (24.7%) | 40 (17.2%) |
| $65,000 to $74,999 | 2 (0.7%) | 6 (2.6%) |
| $75,000 to $99,999 | 0 (0.0%) | 14 (6.0%) |
| $100,000+ | 39 (13.4%) | 0 (0.0%) |
| Total | 291 (100.0%) | 233 (100.0%) |
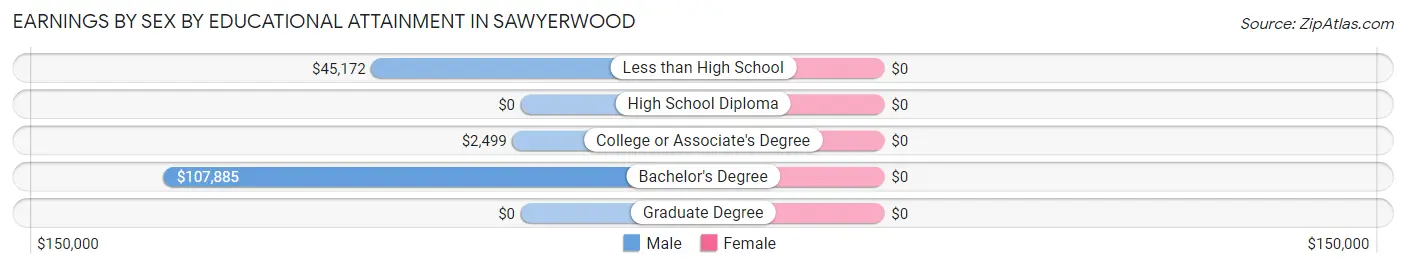
Earnings by Sex by Educational Attainment in Sawyerwood
| Educational Attainment | Male Income | Female Income |
| Less than High School | $45,172 | $0 |
| High School Diploma | - | - |
| College or Associate's Degree | $2,499 | $0 |
| Bachelor's Degree | $107,885 | $0 |
| Graduate Degree | - | - |
| Total | $53,750 | $0 |
Family Income in Sawyerwood
Family Income Brackets in Sawyerwood
According to the Sawyerwood family income data, there are 98 families falling into the $50,000 to $74,999 income range, which is the most common income bracket and makes up 27.5% of all families.
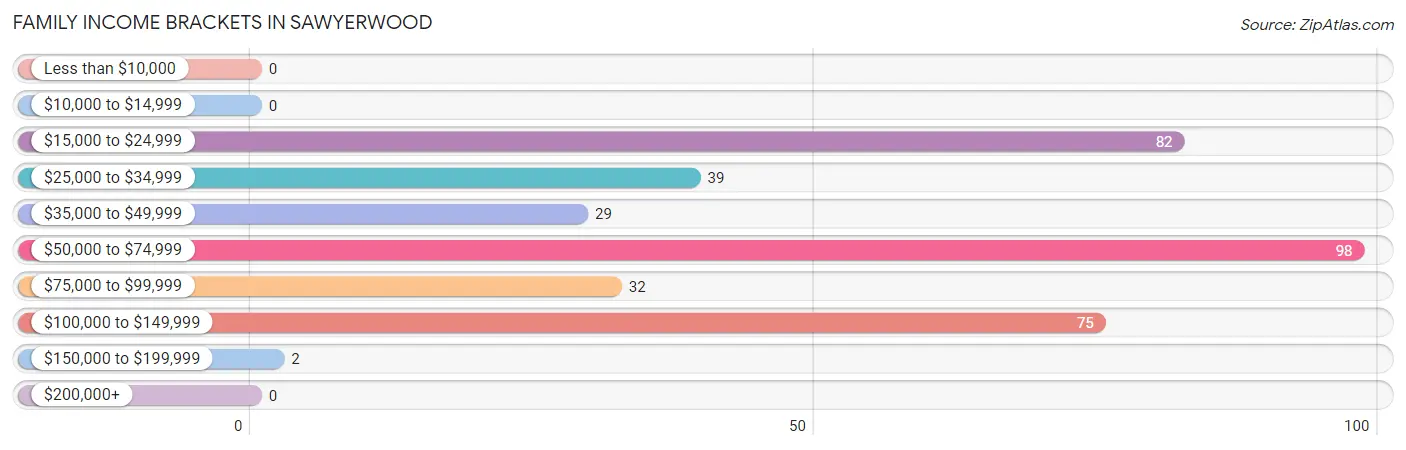
| Income Bracket | # Families | % Families |
| Less than $10,000 | 0 | 0.0% |
| $10,000 to $14,999 | 0 | 0.0% |
| $15,000 to $24,999 | 82 | 23.0% |
| $25,000 to $34,999 | 39 | 10.9% |
| $35,000 to $49,999 | 29 | 8.1% |
| $50,000 to $74,999 | 98 | 27.5% |
| $75,000 to $99,999 | 32 | 9.0% |
| $100,000 to $149,999 | 75 | 21.0% |
| $150,000 to $199,999 | 2 | 0.6% |
| $200,000+ | 0 | 0.0% |
Family Income by Famaliy Size in Sawyerwood
4-person families (71 | 19.9%) account for the highest median family income in Sawyerwood with $107,796 per family, while 4-person families (71 | 19.9%) have the highest median income of $26,949 per family member.
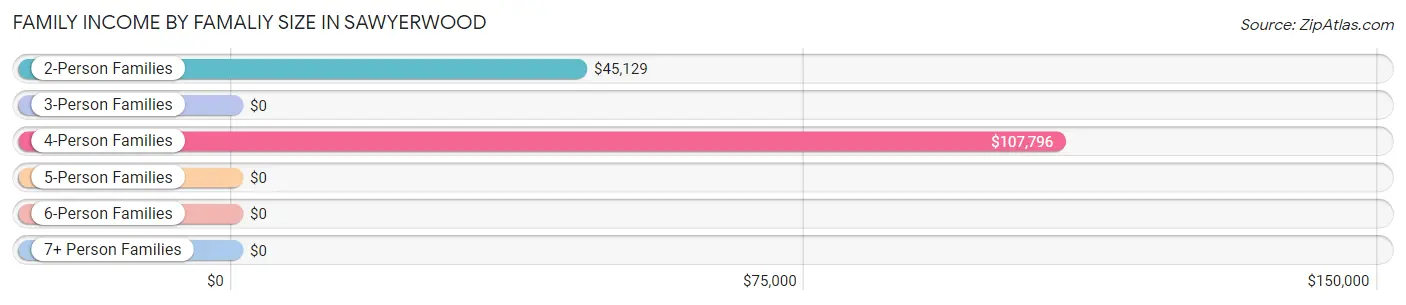
| Income Bracket | # Families | Median Income |
| 2-Person Families | 117 (32.8%) | $45,129 |
| 3-Person Families | 139 (38.9%) | $0 |
| 4-Person Families | 71 (19.9%) | $107,796 |
| 5-Person Families | 6 (1.7%) | $0 |
| 6-Person Families | 24 (6.7%) | $0 |
| 7+ Person Families | 0 (0.0%) | $0 |
| Total | 357 (100.0%) | $56,696 |
Family Income by Number of Earners in Sawyerwood
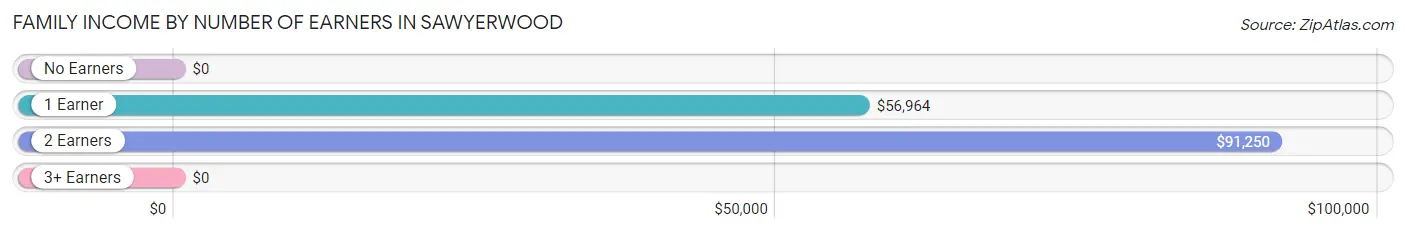
| Number of Earners | # Families | Median Income |
| No Earners | 127 (35.6%) | $0 |
| 1 Earner | 80 (22.4%) | $56,964 |
| 2 Earners | 124 (34.7%) | $91,250 |
| 3+ Earners | 26 (7.3%) | $0 |
| Total | 357 (100.0%) | $56,696 |
Household Income in Sawyerwood
Household Income Brackets in Sawyerwood
With 163 households falling in the category, the $50,000 to $74,999 income range is the most frequent in Sawyerwood, accounting for 30.4% of all households.
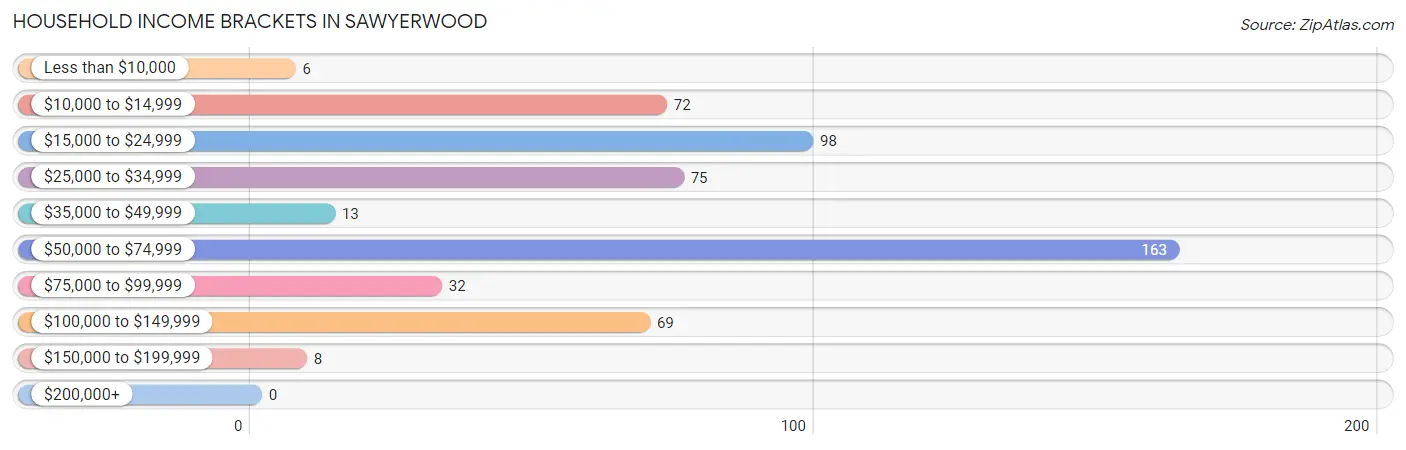
| Income Bracket | # Households | % Households |
| Less than $10,000 | 6 | 1.1% |
| $10,000 to $14,999 | 72 | 13.4% |
| $15,000 to $24,999 | 98 | 18.3% |
| $25,000 to $34,999 | 75 | 14.0% |
| $35,000 to $49,999 | 13 | 2.4% |
| $50,000 to $74,999 | 163 | 30.4% |
| $75,000 to $99,999 | 32 | 6.0% |
| $100,000 to $149,999 | 69 | 12.9% |
| $150,000 to $199,999 | 8 | 1.5% |
| $200,000+ | 0 | 0.0% |
Household Income by Householder Age in Sawyerwood
The median household income in Sawyerwood is $50,625, with the highest median household income of $57,969 found in the 45 to 64 years age bracket for the primary householder. A total of 301 households (56.2%) fall into this category.
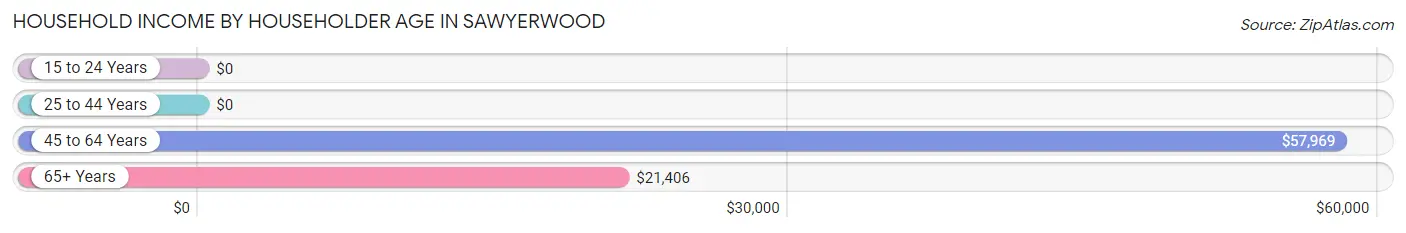
| Income Bracket | # Households | Median Income |
| 15 to 24 Years | 0 (0.0%) | $0 |
| 25 to 44 Years | 13 (2.4%) | $0 |
| 45 to 64 Years | 301 (56.2%) | $57,969 |
| 65+ Years | 222 (41.4%) | $21,406 |
| Total | 536 (100.0%) | $50,625 |
Poverty in Sawyerwood
Income Below Poverty by Sex and Age in Sawyerwood
With 16.4% poverty level for males and 31.4% for females among the residents of Sawyerwood, 35 to 44 year old males and 35 to 44 year old females are the most vulnerable to poverty, with 74 males (49.0%) and 75 females (92.6%) in their respective age groups living below the poverty level.
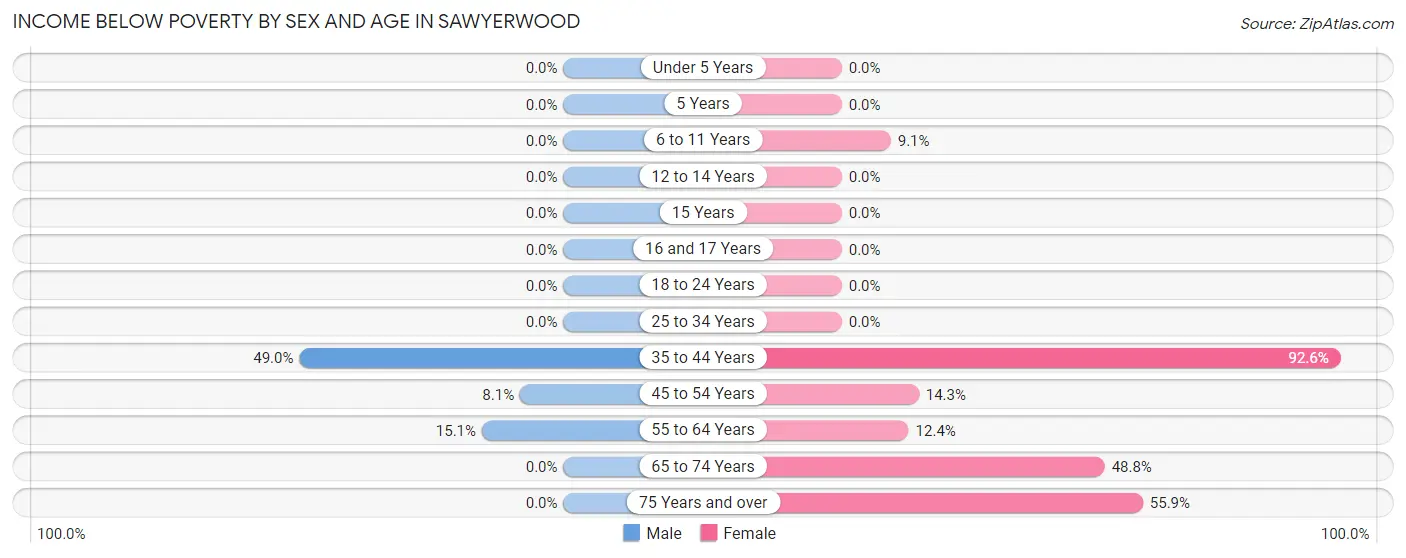
| Age Bracket | Male | Female |
| Under 5 Years | 0 (0.0%) | 0 (0.0%) |
| 5 Years | 0 (0.0%) | 0 (0.0%) |
| 6 to 11 Years | 0 (0.0%) | 7 (9.1%) |
| 12 to 14 Years | 0 (0.0%) | 0 (0.0%) |
| 15 Years | 0 (0.0%) | 0 (0.0%) |
| 16 and 17 Years | 0 (0.0%) | 0 (0.0%) |
| 18 to 24 Years | 0 (0.0%) | 0 (0.0%) |
| 25 to 34 Years | 0 (0.0%) | 0 (0.0%) |
| 35 to 44 Years | 74 (49.0%) | 75 (92.6%) |
| 45 to 54 Years | 7 (8.1%) | 26 (14.3%) |
| 55 to 64 Years | 18 (15.1%) | 18 (12.4%) |
| 65 to 74 Years | 0 (0.0%) | 61 (48.8%) |
| 75 Years and over | 0 (0.0%) | 57 (55.9%) |
| Total | 99 (16.4%) | 244 (31.4%) |
Income Above Poverty by Sex and Age in Sawyerwood
According to the poverty statistics in Sawyerwood, males aged 12 to 14 years and females aged under 5 years are the age groups that are most secure financially, with 100.0% of males and 100.0% of females in these age groups living above the poverty line.
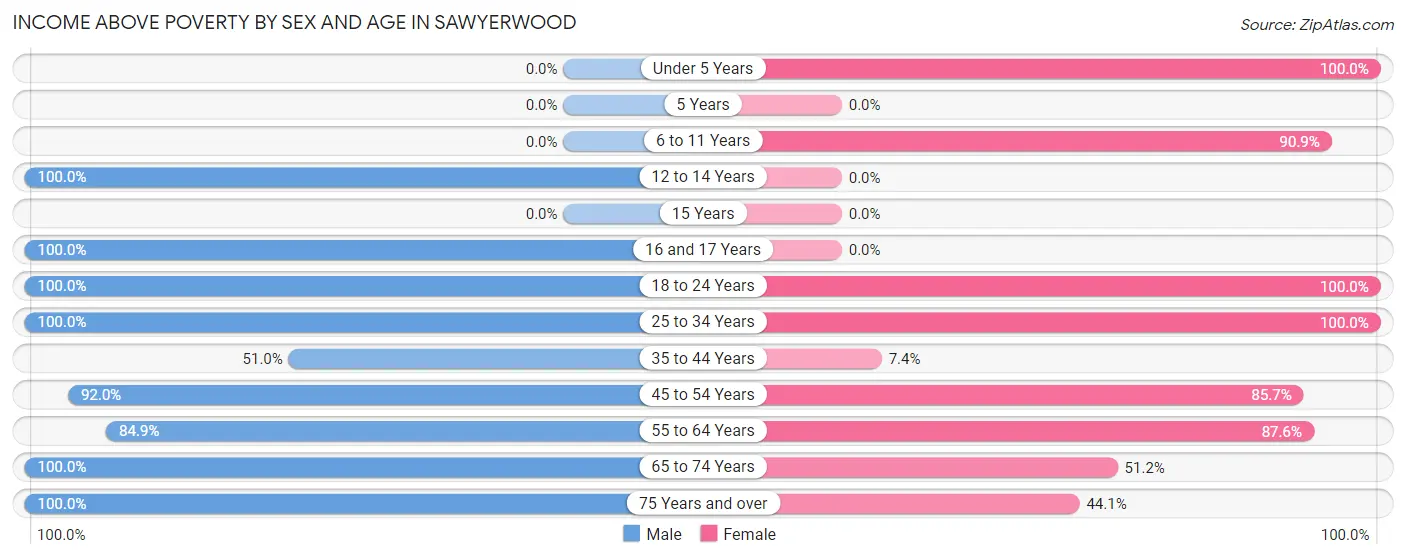
| Age Bracket | Male | Female |
| Under 5 Years | 0 (0.0%) | 13 (100.0%) |
| 5 Years | 0 (0.0%) | 0 (0.0%) |
| 6 to 11 Years | 0 (0.0%) | 70 (90.9%) |
| 12 to 14 Years | 41 (100.0%) | 0 (0.0%) |
| 15 Years | 0 (0.0%) | 0 (0.0%) |
| 16 and 17 Years | 62 (100.0%) | 0 (0.0%) |
| 18 to 24 Years | 65 (100.0%) | 6 (100.0%) |
| 25 to 34 Years | 9 (100.0%) | 46 (100.0%) |
| 35 to 44 Years | 77 (51.0%) | 6 (7.4%) |
| 45 to 54 Years | 80 (91.9%) | 156 (85.7%) |
| 55 to 64 Years | 101 (84.9%) | 127 (87.6%) |
| 65 to 74 Years | 59 (100.0%) | 64 (51.2%) |
| 75 Years and over | 11 (100.0%) | 45 (44.1%) |
| Total | 505 (83.6%) | 533 (68.6%) |
Income Below Poverty Among Married-Couple Families in Sawyerwood
The poverty statistics for married-couple families in Sawyerwood show that 10.8% or 25 of the total 232 families live below the poverty line. Families with no children have the highest poverty rate of 20.0%, comprising of 18 families. On the other hand, families with 1 or 2 children have the lowest poverty rate of 4.9%, which includes 7 families.
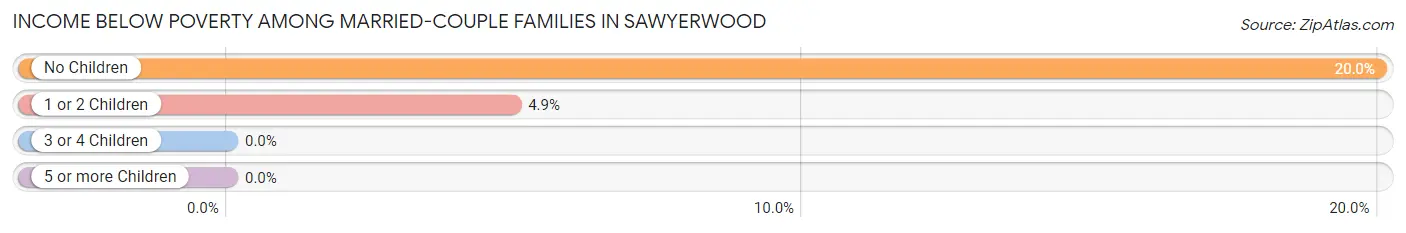
| Children | Above Poverty | Below Poverty |
| No Children | 72 (80.0%) | 18 (20.0%) |
| 1 or 2 Children | 135 (95.1%) | 7 (4.9%) |
| 3 or 4 Children | 0 (0.0%) | 0 (0.0%) |
| 5 or more Children | 0 (0.0%) | 0 (0.0%) |
| Total | 207 (89.2%) | 25 (10.8%) |
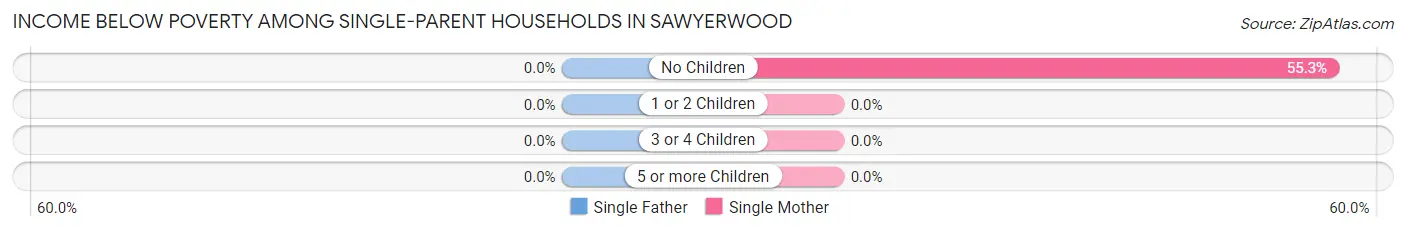
Income Below Poverty Among Single-Parent Households in Sawyerwood
| Children | Single Father | Single Mother |
| No Children | 0 (0.0%) | 57 (55.3%) |
| 1 or 2 Children | 0 (0.0%) | 0 (0.0%) |
| 3 or 4 Children | 0 (0.0%) | 0 (0.0%) |
| 5 or more Children | 0 (0.0%) | 0 (0.0%) |
| Total | 0 (0.0%) | 57 (52.3%) |
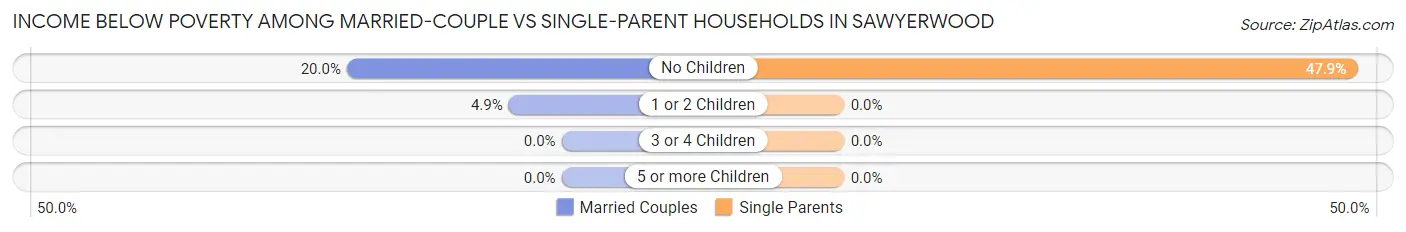
Income Below Poverty Among Married-Couple vs Single-Parent Households in Sawyerwood
The poverty data for Sawyerwood shows that 25 of the married-couple family households (10.8%) and 57 of the single-parent households (45.6%) are living below the poverty level. Within the married-couple family households, those with no children have the highest poverty rate, with 18 households (20.0%) falling below the poverty line. Among the single-parent households, those with no children have the highest poverty rate, with 57 household (47.9%) living below poverty.
| Children | Married-Couple Families | Single-Parent Households |
| No Children | 18 (20.0%) | 57 (47.9%) |
| 1 or 2 Children | 7 (4.9%) | 0 (0.0%) |
| 3 or 4 Children | 0 (0.0%) | 0 (0.0%) |
| 5 or more Children | 0 (0.0%) | 0 (0.0%) |
| Total | 25 (10.8%) | 57 (45.6%) |
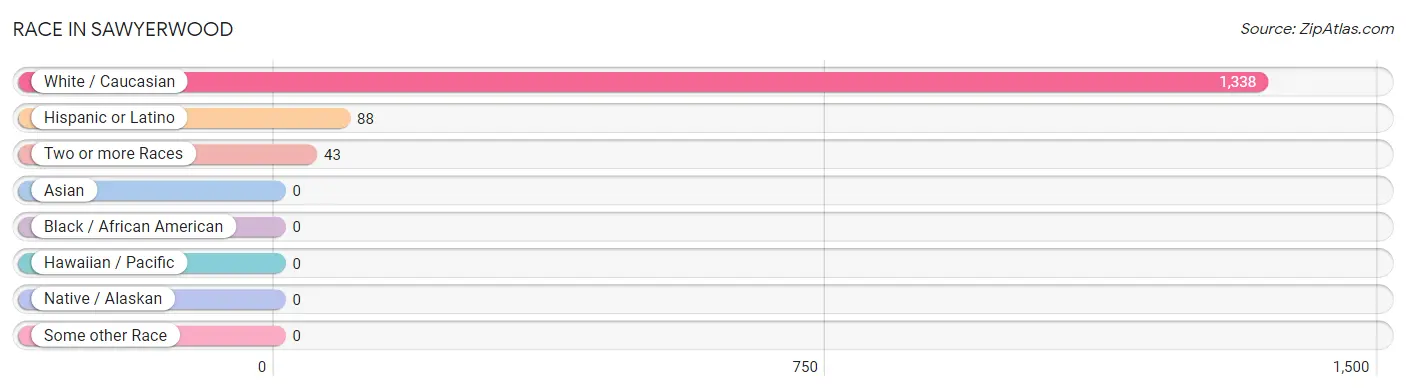
Race in Sawyerwood
The most populous races in Sawyerwood are White / Caucasian (1,338 | 96.9%), Hispanic or Latino (88 | 6.4%), and Two or more Races (43 | 3.1%).
| Race | # Population | % Population |
| Asian | 0 | 0.0% |
| Black / African American | 0 | 0.0% |
| Hawaiian / Pacific | 0 | 0.0% |
| Hispanic or Latino | 88 | 6.4% |
| Native / Alaskan | 0 | 0.0% |
| White / Caucasian | 1,338 | 96.9% |
| Two or more Races | 43 | 3.1% |
| Some other Race | 0 | 0.0% |
| Total | 1,381 | 100.0% |
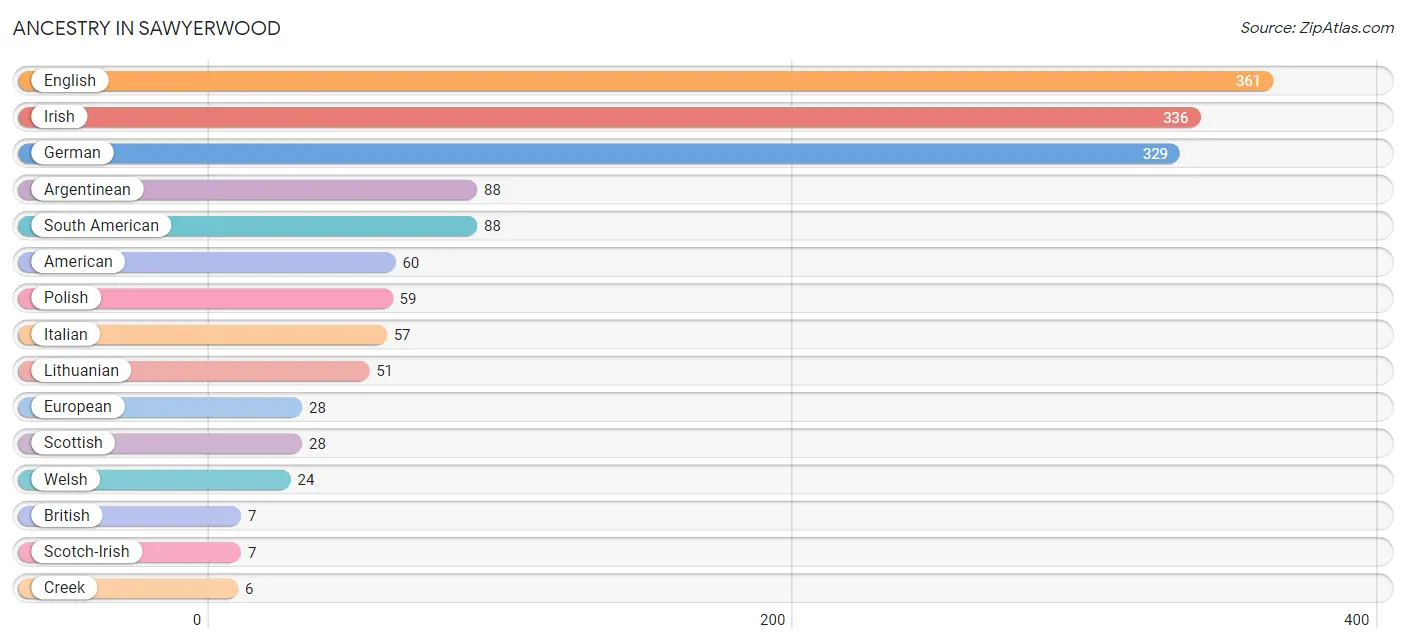
Ancestry in Sawyerwood
The most populous ancestries reported in Sawyerwood are English (361 | 26.1%), Irish (336 | 24.3%), German (329 | 23.8%), Argentinean (88 | 6.4%), and South American (88 | 6.4%), together accounting for 87.0% of all Sawyerwood residents.
| Ancestry | # Population | % Population |
| American | 60 | 4.3% |
| Argentinean | 88 | 6.4% |
| British | 7 | 0.5% |
| Creek | 6 | 0.4% |
| English | 361 | 26.1% |
| European | 28 | 2.0% |
| German | 329 | 23.8% |
| Irish | 336 | 24.3% |
| Italian | 57 | 4.1% |
| Lithuanian | 51 | 3.7% |
| Polish | 59 | 4.3% |
| Scotch-Irish | 7 | 0.5% |
| Scottish | 28 | 2.0% |
| South American | 88 | 6.4% |
| Welsh | 24 | 1.7% | View All 15 Rows |
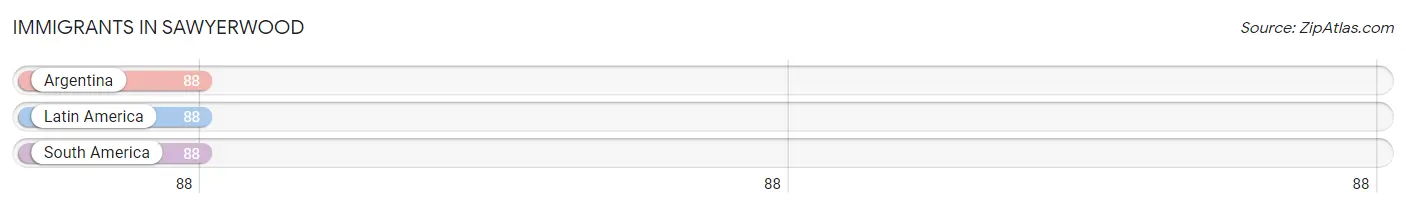
Immigrants in Sawyerwood
The most numerous immigrant groups reported in Sawyerwood came from Argentina (88 | 6.4%), Latin America (88 | 6.4%), and South America (88 | 6.4%), together accounting for 19.1% of all Sawyerwood residents.
| Immigration Origin | # Population | % Population |
| Argentina | 88 | 6.4% |
| Latin America | 88 | 6.4% |
| South America | 88 | 6.4% | View All 3 Rows |
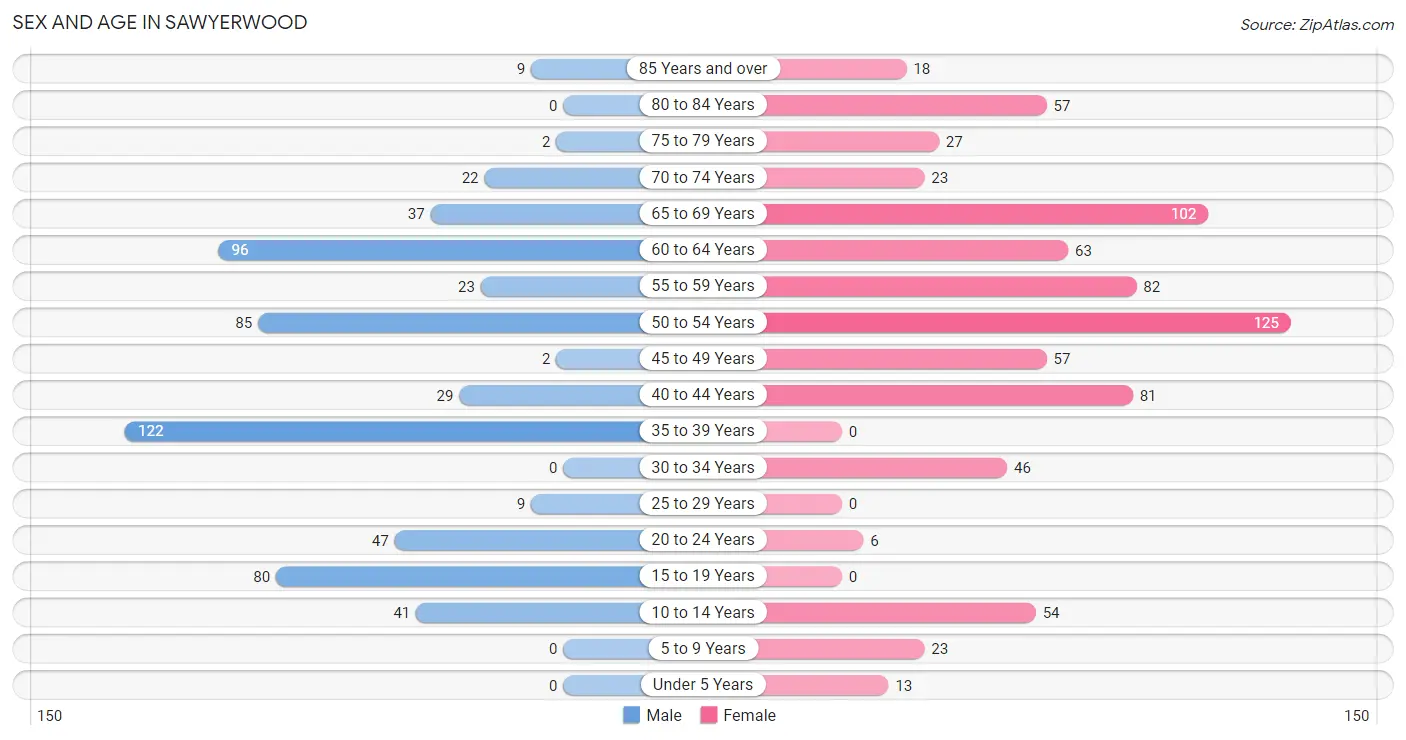
Sex and Age in Sawyerwood
Sex and Age in Sawyerwood
The most populous age groups in Sawyerwood are 35 to 39 Years (122 | 20.2%) for men and 50 to 54 Years (125 | 16.1%) for women.
| Age Bracket | Male | Female |
| Under 5 Years | 0 (0.0%) | 13 (1.7%) |
| 5 to 9 Years | 0 (0.0%) | 23 (3.0%) |
| 10 to 14 Years | 41 (6.8%) | 54 (7.0%) |
| 15 to 19 Years | 80 (13.3%) | 0 (0.0%) |
| 20 to 24 Years | 47 (7.8%) | 6 (0.8%) |
| 25 to 29 Years | 9 (1.5%) | 0 (0.0%) |
| 30 to 34 Years | 0 (0.0%) | 46 (5.9%) |
| 35 to 39 Years | 122 (20.2%) | 0 (0.0%) |
| 40 to 44 Years | 29 (4.8%) | 81 (10.4%) |
| 45 to 49 Years | 2 (0.3%) | 57 (7.3%) |
| 50 to 54 Years | 85 (14.1%) | 125 (16.1%) |
| 55 to 59 Years | 23 (3.8%) | 82 (10.5%) |
| 60 to 64 Years | 96 (15.9%) | 63 (8.1%) |
| 65 to 69 Years | 37 (6.1%) | 102 (13.1%) |
| 70 to 74 Years | 22 (3.6%) | 23 (3.0%) |
| 75 to 79 Years | 2 (0.3%) | 27 (3.5%) |
| 80 to 84 Years | 0 (0.0%) | 57 (7.3%) |
| 85 Years and over | 9 (1.5%) | 18 (2.3%) |
| Total | 604 (100.0%) | 777 (100.0%) |
Families and Households in Sawyerwood
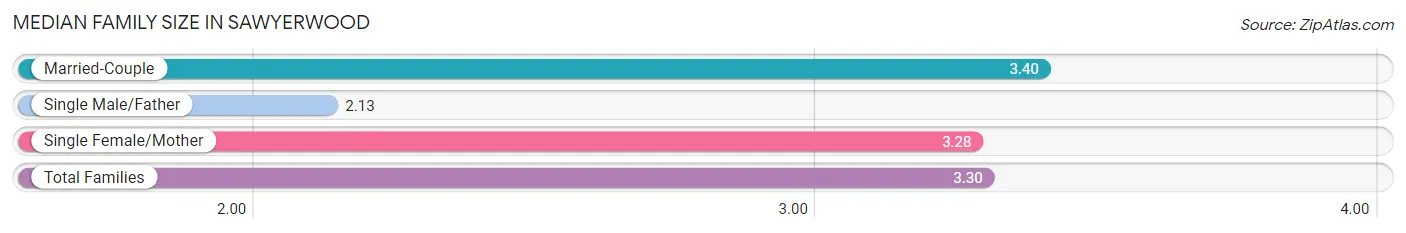
Median Family Size in Sawyerwood
The median family size in Sawyerwood is 3.30 persons per family, with married-couple families (232 | 65.0%) accounting for the largest median family size of 3.4 persons per family. On the other hand, single male/father families (16 | 4.5%) represent the smallest median family size with 2.13 persons per family.
| Family Type | # Families | Family Size |
| Married-Couple | 232 (65.0%) | 3.40 |
| Single Male/Father | 16 (4.5%) | 2.13 |
| Single Female/Mother | 109 (30.5%) | 3.28 |
| Total Families | 357 (100.0%) | 3.30 |
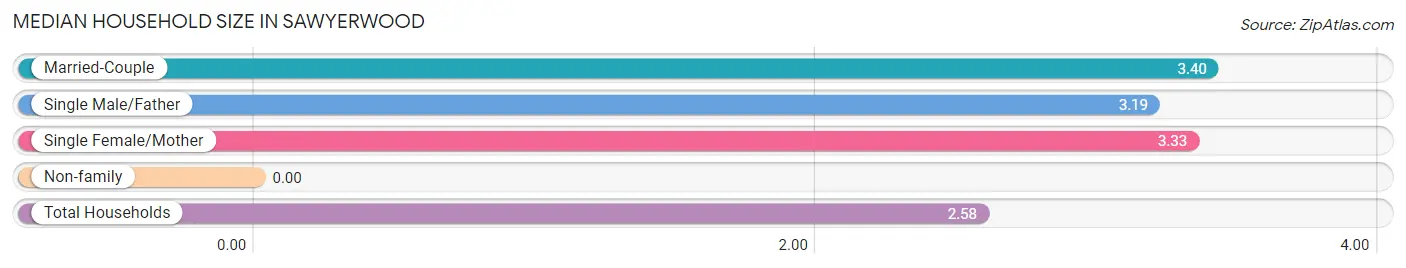
Median Household Size in Sawyerwood
| Household Type | # Households | Household Size |
| Married-Couple | 232 (43.3%) | 3.40 |
| Single Male/Father | 16 (3.0%) | 3.19 |
| Single Female/Mother | 109 (20.3%) | 3.33 |
| Non-family | 179 (33.4%) | - |
| Total Households | 536 (100.0%) | 2.58 |
Household Size by Marriage Status in Sawyerwood
Out of a total of 536 households in Sawyerwood, 357 (66.6%) are family households, while 179 (33.4%) are nonfamily households. The most numerous type of family households are 3-person households, comprising 155, and the most common type of nonfamily households are 1-person households, comprising 179.
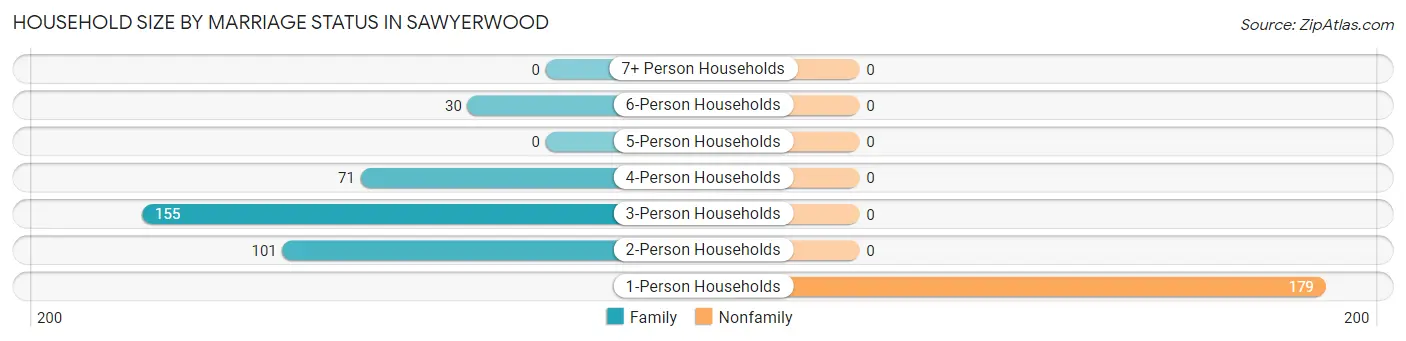
| Household Size | Family Households | Nonfamily Households |
| 1-Person Households | - | 179 (33.4%) |
| 2-Person Households | 101 (18.8%) | 0 (0.0%) |
| 3-Person Households | 155 (28.9%) | 0 (0.0%) |
| 4-Person Households | 71 (13.3%) | 0 (0.0%) |
| 5-Person Households | 0 (0.0%) | 0 (0.0%) |
| 6-Person Households | 30 (5.6%) | 0 (0.0%) |
| 7+ Person Households | 0 (0.0%) | 0 (0.0%) |
| Total | 357 (66.6%) | 179 (33.4%) |
Female Fertility in Sawyerwood
Fertility by Age in Sawyerwood
Average fertility rate in Sawyerwood is 31.0 births per 1,000 women. Women in the age bracket of 20 to 34 years have the highest fertility rate with 115.0 births per 1,000 women. Women in the age bracket of 20 to 34 years acount for 100.0% of all women with births.
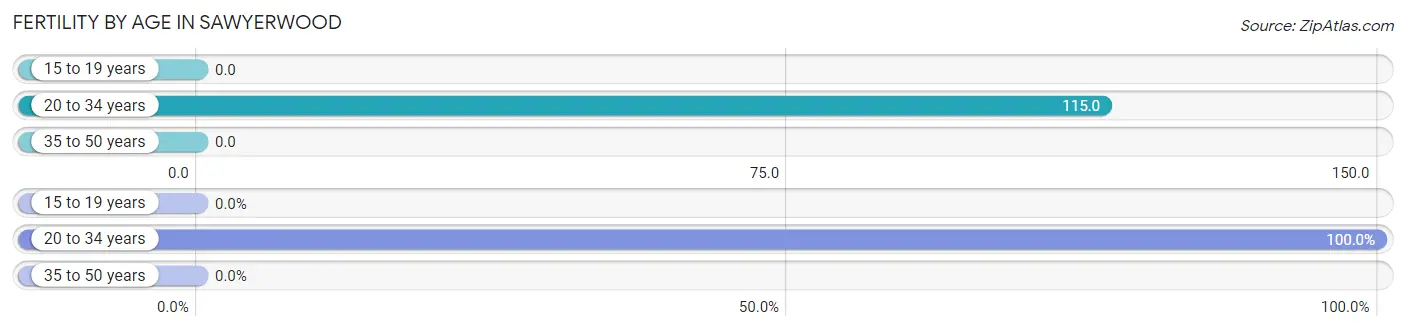
| Age Bracket | Women with Births | Births / 1,000 Women |
| 15 to 19 years | 0 (0.0%) | 0.0 |
| 20 to 34 years | 6 (100.0%) | 115.0 |
| 35 to 50 years | 0 (0.0%) | 0.0 |
| Total | 6 (100.0%) | 31.0 |
Fertility by Age by Marriage Status in Sawyerwood
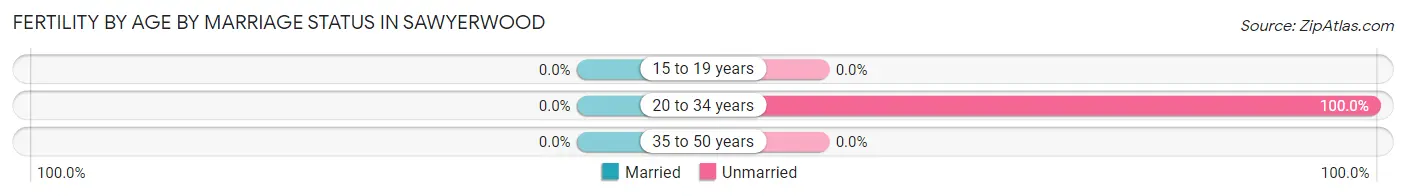
| Age Bracket | Married | Unmarried |
| 15 to 19 years | 0 (0.0%) | 0 (0.0%) |
| 20 to 34 years | 0 (0.0%) | 6 (100.0%) |
| 35 to 50 years | 0 (0.0%) | 0 (0.0%) |
| Total | 0 (0.0%) | 6 (100.0%) |
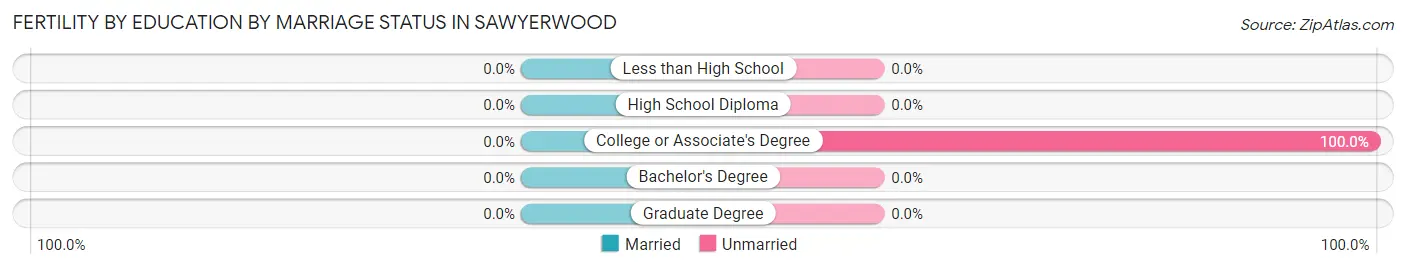
Fertility by Education in Sawyerwood
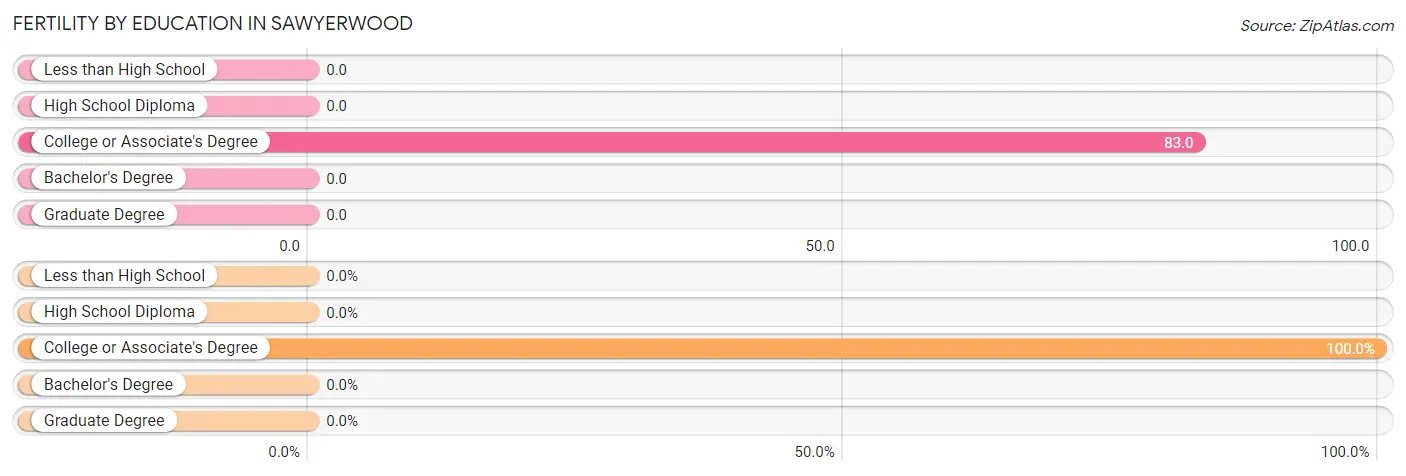
| Educational Attainment | Women with Births | Births / 1,000 Women |
| Less than High School | 0 (0.0%) | 0.0 |
| High School Diploma | 0 (0.0%) | 0.0 |
| College or Associate's Degree | 6 (100.0%) | 83.0 |
| Bachelor's Degree | 0 (0.0%) | 0.0 |
| Graduate Degree | 0 (0.0%) | 0.0 |
| Total | 6 (100.0%) | 31.0 |
Fertility by Education by Marriage Status in Sawyerwood
| Educational Attainment | Married | Unmarried |
| Less than High School | 0 (0.0%) | 0 (0.0%) |
| High School Diploma | 0 (0.0%) | 0 (0.0%) |
| College or Associate's Degree | 0 (0.0%) | 6 (100.0%) |
| Bachelor's Degree | 0 (0.0%) | 0 (0.0%) |
| Graduate Degree | 0 (0.0%) | 0 (0.0%) |
| Total | 0 (0.0%) | 6 (100.0%) |
Employment Characteristics in Sawyerwood
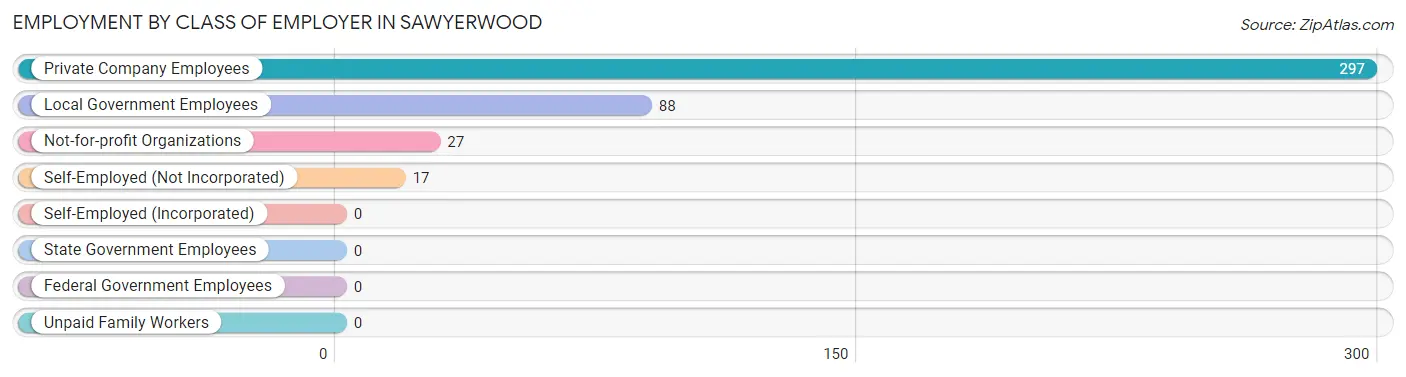
Employment by Class of Employer in Sawyerwood
Among the 429 employed individuals in Sawyerwood, private company employees (297 | 69.2%), local government employees (88 | 20.5%), and not-for-profit organizations (27 | 6.3%) make up the most common classes of employment.
| Employer Class | # Employees | % Employees |
| Private Company Employees | 297 | 69.2% |
| Self-Employed (Incorporated) | 0 | 0.0% |
| Self-Employed (Not Incorporated) | 17 | 4.0% |
| Not-for-profit Organizations | 27 | 6.3% |
| Local Government Employees | 88 | 20.5% |
| State Government Employees | 0 | 0.0% |
| Federal Government Employees | 0 | 0.0% |
| Unpaid Family Workers | 0 | 0.0% |
| Total | 429 | 100.0% |
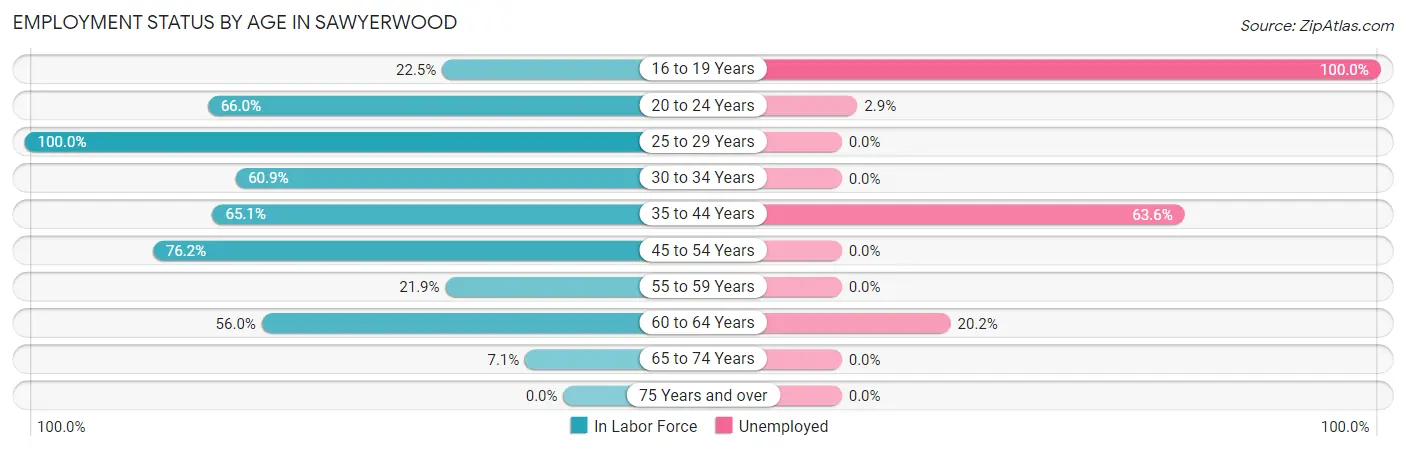
Employment Status by Age in Sawyerwood
According to the labor force statistics for Sawyerwood, out of the total population over 16 years of age (1,250), 45.7% or 571 individuals are in the labor force, with 23.3% or 133 of them unemployed. The age group with the highest labor force participation rate is 25 to 29 years, with 100.0% or 9 individuals in the labor force. Within the labor force, the 16 to 19 years age range has the highest percentage of unemployed individuals, with 100.0% or 18 of them being unemployed.
| Age Bracket | In Labor Force | Unemployed |
| 16 to 19 Years | 18 (22.5%) | 18 (100.0%) |
| 20 to 24 Years | 35 (66.0%) | 1 (2.9%) |
| 25 to 29 Years | 9 (100.0%) | 0 (0.0%) |
| 30 to 34 Years | 28 (60.9%) | 0 (0.0%) |
| 35 to 44 Years | 151 (65.1%) | 96 (63.6%) |
| 45 to 54 Years | 205 (76.2%) | 0 (0.0%) |
| 55 to 59 Years | 23 (21.9%) | 0 (0.0%) |
| 60 to 64 Years | 89 (56.0%) | 18 (20.2%) |
| 65 to 74 Years | 13 (7.1%) | 0 (0.0%) |
| 75 Years and over | 0 (0.0%) | 0 (0.0%) |
| Total | 571 (45.7%) | 133 (23.3%) |
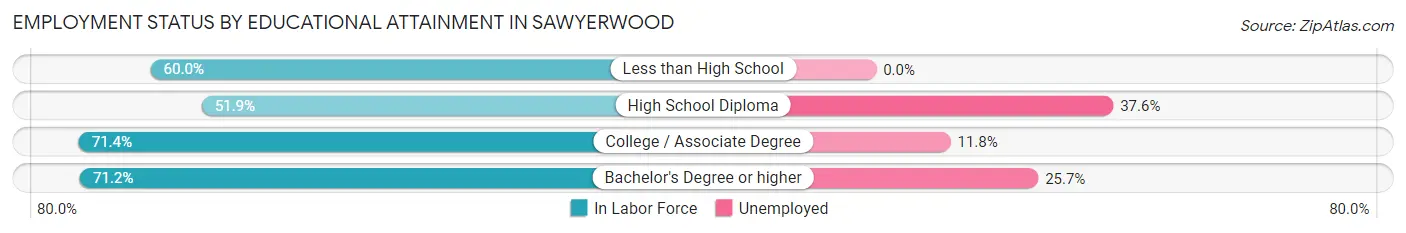
Employment Status by Educational Attainment in Sawyerwood
According to labor force statistics for Sawyerwood, 61.6% of individuals (505) out of the total population between 25 and 64 years of age (820) are in the labor force, with 22.6% or 114 of them being unemployed. The group with the highest labor force participation rate are those with the educational attainment of college / associate degree, with 71.4% or 152 individuals in the labor force. Within the labor force, individuals with high school diploma education have the highest percentage of unemployment, with 37.6% or 68 of them being unemployed.
| Educational Attainment | In Labor Force | Unemployed |
| Less than High School | 63 (60.0%) | 0 (0.0%) |
| High School Diploma | 181 (51.9%) | 131 (37.6%) |
| College / Associate Degree | 152 (71.4%) | 25 (11.8%) |
| Bachelor's Degree or higher | 109 (71.2%) | 39 (25.7%) |
| Total | 505 (61.6%) | 185 (22.6%) |
Employment Occupations by Sex in Sawyerwood
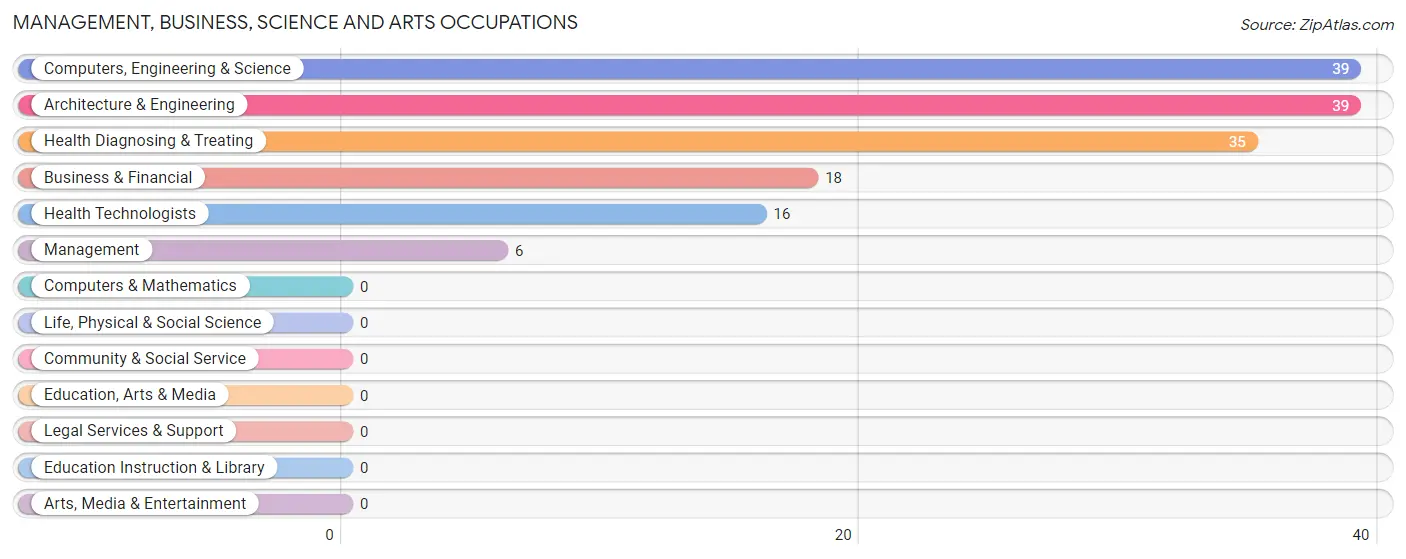
Management, Business, Science and Arts Occupations
The most common Management, Business, Science and Arts occupations in Sawyerwood are Computers, Engineering & Science (39 | 8.9%), Architecture & Engineering (39 | 8.9%), Health Diagnosing & Treating (35 | 8.0%), Business & Financial (18 | 4.1%), and Health Technologists (16 | 3.6%).
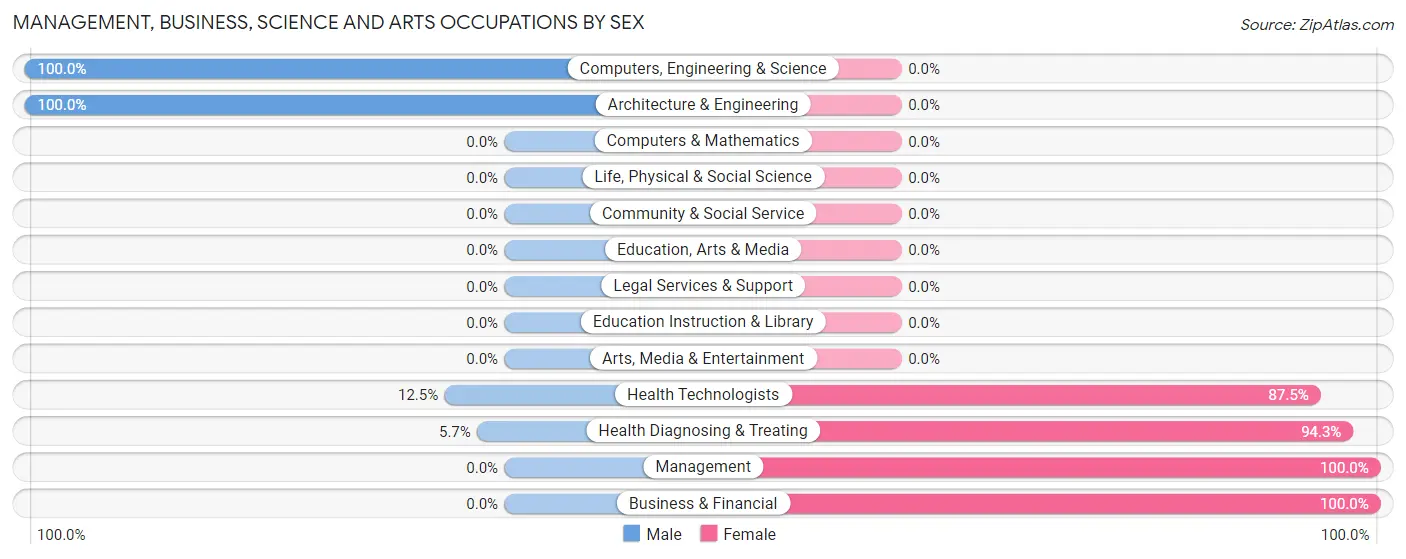
Management, Business, Science and Arts Occupations by Sex
Within the Management, Business, Science and Arts occupations in Sawyerwood, the most male-oriented occupations are Computers, Engineering & Science (100.0%), Architecture & Engineering (100.0%), and Health Technologists (12.5%), while the most female-oriented occupations are Management (100.0%), Business & Financial (100.0%), and Health Diagnosing & Treating (94.3%).
| Occupation | Male | Female |
| Management | 0 (0.0%) | 6 (100.0%) |
| Business & Financial | 0 (0.0%) | 18 (100.0%) |
| Computers, Engineering & Science | 39 (100.0%) | 0 (0.0%) |
| Computers & Mathematics | 0 (0.0%) | 0 (0.0%) |
| Architecture & Engineering | 39 (100.0%) | 0 (0.0%) |
| Life, Physical & Social Science | 0 (0.0%) | 0 (0.0%) |
| Community & Social Service | 0 (0.0%) | 0 (0.0%) |
| Education, Arts & Media | 0 (0.0%) | 0 (0.0%) |
| Legal Services & Support | 0 (0.0%) | 0 (0.0%) |
| Education Instruction & Library | 0 (0.0%) | 0 (0.0%) |
| Arts, Media & Entertainment | 0 (0.0%) | 0 (0.0%) |
| Health Diagnosing & Treating | 2 (5.7%) | 33 (94.3%) |
| Health Technologists | 2 (12.5%) | 14 (87.5%) |
| Total (Category) | 41 (41.8%) | 57 (58.2%) |
| Total (Overall) | 230 (52.5%) | 208 (47.5%) |
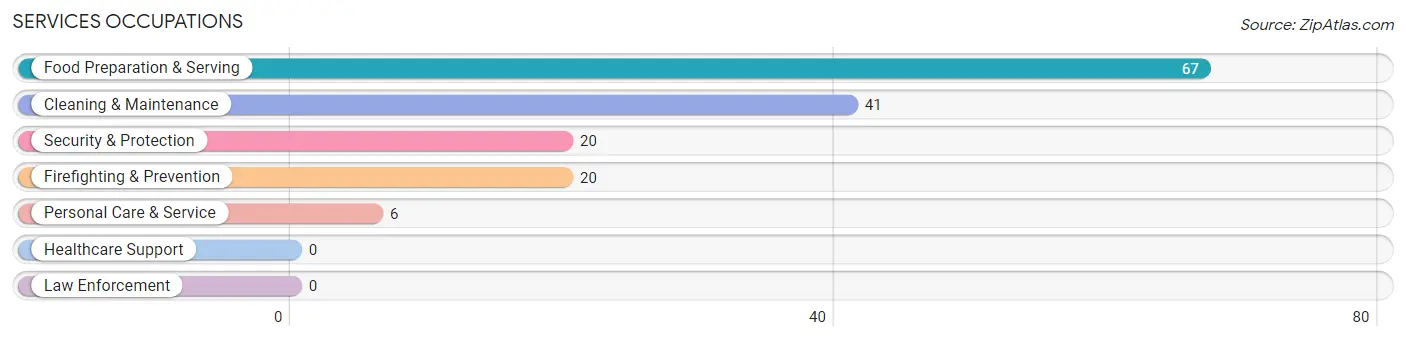
Services Occupations
The most common Services occupations in Sawyerwood are Food Preparation & Serving (67 | 15.3%), Cleaning & Maintenance (41 | 9.4%), Security & Protection (20 | 4.6%), Firefighting & Prevention (20 | 4.6%), and Personal Care & Service (6 | 1.4%).
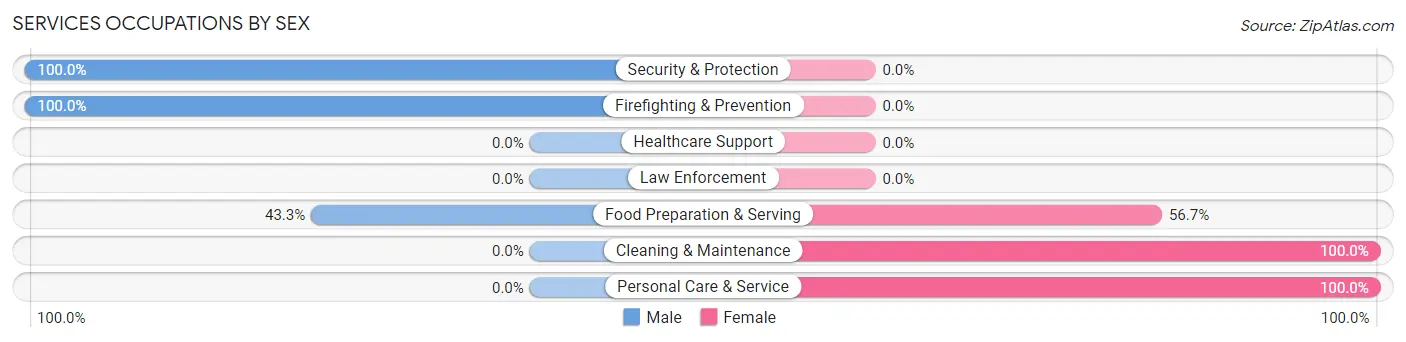
Services Occupations by Sex
Within the Services occupations in Sawyerwood, the most male-oriented occupations are Security & Protection (100.0%), Firefighting & Prevention (100.0%), and Food Preparation & Serving (43.3%), while the most female-oriented occupations are Cleaning & Maintenance (100.0%), Personal Care & Service (100.0%), and Food Preparation & Serving (56.7%).
| Occupation | Male | Female |
| Healthcare Support | 0 (0.0%) | 0 (0.0%) |
| Security & Protection | 20 (100.0%) | 0 (0.0%) |
| Firefighting & Prevention | 20 (100.0%) | 0 (0.0%) |
| Law Enforcement | 0 (0.0%) | 0 (0.0%) |
| Food Preparation & Serving | 29 (43.3%) | 38 (56.7%) |
| Cleaning & Maintenance | 0 (0.0%) | 41 (100.0%) |
| Personal Care & Service | 0 (0.0%) | 6 (100.0%) |
| Total (Category) | 49 (36.6%) | 85 (63.4%) |
| Total (Overall) | 230 (52.5%) | 208 (47.5%) |
Sales and Office Occupations
The most common Sales and Office occupations in Sawyerwood are Office & Administration (43 | 9.8%), and Sales & Related (22 | 5.0%).
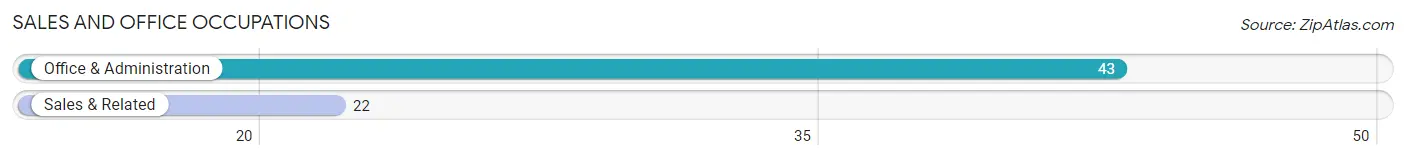
Sales and Office Occupations by Sex
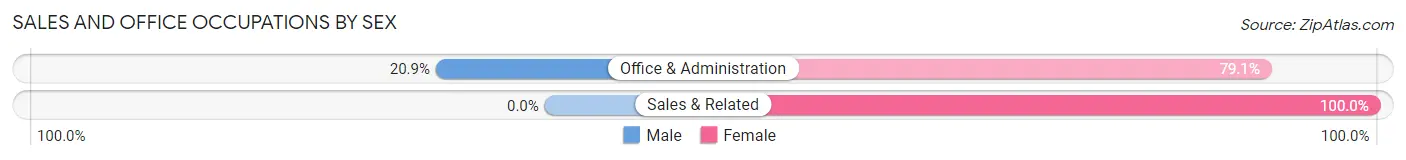
| Occupation | Male | Female |
| Sales & Related | 0 (0.0%) | 22 (100.0%) |
| Office & Administration | 9 (20.9%) | 34 (79.1%) |
| Total (Category) | 9 (13.9%) | 56 (86.2%) |
| Total (Overall) | 230 (52.5%) | 208 (47.5%) |
Natural Resources, Construction and Maintenance Occupations
The most common Natural Resources, Construction and Maintenance occupations in Sawyerwood are , and Installation, Maintenance & Repair (42 | 9.6%).
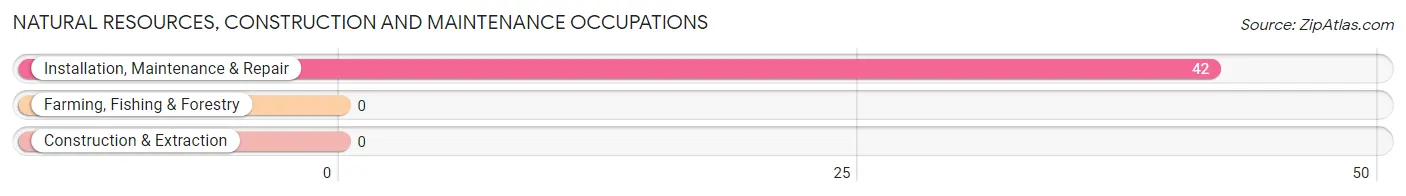
Natural Resources, Construction and Maintenance Occupations by Sex
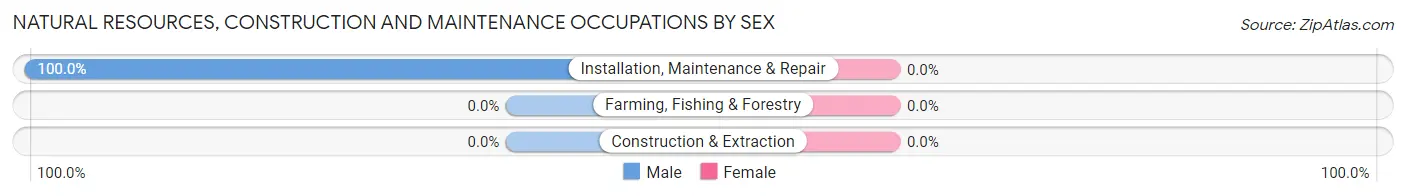
| Occupation | Male | Female |
| Farming, Fishing & Forestry | 0 (0.0%) | 0 (0.0%) |
| Construction & Extraction | 0 (0.0%) | 0 (0.0%) |
| Installation, Maintenance & Repair | 42 (100.0%) | 0 (0.0%) |
| Total (Category) | 42 (100.0%) | 0 (0.0%) |
| Total (Overall) | 230 (52.5%) | 208 (47.5%) |
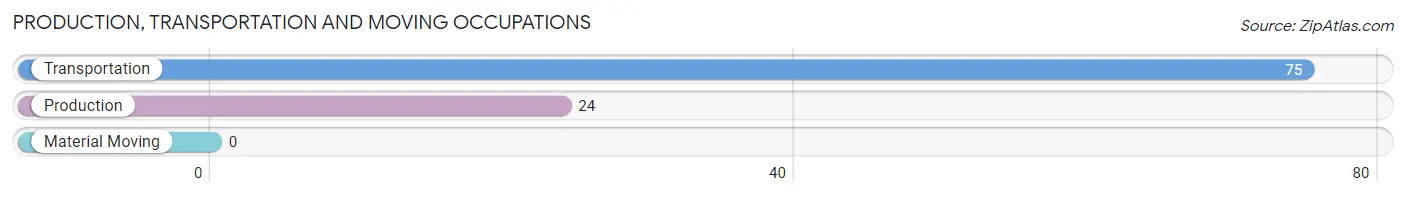
Production, Transportation and Moving Occupations
The most common Production, Transportation and Moving occupations in Sawyerwood are Transportation (75 | 17.1%), and Production (24 | 5.5%).
Production, Transportation and Moving Occupations by Sex
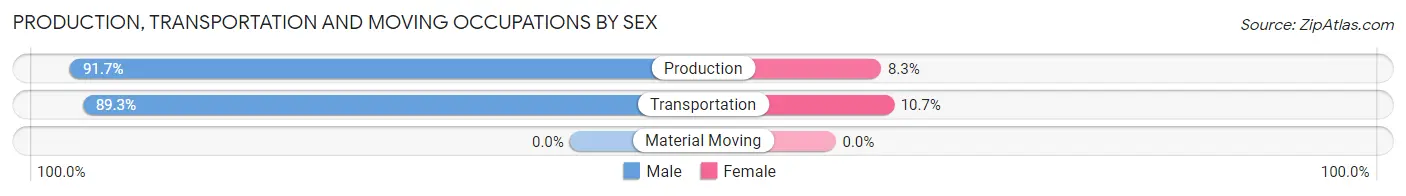
| Occupation | Male | Female |
| Production | 22 (91.7%) | 2 (8.3%) |
| Transportation | 67 (89.3%) | 8 (10.7%) |
| Material Moving | 0 (0.0%) | 0 (0.0%) |
| Total (Category) | 89 (89.9%) | 10 (10.1%) |
| Total (Overall) | 230 (52.5%) | 208 (47.5%) |
Employment Industries by Sex in Sawyerwood
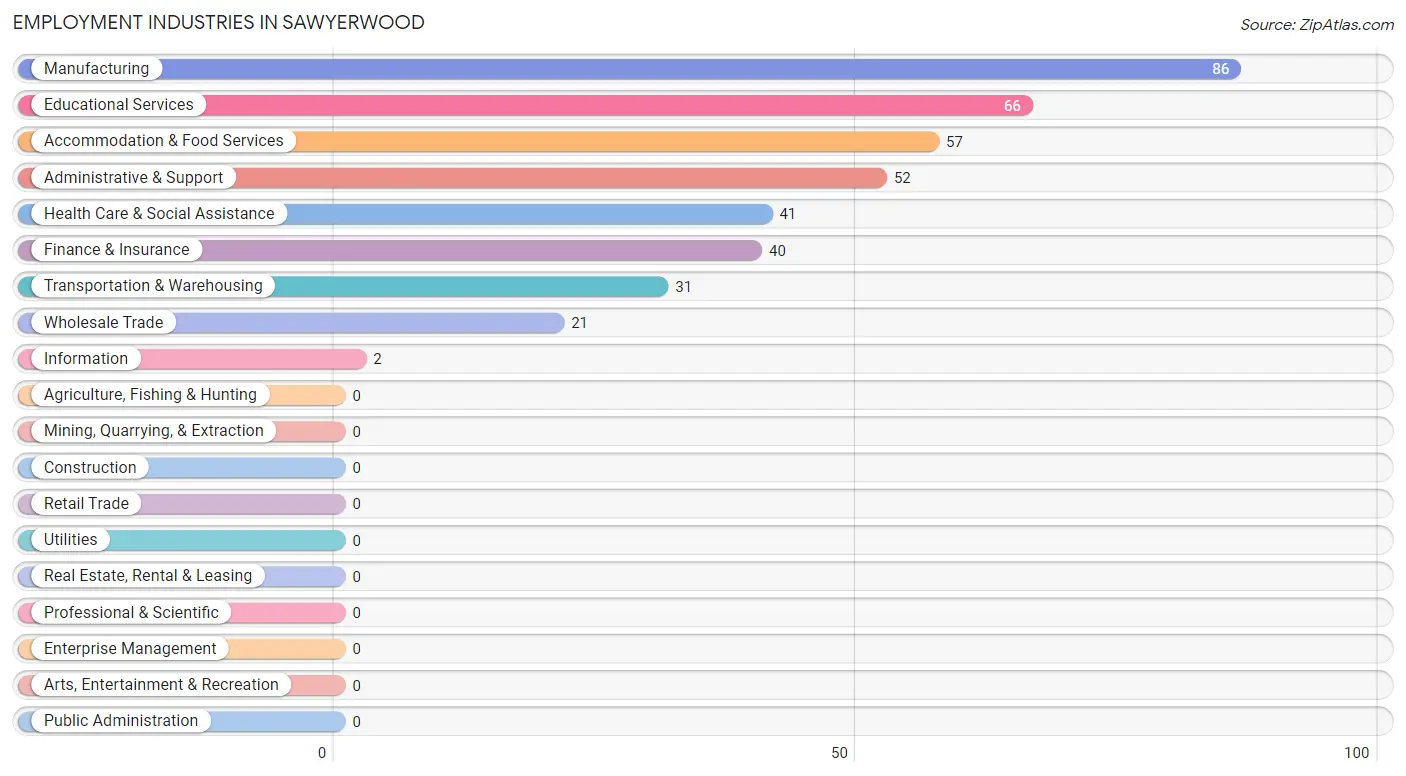
Employment Industries in Sawyerwood
The major employment industries in Sawyerwood include Manufacturing (86 | 19.6%), Educational Services (66 | 15.1%), Accommodation & Food Services (57 | 13.0%), Administrative & Support (52 | 11.9%), and Health Care & Social Assistance (41 | 9.4%).
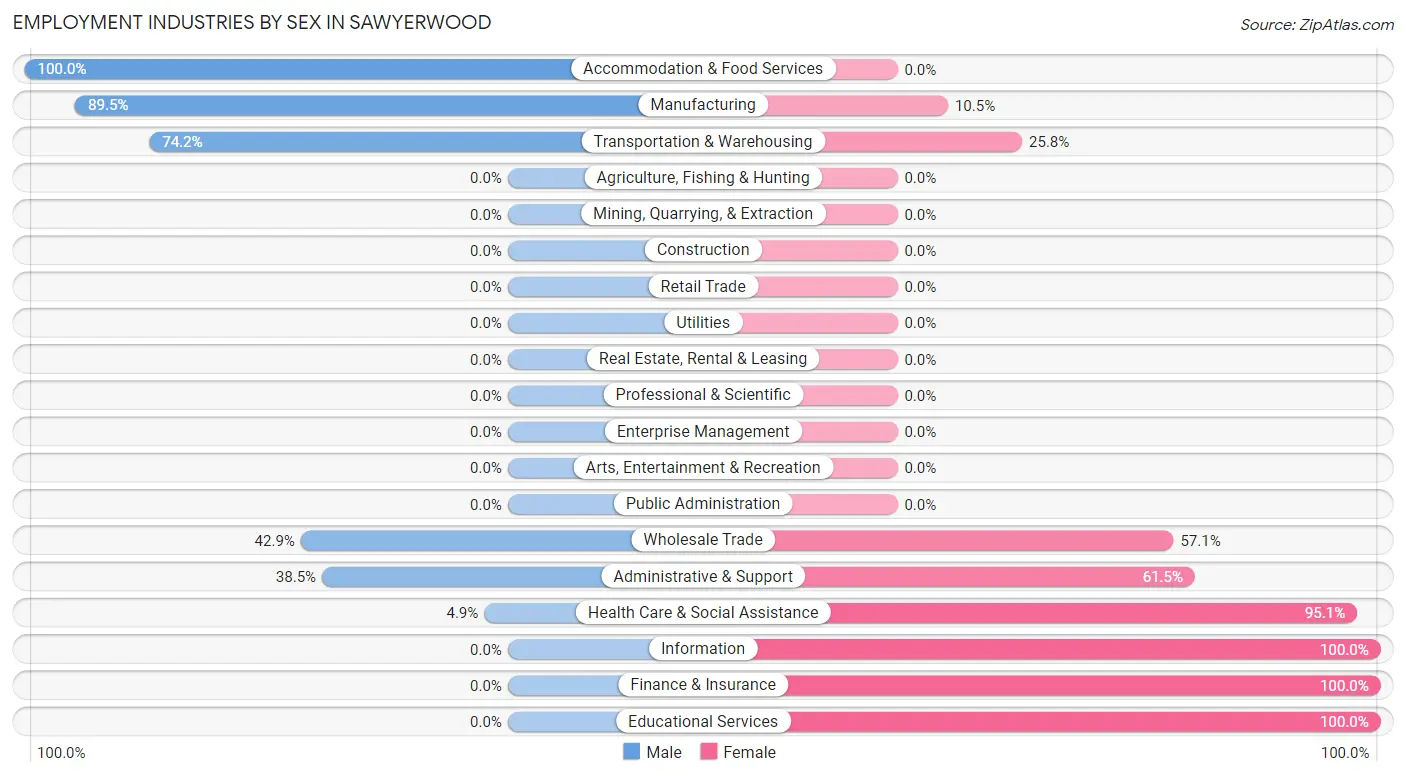
Employment Industries by Sex in Sawyerwood
The Sawyerwood industries that see more men than women are Accommodation & Food Services (100.0%), Manufacturing (89.5%), and Transportation & Warehousing (74.2%), whereas the industries that tend to have a higher number of women are Information (100.0%), Finance & Insurance (100.0%), and Educational Services (100.0%).
| Industry | Male | Female |
| Agriculture, Fishing & Hunting | 0 (0.0%) | 0 (0.0%) |
| Mining, Quarrying, & Extraction | 0 (0.0%) | 0 (0.0%) |
| Construction | 0 (0.0%) | 0 (0.0%) |
| Manufacturing | 77 (89.5%) | 9 (10.5%) |
| Wholesale Trade | 9 (42.9%) | 12 (57.1%) |
| Retail Trade | 0 (0.0%) | 0 (0.0%) |
| Transportation & Warehousing | 23 (74.2%) | 8 (25.8%) |
| Utilities | 0 (0.0%) | 0 (0.0%) |
| Information | 0 (0.0%) | 2 (100.0%) |
| Finance & Insurance | 0 (0.0%) | 40 (100.0%) |
| Real Estate, Rental & Leasing | 0 (0.0%) | 0 (0.0%) |
| Professional & Scientific | 0 (0.0%) | 0 (0.0%) |
| Enterprise Management | 0 (0.0%) | 0 (0.0%) |
| Administrative & Support | 20 (38.5%) | 32 (61.5%) |
| Educational Services | 0 (0.0%) | 66 (100.0%) |
| Health Care & Social Assistance | 2 (4.9%) | 39 (95.1%) |
| Arts, Entertainment & Recreation | 0 (0.0%) | 0 (0.0%) |
| Accommodation & Food Services | 57 (100.0%) | 0 (0.0%) |
| Public Administration | 0 (0.0%) | 0 (0.0%) |
| Total | 230 (52.5%) | 208 (47.5%) |
Education in Sawyerwood
School Enrollment in Sawyerwood
The most common levels of schooling among the 226 students in Sawyerwood are elementary school (77 | 34.1%), high school (62 | 27.4%), and college / undergraduate (46 | 20.3%).
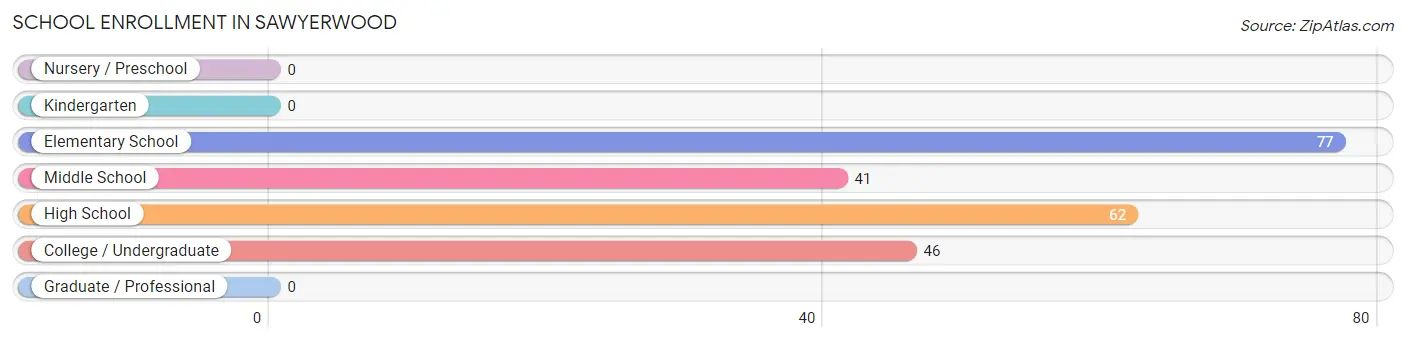
| School Level | # Students | % Students |
| Nursery / Preschool | 0 | 0.0% |
| Kindergarten | 0 | 0.0% |
| Elementary School | 77 | 34.1% |
| Middle School | 41 | 18.1% |
| High School | 62 | 27.4% |
| College / Undergraduate | 46 | 20.3% |
| Graduate / Professional | 0 | 0.0% |
| Total | 226 | 100.0% |
School Enrollment by Age by Funding Source in Sawyerwood
Out of a total of 226 students who are enrolled in schools in Sawyerwood, 46 (20.4%) attend a private institution, while the remaining 180 (79.6%) are enrolled in public schools. The age group of 20 to 24 year olds has the highest likelihood of being enrolled in private schools, with 18 (100.0% in the age bracket) enrolled. Conversely, the age group of 5 to 9 year old has the lowest likelihood of being enrolled in a private school, with 23 (100.0% in the age bracket) attending a public institution.
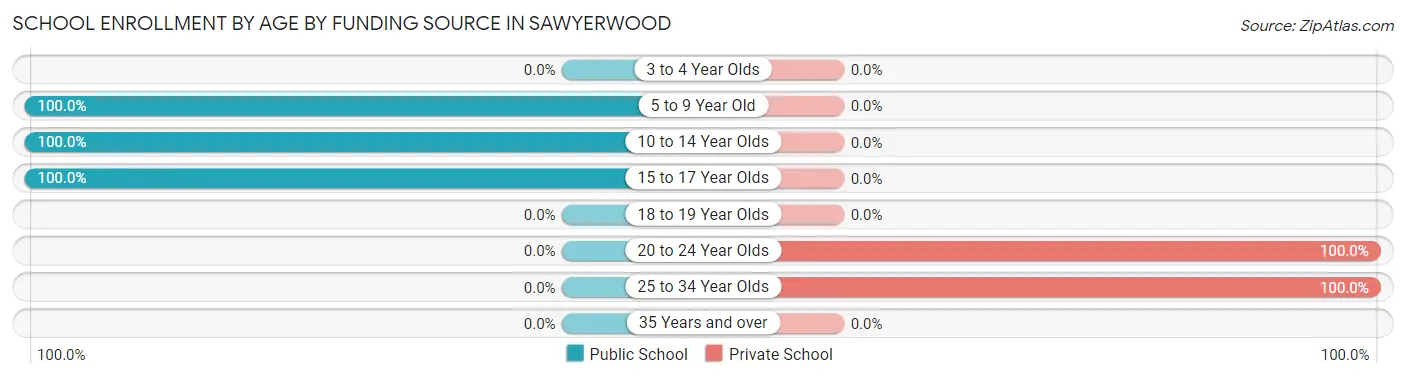
| Age Bracket | Public School | Private School |
| 3 to 4 Year Olds | 0 (0.0%) | 0 (0.0%) |
| 5 to 9 Year Old | 23 (100.0%) | 0 (0.0%) |
| 10 to 14 Year Olds | 95 (100.0%) | 0 (0.0%) |
| 15 to 17 Year Olds | 62 (100.0%) | 0 (0.0%) |
| 18 to 19 Year Olds | 0 (0.0%) | 0 (0.0%) |
| 20 to 24 Year Olds | 0 (0.0%) | 18 (100.0%) |
| 25 to 34 Year Olds | 0 (0.0%) | 28 (100.0%) |
| 35 Years and over | 0 (0.0%) | 0 (0.0%) |
| Total | 180 (79.6%) | 46 (20.4%) |
Educational Attainment by Field of Study in Sawyerwood
Education (64 | 33.5%), arts & humanities (44 | 23.0%), engineering (39 | 20.4%), visual & performing arts (28 | 14.7%), and business (16 | 8.4%) are the most common fields of study among 191 individuals in Sawyerwood who have obtained a bachelor's degree or higher.
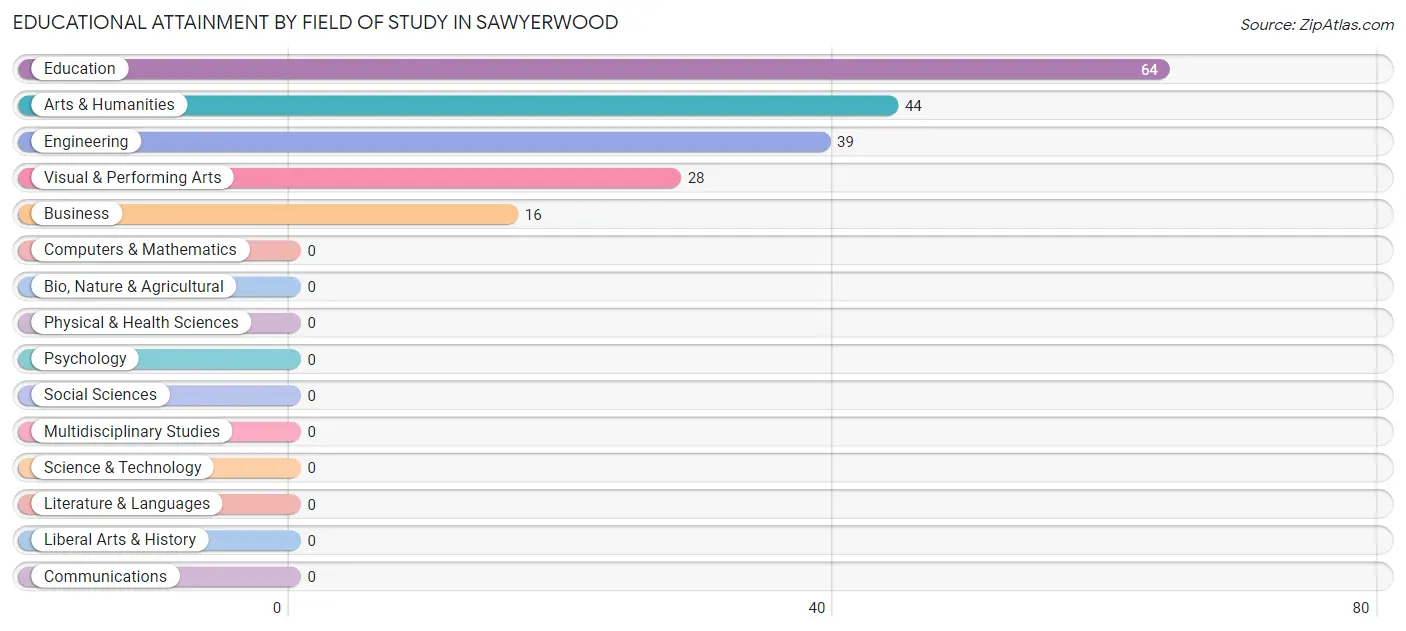
| Field of Study | # Graduates | % Graduates |
| Computers & Mathematics | 0 | 0.0% |
| Bio, Nature & Agricultural | 0 | 0.0% |
| Physical & Health Sciences | 0 | 0.0% |
| Psychology | 0 | 0.0% |
| Social Sciences | 0 | 0.0% |
| Engineering | 39 | 20.4% |
| Multidisciplinary Studies | 0 | 0.0% |
| Science & Technology | 0 | 0.0% |
| Business | 16 | 8.4% |
| Education | 64 | 33.5% |
| Literature & Languages | 0 | 0.0% |
| Liberal Arts & History | 0 | 0.0% |
| Visual & Performing Arts | 28 | 14.7% |
| Communications | 0 | 0.0% |
| Arts & Humanities | 44 | 23.0% |
| Total | 191 | 100.0% |
Transportation & Commute in Sawyerwood
Vehicle Availability by Sex in Sawyerwood
The most prevalent vehicle ownership categories in Sawyerwood are males with 2 vehicles (69, accounting for 31.2%) and females with 2 vehicles (102, making up 33.2%).
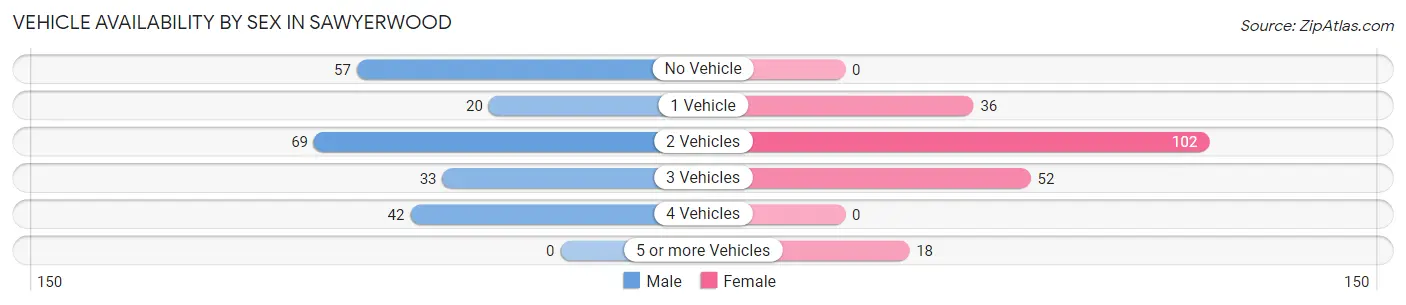
| Vehicles Available | Male | Female |
| No Vehicle | 57 (25.8%) | 0 (0.0%) |
| 1 Vehicle | 20 (9.0%) | 36 (17.3%) |
| 2 Vehicles | 69 (31.2%) | 102 (49.0%) |
| 3 Vehicles | 33 (14.9%) | 52 (25.0%) |
| 4 Vehicles | 42 (19.0%) | 0 (0.0%) |
| 5 or more Vehicles | 0 (0.0%) | 18 (8.6%) |
| Total | 221 (100.0%) | 208 (100.0%) |
Commute Time in Sawyerwood
The most frequently occuring commute durations in Sawyerwood are 15 to 19 minutes (116 commuters, 30.1%), 20 to 24 minutes (115 commuters, 29.9%), and 5 to 9 minutes (63 commuters, 16.4%).
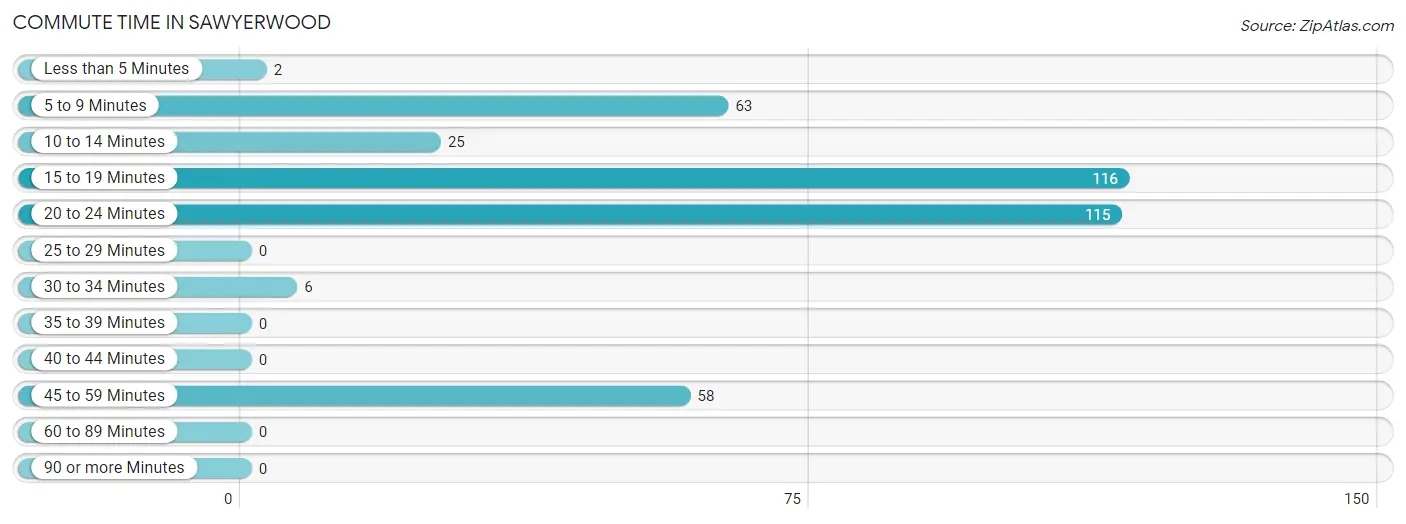
| Commute Time | # Commuters | % Commuters |
| Less than 5 Minutes | 2 | 0.5% |
| 5 to 9 Minutes | 63 | 16.4% |
| 10 to 14 Minutes | 25 | 6.5% |
| 15 to 19 Minutes | 116 | 30.1% |
| 20 to 24 Minutes | 115 | 29.9% |
| 25 to 29 Minutes | 0 | 0.0% |
| 30 to 34 Minutes | 6 | 1.6% |
| 35 to 39 Minutes | 0 | 0.0% |
| 40 to 44 Minutes | 0 | 0.0% |
| 45 to 59 Minutes | 58 | 15.1% |
| 60 to 89 Minutes | 0 | 0.0% |
| 90 or more Minutes | 0 | 0.0% |
Commute Time by Sex in Sawyerwood
The most common commute times in Sawyerwood are 15 to 19 minutes (110 commuters, 49.8%) for males and 20 to 24 minutes (84 commuters, 51.2%) for females.
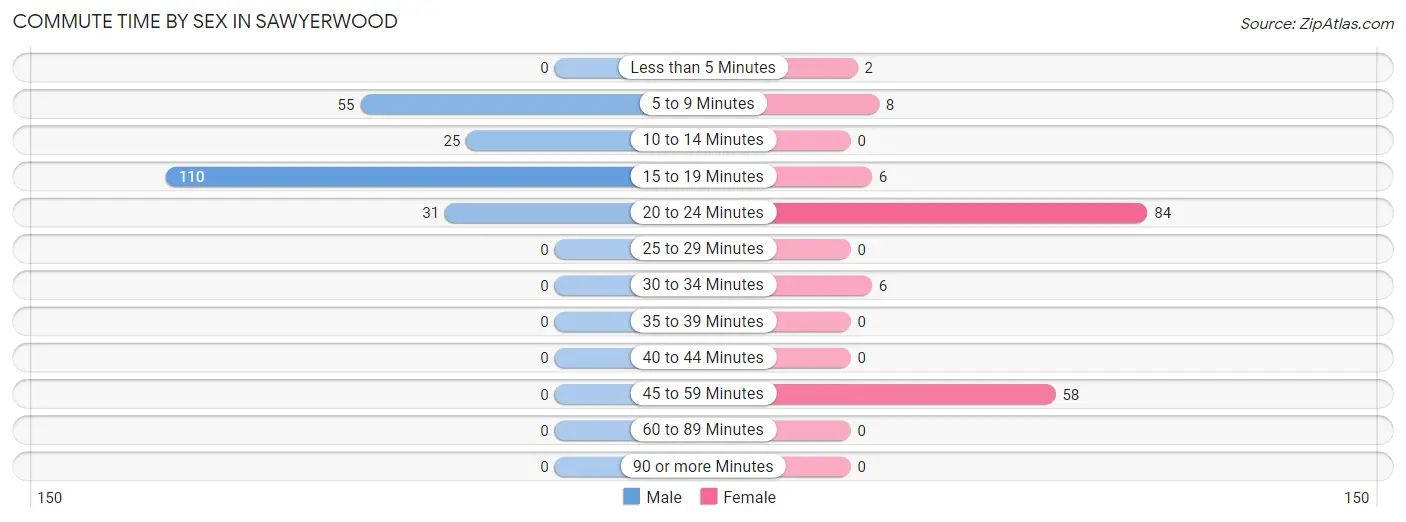
| Commute Time | Male | Female |
| Less than 5 Minutes | 0 (0.0%) | 2 (1.2%) |
| 5 to 9 Minutes | 55 (24.9%) | 8 (4.9%) |
| 10 to 14 Minutes | 25 (11.3%) | 0 (0.0%) |
| 15 to 19 Minutes | 110 (49.8%) | 6 (3.7%) |
| 20 to 24 Minutes | 31 (14.0%) | 84 (51.2%) |
| 25 to 29 Minutes | 0 (0.0%) | 0 (0.0%) |
| 30 to 34 Minutes | 0 (0.0%) | 6 (3.7%) |
| 35 to 39 Minutes | 0 (0.0%) | 0 (0.0%) |
| 40 to 44 Minutes | 0 (0.0%) | 0 (0.0%) |
| 45 to 59 Minutes | 0 (0.0%) | 58 (35.4%) |
| 60 to 89 Minutes | 0 (0.0%) | 0 (0.0%) |
| 90 or more Minutes | 0 (0.0%) | 0 (0.0%) |
Time of Departure to Work by Sex in Sawyerwood
The most frequent times of departure to work in Sawyerwood are 5:30 AM to 5:59 AM (75, 33.9%) for males and 7:00 AM to 7:29 AM (53, 32.3%) for females.
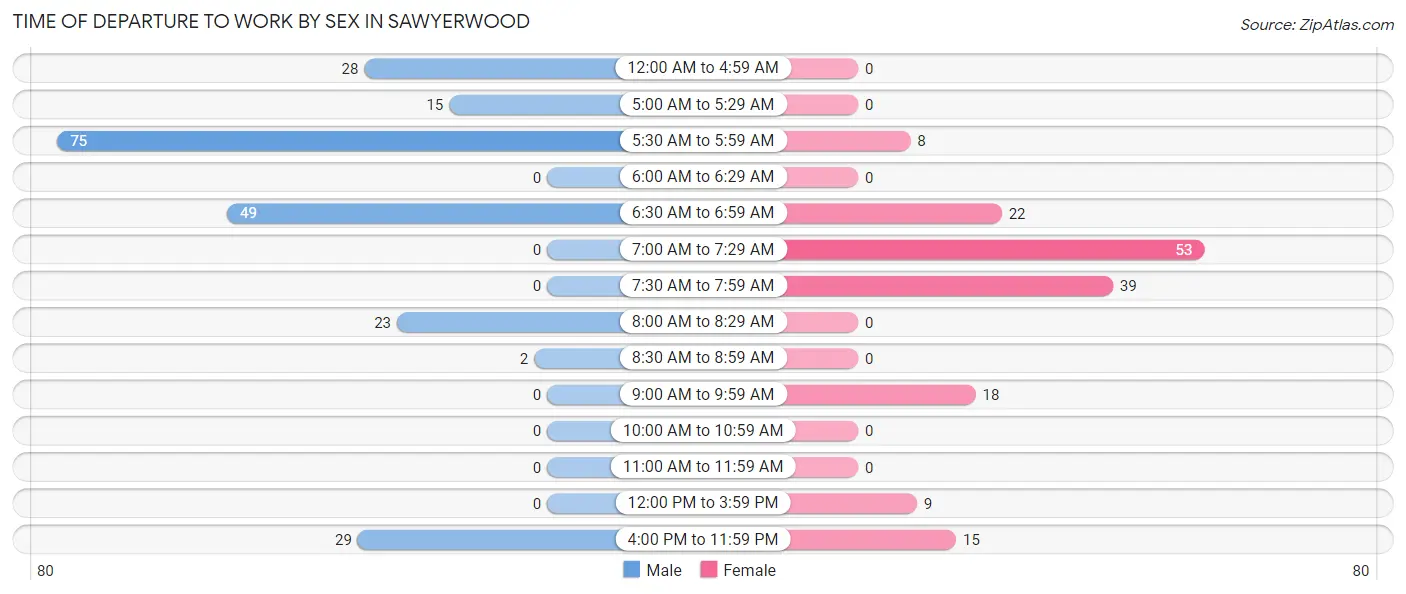
| Time of Departure | Male | Female |
| 12:00 AM to 4:59 AM | 28 (12.7%) | 0 (0.0%) |
| 5:00 AM to 5:29 AM | 15 (6.8%) | 0 (0.0%) |
| 5:30 AM to 5:59 AM | 75 (33.9%) | 8 (4.9%) |
| 6:00 AM to 6:29 AM | 0 (0.0%) | 0 (0.0%) |
| 6:30 AM to 6:59 AM | 49 (22.2%) | 22 (13.4%) |
| 7:00 AM to 7:29 AM | 0 (0.0%) | 53 (32.3%) |
| 7:30 AM to 7:59 AM | 0 (0.0%) | 39 (23.8%) |
| 8:00 AM to 8:29 AM | 23 (10.4%) | 0 (0.0%) |
| 8:30 AM to 8:59 AM | 2 (0.9%) | 0 (0.0%) |
| 9:00 AM to 9:59 AM | 0 (0.0%) | 18 (11.0%) |
| 10:00 AM to 10:59 AM | 0 (0.0%) | 0 (0.0%) |
| 11:00 AM to 11:59 AM | 0 (0.0%) | 0 (0.0%) |
| 12:00 PM to 3:59 PM | 0 (0.0%) | 9 (5.5%) |
| 4:00 PM to 11:59 PM | 29 (13.1%) | 15 (9.1%) |
| Total | 221 (100.0%) | 164 (100.0%) |
Housing Occupancy in Sawyerwood
Occupancy by Ownership in Sawyerwood
Of the total 536 dwellings in Sawyerwood, owner-occupied units account for 489 (91.2%), while renter-occupied units make up 47 (8.8%).
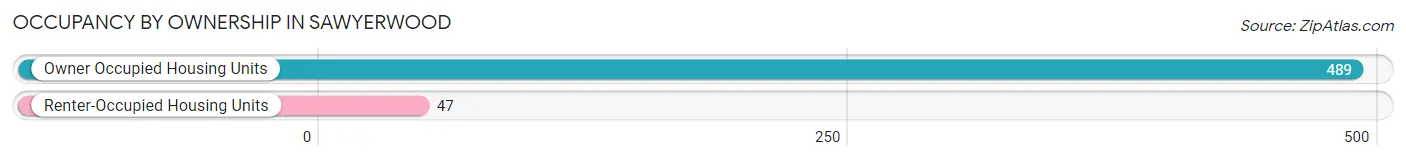
| Occupancy | # Housing Units | % Housing Units |
| Owner Occupied Housing Units | 489 | 91.2% |
| Renter-Occupied Housing Units | 47 | 8.8% |
| Total Occupied Housing Units | 536 | 100.0% |
Occupancy by Household Size in Sawyerwood
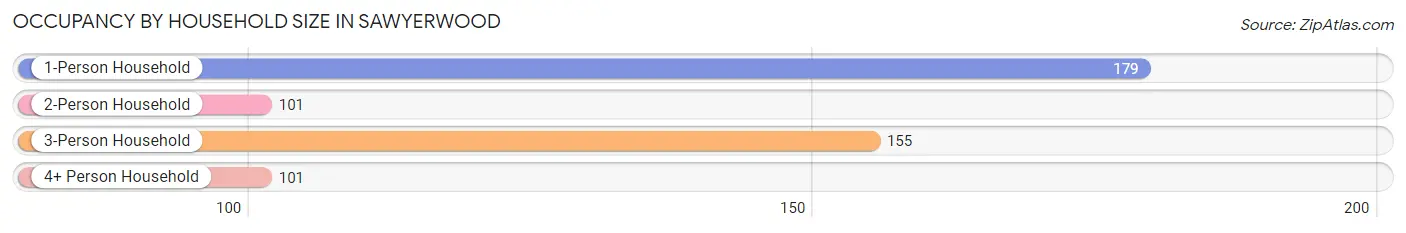
| Household Size | # Housing Units | % Housing Units |
| 1-Person Household | 179 | 33.4% |
| 2-Person Household | 101 | 18.8% |
| 3-Person Household | 155 | 28.9% |
| 4+ Person Household | 101 | 18.8% |
| Total Housing Units | 536 | 100.0% |
Occupancy by Ownership by Household Size in Sawyerwood
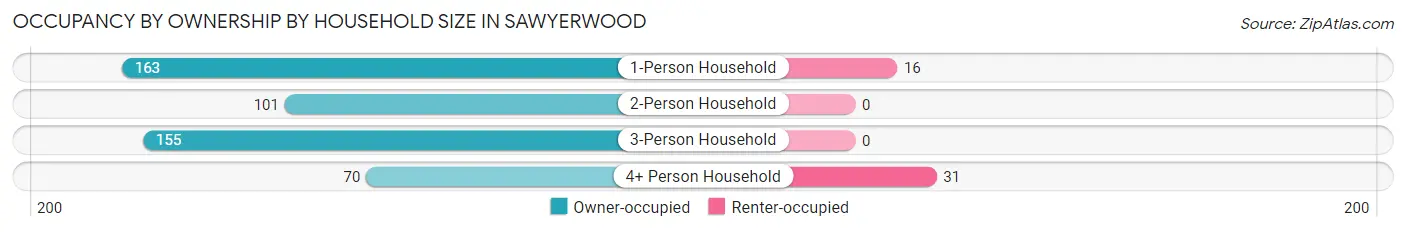
| Household Size | Owner-occupied | Renter-occupied |
| 1-Person Household | 163 (91.1%) | 16 (8.9%) |
| 2-Person Household | 101 (100.0%) | 0 (0.0%) |
| 3-Person Household | 155 (100.0%) | 0 (0.0%) |
| 4+ Person Household | 70 (69.3%) | 31 (30.7%) |
| Total Housing Units | 489 (91.2%) | 47 (8.8%) |
Occupancy by Educational Attainment in Sawyerwood
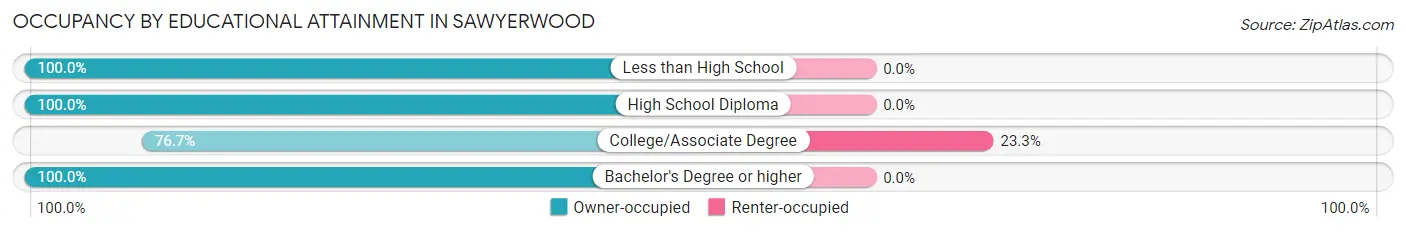
| Household Size | Owner-occupied | Renter-occupied |
| Less than High School | 114 (100.0%) | 0 (0.0%) |
| High School Diploma | 182 (100.0%) | 0 (0.0%) |
| College/Associate Degree | 155 (76.7%) | 47 (23.3%) |
| Bachelor's Degree or higher | 38 (100.0%) | 0 (0.0%) |
Occupancy by Age of Householder in Sawyerwood
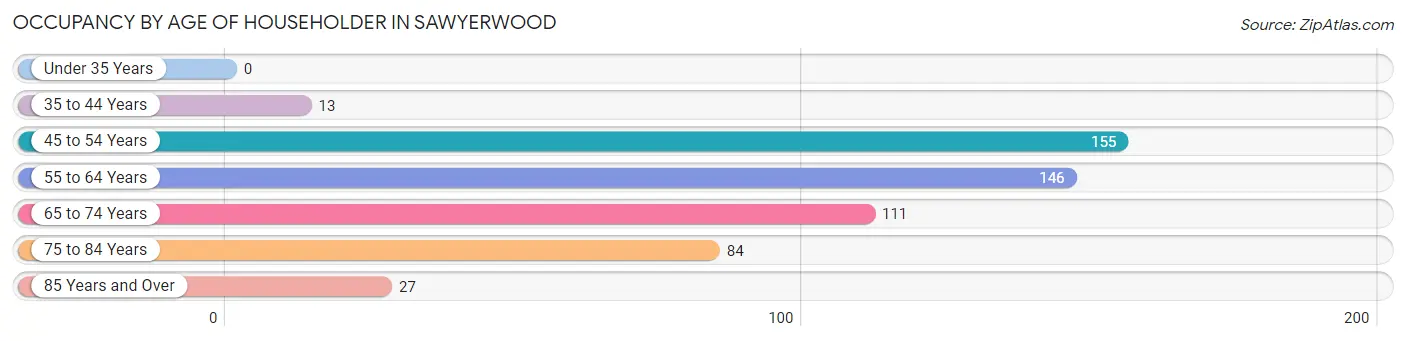
| Age Bracket | # Households | % Households |
| Under 35 Years | 0 | 0.0% |
| 35 to 44 Years | 13 | 2.4% |
| 45 to 54 Years | 155 | 28.9% |
| 55 to 64 Years | 146 | 27.2% |
| 65 to 74 Years | 111 | 20.7% |
| 75 to 84 Years | 84 | 15.7% |
| 85 Years and Over | 27 | 5.0% |
| Total | 536 | 100.0% |
Housing Finances in Sawyerwood
Median Income by Occupancy in Sawyerwood
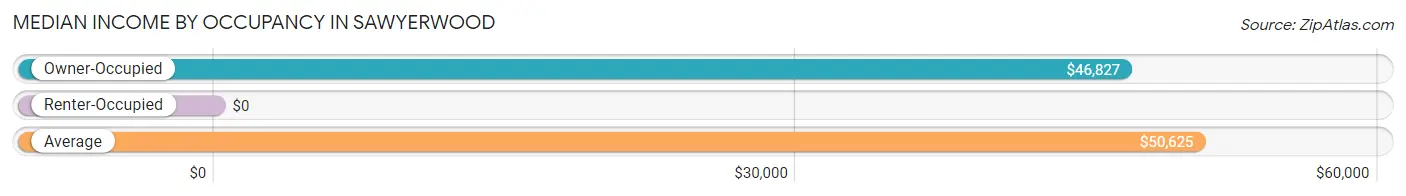
| Occupancy Type | # Households | Median Income |
| Owner-Occupied | 489 (91.2%) | $46,827 |
| Renter-Occupied | 47 (8.8%) | $0 |
| Average | 536 (100.0%) | $50,625 |
Occupancy by Householder Income Bracket in Sawyerwood
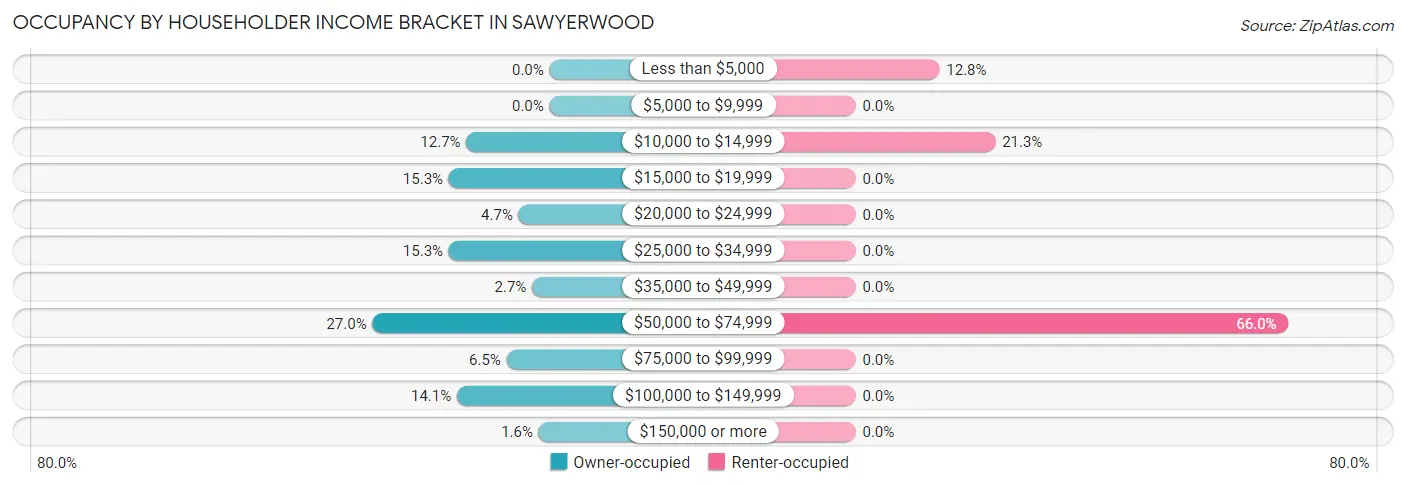
| Income Bracket | Owner-occupied | Renter-occupied |
| Less than $5,000 | 0 (0.0%) | 6 (12.8%) |
| $5,000 to $9,999 | 0 (0.0%) | 0 (0.0%) |
| $10,000 to $14,999 | 62 (12.7%) | 10 (21.3%) |
| $15,000 to $19,999 | 75 (15.3%) | 0 (0.0%) |
| $20,000 to $24,999 | 23 (4.7%) | 0 (0.0%) |
| $25,000 to $34,999 | 75 (15.3%) | 0 (0.0%) |
| $35,000 to $49,999 | 13 (2.7%) | 0 (0.0%) |
| $50,000 to $74,999 | 132 (27.0%) | 31 (66.0%) |
| $75,000 to $99,999 | 32 (6.5%) | 0 (0.0%) |
| $100,000 to $149,999 | 69 (14.1%) | 0 (0.0%) |
| $150,000 or more | 8 (1.6%) | 0 (0.0%) |
| Total | 489 (100.0%) | 47 (100.0%) |
Monthly Housing Cost Tiers in Sawyerwood
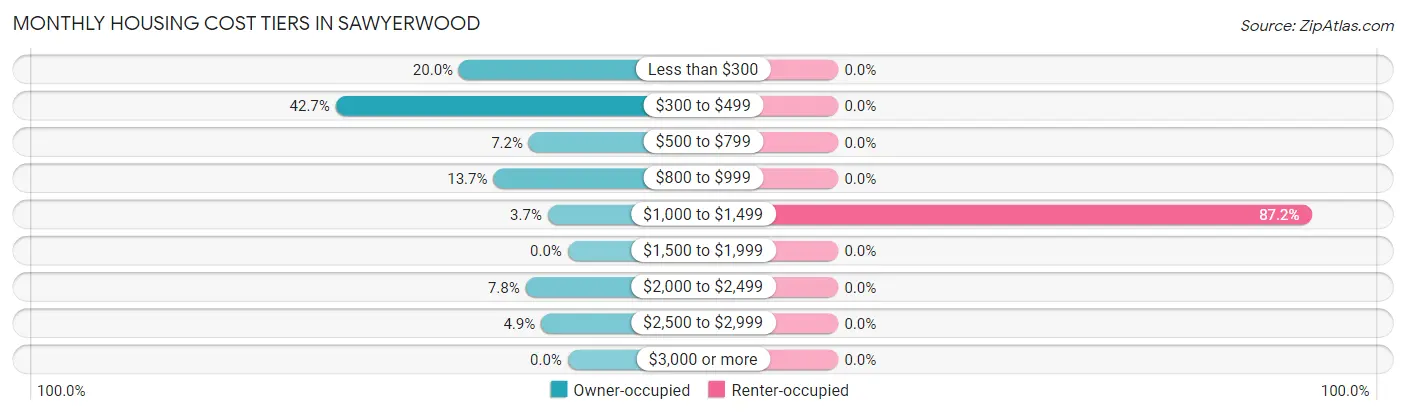
| Monthly Cost | Owner-occupied | Renter-occupied |
| Less than $300 | 98 (20.0%) | 0 (0.0%) |
| $300 to $499 | 209 (42.7%) | 0 (0.0%) |
| $500 to $799 | 35 (7.2%) | 0 (0.0%) |
| $800 to $999 | 67 (13.7%) | 0 (0.0%) |
| $1,000 to $1,499 | 18 (3.7%) | 41 (87.2%) |
| $1,500 to $1,999 | 0 (0.0%) | 0 (0.0%) |
| $2,000 to $2,499 | 38 (7.8%) | 0 (0.0%) |
| $2,500 to $2,999 | 24 (4.9%) | 0 (0.0%) |
| $3,000 or more | 0 (0.0%) | 0 (0.0%) |
| Total | 489 (100.0%) | 47 (100.0%) |
Physical Housing Characteristics in Sawyerwood
Housing Structures in Sawyerwood
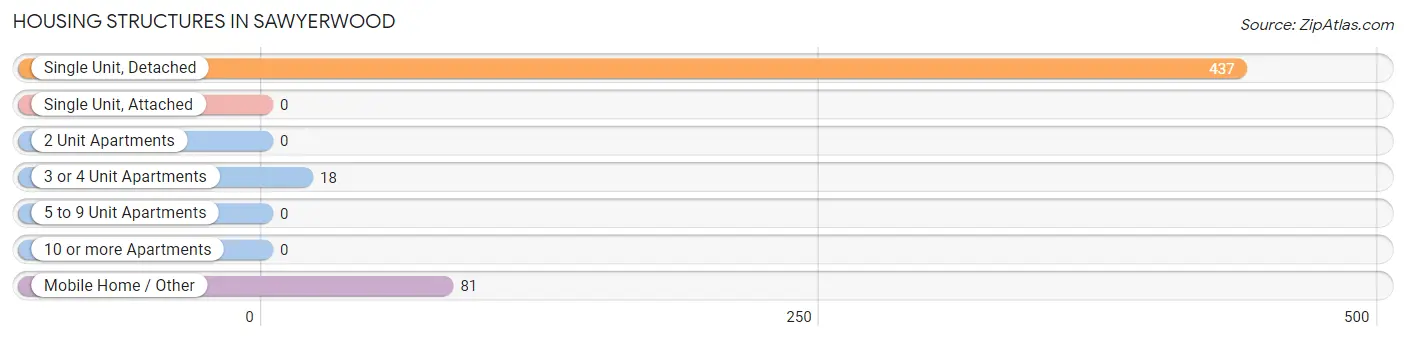
| Structure Type | # Housing Units | % Housing Units |
| Single Unit, Detached | 437 | 81.5% |
| Single Unit, Attached | 0 | 0.0% |
| 2 Unit Apartments | 0 | 0.0% |
| 3 or 4 Unit Apartments | 18 | 3.4% |
| 5 to 9 Unit Apartments | 0 | 0.0% |
| 10 or more Apartments | 0 | 0.0% |
| Mobile Home / Other | 81 | 15.1% |
| Total | 536 | 100.0% |
Housing Structures by Occupancy in Sawyerwood
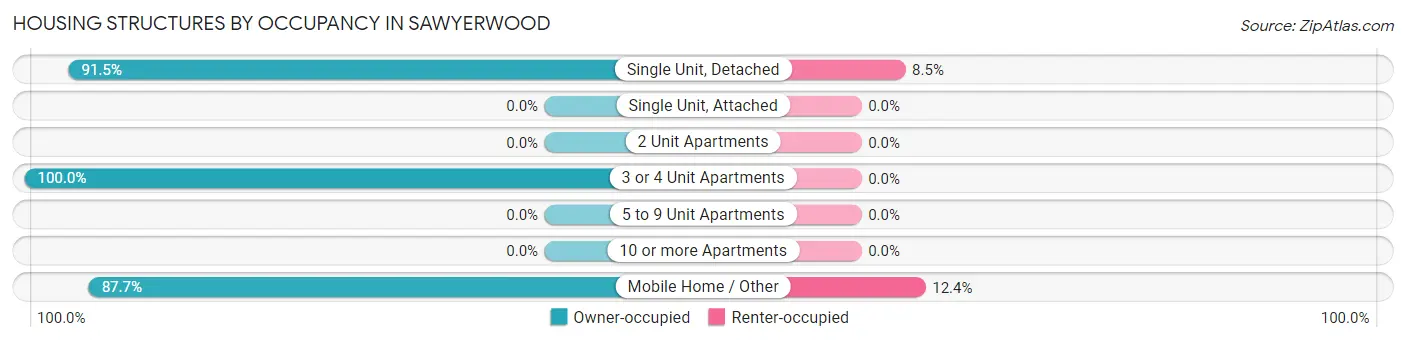
| Structure Type | Owner-occupied | Renter-occupied |
| Single Unit, Detached | 400 (91.5%) | 37 (8.5%) |
| Single Unit, Attached | 0 (0.0%) | 0 (0.0%) |
| 2 Unit Apartments | 0 (0.0%) | 0 (0.0%) |
| 3 or 4 Unit Apartments | 18 (100.0%) | 0 (0.0%) |
| 5 to 9 Unit Apartments | 0 (0.0%) | 0 (0.0%) |
| 10 or more Apartments | 0 (0.0%) | 0 (0.0%) |
| Mobile Home / Other | 71 (87.6%) | 10 (12.3%) |
| Total | 489 (91.2%) | 47 (8.8%) |
Housing Structures by Number of Rooms in Sawyerwood
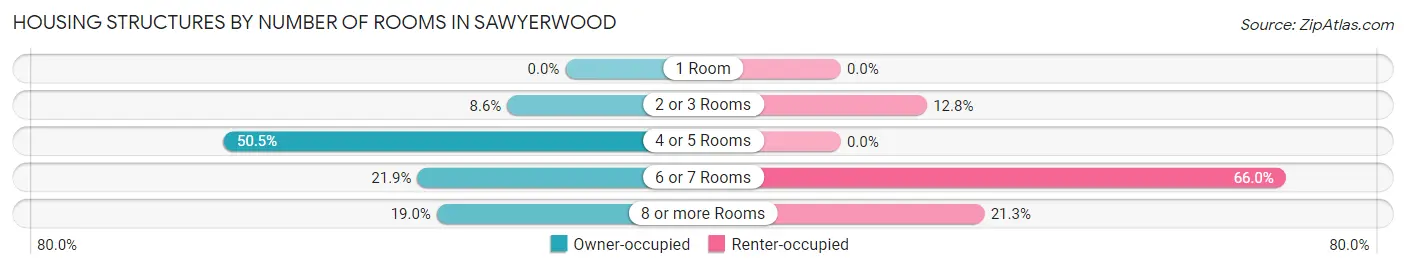
| Number of Rooms | Owner-occupied | Renter-occupied |
| 1 Room | 0 (0.0%) | 0 (0.0%) |
| 2 or 3 Rooms | 42 (8.6%) | 6 (12.8%) |
| 4 or 5 Rooms | 247 (50.5%) | 0 (0.0%) |
| 6 or 7 Rooms | 107 (21.9%) | 31 (66.0%) |
| 8 or more Rooms | 93 (19.0%) | 10 (21.3%) |
| Total | 489 (100.0%) | 47 (100.0%) |
Housing Structure by Heating Type in Sawyerwood
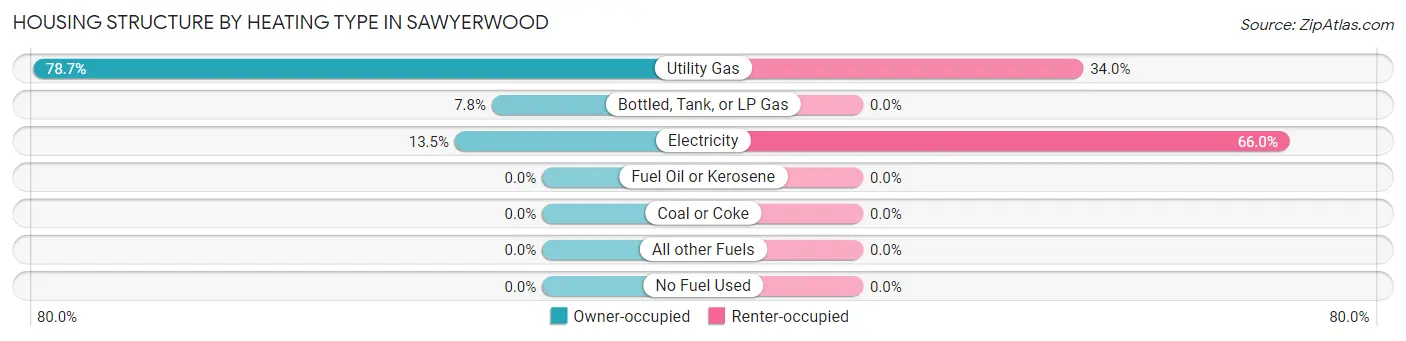
| Heating Type | Owner-occupied | Renter-occupied |
| Utility Gas | 385 (78.7%) | 16 (34.0%) |
| Bottled, Tank, or LP Gas | 38 (7.8%) | 0 (0.0%) |
| Electricity | 66 (13.5%) | 31 (66.0%) |
| Fuel Oil or Kerosene | 0 (0.0%) | 0 (0.0%) |
| Coal or Coke | 0 (0.0%) | 0 (0.0%) |
| All other Fuels | 0 (0.0%) | 0 (0.0%) |
| No Fuel Used | 0 (0.0%) | 0 (0.0%) |
| Total | 489 (100.0%) | 47 (100.0%) |
Household Vehicle Usage in Sawyerwood
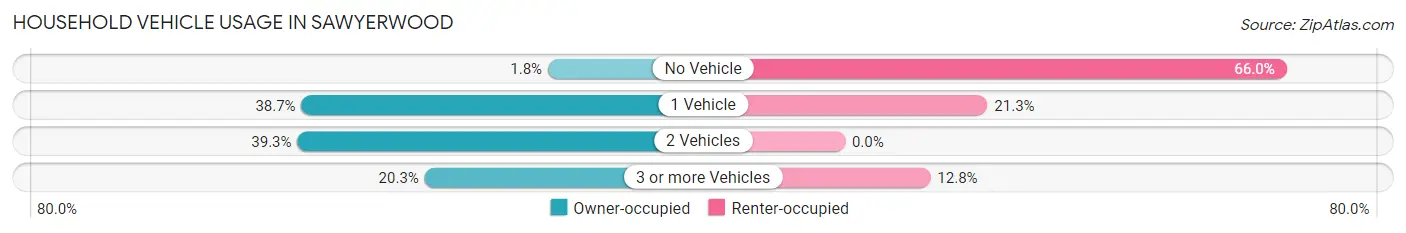
| Vehicles per Household | Owner-occupied | Renter-occupied |
| No Vehicle | 9 (1.8%) | 31 (66.0%) |
| 1 Vehicle | 189 (38.7%) | 10 (21.3%) |
| 2 Vehicles | 192 (39.3%) | 0 (0.0%) |
| 3 or more Vehicles | 99 (20.3%) | 6 (12.8%) |
| Total | 489 (100.0%) | 47 (100.0%) |
Real Estate & Mortgages in Sawyerwood
Real Estate and Mortgage Overview in Sawyerwood
| Characteristic | Without Mortgage | With Mortgage |
| Housing Units | 304 | 185 |
| Median Property Value | $83,600 | $184,700 |
| Median Household Income | $30,952 | $8 |
| Monthly Housing Costs | $414 | $0 |
| Real Estate Taxes | $1,596 | $0 |
Property Value by Mortgage Status in Sawyerwood
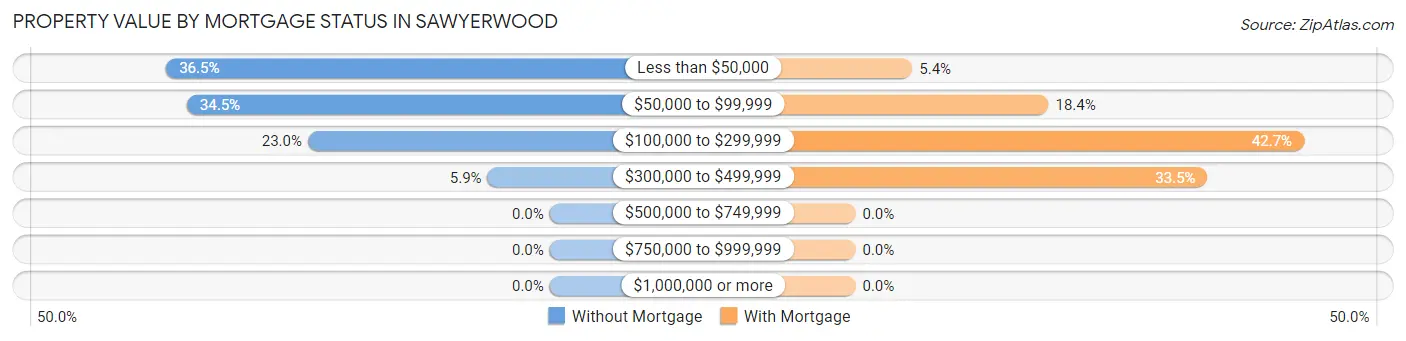
| Property Value | Without Mortgage | With Mortgage |
| Less than $50,000 | 111 (36.5%) | 10 (5.4%) |
| $50,000 to $99,999 | 105 (34.5%) | 34 (18.4%) |
| $100,000 to $299,999 | 70 (23.0%) | 79 (42.7%) |
| $300,000 to $499,999 | 18 (5.9%) | 62 (33.5%) |
| $500,000 to $749,999 | 0 (0.0%) | 0 (0.0%) |
| $750,000 to $999,999 | 0 (0.0%) | 0 (0.0%) |
| $1,000,000 or more | 0 (0.0%) | 0 (0.0%) |
| Total | 304 (100.0%) | 185 (100.0%) |
Household Income by Mortgage Status in Sawyerwood
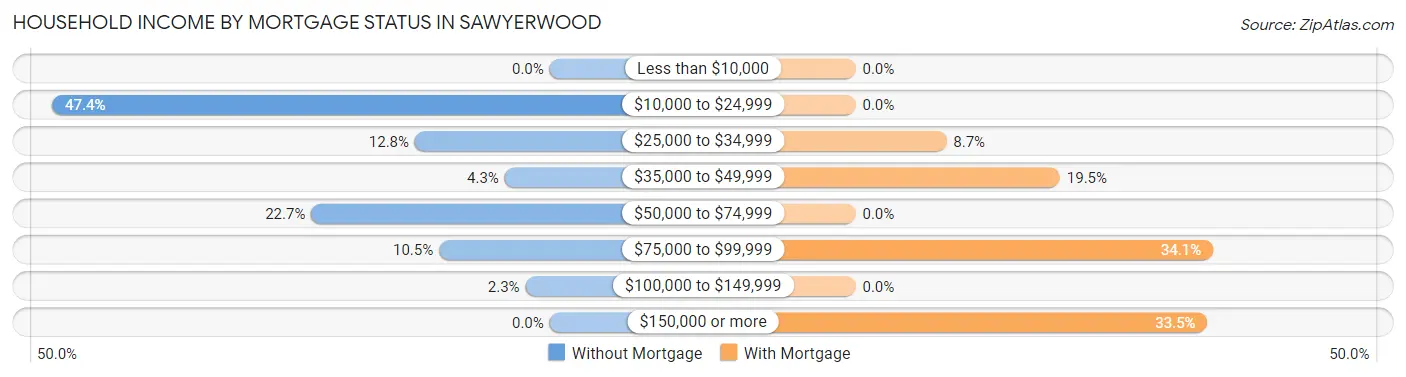
| Household Income | Without Mortgage | With Mortgage |
| Less than $10,000 | 0 (0.0%) | 0 (0.0%) |
| $10,000 to $24,999 | 144 (47.4%) | 0 (0.0%) |
| $25,000 to $34,999 | 39 (12.8%) | 16 (8.6%) |
| $35,000 to $49,999 | 13 (4.3%) | 36 (19.5%) |
| $50,000 to $74,999 | 69 (22.7%) | 0 (0.0%) |
| $75,000 to $99,999 | 32 (10.5%) | 63 (34.1%) |
| $100,000 to $149,999 | 7 (2.3%) | 0 (0.0%) |
| $150,000 or more | 0 (0.0%) | 62 (33.5%) |
| Total | 304 (100.0%) | 185 (100.0%) |
Property Value to Household Income Ratio in Sawyerwood
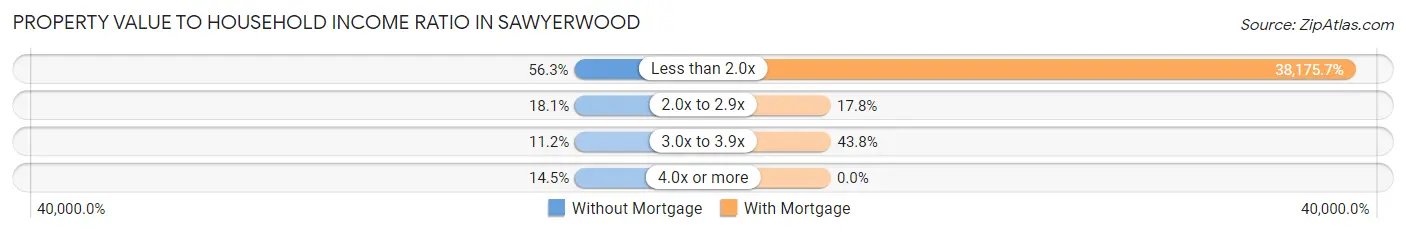
| Value-to-Income Ratio | Without Mortgage | With Mortgage |
| Less than 2.0x | 171 (56.2%) | 70,625 (38,175.7%) |
| 2.0x to 2.9x | 55 (18.1%) | 33 (17.8%) |
| 3.0x to 3.9x | 34 (11.2%) | 81 (43.8%) |
| 4.0x or more | 44 (14.5%) | 0 (0.0%) |
| Total | 304 (100.0%) | 185 (100.0%) |
Real Estate Taxes by Mortgage Status in Sawyerwood
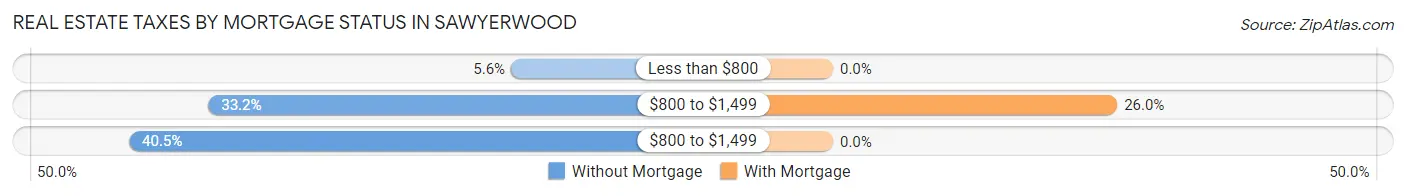
| Property Taxes | Without Mortgage | With Mortgage |
| Less than $800 | 17 (5.6%) | 0 (0.0%) |
| $800 to $1,499 | 101 (33.2%) | 48 (26.0%) |
| $800 to $1,499 | 123 (40.5%) | 0 (0.0%) |
| Total | 304 (100.0%) | 185 (100.0%) |
Health & Disability in Sawyerwood
Health Insurance Coverage by Age in Sawyerwood
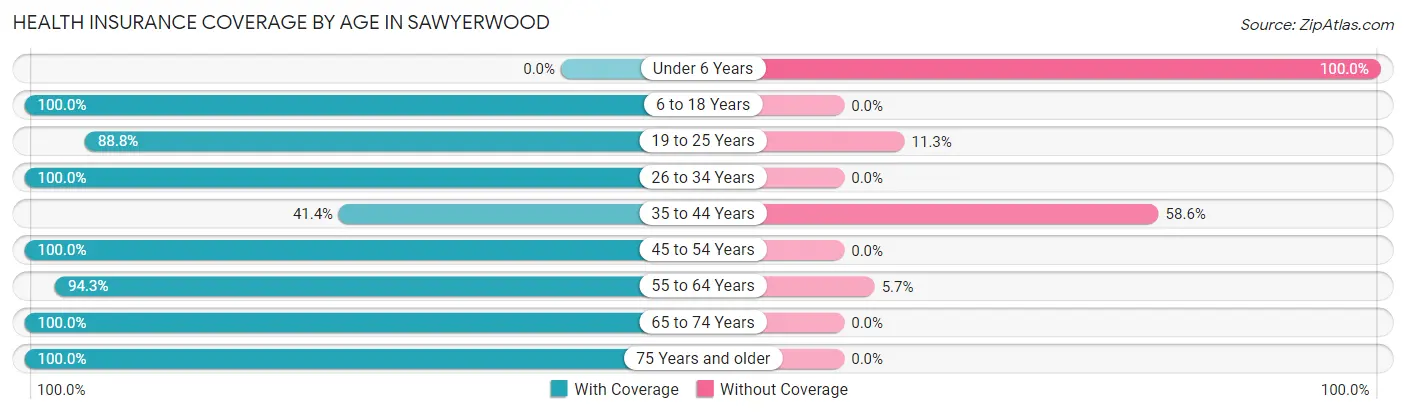
| Age Bracket | With Coverage | Without Coverage |
| Under 6 Years | 0 (0.0%) | 13 (100.0%) |
| 6 to 18 Years | 180 (100.0%) | 0 (0.0%) |
| 19 to 25 Years | 71 (88.7%) | 9 (11.3%) |
| 26 to 34 Years | 46 (100.0%) | 0 (0.0%) |
| 35 to 44 Years | 96 (41.4%) | 136 (58.6%) |
| 45 to 54 Years | 269 (100.0%) | 0 (0.0%) |
| 55 to 64 Years | 249 (94.3%) | 15 (5.7%) |
| 65 to 74 Years | 184 (100.0%) | 0 (0.0%) |
| 75 Years and older | 113 (100.0%) | 0 (0.0%) |
| Total | 1,208 (87.5%) | 173 (12.5%) |
Health Insurance Coverage by Citizenship Status in Sawyerwood
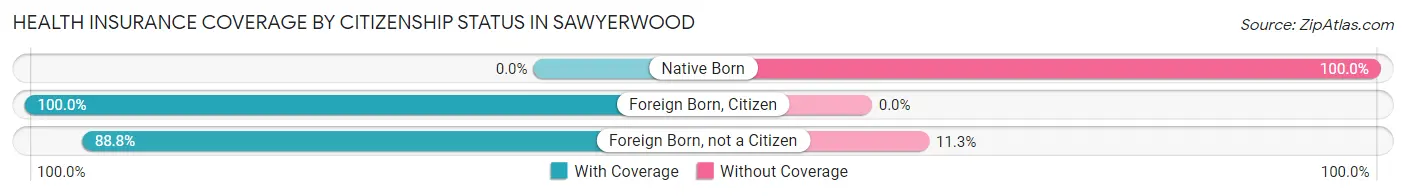
| Citizenship Status | With Coverage | Without Coverage |
| Native Born | 0 (0.0%) | 13 (100.0%) |
| Foreign Born, Citizen | 180 (100.0%) | 0 (0.0%) |
| Foreign Born, not a Citizen | 71 (88.7%) | 9 (11.3%) |
Health Insurance Coverage by Household Income in Sawyerwood
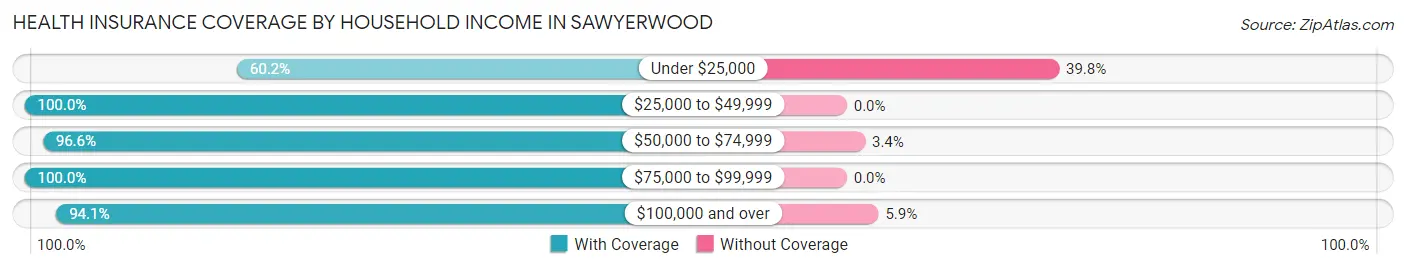
| Household Income | With Coverage | Without Coverage |
| Under $25,000 | 206 (60.2%) | 136 (39.8%) |
| $25,000 to $49,999 | 145 (100.0%) | 0 (0.0%) |
| $50,000 to $74,999 | 423 (96.6%) | 15 (3.4%) |
| $75,000 to $99,999 | 85 (100.0%) | 0 (0.0%) |
| $100,000 and over | 349 (94.1%) | 22 (5.9%) |
Public vs Private Health Insurance Coverage by Age in Sawyerwood

| Age Bracket | Public Insurance | Private Insurance |
| Under 6 | 0 (0.0%) | 0 (0.0%) |
| 6 to 18 Years | 54 (30.0%) | 126 (70.0%) |
| 19 to 25 Years | 24 (30.0%) | 65 (81.2%) |
| 25 to 34 Years | 18 (39.1%) | 46 (100.0%) |
| 35 to 44 Years | 13 (5.6%) | 83 (35.8%) |
| 45 to 54 Years | 24 (8.9%) | 245 (91.1%) |
| 55 to 64 Years | 119 (45.1%) | 166 (62.9%) |
| 65 to 74 Years | 184 (100.0%) | 110 (59.8%) |
| 75 Years and over | 113 (100.0%) | 95 (84.1%) |
| Total | 549 (39.8%) | 936 (67.8%) |
Disability Status by Sex by Age in Sawyerwood
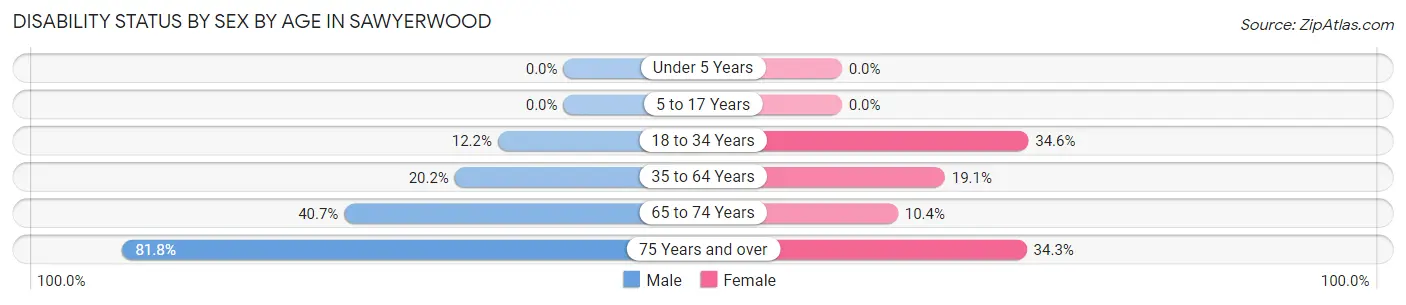
| Age Bracket | Male | Female |
| Under 5 Years | 0 (0.0%) | 0 (0.0%) |
| 5 to 17 Years | 0 (0.0%) | 0 (0.0%) |
| 18 to 34 Years | 9 (12.2%) | 18 (34.6%) |
| 35 to 64 Years | 72 (20.2%) | 78 (19.1%) |
| 65 to 74 Years | 24 (40.7%) | 13 (10.4%) |
| 75 Years and over | 9 (81.8%) | 35 (34.3%) |
Disability Class by Sex by Age in Sawyerwood
Disability Class: Hearing Difficulty
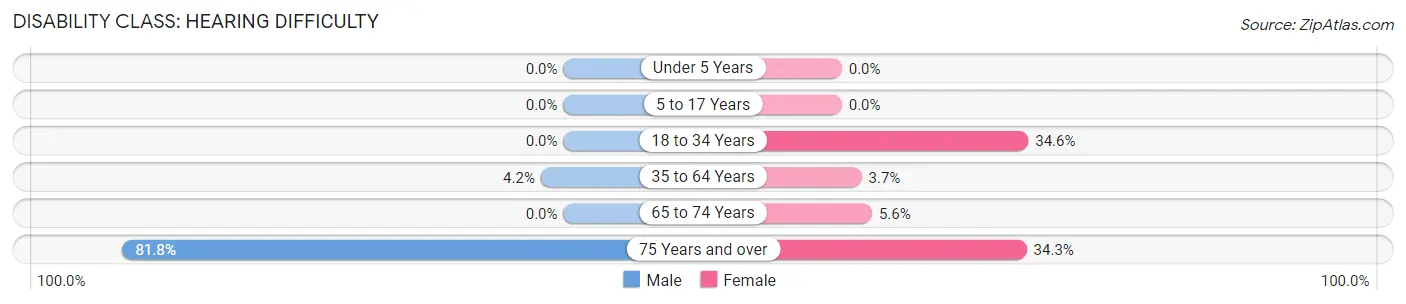
| Age Bracket | Male | Female |
| Under 5 Years | 0 (0.0%) | 0 (0.0%) |
| 5 to 17 Years | 0 (0.0%) | 0 (0.0%) |
| 18 to 34 Years | 0 (0.0%) | 18 (34.6%) |
| 35 to 64 Years | 15 (4.2%) | 15 (3.7%) |
| 65 to 74 Years | 0 (0.0%) | 7 (5.6%) |
| 75 Years and over | 9 (81.8%) | 35 (34.3%) |
Disability Class: Vision Difficulty
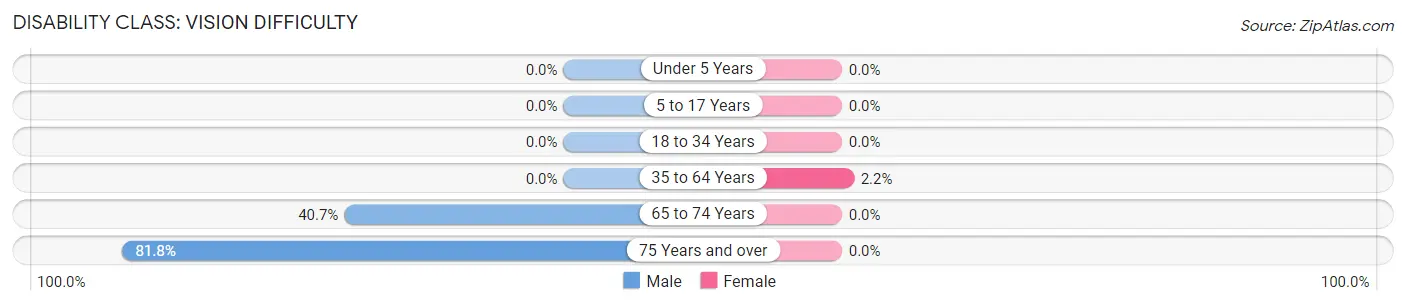
| Age Bracket | Male | Female |
| Under 5 Years | 0 (0.0%) | 0 (0.0%) |
| 5 to 17 Years | 0 (0.0%) | 0 (0.0%) |
| 18 to 34 Years | 0 (0.0%) | 0 (0.0%) |
| 35 to 64 Years | 0 (0.0%) | 9 (2.2%) |
| 65 to 74 Years | 24 (40.7%) | 0 (0.0%) |
| 75 Years and over | 9 (81.8%) | 0 (0.0%) |
Disability Class: Cognitive Difficulty
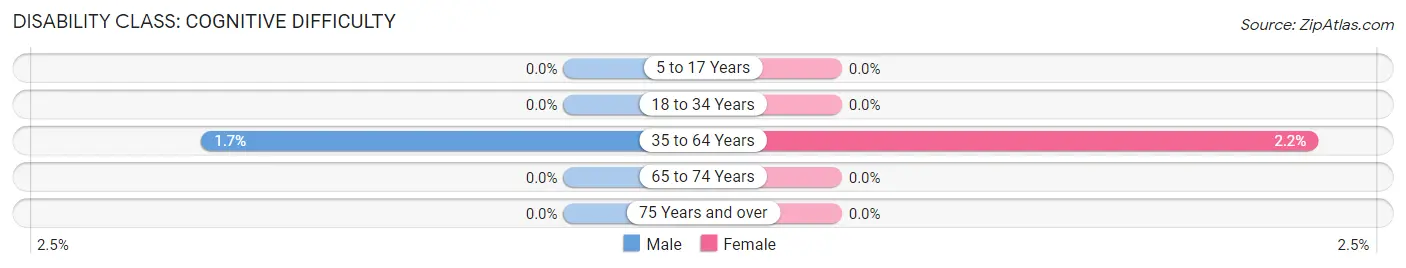
| Age Bracket | Male | Female |
| 5 to 17 Years | 0 (0.0%) | 0 (0.0%) |
| 18 to 34 Years | 0 (0.0%) | 0 (0.0%) |
| 35 to 64 Years | 6 (1.7%) | 9 (2.2%) |
| 65 to 74 Years | 0 (0.0%) | 0 (0.0%) |
| 75 Years and over | 0 (0.0%) | 0 (0.0%) |
Disability Class: Ambulatory Difficulty
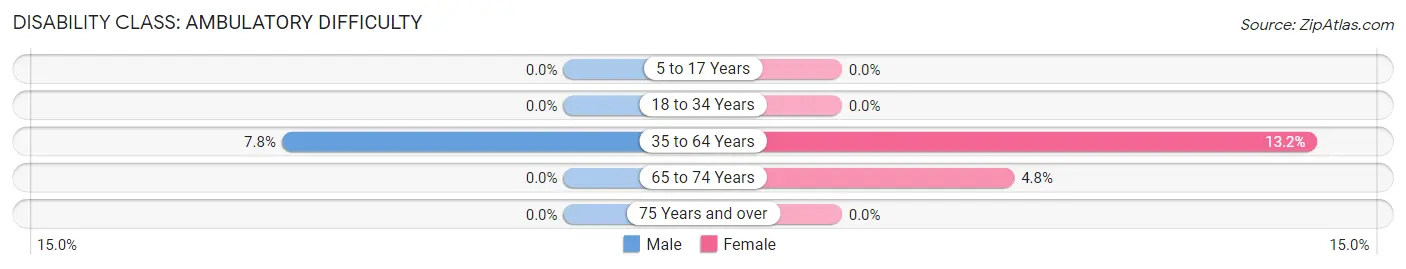
| Age Bracket | Male | Female |
| 5 to 17 Years | 0 (0.0%) | 0 (0.0%) |
| 18 to 34 Years | 0 (0.0%) | 0 (0.0%) |
| 35 to 64 Years | 28 (7.8%) | 54 (13.2%) |
| 65 to 74 Years | 0 (0.0%) | 6 (4.8%) |
| 75 Years and over | 0 (0.0%) | 0 (0.0%) |
Disability Class: Self-Care Difficulty
| Age Bracket | Male | Female |
| 5 to 17 Years | 0 (0.0%) | 0 (0.0%) |
| 18 to 34 Years | 0 (0.0%) | 0 (0.0%) |
| 35 to 64 Years | 0 (0.0%) | 0 (0.0%) |
| 65 to 74 Years | 0 (0.0%) | 0 (0.0%) |
| 75 Years and over | 0 (0.0%) | 0 (0.0%) |
Technology Access in Sawyerwood
Computing Device Access in Sawyerwood
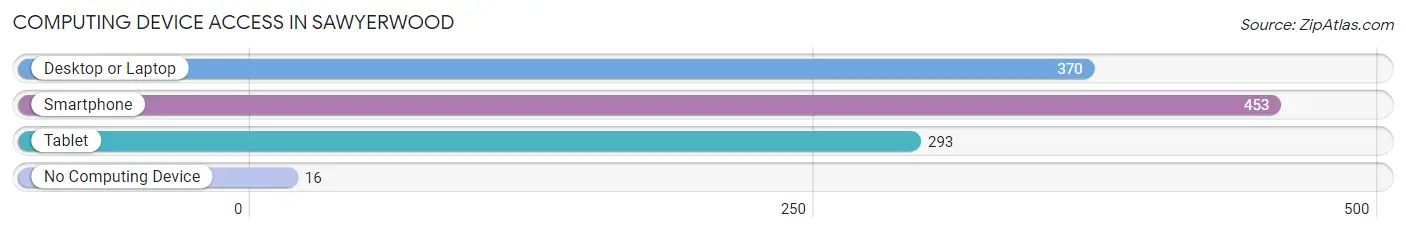
| Device Type | # Households | % Households |
| Desktop or Laptop | 370 | 69.0% |
| Smartphone | 453 | 84.5% |
| Tablet | 293 | 54.7% |
| No Computing Device | 16 | 3.0% |
| Total | 536 | 100.0% |
Internet Access in Sawyerwood
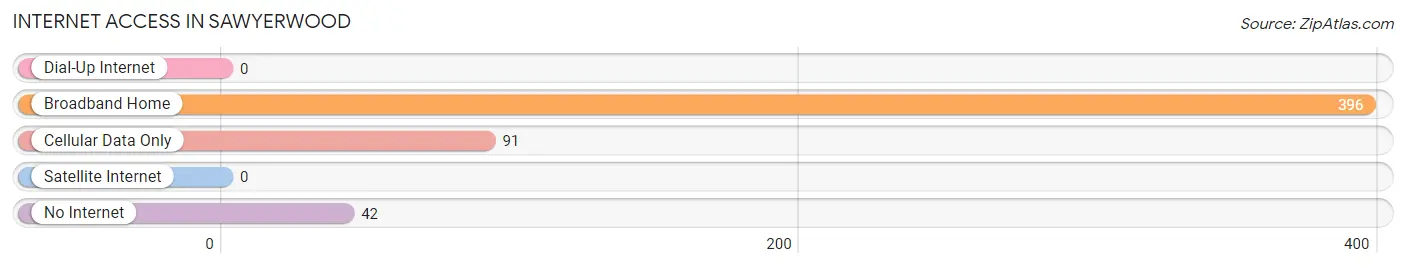
| Internet Type | # Households | % Households |
| Dial-Up Internet | 0 | 0.0% |
| Broadband Home | 396 | 73.9% |
| Cellular Data Only | 91 | 17.0% |
| Satellite Internet | 0 | 0.0% |
| No Internet | 42 | 7.8% |
| Total | 536 | 100.0% |
Sawyerwood Summary
Sawyerwood is a small village located in the state of Ohio, in the United States. It is situated in the county of Hamilton, and is part of the Cincinnati metropolitan area. The village has a population of approximately 1,000 people, and is located about 20 miles north of Cincinnati.
History
Sawyerwood was founded in 1817 by a group of settlers from Pennsylvania. The village was named after the first settler, John Sawyer, who had purchased the land from the government. The village was originally a farming community, and the settlers grew corn, wheat, and other crops. As the years passed, the village grew and more people moved to the area. By the late 1800s, the village had become a small town, with a population of around 500 people.
In the early 1900s, the village began to experience a period of growth and development. The population increased, and new businesses began to open in the area. The village also became a popular tourist destination, as it was located near the Ohio River. In the 1950s, the village was incorporated as a village, and the population continued to grow.
Geography
Sawyerwood is located in the southwestern part of Hamilton County, Ohio. It is situated on the banks of the Ohio River, and is about 20 miles north of Cincinnati. The village is surrounded by rolling hills and farmland, and is located in a rural area. The village is also located near the Great Miami River, which is a popular destination for fishing and boating.
The climate in Sawyerwood is typical of the Midwest, with hot summers and cold winters. The average temperature in the summer is around 80 degrees Fahrenheit, and the average temperature in the winter is around 30 degrees Fahrenheit. The village receives an average of 40 inches of precipitation each year.
Economy
The economy of Sawyerwood is largely based on agriculture and tourism. The village is home to several farms, which produce corn, wheat, and other crops. The village also has several small businesses, including restaurants, shops, and other services. Tourism is also an important part of the economy, as the village is located near the Ohio River and is a popular destination for fishing and boating.
Demographics
As of the 2010 census, the population of Sawyerwood was 1,000 people. The racial makeup of the village was 97.2% White, 0.7% African American, 0.3% Native American, 0.3% Asian, and 1.5% from other races. The median household income was $45,000, and the median age was 40 years. The village is home to a variety of religious denominations, including Catholic, Protestant, and Jewish.
Common Questions
What is Per Capita Income in Sawyerwood?
Per Capita income in Sawyerwood is $20,660.
What is the Median Family Income in Sawyerwood?
Median Family Income in Sawyerwood is $56,696.
What is the Median Household income in Sawyerwood?
Median Household Income in Sawyerwood is $50,625.
What is Inequality or Gini Index in Sawyerwood?
Inequality or Gini Index in Sawyerwood is 0.38.
What is the Total Population of Sawyerwood?
Total Population of Sawyerwood is 1,381.
What is the Total Male Population of Sawyerwood?
Total Male Population of Sawyerwood is 604.
What is the Total Female Population of Sawyerwood?
Total Female Population of Sawyerwood is 777.
What is the Ratio of Males per 100 Females in Sawyerwood?
There are 77.73 Males per 100 Females in Sawyerwood.
What is the Ratio of Females per 100 Males in Sawyerwood?
There are 128.64 Females per 100 Males in Sawyerwood.
What is the Median Population Age in Sawyerwood?
Median Population Age in Sawyerwood is 54.2 Years.
What is the Average Family Size in Sawyerwood
Average Family Size in Sawyerwood is 3.3 People.
What is the Average Household Size in Sawyerwood
Average Household Size in Sawyerwood is 2.6 People.
How Large is the Labor Force in Sawyerwood?
There are 571 People in the Labor Forcein in Sawyerwood.
What is the Percentage of People in the Labor Force in Sawyerwood?
45.7% of People are in the Labor Force in Sawyerwood.
What is the Unemployment Rate in Sawyerwood?
Unemployment Rate in Sawyerwood is 23.3%.