Clifton, OH Map & Demographics
Clifton Map
Clifton Overview
$43,689
PER CAPITA INCOME
$93,125
AVG FAMILY INCOME
$75,750
AVG HOUSEHOLD INCOME
63.7%
WAGE / INCOME GAP [ % ]
36.3¢/ $1
WAGE / INCOME GAP [ $ ]
0.27
INEQUALITY / GINI INDEX
141
TOTAL POPULATION
91
MALE POPULATION
50
FEMALE POPULATION
182.00
MALES / 100 FEMALES
54.95
FEMALES / 100 MALES
44.2
MEDIAN AGE
3.1
AVG FAMILY SIZE
2.4
AVG HOUSEHOLD SIZE
104
LABOR FORCE [ PEOPLE ]
80.6%
PERCENT IN LABOR FORCE
1.0%
UNEMPLOYMENT RATE
Clifton Zip Codes
Clifton Area Codes
Income in Clifton
Income Overview in Clifton
Per Capita Income in Clifton is $43,689, while median incomes of families and households are $93,125 and $75,750 respectively.
| Characteristic | Number | Measure |
| Per Capita Income | 141 | $43,689 |
| Median Family Income | 35 | $93,125 |
| Mean Family Income | 35 | $95,237 |
| Median Household Income | 58 | $75,750 |
| Mean Household Income | 58 | $88,952 |
| Income Deficit | 35 | $0 |
| Wage / Income Gap (%) | 141 | 63.72% |
| Wage / Income Gap ($) | 141 | 36.28¢ per $1 |
| Gini / Inequality Index | 141 | 0.27 |
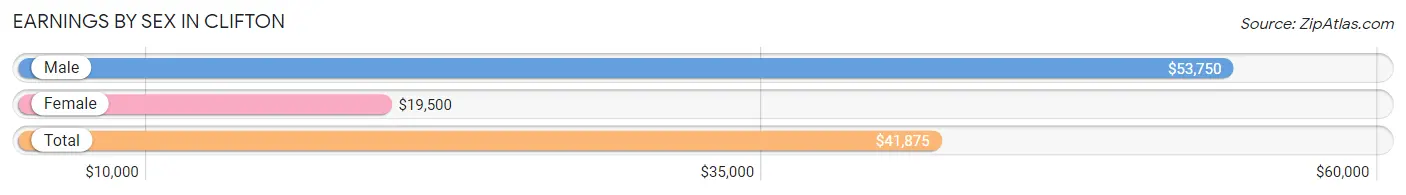
Earnings by Sex in Clifton
Average Earnings in Clifton are $41,875, $53,750 for men and $19,500 for women, a difference of 63.7%.
| Sex | Number | Average Earnings |
| Male | 76 (71.7%) | $53,750 |
| Female | 30 (28.3%) | $19,500 |
| Total | 106 (100.0%) | $41,875 |
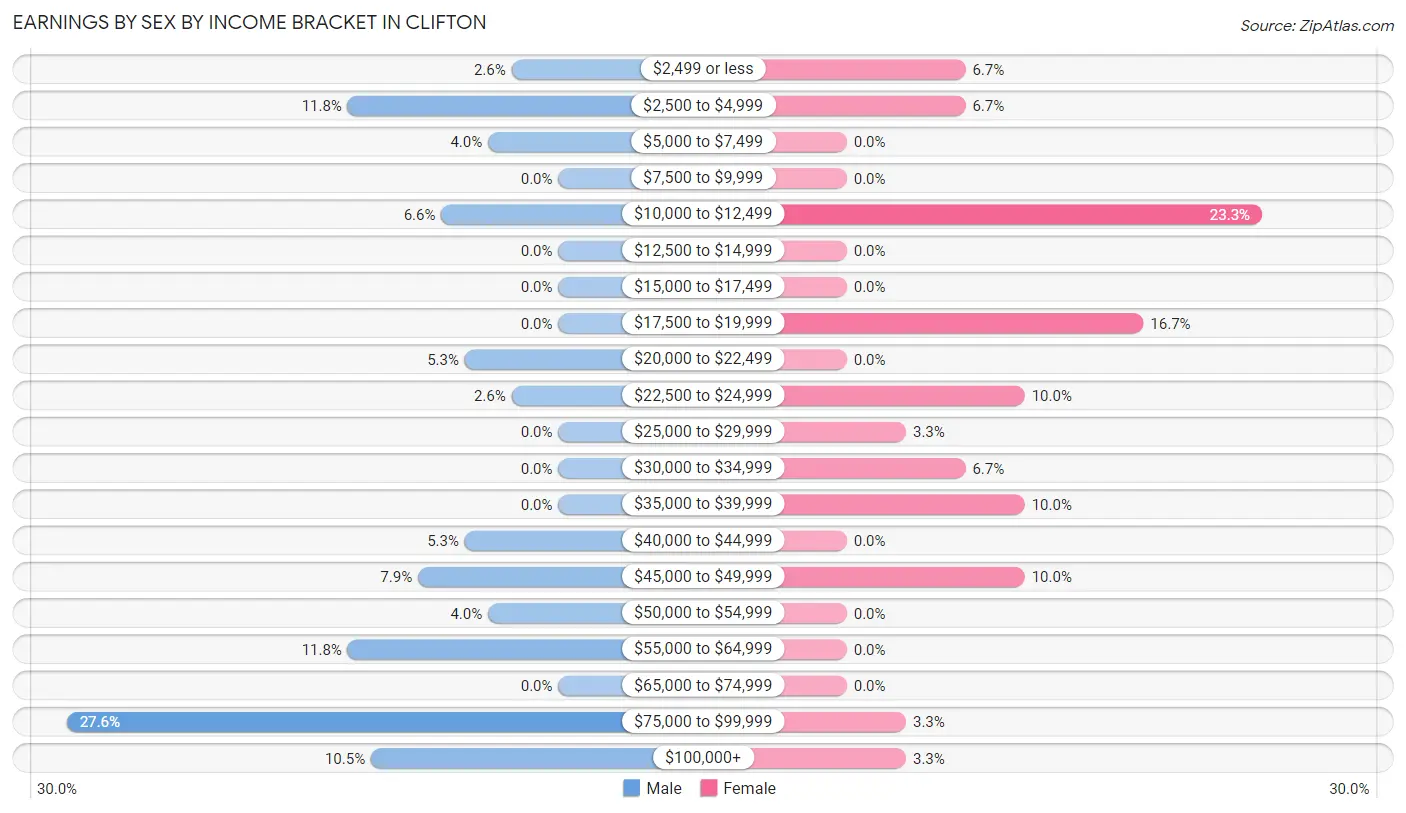
Earnings by Sex by Income Bracket in Clifton
The most common earnings brackets in Clifton are $75,000 to $99,999 for men (21 | 27.6%) and $10,000 to $12,499 for women (7 | 23.3%).
| Income | Male | Female |
| $2,499 or less | 2 (2.6%) | 2 (6.7%) |
| $2,500 to $4,999 | 9 (11.8%) | 2 (6.7%) |
| $5,000 to $7,499 | 3 (4.0%) | 0 (0.0%) |
| $7,500 to $9,999 | 0 (0.0%) | 0 (0.0%) |
| $10,000 to $12,499 | 5 (6.6%) | 7 (23.3%) |
| $12,500 to $14,999 | 0 (0.0%) | 0 (0.0%) |
| $15,000 to $17,499 | 0 (0.0%) | 0 (0.0%) |
| $17,500 to $19,999 | 0 (0.0%) | 5 (16.7%) |
| $20,000 to $22,499 | 4 (5.3%) | 0 (0.0%) |
| $22,500 to $24,999 | 2 (2.6%) | 3 (10.0%) |
| $25,000 to $29,999 | 0 (0.0%) | 1 (3.3%) |
| $30,000 to $34,999 | 0 (0.0%) | 2 (6.7%) |
| $35,000 to $39,999 | 0 (0.0%) | 3 (10.0%) |
| $40,000 to $44,999 | 4 (5.3%) | 0 (0.0%) |
| $45,000 to $49,999 | 6 (7.9%) | 3 (10.0%) |
| $50,000 to $54,999 | 3 (4.0%) | 0 (0.0%) |
| $55,000 to $64,999 | 9 (11.8%) | 0 (0.0%) |
| $65,000 to $74,999 | 0 (0.0%) | 0 (0.0%) |
| $75,000 to $99,999 | 21 (27.6%) | 1 (3.3%) |
| $100,000+ | 8 (10.5%) | 1 (3.3%) |
| Total | 76 (100.0%) | 30 (100.0%) |
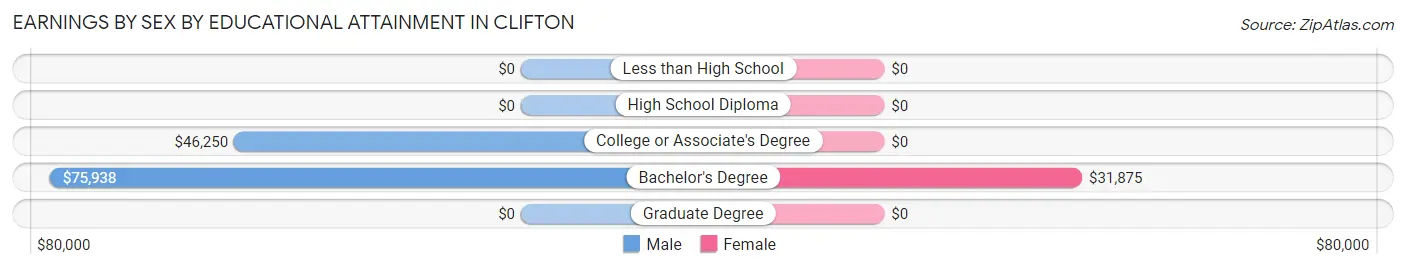
Earnings by Sex by Educational Attainment in Clifton
Average earnings in Clifton are $58,214 for men and $22,917 for women, a difference of 60.6%. Men with an educational attainment of bachelor's degree enjoy the highest average annual earnings of $75,938, while those with college or associate's degree education earn the least with $46,250. Women with an educational attainment of bachelor's degree earn the most with the average annual earnings of $31,875, while those with bachelor's degree education have the smallest earnings of $31,875.
| Educational Attainment | Male Income | Female Income |
| Less than High School | - | - |
| High School Diploma | - | - |
| College or Associate's Degree | $46,250 | $0 |
| Bachelor's Degree | $75,938 | $31,875 |
| Graduate Degree | - | - |
| Total | $58,214 | $22,917 |
Family Income in Clifton
Family Income Brackets in Clifton
According to the Clifton family income data, there are 9 families falling into the $35,000 to $49,999 income range, which is the most common income bracket and makes up 25.7% of all families.
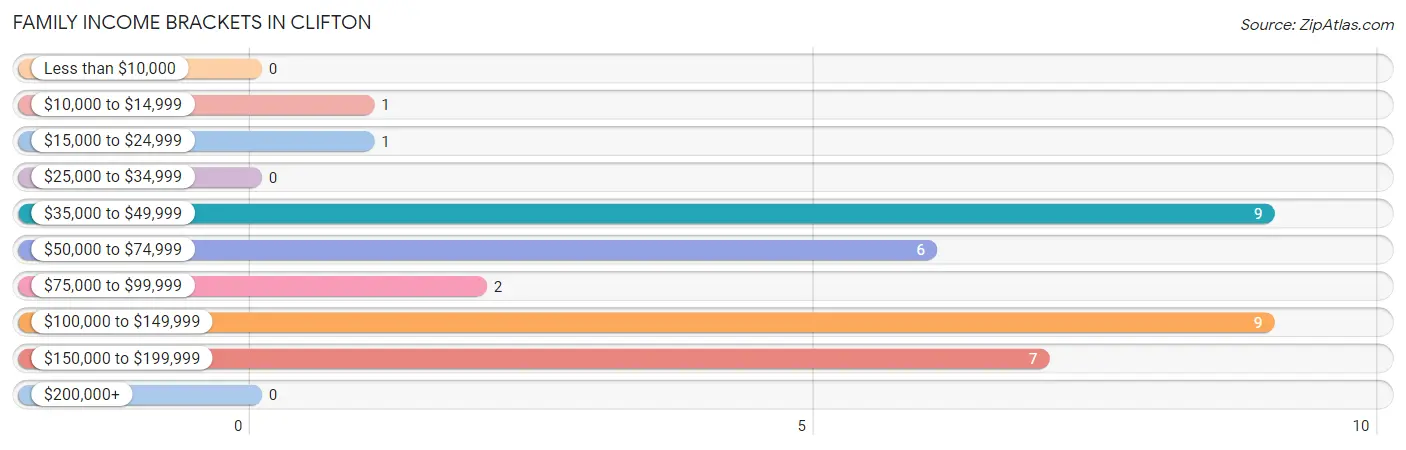
| Income Bracket | # Families | % Families |
| Less than $10,000 | 0 | 0.0% |
| $10,000 to $14,999 | 1 | 2.9% |
| $15,000 to $24,999 | 1 | 2.9% |
| $25,000 to $34,999 | 0 | 0.0% |
| $35,000 to $49,999 | 9 | 25.7% |
| $50,000 to $74,999 | 6 | 17.1% |
| $75,000 to $99,999 | 2 | 5.7% |
| $100,000 to $149,999 | 9 | 25.7% |
| $150,000 to $199,999 | 7 | 20.0% |
| $200,000+ | 0 | 0.0% |
Family Income by Famaliy Size in Clifton
2-person families (26 | 74.3%) account for the highest median family income in Clifton with $70,833 per family, while 2-person families (26 | 74.3%) have the highest median income of $35,416 per family member.
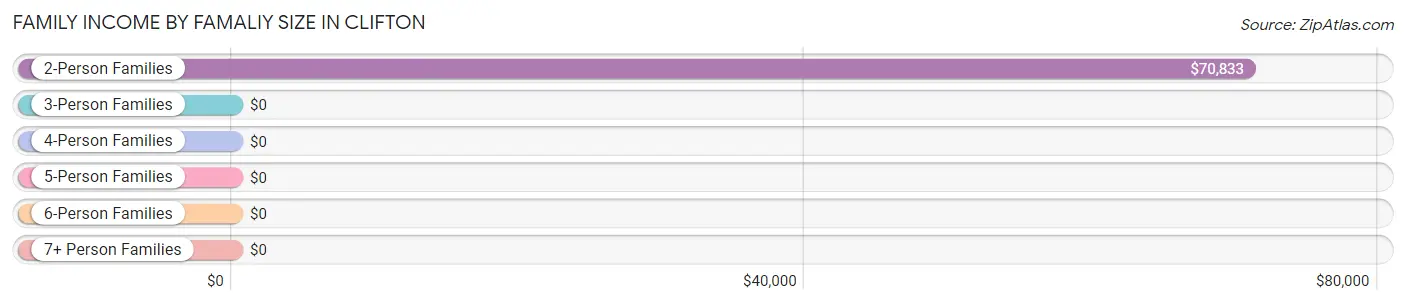
| Income Bracket | # Families | Median Income |
| 2-Person Families | 26 (74.3%) | $70,833 |
| 3-Person Families | 2 (5.7%) | $0 |
| 4-Person Families | 4 (11.4%) | $0 |
| 5-Person Families | 3 (8.6%) | $0 |
| 6-Person Families | 0 (0.0%) | $0 |
| 7+ Person Families | 0 (0.0%) | $0 |
| Total | 35 (100.0%) | $93,125 |
Family Income by Number of Earners in Clifton
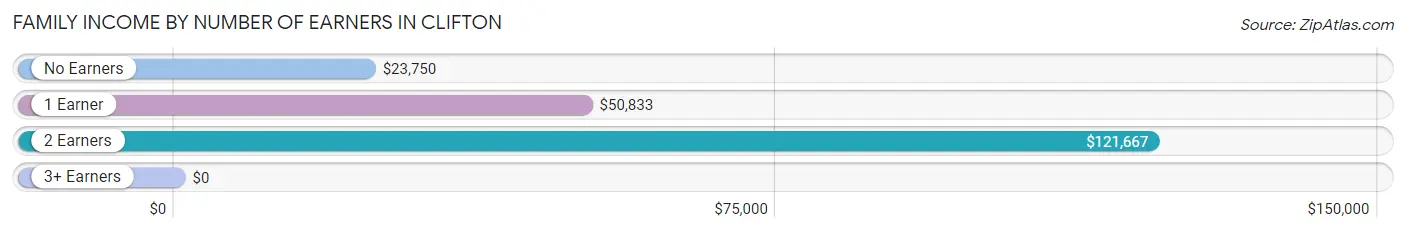
| Number of Earners | # Families | Median Income |
| No Earners | 3 (8.6%) | $23,750 |
| 1 Earner | 14 (40.0%) | $50,833 |
| 2 Earners | 14 (40.0%) | $121,667 |
| 3+ Earners | 4 (11.4%) | $0 |
| Total | 35 (100.0%) | $93,125 |
Household Income in Clifton
Household Income Brackets in Clifton
With 15 households falling in the category, the $50,000 to $74,999 income range is the most frequent in Clifton, accounting for 25.9% of all households.
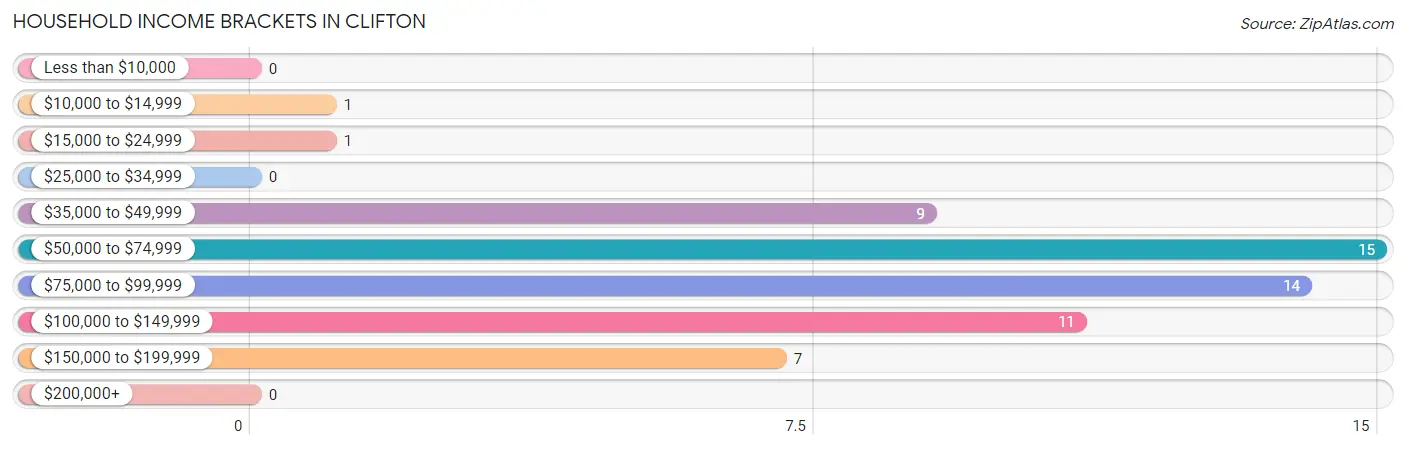
| Income Bracket | # Households | % Households |
| Less than $10,000 | 0 | 0.0% |
| $10,000 to $14,999 | 1 | 1.7% |
| $15,000 to $24,999 | 1 | 1.7% |
| $25,000 to $34,999 | 0 | 0.0% |
| $35,000 to $49,999 | 9 | 15.5% |
| $50,000 to $74,999 | 15 | 25.9% |
| $75,000 to $99,999 | 14 | 24.1% |
| $100,000 to $149,999 | 11 | 19.0% |
| $150,000 to $199,999 | 7 | 12.1% |
| $200,000+ | 0 | 0.0% |
Household Income by Householder Age in Clifton
The median household income in Clifton is $75,750, with the highest median household income of $122,083 found in the 45 to 64 years age bracket for the primary householder. A total of 21 households (36.2%) fall into this category.
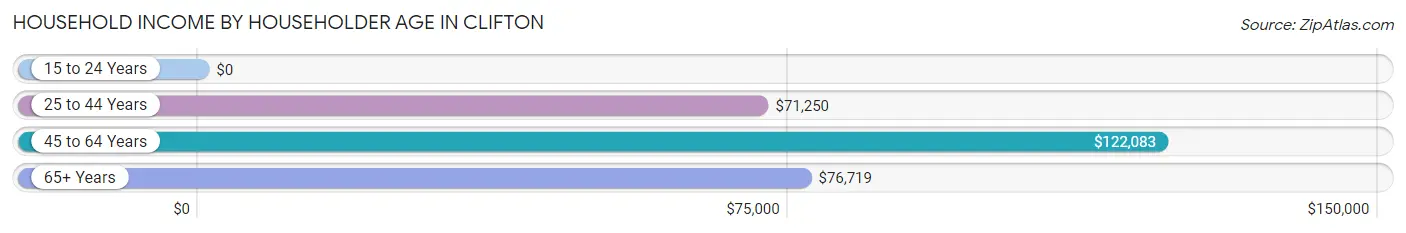
| Income Bracket | # Households | Median Income |
| 15 to 24 Years | 0 (0.0%) | $0 |
| 25 to 44 Years | 20 (34.5%) | $71,250 |
| 45 to 64 Years | 21 (36.2%) | $122,083 |
| 65+ Years | 17 (29.3%) | $76,719 |
| Total | 58 (100.0%) | $75,750 |
Poverty in Clifton
Income Below Poverty by Sex and Age in Clifton
With 1.1% poverty level for males and 16.0% for females among the residents of Clifton, 15 year old males and 25 to 34 year old females are the most vulnerable to poverty, with 1 males (33.3%) and 7 females (53.8%) in their respective age groups living below the poverty level.
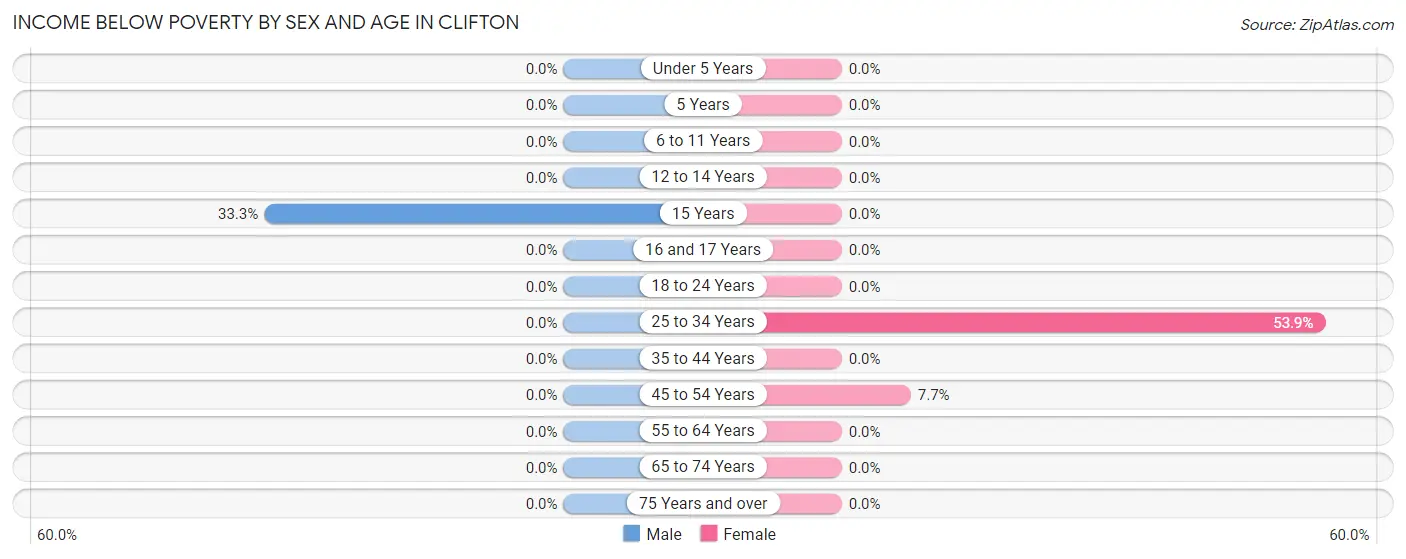
| Age Bracket | Male | Female |
| Under 5 Years | 0 (0.0%) | 0 (0.0%) |
| 5 Years | 0 (0.0%) | 0 (0.0%) |
| 6 to 11 Years | 0 (0.0%) | 0 (0.0%) |
| 12 to 14 Years | 0 (0.0%) | 0 (0.0%) |
| 15 Years | 1 (33.3%) | 0 (0.0%) |
| 16 and 17 Years | 0 (0.0%) | 0 (0.0%) |
| 18 to 24 Years | 0 (0.0%) | 0 (0.0%) |
| 25 to 34 Years | 0 (0.0%) | 7 (53.8%) |
| 35 to 44 Years | 0 (0.0%) | 0 (0.0%) |
| 45 to 54 Years | 0 (0.0%) | 1 (7.7%) |
| 55 to 64 Years | 0 (0.0%) | 0 (0.0%) |
| 65 to 74 Years | 0 (0.0%) | 0 (0.0%) |
| 75 Years and over | 0 (0.0%) | 0 (0.0%) |
| Total | 1 (1.1%) | 8 (16.0%) |
Income Above Poverty by Sex and Age in Clifton
According to the poverty statistics in Clifton, males aged 6 to 11 years and females aged 12 to 14 years are the age groups that are most secure financially, with 100.0% of males and 100.0% of females in these age groups living above the poverty line.
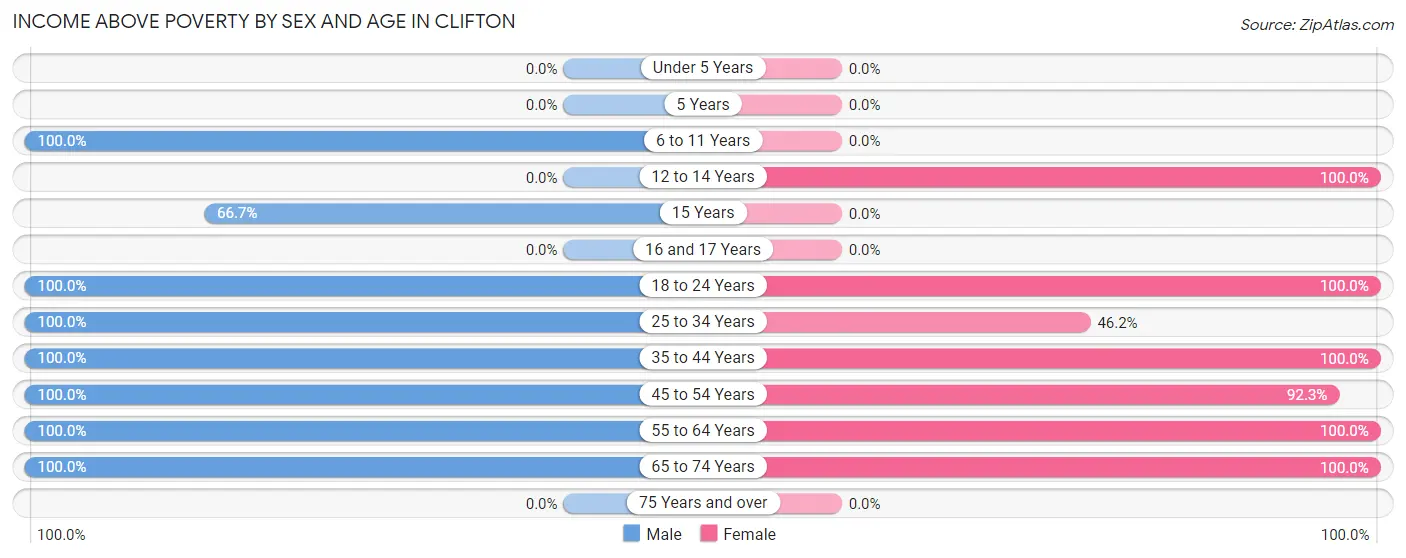
| Age Bracket | Male | Female |
| Under 5 Years | 0 (0.0%) | 0 (0.0%) |
| 5 Years | 0 (0.0%) | 0 (0.0%) |
| 6 to 11 Years | 5 (100.0%) | 0 (0.0%) |
| 12 to 14 Years | 0 (0.0%) | 4 (100.0%) |
| 15 Years | 2 (66.7%) | 0 (0.0%) |
| 16 and 17 Years | 0 (0.0%) | 0 (0.0%) |
| 18 to 24 Years | 8 (100.0%) | 3 (100.0%) |
| 25 to 34 Years | 15 (100.0%) | 6 (46.2%) |
| 35 to 44 Years | 19 (100.0%) | 3 (100.0%) |
| 45 to 54 Years | 4 (100.0%) | 12 (92.3%) |
| 55 to 64 Years | 22 (100.0%) | 7 (100.0%) |
| 65 to 74 Years | 15 (100.0%) | 7 (100.0%) |
| 75 Years and over | 0 (0.0%) | 0 (0.0%) |
| Total | 90 (98.9%) | 42 (84.0%) |
Income Below Poverty Among Married-Couple Families in Clifton
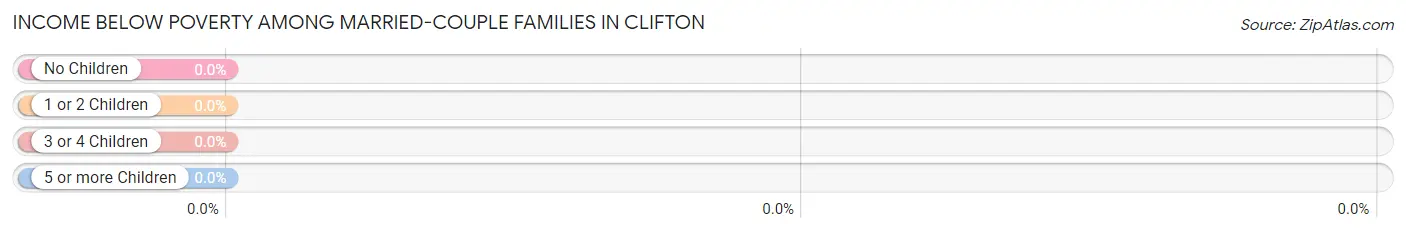
| Children | Above Poverty | Below Poverty |
| No Children | 24 (100.0%) | 0 (0.0%) |
| 1 or 2 Children | 5 (100.0%) | 0 (0.0%) |
| 3 or 4 Children | 0 (0.0%) | 0 (0.0%) |
| 5 or more Children | 0 (0.0%) | 0 (0.0%) |
| Total | 29 (100.0%) | 0 (0.0%) |
Income Below Poverty Among Single-Parent Households in Clifton
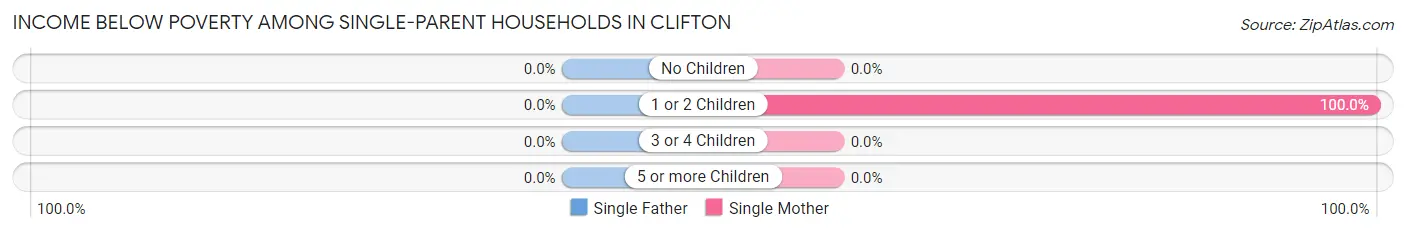
| Children | Single Father | Single Mother |
| No Children | 0 (0.0%) | 0 (0.0%) |
| 1 or 2 Children | 0 (0.0%) | 1 (100.0%) |
| 3 or 4 Children | 0 (0.0%) | 0 (0.0%) |
| 5 or more Children | 0 (0.0%) | 0 (0.0%) |
| Total | 0 (0.0%) | 1 (16.7%) |
Income Below Poverty Among Married-Couple vs Single-Parent Households in Clifton
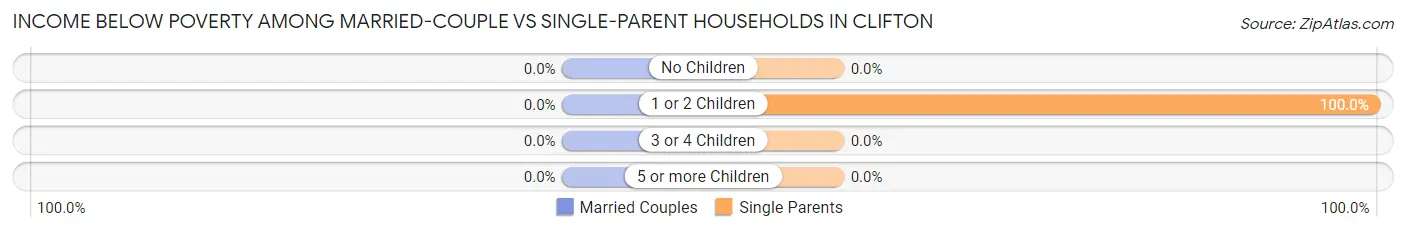
| Children | Married-Couple Families | Single-Parent Households |
| No Children | 0 (0.0%) | 0 (0.0%) |
| 1 or 2 Children | 0 (0.0%) | 1 (100.0%) |
| 3 or 4 Children | 0 (0.0%) | 0 (0.0%) |
| 5 or more Children | 0 (0.0%) | 0 (0.0%) |
| Total | 0 (0.0%) | 1 (16.7%) |
Race in Clifton
The most populous races in Clifton are White / Caucasian (127 | 90.1%), Hispanic or Latino (12 | 8.5%), and Two or more Races (10 | 7.1%).
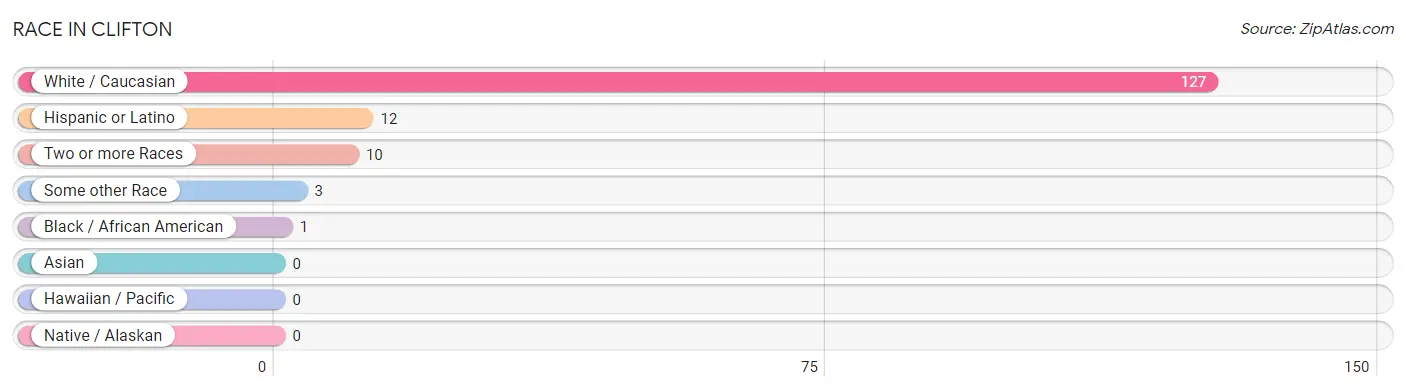
| Race | # Population | % Population |
| Asian | 0 | 0.0% |
| Black / African American | 1 | 0.7% |
| Hawaiian / Pacific | 0 | 0.0% |
| Hispanic or Latino | 12 | 8.5% |
| Native / Alaskan | 0 | 0.0% |
| White / Caucasian | 127 | 90.1% |
| Two or more Races | 10 | 7.1% |
| Some other Race | 3 | 2.1% |
| Total | 141 | 100.0% |
Ancestry in Clifton
The most populous ancestries reported in Clifton are German (58 | 41.1%), Irish (25 | 17.7%), English (20 | 14.2%), Mexican (12 | 8.5%), and Swiss (12 | 8.5%), together accounting for 90.1% of all Clifton residents.
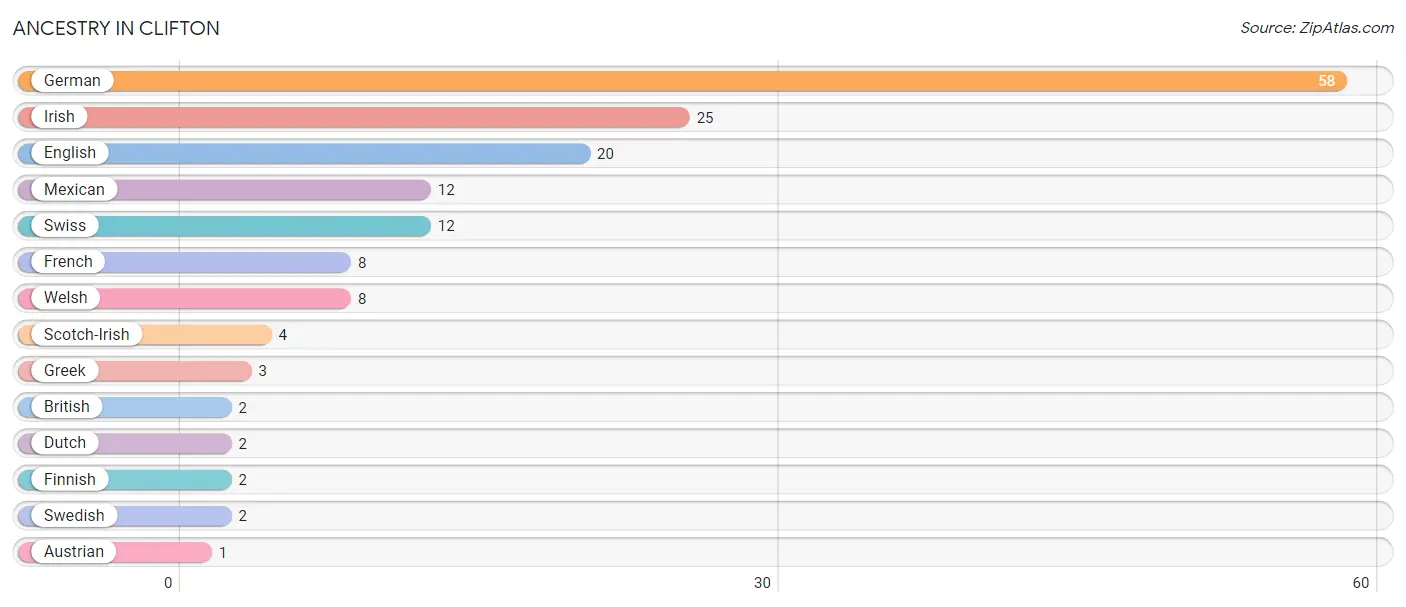
| Ancestry | # Population | % Population |
| Austrian | 1 | 0.7% |
| British | 2 | 1.4% |
| Dutch | 2 | 1.4% |
| English | 20 | 14.2% |
| Finnish | 2 | 1.4% |
| French | 8 | 5.7% |
| German | 58 | 41.1% |
| Greek | 3 | 2.1% |
| Irish | 25 | 17.7% |
| Mexican | 12 | 8.5% |
| Scotch-Irish | 4 | 2.8% |
| Swedish | 2 | 1.4% |
| Swiss | 12 | 8.5% |
| Welsh | 8 | 5.7% | View All 14 Rows |
Immigrants in Clifton
The most numerous immigrant groups reported in Clifton came from Central America (3 | 2.1%), Latin America (3 | 2.1%), and Mexico (3 | 2.1%), together accounting for 6.4% of all Clifton residents.
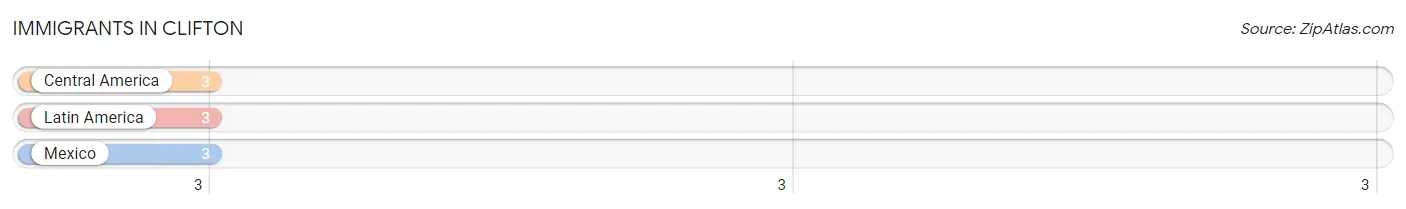
| Immigration Origin | # Population | % Population |
| Central America | 3 | 2.1% |
| Latin America | 3 | 2.1% |
| Mexico | 3 | 2.1% | View All 3 Rows |
Sex and Age in Clifton
Sex and Age in Clifton
The most populous age groups in Clifton are 60 to 64 Years (18 | 19.8%) for men and 25 to 29 Years (12 | 24.0%) for women.
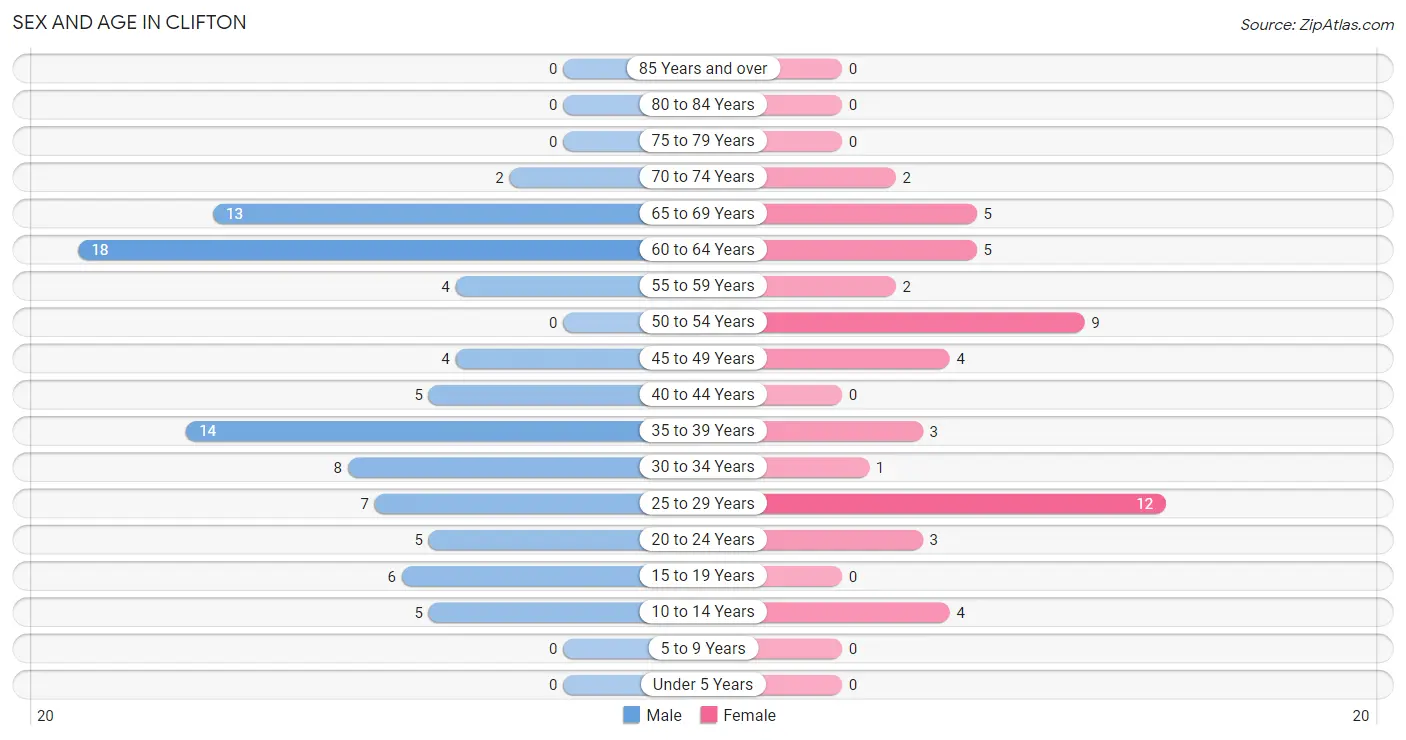
| Age Bracket | Male | Female |
| Under 5 Years | 0 (0.0%) | 0 (0.0%) |
| 5 to 9 Years | 0 (0.0%) | 0 (0.0%) |
| 10 to 14 Years | 5 (5.5%) | 4 (8.0%) |
| 15 to 19 Years | 6 (6.6%) | 0 (0.0%) |
| 20 to 24 Years | 5 (5.5%) | 3 (6.0%) |
| 25 to 29 Years | 7 (7.7%) | 12 (24.0%) |
| 30 to 34 Years | 8 (8.8%) | 1 (2.0%) |
| 35 to 39 Years | 14 (15.4%) | 3 (6.0%) |
| 40 to 44 Years | 5 (5.5%) | 0 (0.0%) |
| 45 to 49 Years | 4 (4.4%) | 4 (8.0%) |
| 50 to 54 Years | 0 (0.0%) | 9 (18.0%) |
| 55 to 59 Years | 4 (4.4%) | 2 (4.0%) |
| 60 to 64 Years | 18 (19.8%) | 5 (10.0%) |
| 65 to 69 Years | 13 (14.3%) | 5 (10.0%) |
| 70 to 74 Years | 2 (2.2%) | 2 (4.0%) |
| 75 to 79 Years | 0 (0.0%) | 0 (0.0%) |
| 80 to 84 Years | 0 (0.0%) | 0 (0.0%) |
| 85 Years and over | 0 (0.0%) | 0 (0.0%) |
| Total | 91 (100.0%) | 50 (100.0%) |
Families and Households in Clifton
Median Family Size in Clifton
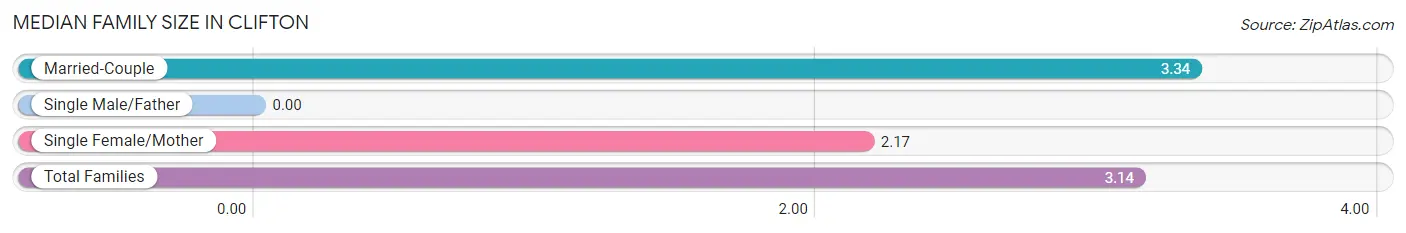
| Family Type | # Families | Family Size |
| Married-Couple | 29 (82.9%) | 3.34 |
| Single Male/Father | 0 (0.0%) | - |
| Single Female/Mother | 6 (17.1%) | 2.17 |
| Total Families | 35 (100.0%) | 3.14 |
Median Household Size in Clifton
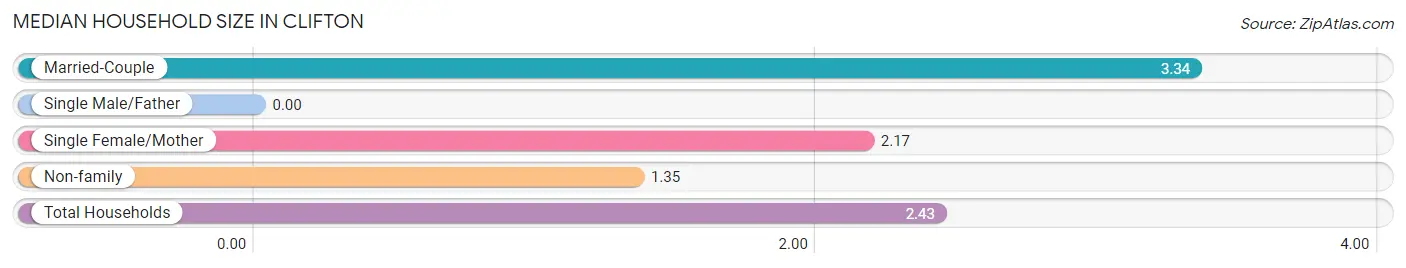
| Household Type | # Households | Household Size |
| Married-Couple | 29 (50.0%) | 3.34 |
| Single Male/Father | 0 (0.0%) | - |
| Single Female/Mother | 6 (10.3%) | 2.17 |
| Non-family | 23 (39.7%) | 1.35 |
| Total Households | 58 (100.0%) | 2.43 |
Household Size by Marriage Status in Clifton
Out of a total of 58 households in Clifton, 35 (60.3%) are family households, while 23 (39.7%) are nonfamily households. The most numerous type of family households are 2-person households, comprising 26, and the most common type of nonfamily households are 1-person households, comprising 14.
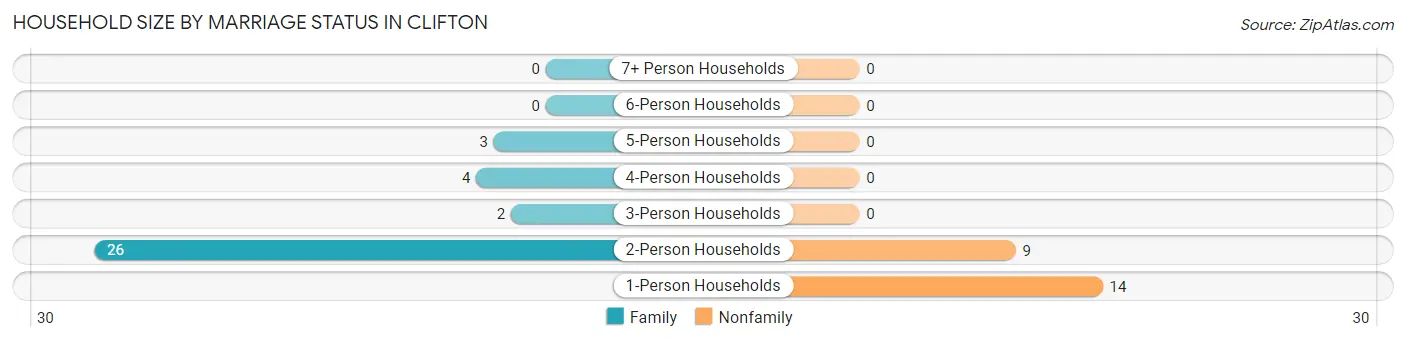
| Household Size | Family Households | Nonfamily Households |
| 1-Person Households | - | 14 (24.1%) |
| 2-Person Households | 26 (44.8%) | 9 (15.5%) |
| 3-Person Households | 2 (3.5%) | 0 (0.0%) |
| 4-Person Households | 4 (6.9%) | 0 (0.0%) |
| 5-Person Households | 3 (5.2%) | 0 (0.0%) |
| 6-Person Households | 0 (0.0%) | 0 (0.0%) |
| 7+ Person Households | 0 (0.0%) | 0 (0.0%) |
| Total | 35 (60.3%) | 23 (39.7%) |
Female Fertility in Clifton
Fertility by Age in Clifton
| Age Bracket | Women with Births | Births / 1,000 Women |
| 15 to 19 years | 0 (0.0%) | 0.0 |
| 20 to 34 years | 0 (0.0%) | 0.0 |
| 35 to 50 years | 0 (0.0%) | 0.0 |
| Total | 0 (0.0%) | 0.0 |
Fertility by Age by Marriage Status in Clifton
| Age Bracket | Married | Unmarried |
| 15 to 19 years | 0 (0.0%) | 0 (0.0%) |
| 20 to 34 years | 0 (0.0%) | 0 (0.0%) |
| 35 to 50 years | 0 (0.0%) | 0 (0.0%) |
| Total | 0 (0.0%) | 0 (0.0%) |
Fertility by Education in Clifton
| Educational Attainment | Women with Births | Births / 1,000 Women |
| Less than High School | 0 (0.0%) | 0.0 |
| High School Diploma | 0 (0.0%) | 0.0 |
| College or Associate's Degree | 0 (0.0%) | 0.0 |
| Bachelor's Degree | 0 (0.0%) | 0.0 |
| Graduate Degree | 0 (0.0%) | 0.0 |
| Total | 0 (0.0%) | 0.0 |
Fertility by Education by Marriage Status in Clifton
| Educational Attainment | Married | Unmarried |
| Less than High School | 0 (0.0%) | 0 (0.0%) |
| High School Diploma | 0 (0.0%) | 0 (0.0%) |
| College or Associate's Degree | 0 (0.0%) | 0 (0.0%) |
| Bachelor's Degree | 0 (0.0%) | 0 (0.0%) |
| Graduate Degree | 0 (0.0%) | 0 (0.0%) |
| Total | 0 (0.0%) | 0 (0.0%) |
Employment Characteristics in Clifton
Employment by Class of Employer in Clifton
Among the 99 employed individuals in Clifton, private company employees (61 | 61.6%), not-for-profit organizations (15 | 15.1%), and self-employed (not incorporated) (13 | 13.1%) make up the most common classes of employment.
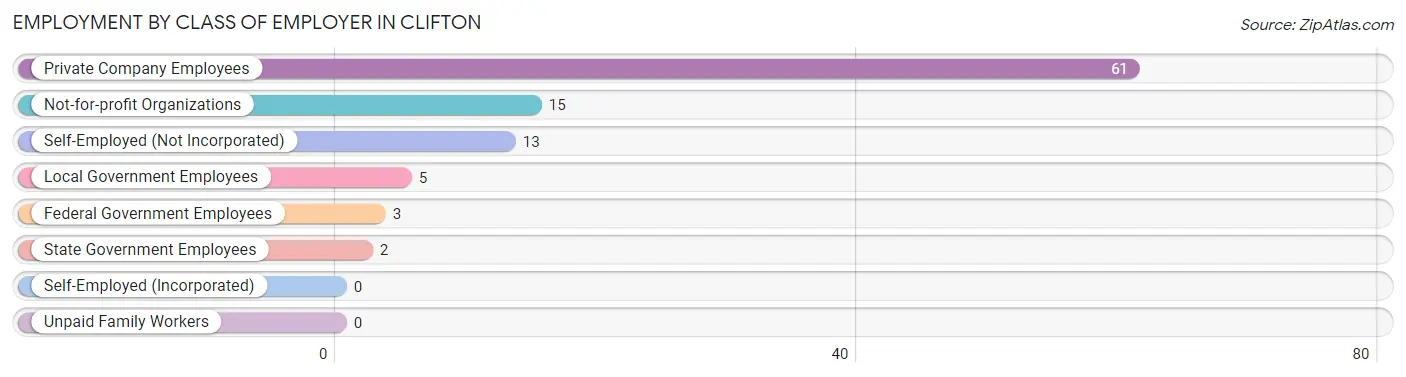
| Employer Class | # Employees | % Employees |
| Private Company Employees | 61 | 61.6% |
| Self-Employed (Incorporated) | 0 | 0.0% |
| Self-Employed (Not Incorporated) | 13 | 13.1% |
| Not-for-profit Organizations | 15 | 15.1% |
| Local Government Employees | 5 | 5.1% |
| State Government Employees | 2 | 2.0% |
| Federal Government Employees | 3 | 3.0% |
| Unpaid Family Workers | 0 | 0.0% |
| Total | 99 | 100.0% |
Employment Status by Age in Clifton
According to the labor force statistics for Clifton, out of the total population over 16 years of age (129), 80.6% or 104 individuals are in the labor force, with 1.0% or 1 of them unemployed. The age group with the highest labor force participation rate is 16 to 19 years, with 100.0% or 3 individuals in the labor force. Within the labor force, the 45 to 54 years age range has the highest percentage of unemployed individuals, with 7.1% or 1 of them being unemployed.
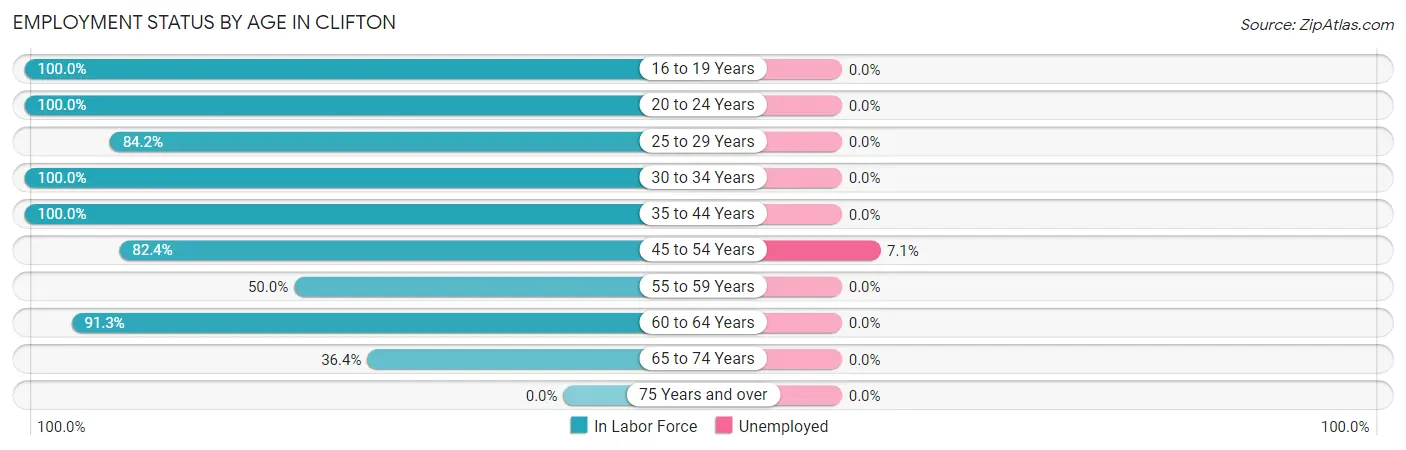
| Age Bracket | In Labor Force | Unemployed |
| 16 to 19 Years | 3 (100.0%) | 0 (0.0%) |
| 20 to 24 Years | 8 (100.0%) | 0 (0.0%) |
| 25 to 29 Years | 16 (84.2%) | 0 (0.0%) |
| 30 to 34 Years | 9 (100.0%) | 0 (0.0%) |
| 35 to 44 Years | 22 (100.0%) | 0 (0.0%) |
| 45 to 54 Years | 14 (82.4%) | 1 (7.1%) |
| 55 to 59 Years | 3 (50.0%) | 0 (0.0%) |
| 60 to 64 Years | 21 (91.3%) | 0 (0.0%) |
| 65 to 74 Years | 8 (36.4%) | 0 (0.0%) |
| 75 Years and over | 0 (0.0%) | 0 (0.0%) |
| Total | 104 (80.6%) | 1 (1.0%) |
Employment Status by Educational Attainment in Clifton
According to labor force statistics for Clifton, 88.5% of individuals (85) out of the total population between 25 and 64 years of age (96) are in the labor force, with 1.2% or 1 of them being unemployed. The group with the highest labor force participation rate are those with the educational attainment of less than high school, with 100.0% or 3 individuals in the labor force. Within the labor force, individuals with less than high school education have the highest percentage of unemployment, with 33.3% or 1 of them being unemployed.
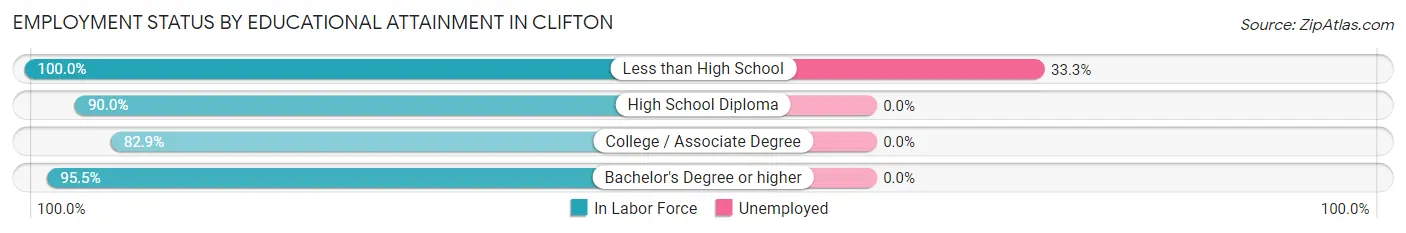
| Educational Attainment | In Labor Force | Unemployed |
| Less than High School | 3 (100.0%) | 1 (33.3%) |
| High School Diploma | 27 (90.0%) | 0 (0.0%) |
| College / Associate Degree | 34 (82.9%) | 0 (0.0%) |
| Bachelor's Degree or higher | 21 (95.5%) | 0 (0.0%) |
| Total | 85 (88.5%) | 1 (1.2%) |
Employment Occupations by Sex in Clifton
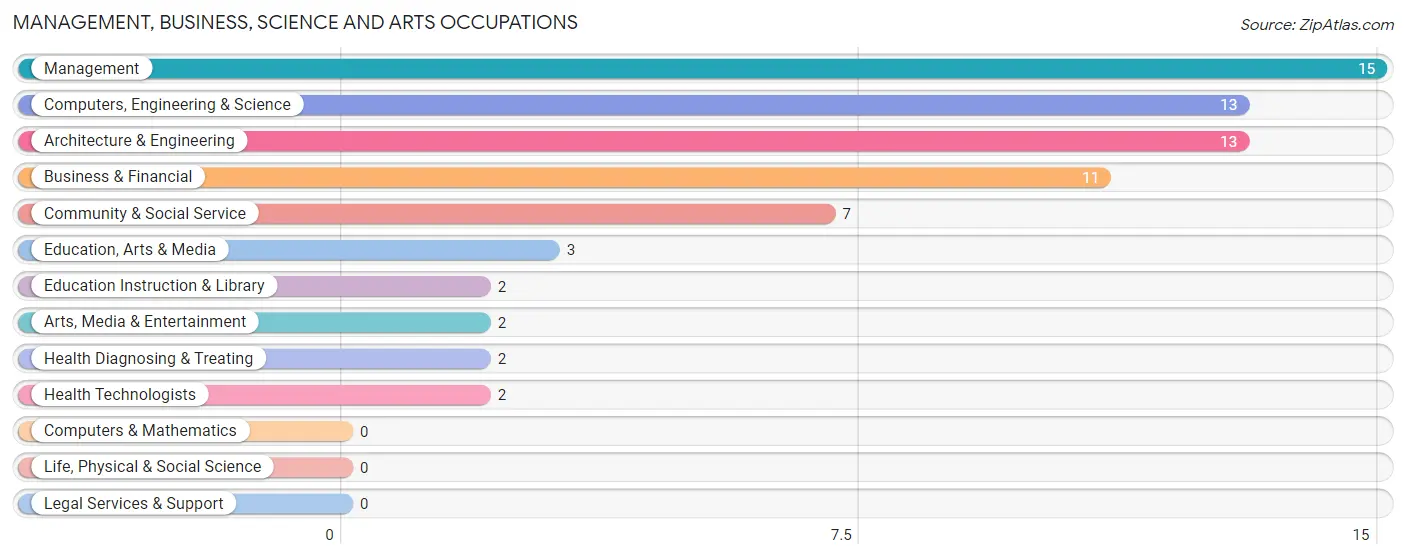
Management, Business, Science and Arts Occupations
The most common Management, Business, Science and Arts occupations in Clifton are Management (15 | 14.6%), Computers, Engineering & Science (13 | 12.6%), Architecture & Engineering (13 | 12.6%), Business & Financial (11 | 10.7%), and Community & Social Service (7 | 6.8%).
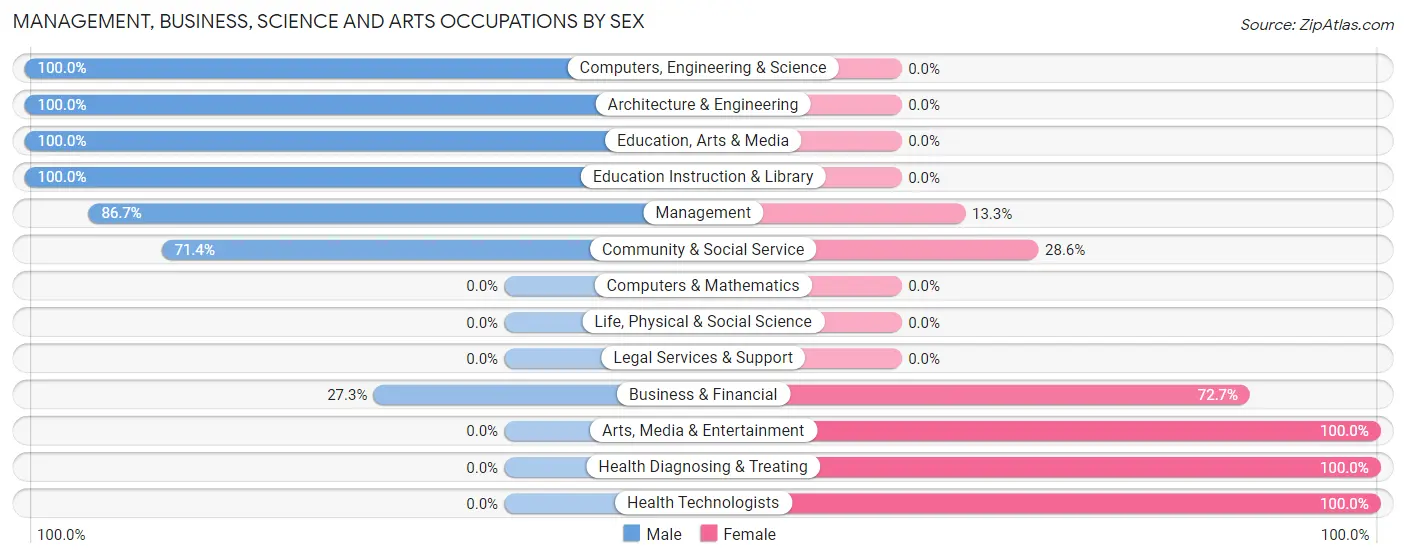
Management, Business, Science and Arts Occupations by Sex
Within the Management, Business, Science and Arts occupations in Clifton, the most male-oriented occupations are Computers, Engineering & Science (100.0%), Architecture & Engineering (100.0%), and Education, Arts & Media (100.0%), while the most female-oriented occupations are Arts, Media & Entertainment (100.0%), Health Diagnosing & Treating (100.0%), and Health Technologists (100.0%).
| Occupation | Male | Female |
| Management | 13 (86.7%) | 2 (13.3%) |
| Business & Financial | 3 (27.3%) | 8 (72.7%) |
| Computers, Engineering & Science | 13 (100.0%) | 0 (0.0%) |
| Computers & Mathematics | 0 (0.0%) | 0 (0.0%) |
| Architecture & Engineering | 13 (100.0%) | 0 (0.0%) |
| Life, Physical & Social Science | 0 (0.0%) | 0 (0.0%) |
| Community & Social Service | 5 (71.4%) | 2 (28.6%) |
| Education, Arts & Media | 3 (100.0%) | 0 (0.0%) |
| Legal Services & Support | 0 (0.0%) | 0 (0.0%) |
| Education Instruction & Library | 2 (100.0%) | 0 (0.0%) |
| Arts, Media & Entertainment | 0 (0.0%) | 2 (100.0%) |
| Health Diagnosing & Treating | 0 (0.0%) | 2 (100.0%) |
| Health Technologists | 0 (0.0%) | 2 (100.0%) |
| Total (Category) | 34 (70.8%) | 14 (29.2%) |
| Total (Overall) | 73 (70.9%) | 30 (29.1%) |
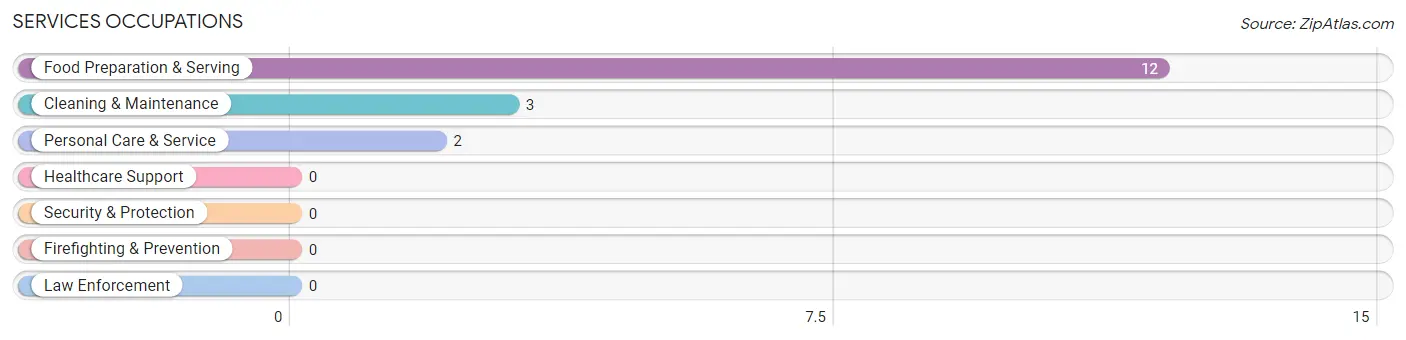
Services Occupations
The most common Services occupations in Clifton are Food Preparation & Serving (12 | 11.7%), Cleaning & Maintenance (3 | 2.9%), and Personal Care & Service (2 | 1.9%).
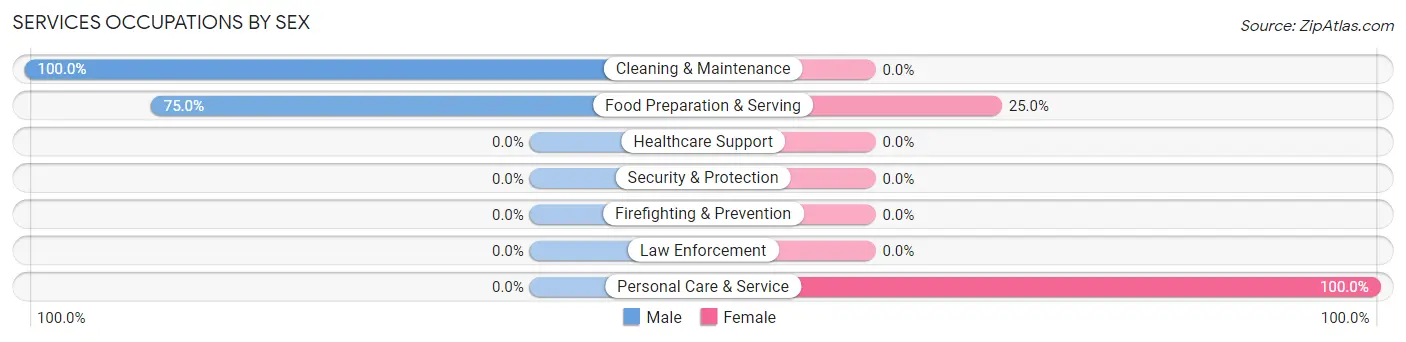
Services Occupations by Sex
Within the Services occupations in Clifton, the most male-oriented occupations are Cleaning & Maintenance (100.0%), and Food Preparation & Serving (75.0%), while the most female-oriented occupations are Personal Care & Service (100.0%), and Food Preparation & Serving (25.0%).
| Occupation | Male | Female |
| Healthcare Support | 0 (0.0%) | 0 (0.0%) |
| Security & Protection | 0 (0.0%) | 0 (0.0%) |
| Firefighting & Prevention | 0 (0.0%) | 0 (0.0%) |
| Law Enforcement | 0 (0.0%) | 0 (0.0%) |
| Food Preparation & Serving | 9 (75.0%) | 3 (25.0%) |
| Cleaning & Maintenance | 3 (100.0%) | 0 (0.0%) |
| Personal Care & Service | 0 (0.0%) | 2 (100.0%) |
| Total (Category) | 12 (70.6%) | 5 (29.4%) |
| Total (Overall) | 73 (70.9%) | 30 (29.1%) |
Sales and Office Occupations
The most common Sales and Office occupations in Clifton are Sales & Related (18 | 17.5%), and Office & Administration (6 | 5.8%).
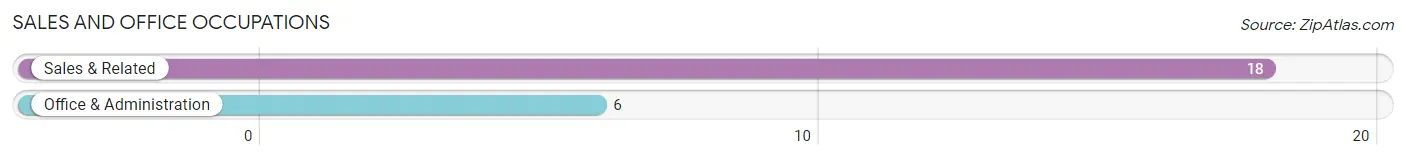
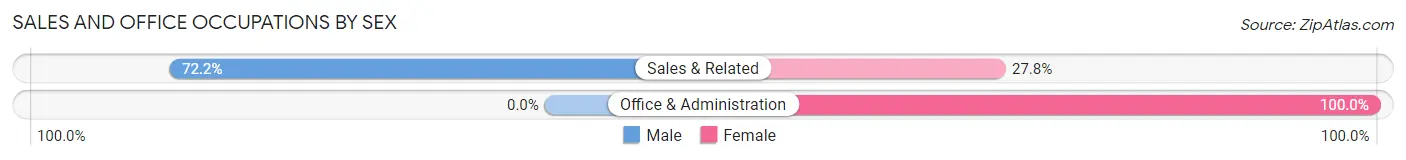
Sales and Office Occupations by Sex
| Occupation | Male | Female |
| Sales & Related | 13 (72.2%) | 5 (27.8%) |
| Office & Administration | 0 (0.0%) | 6 (100.0%) |
| Total (Category) | 13 (54.2%) | 11 (45.8%) |
| Total (Overall) | 73 (70.9%) | 30 (29.1%) |
Natural Resources, Construction and Maintenance Occupations
The most common Natural Resources, Construction and Maintenance occupations in Clifton are , and Installation, Maintenance & Repair (9 | 8.7%).
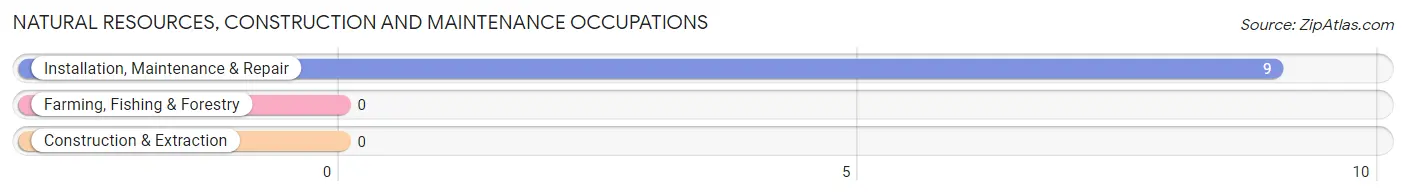
Natural Resources, Construction and Maintenance Occupations by Sex

| Occupation | Male | Female |
| Farming, Fishing & Forestry | 0 (0.0%) | 0 (0.0%) |
| Construction & Extraction | 0 (0.0%) | 0 (0.0%) |
| Installation, Maintenance & Repair | 9 (100.0%) | 0 (0.0%) |
| Total (Category) | 9 (100.0%) | 0 (0.0%) |
| Total (Overall) | 73 (70.9%) | 30 (29.1%) |
Production, Transportation and Moving Occupations
The most common Production, Transportation and Moving occupations in Clifton are Material Moving (4 | 3.9%), and Transportation (1 | 1.0%).
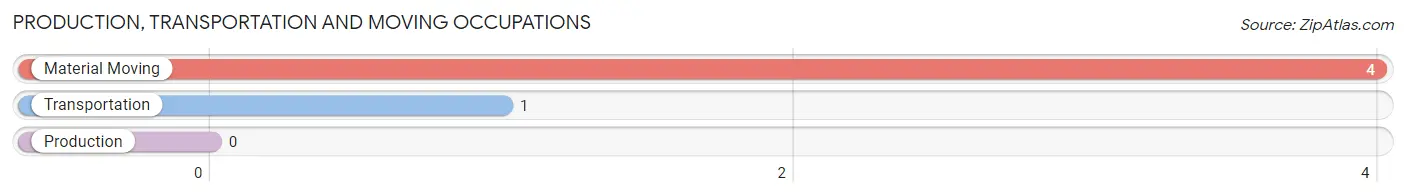
Production, Transportation and Moving Occupations by Sex
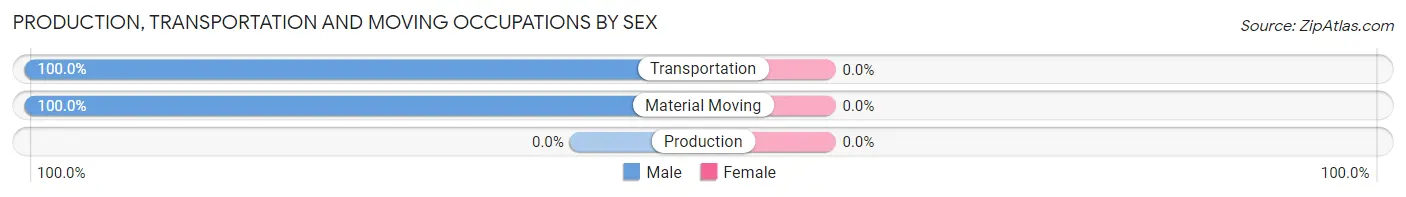
| Occupation | Male | Female |
| Production | 0 (0.0%) | 0 (0.0%) |
| Transportation | 1 (100.0%) | 0 (0.0%) |
| Material Moving | 4 (100.0%) | 0 (0.0%) |
| Total (Category) | 5 (100.0%) | 0 (0.0%) |
| Total (Overall) | 73 (70.9%) | 30 (29.1%) |
Employment Industries by Sex in Clifton
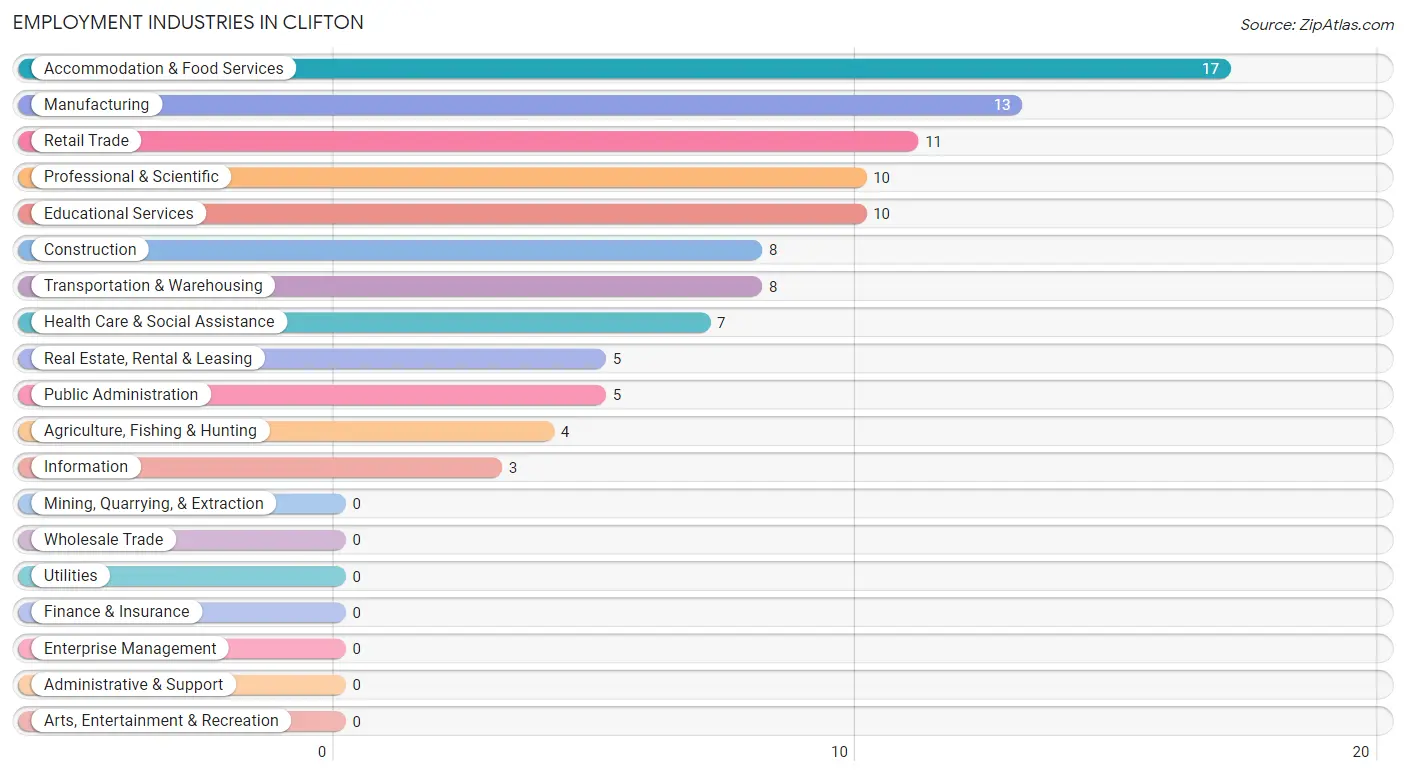
Employment Industries in Clifton
The major employment industries in Clifton include Accommodation & Food Services (17 | 16.5%), Manufacturing (13 | 12.6%), Retail Trade (11 | 10.7%), Professional & Scientific (10 | 9.7%), and Educational Services (10 | 9.7%).
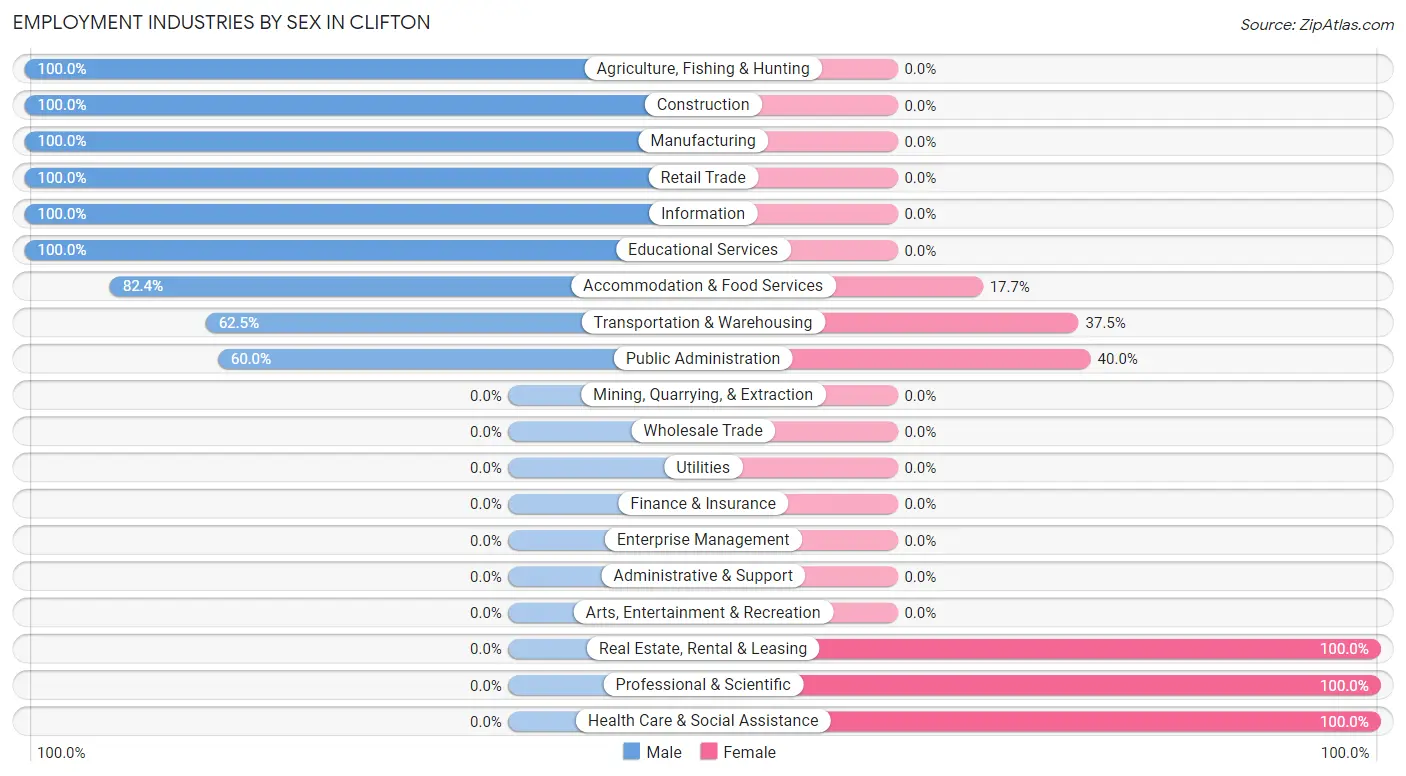
Employment Industries by Sex in Clifton
The Clifton industries that see more men than women are Agriculture, Fishing & Hunting (100.0%), Construction (100.0%), and Manufacturing (100.0%), whereas the industries that tend to have a higher number of women are Real Estate, Rental & Leasing (100.0%), Professional & Scientific (100.0%), and Health Care & Social Assistance (100.0%).
| Industry | Male | Female |
| Agriculture, Fishing & Hunting | 4 (100.0%) | 0 (0.0%) |
| Mining, Quarrying, & Extraction | 0 (0.0%) | 0 (0.0%) |
| Construction | 8 (100.0%) | 0 (0.0%) |
| Manufacturing | 13 (100.0%) | 0 (0.0%) |
| Wholesale Trade | 0 (0.0%) | 0 (0.0%) |
| Retail Trade | 11 (100.0%) | 0 (0.0%) |
| Transportation & Warehousing | 5 (62.5%) | 3 (37.5%) |
| Utilities | 0 (0.0%) | 0 (0.0%) |
| Information | 3 (100.0%) | 0 (0.0%) |
| Finance & Insurance | 0 (0.0%) | 0 (0.0%) |
| Real Estate, Rental & Leasing | 0 (0.0%) | 5 (100.0%) |
| Professional & Scientific | 0 (0.0%) | 10 (100.0%) |
| Enterprise Management | 0 (0.0%) | 0 (0.0%) |
| Administrative & Support | 0 (0.0%) | 0 (0.0%) |
| Educational Services | 10 (100.0%) | 0 (0.0%) |
| Health Care & Social Assistance | 0 (0.0%) | 7 (100.0%) |
| Arts, Entertainment & Recreation | 0 (0.0%) | 0 (0.0%) |
| Accommodation & Food Services | 14 (82.4%) | 3 (17.6%) |
| Public Administration | 3 (60.0%) | 2 (40.0%) |
| Total | 73 (70.9%) | 30 (29.1%) |
Education in Clifton
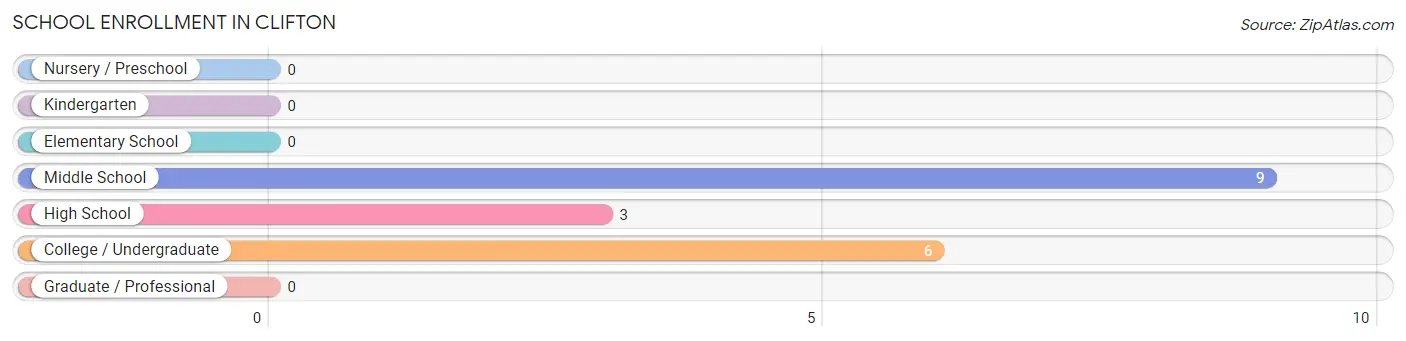
School Enrollment in Clifton
The most common levels of schooling among the 18 students in Clifton are middle school (9 | 50.0%), college / undergraduate (6 | 33.3%), and high school (3 | 16.7%).
| School Level | # Students | % Students |
| Nursery / Preschool | 0 | 0.0% |
| Kindergarten | 0 | 0.0% |
| Elementary School | 0 | 0.0% |
| Middle School | 9 | 50.0% |
| High School | 3 | 16.7% |
| College / Undergraduate | 6 | 33.3% |
| Graduate / Professional | 0 | 0.0% |
| Total | 18 | 100.0% |
School Enrollment by Age by Funding Source in Clifton
Out of a total of 18 students who are enrolled in schools in Clifton, 2 (11.1%) attend a private institution, while the remaining 16 (88.9%) are enrolled in public schools. The age group of 15 to 17 year olds has the highest likelihood of being enrolled in private schools, with 2 (66.7% in the age bracket) enrolled. Conversely, the age group of 10 to 14 year olds has the lowest likelihood of being enrolled in a private school, with 9 (100.0% in the age bracket) attending a public institution.
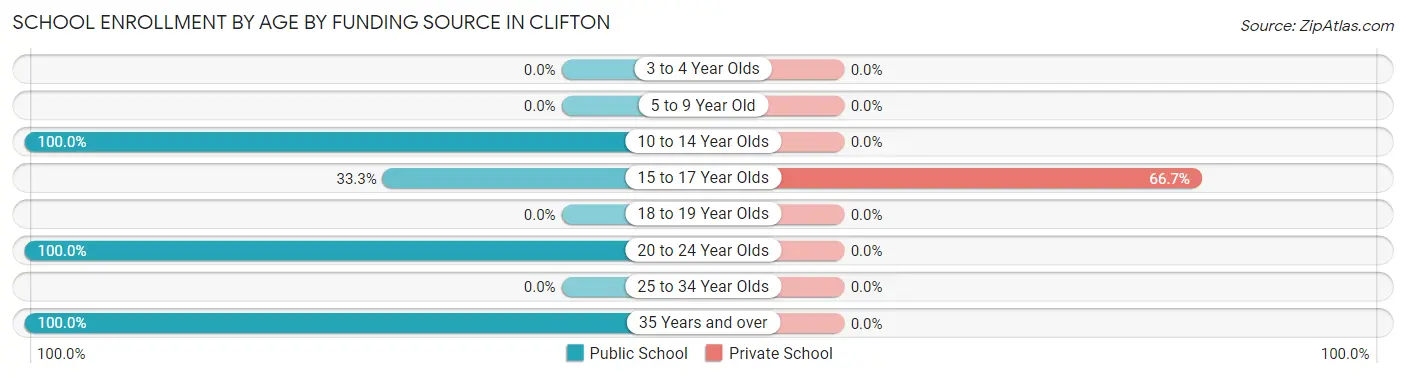
| Age Bracket | Public School | Private School |
| 3 to 4 Year Olds | 0 (0.0%) | 0 (0.0%) |
| 5 to 9 Year Old | 0 (0.0%) | 0 (0.0%) |
| 10 to 14 Year Olds | 9 (100.0%) | 0 (0.0%) |
| 15 to 17 Year Olds | 1 (33.3%) | 2 (66.7%) |
| 18 to 19 Year Olds | 0 (0.0%) | 0 (0.0%) |
| 20 to 24 Year Olds | 5 (100.0%) | 0 (0.0%) |
| 25 to 34 Year Olds | 0 (0.0%) | 0 (0.0%) |
| 35 Years and over | 1 (100.0%) | 0 (0.0%) |
| Total | 16 (88.9%) | 2 (11.1%) |
Educational Attainment by Field of Study in Clifton
Business (16 | 32.7%), communications (8 | 16.3%), science & technology (6 | 12.2%), physical & health sciences (5 | 10.2%), and education (3 | 6.1%) are the most common fields of study among 49 individuals in Clifton who have obtained a bachelor's degree or higher.
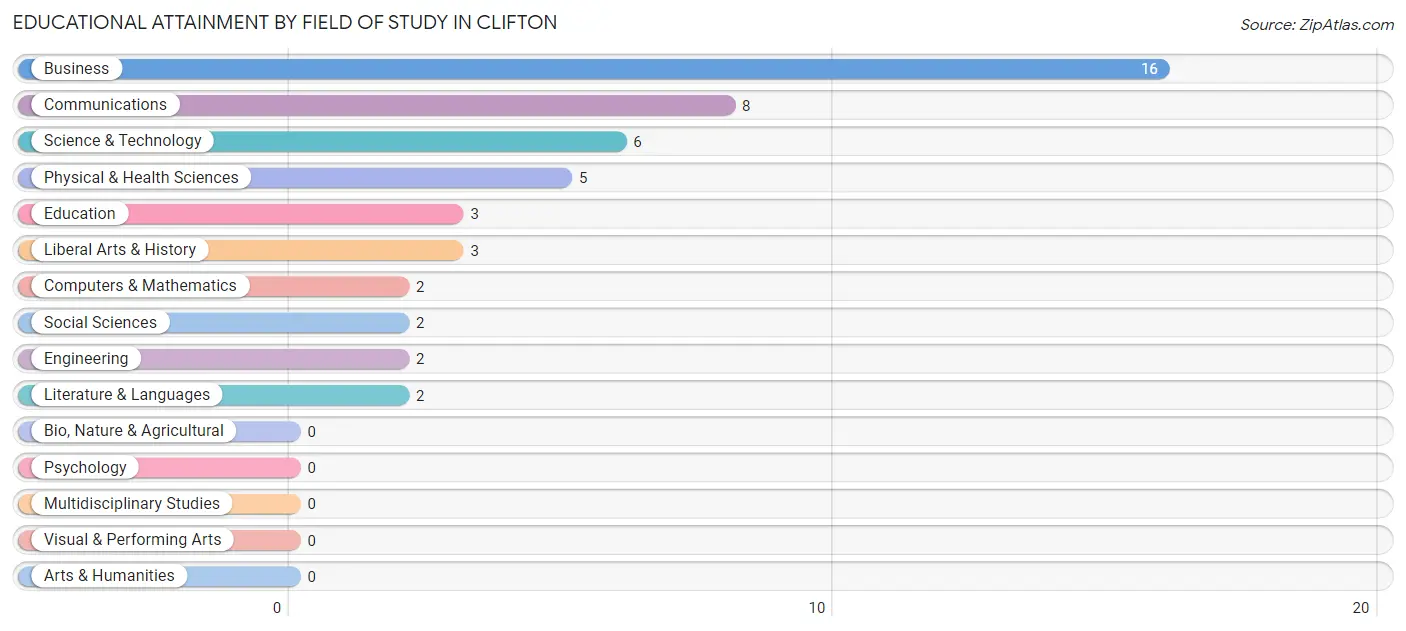
| Field of Study | # Graduates | % Graduates |
| Computers & Mathematics | 2 | 4.1% |
| Bio, Nature & Agricultural | 0 | 0.0% |
| Physical & Health Sciences | 5 | 10.2% |
| Psychology | 0 | 0.0% |
| Social Sciences | 2 | 4.1% |
| Engineering | 2 | 4.1% |
| Multidisciplinary Studies | 0 | 0.0% |
| Science & Technology | 6 | 12.2% |
| Business | 16 | 32.7% |
| Education | 3 | 6.1% |
| Literature & Languages | 2 | 4.1% |
| Liberal Arts & History | 3 | 6.1% |
| Visual & Performing Arts | 0 | 0.0% |
| Communications | 8 | 16.3% |
| Arts & Humanities | 0 | 0.0% |
| Total | 49 | 100.0% |
Transportation & Commute in Clifton
Vehicle Availability by Sex in Clifton
The most prevalent vehicle ownership categories in Clifton are males with 2 vehicles (25, accounting for 36.2%) and females with 2 vehicles (8, making up 83.3%).
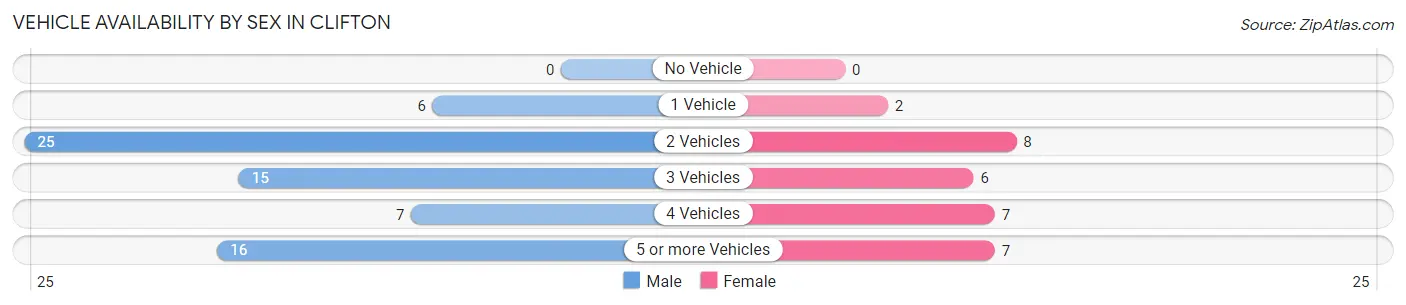
| Vehicles Available | Male | Female |
| No Vehicle | 0 (0.0%) | 0 (0.0%) |
| 1 Vehicle | 6 (8.7%) | 2 (6.7%) |
| 2 Vehicles | 25 (36.2%) | 8 (26.7%) |
| 3 Vehicles | 15 (21.7%) | 6 (20.0%) |
| 4 Vehicles | 7 (10.1%) | 7 (23.3%) |
| 5 or more Vehicles | 16 (23.2%) | 7 (23.3%) |
| Total | 69 (100.0%) | 30 (100.0%) |
Commute Time in Clifton
The most frequently occuring commute durations in Clifton are 15 to 19 minutes (20 commuters, 23.0%), 5 to 9 minutes (15 commuters, 17.2%), and 20 to 24 minutes (13 commuters, 14.9%).
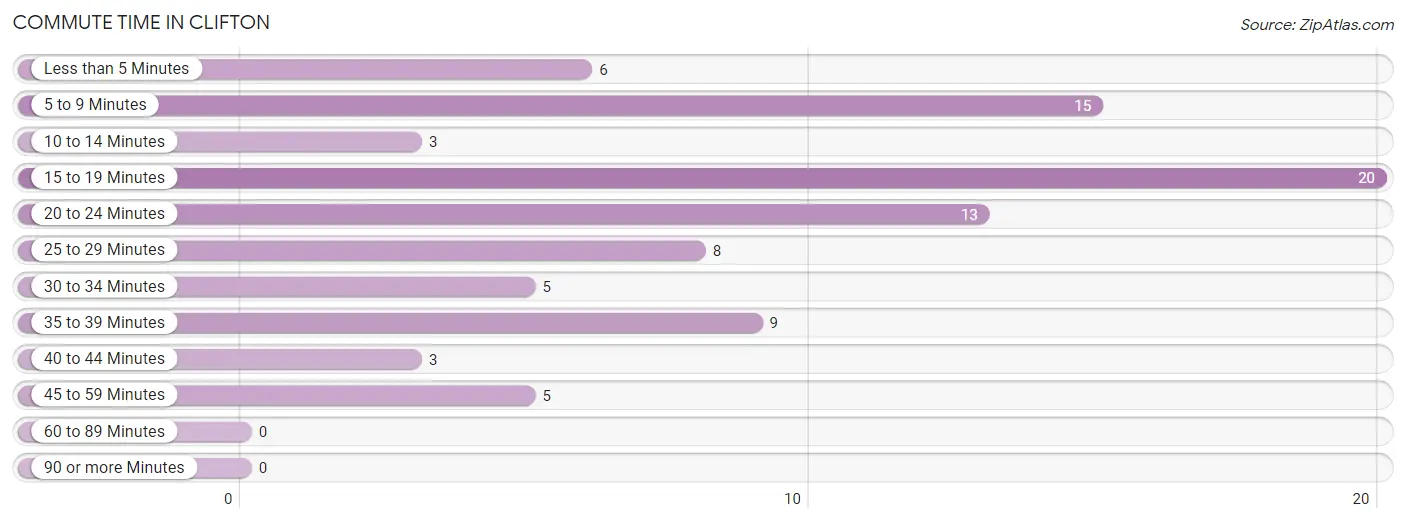
| Commute Time | # Commuters | % Commuters |
| Less than 5 Minutes | 6 | 6.9% |
| 5 to 9 Minutes | 15 | 17.2% |
| 10 to 14 Minutes | 3 | 3.5% |
| 15 to 19 Minutes | 20 | 23.0% |
| 20 to 24 Minutes | 13 | 14.9% |
| 25 to 29 Minutes | 8 | 9.2% |
| 30 to 34 Minutes | 5 | 5.8% |
| 35 to 39 Minutes | 9 | 10.3% |
| 40 to 44 Minutes | 3 | 3.5% |
| 45 to 59 Minutes | 5 | 5.8% |
| 60 to 89 Minutes | 0 | 0.0% |
| 90 or more Minutes | 0 | 0.0% |
Commute Time by Sex in Clifton
The most common commute times in Clifton are 15 to 19 minutes (19 commuters, 27.5%) for males and 5 to 9 minutes (5 commuters, 27.8%) for females.
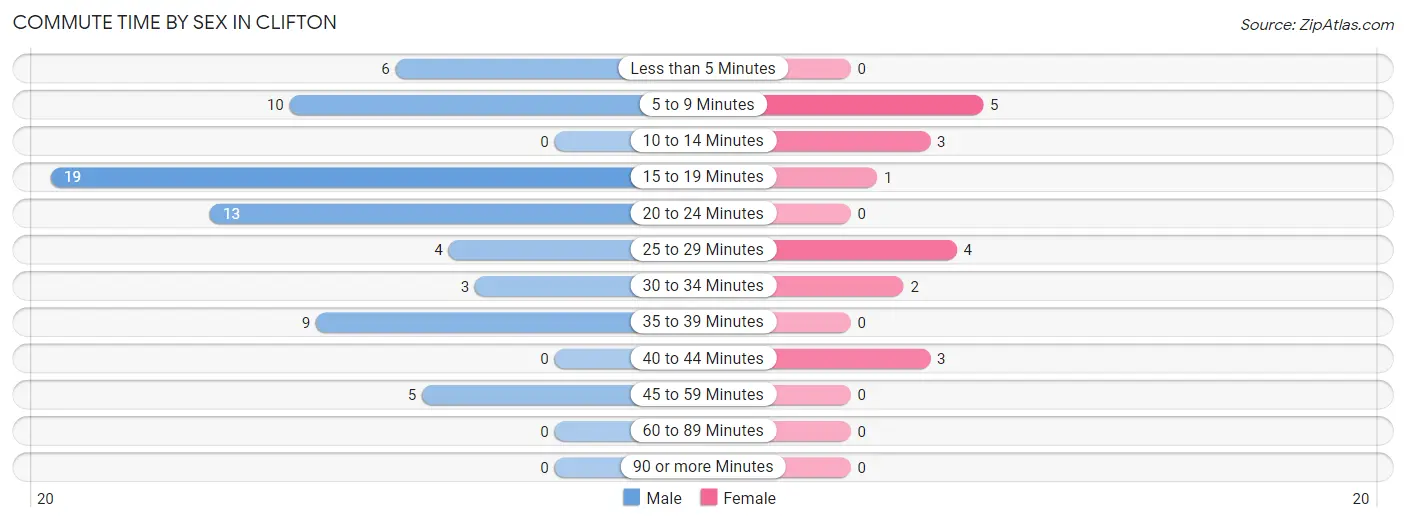
| Commute Time | Male | Female |
| Less than 5 Minutes | 6 (8.7%) | 0 (0.0%) |
| 5 to 9 Minutes | 10 (14.5%) | 5 (27.8%) |
| 10 to 14 Minutes | 0 (0.0%) | 3 (16.7%) |
| 15 to 19 Minutes | 19 (27.5%) | 1 (5.6%) |
| 20 to 24 Minutes | 13 (18.8%) | 0 (0.0%) |
| 25 to 29 Minutes | 4 (5.8%) | 4 (22.2%) |
| 30 to 34 Minutes | 3 (4.3%) | 2 (11.1%) |
| 35 to 39 Minutes | 9 (13.0%) | 0 (0.0%) |
| 40 to 44 Minutes | 0 (0.0%) | 3 (16.7%) |
| 45 to 59 Minutes | 5 (7.2%) | 0 (0.0%) |
| 60 to 89 Minutes | 0 (0.0%) | 0 (0.0%) |
| 90 or more Minutes | 0 (0.0%) | 0 (0.0%) |
Time of Departure to Work by Sex in Clifton
The most frequent times of departure to work in Clifton are 7:30 AM to 7:59 AM (22, 31.9%) for males and 9:00 AM to 9:59 AM (5, 27.8%) for females.
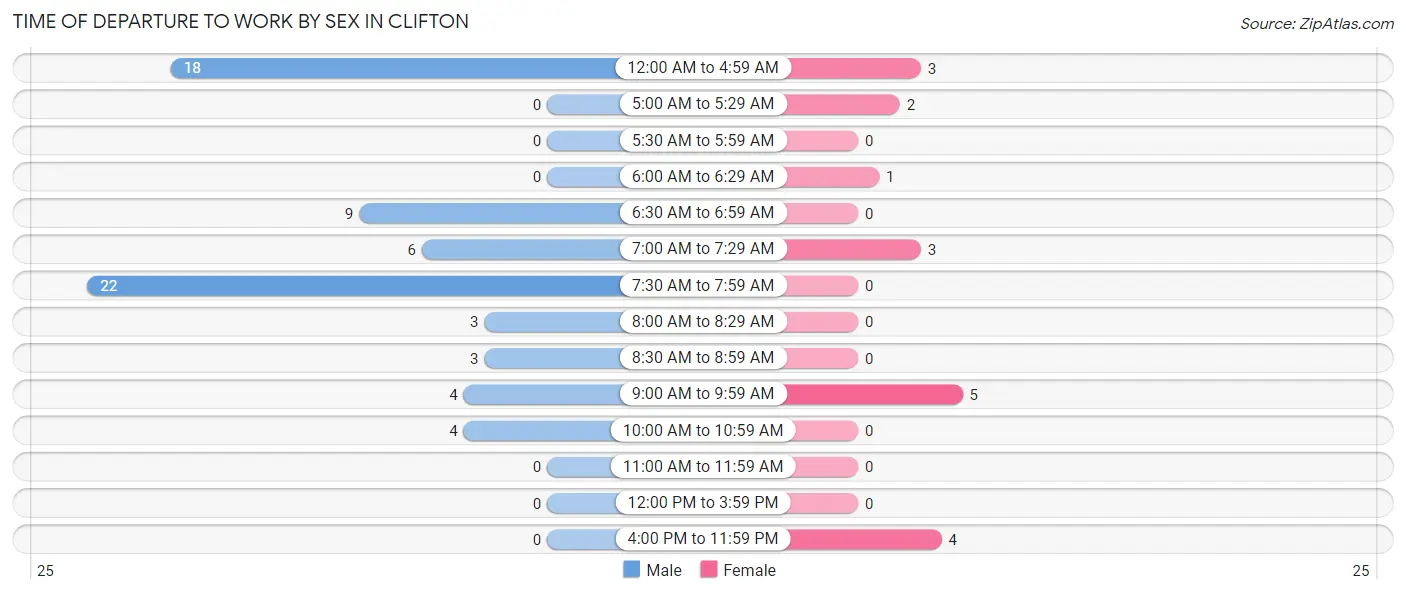
| Time of Departure | Male | Female |
| 12:00 AM to 4:59 AM | 18 (26.1%) | 3 (16.7%) |
| 5:00 AM to 5:29 AM | 0 (0.0%) | 2 (11.1%) |
| 5:30 AM to 5:59 AM | 0 (0.0%) | 0 (0.0%) |
| 6:00 AM to 6:29 AM | 0 (0.0%) | 1 (5.6%) |
| 6:30 AM to 6:59 AM | 9 (13.0%) | 0 (0.0%) |
| 7:00 AM to 7:29 AM | 6 (8.7%) | 3 (16.7%) |
| 7:30 AM to 7:59 AM | 22 (31.9%) | 0 (0.0%) |
| 8:00 AM to 8:29 AM | 3 (4.3%) | 0 (0.0%) |
| 8:30 AM to 8:59 AM | 3 (4.3%) | 0 (0.0%) |
| 9:00 AM to 9:59 AM | 4 (5.8%) | 5 (27.8%) |
| 10:00 AM to 10:59 AM | 4 (5.8%) | 0 (0.0%) |
| 11:00 AM to 11:59 AM | 0 (0.0%) | 0 (0.0%) |
| 12:00 PM to 3:59 PM | 0 (0.0%) | 0 (0.0%) |
| 4:00 PM to 11:59 PM | 0 (0.0%) | 4 (22.2%) |
| Total | 69 (100.0%) | 18 (100.0%) |
Housing Occupancy in Clifton
Occupancy by Ownership in Clifton
Of the total 58 dwellings in Clifton, owner-occupied units account for 42 (72.4%), while renter-occupied units make up 16 (27.6%).
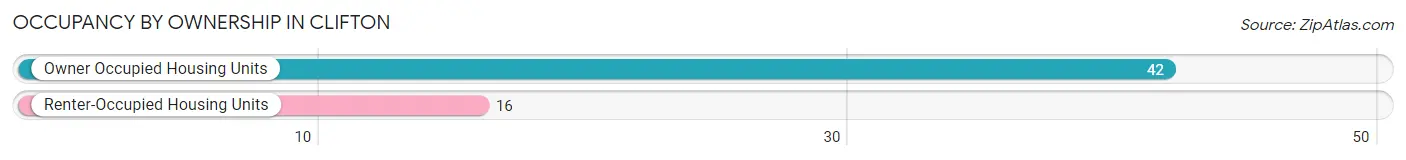
| Occupancy | # Housing Units | % Housing Units |
| Owner Occupied Housing Units | 42 | 72.4% |
| Renter-Occupied Housing Units | 16 | 27.6% |
| Total Occupied Housing Units | 58 | 100.0% |
Occupancy by Household Size in Clifton
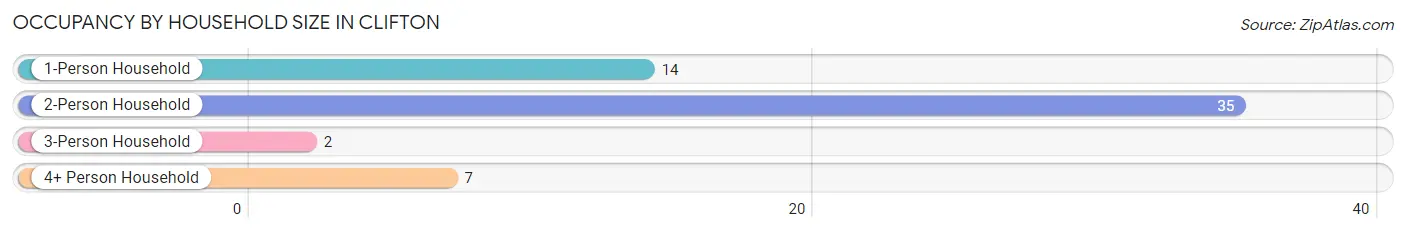
| Household Size | # Housing Units | % Housing Units |
| 1-Person Household | 14 | 24.1% |
| 2-Person Household | 35 | 60.3% |
| 3-Person Household | 2 | 3.5% |
| 4+ Person Household | 7 | 12.1% |
| Total Housing Units | 58 | 100.0% |
Occupancy by Ownership by Household Size in Clifton
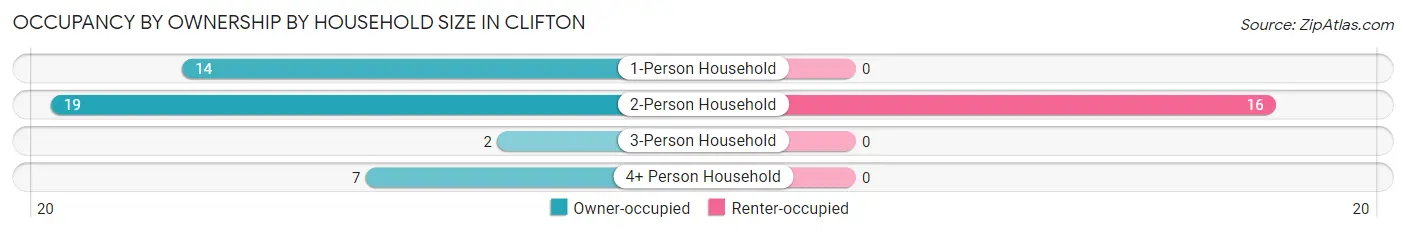
| Household Size | Owner-occupied | Renter-occupied |
| 1-Person Household | 14 (100.0%) | 0 (0.0%) |
| 2-Person Household | 19 (54.3%) | 16 (45.7%) |
| 3-Person Household | 2 (100.0%) | 0 (0.0%) |
| 4+ Person Household | 7 (100.0%) | 0 (0.0%) |
| Total Housing Units | 42 (72.4%) | 16 (27.6%) |
Occupancy by Educational Attainment in Clifton
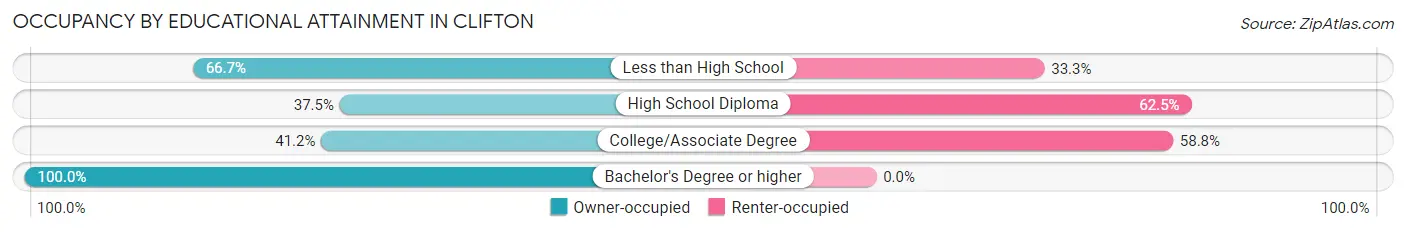
| Household Size | Owner-occupied | Renter-occupied |
| Less than High School | 2 (66.7%) | 1 (33.3%) |
| High School Diploma | 3 (37.5%) | 5 (62.5%) |
| College/Associate Degree | 7 (41.2%) | 10 (58.8%) |
| Bachelor's Degree or higher | 30 (100.0%) | 0 (0.0%) |
Occupancy by Age of Householder in Clifton
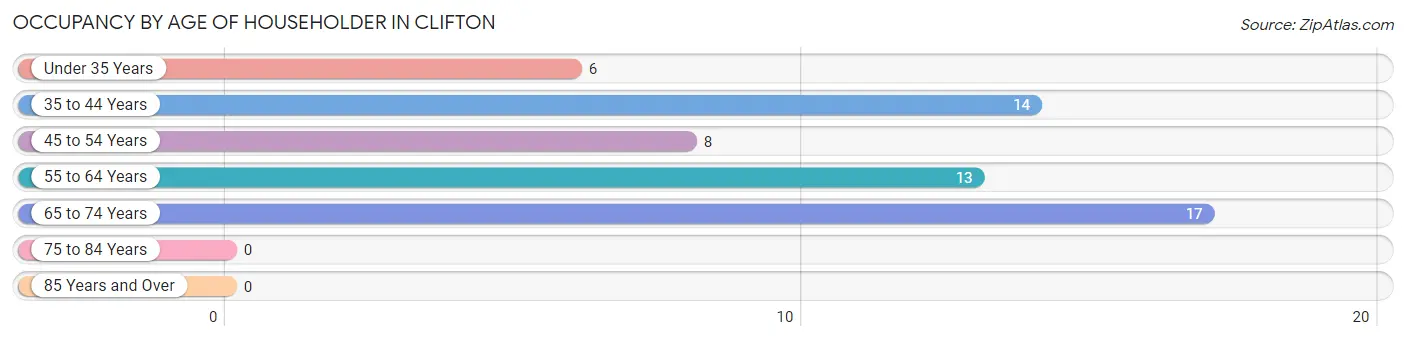
| Age Bracket | # Households | % Households |
| Under 35 Years | 6 | 10.3% |
| 35 to 44 Years | 14 | 24.1% |
| 45 to 54 Years | 8 | 13.8% |
| 55 to 64 Years | 13 | 22.4% |
| 65 to 74 Years | 17 | 29.3% |
| 75 to 84 Years | 0 | 0.0% |
| 85 Years and Over | 0 | 0.0% |
| Total | 58 | 100.0% |
Housing Finances in Clifton
Median Income by Occupancy in Clifton
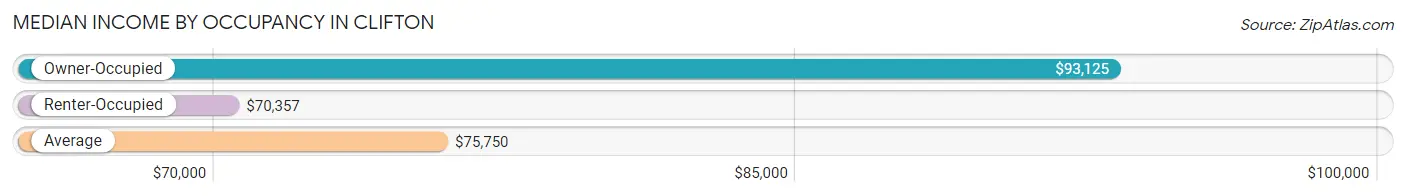
| Occupancy Type | # Households | Median Income |
| Owner-Occupied | 42 (72.4%) | $93,125 |
| Renter-Occupied | 16 (27.6%) | $70,357 |
| Average | 58 (100.0%) | $75,750 |
Occupancy by Householder Income Bracket in Clifton
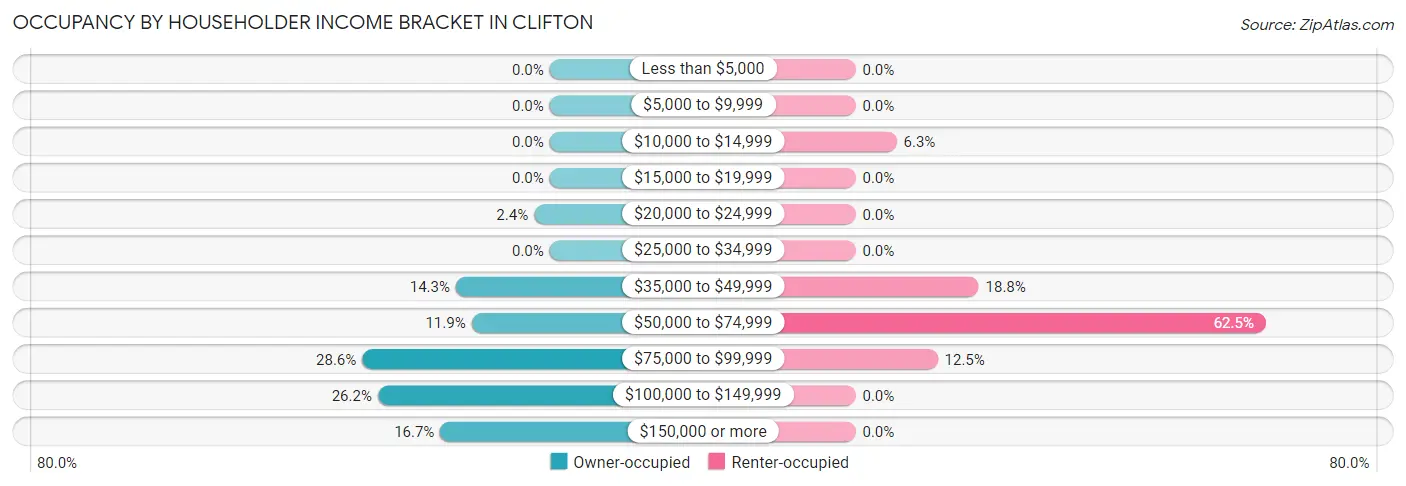
| Income Bracket | Owner-occupied | Renter-occupied |
| Less than $5,000 | 0 (0.0%) | 0 (0.0%) |
| $5,000 to $9,999 | 0 (0.0%) | 0 (0.0%) |
| $10,000 to $14,999 | 0 (0.0%) | 1 (6.2%) |
| $15,000 to $19,999 | 0 (0.0%) | 0 (0.0%) |
| $20,000 to $24,999 | 1 (2.4%) | 0 (0.0%) |
| $25,000 to $34,999 | 0 (0.0%) | 0 (0.0%) |
| $35,000 to $49,999 | 6 (14.3%) | 3 (18.8%) |
| $50,000 to $74,999 | 5 (11.9%) | 10 (62.5%) |
| $75,000 to $99,999 | 12 (28.6%) | 2 (12.5%) |
| $100,000 to $149,999 | 11 (26.2%) | 0 (0.0%) |
| $150,000 or more | 7 (16.7%) | 0 (0.0%) |
| Total | 42 (100.0%) | 16 (100.0%) |
Monthly Housing Cost Tiers in Clifton
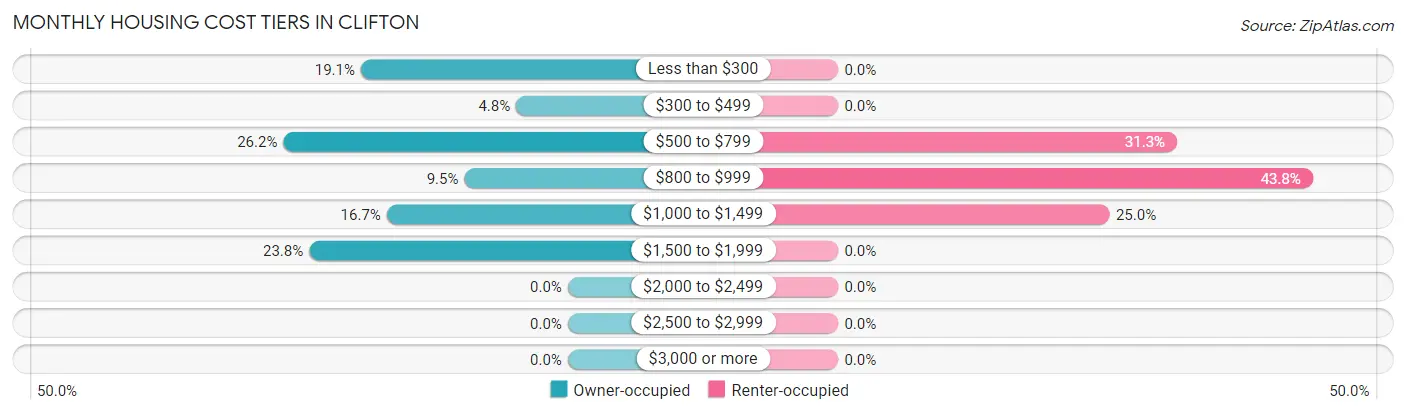
| Monthly Cost | Owner-occupied | Renter-occupied |
| Less than $300 | 8 (19.1%) | 0 (0.0%) |
| $300 to $499 | 2 (4.8%) | 0 (0.0%) |
| $500 to $799 | 11 (26.2%) | 5 (31.2%) |
| $800 to $999 | 4 (9.5%) | 7 (43.8%) |
| $1,000 to $1,499 | 7 (16.7%) | 4 (25.0%) |
| $1,500 to $1,999 | 10 (23.8%) | 0 (0.0%) |
| $2,000 to $2,499 | 0 (0.0%) | 0 (0.0%) |
| $2,500 to $2,999 | 0 (0.0%) | 0 (0.0%) |
| $3,000 or more | 0 (0.0%) | 0 (0.0%) |
| Total | 42 (100.0%) | 16 (100.0%) |
Physical Housing Characteristics in Clifton
Housing Structures in Clifton
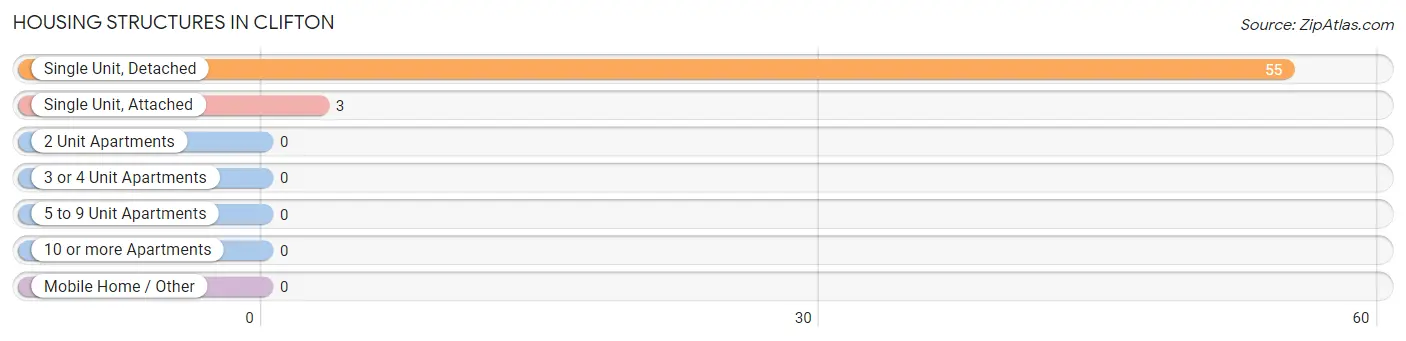
| Structure Type | # Housing Units | % Housing Units |
| Single Unit, Detached | 55 | 94.8% |
| Single Unit, Attached | 3 | 5.2% |
| 2 Unit Apartments | 0 | 0.0% |
| 3 or 4 Unit Apartments | 0 | 0.0% |
| 5 to 9 Unit Apartments | 0 | 0.0% |
| 10 or more Apartments | 0 | 0.0% |
| Mobile Home / Other | 0 | 0.0% |
| Total | 58 | 100.0% |
Housing Structures by Occupancy in Clifton
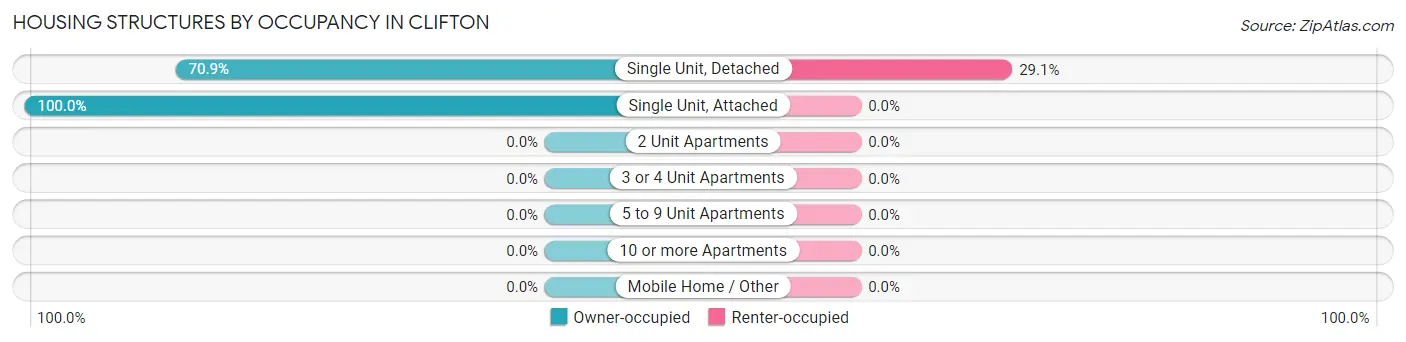
| Structure Type | Owner-occupied | Renter-occupied |
| Single Unit, Detached | 39 (70.9%) | 16 (29.1%) |
| Single Unit, Attached | 3 (100.0%) | 0 (0.0%) |
| 2 Unit Apartments | 0 (0.0%) | 0 (0.0%) |
| 3 or 4 Unit Apartments | 0 (0.0%) | 0 (0.0%) |
| 5 to 9 Unit Apartments | 0 (0.0%) | 0 (0.0%) |
| 10 or more Apartments | 0 (0.0%) | 0 (0.0%) |
| Mobile Home / Other | 0 (0.0%) | 0 (0.0%) |
| Total | 42 (72.4%) | 16 (27.6%) |
Housing Structures by Number of Rooms in Clifton
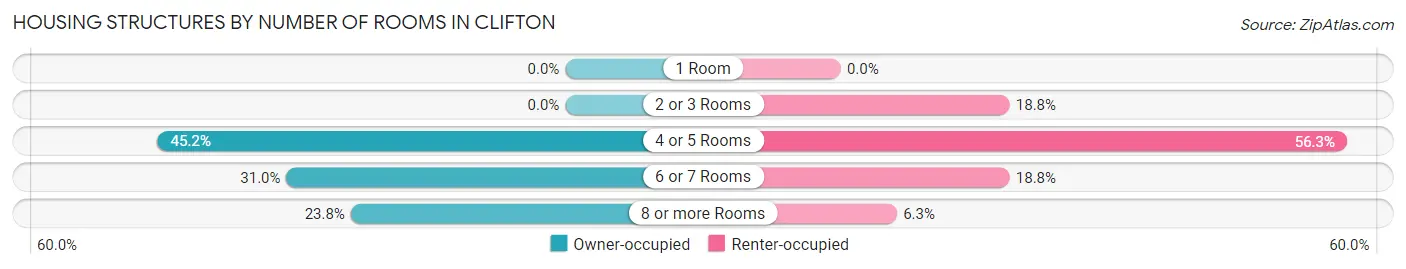
| Number of Rooms | Owner-occupied | Renter-occupied |
| 1 Room | 0 (0.0%) | 0 (0.0%) |
| 2 or 3 Rooms | 0 (0.0%) | 3 (18.8%) |
| 4 or 5 Rooms | 19 (45.2%) | 9 (56.2%) |
| 6 or 7 Rooms | 13 (30.9%) | 3 (18.8%) |
| 8 or more Rooms | 10 (23.8%) | 1 (6.2%) |
| Total | 42 (100.0%) | 16 (100.0%) |
Housing Structure by Heating Type in Clifton
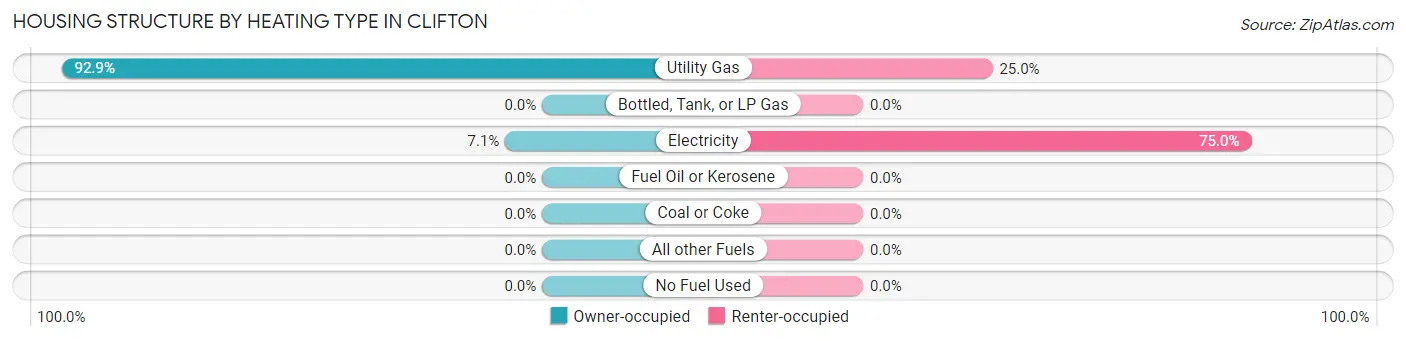
| Heating Type | Owner-occupied | Renter-occupied |
| Utility Gas | 39 (92.9%) | 4 (25.0%) |
| Bottled, Tank, or LP Gas | 0 (0.0%) | 0 (0.0%) |
| Electricity | 3 (7.1%) | 12 (75.0%) |
| Fuel Oil or Kerosene | 0 (0.0%) | 0 (0.0%) |
| Coal or Coke | 0 (0.0%) | 0 (0.0%) |
| All other Fuels | 0 (0.0%) | 0 (0.0%) |
| No Fuel Used | 0 (0.0%) | 0 (0.0%) |
| Total | 42 (100.0%) | 16 (100.0%) |
Household Vehicle Usage in Clifton
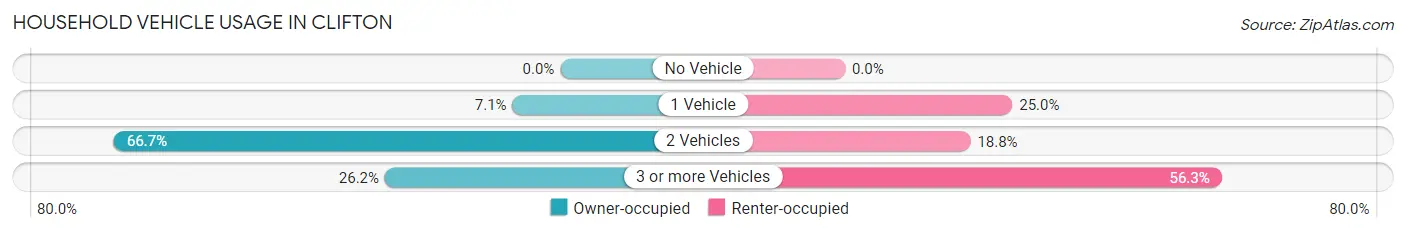
| Vehicles per Household | Owner-occupied | Renter-occupied |
| No Vehicle | 0 (0.0%) | 0 (0.0%) |
| 1 Vehicle | 3 (7.1%) | 4 (25.0%) |
| 2 Vehicles | 28 (66.7%) | 3 (18.8%) |
| 3 or more Vehicles | 11 (26.2%) | 9 (56.2%) |
| Total | 42 (100.0%) | 16 (100.0%) |
Real Estate & Mortgages in Clifton
Real Estate and Mortgage Overview in Clifton
| Characteristic | Without Mortgage | With Mortgage |
| Housing Units | 19 | 23 |
| Median Property Value | $145,300 | $215,600 |
| Median Household Income | $76,406 | $7 |
| Monthly Housing Costs | $475 | $0 |
| Real Estate Taxes | - | - |
Property Value by Mortgage Status in Clifton
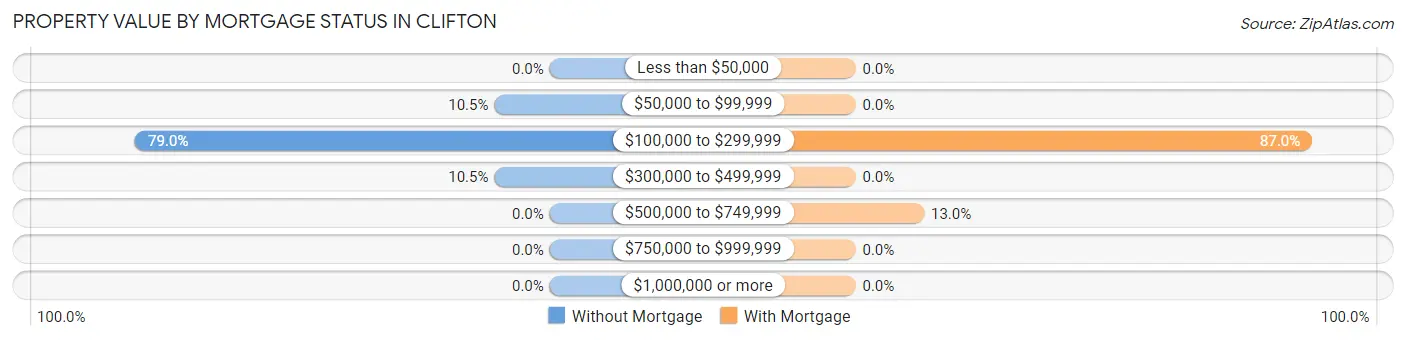
| Property Value | Without Mortgage | With Mortgage |
| Less than $50,000 | 0 (0.0%) | 0 (0.0%) |
| $50,000 to $99,999 | 2 (10.5%) | 0 (0.0%) |
| $100,000 to $299,999 | 15 (78.9%) | 20 (87.0%) |
| $300,000 to $499,999 | 2 (10.5%) | 0 (0.0%) |
| $500,000 to $749,999 | 0 (0.0%) | 3 (13.0%) |
| $750,000 to $999,999 | 0 (0.0%) | 0 (0.0%) |
| $1,000,000 or more | 0 (0.0%) | 0 (0.0%) |
| Total | 19 (100.0%) | 23 (100.0%) |
Household Income by Mortgage Status in Clifton
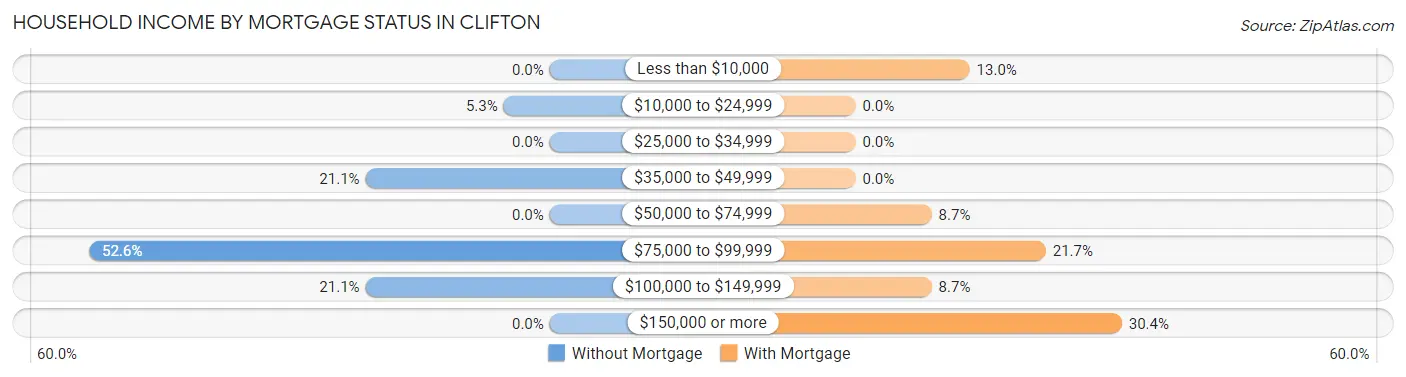
| Household Income | Without Mortgage | With Mortgage |
| Less than $10,000 | 0 (0.0%) | 3 (13.0%) |
| $10,000 to $24,999 | 1 (5.3%) | 0 (0.0%) |
| $25,000 to $34,999 | 0 (0.0%) | 0 (0.0%) |
| $35,000 to $49,999 | 4 (21.0%) | 0 (0.0%) |
| $50,000 to $74,999 | 0 (0.0%) | 2 (8.7%) |
| $75,000 to $99,999 | 10 (52.6%) | 5 (21.7%) |
| $100,000 to $149,999 | 4 (21.0%) | 2 (8.7%) |
| $150,000 or more | 0 (0.0%) | 7 (30.4%) |
| Total | 19 (100.0%) | 23 (100.0%) |
Property Value to Household Income Ratio in Clifton
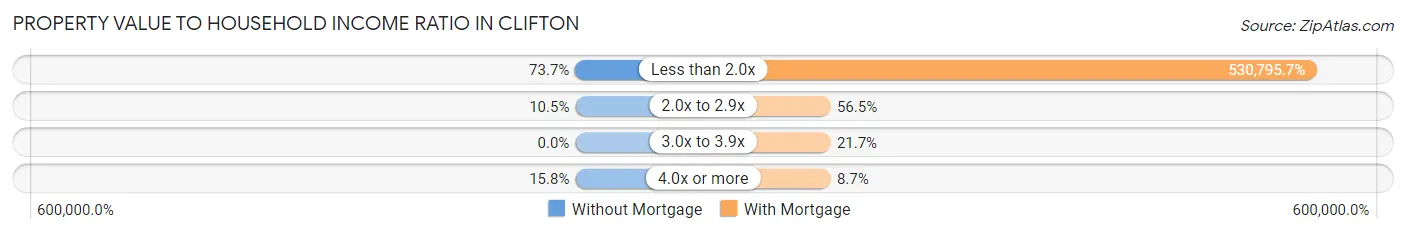
| Value-to-Income Ratio | Without Mortgage | With Mortgage |
| Less than 2.0x | 14 (73.7%) | 122,083 (530,795.7%) |
| 2.0x to 2.9x | 2 (10.5%) | 13 (56.5%) |
| 3.0x to 3.9x | 0 (0.0%) | 5 (21.7%) |
| 4.0x or more | 3 (15.8%) | 2 (8.7%) |
| Total | 19 (100.0%) | 23 (100.0%) |
Real Estate Taxes by Mortgage Status in Clifton
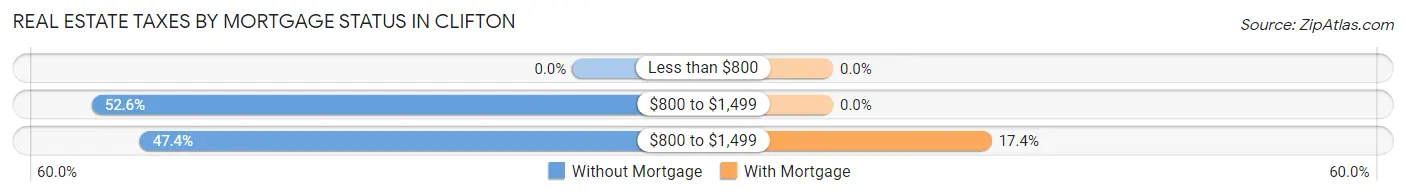
| Property Taxes | Without Mortgage | With Mortgage |
| Less than $800 | 0 (0.0%) | 0 (0.0%) |
| $800 to $1,499 | 10 (52.6%) | 0 (0.0%) |
| $800 to $1,499 | 9 (47.4%) | 4 (17.4%) |
| Total | 19 (100.0%) | 23 (100.0%) |
Health & Disability in Clifton
Health Insurance Coverage by Age in Clifton
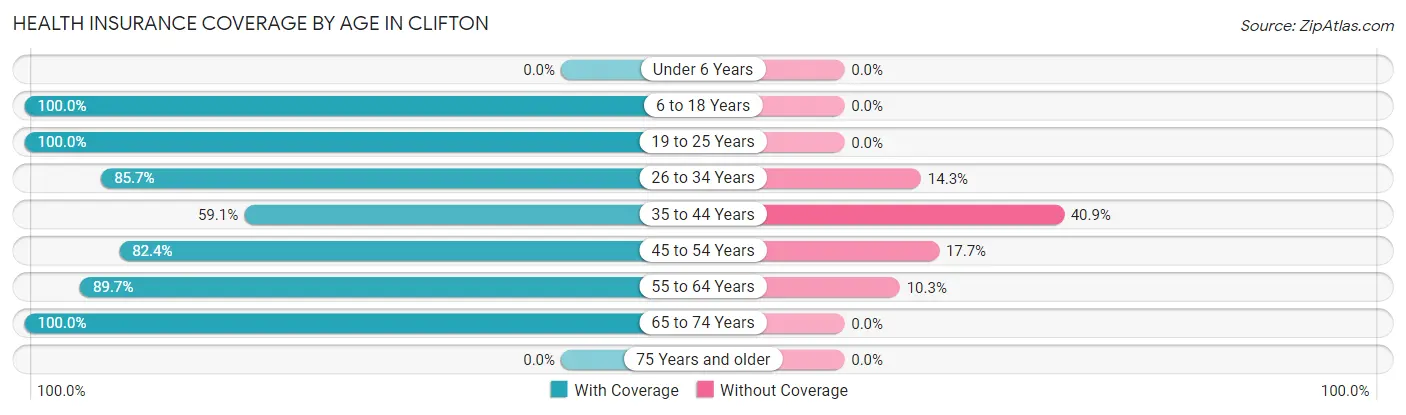
| Age Bracket | With Coverage | Without Coverage |
| Under 6 Years | 0 (0.0%) | 0 (0.0%) |
| 6 to 18 Years | 12 (100.0%) | 0 (0.0%) |
| 19 to 25 Years | 11 (100.0%) | 0 (0.0%) |
| 26 to 34 Years | 24 (85.7%) | 4 (14.3%) |
| 35 to 44 Years | 13 (59.1%) | 9 (40.9%) |
| 45 to 54 Years | 14 (82.4%) | 3 (17.6%) |
| 55 to 64 Years | 26 (89.7%) | 3 (10.3%) |
| 65 to 74 Years | 22 (100.0%) | 0 (0.0%) |
| 75 Years and older | 0 (0.0%) | 0 (0.0%) |
| Total | 122 (86.5%) | 19 (13.5%) |
Health Insurance Coverage by Citizenship Status in Clifton
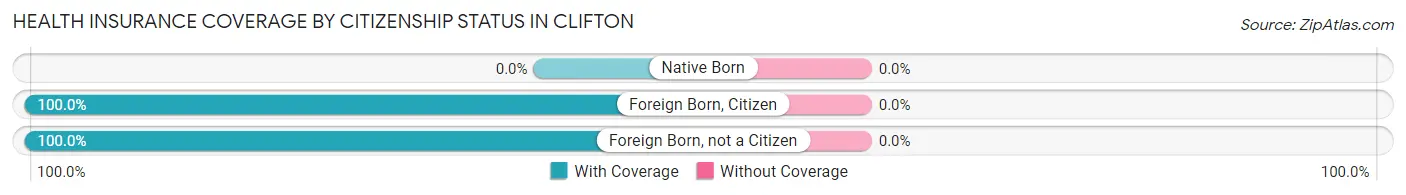
| Citizenship Status | With Coverage | Without Coverage |
| Native Born | 0 (0.0%) | 0 (0.0%) |
| Foreign Born, Citizen | 12 (100.0%) | 0 (0.0%) |
| Foreign Born, not a Citizen | 11 (100.0%) | 0 (0.0%) |
Health Insurance Coverage by Household Income in Clifton
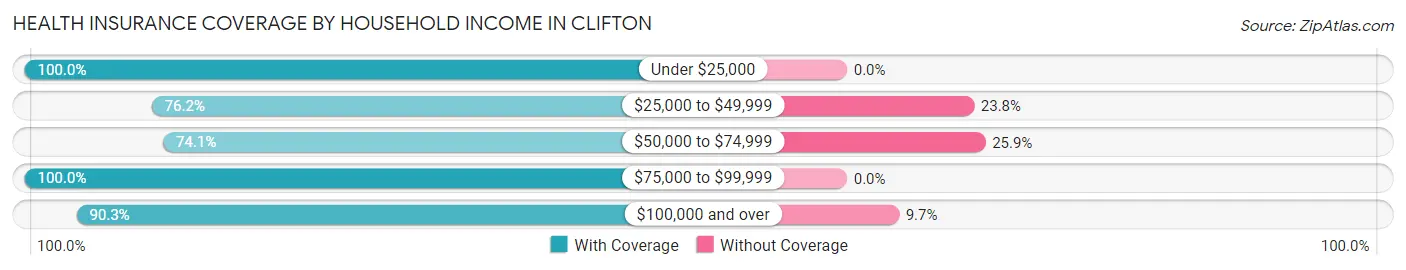
| Household Income | With Coverage | Without Coverage |
| Under $25,000 | 4 (100.0%) | 0 (0.0%) |
| $25,000 to $49,999 | 16 (76.2%) | 5 (23.8%) |
| $50,000 to $74,999 | 20 (74.1%) | 7 (25.9%) |
| $75,000 to $99,999 | 17 (100.0%) | 0 (0.0%) |
| $100,000 and over | 65 (90.3%) | 7 (9.7%) |
Public vs Private Health Insurance Coverage by Age in Clifton
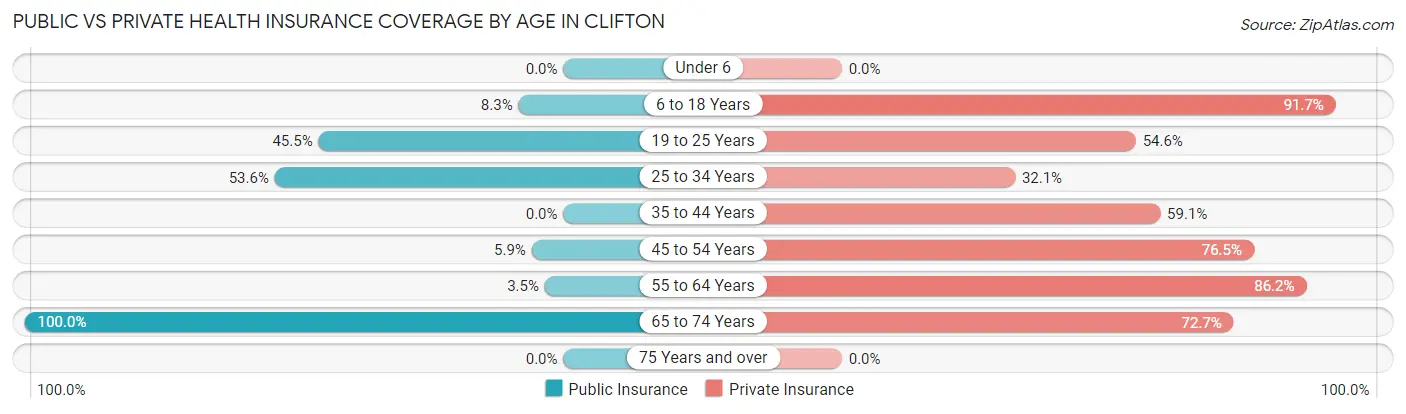
| Age Bracket | Public Insurance | Private Insurance |
| Under 6 | 0 (0.0%) | 0 (0.0%) |
| 6 to 18 Years | 1 (8.3%) | 11 (91.7%) |
| 19 to 25 Years | 5 (45.5%) | 6 (54.5%) |
| 25 to 34 Years | 15 (53.6%) | 9 (32.1%) |
| 35 to 44 Years | 0 (0.0%) | 13 (59.1%) |
| 45 to 54 Years | 1 (5.9%) | 13 (76.5%) |
| 55 to 64 Years | 1 (3.5%) | 25 (86.2%) |
| 65 to 74 Years | 22 (100.0%) | 16 (72.7%) |
| 75 Years and over | 0 (0.0%) | 0 (0.0%) |
| Total | 45 (31.9%) | 93 (66.0%) |
Disability Status by Sex by Age in Clifton
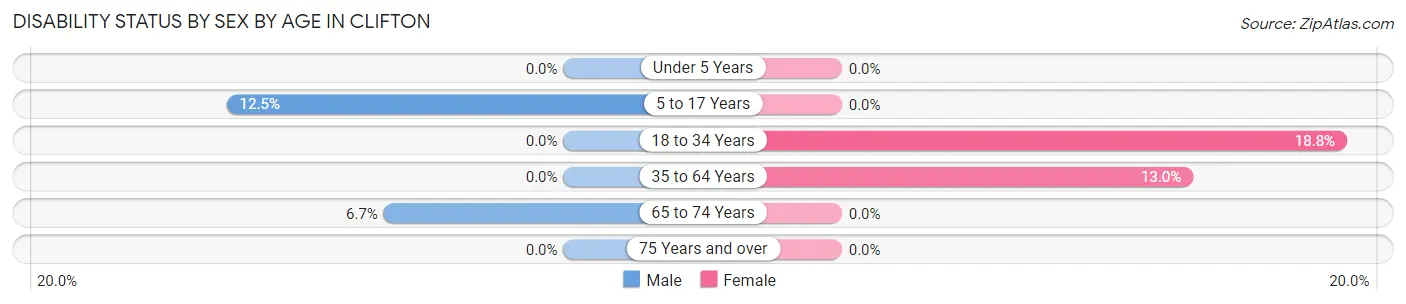
| Age Bracket | Male | Female |
| Under 5 Years | 0 (0.0%) | 0 (0.0%) |
| 5 to 17 Years | 1 (12.5%) | 0 (0.0%) |
| 18 to 34 Years | 0 (0.0%) | 3 (18.8%) |
| 35 to 64 Years | 0 (0.0%) | 3 (13.0%) |
| 65 to 74 Years | 1 (6.7%) | 0 (0.0%) |
| 75 Years and over | 0 (0.0%) | 0 (0.0%) |
Disability Class by Sex by Age in Clifton
Disability Class: Hearing Difficulty
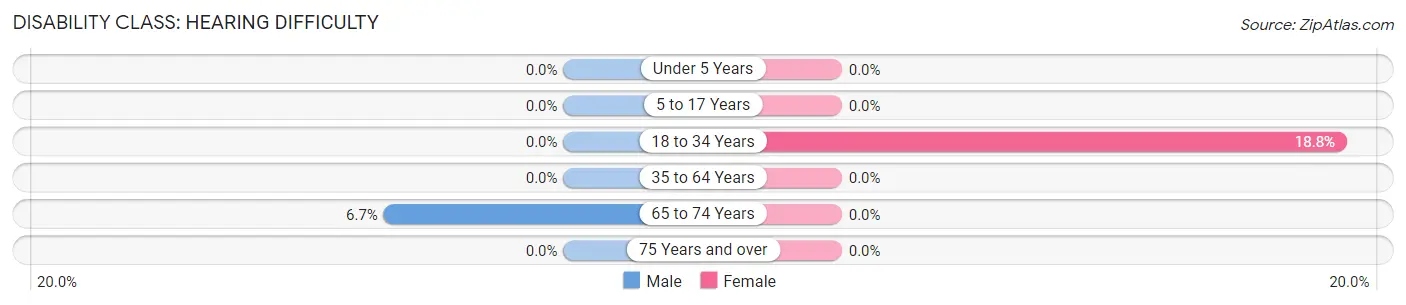
| Age Bracket | Male | Female |
| Under 5 Years | 0 (0.0%) | 0 (0.0%) |
| 5 to 17 Years | 0 (0.0%) | 0 (0.0%) |
| 18 to 34 Years | 0 (0.0%) | 3 (18.8%) |
| 35 to 64 Years | 0 (0.0%) | 0 (0.0%) |
| 65 to 74 Years | 1 (6.7%) | 0 (0.0%) |
| 75 Years and over | 0 (0.0%) | 0 (0.0%) |
Disability Class: Vision Difficulty
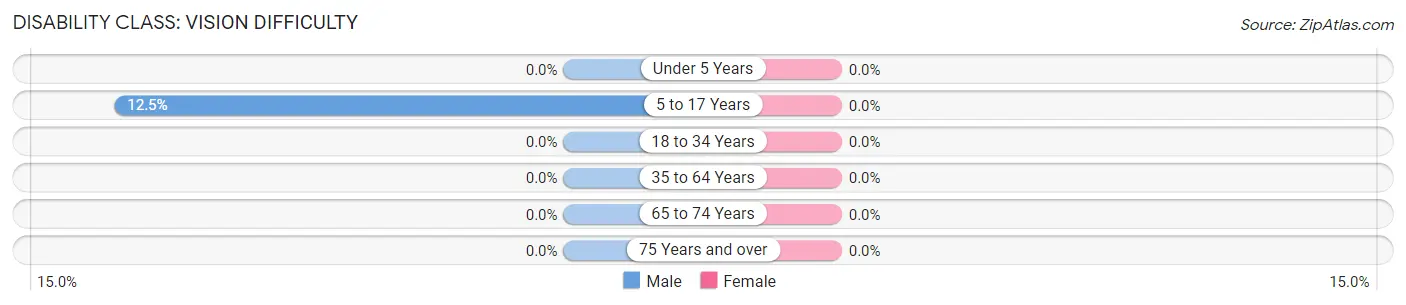
| Age Bracket | Male | Female |
| Under 5 Years | 0 (0.0%) | 0 (0.0%) |
| 5 to 17 Years | 1 (12.5%) | 0 (0.0%) |
| 18 to 34 Years | 0 (0.0%) | 0 (0.0%) |
| 35 to 64 Years | 0 (0.0%) | 0 (0.0%) |
| 65 to 74 Years | 0 (0.0%) | 0 (0.0%) |
| 75 Years and over | 0 (0.0%) | 0 (0.0%) |
Disability Class: Cognitive Difficulty
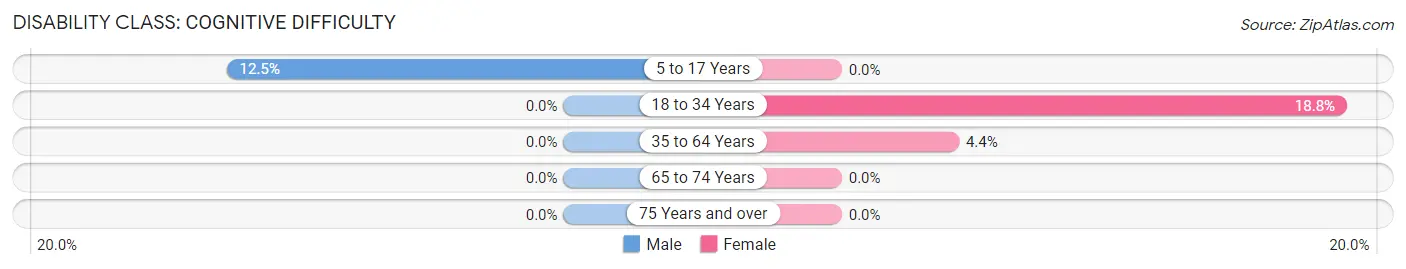
| Age Bracket | Male | Female |
| 5 to 17 Years | 1 (12.5%) | 0 (0.0%) |
| 18 to 34 Years | 0 (0.0%) | 3 (18.8%) |
| 35 to 64 Years | 0 (0.0%) | 1 (4.3%) |
| 65 to 74 Years | 0 (0.0%) | 0 (0.0%) |
| 75 Years and over | 0 (0.0%) | 0 (0.0%) |
Disability Class: Ambulatory Difficulty
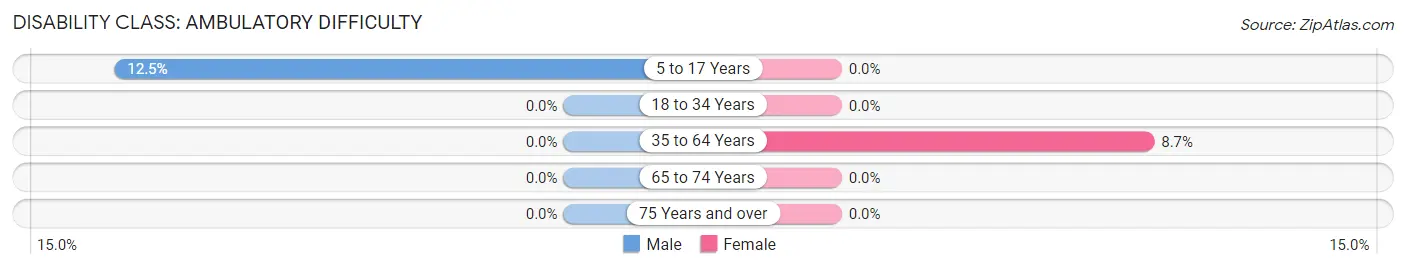
| Age Bracket | Male | Female |
| 5 to 17 Years | 1 (12.5%) | 0 (0.0%) |
| 18 to 34 Years | 0 (0.0%) | 0 (0.0%) |
| 35 to 64 Years | 0 (0.0%) | 2 (8.7%) |
| 65 to 74 Years | 0 (0.0%) | 0 (0.0%) |
| 75 Years and over | 0 (0.0%) | 0 (0.0%) |
Disability Class: Self-Care Difficulty
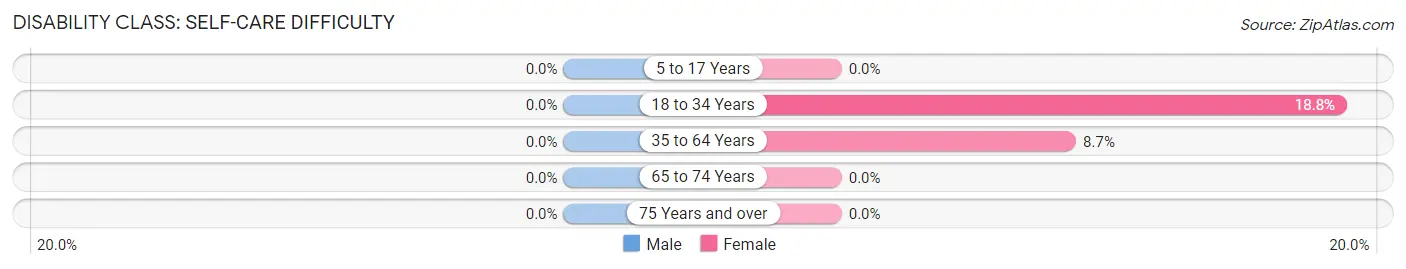
| Age Bracket | Male | Female |
| 5 to 17 Years | 0 (0.0%) | 0 (0.0%) |
| 18 to 34 Years | 0 (0.0%) | 3 (18.8%) |
| 35 to 64 Years | 0 (0.0%) | 2 (8.7%) |
| 65 to 74 Years | 0 (0.0%) | 0 (0.0%) |
| 75 Years and over | 0 (0.0%) | 0 (0.0%) |
Technology Access in Clifton
Computing Device Access in Clifton
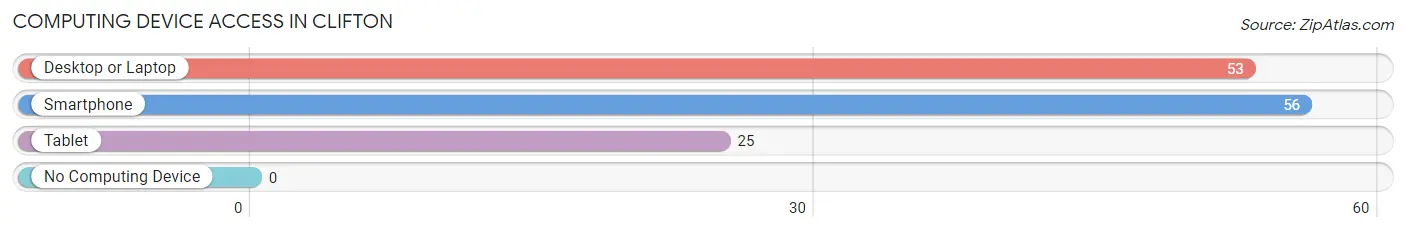
| Device Type | # Households | % Households |
| Desktop or Laptop | 53 | 91.4% |
| Smartphone | 56 | 96.6% |
| Tablet | 25 | 43.1% |
| No Computing Device | 0 | 0.0% |
| Total | 58 | 100.0% |
Internet Access in Clifton
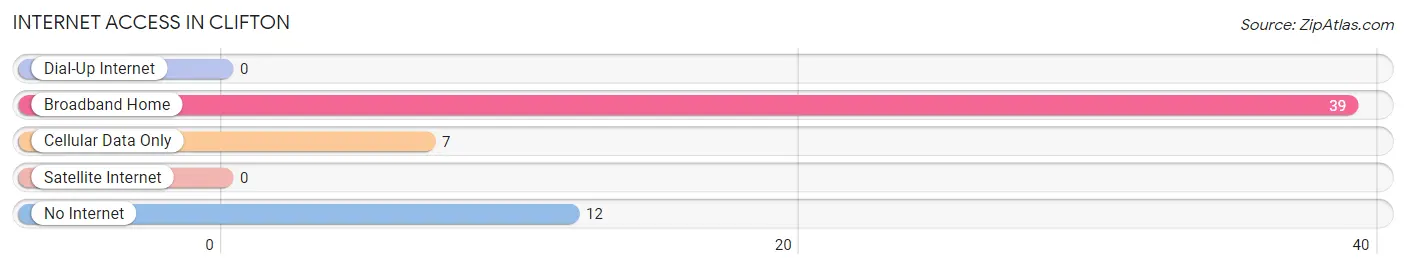
| Internet Type | # Households | % Households |
| Dial-Up Internet | 0 | 0.0% |
| Broadband Home | 39 | 67.2% |
| Cellular Data Only | 7 | 12.1% |
| Satellite Internet | 0 | 0.0% |
| No Internet | 12 | 20.7% |
| Total | 58 | 100.0% |
Clifton Summary
Clifton, Ohio is a small village located in Greene County, Ohio. It is situated on the banks of the Little Miami River, approximately 10 miles east of Xenia and 25 miles south of Dayton. The village has a population of approximately 1,000 people and covers an area of 0.6 square miles.
History
Clifton was founded in 1817 by a group of settlers from Virginia. The village was named after the nearby Clifton Mill, which was built in 1812. The mill was owned by William Clifton, who was one of the original settlers. The village grew slowly over the years, and by the mid-1800s, it had become a thriving community with a population of around 500 people.
The village was incorporated in 1867 and the first mayor was elected in 1868. The village continued to grow and by the early 1900s, it had become a popular tourist destination. The village was home to several hotels, restaurants, and stores.
In the 1950s, the village began to decline as many of the businesses closed and the population began to decline. The village was hit hard by the Great Recession of 2008 and many of the businesses closed. However, the village has seen a resurgence in recent years and is now home to several small businesses and restaurants.
Geography
Clifton is located in Greene County, Ohio. It is situated on the banks of the Little Miami River, approximately 10 miles east of Xenia and 25 miles south of Dayton. The village has a total area of 0.6 square miles, all of which is land. The village is located in a rural area and is surrounded by farmland.
Economy
Clifton’s economy is largely based on agriculture and tourism. The village is home to several small businesses, including restaurants, stores, and a winery. The village also has a farmers’ market that is open during the summer months.
Demographics
As of the 2010 census, the village had a population of 1,000 people. The racial makeup of the village was 97.2% White, 0.7% African American, 0.3% Native American, 0.2% Asian, and 1.6% from other races. The median household income was $41,250 and the median family income was $50,000.
Conclusion
Clifton, Ohio is a small village located in Greene County, Ohio. It is situated on the banks of the Little Miami River, approximately 10 miles east of Xenia and 25 miles south of Dayton. The village has a population of approximately 1,000 people and covers an area of 0.6 square miles. The village was founded in 1817 and has a long history of agriculture and tourism. The village’s economy is largely based on agriculture and tourism, and it is home to several small businesses, including restaurants, stores, and a winery. The village has a population of 1,000 people, with a median household income of $41,250 and a median family income of $50,000.
Common Questions
What is Per Capita Income in Clifton?
Per Capita income in Clifton is $43,689.
What is the Median Family Income in Clifton?
Median Family Income in Clifton is $93,125.
What is the Median Household income in Clifton?
Median Household Income in Clifton is $75,750.
What is Income or Wage Gap in Clifton?
Income or Wage Gap in Clifton is 63.7%.
Women in Clifton earn 36.3 cents for every dollar earned by a man.
What is Inequality or Gini Index in Clifton?
Inequality or Gini Index in Clifton is 0.27.
What is the Total Population of Clifton?
Total Population of Clifton is 141.
What is the Total Male Population of Clifton?
Total Male Population of Clifton is 91.
What is the Total Female Population of Clifton?
Total Female Population of Clifton is 50.
What is the Ratio of Males per 100 Females in Clifton?
There are 182.00 Males per 100 Females in Clifton.
What is the Ratio of Females per 100 Males in Clifton?
There are 54.95 Females per 100 Males in Clifton.
What is the Median Population Age in Clifton?
Median Population Age in Clifton is 44.2 Years.
What is the Average Family Size in Clifton
Average Family Size in Clifton is 3.1 People.
What is the Average Household Size in Clifton
Average Household Size in Clifton is 2.4 People.
How Large is the Labor Force in Clifton?
There are 104 People in the Labor Forcein in Clifton.
What is the Percentage of People in the Labor Force in Clifton?
80.6% of People are in the Labor Force in Clifton.
What is the Unemployment Rate in Clifton?
Unemployment Rate in Clifton is 1.0%.