Cities with the Lowest Population Density in Ohio
RELATED REPORTS & OPTIONS
Lowest Population Density
Ohio
Compare Cities
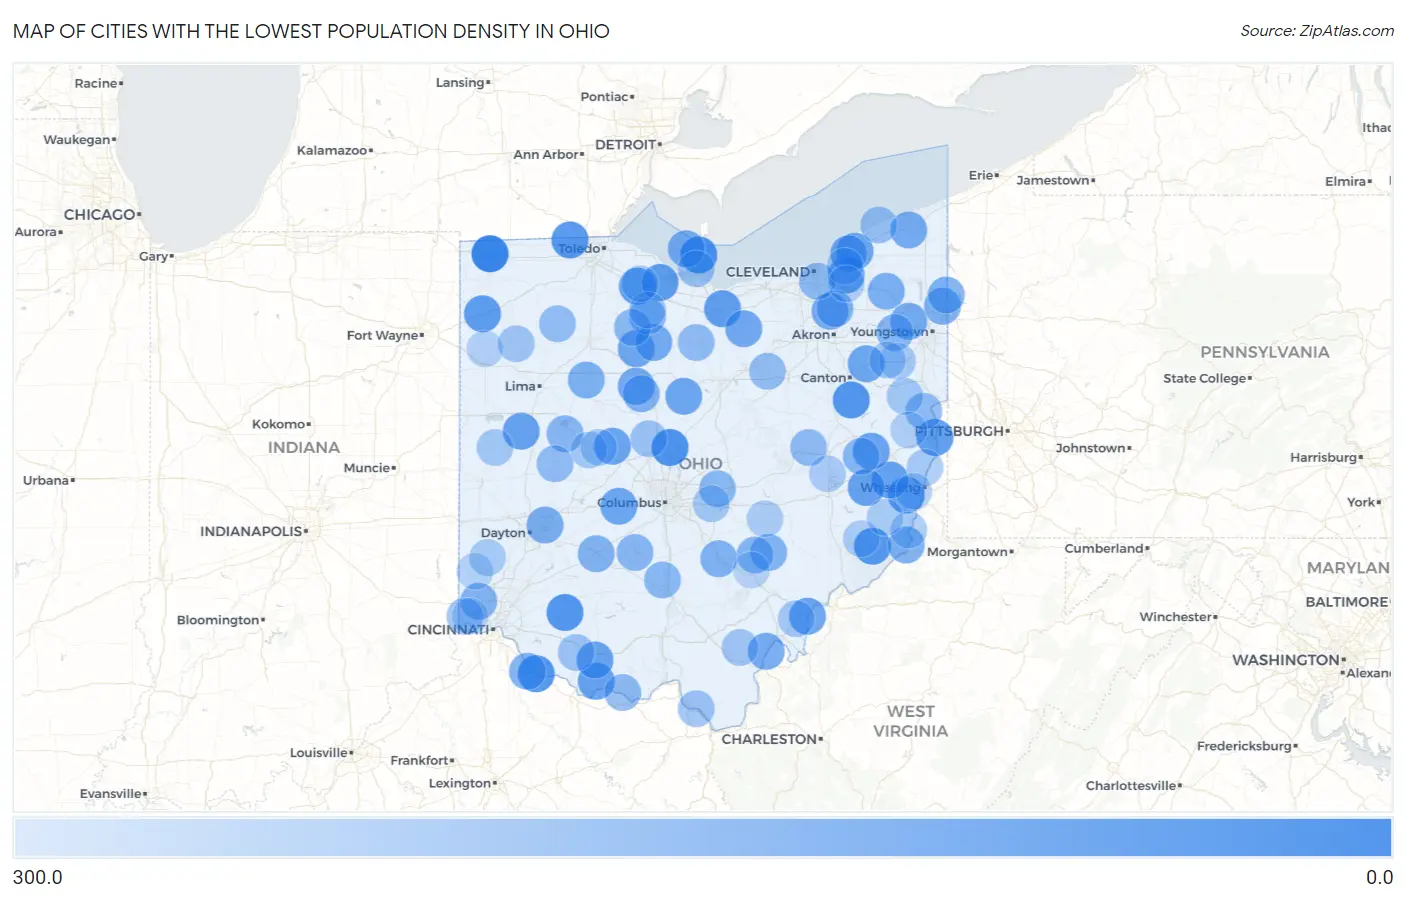
Map of Cities with the Lowest Population Density in Ohio
300.0
0.0
Cities with the Lowest Population Density in Ohio
| City | People / Sq Mi | vs State | vs National | |
| 1. | Holiday City | 7.0 | 288.2(-281)#1 | 0.0(+6.99)#259 |
| 2. | Kelleys Island | 50.2 | 288.2(-238)#2 | 0.0(+50.2)#1,598 |
| 3. | Kilbourne | 56.2 | 288.2(-232)#3 | 0.0(+56.2)#1,760 |
| 4. | Sandyville | 62.3 | 288.2(-226)#4 | 0.0(+62.3)#1,921 |
| 5. | St Martin | 69.8 | 288.2(-218)#5 | 0.0(+69.8)#2,123 |
| 6. | Chilo | 70.9 | 288.2(-217)#6 | 0.0(+70.9)#2,165 |
| 7. | Berkey | 73.3 | 288.2(-215)#7 | 0.0(+73.3)#2,228 |
| 8. | Graysville | 76.5 | 288.2(-212)#8 | 0.0(+76.5)#2,341 |
| 9. | Hessville | 86.5 | 288.2(-202)#9 | 0.0(+86.5)#2,615 |
| 10. | Glencoe | 91.3 | 288.2(-197)#10 | 0.0(+91.3)#2,727 |
| 11. | Pottery Addition | 91.4 | 288.2(-197)#11 | 0.0(+91.4)#2,731 |
| 12. | Wightmans Grove | 92.2 | 288.2(-196)#12 | 0.0(+92.2)#2,752 |
| 13. | Cecil | 93.1 | 288.2(-195)#13 | 0.0(+93.1)#2,782 |
| 14. | Collins | 95.7 | 288.2(-193)#14 | 0.0(+95.7)#2,848 |
| 15. | Hunting Valley | 100.0 | 288.2(-188)#15 | 0.0(+100.0)#2,952 |
| 16. | Lafferty | 104.4 | 288.2(-184)#16 | 0.0(+104)#3,072 |
| 17. | Bentonville | 109.1 | 288.2(-179)#17 | 0.0(+109)#3,202 |
| 18. | Fairview | 109.9 | 288.2(-178)#18 | 0.0(+110)#3,220 |
| 19. | Kettlersville | 113.4 | 288.2(-175)#19 | 0.0(+113)#3,304 |
| 20. | Hockingport | 115.2 | 288.2(-173)#20 | 0.0(+115)#3,345 |
| 21. | Cherry Fork | 116.1 | 288.2(-172)#21 | 0.0(+116)#3,365 |
| 22. | Raymond | 118.4 | 288.2(-170)#22 | 0.0(+118)#3,424 |
| 23. | Kirtland Hills | 120.3 | 288.2(-168)#23 | 0.0(+120)#3,462 |
| 24. | Deersville | 122.0 | 288.2(-166)#24 | 0.0(+122)#3,504 |
| 25. | Harrisburg | 126.9 | 288.2(-161)#25 | 0.0(+127)#3,608 |
| 26. | Iberia | 126.9 | 288.2(-161)#26 | 0.0(+127)#3,610 |
| 27. | Lafayette | 127.1 | 288.2(-161)#27 | 0.0(+127)#3,615 |
| 28. | Mccutchenville | 128.3 | 288.2(-160)#28 | 0.0(+128)#3,647 |
| 29. | Waite Hill | 130.7 | 288.2(-158)#29 | 0.0(+131)#3,709 |
| 30. | Harpster | 132.6 | 288.2(-156)#30 | 0.0(+133)#3,753 |
| 31. | Rochester | 136.1 | 288.2(-152)#31 | 0.0(+136)#3,829 |
| 32. | Melmore | 139.6 | 288.2(-149)#32 | 0.0(+140)#3,900 |
| 33. | Peninsula | 143.2 | 288.2(-145)#33 | 0.0(+143)#3,981 |
| 34. | Lordstown | 143.6 | 288.2(-145)#34 | 0.0(+144)#3,996 |
| 35. | Austinburg | 143.9 | 288.2(-144)#35 | 0.0(+144)#4,004 |
| 36. | Put In Bay | 146.1 | 288.2(-142)#36 | 0.0(+146)#4,051 |
| 37. | Cheshire | 146.1 | 288.2(-142)#37 | 0.0(+146)#4,052 |
| 38. | Wright Patterson Afb | 155.5 | 288.2(-133)#38 | 0.0(+155)#4,266 |
| 39. | Hannibal | 158.5 | 288.2(-130)#39 | 0.0(+158)#4,343 |
| 40. | Parkman | 158.9 | 288.2(-129)#40 | 0.0(+159)#4,353 |
| 41. | Yankee Lake | 159.4 | 288.2(-129)#41 | 0.0(+159)#4,361 |
| 42. | Orangeville | 163.6 | 288.2(-125)#42 | 0.0(+164)#4,450 |
| 43. | Dola | 163.8 | 288.2(-124)#43 | 0.0(+164)#4,462 |
| 44. | Neville | 164.5 | 288.2(-124)#44 | 0.0(+165)#4,492 |
| 45. | Rockbridge | 168.2 | 288.2(-120)#45 | 0.0(+168)#4,576 |
| 46. | Morral | 170.4 | 288.2(-118)#46 | 0.0(+170)#4,629 |
| 47. | Octa | 172.3 | 288.2(-116)#47 | 0.0(+172)#4,669 |
| 48. | Dunlap | 173.5 | 288.2(-115)#48 | 0.0(+174)#4,693 |
| 49. | Rendville | 175.8 | 288.2(-112)#49 | 0.0(+176)#4,747 |
| 50. | Boston Heights | 177.9 | 288.2(-110)#50 | 0.0(+178)#4,789 |
| 51. | Tippecanoe | 181.1 | 288.2(-107)#51 | 0.0(+181)#4,872 |
| 52. | Shawnee | 182.0 | 288.2(-106)#52 | 0.0(+182)#4,900 |
| 53. | Lewistown | 186.5 | 288.2(-102)#53 | 0.0(+186)#4,999 |
| 54. | Pancoastburg | 187.6 | 288.2(-101)#54 | 0.0(+188)#5,025 |
| 55. | Fort Seneca | 188.5 | 288.2(-99.7)#55 | 0.0(+188)#5,049 |
| 56. | Lake Milton | 188.8 | 288.2(-99.4)#56 | 0.0(+189)#5,053 |
| 57. | Bascom | 189.8 | 288.2(-98.4)#57 | 0.0(+190)#5,070 |
| 58. | Granville South | 190.4 | 288.2(-97.7)#58 | 0.0(+190)#5,084 |
| 59. | Andersonville | 190.7 | 288.2(-97.4)#59 | 0.0(+191)#5,090 |
| 60. | Cuyahoga Heights | 195.3 | 288.2(-92.9)#60 | 0.0(+195)#5,192 |
| 61. | Fresno | 200.0 | 288.2(-88.2)#61 | 0.0(+200)#5,290 |
| 62. | Rome Stout | 200.4 | 288.2(-87.8)#62 | 0.0(+200)#5,294 |
| 63. | Irondale | 202.1 | 288.2(-86.1)#63 | 0.0(+202)#5,326 |
| 64. | Celeryville | 206.4 | 288.2(-81.8)#64 | 0.0(+206)#5,421 |
| 65. | Rosewood | 207.1 | 288.2(-81.1)#65 | 0.0(+207)#5,432 |
| 66. | New Pittsburg | 211.2 | 288.2(-77.0)#66 | 0.0(+211)#5,519 |
| 67. | Belmore | 211.4 | 288.2(-76.8)#67 | 0.0(+211)#5,523 |
| 68. | North Perry | 219.9 | 288.2(-68.2)#68 | 0.0(+220)#5,704 |
| 69. | Hooven | 220.8 | 288.2(-67.4)#69 | 0.0(+221)#5,721 |
| 70. | Hanging Rock | 226.5 | 288.2(-61.7)#70 | 0.0(+227)#5,828 |
| 71. | Lake Waynoka | 230.9 | 288.2(-57.3)#71 | 0.0(+231)#5,907 |
| 72. | Marblehead | 231.8 | 288.2(-56.4)#72 | 0.0(+232)#5,930 |
| 73. | Radnor | 232.0 | 288.2(-56.2)#73 | 0.0(+232)#5,937 |
| 74. | Cloverdale | 237.1 | 288.2(-51.1)#74 | 0.0(+237)#6,029 |
| 75. | Gates Mills | 237.2 | 288.2(-51.0)#75 | 0.0(+237)#6,030 |
| 76. | Vinton | 238.2 | 288.2(-50.0)#76 | 0.0(+238)#6,052 |
| 77. | Old Fort | 239.5 | 288.2(-48.7)#77 | 0.0(+239)#6,081 |
| 78. | Tuppers Plains | 246.9 | 288.2(-41.2)#78 | 0.0(+247)#6,222 |
| 79. | Summitville | 247.8 | 288.2(-40.4)#79 | 0.0(+248)#6,235 |
| 80. | Kirkersville | 248.0 | 288.2(-40.1)#80 | 0.0(+248)#6,245 |
| 81. | Yorkshire | 248.6 | 288.2(-39.6)#81 | 0.0(+249)#6,256 |
| 82. | Valley Hi | 251.7 | 288.2(-36.5)#82 | 0.0(+252)#6,316 |
| 83. | Damascus | 251.8 | 288.2(-36.4)#83 | 0.0(+252)#6,319 |
| 84. | Clarington | 255.4 | 288.2(-32.8)#84 | 0.0(+255)#6,382 |
| 85. | Connorville | 255.5 | 288.2(-32.7)#85 | 0.0(+255)#6,383 |
| 86. | East Liberty | 256.5 | 288.2(-31.7)#86 | 0.0(+256)#6,408 |
| 87. | Maple Ridge | 258.7 | 288.2(-29.4)#87 | 0.0(+259)#6,463 |
| 88. | West Elkton | 259.0 | 288.2(-29.1)#88 | 0.0(+259)#6,465 |
| 89. | Kimbolton | 261.5 | 288.2(-26.7)#89 | 0.0(+262)#6,519 |
| 90. | Stafford | 265.4 | 288.2(-22.8)#90 | 0.0(+265)#6,589 |
| 91. | Lindsey | 266.2 | 288.2(-22.0)#91 | 0.0(+266)#6,602 |
| 92. | Wilson | 268.2 | 288.2(-20.0)#92 | 0.0(+268)#6,649 |
| 93. | East Fultonham | 269.6 | 288.2(-18.5)#93 | 0.0(+270)#6,685 |
| 94. | Bentleyville | 270.6 | 288.2(-17.5)#94 | 0.0(+271)#6,701 |
| 95. | East Springfield | 272.8 | 288.2(-15.4)#95 | 0.0(+273)#6,742 |
| 96. | Neffs | 272.8 | 288.2(-15.4)#96 | 0.0(+273)#6,743 |
| 97. | Scott | 280.3 | 288.2(-7.92)#97 | 0.0(+280)#6,881 |
| 98. | Darrtown | 288.6 | 288.2(+0.418)#98 | 0.0(+289)#7,021 |
| 99. | Carbon Hill | 290.9 | 288.2(+2.70)#99 | 0.0(+291)#7,071 |
| 100. | Grandview | 291.4 | 288.2(+3.19)#100 | 0.0(+291)#7,082 |
Common Questions
What are the Top 10 Cities with the Lowest Population Density in Ohio?
Top 10 Cities with the Lowest Population Density in Ohio are:
#1
7.0
#2
50.2
#3
56.2
#4
62.3
#5
69.8
#6
70.9
#7
73.3
#8
76.5
#9
86.5
#10
91.3
What city has the Lowest Population Density in Ohio?
Holiday City has the Lowest Population Density in Ohio with 7.0.
What is the Population Density in the State of Ohio?
Population Density in Ohio is 288.2.