Granville South, OH Map & Demographics
Granville South Map
Granville South Overview
$52,964
PER CAPITA INCOME
$141,786
AVG FAMILY INCOME
$127,083
AVG HOUSEHOLD INCOME
16.1%
WAGE / INCOME GAP [ % ]
83.9¢/ $1
WAGE / INCOME GAP [ $ ]
0.30
INEQUALITY / GINI INDEX
1,168
TOTAL POPULATION
590
MALE POPULATION
578
FEMALE POPULATION
102.08
MALES / 100 FEMALES
97.97
FEMALES / 100 MALES
43.2
MEDIAN AGE
3.0
AVG FAMILY SIZE
2.5
AVG HOUSEHOLD SIZE
565
LABOR FORCE [ PEOPLE ]
58.1%
PERCENT IN LABOR FORCE
Income in Granville South
Income Overview in Granville South
Per Capita Income in Granville South is $52,964, while median incomes of families and households are $141,786 and $127,083 respectively.
| Characteristic | Number | Measure |
| Per Capita Income | 1,168 | $52,964 |
| Median Family Income | 328 | $141,786 |
| Mean Family Income | 328 | $141,039 |
| Median Household Income | 466 | $127,083 |
| Mean Household Income | 466 | $129,900 |
| Income Deficit | 328 | $0 |
| Wage / Income Gap (%) | 1,168 | 16.14% |
| Wage / Income Gap ($) | 1,168 | 83.86¢ per $1 |
| Gini / Inequality Index | 1,168 | 0.30 |
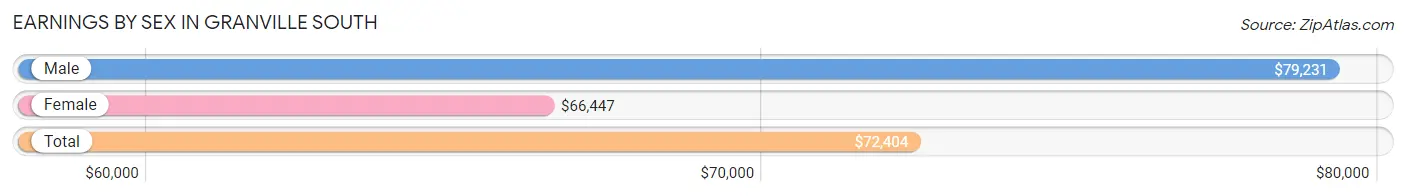
Earnings by Sex in Granville South
Average Earnings in Granville South are $72,404, $79,231 for men and $66,447 for women, a difference of 16.1%.
| Sex | Number | Average Earnings |
| Male | 352 (56.4%) | $79,231 |
| Female | 272 (43.6%) | $66,447 |
| Total | 624 (100.0%) | $72,404 |
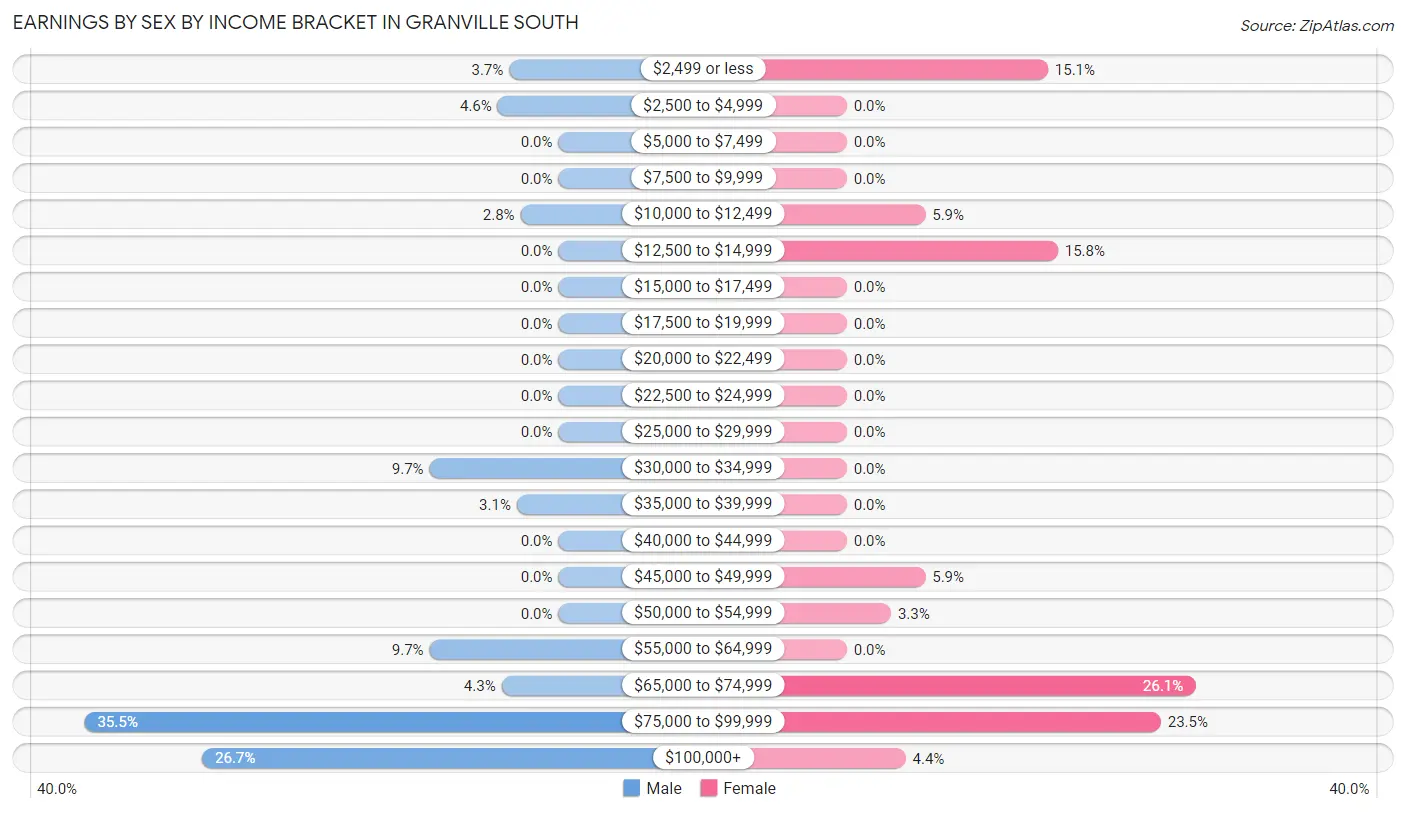
Earnings by Sex by Income Bracket in Granville South
The most common earnings brackets in Granville South are $75,000 to $99,999 for men (125 | 35.5%) and $65,000 to $74,999 for women (71 | 26.1%).
| Income | Male | Female |
| $2,499 or less | 13 (3.7%) | 41 (15.1%) |
| $2,500 to $4,999 | 16 (4.5%) | 0 (0.0%) |
| $5,000 to $7,499 | 0 (0.0%) | 0 (0.0%) |
| $7,500 to $9,999 | 0 (0.0%) | 0 (0.0%) |
| $10,000 to $12,499 | 10 (2.8%) | 16 (5.9%) |
| $12,500 to $14,999 | 0 (0.0%) | 43 (15.8%) |
| $15,000 to $17,499 | 0 (0.0%) | 0 (0.0%) |
| $17,500 to $19,999 | 0 (0.0%) | 0 (0.0%) |
| $20,000 to $22,499 | 0 (0.0%) | 0 (0.0%) |
| $22,500 to $24,999 | 0 (0.0%) | 0 (0.0%) |
| $25,000 to $29,999 | 0 (0.0%) | 0 (0.0%) |
| $30,000 to $34,999 | 34 (9.7%) | 0 (0.0%) |
| $35,000 to $39,999 | 11 (3.1%) | 0 (0.0%) |
| $40,000 to $44,999 | 0 (0.0%) | 0 (0.0%) |
| $45,000 to $49,999 | 0 (0.0%) | 16 (5.9%) |
| $50,000 to $54,999 | 0 (0.0%) | 9 (3.3%) |
| $55,000 to $64,999 | 34 (9.7%) | 0 (0.0%) |
| $65,000 to $74,999 | 15 (4.3%) | 71 (26.1%) |
| $75,000 to $99,999 | 125 (35.5%) | 64 (23.5%) |
| $100,000+ | 94 (26.7%) | 12 (4.4%) |
| Total | 352 (100.0%) | 272 (100.0%) |
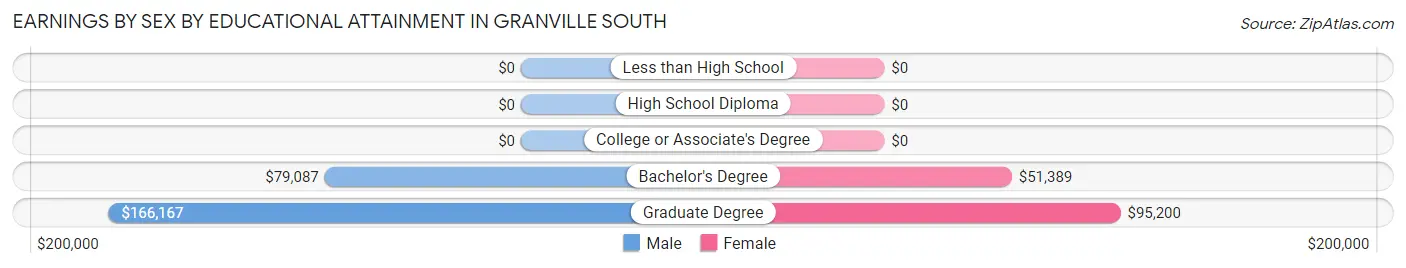
Earnings by Sex by Educational Attainment in Granville South
Average earnings in Granville South are $79,928 for men and $70,240 for women, a difference of 12.1%. Men with an educational attainment of graduate degree enjoy the highest average annual earnings of $166,167, while those with bachelor's degree education earn the least with $79,087. Women with an educational attainment of graduate degree earn the most with the average annual earnings of $95,200, while those with bachelor's degree education have the smallest earnings of $51,389.
| Educational Attainment | Male Income | Female Income |
| Less than High School | - | - |
| High School Diploma | - | - |
| College or Associate's Degree | - | - |
| Bachelor's Degree | $79,087 | $51,389 |
| Graduate Degree | $166,167 | $95,200 |
| Total | $79,928 | $70,240 |
Family Income in Granville South
Family Income Brackets in Granville South
According to the Granville South family income data, there are 171 families falling into the $100,000 to $149,999 income range, which is the most common income bracket and makes up 52.1% of all families.
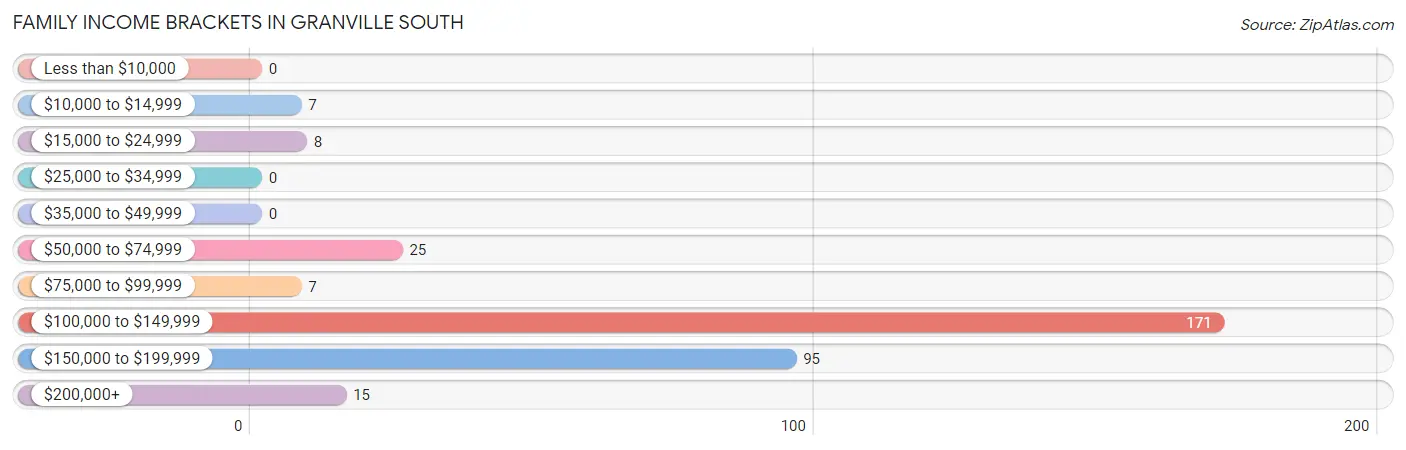
| Income Bracket | # Families | % Families |
| Less than $10,000 | 0 | 0.0% |
| $10,000 to $14,999 | 7 | 2.1% |
| $15,000 to $24,999 | 8 | 2.4% |
| $25,000 to $34,999 | 0 | 0.0% |
| $35,000 to $49,999 | 0 | 0.0% |
| $50,000 to $74,999 | 25 | 7.6% |
| $75,000 to $99,999 | 7 | 2.1% |
| $100,000 to $149,999 | 171 | 52.1% |
| $150,000 to $199,999 | 95 | 29.0% |
| $200,000+ | 15 | 4.6% |
Family Income by Famaliy Size in Granville South
2-person families (198 | 60.4%) account for the highest median family income in Granville South with $147,692 per family, while 2-person families (198 | 60.4%) have the highest median income of $73,846 per family member.
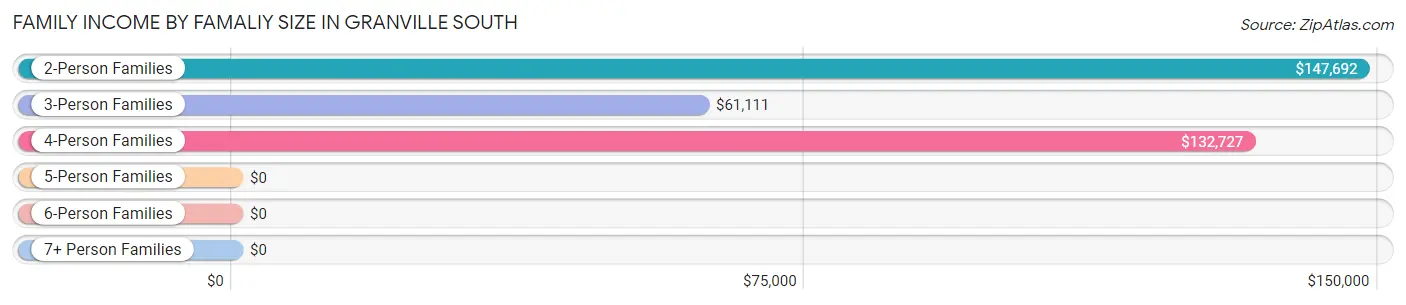
| Income Bracket | # Families | Median Income |
| 2-Person Families | 198 (60.4%) | $147,692 |
| 3-Person Families | 24 (7.3%) | $61,111 |
| 4-Person Families | 74 (22.6%) | $132,727 |
| 5-Person Families | 32 (9.8%) | $0 |
| 6-Person Families | 0 (0.0%) | $0 |
| 7+ Person Families | 0 (0.0%) | $0 |
| Total | 328 (100.0%) | $141,786 |
Family Income by Number of Earners in Granville South
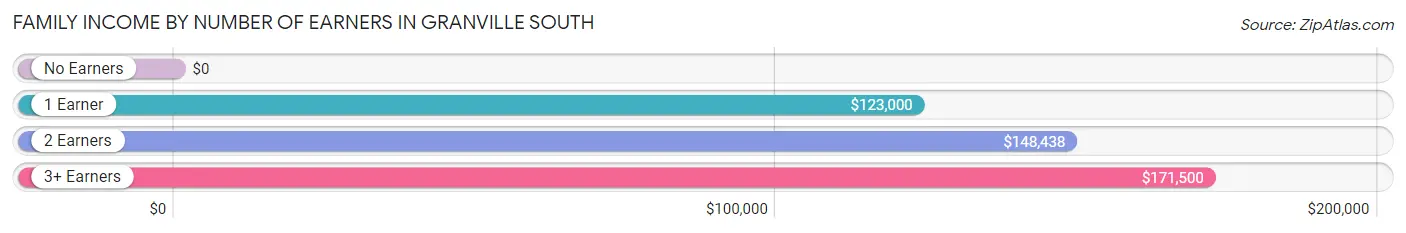
| Number of Earners | # Families | Median Income |
| No Earners | 37 (11.3%) | $0 |
| 1 Earner | 98 (29.9%) | $123,000 |
| 2 Earners | 157 (47.9%) | $148,438 |
| 3+ Earners | 36 (11.0%) | $171,500 |
| Total | 328 (100.0%) | $141,786 |
Household Income in Granville South
Household Income Brackets in Granville South
With 179 households falling in the category, the $100,000 to $149,999 income range is the most frequent in Granville South, accounting for 38.4% of all households.
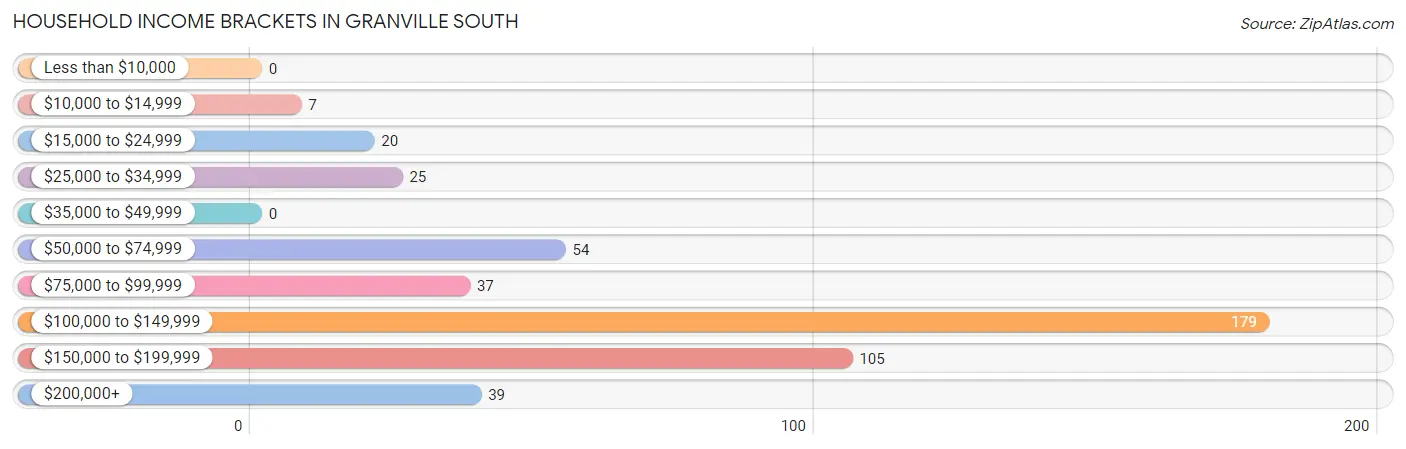
| Income Bracket | # Households | % Households |
| Less than $10,000 | 0 | 0.0% |
| $10,000 to $14,999 | 7 | 1.5% |
| $15,000 to $24,999 | 20 | 4.3% |
| $25,000 to $34,999 | 25 | 5.4% |
| $35,000 to $49,999 | 0 | 0.0% |
| $50,000 to $74,999 | 54 | 11.6% |
| $75,000 to $99,999 | 37 | 7.9% |
| $100,000 to $149,999 | 179 | 38.4% |
| $150,000 to $199,999 | 105 | 22.5% |
| $200,000+ | 39 | 8.4% |
Household Income by Householder Age in Granville South
The median household income in Granville South is $127,083, with the highest median household income of $148,077 found in the 25 to 44 years age bracket for the primary householder. A total of 144 households (30.9%) fall into this category.
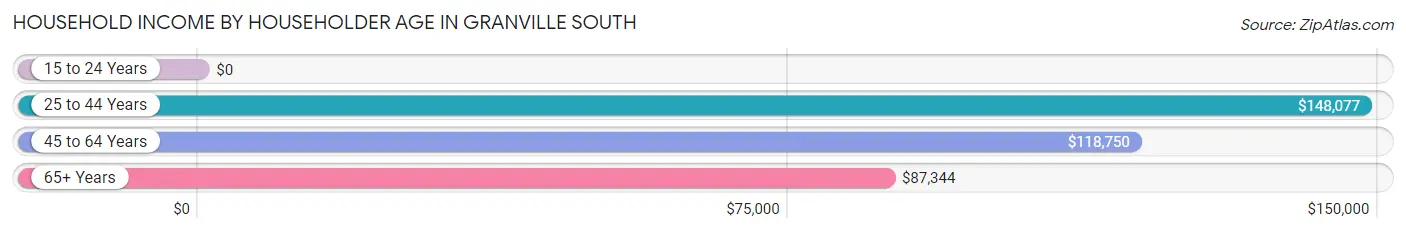
| Income Bracket | # Households | Median Income |
| 15 to 24 Years | 0 (0.0%) | $0 |
| 25 to 44 Years | 144 (30.9%) | $148,077 |
| 45 to 64 Years | 124 (26.6%) | $118,750 |
| 65+ Years | 198 (42.5%) | $87,344 |
| Total | 466 (100.0%) | $127,083 |
Poverty in Granville South
Income Below Poverty by Sex and Age in Granville South
With 4.4% poverty level for males and 8.9% for females among the residents of Granville South, 55 to 64 year old males and 25 to 34 year old females are the most vulnerable to poverty, with 18 males (30.5%) and 26 females (56.5%) in their respective age groups living below the poverty level.
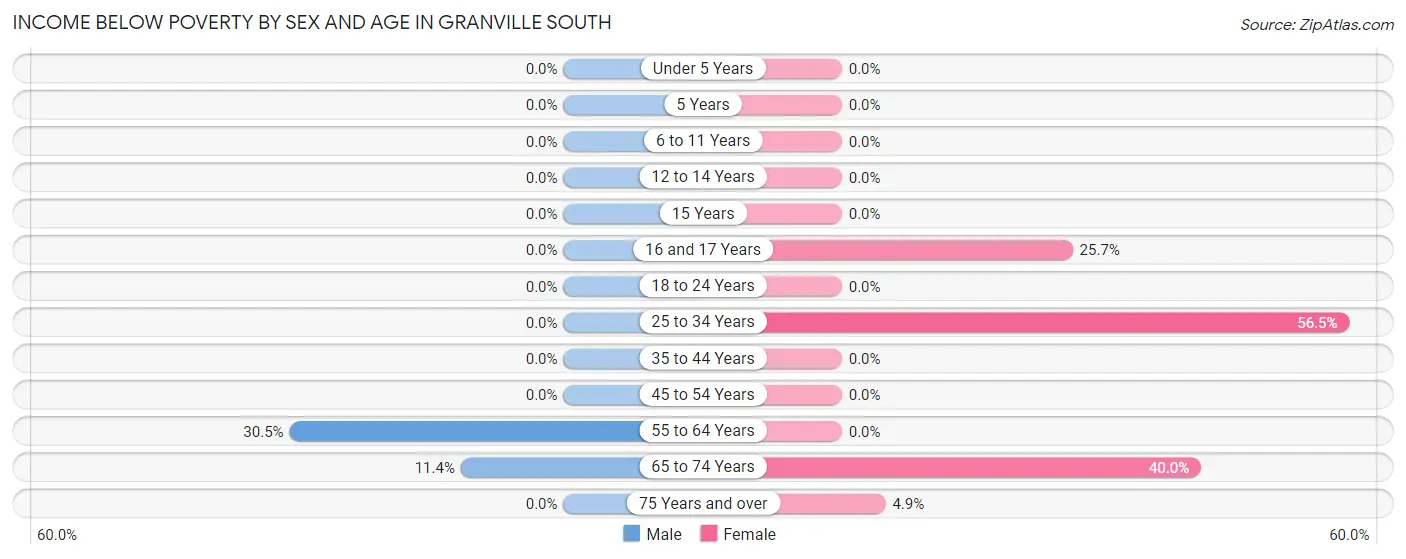
| Age Bracket | Male | Female |
| Under 5 Years | 0 (0.0%) | 0 (0.0%) |
| 5 Years | 0 (0.0%) | 0 (0.0%) |
| 6 to 11 Years | 0 (0.0%) | 0 (0.0%) |
| 12 to 14 Years | 0 (0.0%) | 0 (0.0%) |
| 15 Years | 0 (0.0%) | 0 (0.0%) |
| 16 and 17 Years | 0 (0.0%) | 9 (25.7%) |
| 18 to 24 Years | 0 (0.0%) | 0 (0.0%) |
| 25 to 34 Years | 0 (0.0%) | 26 (56.5%) |
| 35 to 44 Years | 0 (0.0%) | 0 (0.0%) |
| 45 to 54 Years | 0 (0.0%) | 0 (0.0%) |
| 55 to 64 Years | 18 (30.5%) | 0 (0.0%) |
| 65 to 74 Years | 8 (11.4%) | 8 (40.0%) |
| 75 Years and over | 0 (0.0%) | 7 (4.9%) |
| Total | 26 (4.4%) | 50 (8.9%) |
Income Above Poverty by Sex and Age in Granville South
According to the poverty statistics in Granville South, males aged under 5 years and females aged under 5 years are the age groups that are most secure financially, with 100.0% of males and 100.0% of females in these age groups living above the poverty line.
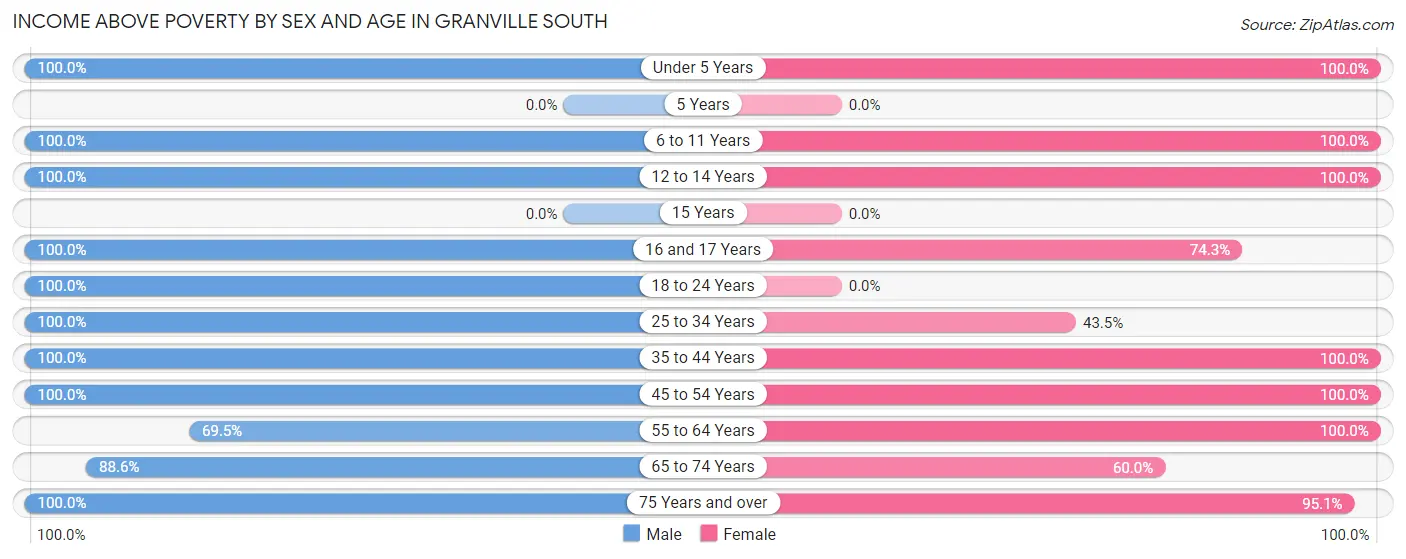
| Age Bracket | Male | Female |
| Under 5 Years | 21 (100.0%) | 30 (100.0%) |
| 5 Years | 0 (0.0%) | 0 (0.0%) |
| 6 to 11 Years | 70 (100.0%) | 29 (100.0%) |
| 12 to 14 Years | 31 (100.0%) | 14 (100.0%) |
| 15 Years | 0 (0.0%) | 0 (0.0%) |
| 16 and 17 Years | 53 (100.0%) | 26 (74.3%) |
| 18 to 24 Years | 33 (100.0%) | 0 (0.0%) |
| 25 to 34 Years | 40 (100.0%) | 20 (43.5%) |
| 35 to 44 Years | 129 (100.0%) | 113 (100.0%) |
| 45 to 54 Years | 52 (100.0%) | 23 (100.0%) |
| 55 to 64 Years | 41 (69.5%) | 105 (100.0%) |
| 65 to 74 Years | 62 (88.6%) | 12 (60.0%) |
| 75 Years and over | 28 (100.0%) | 137 (95.1%) |
| Total | 560 (95.6%) | 509 (91.1%) |
Income Below Poverty Among Married-Couple Families in Granville South
The poverty statistics for married-couple families in Granville South show that 2.9% or 8 of the total 272 families live below the poverty line. Families with 1 or 2 children have the highest poverty rate of 8.2%, comprising of 8 families. On the other hand, families with no children have the lowest poverty rate of 0.0%, which includes 0 families.
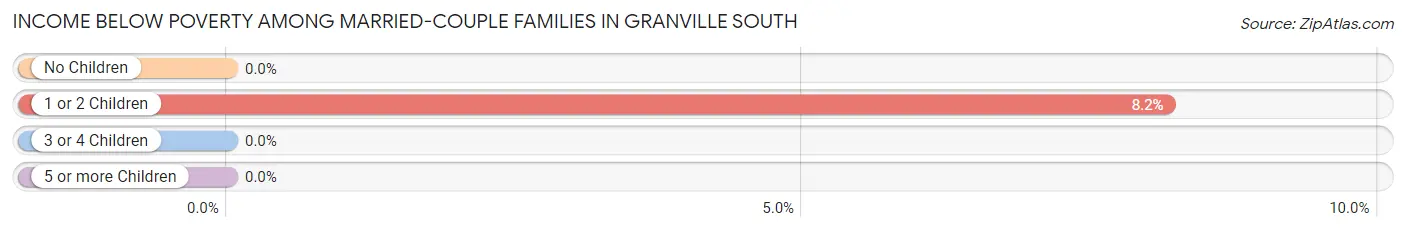
| Children | Above Poverty | Below Poverty |
| No Children | 142 (100.0%) | 0 (0.0%) |
| 1 or 2 Children | 90 (91.8%) | 8 (8.2%) |
| 3 or 4 Children | 32 (100.0%) | 0 (0.0%) |
| 5 or more Children | 0 (0.0%) | 0 (0.0%) |
| Total | 264 (97.1%) | 8 (2.9%) |
Income Below Poverty Among Single-Parent Households in Granville South
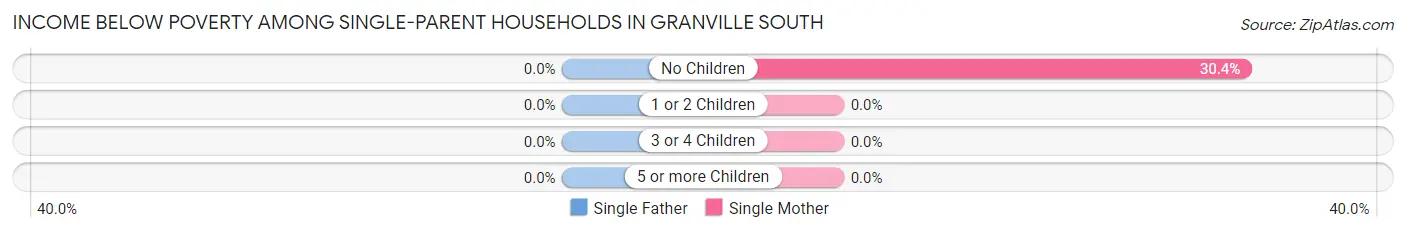
| Children | Single Father | Single Mother |
| No Children | 0 (0.0%) | 7 (30.4%) |
| 1 or 2 Children | 0 (0.0%) | 0 (0.0%) |
| 3 or 4 Children | 0 (0.0%) | 0 (0.0%) |
| 5 or more Children | 0 (0.0%) | 0 (0.0%) |
| Total | 0 (0.0%) | 7 (30.4%) |
Income Below Poverty Among Married-Couple vs Single-Parent Households in Granville South
The poverty data for Granville South shows that 8 of the married-couple family households (2.9%) and 7 of the single-parent households (12.5%) are living below the poverty level. Within the married-couple family households, those with 1 or 2 children have the highest poverty rate, with 8 households (8.2%) falling below the poverty line. Among the single-parent households, those with no children have the highest poverty rate, with 7 household (18.4%) living below poverty.
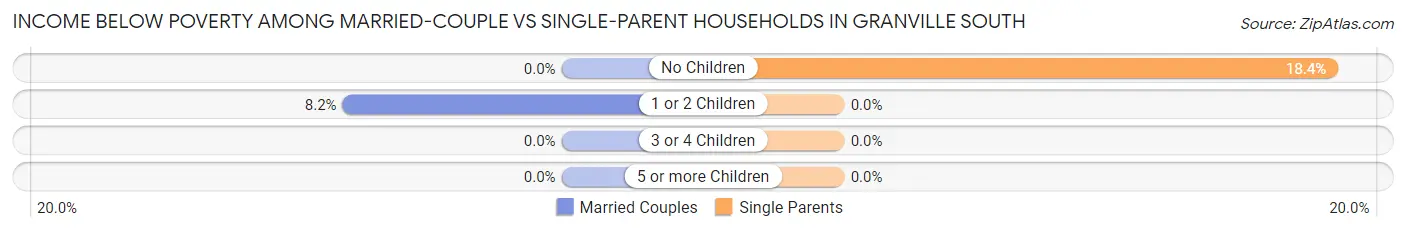
| Children | Married-Couple Families | Single-Parent Households |
| No Children | 0 (0.0%) | 7 (18.4%) |
| 1 or 2 Children | 8 (8.2%) | 0 (0.0%) |
| 3 or 4 Children | 0 (0.0%) | 0 (0.0%) |
| 5 or more Children | 0 (0.0%) | 0 (0.0%) |
| Total | 8 (2.9%) | 7 (12.5%) |
Race in Granville South
The most populous races in Granville South are White / Caucasian (1,146 | 98.1%), Hispanic or Latino (18 | 1.5%), and Asian (17 | 1.5%).
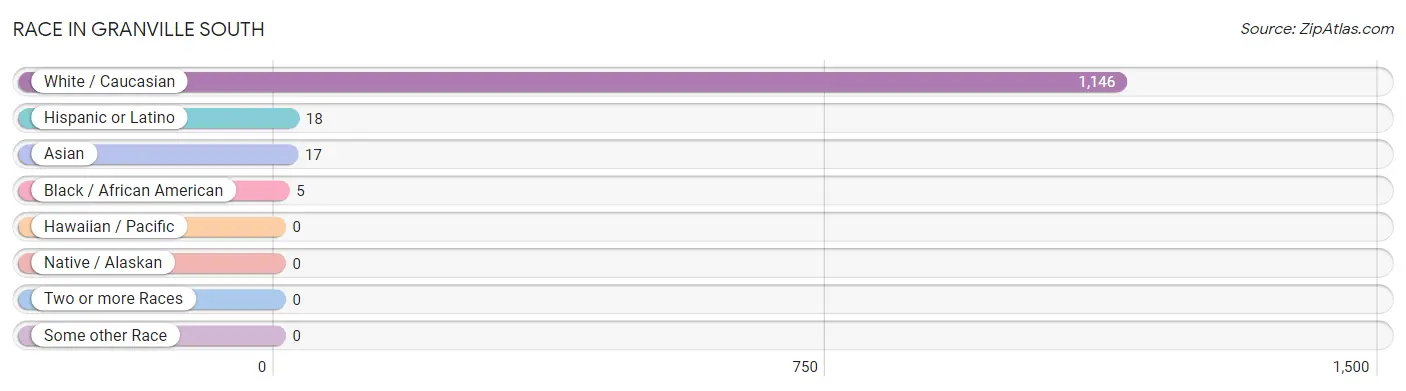
| Race | # Population | % Population |
| Asian | 17 | 1.5% |
| Black / African American | 5 | 0.4% |
| Hawaiian / Pacific | 0 | 0.0% |
| Hispanic or Latino | 18 | 1.5% |
| Native / Alaskan | 0 | 0.0% |
| White / Caucasian | 1,146 | 98.1% |
| Two or more Races | 0 | 0.0% |
| Some other Race | 0 | 0.0% |
| Total | 1,168 | 100.0% |
Ancestry in Granville South
The most populous ancestries reported in Granville South are German (446 | 38.2%), English (318 | 27.2%), Irish (278 | 23.8%), American (71 | 6.1%), and Scottish (65 | 5.6%), together accounting for 100.9% of all Granville South residents.
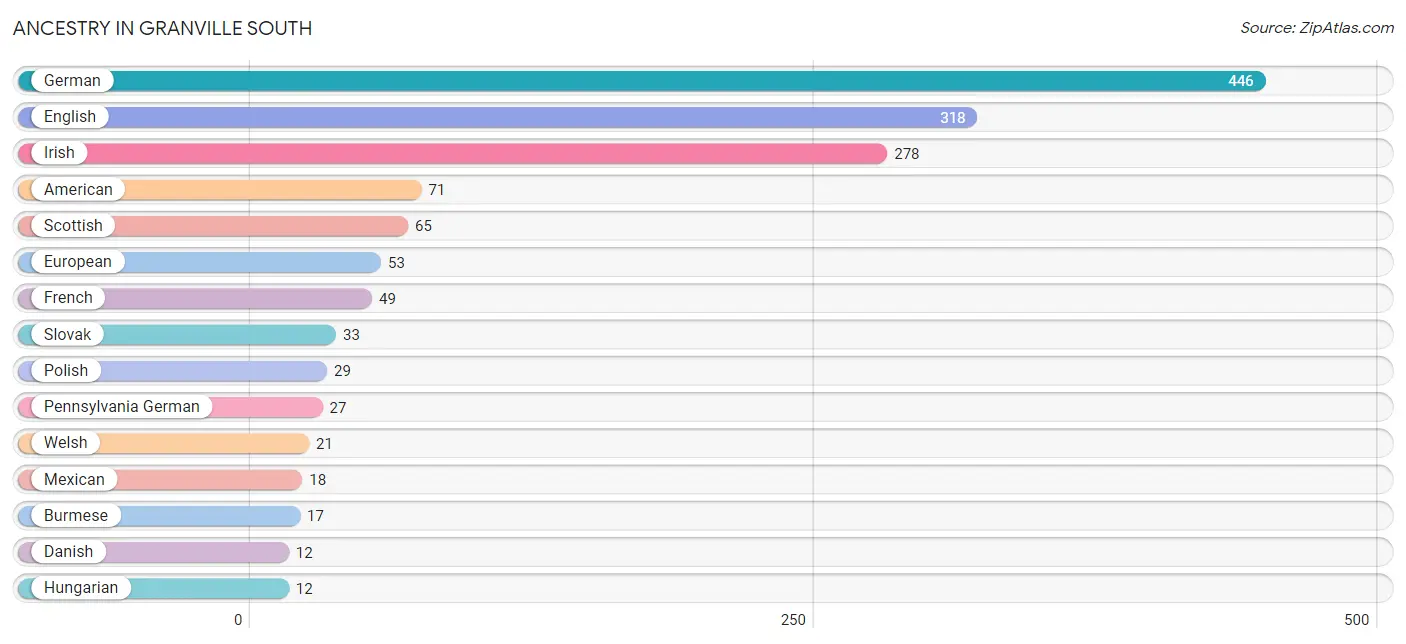
| Ancestry | # Population | % Population |
| American | 71 | 6.1% |
| Burmese | 17 | 1.5% |
| Danish | 12 | 1.0% |
| English | 318 | 27.2% |
| European | 53 | 4.5% |
| French | 49 | 4.2% |
| German | 446 | 38.2% |
| Hungarian | 12 | 1.0% |
| Irish | 278 | 23.8% |
| Mexican | 18 | 1.5% |
| Pennsylvania German | 27 | 2.3% |
| Polish | 29 | 2.5% |
| Romanian | 7 | 0.6% |
| Scotch-Irish | 8 | 0.7% |
| Scottish | 65 | 5.6% |
| Slovak | 33 | 2.8% |
| Swiss | 12 | 1.0% |
| Welsh | 21 | 1.8% | View All 18 Rows |
Immigrants in Granville South
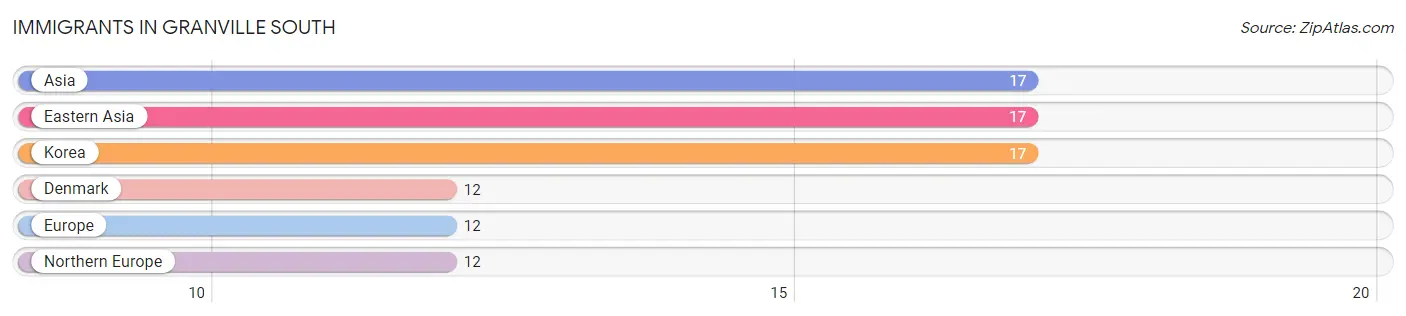
The most numerous immigrant groups reported in Granville South came from Asia (17 | 1.5%), Eastern Asia (17 | 1.5%), Korea (17 | 1.5%), Denmark (12 | 1.0%), and Europe (12 | 1.0%), together accounting for 6.4% of all Granville South residents.
| Immigration Origin | # Population | % Population |
| Asia | 17 | 1.5% |
| Denmark | 12 | 1.0% |
| Eastern Asia | 17 | 1.5% |
| Europe | 12 | 1.0% |
| Korea | 17 | 1.5% |
| Northern Europe | 12 | 1.0% | View All 6 Rows |
Sex and Age in Granville South
Sex and Age in Granville South
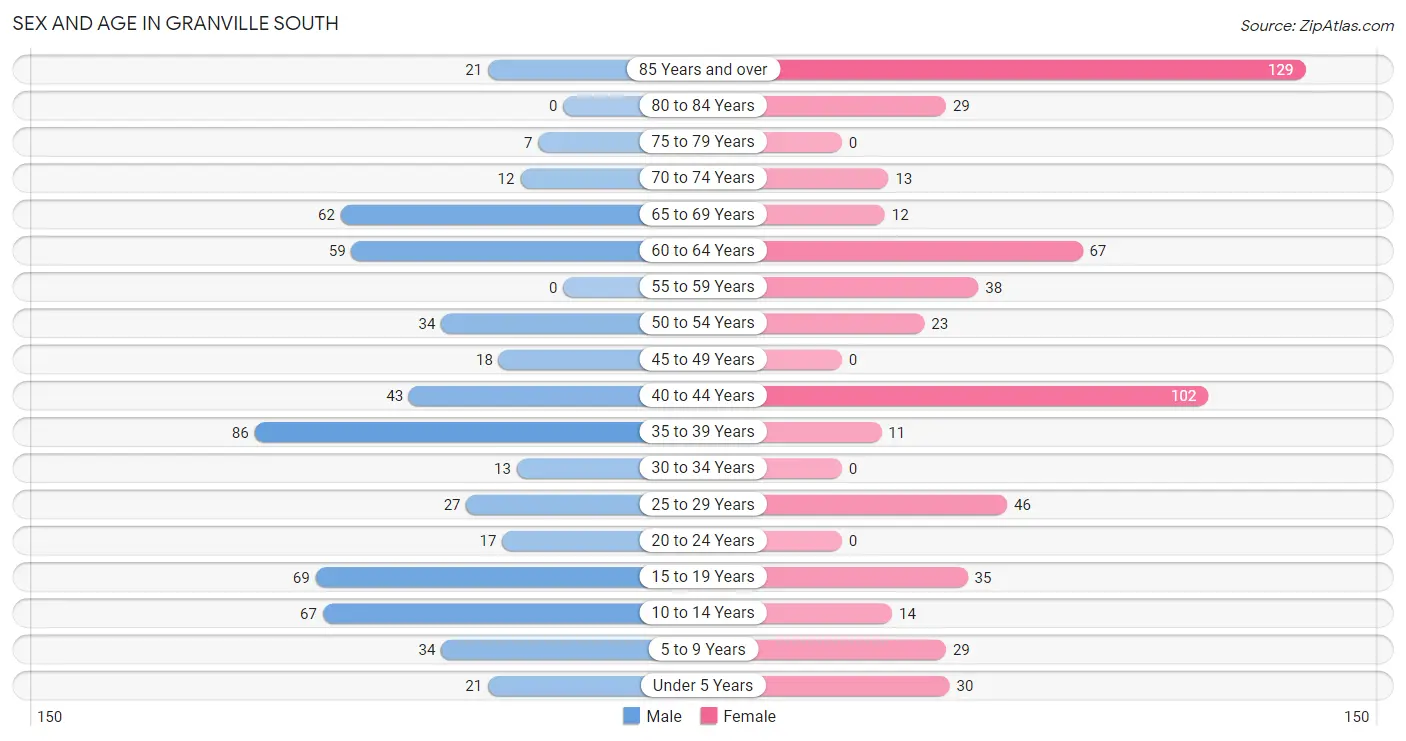
The most populous age groups in Granville South are 35 to 39 Years (86 | 14.6%) for men and 85 Years and over (129 | 22.3%) for women.
| Age Bracket | Male | Female |
| Under 5 Years | 21 (3.6%) | 30 (5.2%) |
| 5 to 9 Years | 34 (5.8%) | 29 (5.0%) |
| 10 to 14 Years | 67 (11.4%) | 14 (2.4%) |
| 15 to 19 Years | 69 (11.7%) | 35 (6.1%) |
| 20 to 24 Years | 17 (2.9%) | 0 (0.0%) |
| 25 to 29 Years | 27 (4.6%) | 46 (8.0%) |
| 30 to 34 Years | 13 (2.2%) | 0 (0.0%) |
| 35 to 39 Years | 86 (14.6%) | 11 (1.9%) |
| 40 to 44 Years | 43 (7.3%) | 102 (17.6%) |
| 45 to 49 Years | 18 (3.0%) | 0 (0.0%) |
| 50 to 54 Years | 34 (5.8%) | 23 (4.0%) |
| 55 to 59 Years | 0 (0.0%) | 38 (6.6%) |
| 60 to 64 Years | 59 (10.0%) | 67 (11.6%) |
| 65 to 69 Years | 62 (10.5%) | 12 (2.1%) |
| 70 to 74 Years | 12 (2.0%) | 13 (2.2%) |
| 75 to 79 Years | 7 (1.2%) | 0 (0.0%) |
| 80 to 84 Years | 0 (0.0%) | 29 (5.0%) |
| 85 Years and over | 21 (3.6%) | 129 (22.3%) |
| Total | 590 (100.0%) | 578 (100.0%) |
Families and Households in Granville South
Median Family Size in Granville South
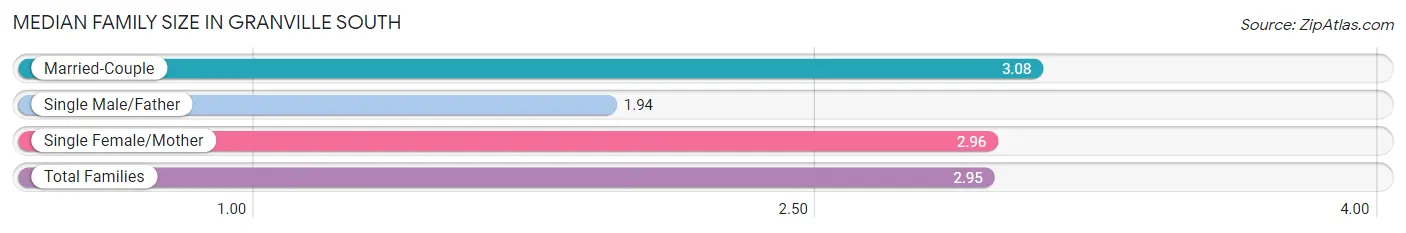
The median family size in Granville South is 2.95 persons per family, with married-couple families (272 | 82.9%) accounting for the largest median family size of 3.08 persons per family. On the other hand, single male/father families (33 | 10.1%) represent the smallest median family size with 1.94 persons per family.
| Family Type | # Families | Family Size |
| Married-Couple | 272 (82.9%) | 3.08 |
| Single Male/Father | 33 (10.1%) | 1.94 |
| Single Female/Mother | 23 (7.0%) | 2.96 |
| Total Families | 328 (100.0%) | 2.95 |
Median Household Size in Granville South
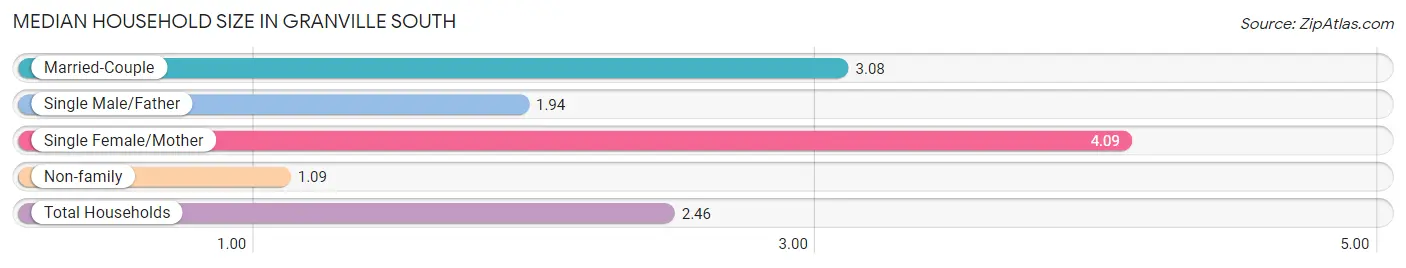
The median household size in Granville South is 2.46 persons per household, with single female/mother households (23 | 4.9%) accounting for the largest median household size of 4.09 persons per household. non-family households (138 | 29.6%) represent the smallest median household size with 1.09 persons per household.
| Household Type | # Households | Household Size |
| Married-Couple | 272 (58.4%) | 3.08 |
| Single Male/Father | 33 (7.1%) | 1.94 |
| Single Female/Mother | 23 (4.9%) | 4.09 |
| Non-family | 138 (29.6%) | 1.09 |
| Total Households | 466 (100.0%) | 2.46 |
Household Size by Marriage Status in Granville South
Out of a total of 466 households in Granville South, 328 (70.4%) are family households, while 138 (29.6%) are nonfamily households. The most numerous type of family households are 2-person households, comprising 182, and the most common type of nonfamily households are 1-person households, comprising 126.
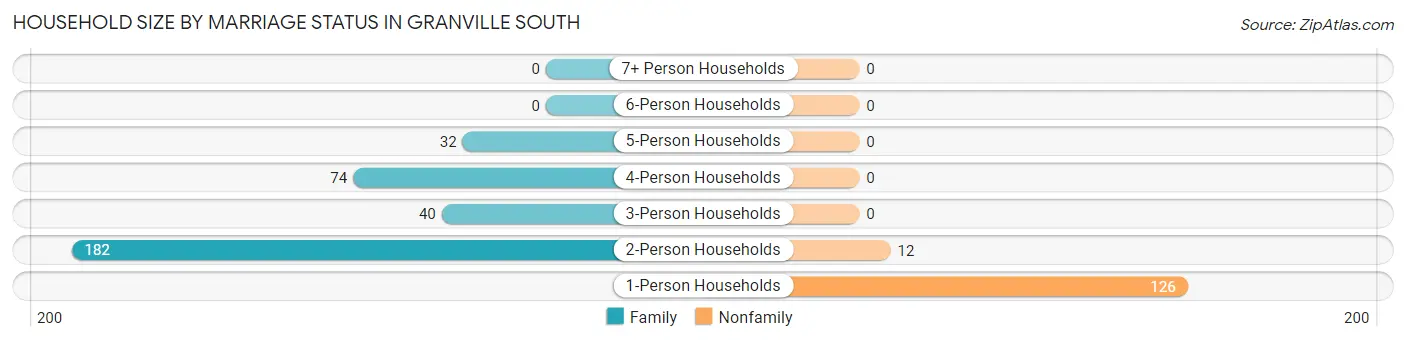
| Household Size | Family Households | Nonfamily Households |
| 1-Person Households | - | 126 (27.0%) |
| 2-Person Households | 182 (39.1%) | 12 (2.6%) |
| 3-Person Households | 40 (8.6%) | 0 (0.0%) |
| 4-Person Households | 74 (15.9%) | 0 (0.0%) |
| 5-Person Households | 32 (6.9%) | 0 (0.0%) |
| 6-Person Households | 0 (0.0%) | 0 (0.0%) |
| 7+ Person Households | 0 (0.0%) | 0 (0.0%) |
| Total | 328 (70.4%) | 138 (29.6%) |
Female Fertility in Granville South
Fertility by Age in Granville South
| Age Bracket | Women with Births | Births / 1,000 Women |
| 15 to 19 years | 0 (0.0%) | 0.0 |
| 20 to 34 years | 0 (0.0%) | 0.0 |
| 35 to 50 years | 0 (0.0%) | 0.0 |
| Total | 0 (0.0%) | 0.0 |
Fertility by Age by Marriage Status in Granville South
| Age Bracket | Married | Unmarried |
| 15 to 19 years | 0 (0.0%) | 0 (0.0%) |
| 20 to 34 years | 0 (0.0%) | 0 (0.0%) |
| 35 to 50 years | 0 (0.0%) | 0 (0.0%) |
| Total | 0 (0.0%) | 0 (0.0%) |
Fertility by Education in Granville South
| Educational Attainment | Women with Births | Births / 1,000 Women |
| Less than High School | 0 (0.0%) | 0.0 |
| High School Diploma | 0 (0.0%) | 0.0 |
| College or Associate's Degree | 0 (0.0%) | 0.0 |
| Bachelor's Degree | 0 (0.0%) | 0.0 |
| Graduate Degree | 0 (0.0%) | 0.0 |
| Total | 0 (0.0%) | 0.0 |
Fertility by Education by Marriage Status in Granville South
| Educational Attainment | Married | Unmarried |
| Less than High School | 0 (0.0%) | 0 (0.0%) |
| High School Diploma | 0 (0.0%) | 0 (0.0%) |
| College or Associate's Degree | 0 (0.0%) | 0 (0.0%) |
| Bachelor's Degree | 0 (0.0%) | 0 (0.0%) |
| Graduate Degree | 0 (0.0%) | 0 (0.0%) |
| Total | 0 (0.0%) | 0 (0.0%) |
Employment Characteristics in Granville South
Employment by Class of Employer in Granville South
Among the 554 employed individuals in Granville South, private company employees (239 | 43.1%), local government employees (127 | 22.9%), and state government employees (52 | 9.4%) make up the most common classes of employment.
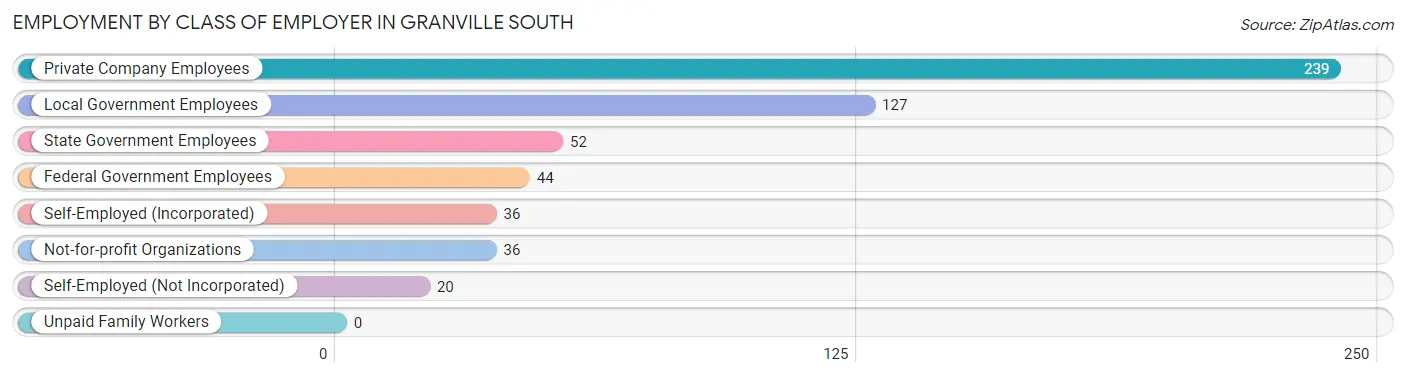
| Employer Class | # Employees | % Employees |
| Private Company Employees | 239 | 43.1% |
| Self-Employed (Incorporated) | 36 | 6.5% |
| Self-Employed (Not Incorporated) | 20 | 3.6% |
| Not-for-profit Organizations | 36 | 6.5% |
| Local Government Employees | 127 | 22.9% |
| State Government Employees | 52 | 9.4% |
| Federal Government Employees | 44 | 7.9% |
| Unpaid Family Workers | 0 | 0.0% |
| Total | 554 | 100.0% |
Employment Status by Age in Granville South
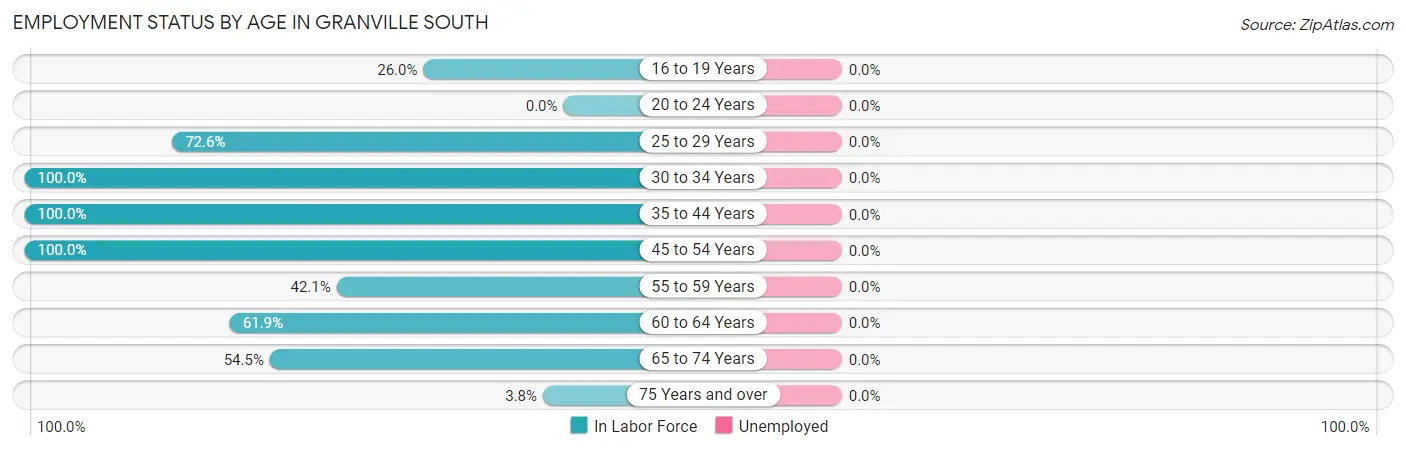
| Age Bracket | In Labor Force | Unemployed |
| 16 to 19 Years | 27 (26.0%) | 0 (0.0%) |
| 20 to 24 Years | 0 (0.0%) | 0 (0.0%) |
| 25 to 29 Years | 53 (72.6%) | 0 (0.0%) |
| 30 to 34 Years | 13 (100.0%) | 0 (0.0%) |
| 35 to 44 Years | 242 (100.0%) | 0 (0.0%) |
| 45 to 54 Years | 75 (100.0%) | 0 (0.0%) |
| 55 to 59 Years | 16 (42.1%) | 0 (0.0%) |
| 60 to 64 Years | 78 (61.9%) | 0 (0.0%) |
| 65 to 74 Years | 54 (54.5%) | 0 (0.0%) |
| 75 Years and over | 7 (3.8%) | 0 (0.0%) |
| Total | 565 (58.1%) | 0 (0.0%) |
Employment Status by Educational Attainment in Granville South
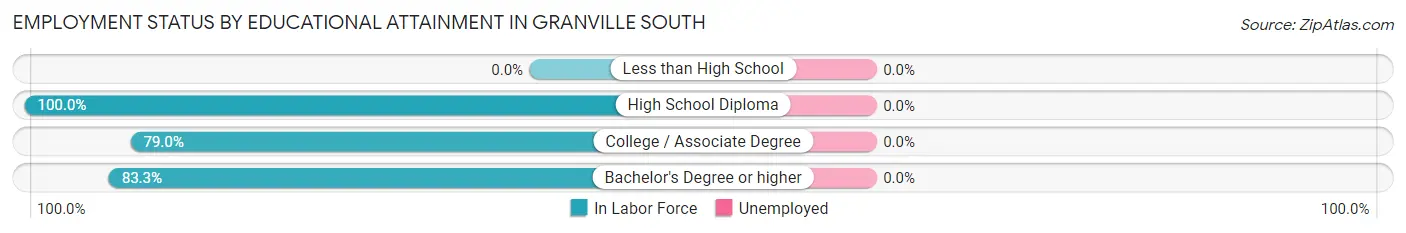
| Educational Attainment | In Labor Force | Unemployed |
| Less than High School | 0 (0.0%) | 0 (0.0%) |
| High School Diploma | 70 (100.0%) | 0 (0.0%) |
| College / Associate Degree | 128 (79.0%) | 0 (0.0%) |
| Bachelor's Degree or higher | 279 (83.3%) | 0 (0.0%) |
| Total | 477 (84.1%) | 0 (0.0%) |
Employment Occupations by Sex in Granville South
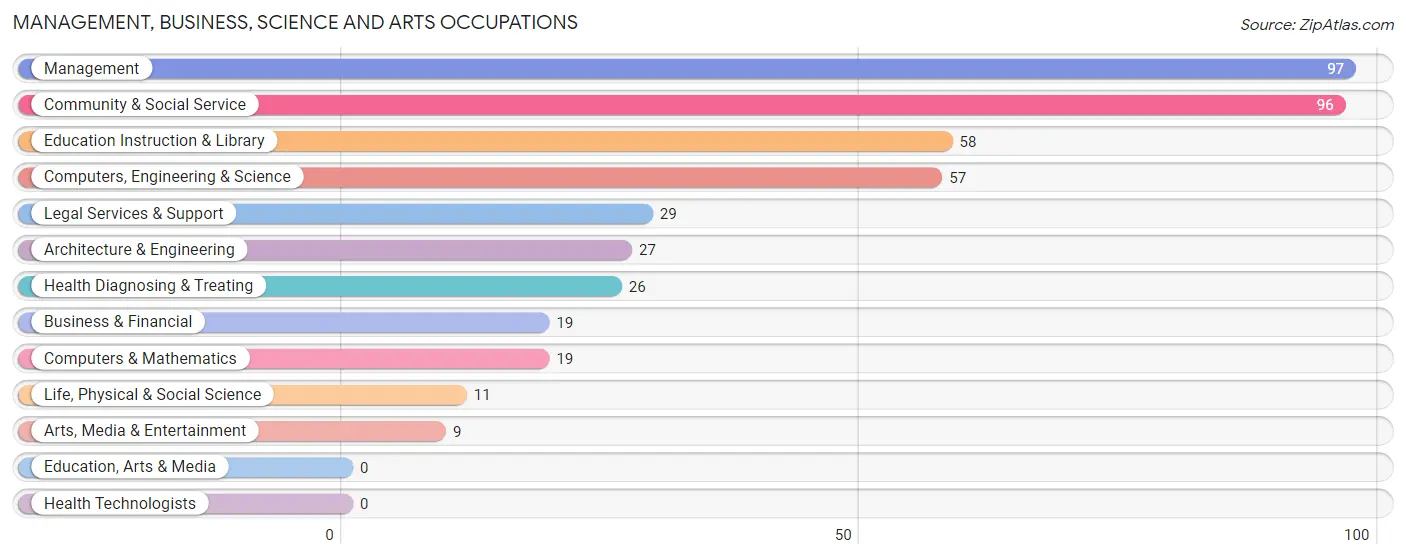
Management, Business, Science and Arts Occupations
The most common Management, Business, Science and Arts occupations in Granville South are Management (97 | 17.2%), Community & Social Service (96 | 17.0%), Education Instruction & Library (58 | 10.3%), Computers, Engineering & Science (57 | 10.1%), and Legal Services & Support (29 | 5.1%).
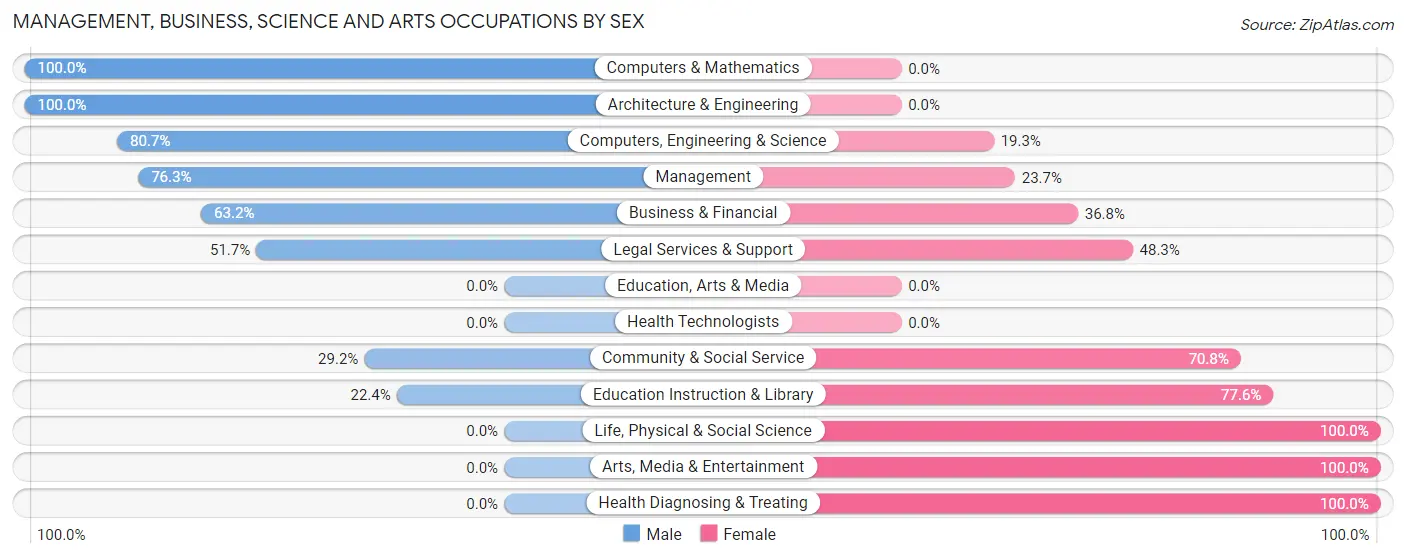
Management, Business, Science and Arts Occupations by Sex
Within the Management, Business, Science and Arts occupations in Granville South, the most male-oriented occupations are Computers & Mathematics (100.0%), Architecture & Engineering (100.0%), and Computers, Engineering & Science (80.7%), while the most female-oriented occupations are Life, Physical & Social Science (100.0%), Arts, Media & Entertainment (100.0%), and Health Diagnosing & Treating (100.0%).
| Occupation | Male | Female |
| Management | 74 (76.3%) | 23 (23.7%) |
| Business & Financial | 12 (63.2%) | 7 (36.8%) |
| Computers, Engineering & Science | 46 (80.7%) | 11 (19.3%) |
| Computers & Mathematics | 19 (100.0%) | 0 (0.0%) |
| Architecture & Engineering | 27 (100.0%) | 0 (0.0%) |
| Life, Physical & Social Science | 0 (0.0%) | 11 (100.0%) |
| Community & Social Service | 28 (29.2%) | 68 (70.8%) |
| Education, Arts & Media | 0 (0.0%) | 0 (0.0%) |
| Legal Services & Support | 15 (51.7%) | 14 (48.3%) |
| Education Instruction & Library | 13 (22.4%) | 45 (77.6%) |
| Arts, Media & Entertainment | 0 (0.0%) | 9 (100.0%) |
| Health Diagnosing & Treating | 0 (0.0%) | 26 (100.0%) |
| Health Technologists | 0 (0.0%) | 0 (0.0%) |
| Total (Category) | 160 (54.2%) | 135 (45.8%) |
| Total (Overall) | 336 (59.5%) | 229 (40.5%) |
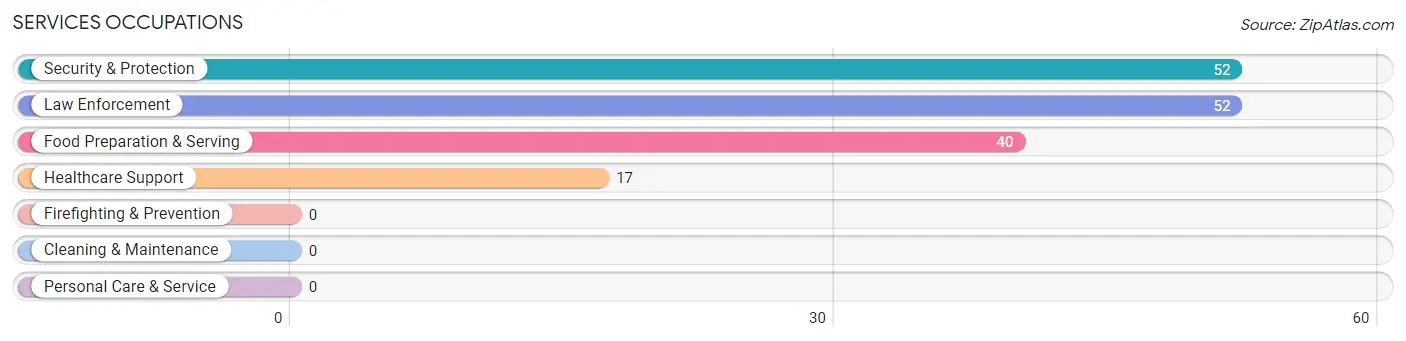
Services Occupations
The most common Services occupations in Granville South are Security & Protection (52 | 9.2%), Law Enforcement (52 | 9.2%), Food Preparation & Serving (40 | 7.1%), and Healthcare Support (17 | 3.0%).
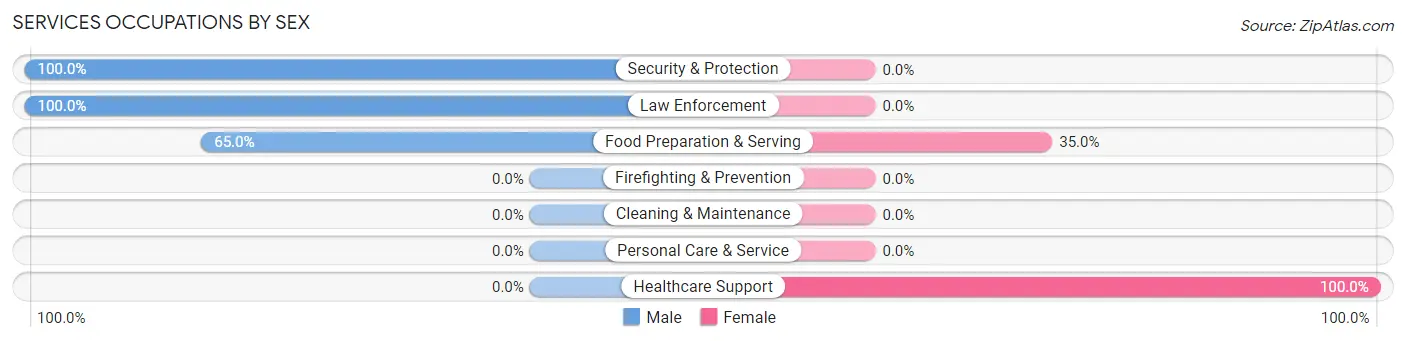
Services Occupations by Sex
Within the Services occupations in Granville South, the most male-oriented occupations are Security & Protection (100.0%), Law Enforcement (100.0%), and Food Preparation & Serving (65.0%), while the most female-oriented occupations are Healthcare Support (100.0%), and Food Preparation & Serving (35.0%).
| Occupation | Male | Female |
| Healthcare Support | 0 (0.0%) | 17 (100.0%) |
| Security & Protection | 52 (100.0%) | 0 (0.0%) |
| Firefighting & Prevention | 0 (0.0%) | 0 (0.0%) |
| Law Enforcement | 52 (100.0%) | 0 (0.0%) |
| Food Preparation & Serving | 26 (65.0%) | 14 (35.0%) |
| Cleaning & Maintenance | 0 (0.0%) | 0 (0.0%) |
| Personal Care & Service | 0 (0.0%) | 0 (0.0%) |
| Total (Category) | 78 (71.6%) | 31 (28.4%) |
| Total (Overall) | 336 (59.5%) | 229 (40.5%) |
Sales and Office Occupations
The most common Sales and Office occupations in Granville South are Office & Administration (63 | 11.2%), and Sales & Related (23 | 4.1%).

Sales and Office Occupations by Sex

| Occupation | Male | Female |
| Sales & Related | 23 (100.0%) | 0 (0.0%) |
| Office & Administration | 0 (0.0%) | 63 (100.0%) |
| Total (Category) | 23 (26.7%) | 63 (73.3%) |
| Total (Overall) | 336 (59.5%) | 229 (40.5%) |
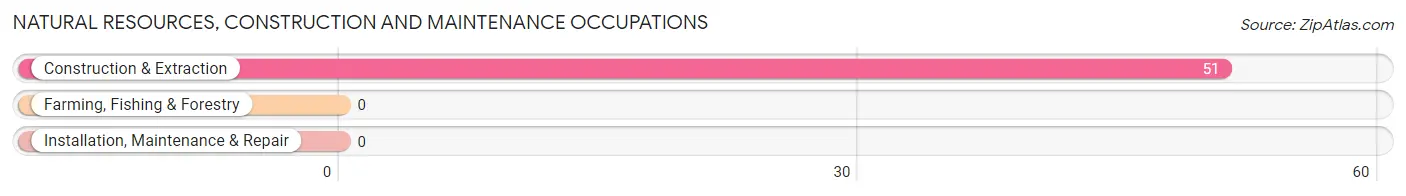
Natural Resources, Construction and Maintenance Occupations
The most common Natural Resources, Construction and Maintenance occupations in Granville South are , and Construction & Extraction (51 | 9.0%).
Natural Resources, Construction and Maintenance Occupations by Sex
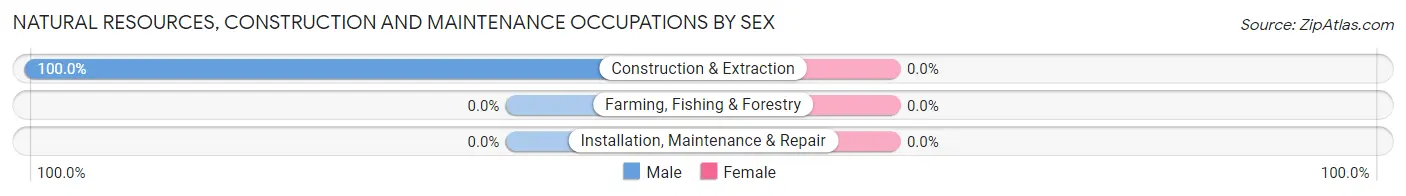
| Occupation | Male | Female |
| Farming, Fishing & Forestry | 0 (0.0%) | 0 (0.0%) |
| Construction & Extraction | 51 (100.0%) | 0 (0.0%) |
| Installation, Maintenance & Repair | 0 (0.0%) | 0 (0.0%) |
| Total (Category) | 51 (100.0%) | 0 (0.0%) |
| Total (Overall) | 336 (59.5%) | 229 (40.5%) |
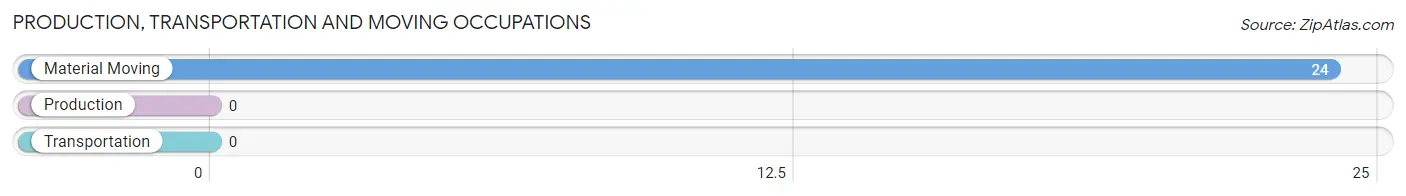
Production, Transportation and Moving Occupations
The most common Production, Transportation and Moving occupations in Granville South are , and Material Moving (24 | 4.3%).
Production, Transportation and Moving Occupations by Sex
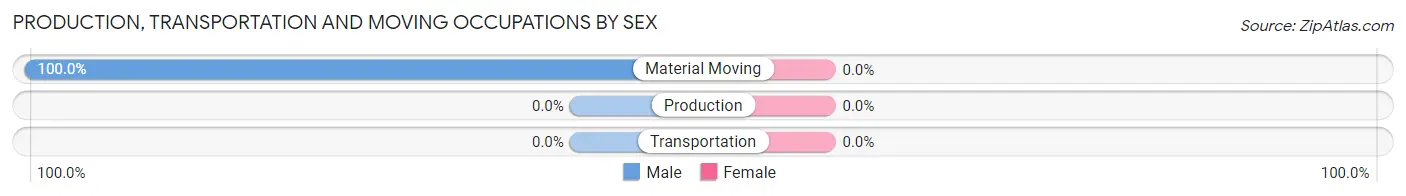
| Occupation | Male | Female |
| Production | 0 (0.0%) | 0 (0.0%) |
| Transportation | 0 (0.0%) | 0 (0.0%) |
| Material Moving | 24 (100.0%) | 0 (0.0%) |
| Total (Category) | 24 (100.0%) | 0 (0.0%) |
| Total (Overall) | 336 (59.5%) | 229 (40.5%) |
Employment Industries by Sex in Granville South
Employment Industries in Granville South
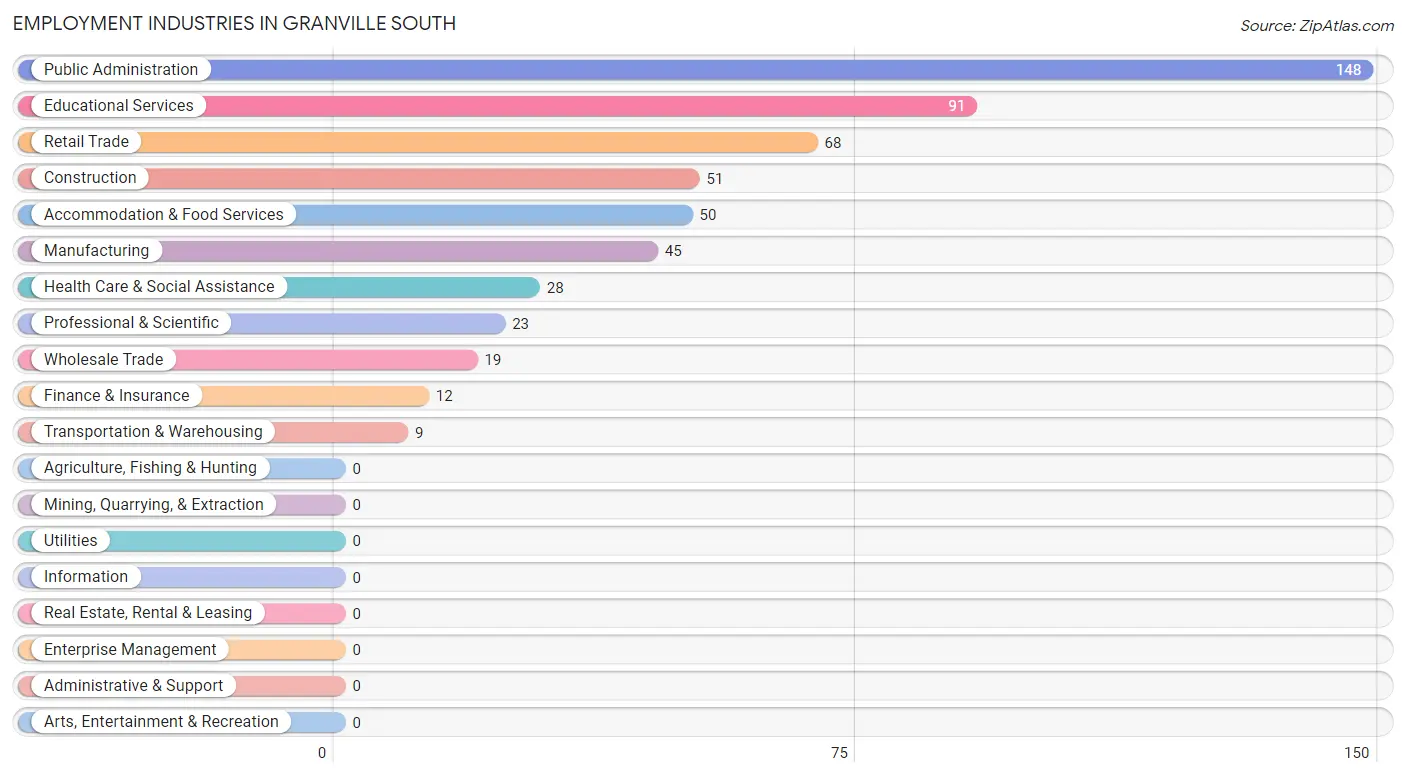
The major employment industries in Granville South include Public Administration (148 | 26.2%), Educational Services (91 | 16.1%), Retail Trade (68 | 12.0%), Construction (51 | 9.0%), and Accommodation & Food Services (50 | 8.8%).
Employment Industries by Sex in Granville South
The Granville South industries that see more men than women are Construction (100.0%), Manufacturing (100.0%), and Wholesale Trade (100.0%), whereas the industries that tend to have a higher number of women are Professional & Scientific (100.0%), Health Care & Social Assistance (100.0%), and Educational Services (69.2%).
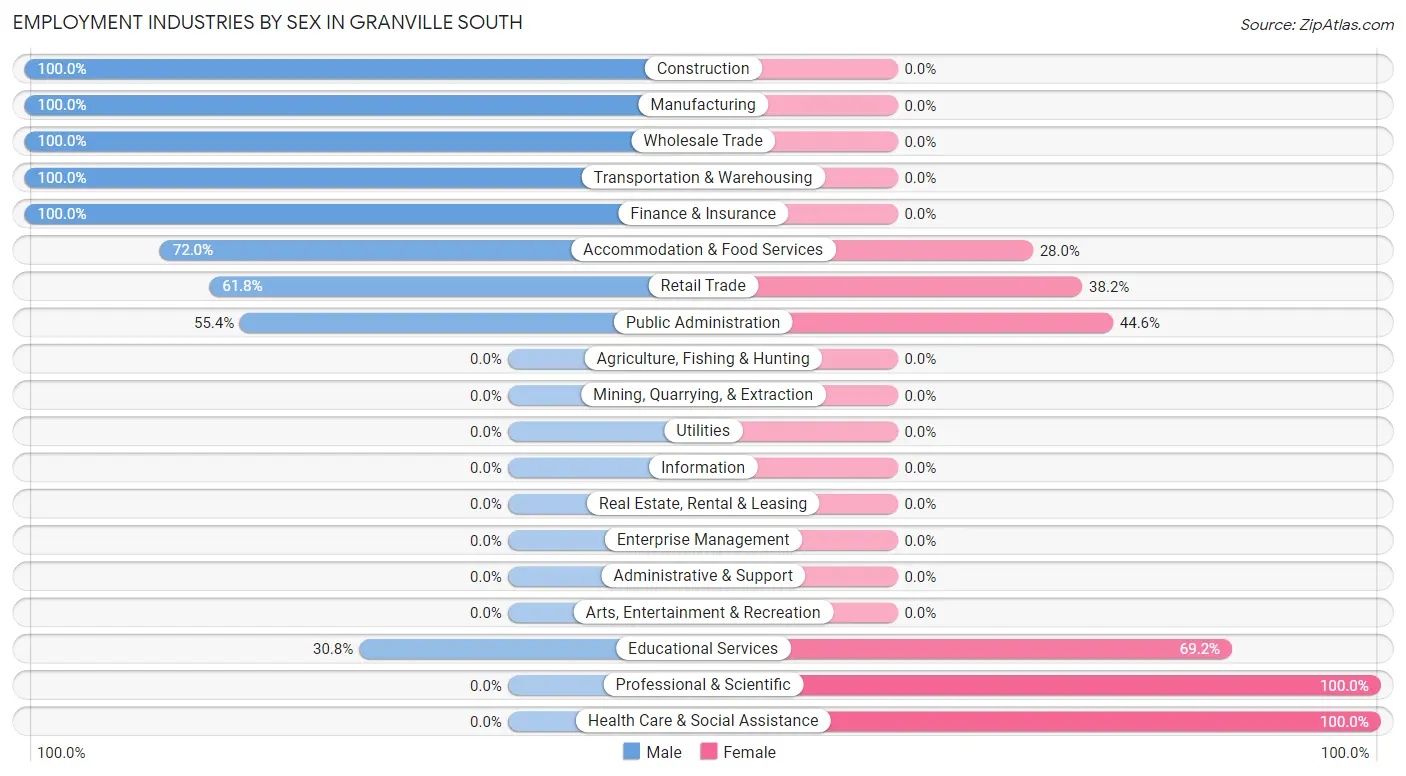
| Industry | Male | Female |
| Agriculture, Fishing & Hunting | 0 (0.0%) | 0 (0.0%) |
| Mining, Quarrying, & Extraction | 0 (0.0%) | 0 (0.0%) |
| Construction | 51 (100.0%) | 0 (0.0%) |
| Manufacturing | 45 (100.0%) | 0 (0.0%) |
| Wholesale Trade | 19 (100.0%) | 0 (0.0%) |
| Retail Trade | 42 (61.8%) | 26 (38.2%) |
| Transportation & Warehousing | 9 (100.0%) | 0 (0.0%) |
| Utilities | 0 (0.0%) | 0 (0.0%) |
| Information | 0 (0.0%) | 0 (0.0%) |
| Finance & Insurance | 12 (100.0%) | 0 (0.0%) |
| Real Estate, Rental & Leasing | 0 (0.0%) | 0 (0.0%) |
| Professional & Scientific | 0 (0.0%) | 23 (100.0%) |
| Enterprise Management | 0 (0.0%) | 0 (0.0%) |
| Administrative & Support | 0 (0.0%) | 0 (0.0%) |
| Educational Services | 28 (30.8%) | 63 (69.2%) |
| Health Care & Social Assistance | 0 (0.0%) | 28 (100.0%) |
| Arts, Entertainment & Recreation | 0 (0.0%) | 0 (0.0%) |
| Accommodation & Food Services | 36 (72.0%) | 14 (28.0%) |
| Public Administration | 82 (55.4%) | 66 (44.6%) |
| Total | 336 (59.5%) | 229 (40.5%) |
Education in Granville South
School Enrollment in Granville South
The most common levels of schooling among the 367 students in Granville South are college / undergraduate (116 | 31.6%), high school (102 | 27.8%), and middle school (67 | 18.3%).
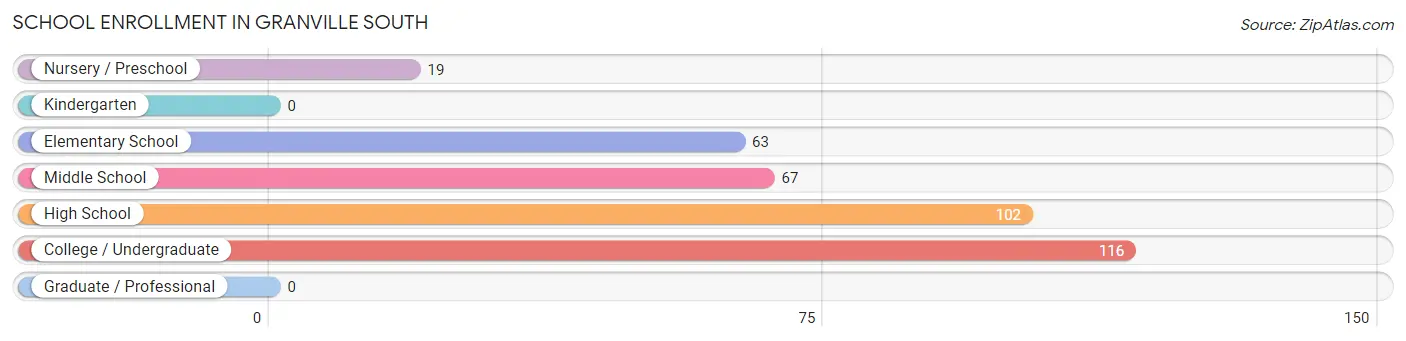
| School Level | # Students | % Students |
| Nursery / Preschool | 19 | 5.2% |
| Kindergarten | 0 | 0.0% |
| Elementary School | 63 | 17.2% |
| Middle School | 67 | 18.3% |
| High School | 102 | 27.8% |
| College / Undergraduate | 116 | 31.6% |
| Graduate / Professional | 0 | 0.0% |
| Total | 367 | 100.0% |
School Enrollment by Age by Funding Source in Granville South
Out of a total of 367 students who are enrolled in schools in Granville South, 45 (12.3%) attend a private institution, while the remaining 322 (87.7%) are enrolled in public schools. The age group of 3 to 4 year olds has the highest likelihood of being enrolled in private schools, with 19 (100.0% in the age bracket) enrolled. Conversely, the age group of 5 to 9 year old has the lowest likelihood of being enrolled in a private school, with 63 (100.0% in the age bracket) attending a public institution.
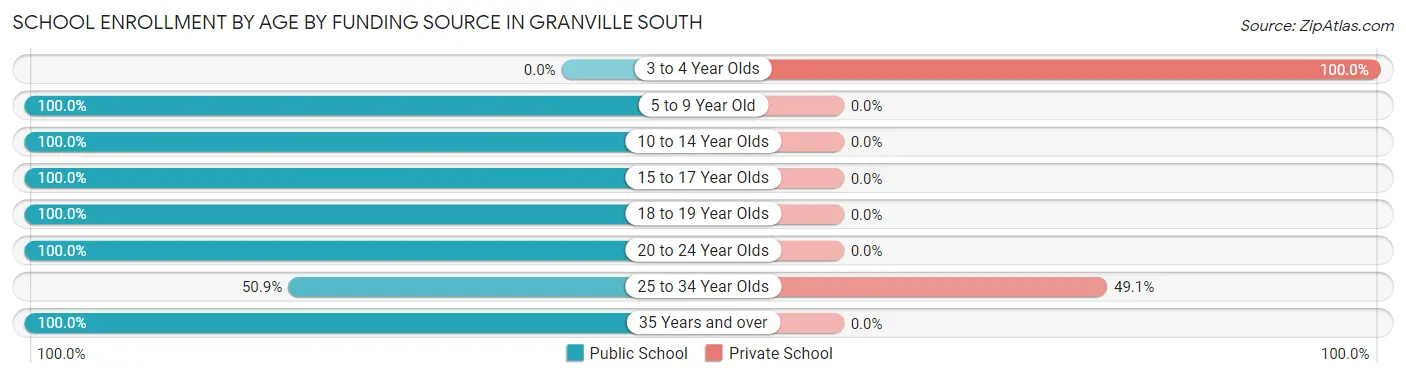
| Age Bracket | Public School | Private School |
| 3 to 4 Year Olds | 0 (0.0%) | 19 (100.0%) |
| 5 to 9 Year Old | 63 (100.0%) | 0 (0.0%) |
| 10 to 14 Year Olds | 81 (100.0%) | 0 (0.0%) |
| 15 to 17 Year Olds | 88 (100.0%) | 0 (0.0%) |
| 18 to 19 Year Olds | 16 (100.0%) | 0 (0.0%) |
| 20 to 24 Year Olds | 17 (100.0%) | 0 (0.0%) |
| 25 to 34 Year Olds | 27 (50.9%) | 26 (49.1%) |
| 35 Years and over | 30 (100.0%) | 0 (0.0%) |
| Total | 322 (87.7%) | 45 (12.3%) |
Educational Attainment by Field of Study in Granville South
Education (106 | 18.8%), literature & languages (97 | 17.2%), business (83 | 14.7%), social sciences (78 | 13.8%), and liberal arts & history (59 | 10.4%) are the most common fields of study among 565 individuals in Granville South who have obtained a bachelor's degree or higher.
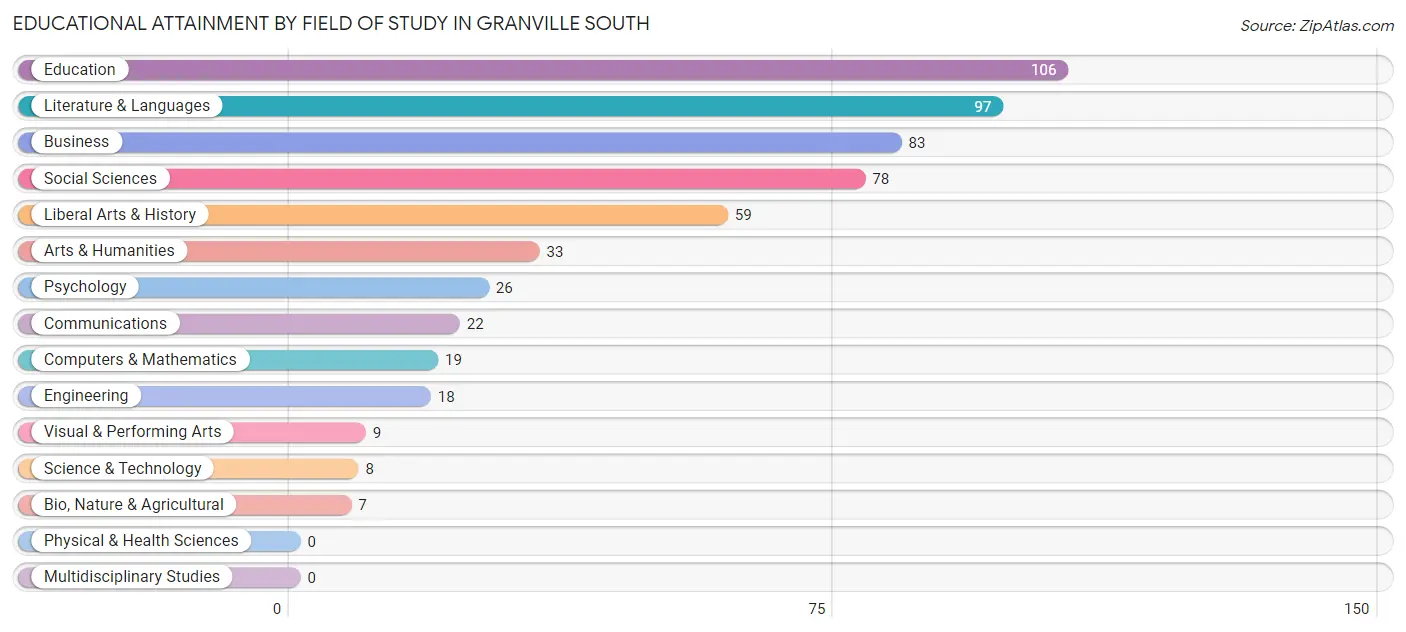
| Field of Study | # Graduates | % Graduates |
| Computers & Mathematics | 19 | 3.4% |
| Bio, Nature & Agricultural | 7 | 1.2% |
| Physical & Health Sciences | 0 | 0.0% |
| Psychology | 26 | 4.6% |
| Social Sciences | 78 | 13.8% |
| Engineering | 18 | 3.2% |
| Multidisciplinary Studies | 0 | 0.0% |
| Science & Technology | 8 | 1.4% |
| Business | 83 | 14.7% |
| Education | 106 | 18.8% |
| Literature & Languages | 97 | 17.2% |
| Liberal Arts & History | 59 | 10.4% |
| Visual & Performing Arts | 9 | 1.6% |
| Communications | 22 | 3.9% |
| Arts & Humanities | 33 | 5.8% |
| Total | 565 | 100.0% |
Transportation & Commute in Granville South
Vehicle Availability by Sex in Granville South
The most prevalent vehicle ownership categories in Granville South are males with 2 vehicles (126, accounting for 37.5%) and females with 2 vehicles (82, making up 57.8%).
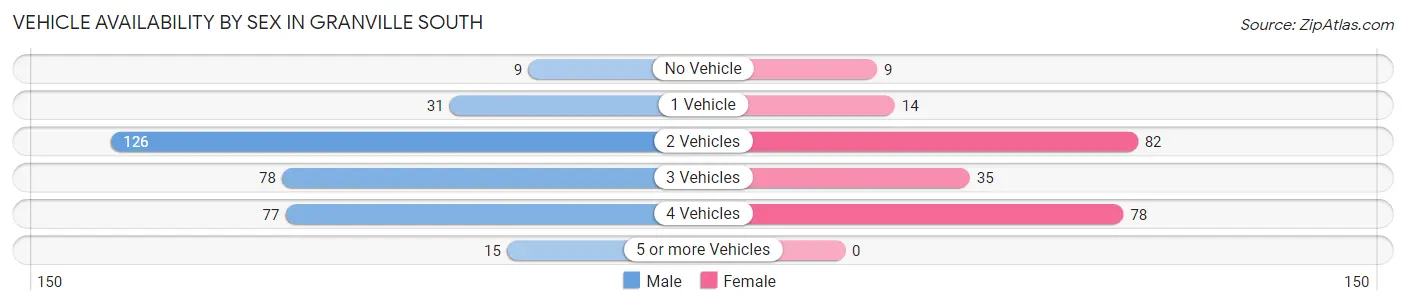
| Vehicles Available | Male | Female |
| No Vehicle | 9 (2.7%) | 9 (4.1%) |
| 1 Vehicle | 31 (9.2%) | 14 (6.4%) |
| 2 Vehicles | 126 (37.5%) | 82 (37.6%) |
| 3 Vehicles | 78 (23.2%) | 35 (16.1%) |
| 4 Vehicles | 77 (22.9%) | 78 (35.8%) |
| 5 or more Vehicles | 15 (4.5%) | 0 (0.0%) |
| Total | 336 (100.0%) | 218 (100.0%) |
Commute Time in Granville South
The most frequently occuring commute durations in Granville South are 5 to 9 minutes (120 commuters, 24.2%), 10 to 14 minutes (77 commuters, 15.6%), and 35 to 39 minutes (71 commuters, 14.3%).
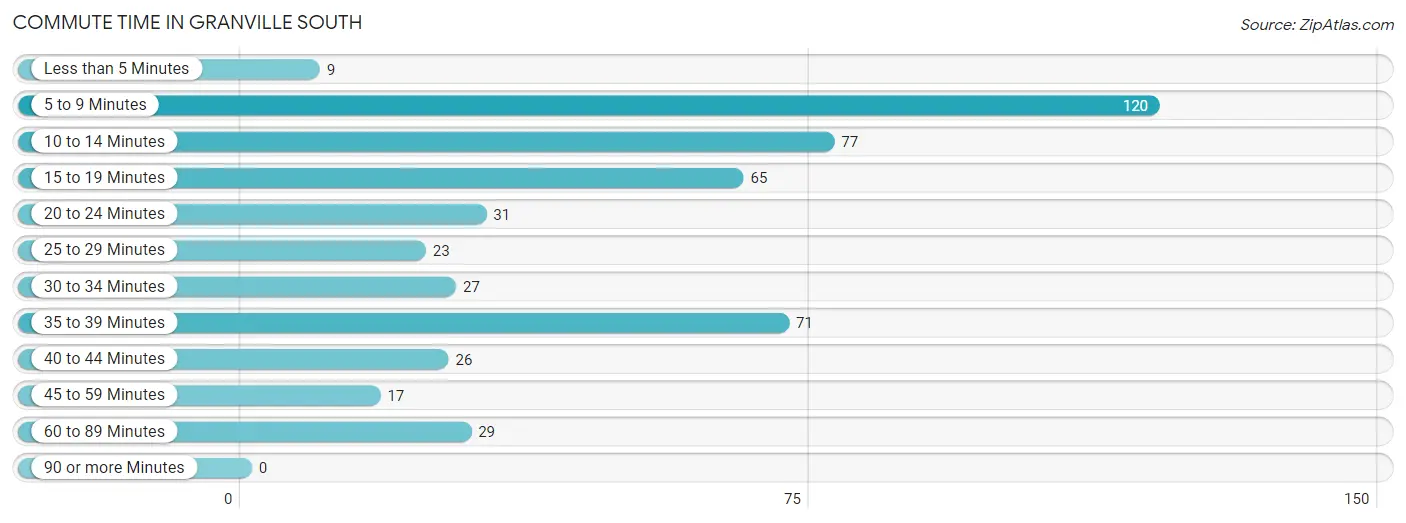
| Commute Time | # Commuters | % Commuters |
| Less than 5 Minutes | 9 | 1.8% |
| 5 to 9 Minutes | 120 | 24.2% |
| 10 to 14 Minutes | 77 | 15.6% |
| 15 to 19 Minutes | 65 | 13.1% |
| 20 to 24 Minutes | 31 | 6.3% |
| 25 to 29 Minutes | 23 | 4.6% |
| 30 to 34 Minutes | 27 | 5.4% |
| 35 to 39 Minutes | 71 | 14.3% |
| 40 to 44 Minutes | 26 | 5.2% |
| 45 to 59 Minutes | 17 | 3.4% |
| 60 to 89 Minutes | 29 | 5.9% |
| 90 or more Minutes | 0 | 0.0% |
Commute Time by Sex in Granville South
The most common commute times in Granville South are 5 to 9 minutes (113 commuters, 36.3%) for males and 35 to 39 minutes (52 commuters, 28.3%) for females.
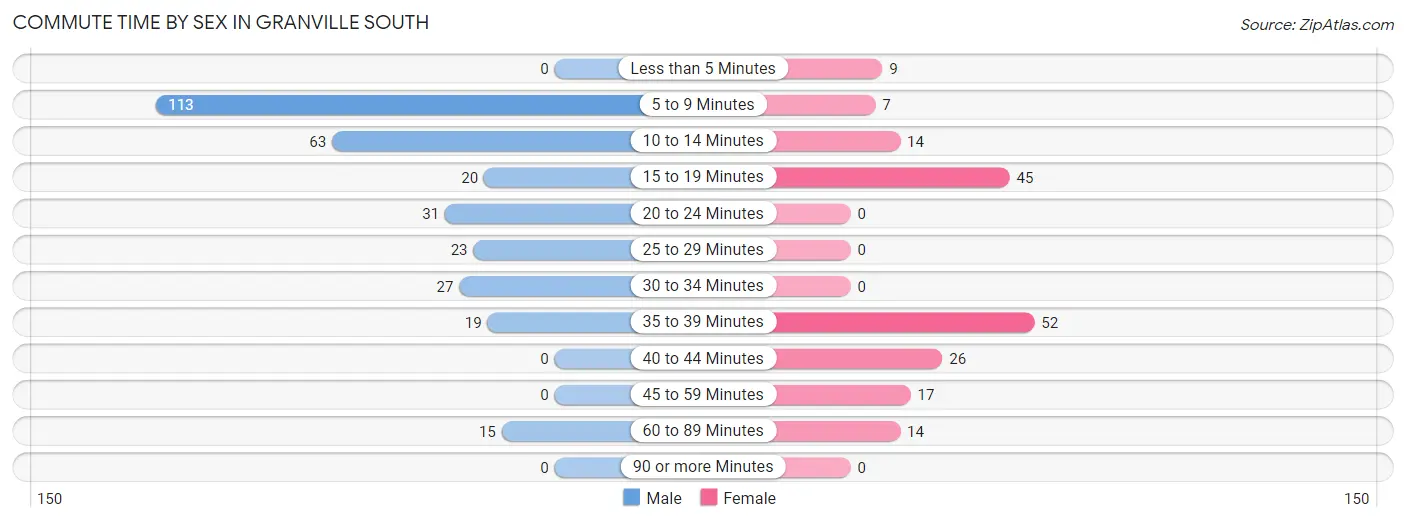
| Commute Time | Male | Female |
| Less than 5 Minutes | 0 (0.0%) | 9 (4.9%) |
| 5 to 9 Minutes | 113 (36.3%) | 7 (3.8%) |
| 10 to 14 Minutes | 63 (20.3%) | 14 (7.6%) |
| 15 to 19 Minutes | 20 (6.4%) | 45 (24.5%) |
| 20 to 24 Minutes | 31 (10.0%) | 0 (0.0%) |
| 25 to 29 Minutes | 23 (7.4%) | 0 (0.0%) |
| 30 to 34 Minutes | 27 (8.7%) | 0 (0.0%) |
| 35 to 39 Minutes | 19 (6.1%) | 52 (28.3%) |
| 40 to 44 Minutes | 0 (0.0%) | 26 (14.1%) |
| 45 to 59 Minutes | 0 (0.0%) | 17 (9.2%) |
| 60 to 89 Minutes | 15 (4.8%) | 14 (7.6%) |
| 90 or more Minutes | 0 (0.0%) | 0 (0.0%) |
Time of Departure to Work by Sex in Granville South
The most frequent times of departure to work in Granville South are 7:00 AM to 7:29 AM (102, 32.8%) for males and 7:00 AM to 7:29 AM (85, 46.2%) for females.
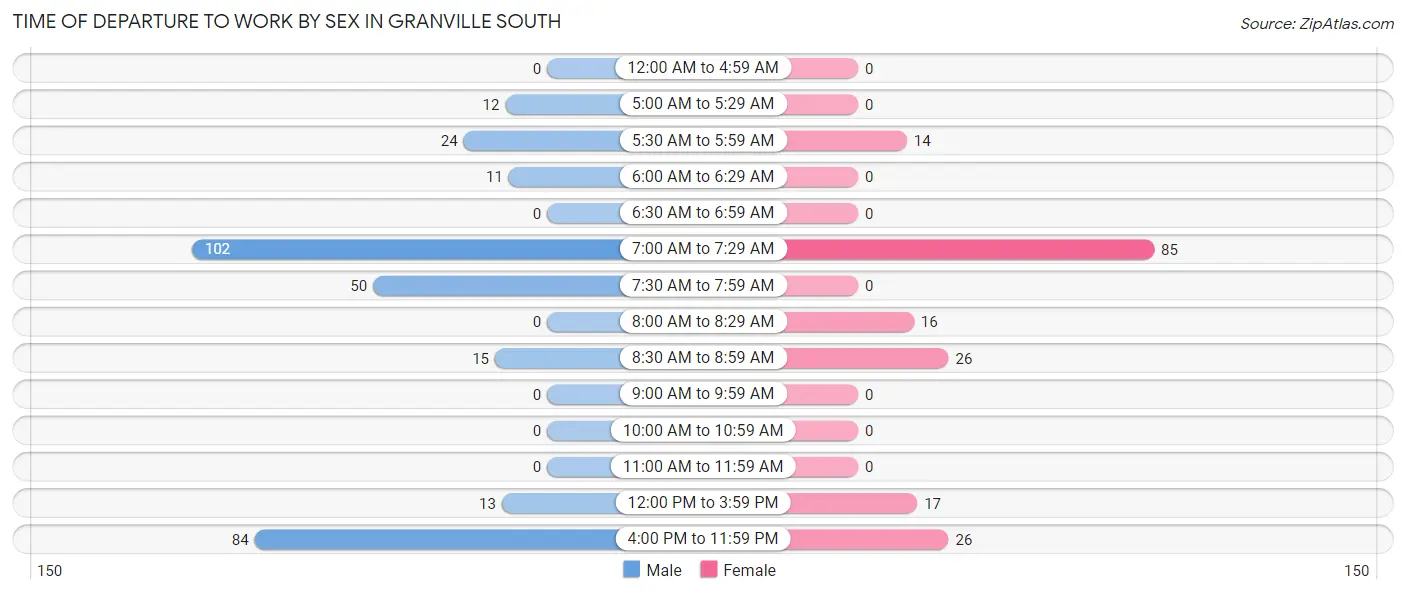
| Time of Departure | Male | Female |
| 12:00 AM to 4:59 AM | 0 (0.0%) | 0 (0.0%) |
| 5:00 AM to 5:29 AM | 12 (3.9%) | 0 (0.0%) |
| 5:30 AM to 5:59 AM | 24 (7.7%) | 14 (7.6%) |
| 6:00 AM to 6:29 AM | 11 (3.5%) | 0 (0.0%) |
| 6:30 AM to 6:59 AM | 0 (0.0%) | 0 (0.0%) |
| 7:00 AM to 7:29 AM | 102 (32.8%) | 85 (46.2%) |
| 7:30 AM to 7:59 AM | 50 (16.1%) | 0 (0.0%) |
| 8:00 AM to 8:29 AM | 0 (0.0%) | 16 (8.7%) |
| 8:30 AM to 8:59 AM | 15 (4.8%) | 26 (14.1%) |
| 9:00 AM to 9:59 AM | 0 (0.0%) | 0 (0.0%) |
| 10:00 AM to 10:59 AM | 0 (0.0%) | 0 (0.0%) |
| 11:00 AM to 11:59 AM | 0 (0.0%) | 0 (0.0%) |
| 12:00 PM to 3:59 PM | 13 (4.2%) | 17 (9.2%) |
| 4:00 PM to 11:59 PM | 84 (27.0%) | 26 (14.1%) |
| Total | 311 (100.0%) | 184 (100.0%) |
Housing Occupancy in Granville South
Occupancy by Ownership in Granville South
Of the total 466 dwellings in Granville South, owner-occupied units account for 354 (76.0%), while renter-occupied units make up 112 (24.0%).
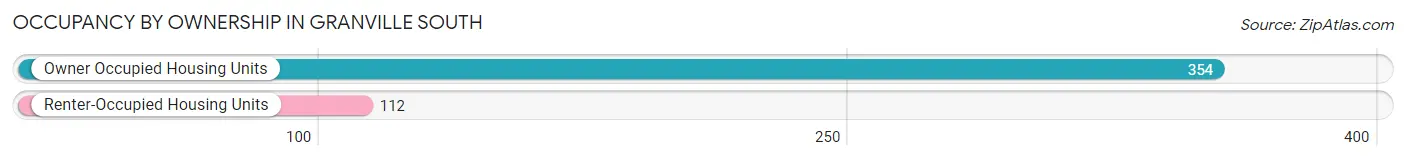
| Occupancy | # Housing Units | % Housing Units |
| Owner Occupied Housing Units | 354 | 76.0% |
| Renter-Occupied Housing Units | 112 | 24.0% |
| Total Occupied Housing Units | 466 | 100.0% |
Occupancy by Household Size in Granville South
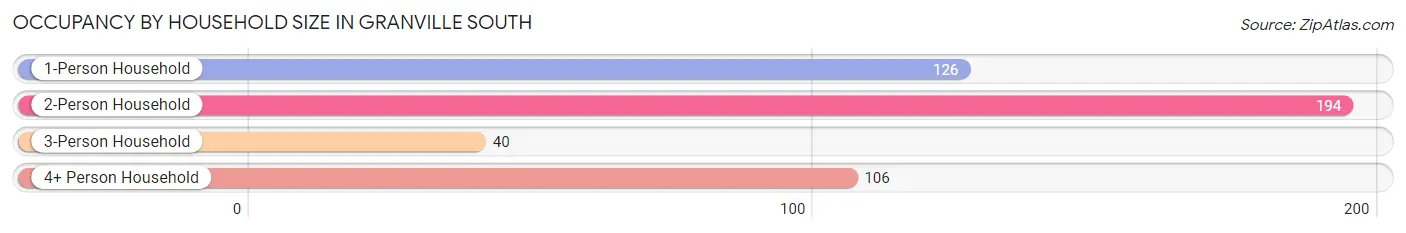
| Household Size | # Housing Units | % Housing Units |
| 1-Person Household | 126 | 27.0% |
| 2-Person Household | 194 | 41.6% |
| 3-Person Household | 40 | 8.6% |
| 4+ Person Household | 106 | 22.8% |
| Total Housing Units | 466 | 100.0% |
Occupancy by Ownership by Household Size in Granville South
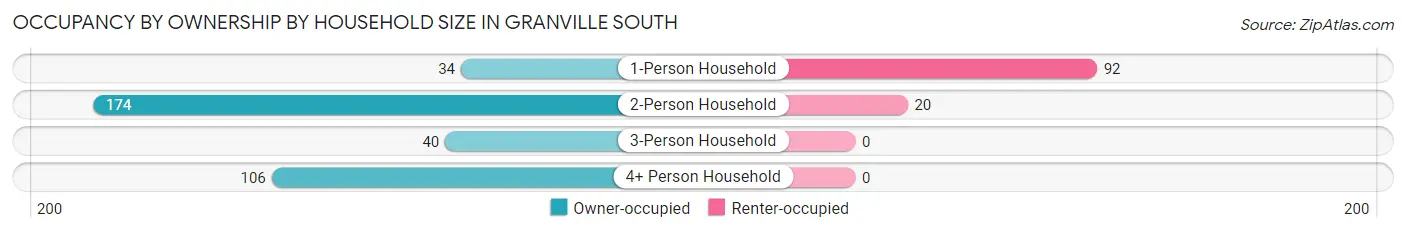
| Household Size | Owner-occupied | Renter-occupied |
| 1-Person Household | 34 (27.0%) | 92 (73.0%) |
| 2-Person Household | 174 (89.7%) | 20 (10.3%) |
| 3-Person Household | 40 (100.0%) | 0 (0.0%) |
| 4+ Person Household | 106 (100.0%) | 0 (0.0%) |
| Total Housing Units | 354 (76.0%) | 112 (24.0%) |
Occupancy by Educational Attainment in Granville South
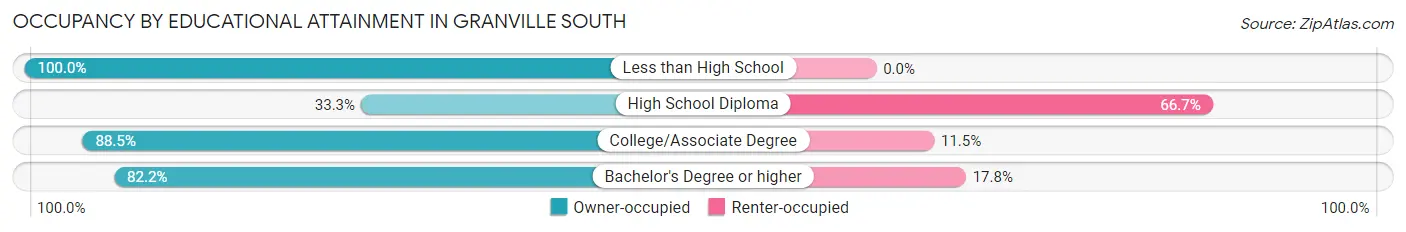
| Household Size | Owner-occupied | Renter-occupied |
| Less than High School | 12 (100.0%) | 0 (0.0%) |
| High School Diploma | 24 (33.3%) | 48 (66.7%) |
| College/Associate Degree | 54 (88.5%) | 7 (11.5%) |
| Bachelor's Degree or higher | 264 (82.2%) | 57 (17.8%) |
Occupancy by Age of Householder in Granville South
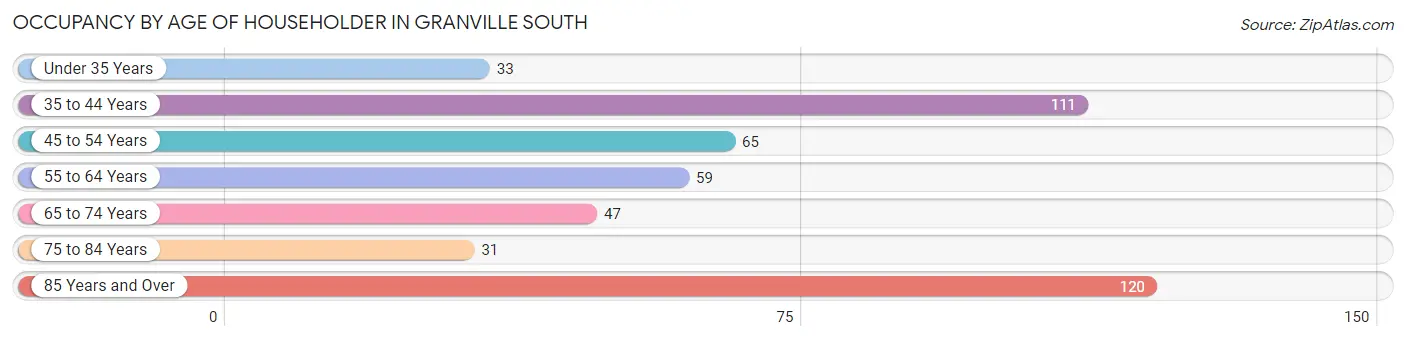
| Age Bracket | # Households | % Households |
| Under 35 Years | 33 | 7.1% |
| 35 to 44 Years | 111 | 23.8% |
| 45 to 54 Years | 65 | 14.0% |
| 55 to 64 Years | 59 | 12.7% |
| 65 to 74 Years | 47 | 10.1% |
| 75 to 84 Years | 31 | 6.7% |
| 85 Years and Over | 120 | 25.8% |
| Total | 466 | 100.0% |
Housing Finances in Granville South
Median Income by Occupancy in Granville South
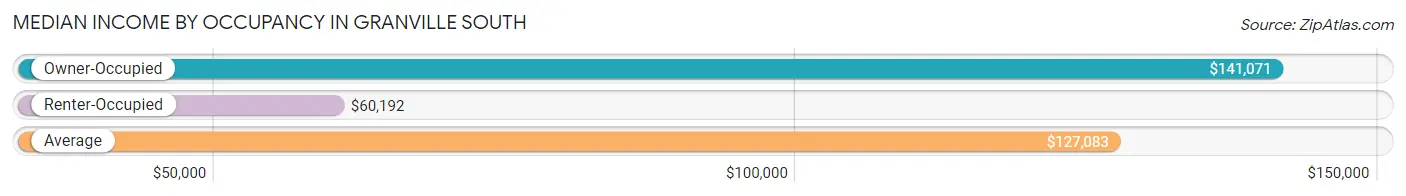
| Occupancy Type | # Households | Median Income |
| Owner-Occupied | 354 (76.0%) | $141,071 |
| Renter-Occupied | 112 (24.0%) | $60,192 |
| Average | 466 (100.0%) | $127,083 |
Occupancy by Householder Income Bracket in Granville South
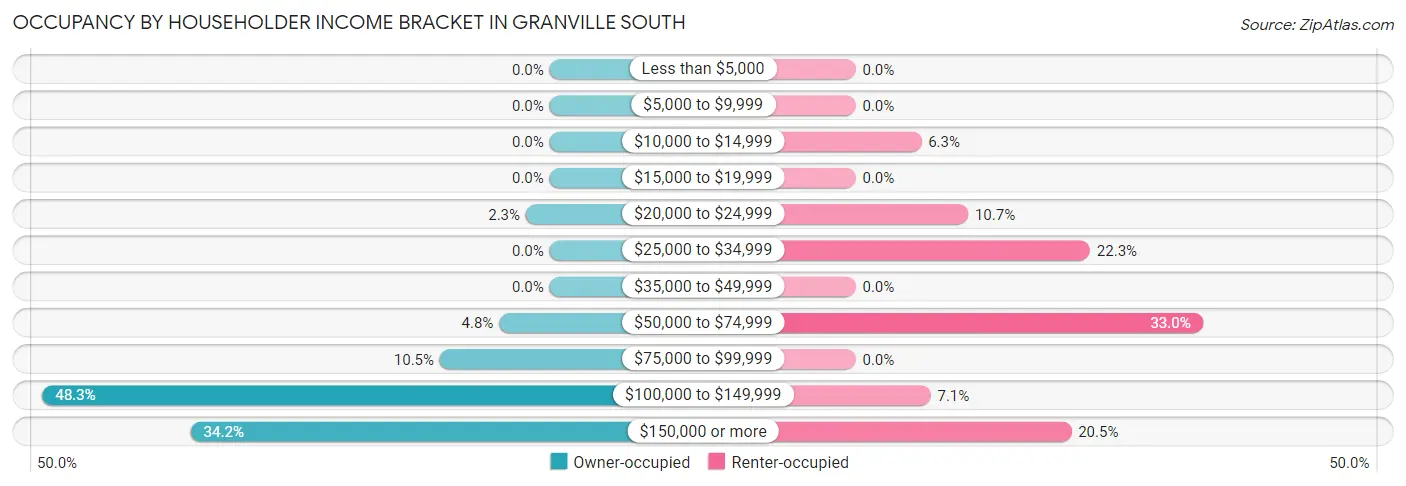
| Income Bracket | Owner-occupied | Renter-occupied |
| Less than $5,000 | 0 (0.0%) | 0 (0.0%) |
| $5,000 to $9,999 | 0 (0.0%) | 0 (0.0%) |
| $10,000 to $14,999 | 0 (0.0%) | 7 (6.2%) |
| $15,000 to $19,999 | 0 (0.0%) | 0 (0.0%) |
| $20,000 to $24,999 | 8 (2.3%) | 12 (10.7%) |
| $25,000 to $34,999 | 0 (0.0%) | 25 (22.3%) |
| $35,000 to $49,999 | 0 (0.0%) | 0 (0.0%) |
| $50,000 to $74,999 | 17 (4.8%) | 37 (33.0%) |
| $75,000 to $99,999 | 37 (10.4%) | 0 (0.0%) |
| $100,000 to $149,999 | 171 (48.3%) | 8 (7.1%) |
| $150,000 or more | 121 (34.2%) | 23 (20.5%) |
| Total | 354 (100.0%) | 112 (100.0%) |
Monthly Housing Cost Tiers in Granville South
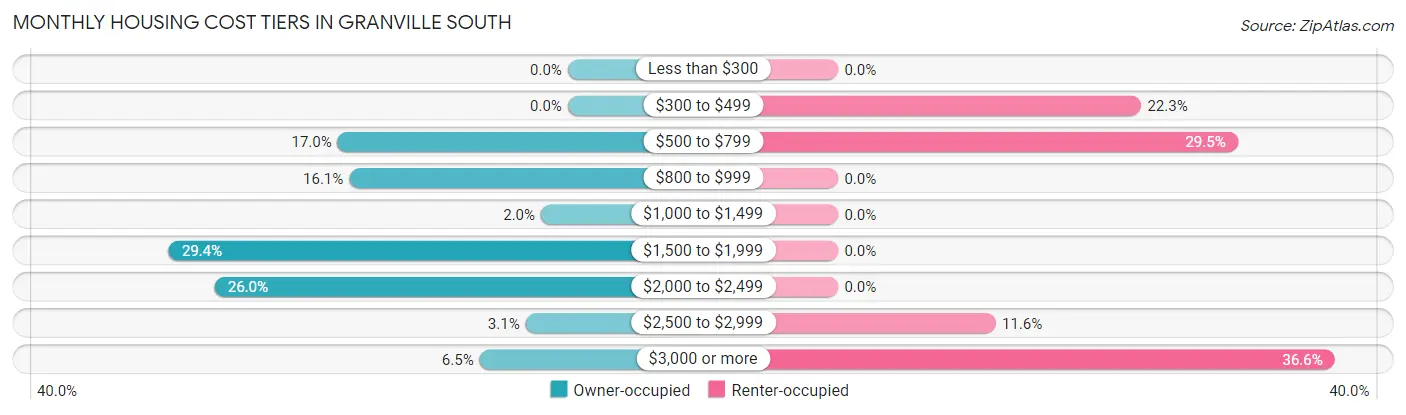
| Monthly Cost | Owner-occupied | Renter-occupied |
| Less than $300 | 0 (0.0%) | 0 (0.0%) |
| $300 to $499 | 0 (0.0%) | 25 (22.3%) |
| $500 to $799 | 60 (17.0%) | 33 (29.5%) |
| $800 to $999 | 57 (16.1%) | 0 (0.0%) |
| $1,000 to $1,499 | 7 (2.0%) | 0 (0.0%) |
| $1,500 to $1,999 | 104 (29.4%) | 0 (0.0%) |
| $2,000 to $2,499 | 92 (26.0%) | 0 (0.0%) |
| $2,500 to $2,999 | 11 (3.1%) | 13 (11.6%) |
| $3,000 or more | 23 (6.5%) | 41 (36.6%) |
| Total | 354 (100.0%) | 112 (100.0%) |
Physical Housing Characteristics in Granville South
Housing Structures in Granville South
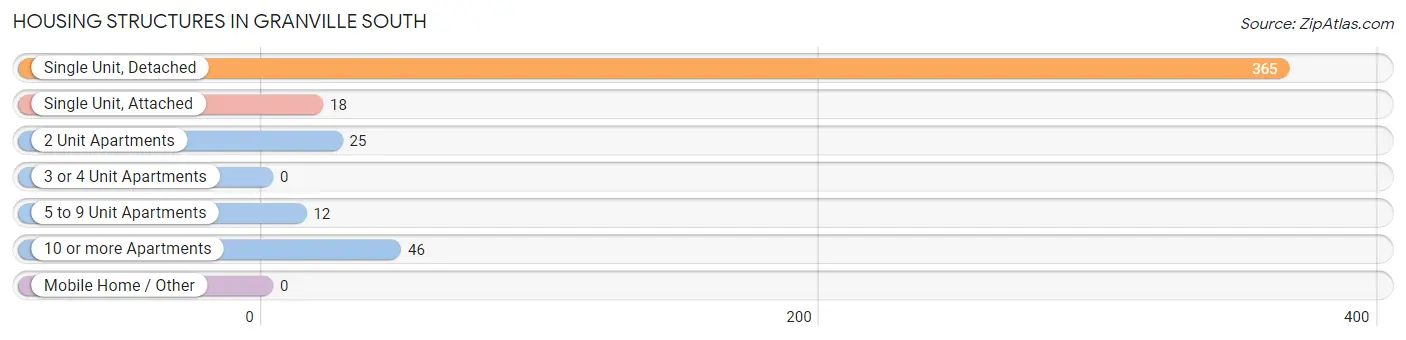
| Structure Type | # Housing Units | % Housing Units |
| Single Unit, Detached | 365 | 78.3% |
| Single Unit, Attached | 18 | 3.9% |
| 2 Unit Apartments | 25 | 5.4% |
| 3 or 4 Unit Apartments | 0 | 0.0% |
| 5 to 9 Unit Apartments | 12 | 2.6% |
| 10 or more Apartments | 46 | 9.9% |
| Mobile Home / Other | 0 | 0.0% |
| Total | 466 | 100.0% |
Housing Structures by Occupancy in Granville South
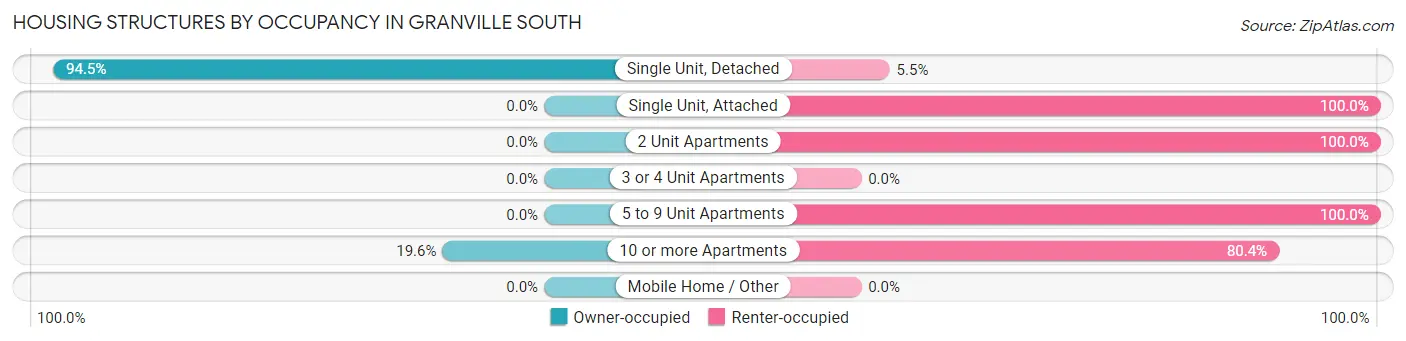
| Structure Type | Owner-occupied | Renter-occupied |
| Single Unit, Detached | 345 (94.5%) | 20 (5.5%) |
| Single Unit, Attached | 0 (0.0%) | 18 (100.0%) |
| 2 Unit Apartments | 0 (0.0%) | 25 (100.0%) |
| 3 or 4 Unit Apartments | 0 (0.0%) | 0 (0.0%) |
| 5 to 9 Unit Apartments | 0 (0.0%) | 12 (100.0%) |
| 10 or more Apartments | 9 (19.6%) | 37 (80.4%) |
| Mobile Home / Other | 0 (0.0%) | 0 (0.0%) |
| Total | 354 (76.0%) | 112 (24.0%) |
Housing Structures by Number of Rooms in Granville South
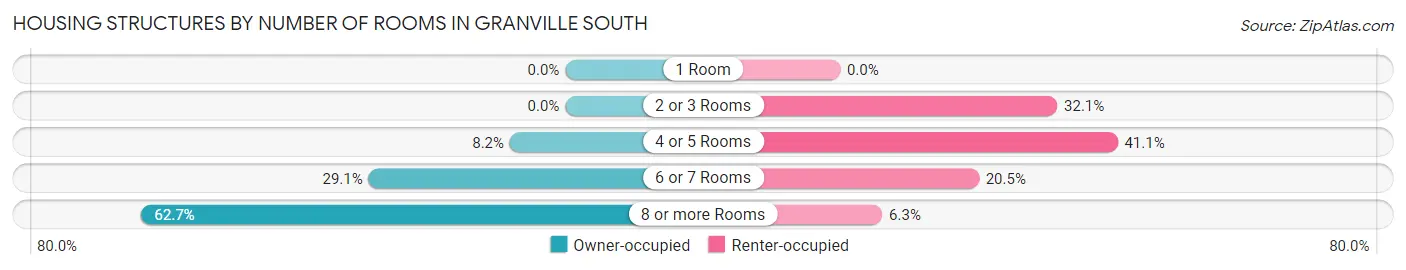
| Number of Rooms | Owner-occupied | Renter-occupied |
| 1 Room | 0 (0.0%) | 0 (0.0%) |
| 2 or 3 Rooms | 0 (0.0%) | 36 (32.1%) |
| 4 or 5 Rooms | 29 (8.2%) | 46 (41.1%) |
| 6 or 7 Rooms | 103 (29.1%) | 23 (20.5%) |
| 8 or more Rooms | 222 (62.7%) | 7 (6.2%) |
| Total | 354 (100.0%) | 112 (100.0%) |
Housing Structure by Heating Type in Granville South
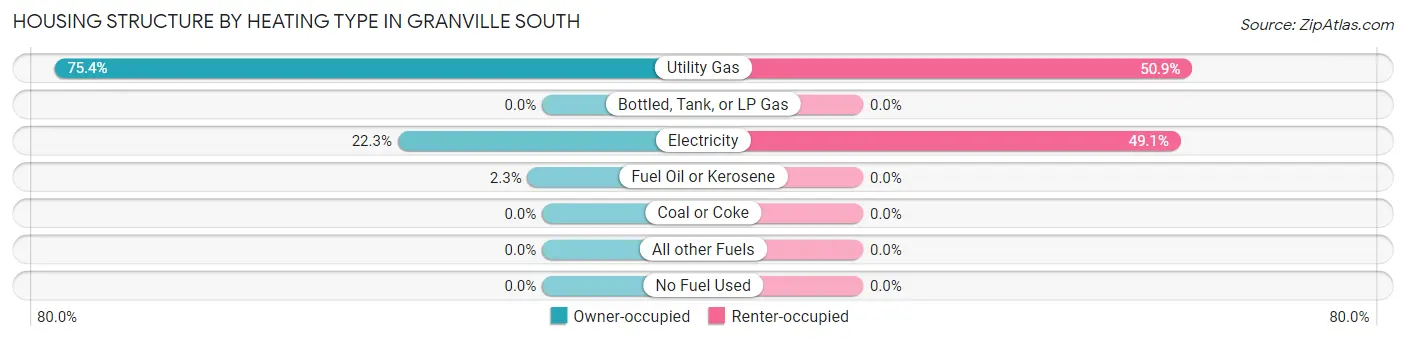
| Heating Type | Owner-occupied | Renter-occupied |
| Utility Gas | 267 (75.4%) | 57 (50.9%) |
| Bottled, Tank, or LP Gas | 0 (0.0%) | 0 (0.0%) |
| Electricity | 79 (22.3%) | 55 (49.1%) |
| Fuel Oil or Kerosene | 8 (2.3%) | 0 (0.0%) |
| Coal or Coke | 0 (0.0%) | 0 (0.0%) |
| All other Fuels | 0 (0.0%) | 0 (0.0%) |
| No Fuel Used | 0 (0.0%) | 0 (0.0%) |
| Total | 354 (100.0%) | 112 (100.0%) |
Household Vehicle Usage in Granville South
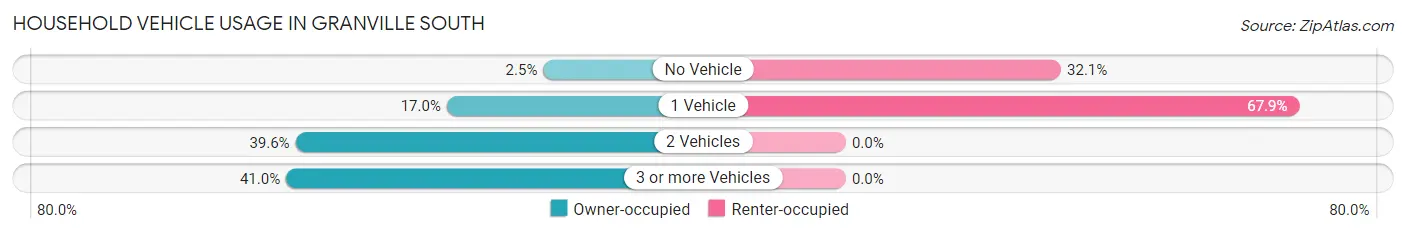
| Vehicles per Household | Owner-occupied | Renter-occupied |
| No Vehicle | 9 (2.5%) | 36 (32.1%) |
| 1 Vehicle | 60 (17.0%) | 76 (67.9%) |
| 2 Vehicles | 140 (39.6%) | 0 (0.0%) |
| 3 or more Vehicles | 145 (41.0%) | 0 (0.0%) |
| Total | 354 (100.0%) | 112 (100.0%) |
Real Estate & Mortgages in Granville South
Real Estate and Mortgage Overview in Granville South
| Characteristic | Without Mortgage | With Mortgage |
| Housing Units | 124 | 230 |
| Median Property Value | $278,300 | $356,700 |
| Median Household Income | $156,250 | $59 |
| Monthly Housing Costs | $811 | $23 |
| Real Estate Taxes | $5,327 | $0 |
Property Value by Mortgage Status in Granville South
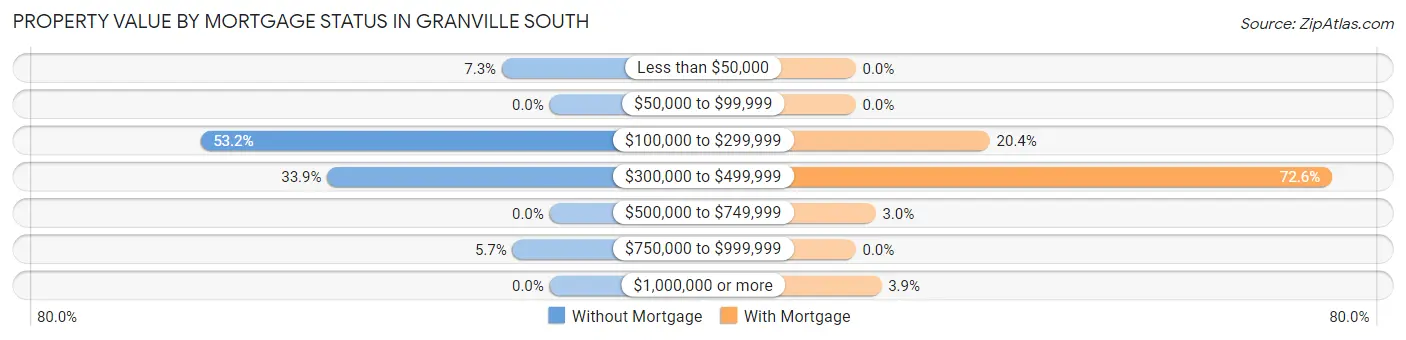
| Property Value | Without Mortgage | With Mortgage |
| Less than $50,000 | 9 (7.3%) | 0 (0.0%) |
| $50,000 to $99,999 | 0 (0.0%) | 0 (0.0%) |
| $100,000 to $299,999 | 66 (53.2%) | 47 (20.4%) |
| $300,000 to $499,999 | 42 (33.9%) | 167 (72.6%) |
| $500,000 to $749,999 | 0 (0.0%) | 7 (3.0%) |
| $750,000 to $999,999 | 7 (5.7%) | 0 (0.0%) |
| $1,000,000 or more | 0 (0.0%) | 9 (3.9%) |
| Total | 124 (100.0%) | 230 (100.0%) |
Household Income by Mortgage Status in Granville South
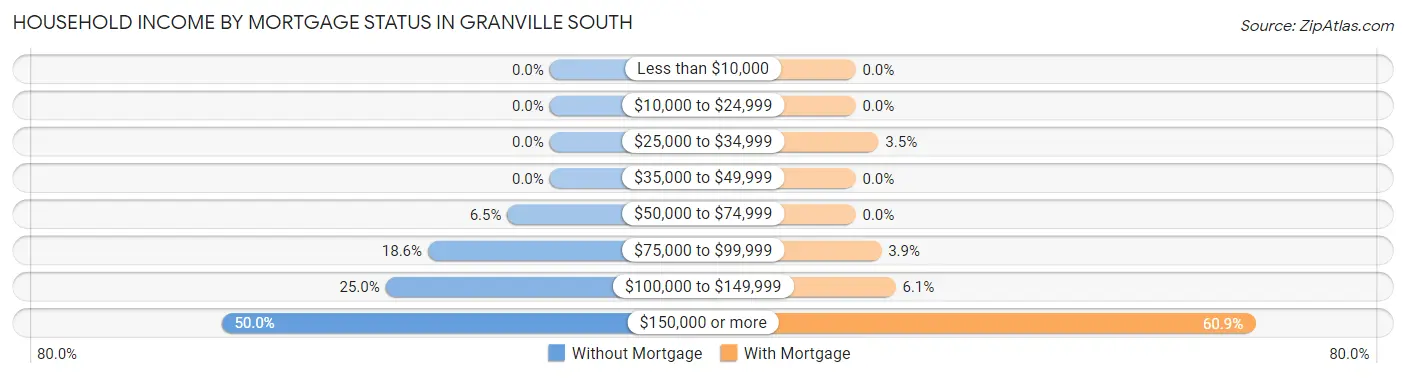
| Household Income | Without Mortgage | With Mortgage |
| Less than $10,000 | 0 (0.0%) | 0 (0.0%) |
| $10,000 to $24,999 | 0 (0.0%) | 0 (0.0%) |
| $25,000 to $34,999 | 0 (0.0%) | 8 (3.5%) |
| $35,000 to $49,999 | 0 (0.0%) | 0 (0.0%) |
| $50,000 to $74,999 | 8 (6.5%) | 0 (0.0%) |
| $75,000 to $99,999 | 23 (18.5%) | 9 (3.9%) |
| $100,000 to $149,999 | 31 (25.0%) | 14 (6.1%) |
| $150,000 or more | 62 (50.0%) | 140 (60.9%) |
| Total | 124 (100.0%) | 230 (100.0%) |
Property Value to Household Income Ratio in Granville South
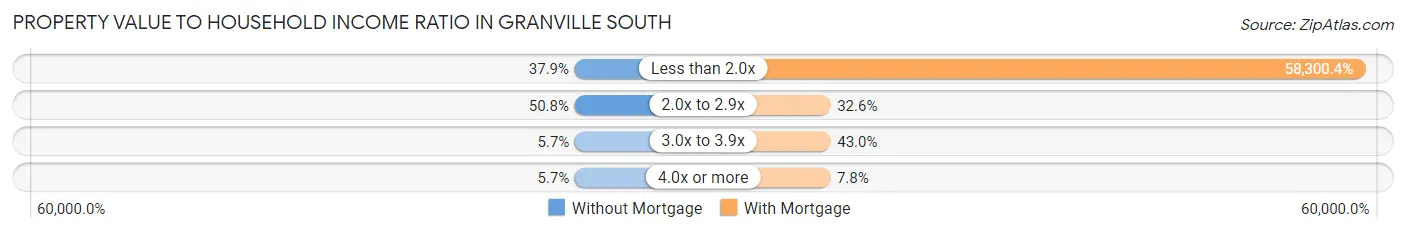
| Value-to-Income Ratio | Without Mortgage | With Mortgage |
| Less than 2.0x | 47 (37.9%) | 134,091 (58,300.4%) |
| 2.0x to 2.9x | 63 (50.8%) | 75 (32.6%) |
| 3.0x to 3.9x | 7 (5.7%) | 99 (43.0%) |
| 4.0x or more | 7 (5.7%) | 18 (7.8%) |
| Total | 124 (100.0%) | 230 (100.0%) |
Real Estate Taxes by Mortgage Status in Granville South
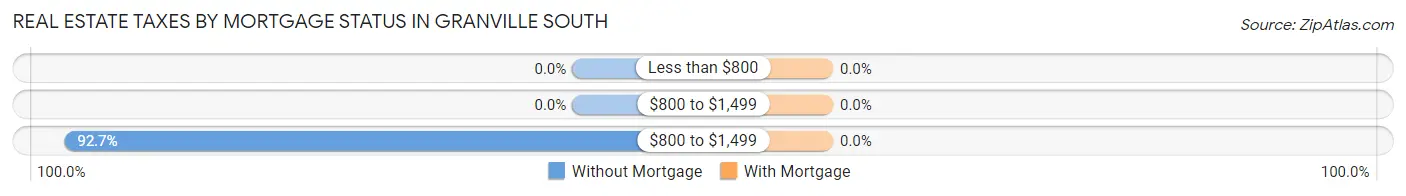
| Property Taxes | Without Mortgage | With Mortgage |
| Less than $800 | 0 (0.0%) | 0 (0.0%) |
| $800 to $1,499 | 0 (0.0%) | 0 (0.0%) |
| $800 to $1,499 | 115 (92.7%) | 0 (0.0%) |
| Total | 124 (100.0%) | 230 (100.0%) |
Health & Disability in Granville South
Health Insurance Coverage by Age in Granville South
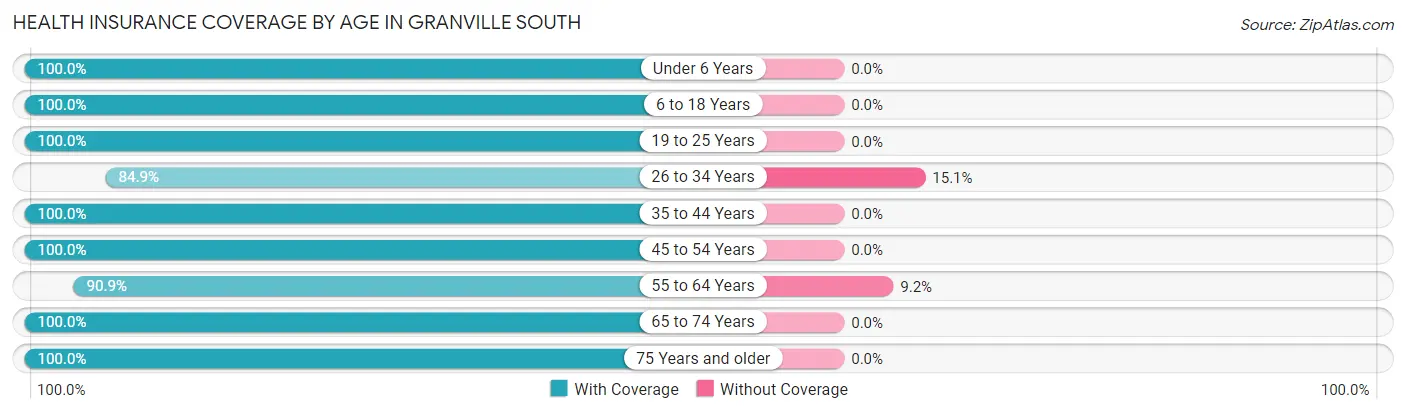
| Age Bracket | With Coverage | Without Coverage |
| Under 6 Years | 51 (100.0%) | 0 (0.0%) |
| 6 to 18 Years | 232 (100.0%) | 0 (0.0%) |
| 19 to 25 Years | 33 (100.0%) | 0 (0.0%) |
| 26 to 34 Years | 73 (84.9%) | 13 (15.1%) |
| 35 to 44 Years | 242 (100.0%) | 0 (0.0%) |
| 45 to 54 Years | 75 (100.0%) | 0 (0.0%) |
| 55 to 64 Years | 149 (90.8%) | 15 (9.1%) |
| 65 to 74 Years | 90 (100.0%) | 0 (0.0%) |
| 75 Years and older | 172 (100.0%) | 0 (0.0%) |
| Total | 1,117 (97.6%) | 28 (2.5%) |
Health Insurance Coverage by Citizenship Status in Granville South
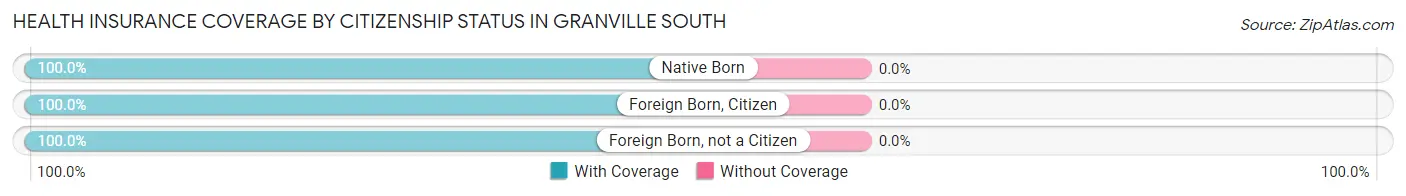
| Citizenship Status | With Coverage | Without Coverage |
| Native Born | 51 (100.0%) | 0 (0.0%) |
| Foreign Born, Citizen | 232 (100.0%) | 0 (0.0%) |
| Foreign Born, not a Citizen | 33 (100.0%) | 0 (0.0%) |
Health Insurance Coverage by Household Income in Granville South
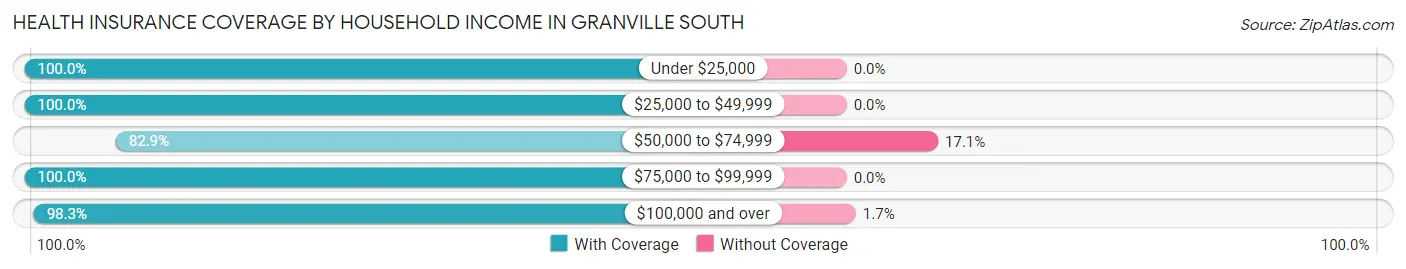
| Household Income | With Coverage | Without Coverage |
| Under $25,000 | 62 (100.0%) | 0 (0.0%) |
| $25,000 to $49,999 | 25 (100.0%) | 0 (0.0%) |
| $50,000 to $74,999 | 63 (82.9%) | 13 (17.1%) |
| $75,000 to $99,999 | 104 (100.0%) | 0 (0.0%) |
| $100,000 and over | 863 (98.3%) | 15 (1.7%) |
Public vs Private Health Insurance Coverage by Age in Granville South
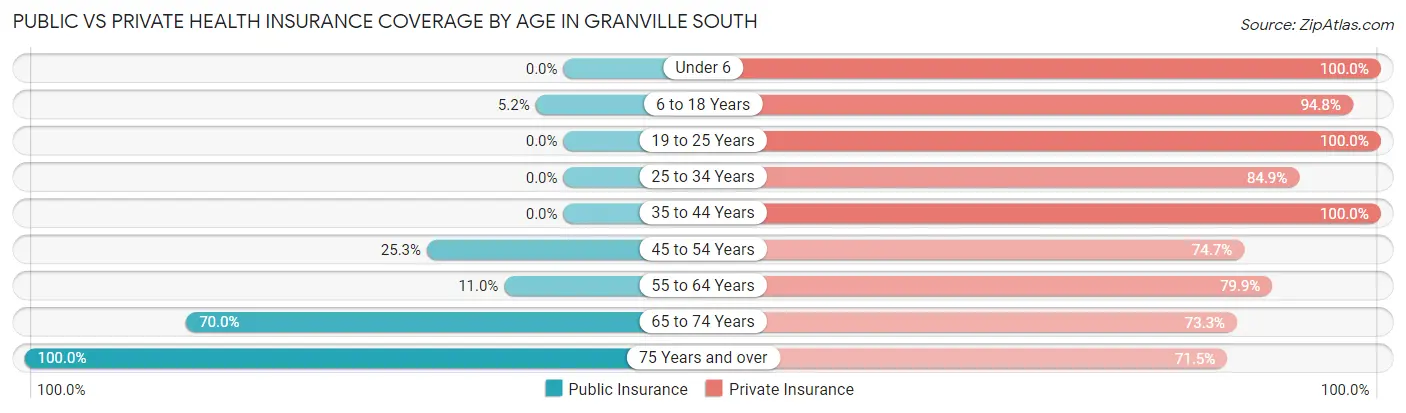
| Age Bracket | Public Insurance | Private Insurance |
| Under 6 | 0 (0.0%) | 51 (100.0%) |
| 6 to 18 Years | 12 (5.2%) | 220 (94.8%) |
| 19 to 25 Years | 0 (0.0%) | 33 (100.0%) |
| 25 to 34 Years | 0 (0.0%) | 73 (84.9%) |
| 35 to 44 Years | 0 (0.0%) | 242 (100.0%) |
| 45 to 54 Years | 19 (25.3%) | 56 (74.7%) |
| 55 to 64 Years | 18 (11.0%) | 131 (79.9%) |
| 65 to 74 Years | 63 (70.0%) | 66 (73.3%) |
| 75 Years and over | 172 (100.0%) | 123 (71.5%) |
| Total | 284 (24.8%) | 995 (86.9%) |
Disability Status by Sex by Age in Granville South
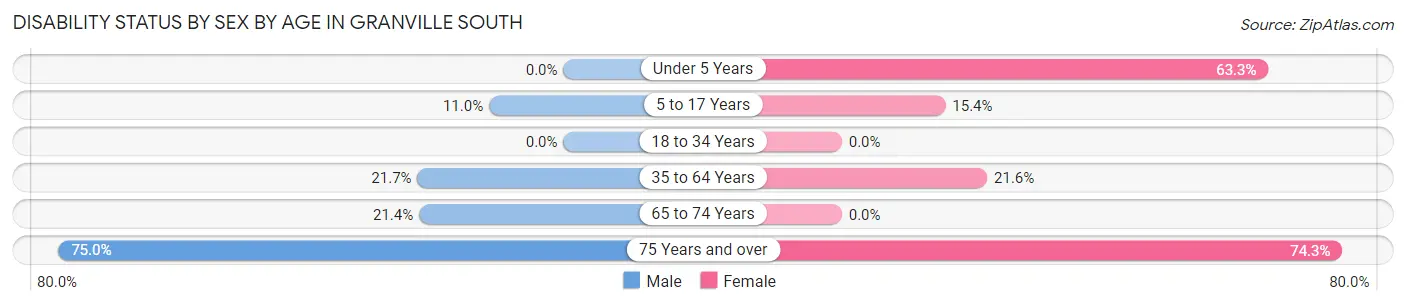
| Age Bracket | Male | Female |
| Under 5 Years | 0 (0.0%) | 19 (63.3%) |
| 5 to 17 Years | 17 (11.0%) | 12 (15.4%) |
| 18 to 34 Years | 0 (0.0%) | 0 (0.0%) |
| 35 to 64 Years | 52 (21.7%) | 52 (21.6%) |
| 65 to 74 Years | 15 (21.4%) | 0 (0.0%) |
| 75 Years and over | 21 (75.0%) | 107 (74.3%) |
Disability Class by Sex by Age in Granville South
Disability Class: Hearing Difficulty
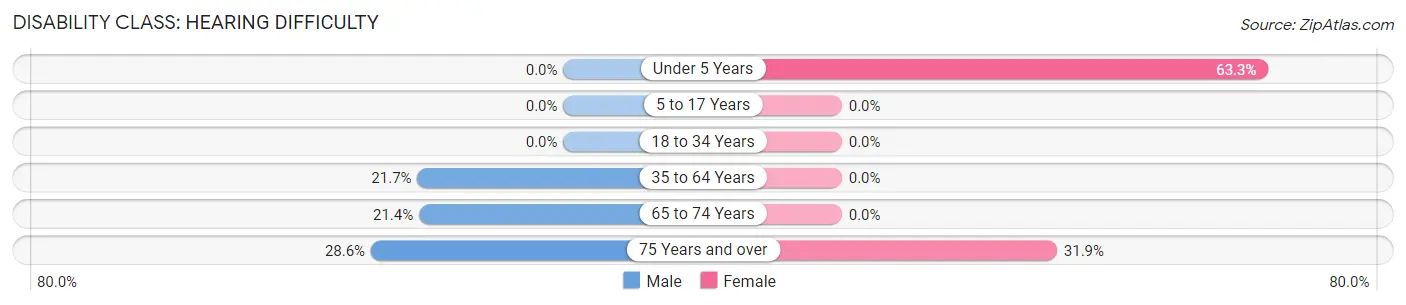
| Age Bracket | Male | Female |
| Under 5 Years | 0 (0.0%) | 19 (63.3%) |
| 5 to 17 Years | 0 (0.0%) | 0 (0.0%) |
| 18 to 34 Years | 0 (0.0%) | 0 (0.0%) |
| 35 to 64 Years | 52 (21.7%) | 0 (0.0%) |
| 65 to 74 Years | 15 (21.4%) | 0 (0.0%) |
| 75 Years and over | 8 (28.6%) | 46 (31.9%) |
Disability Class: Vision Difficulty
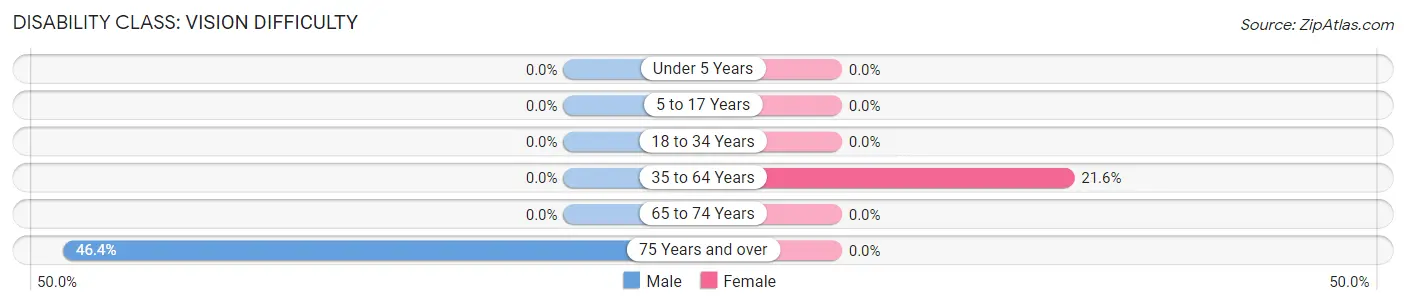
| Age Bracket | Male | Female |
| Under 5 Years | 0 (0.0%) | 0 (0.0%) |
| 5 to 17 Years | 0 (0.0%) | 0 (0.0%) |
| 18 to 34 Years | 0 (0.0%) | 0 (0.0%) |
| 35 to 64 Years | 0 (0.0%) | 52 (21.6%) |
| 65 to 74 Years | 0 (0.0%) | 0 (0.0%) |
| 75 Years and over | 13 (46.4%) | 0 (0.0%) |
Disability Class: Cognitive Difficulty
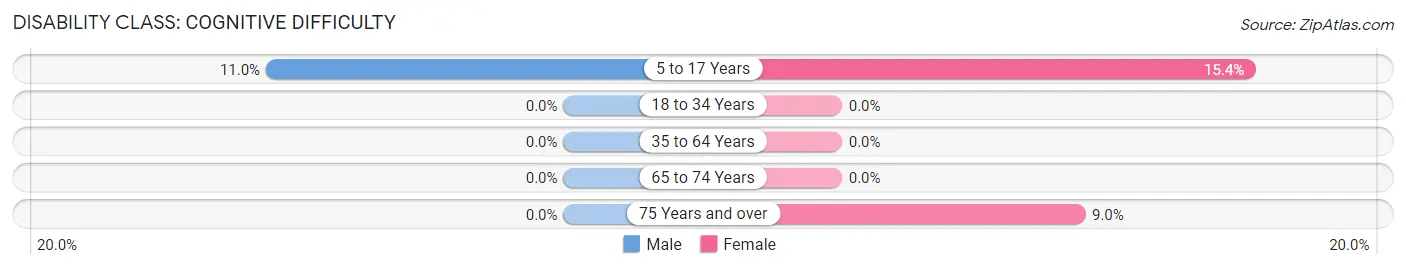
| Age Bracket | Male | Female |
| 5 to 17 Years | 17 (11.0%) | 12 (15.4%) |
| 18 to 34 Years | 0 (0.0%) | 0 (0.0%) |
| 35 to 64 Years | 0 (0.0%) | 0 (0.0%) |
| 65 to 74 Years | 0 (0.0%) | 0 (0.0%) |
| 75 Years and over | 0 (0.0%) | 13 (9.0%) |
Disability Class: Ambulatory Difficulty
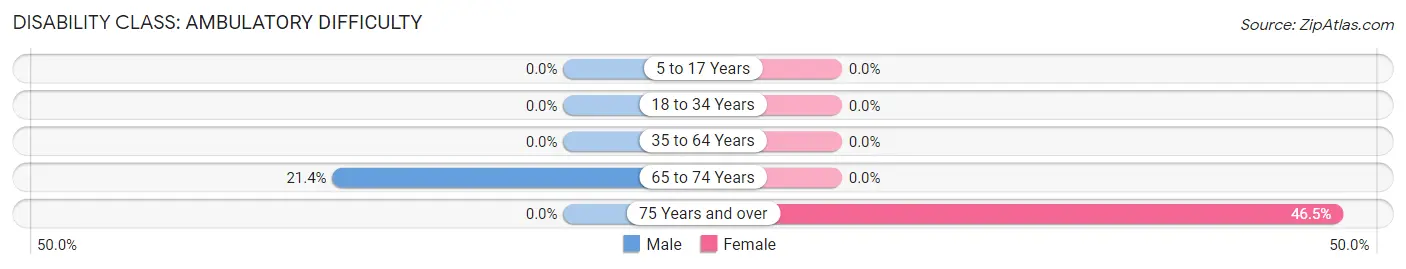
| Age Bracket | Male | Female |
| 5 to 17 Years | 0 (0.0%) | 0 (0.0%) |
| 18 to 34 Years | 0 (0.0%) | 0 (0.0%) |
| 35 to 64 Years | 0 (0.0%) | 0 (0.0%) |
| 65 to 74 Years | 15 (21.4%) | 0 (0.0%) |
| 75 Years and over | 0 (0.0%) | 67 (46.5%) |
Disability Class: Self-Care Difficulty
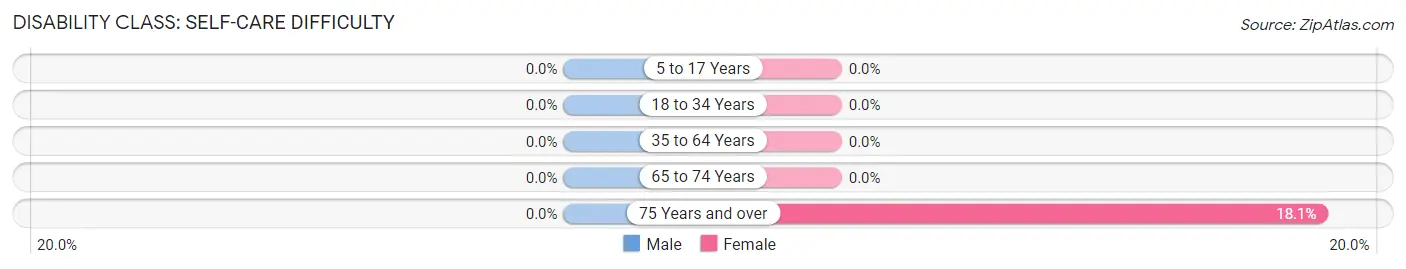
| Age Bracket | Male | Female |
| 5 to 17 Years | 0 (0.0%) | 0 (0.0%) |
| 18 to 34 Years | 0 (0.0%) | 0 (0.0%) |
| 35 to 64 Years | 0 (0.0%) | 0 (0.0%) |
| 65 to 74 Years | 0 (0.0%) | 0 (0.0%) |
| 75 Years and over | 0 (0.0%) | 26 (18.1%) |
Technology Access in Granville South
Computing Device Access in Granville South
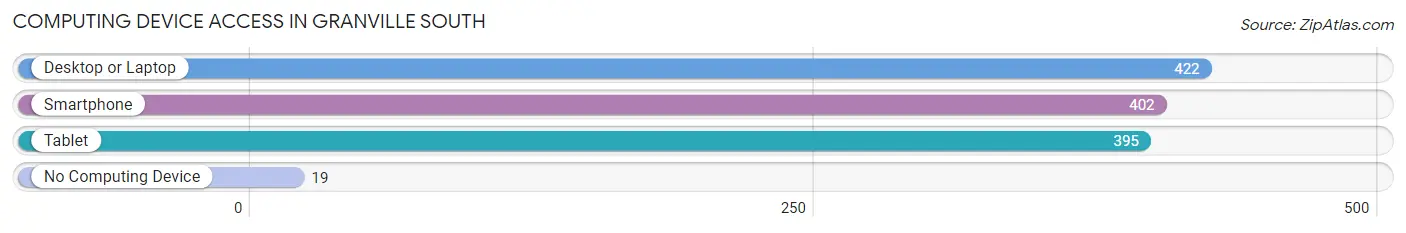
| Device Type | # Households | % Households |
| Desktop or Laptop | 422 | 90.6% |
| Smartphone | 402 | 86.3% |
| Tablet | 395 | 84.8% |
| No Computing Device | 19 | 4.1% |
| Total | 466 | 100.0% |
Internet Access in Granville South
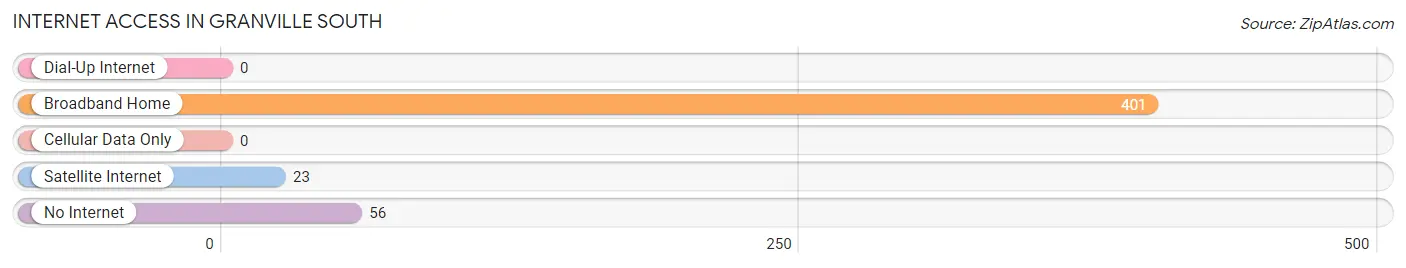
| Internet Type | # Households | % Households |
| Dial-Up Internet | 0 | 0.0% |
| Broadband Home | 401 | 86.1% |
| Cellular Data Only | 0 | 0.0% |
| Satellite Internet | 23 | 4.9% |
| No Internet | 56 | 12.0% |
| Total | 466 | 100.0% |
Granville South Summary
Granville South is a small village located in Licking County, Ohio. It is situated on the banks of the Licking River, approximately 25 miles east of Columbus. The village has a population of approximately 1,000 people and is part of the Granville Exempted Village School District.
History
Granville South was founded in 1812 by a group of settlers from Granville, Massachusetts. The settlers were led by Reverend John Walker, who was a minister in the Congregational Church. The village was originally known as Walker's Mills, but was later renamed Granville South. The village was incorporated in 1817 and was the first village in Licking County to be incorporated.
Geography
Granville South is located in the rolling hills of Licking County, Ohio. The village is situated on the banks of the Licking River, approximately 25 miles east of Columbus. The village is surrounded by farmland and is home to several small lakes and ponds. The village is located in the Central Lowland region of the United States and has a humid continental climate.
Economy
Granville South is a small village with a population of approximately 1,000 people. The village is home to several small businesses, including a grocery store, a hardware store, a restaurant, and a few other small shops. The village is also home to a few small manufacturing companies, including a furniture manufacturer and a plastics manufacturer. The village is also home to a few small farms, which produce a variety of crops, including corn, soybeans, and wheat.
Demographics
Granville South is a small village with a population of approximately 1,000 people. The village is predominantly white, with approximately 95% of the population being white. The remaining 5% of the population is made up of African Americans, Hispanics, and other ethnicities. The median household income in Granville South is approximately $45,000, and the median home value is approximately $150,000. The village has a low unemployment rate, with only 4.5% of the population being unemployed. The village also has a low crime rate, with only a few minor incidents reported each year.
Common Questions
What is Per Capita Income in Granville South?
Per Capita income in Granville South is $52,964.
What is the Median Family Income in Granville South?
Median Family Income in Granville South is $141,786.
What is the Median Household income in Granville South?
Median Household Income in Granville South is $127,083.
What is Income or Wage Gap in Granville South?
Income or Wage Gap in Granville South is 16.1%.
Women in Granville South earn 83.9 cents for every dollar earned by a man.
What is Inequality or Gini Index in Granville South?
Inequality or Gini Index in Granville South is 0.30.
What is the Total Population of Granville South?
Total Population of Granville South is 1,168.
What is the Total Male Population of Granville South?
Total Male Population of Granville South is 590.
What is the Total Female Population of Granville South?
Total Female Population of Granville South is 578.
What is the Ratio of Males per 100 Females in Granville South?
There are 102.08 Males per 100 Females in Granville South.
What is the Ratio of Females per 100 Males in Granville South?
There are 97.97 Females per 100 Males in Granville South.
What is the Median Population Age in Granville South?
Median Population Age in Granville South is 43.2 Years.
What is the Average Family Size in Granville South
Average Family Size in Granville South is 3.0 People.
What is the Average Household Size in Granville South
Average Household Size in Granville South is 2.5 People.
How Large is the Labor Force in Granville South?
There are 565 People in the Labor Forcein in Granville South.
What is the Percentage of People in the Labor Force in Granville South?
58.1% of People are in the Labor Force in Granville South.