Cities with the Largest Arab Community in Ohio
RELATED REPORTS & OPTIONS
Arab
Ohio
Compare Cities
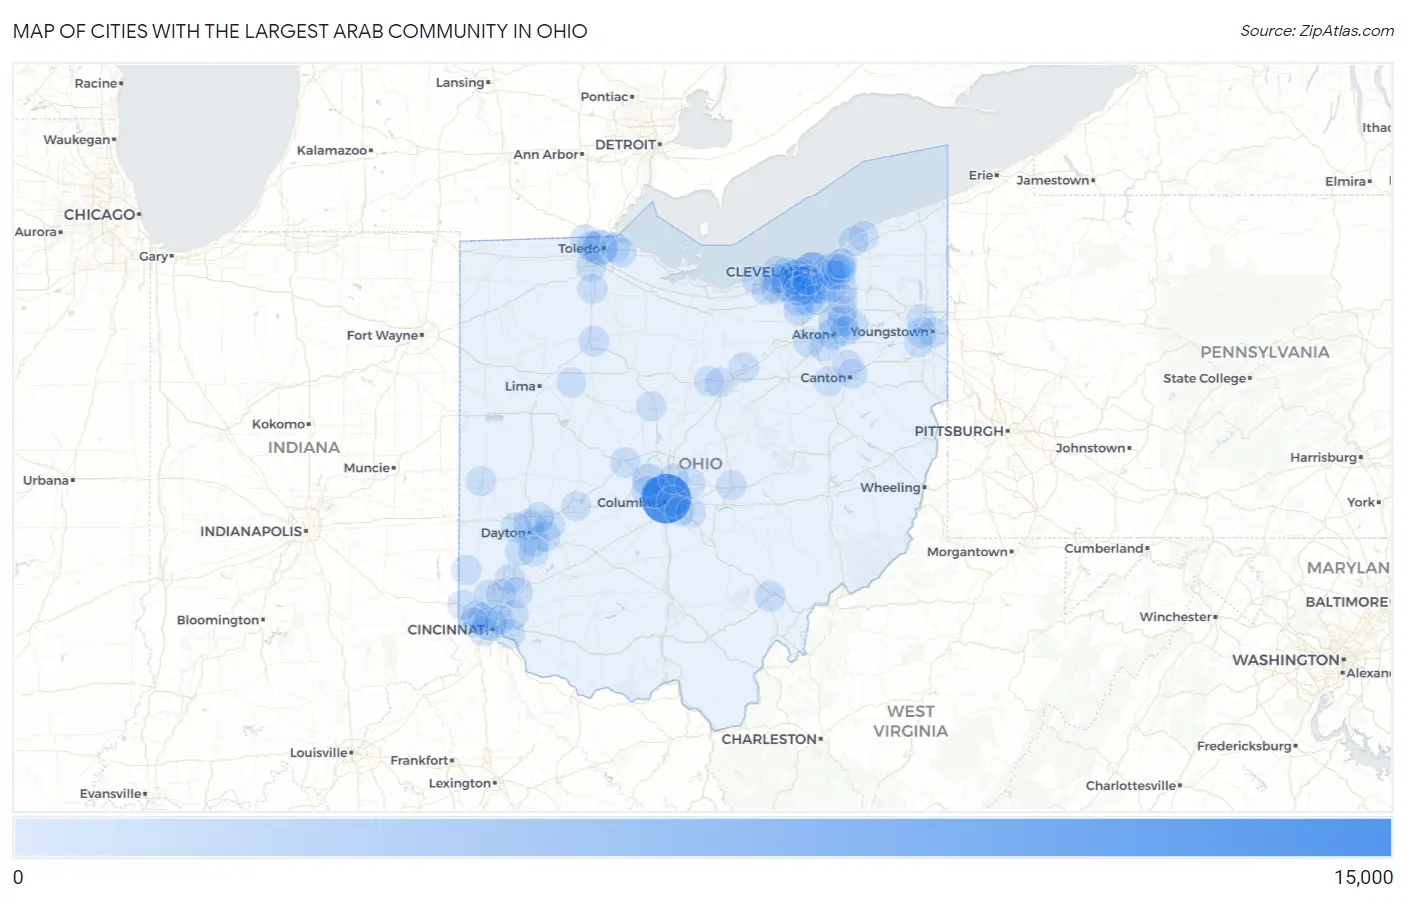
Map of Cities with the Largest Arab Community in Ohio
0
15,000
Cities with the Largest Arab Community in Ohio
| City | Arab | vs State | vs National | |
| 1. | Columbus | 12,761 | 87,611(14.57%)#1 | 2,164,088(0.59%)#8 |
| 2. | Cleveland | 5,260 | 87,611(6.00%)#2 | 2,164,088(0.24%)#36 |
| 3. | Toledo | 3,280 | 87,611(3.74%)#3 | 2,164,088(0.15%)#67 |
| 4. | Westlake | 2,246 | 87,611(2.56%)#4 | 2,164,088(0.10%)#99 |
| 5. | North Olmsted | 2,130 | 87,611(2.43%)#5 | 2,164,088(0.10%)#106 |
| 6. | Lakewood | 1,877 | 87,611(2.14%)#6 | 2,164,088(0.09%)#128 |
| 7. | Cincinnati | 1,832 | 87,611(2.09%)#7 | 2,164,088(0.08%)#134 |
| 8. | Dublin | 1,759 | 87,611(2.01%)#8 | 2,164,088(0.08%)#140 |
| 9. | Parma | 1,722 | 87,611(1.97%)#9 | 2,164,088(0.08%)#145 |
| 10. | Akron | 1,272 | 87,611(1.45%)#10 | 2,164,088(0.06%)#224 |
| 11. | Strongsville | 1,189 | 87,611(1.36%)#11 | 2,164,088(0.05%)#251 |
| 12. | Rocky River | 914 | 87,611(1.04%)#12 | 2,164,088(0.04%)#343 |
| 13. | Hilliard | 834 | 87,611(0.95%)#13 | 2,164,088(0.04%)#390 |
| 14. | Dayton | 817 | 87,611(0.93%)#14 | 2,164,088(0.04%)#401 |
| 15. | Kettering | 731 | 87,611(0.83%)#15 | 2,164,088(0.03%)#453 |
| 16. | North Royalton | 666 | 87,611(0.76%)#16 | 2,164,088(0.03%)#496 |
| 17. | Cuyahoga Falls | 663 | 87,611(0.76%)#17 | 2,164,088(0.03%)#498 |
| 18. | Mason | 617 | 87,611(0.70%)#18 | 2,164,088(0.03%)#530 |
| 19. | Sylvania | 604 | 87,611(0.69%)#19 | 2,164,088(0.03%)#545 |
| 20. | Parma Heights | 595 | 87,611(0.68%)#20 | 2,164,088(0.03%)#553 |
| 21. | Stow | 579 | 87,611(0.66%)#21 | 2,164,088(0.03%)#571 |
| 22. | Upper Arlington | 576 | 87,611(0.66%)#22 | 2,164,088(0.03%)#573 |
| 23. | Kent | 568 | 87,611(0.65%)#23 | 2,164,088(0.03%)#581 |
| 24. | North Ridgeville | 566 | 87,611(0.65%)#24 | 2,164,088(0.03%)#583 |
| 25. | Beavercreek | 546 | 87,611(0.62%)#25 | 2,164,088(0.03%)#602 |
| 26. | Athens | 503 | 87,611(0.57%)#26 | 2,164,088(0.02%)#667 |
| 27. | Bexley | 503 | 87,611(0.57%)#27 | 2,164,088(0.02%)#669 |
| 28. | Brunswick | 492 | 87,611(0.56%)#28 | 2,164,088(0.02%)#683 |
| 29. | Huber Heights | 475 | 87,611(0.54%)#29 | 2,164,088(0.02%)#701 |
| 30. | Dent | 455 | 87,611(0.52%)#30 | 2,164,088(0.02%)#729 |
| 31. | Bay Village | 423 | 87,611(0.48%)#31 | 2,164,088(0.02%)#782 |
| 32. | Seven Hills | 409 | 87,611(0.47%)#32 | 2,164,088(0.02%)#807 |
| 33. | Centerville | 400 | 87,611(0.46%)#33 | 2,164,088(0.02%)#814 |
| 34. | Monroe | 385 | 87,611(0.44%)#34 | 2,164,088(0.02%)#850 |
| 35. | Findlay | 372 | 87,611(0.42%)#35 | 2,164,088(0.02%)#877 |
| 36. | Newark | 369 | 87,611(0.42%)#36 | 2,164,088(0.02%)#885 |
| 37. | Fairview Park | 365 | 87,611(0.42%)#37 | 2,164,088(0.02%)#900 |
| 38. | Austintown | 361 | 87,611(0.41%)#38 | 2,164,088(0.02%)#912 |
| 39. | Avon Lake | 294 | 87,611(0.34%)#39 | 2,164,088(0.01%)#1,116 |
| 40. | Ashland | 290 | 87,611(0.33%)#40 | 2,164,088(0.01%)#1,127 |
| 41. | Brook Park | 290 | 87,611(0.33%)#41 | 2,164,088(0.01%)#1,128 |
| 42. | Cleveland Heights | 289 | 87,611(0.33%)#42 | 2,164,088(0.01%)#1,131 |
| 43. | Independence | 285 | 87,611(0.33%)#43 | 2,164,088(0.01%)#1,143 |
| 44. | Ottawa Hills | 283 | 87,611(0.32%)#44 | 2,164,088(0.01%)#1,151 |
| 45. | Marysville | 282 | 87,611(0.32%)#45 | 2,164,088(0.01%)#1,158 |
| 46. | Hudson | 261 | 87,611(0.30%)#46 | 2,164,088(0.01%)#1,218 |
| 47. | Bedford | 259 | 87,611(0.30%)#47 | 2,164,088(0.01%)#1,228 |
| 48. | Solon | 258 | 87,611(0.29%)#48 | 2,164,088(0.01%)#1,230 |
| 49. | Shaker Heights | 252 | 87,611(0.29%)#49 | 2,164,088(0.01%)#1,245 |
| 50. | Perrysburg | 252 | 87,611(0.29%)#50 | 2,164,088(0.01%)#1,247 |
| 51. | Pepper Pike | 247 | 87,611(0.28%)#51 | 2,164,088(0.01%)#1,263 |
| 52. | Broadview Heights | 246 | 87,611(0.28%)#52 | 2,164,088(0.01%)#1,267 |
| 53. | Westerville | 244 | 87,611(0.28%)#53 | 2,164,088(0.01%)#1,276 |
| 54. | Avon | 243 | 87,611(0.28%)#54 | 2,164,088(0.01%)#1,284 |
| 55. | Trotwood | 240 | 87,611(0.27%)#55 | 2,164,088(0.01%)#1,297 |
| 56. | Wadsworth | 221 | 87,611(0.25%)#56 | 2,164,088(0.01%)#1,383 |
| 57. | Lorain | 217 | 87,611(0.25%)#57 | 2,164,088(0.01%)#1,401 |
| 58. | Ontario | 215 | 87,611(0.25%)#58 | 2,164,088(0.01%)#1,415 |
| 59. | Barberton | 214 | 87,611(0.24%)#59 | 2,164,088(0.01%)#1,422 |
| 60. | Oregon | 211 | 87,611(0.24%)#60 | 2,164,088(0.01%)#1,444 |
| 61. | Miamisburg | 211 | 87,611(0.24%)#61 | 2,164,088(0.01%)#1,445 |
| 62. | Middleburg Heights | 210 | 87,611(0.24%)#62 | 2,164,088(0.01%)#1,452 |
| 63. | Pickerington | 209 | 87,611(0.24%)#63 | 2,164,088(0.01%)#1,459 |
| 64. | Lyndhurst | 209 | 87,611(0.24%)#64 | 2,164,088(0.01%)#1,460 |
| 65. | Twinsburg | 205 | 87,611(0.23%)#65 | 2,164,088(0.01%)#1,473 |
| 66. | Harrison | 203 | 87,611(0.23%)#66 | 2,164,088(0.01%)#1,479 |
| 67. | Monfort Heights | 201 | 87,611(0.23%)#67 | 2,164,088(0.01%)#1,489 |
| 68. | Beachwood | 199 | 87,611(0.23%)#68 | 2,164,088(0.01%)#1,502 |
| 69. | Painesville | 192 | 87,611(0.22%)#69 | 2,164,088(0.01%)#1,532 |
| 70. | Brooklyn | 188 | 87,611(0.21%)#70 | 2,164,088(0.01%)#1,567 |
| 71. | Massillon | 187 | 87,611(0.21%)#71 | 2,164,088(0.01%)#1,574 |
| 72. | New Albany | 186 | 87,611(0.21%)#72 | 2,164,088(0.01%)#1,582 |
| 73. | The Village Of Indian Hill | 184 | 87,611(0.21%)#73 | 2,164,088(0.01%)#1,595 |
| 74. | Highland Heights | 183 | 87,611(0.21%)#74 | 2,164,088(0.01%)#1,600 |
| 75. | Marion | 181 | 87,611(0.21%)#75 | 2,164,088(0.01%)#1,618 |
| 76. | Curtice | 179 | 87,611(0.20%)#76 | 2,164,088(0.01%)#1,628 |
| 77. | Delshire | 176 | 87,611(0.20%)#77 | 2,164,088(0.01%)#1,654 |
| 78. | Youngstown | 175 | 87,611(0.20%)#78 | 2,164,088(0.01%)#1,655 |
| 79. | Mayfield | 175 | 87,611(0.20%)#79 | 2,164,088(0.01%)#1,659 |
| 80. | Fruit Hill | 170 | 87,611(0.19%)#80 | 2,164,088(0.01%)#1,687 |
| 81. | Beckett Ridge | 163 | 87,611(0.19%)#81 | 2,164,088(0.01%)#1,731 |
| 82. | Bowling Green | 159 | 87,611(0.18%)#82 | 2,164,088(0.01%)#1,759 |
| 83. | Fairfield | 157 | 87,611(0.18%)#83 | 2,164,088(0.01%)#1,778 |
| 84. | Oxford | 156 | 87,611(0.18%)#84 | 2,164,088(0.01%)#1,785 |
| 85. | Blacklick Estates | 156 | 87,611(0.18%)#85 | 2,164,088(0.01%)#1,788 |
| 86. | Canfield | 153 | 87,611(0.17%)#86 | 2,164,088(0.01%)#1,809 |
| 87. | Tallmadge | 152 | 87,611(0.17%)#87 | 2,164,088(0.01%)#1,815 |
| 88. | North Canton | 150 | 87,611(0.17%)#88 | 2,164,088(0.01%)#1,826 |
| 89. | Norwood | 148 | 87,611(0.17%)#89 | 2,164,088(0.01%)#1,838 |
| 90. | Ada | 144 | 87,611(0.16%)#90 | 2,164,088(0.01%)#1,879 |
| 91. | Canton | 138 | 87,611(0.16%)#91 | 2,164,088(0.01%)#1,932 |
| 92. | Springfield | 134 | 87,611(0.15%)#92 | 2,164,088(0.01%)#1,966 |
| 93. | Fairborn | 133 | 87,611(0.15%)#93 | 2,164,088(0.01%)#1,974 |
| 94. | Mansfield | 132 | 87,611(0.15%)#94 | 2,164,088(0.01%)#1,980 |
| 95. | Mentor | 131 | 87,611(0.15%)#95 | 2,164,088(0.01%)#1,996 |
| 96. | Mack | 130 | 87,611(0.15%)#96 | 2,164,088(0.01%)#2,013 |
| 97. | Niles | 129 | 87,611(0.15%)#97 | 2,164,088(0.01%)#2,028 |
| 98. | Elyria | 126 | 87,611(0.14%)#98 | 2,164,088(0.01%)#2,060 |
| 99. | Greenville | 120 | 87,611(0.14%)#99 | 2,164,088(0.01%)#2,120 |
| 100. | Mayfield Heights | 116 | 87,611(0.13%)#100 | 2,164,088(0.01%)#2,157 |
Common Questions
What are the Top 10 Cities with the Largest Arab Community in Ohio?
Top 10 Cities with the Largest Arab Community in Ohio are:
#1
12,761
#2
5,260
#3
3,280
#4
2,246
#5
2,130
#6
1,877
#7
1,832
#8
1,759
#9
1,722
#10
1,272
What city has the Largest Arab Community in Ohio?
Columbus has the Largest Arab Community in Ohio with 12,761.
What is the Total Arab Population in the State of Ohio?
Total Arab Population in Ohio is 87,611.
What is the Total Arab Population in the United States?
Total Arab Population in the United States is 2,164,088.