Cities with the Most Immigrants from Nepal in Ohio
RELATED REPORTS & OPTIONS
Nepal
Ohio
Compare Cities
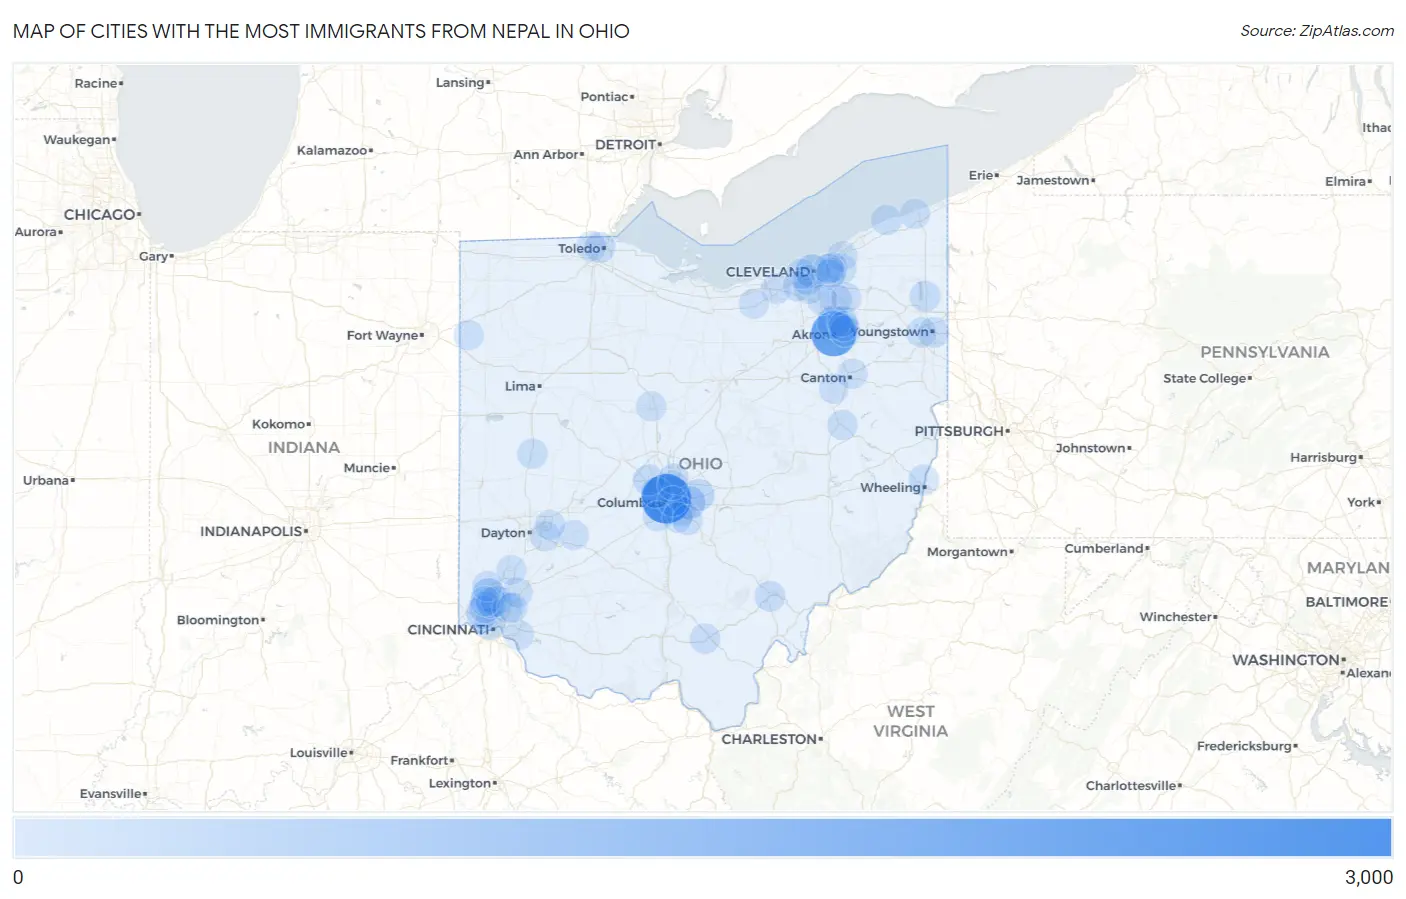
Map of Cities with the Most Immigrants from Nepal in Ohio
0
3,000
Cities with the Most Immigrants from Nepal in Ohio
| City | Nepal | vs State | vs National | |
| 1. | Columbus | 2,662 | 10,777(24.70%)#1 | 165,080(1.61%)#4 |
| 2. | Akron | 2,047 | 10,777(18.99%)#2 | 165,080(1.24%)#5 |
| 3. | Cleveland | 496 | 10,777(4.60%)#3 | 165,080(0.30%)#44 |
| 4. | Fairfield | 448 | 10,777(4.16%)#4 | 165,080(0.27%)#57 |
| 5. | Cuyahoga Falls | 416 | 10,777(3.86%)#5 | 165,080(0.25%)#64 |
| 6. | Reynoldsburg | 401 | 10,777(3.72%)#6 | 165,080(0.24%)#69 |
| 7. | White Oak | 335 | 10,777(3.11%)#7 | 165,080(0.20%)#84 |
| 8. | Pataskala | 216 | 10,777(2.00%)#8 | 165,080(0.13%)#152 |
| 9. | Cincinnati | 211 | 10,777(1.96%)#9 | 165,080(0.13%)#156 |
| 10. | Northbrook | 193 | 10,777(1.79%)#10 | 165,080(0.12%)#174 |
| 11. | Dublin | 168 | 10,777(1.56%)#11 | 165,080(0.10%)#202 |
| 12. | Tallmadge | 117 | 10,777(1.09%)#12 | 165,080(0.07%)#281 |
| 13. | Springdale | 108 | 10,777(1.00%)#13 | 165,080(0.07%)#308 |
| 14. | Forest Park | 101 | 10,777(0.94%)#14 | 165,080(0.06%)#326 |
| 15. | Cortland | 100 | 10,777(0.93%)#15 | 165,080(0.06%)#328 |
| 16. | Martins Ferry | 89 | 10,777(0.83%)#16 | 165,080(0.05%)#366 |
| 17. | Upper Arlington | 86 | 10,777(0.80%)#17 | 165,080(0.05%)#373 |
| 18. | Macedonia | 78 | 10,777(0.72%)#18 | 165,080(0.05%)#408 |
| 19. | Blue Ash | 73 | 10,777(0.68%)#19 | 165,080(0.04%)#434 |
| 20. | Toledo | 72 | 10,777(0.67%)#20 | 165,080(0.04%)#435 |
| 21. | Athens | 68 | 10,777(0.63%)#21 | 165,080(0.04%)#456 |
| 22. | Jackson | 64 | 10,777(0.59%)#22 | 165,080(0.04%)#479 |
| 23. | Youngstown | 63 | 10,777(0.58%)#23 | 165,080(0.04%)#482 |
| 24. | Stow | 61 | 10,777(0.57%)#24 | 165,080(0.04%)#489 |
| 25. | Westerville | 48 | 10,777(0.45%)#25 | 165,080(0.03%)#571 |
| 26. | Hamilton | 37 | 10,777(0.34%)#26 | 165,080(0.02%)#655 |
| 27. | Sidney | 35 | 10,777(0.32%)#27 | 165,080(0.02%)#677 |
| 28. | Reminderville | 33 | 10,777(0.31%)#28 | 165,080(0.02%)#704 |
| 29. | North Ridgeville | 32 | 10,777(0.30%)#29 | 165,080(0.02%)#709 |
| 30. | Mayfield Heights | 30 | 10,777(0.28%)#30 | 165,080(0.02%)#735 |
| 31. | Blacklick Estates | 30 | 10,777(0.28%)#31 | 165,080(0.02%)#737 |
| 32. | New Philadelphia | 29 | 10,777(0.27%)#32 | 165,080(0.02%)#749 |
| 33. | Parma | 26 | 10,777(0.24%)#33 | 165,080(0.02%)#789 |
| 34. | Munroe Falls | 26 | 10,777(0.24%)#34 | 165,080(0.02%)#799 |
| 35. | Brooklyn | 24 | 10,777(0.22%)#35 | 165,080(0.01%)#818 |
| 36. | Canal Winchester | 24 | 10,777(0.22%)#36 | 165,080(0.01%)#820 |
| 37. | North Madison | 23 | 10,777(0.21%)#37 | 165,080(0.01%)#836 |
| 38. | Withamsville | 22 | 10,777(0.20%)#38 | 165,080(0.01%)#856 |
| 39. | Mason | 20 | 10,777(0.19%)#39 | 165,080(0.01%)#875 |
| 40. | Marion | 17 | 10,777(0.16%)#40 | 165,080(0.01%)#927 |
| 41. | Willoughby Hills | 17 | 10,777(0.16%)#41 | 165,080(0.01%)#939 |
| 42. | Lakewood | 15 | 10,777(0.14%)#42 | 165,080(0.01%)#963 |
| 43. | Shaker Heights | 15 | 10,777(0.14%)#43 | 165,080(0.01%)#965 |
| 44. | Brecksville | 15 | 10,777(0.14%)#44 | 165,080(0.01%)#970 |
| 45. | Austintown | 13 | 10,777(0.12%)#45 | 165,080(0.01%)#1,005 |
| 46. | Pleasant Run | 12 | 10,777(0.11%)#46 | 165,080(0.01%)#1,040 |
| 47. | Montgomery | 11 | 10,777(0.10%)#47 | 165,080(0.01%)#1,063 |
| 48. | Ottawa Hills | 10 | 10,777(0.09%)#48 | 165,080(0.01%)#1,083 |
| 49. | Bexley | 9 | 10,777(0.08%)#49 | 165,080(0.01%)#1,098 |
| 50. | Beavercreek | 8 | 10,777(0.07%)#50 | 165,080(0.00%)#1,112 |
| 51. | South Euclid | 7 | 10,777(0.06%)#51 | 165,080(0.00%)#1,146 |
| 52. | University Heights | 7 | 10,777(0.06%)#52 | 165,080(0.00%)#1,150 |
| 53. | Brook Park | 6 | 10,777(0.06%)#53 | 165,080(0.00%)#1,169 |
| 54. | Oberlin | 6 | 10,777(0.06%)#54 | 165,080(0.00%)#1,175 |
| 55. | Grove City | 4 | 10,777(0.04%)#55 | 165,080(0.00%)#1,205 |
| 56. | Groveport | 4 | 10,777(0.04%)#56 | 165,080(0.00%)#1,212 |
| 57. | Cedarville | 4 | 10,777(0.04%)#57 | 165,080(0.00%)#1,214 |
| 58. | Payne | 4 | 10,777(0.04%)#58 | 165,080(0.00%)#1,217 |
| 59. | Canton | 3 | 10,777(0.03%)#59 | 165,080(0.00%)#1,221 |
| 60. | Cleveland Heights | 2 | 10,777(0.02%)#60 | 165,080(0.00%)#1,237 |
| 61. | Fairborn | 2 | 10,777(0.02%)#61 | 165,080(0.00%)#1,240 |
| 62. | Ashtabula | 2 | 10,777(0.02%)#62 | 165,080(0.00%)#1,244 |
| 63. | Minerva Park | 2 | 10,777(0.02%)#63 | 165,080(0.00%)#1,249 |
| 64. | Navarre | 2 | 10,777(0.02%)#64 | 165,080(0.00%)#1,250 |
| 65. | Middletown | 1 | 10,777(0.01%)#65 | 165,080(0.00%)#1,256 |
Common Questions
What are the Top 10 Cities with the Most Immigrants from Nepal in Ohio?
Top 10 Cities with the Most Immigrants from Nepal in Ohio are:
#1
2,662
#2
2,047
#3
496
#4
448
#5
416
#6
401
#7
335
#8
216
#9
211
#10
193
What city has the Most Immigrants from Nepal in Ohio?
Columbus has the Most Immigrants from Nepal in Ohio with 2,662.
What is the Total Immigrants from Nepal in the State of Ohio?
Total Immigrants from Nepal in Ohio is 10,777.
What is the Total Immigrants from Nepal in the United States?
Total Immigrants from Nepal in the United States is 165,080.