Cities with the Highest Percentage of Immigrants from Eastern Africa in Ohio
RELATED REPORTS & OPTIONS
Eastern Africa
Ohio
Compare Cities
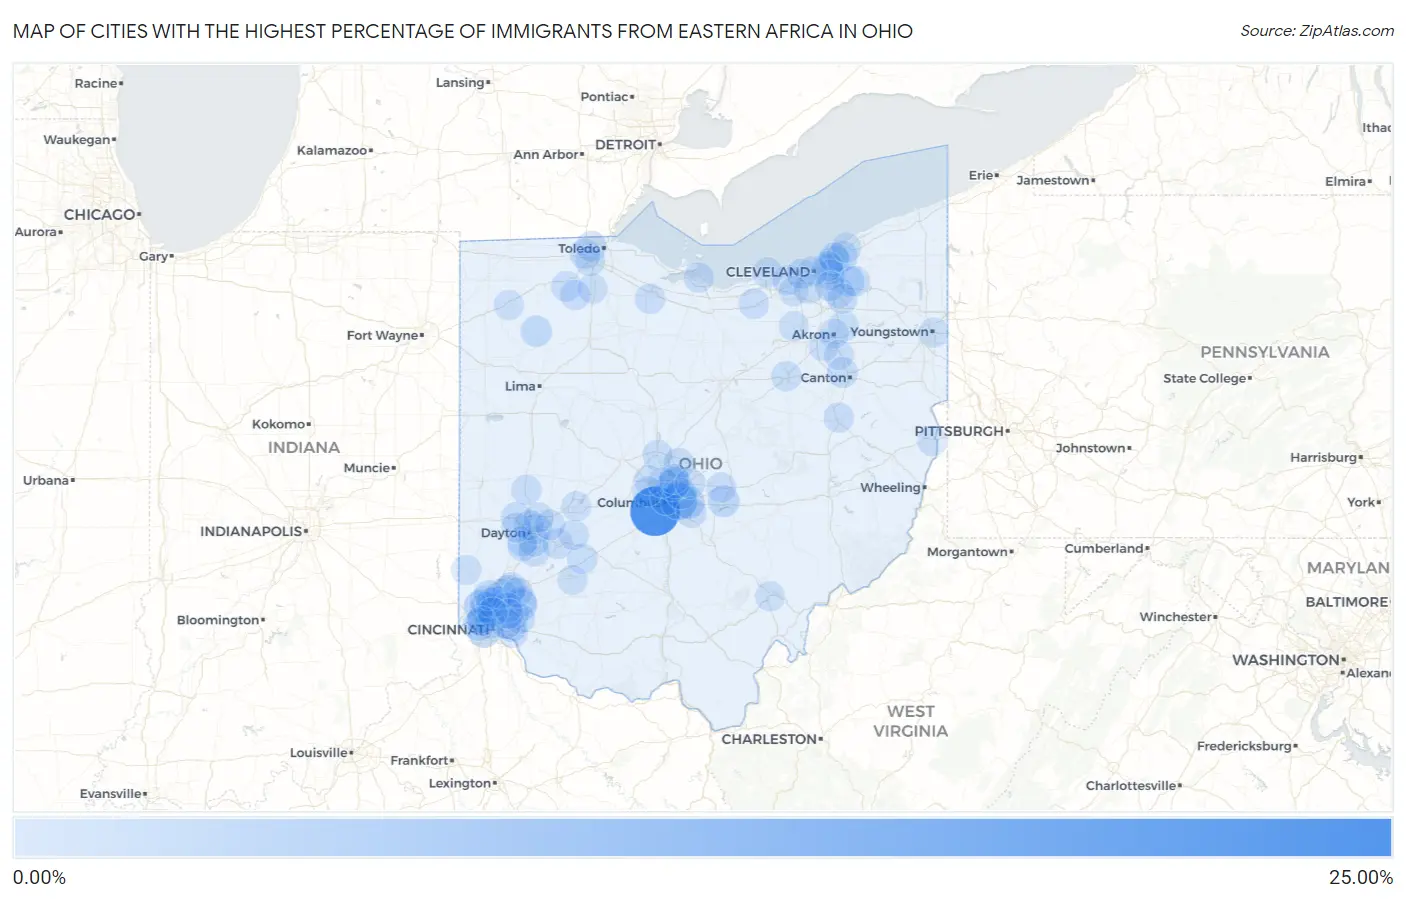
Map of Cities with the Highest Percentage of Immigrants from Eastern Africa in Ohio
0.00%
25.00%
Cities with the Highest Percentage of Immigrants from Eastern Africa in Ohio
| City | Eastern Africa | vs State | vs National | |
| 1. | Urbancrest | 22.30% | 0.30%(+22.0)#-1 | 0.23%(+22.1)#0 |
| 2. | Whitehall | 7.59% | 0.30%(+7.28)#0 | 0.23%(+7.36)#1 |
| 3. | Delshire | 3.05% | 0.30%(+2.74)#1 | 0.23%(+2.82)#2 |
| 4. | Columbus | 2.38% | 0.30%(+2.07)#3 | 0.23%(+2.15)#322 |
| 5. | Reynoldsburg | 2.33% | 0.30%(+2.03)#4 | 0.23%(+2.11)#323 |
| 6. | Loveland | 2.33% | 0.30%(+2.02)#5 | 0.23%(+2.10)#324 |
| 7. | Wetherington | 2.26% | 0.30%(+1.96)#6 | 0.23%(+2.04)#325 |
| 8. | Minerva Park | 2.22% | 0.30%(+1.91)#7 | 0.23%(+1.99)#326 |
| 9. | Dry Ridge | 2.19% | 0.30%(+1.89)#8 | 0.23%(+1.96)#327 |
| 10. | Pleasant Hills | 2.07% | 0.30%(+1.76)#9 | 0.23%(+1.84)#328 |
| 11. | Hebron | 1.93% | 0.30%(+1.63)#10 | 0.23%(+1.70)#329 |
| 12. | Huber Ridge | 1.79% | 0.30%(+1.49)#11 | 0.23%(+1.56)#330 |
| 13. | Covedale | 1.67% | 0.30%(+1.36)#12 | 0.23%(+1.44)#331 |
| 14. | Richmond Heights | 1.44% | 0.30%(+1.13)#13 | 0.23%(+1.21)#332 |
| 15. | Miller City | 1.39% | 0.30%(+1.08)#14 | 0.23%(+1.16)#333 |
| 16. | Chagrin Falls | 1.31% | 0.30%(+1.01)#15 | 0.23%(+1.08)#334 |
| 17. | Galena | 1.16% | 0.30%(+0.858)#16 | 0.23%(+0.935)#335 |
| 18. | Gahanna | 1.02% | 0.30%(+0.721)#17 | 0.23%(+0.797)#336 |
| 19. | Northbrook | 0.94% | 0.30%(+0.634)#18 | 0.23%(+0.710)#337 |
| 20. | Willoughby Hills | 0.93% | 0.30%(+0.629)#19 | 0.23%(+0.705)#338 |
| 21. | Monfort Heights | 0.90% | 0.30%(+0.595)#20 | 0.23%(+0.672)#339 |
| 22. | Hills And Dales | 0.79% | 0.30%(+0.483)#21 | 0.23%(+0.560)#340 |
| 23. | Cleveland Heights | 0.76% | 0.30%(+0.458)#22 | 0.23%(+0.535)#341 |
| 24. | Glenwillow | 0.71% | 0.30%(+0.403)#23 | 0.23%(+0.479)#342 |
| 25. | Newtown | 0.71% | 0.30%(+0.402)#24 | 0.23%(+0.479)#343 |
| 26. | Englewood | 0.67% | 0.30%(+0.366)#25 | 0.23%(+0.443)#344 |
| 27. | Centerville | 0.64% | 0.30%(+0.341)#26 | 0.23%(+0.417)#345 |
| 28. | Pleasant Run | 0.63% | 0.30%(+0.324)#27 | 0.23%(+0.400)#346 |
| 29. | Kettering | 0.63% | 0.30%(+0.322)#28 | 0.23%(+0.398)#347 |
| 30. | Pickerington | 0.62% | 0.30%(+0.320)#29 | 0.23%(+0.397)#348 |
| 31. | Cincinnati | 0.59% | 0.30%(+0.281)#30 | 0.23%(+0.358)#349 |
| 32. | Loveland Park | 0.55% | 0.30%(+0.244)#31 | 0.23%(+0.321)#350 |
| 33. | The Village Of Indian Hill | 0.55% | 0.30%(+0.241)#32 | 0.23%(+0.318)#351 |
| 34. | Four Bridges | 0.54% | 0.30%(+0.237)#33 | 0.23%(+0.314)#352 |
| 35. | Xenia | 0.54% | 0.30%(+0.233)#34 | 0.23%(+0.310)#353 |
| 36. | Oberlin | 0.54% | 0.30%(+0.233)#35 | 0.23%(+0.310)#354 |
| 37. | Springdale | 0.52% | 0.30%(+0.215)#36 | 0.23%(+0.291)#355 |
| 38. | Grand Rapids | 0.48% | 0.30%(+0.180)#37 | 0.23%(+0.257)#356 |
| 39. | Riverside | 0.45% | 0.30%(+0.141)#38 | 0.23%(+0.218)#357 |
| 40. | Troy | 0.40% | 0.30%(+0.100)#39 | 0.23%(+0.177)#358 |
| 41. | Ottawa Hills | 0.40% | 0.30%(+0.093)#40 | 0.23%(+0.170)#359 |
| 42. | Beckett Ridge | 0.39% | 0.30%(+0.091)#41 | 0.23%(+0.168)#360 |
| 43. | Shaker Heights | 0.39% | 0.30%(+0.087)#42 | 0.23%(+0.164)#361 |
| 44. | Ballville | 0.39% | 0.30%(+0.081)#43 | 0.23%(+0.158)#362 |
| 45. | Holland | 0.38% | 0.30%(+0.080)#44 | 0.23%(+0.157)#363 |
| 46. | Forestville | 0.36% | 0.30%(+0.060)#45 | 0.23%(+0.136)#364 |
| 47. | Bowersville | 0.34% | 0.30%(+0.037)#46 | 0.23%(+0.114)#365 |
| 48. | Wooster | 0.33% | 0.30%(+0.025)#47 | 0.23%(+0.102)#366 |
| 49. | South Russell | 0.33% | 0.30%(+0.024)#48 | 0.23%(+0.101)#367 |
| 50. | Sheffield Lake | 0.32% | 0.30%(+0.020)#49 | 0.23%(+0.097)#368 |
| 51. | Milford | 0.32% | 0.30%(+0.016)#50 | 0.23%(+0.093)#369 |
| 52. | Dover | 0.31% | 0.30%(+0.009)#51 | 0.23%(+0.085)#370 |
| 53. | Moraine | 0.29% | 0.30%(-0.011)#52 | 0.23%(+0.066)#371 |
| 54. | Weston | 0.28% | 0.30%(-0.028)#53 | 0.23%(+0.049)#372 |
| 55. | Delaware | 0.27% | 0.30%(-0.034)#54 | 0.23%(+0.042)#373 |
| 56. | East Cleveland | 0.26% | 0.30%(-0.045)#55 | 0.23%(+0.031)#374 |
| 57. | Dayton | 0.26% | 0.30%(-0.047)#56 | 0.23%(+0.030)#375 |
| 58. | Forest Park | 0.24% | 0.30%(-0.059)#57 | 0.23%(+0.018)#376 |
| 59. | Fairfax | 0.24% | 0.30%(-0.063)#58 | 0.23%(+0.014)#377 |
| 60. | Munroe Falls | 0.24% | 0.30%(-0.066)#59 | 0.23%(+0.011)#378 |
| 61. | Westlake | 0.23% | 0.30%(-0.072)#60 | 0.23%(+0.005)#379 |
| 62. | Granville | 0.22% | 0.30%(-0.079)#61 | 0.23%(-0.002)#380 |
| 63. | Cedarville | 0.20% | 0.30%(-0.100)#62 | 0.23%(-0.023)#381 |
| 64. | Lakewood | 0.20% | 0.30%(-0.102)#63 | 0.23%(-0.026)#382 |
| 65. | Fairborn | 0.20% | 0.30%(-0.104)#64 | 0.23%(-0.027)#383 |
| 66. | Sandusky | 0.20% | 0.30%(-0.108)#65 | 0.23%(-0.031)#384 |
| 67. | Cleveland | 0.18% | 0.30%(-0.124)#66 | 0.23%(-0.047)#385 |
| 68. | Euclid | 0.17% | 0.30%(-0.131)#67 | 0.23%(-0.055)#386 |
| 69. | Barberton | 0.17% | 0.30%(-0.133)#68 | 0.23%(-0.056)#387 |
| 70. | Dublin | 0.17% | 0.30%(-0.134)#69 | 0.23%(-0.057)#388 |
| 71. | West Carrollton | 0.16% | 0.30%(-0.143)#70 | 0.23%(-0.066)#389 |
| 72. | Worthington | 0.16% | 0.30%(-0.144)#71 | 0.23%(-0.067)#390 |
| 73. | Blue Ash | 0.16% | 0.30%(-0.146)#72 | 0.23%(-0.070)#391 |
| 74. | Westerville | 0.16% | 0.30%(-0.147)#73 | 0.23%(-0.070)#392 |
| 75. | Parma | 0.16% | 0.30%(-0.148)#74 | 0.23%(-0.071)#393 |
| 76. | Hilliard | 0.16% | 0.30%(-0.149)#75 | 0.23%(-0.072)#394 |
| 77. | Mason | 0.14% | 0.30%(-0.160)#76 | 0.23%(-0.083)#395 |
| 78. | Fairfield | 0.14% | 0.30%(-0.160)#77 | 0.23%(-0.084)#396 |
| 79. | Defiance | 0.14% | 0.30%(-0.167)#78 | 0.23%(-0.091)#397 |
| 80. | New Albany | 0.13% | 0.30%(-0.171)#79 | 0.23%(-0.094)#398 |
| 81. | Kenwood | 0.13% | 0.30%(-0.171)#80 | 0.23%(-0.094)#399 |
| 82. | Huber Heights | 0.13% | 0.30%(-0.174)#81 | 0.23%(-0.097)#400 |
| 83. | Twinsburg | 0.12% | 0.30%(-0.180)#82 | 0.23%(-0.103)#401 |
| 84. | Finneytown | 0.12% | 0.30%(-0.180)#83 | 0.23%(-0.103)#402 |
| 85. | Steubenville | 0.12% | 0.30%(-0.183)#84 | 0.23%(-0.106)#403 |
| 86. | Medina | 0.12% | 0.30%(-0.185)#85 | 0.23%(-0.108)#404 |
| 87. | Youngstown | 0.12% | 0.30%(-0.186)#86 | 0.23%(-0.109)#405 |
| 88. | Akron | 0.11% | 0.30%(-0.189)#87 | 0.23%(-0.113)#406 |
| 89. | Bowling Green | 0.11% | 0.30%(-0.191)#88 | 0.23%(-0.114)#407 |
| 90. | Willoughby | 0.10% | 0.30%(-0.199)#89 | 0.23%(-0.122)#408 |
| 91. | Oxford | 0.10% | 0.30%(-0.200)#90 | 0.23%(-0.123)#409 |
| 92. | Cheviot | 0.10% | 0.30%(-0.200)#91 | 0.23%(-0.124)#410 |
| 93. | Maumee | 0.10% | 0.30%(-0.203)#92 | 0.23%(-0.126)#411 |
| 94. | Maple Heights | 0.098% | 0.30%(-0.206)#93 | 0.23%(-0.129)#412 |
| 95. | Springfield | 0.094% | 0.30%(-0.210)#94 | 0.23%(-0.133)#413 |
| 96. | Berea | 0.092% | 0.30%(-0.212)#95 | 0.23%(-0.136)#414 |
| 97. | Wilmington | 0.087% | 0.30%(-0.217)#96 | 0.23%(-0.140)#415 |
| 98. | Trotwood | 0.086% | 0.30%(-0.217)#97 | 0.23%(-0.141)#416 |
| 99. | Green | 0.084% | 0.30%(-0.220)#98 | 0.23%(-0.143)#417 |
| 100. | Athens | 0.079% | 0.30%(-0.225)#99 | 0.23%(-0.148)#418 |
Common Questions
What are the Top 10 Cities with the Highest Percentage of Immigrants from Eastern Africa in Ohio?
Top 10 Cities with the Highest Percentage of Immigrants from Eastern Africa in Ohio are:
#1
22.30%
#2
7.59%
#3
3.05%
#4
2.38%
#5
2.33%
#6
2.33%
#7
2.26%
#8
2.22%
#9
2.19%
#10
2.07%
What city has the Highest Percentage of Immigrants from Eastern Africa in Ohio?
Urbancrest has the Highest Percentage of Immigrants from Eastern Africa in Ohio with 22.30%.
What is the Percentage of Immigrants from Eastern Africa in the State of Ohio?
Percentage of Immigrants from Eastern Africa in Ohio is 0.30%.
What is the Percentage of Immigrants from Eastern Africa in the United States?
Percentage of Immigrants from Eastern Africa in the United States is 0.23%.