Zip Codes with the Highest Percentage of Population Employed in Architecture & Engineering in Ohio
RELATED REPORTS & OPTIONS
Architecture & Engineering
Ohio
Compare Zip Codes
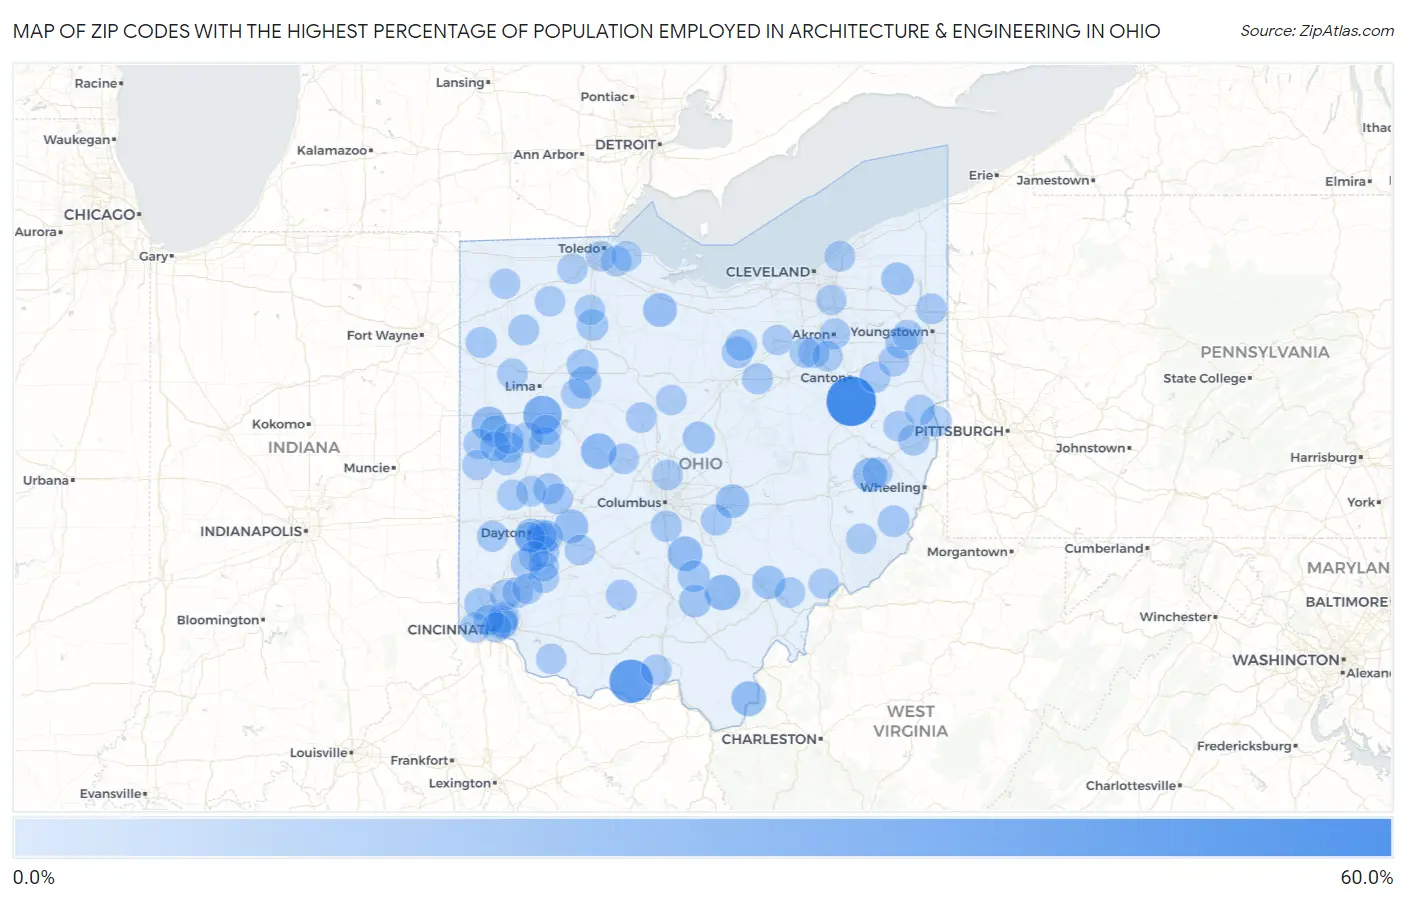
Map of Zip Codes with the Highest Percentage of Population Employed in Architecture & Engineering in Ohio
0.0%
60.0%
Zip Codes with the Highest Percentage of Population Employed in Architecture & Engineering in Ohio
| Zip Code | % Employed | vs State | vs National | |
| 1. | 44671 | 51.3% | 2.1%(+49.1)#1 | 2.1%(+49.1)#16 |
| 2. | 45616 | 36.2% | 2.1%(+34.1)#2 | 2.1%(+34.1)#38 |
| 3. | 45884 | 23.7% | 2.1%(+21.6)#3 | 2.1%(+21.6)#74 |
| 4. | 43319 | 16.9% | 2.1%(+14.7)#4 | 2.1%(+14.7)#124 |
| 5. | 45622 | 16.4% | 2.1%(+14.3)#5 | 2.1%(+14.3)#132 |
| 6. | 43154 | 14.9% | 2.1%(+12.7)#6 | 2.1%(+12.7)#150 |
| 7. | 45623 | 14.9% | 2.1%(+12.7)#7 | 2.1%(+12.7)#151 |
| 8. | 45866 | 13.6% | 2.1%(+11.5)#8 | 2.1%(+11.5)#181 |
| 9. | 43983 | 13.3% | 2.1%(+11.2)#9 | 2.1%(+11.2)#188 |
| 10. | 44836 | 12.6% | 2.1%(+10.5)#10 | 2.1%(+10.5)#212 |
| 11. | 45316 | 12.6% | 2.1%(+10.5)#11 | 2.1%(+10.5)#213 |
| 12. | 43030 | 11.9% | 2.1%(+9.79)#12 | 2.1%(+9.78)#245 |
| 13. | 45761 | 11.2% | 2.1%(+9.11)#13 | 2.1%(+9.10)#275 |
| 14. | 45469 | 10.2% | 2.1%(+8.04)#14 | 2.1%(+8.02)#333 |
| 15. | 44439 | 9.5% | 2.1%(+7.41)#15 | 2.1%(+7.40)#372 |
| 16. | 45835 | 8.8% | 2.1%(+6.63)#16 | 2.1%(+6.61)#449 |
| 17. | 45647 | 8.6% | 2.1%(+6.48)#17 | 2.1%(+6.47)#472 |
| 18. | 43350 | 8.2% | 2.1%(+6.09)#18 | 2.1%(+6.07)#534 |
| 19. | 43101 | 8.1% | 2.1%(+5.92)#19 | 2.1%(+5.90)#563 |
| 20. | 45841 | 7.4% | 2.1%(+5.27)#20 | 2.1%(+5.26)#672 |
| 21. | 43716 | 7.4% | 2.1%(+5.26)#21 | 2.1%(+5.25)#674 |
| 22. | 45889 | 7.2% | 2.1%(+5.02)#22 | 2.1%(+5.00)#714 |
| 23. | 44401 | 7.1% | 2.1%(+4.95)#23 | 2.1%(+4.94)#729 |
| 24. | 45252 | 7.0% | 2.1%(+4.82)#24 | 2.1%(+4.81)#760 |
| 25. | 44874 | 6.7% | 2.1%(+4.58)#25 | 2.1%(+4.56)#820 |
| 26. | 45430 | 6.7% | 2.1%(+4.57)#26 | 2.1%(+4.55)#825 |
| 27. | 44859 | 6.7% | 2.1%(+4.56)#27 | 2.1%(+4.54)#829 |
| 28. | 43926 | 6.4% | 2.1%(+4.29)#28 | 2.1%(+4.27)#920 |
| 29. | 45434 | 6.3% | 2.1%(+4.13)#29 | 2.1%(+4.11)#977 |
| 30. | 45851 | 6.1% | 2.1%(+4.01)#30 | 2.1%(+4.00)#1,022 |
| 31. | 43137 | 6.0% | 2.1%(+3.90)#31 | 2.1%(+3.89)#1,064 |
| 32. | 45209 | 6.0% | 2.1%(+3.90)#32 | 2.1%(+3.88)#1,065 |
| 33. | 43910 | 6.0% | 2.1%(+3.88)#33 | 2.1%(+3.87)#1,073 |
| 34. | 44840 | 6.0% | 2.1%(+3.84)#34 | 2.1%(+3.83)#1,093 |
| 35. | 45389 | 5.9% | 2.1%(+3.79)#35 | 2.1%(+3.77)#1,116 |
| 36. | 45340 | 5.9% | 2.1%(+3.78)#36 | 2.1%(+3.76)#1,121 |
| 37. | 43157 | 5.9% | 2.1%(+3.72)#37 | 2.1%(+3.70)#1,158 |
| 38. | 45831 | 5.8% | 2.1%(+3.70)#38 | 2.1%(+3.68)#1,164 |
| 39. | 45381 | 5.8% | 2.1%(+3.69)#39 | 2.1%(+3.68)#1,166 |
| 40. | 45305 | 5.8% | 2.1%(+3.69)#40 | 2.1%(+3.68)#1,167 |
| 41. | 44230 | 5.8% | 2.1%(+3.62)#41 | 2.1%(+3.61)#1,192 |
| 42. | 45302 | 5.7% | 2.1%(+3.60)#42 | 2.1%(+3.58)#1,202 |
| 43. | 45213 | 5.7% | 2.1%(+3.59)#43 | 2.1%(+3.58)#1,207 |
| 44. | 45826 | 5.7% | 2.1%(+3.54)#44 | 2.1%(+3.52)#1,233 |
| 45. | 45432 | 5.6% | 2.1%(+3.49)#45 | 2.1%(+3.47)#1,267 |
| 46. | 45066 | 5.5% | 2.1%(+3.35)#46 | 2.1%(+3.33)#1,335 |
| 47. | 45054 | 5.5% | 2.1%(+3.34)#47 | 2.1%(+3.33)#1,340 |
| 48. | 45339 | 5.5% | 2.1%(+3.32)#48 | 2.1%(+3.31)#1,357 |
| 49. | 45845 | 5.5% | 2.1%(+3.32)#49 | 2.1%(+3.30)#1,360 |
| 50. | 45123 | 5.4% | 2.1%(+3.28)#50 | 2.1%(+3.27)#1,377 |
| 51. | 43903 | 5.4% | 2.1%(+3.26)#51 | 2.1%(+3.24)#1,392 |
| 52. | 44304 | 5.3% | 2.1%(+3.19)#52 | 2.1%(+3.17)#1,434 |
| 53. | 45349 | 5.3% | 2.1%(+3.18)#53 | 2.1%(+3.16)#1,443 |
| 54. | 45208 | 5.2% | 2.1%(+3.11)#54 | 2.1%(+3.10)#1,491 |
| 55. | 45069 | 5.2% | 2.1%(+3.08)#55 | 2.1%(+3.06)#1,507 |
| 56. | 44669 | 5.2% | 2.1%(+3.03)#56 | 2.1%(+3.01)#1,549 |
| 57. | 45652 | 5.1% | 2.1%(+3.01)#57 | 2.1%(+3.00)#1,566 |
| 58. | 43040 | 5.1% | 2.1%(+2.97)#58 | 2.1%(+2.96)#1,591 |
| 59. | 45409 | 5.1% | 2.1%(+2.97)#59 | 2.1%(+2.95)#1,595 |
| 60. | 44270 | 5.1% | 2.1%(+2.95)#60 | 2.1%(+2.93)#1,608 |
| 61. | 45335 | 5.1% | 2.1%(+2.94)#61 | 2.1%(+2.92)#1,613 |
| 62. | 45363 | 5.1% | 2.1%(+2.93)#62 | 2.1%(+2.91)#1,622 |
| 63. | 44473 | 5.1% | 2.1%(+2.92)#63 | 2.1%(+2.90)#1,627 |
| 64. | 44609 | 5.0% | 2.1%(+2.90)#64 | 2.1%(+2.89)#1,640 |
| 65. | 43240 | 5.0% | 2.1%(+2.86)#65 | 2.1%(+2.85)#1,666 |
| 66. | 45040 | 4.9% | 2.1%(+2.78)#66 | 2.1%(+2.77)#1,719 |
| 67. | 45310 | 4.9% | 2.1%(+2.77)#67 | 2.1%(+2.76)#1,726 |
| 68. | 45223 | 4.9% | 2.1%(+2.77)#68 | 2.1%(+2.76)#1,727 |
| 69. | 44092 | 4.9% | 2.1%(+2.75)#69 | 2.1%(+2.73)#1,759 |
| 70. | 45068 | 4.9% | 2.1%(+2.74)#70 | 2.1%(+2.72)#1,769 |
| 71. | 44216 | 4.9% | 2.1%(+2.72)#71 | 2.1%(+2.70)#1,784 |
| 72. | 43322 | 4.8% | 2.1%(+2.71)#72 | 2.1%(+2.70)#1,789 |
| 73. | 43447 | 4.8% | 2.1%(+2.65)#73 | 2.1%(+2.63)#1,852 |
| 74. | 43786 | 4.8% | 2.1%(+2.63)#74 | 2.1%(+2.61)#1,871 |
| 75. | 45833 | 4.7% | 2.1%(+2.60)#75 | 2.1%(+2.59)#1,892 |
| 76. | 45065 | 4.7% | 2.1%(+2.60)#76 | 2.1%(+2.58)#1,897 |
| 77. | 43930 | 4.7% | 2.1%(+2.58)#77 | 2.1%(+2.56)#1,919 |
| 78. | 45729 | 4.7% | 2.1%(+2.57)#78 | 2.1%(+2.56)#1,932 |
| 79. | 45373 | 4.6% | 2.1%(+2.51)#79 | 2.1%(+2.50)#1,984 |
| 80. | 43314 | 4.6% | 2.1%(+2.49)#80 | 2.1%(+2.48)#2,000 |
| 81. | 45303 | 4.6% | 2.1%(+2.48)#81 | 2.1%(+2.46)#2,008 |
| 82. | 43519 | 4.6% | 2.1%(+2.47)#82 | 2.1%(+2.46)#2,011 |
| 83. | 43460 | 4.6% | 2.1%(+2.47)#83 | 2.1%(+2.45)#2,018 |
| 84. | 45859 | 4.6% | 2.1%(+2.46)#84 | 2.1%(+2.45)#2,021 |
| 85. | 45233 | 4.6% | 2.1%(+2.45)#85 | 2.1%(+2.44)#2,028 |
| 86. | 43571 | 4.6% | 2.1%(+2.43)#86 | 2.1%(+2.42)#2,052 |
| 87. | 45778 | 4.5% | 2.1%(+2.41)#87 | 2.1%(+2.40)#2,076 |
| 88. | 44254 | 4.5% | 2.1%(+2.40)#88 | 2.1%(+2.38)#2,089 |
| 89. | 43985 | 4.5% | 2.1%(+2.36)#89 | 2.1%(+2.35)#2,130 |
| 90. | 45458 | 4.5% | 2.1%(+2.36)#90 | 2.1%(+2.34)#2,136 |
| 91. | 43468 | 4.5% | 2.1%(+2.34)#91 | 2.1%(+2.32)#2,171 |
| 92. | 43535 | 4.5% | 2.1%(+2.32)#92 | 2.1%(+2.31)#2,183 |
| 93. | 45130 | 4.4% | 2.1%(+2.31)#93 | 2.1%(+2.29)#2,198 |
| 94. | 44451 | 4.4% | 2.1%(+2.28)#94 | 2.1%(+2.27)#2,230 |
| 95. | 45351 | 4.4% | 2.1%(+2.26)#95 | 2.1%(+2.25)#2,263 |
| 96. | 43413 | 4.4% | 2.1%(+2.23)#96 | 2.1%(+2.22)#2,301 |
| 97. | 45202 | 4.4% | 2.1%(+2.23)#97 | 2.1%(+2.21)#2,306 |
| 98. | 45334 | 4.3% | 2.1%(+2.17)#98 | 2.1%(+2.15)#2,365 |
| 99. | 44067 | 4.3% | 2.1%(+2.14)#99 | 2.1%(+2.12)#2,404 |
| 100. | 45865 | 4.3% | 2.1%(+2.12)#100 | 2.1%(+2.10)#2,426 |
Common Questions
What are the Top 10 Zip Codes with the Highest Percentage of Population Employed in Architecture & Engineering in Ohio?
Top 10 Zip Codes with the Highest Percentage of Population Employed in Architecture & Engineering in Ohio are:
What zip code has the Highest Percentage of Population Employed in Architecture & Engineering in Ohio?
44671 has the Highest Percentage of Population Employed in Architecture & Engineering in Ohio with 51.3%.
What is the Percentage of Population Employed in Architecture & Engineering in the State of Ohio?
Percentage of Population Employed in Architecture & Engineering in Ohio is 2.1%.
What is the Percentage of Population Employed in Architecture & Engineering in the United States?
Percentage of Population Employed in Architecture & Engineering in the United States is 2.1%.