Zip Codes with the Highest Percentage of Population Employed in Architecture & Engineering in Westerville, OH
RELATED REPORTS & OPTIONS
Architecture & Engineering
Westerville
Compare Zip Codes
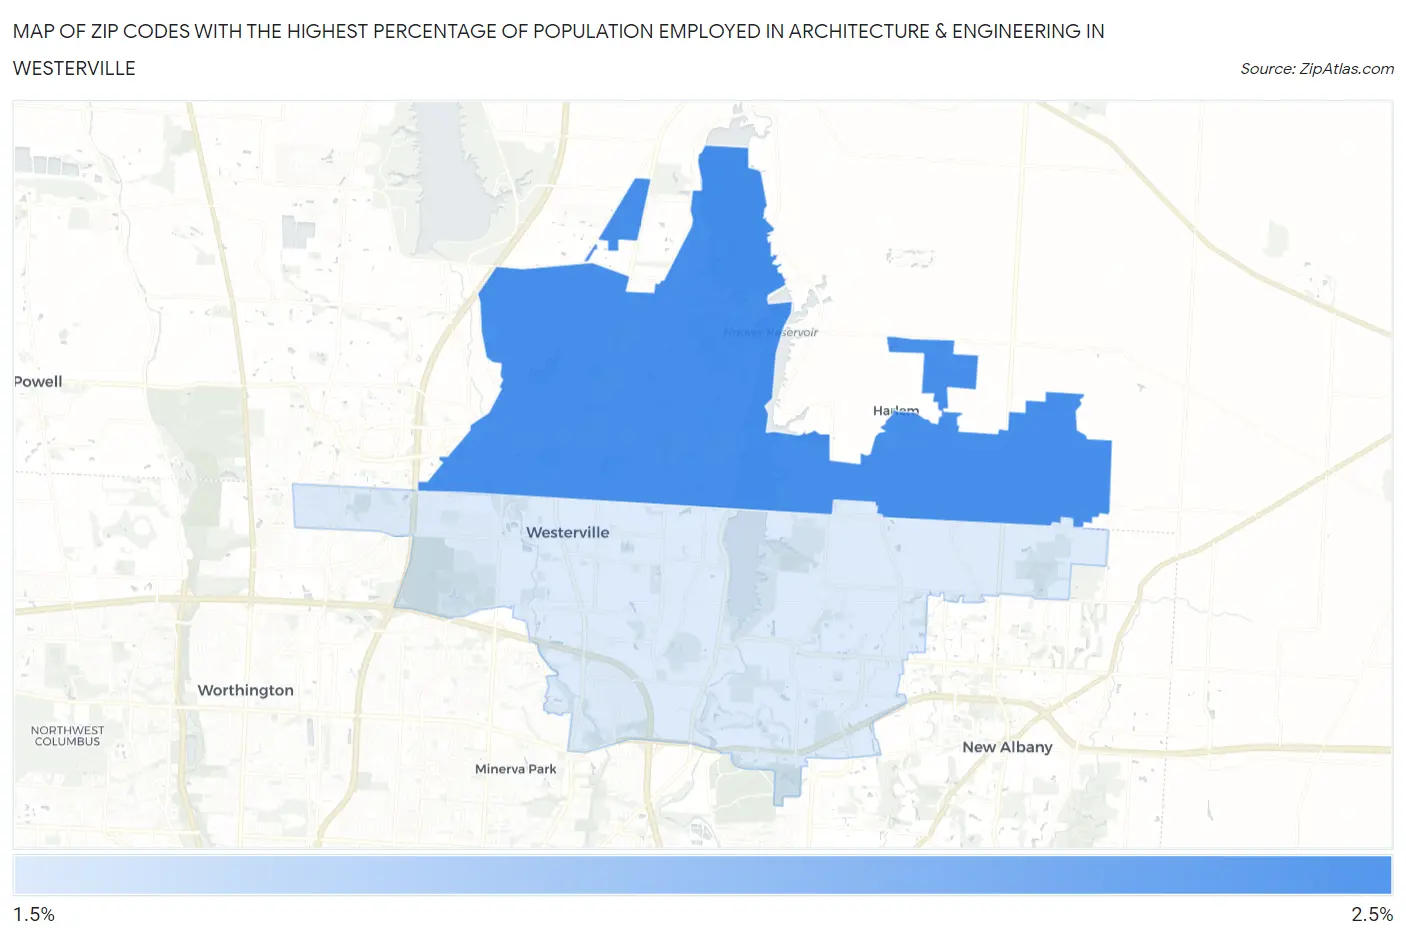
Map of Zip Codes with the Highest Percentage of Population Employed in Architecture & Engineering in Westerville
2.0%
2.2%
Zip Codes with the Highest Percentage of Population Employed in Architecture & Engineering in Westerville, OH
| Zip Code | % Employed | vs State | vs National | |
| 1. | 43082 | 2.2% | 2.1%(+0.054)#378 | 2.1%(+0.038)#8,543 |
| 2. | 43081 | 2.0% | 2.1%(-0.100)#415 | 2.1%(-0.116)#9,405 |
1
Common Questions
What are the Top Zip Codes with the Highest Percentage of Population Employed in Architecture & Engineering in Westerville, OH?
Top Zip Codes with the Highest Percentage of Population Employed in Architecture & Engineering in Westerville, OH are:
What zip code has the Highest Percentage of Population Employed in Architecture & Engineering in Westerville, OH?
43082 has the Highest Percentage of Population Employed in Architecture & Engineering in Westerville, OH with 2.2%.
What is the Percentage of Population Employed in Architecture & Engineering in Westerville, OH?
Percentage of Population Employed in Architecture & Engineering in Westerville is 2.1%.
What is the Percentage of Population Employed in Architecture & Engineering in Ohio?
Percentage of Population Employed in Architecture & Engineering in Ohio is 2.1%.
What is the Percentage of Population Employed in Architecture & Engineering in the United States?
Percentage of Population Employed in Architecture & Engineering in the United States is 2.1%.