Cities with the Highest Poverty Level Among Females Between Ages 18 and 24 in Ohio
RELATED REPORTS & OPTIONS
Highest Poverty | Female 18-24
Ohio
Compare Cities
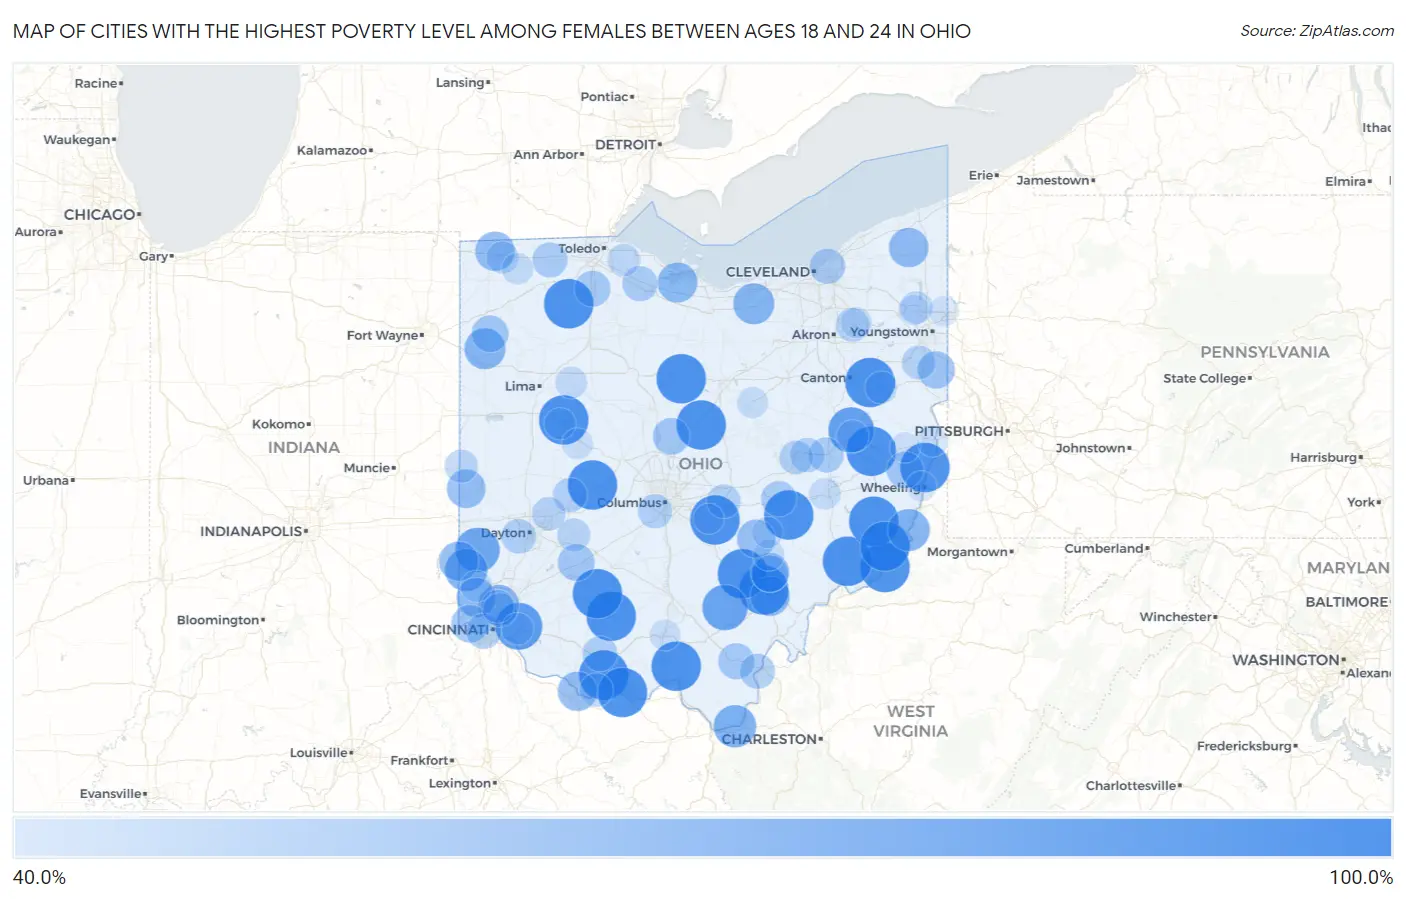
Map of Cities with the Highest Poverty Level Among Females Between Ages 18 and 24 in Ohio
0.0%
100.0%
Cities with the Highest Poverty Level Among Females Between Ages 18 and 24 in Ohio
| City | Female Poverty | vs State | vs National | |
| 1. | West Union | 100.0% | 23.5%(+76.5)#1 | 21.6%(+78.4)#25 |
| 2. | The Plains | 100.0% | 23.5%(+76.5)#2 | 21.6%(+78.4)#36 |
| 3. | Duncan Falls | 100.0% | 23.5%(+76.5)#3 | 21.6%(+78.4)#96 |
| 4. | Matamoras | 100.0% | 23.5%(+76.5)#4 | 21.6%(+78.4)#156 |
| 5. | Highland Holiday | 100.0% | 23.5%(+76.5)#5 | 21.6%(+78.4)#210 |
| 6. | South Mount Vernon | 100.0% | 23.5%(+76.5)#6 | 21.6%(+78.4)#235 |
| 7. | Clarktown | 100.0% | 23.5%(+76.5)#7 | 21.6%(+78.4)#294 |
| 8. | Chippewa Park | 100.0% | 23.5%(+76.5)#8 | 21.6%(+78.4)#301 |
| 9. | Madison Place | 100.0% | 23.5%(+76.5)#9 | 21.6%(+78.4)#364 |
| 10. | Thurston | 100.0% | 23.5%(+76.5)#10 | 21.6%(+78.4)#389 |
| 11. | Haydenville | 100.0% | 23.5%(+76.5)#11 | 21.6%(+78.4)#481 |
| 12. | Petersburg | 100.0% | 23.5%(+76.5)#12 | 21.6%(+78.4)#505 |
| 13. | North Robinson | 100.0% | 23.5%(+76.5)#13 | 21.6%(+78.4)#518 |
| 14. | Robertsville | 100.0% | 23.5%(+76.5)#14 | 21.6%(+78.4)#600 |
| 15. | Custar | 100.0% | 23.5%(+76.5)#15 | 21.6%(+78.4)#608 |
| 16. | Chesterville | 100.0% | 23.5%(+76.5)#16 | 21.6%(+78.4)#707 |
| 17. | Highland | 100.0% | 23.5%(+76.5)#17 | 21.6%(+78.4)#797 |
| 18. | Lower Salem | 100.0% | 23.5%(+76.5)#18 | 21.6%(+78.4)#826 |
| 19. | Connorville | 100.0% | 23.5%(+76.5)#19 | 21.6%(+78.4)#840 |
| 20. | Miltonsburg | 100.0% | 23.5%(+76.5)#20 | 21.6%(+78.4)#925 |
| 21. | Mutual | 100.0% | 23.5%(+76.5)#21 | 21.6%(+78.4)#926 |
| 22. | Rome Stout | 100.0% | 23.5%(+76.5)#22 | 21.6%(+78.4)#943 |
| 23. | Antioch | 100.0% | 23.5%(+76.5)#23 | 21.6%(+78.4)#956 |
| 24. | Deersville | 100.0% | 23.5%(+76.5)#24 | 21.6%(+78.4)#967 |
| 25. | Summerside | 93.3% | 23.5%(+69.8)#25 | 21.6%(+71.7)#1,028 |
| 26. | Barnhill | 90.0% | 23.5%(+66.5)#26 | 21.6%(+68.4)#1,068 |
| 27. | Medway | 89.5% | 23.5%(+66.0)#27 | 21.6%(+67.9)#1,077 |
| 28. | Mcarthur | 88.7% | 23.5%(+65.3)#28 | 21.6%(+67.2)#1,093 |
| 29. | Camden | 86.8% | 23.5%(+63.3)#29 | 21.6%(+65.2)#1,135 |
| 30. | Proctorville | 81.4% | 23.5%(+57.9)#30 | 21.6%(+59.8)#1,252 |
| 31. | Oxford | 81.2% | 23.5%(+57.7)#31 | 21.6%(+59.6)#1,261 |
| 32. | Clarington | 80.0% | 23.5%(+56.5)#32 | 21.6%(+58.4)#1,304 |
| 33. | Scott | 77.8% | 23.5%(+54.3)#33 | 21.6%(+56.2)#1,386 |
| 34. | Oberlin | 77.7% | 23.5%(+54.2)#34 | 21.6%(+56.1)#1,391 |
| 35. | Glendale | 76.5% | 23.5%(+53.0)#35 | 21.6%(+54.9)#1,421 |
| 36. | Whites Landing | 74.6% | 23.5%(+51.1)#36 | 21.6%(+53.0)#1,526 |
| 37. | Rock Creek | 73.8% | 23.5%(+50.4)#37 | 21.6%(+52.2)#1,543 |
| 38. | Athens | 73.6% | 23.5%(+50.1)#38 | 21.6%(+52.0)#1,557 |
| 39. | Kunkle | 73.5% | 23.5%(+50.1)#39 | 21.6%(+51.9)#1,559 |
| 40. | Aberdeen | 73.3% | 23.5%(+49.9)#40 | 21.6%(+51.7)#1,565 |
| 41. | College Corner | 73.3% | 23.5%(+49.9)#41 | 21.6%(+51.7)#1,569 |
| 42. | Ross | 73.1% | 23.5%(+49.7)#42 | 21.6%(+51.5)#1,574 |
| 43. | Trimble | 71.4% | 23.5%(+48.0)#43 | 21.6%(+49.8)#1,645 |
| 44. | Palestine | 71.4% | 23.5%(+48.0)#44 | 21.6%(+49.8)#1,653 |
| 45. | New Lexington | 70.4% | 23.5%(+46.9)#45 | 21.6%(+48.8)#1,687 |
| 46. | Addyston | 68.8% | 23.5%(+45.3)#46 | 21.6%(+47.2)#1,765 |
| 47. | New Waterford | 67.9% | 23.5%(+44.5)#47 | 21.6%(+46.3)#1,808 |
| 48. | Ashley | 66.7% | 23.5%(+43.2)#48 | 21.6%(+45.1)#1,860 |
| 49. | Jacksonville | 66.7% | 23.5%(+43.2)#49 | 21.6%(+45.1)#1,905 |
| 50. | Port William | 66.7% | 23.5%(+43.2)#50 | 21.6%(+45.1)#1,911 |
| 51. | Harrisville | 66.7% | 23.5%(+43.2)#51 | 21.6%(+45.1)#1,938 |
| 52. | Broughton | 66.7% | 23.5%(+43.2)#52 | 21.6%(+45.1)#1,946 |
| 53. | Rio Grande | 65.1% | 23.5%(+41.6)#53 | 21.6%(+43.5)#2,003 |
| 54. | Bowling Green | 64.4% | 23.5%(+40.9)#54 | 21.6%(+42.8)#2,039 |
| 55. | East Cleveland | 63.0% | 23.5%(+39.6)#55 | 21.6%(+41.4)#2,110 |
| 56. | North Zanesville | 62.9% | 23.5%(+39.4)#56 | 21.6%(+41.3)#2,121 |
| 57. | Delshire | 62.5% | 23.5%(+39.0)#57 | 21.6%(+40.9)#2,139 |
| 58. | Lindsey | 62.5% | 23.5%(+39.0)#58 | 21.6%(+40.9)#2,154 |
| 59. | Newcomerstown | 62.3% | 23.5%(+38.8)#59 | 21.6%(+40.7)#2,176 |
| 60. | Gallipolis | 62.2% | 23.5%(+38.7)#60 | 21.6%(+40.6)#2,180 |
| 61. | Delta | 62.2% | 23.5%(+38.7)#61 | 21.6%(+40.6)#2,184 |
| 62. | Seaman | 62.1% | 23.5%(+38.6)#62 | 21.6%(+40.5)#2,190 |
| 63. | Drexel | 61.1% | 23.5%(+37.6)#63 | 21.6%(+39.5)#2,247 |
| 64. | West Lafayette | 60.4% | 23.5%(+37.0)#64 | 21.6%(+38.8)#2,293 |
| 65. | Urbancrest | 60.0% | 23.5%(+36.5)#65 | 21.6%(+38.4)#2,307 |
| 66. | Tremont City | 60.0% | 23.5%(+36.5)#66 | 21.6%(+38.4)#2,337 |
| 67. | Hebron | 59.3% | 23.5%(+35.8)#67 | 21.6%(+37.7)#2,386 |
| 68. | Lockland | 59.2% | 23.5%(+35.7)#68 | 21.6%(+37.6)#2,392 |
| 69. | Coshocton | 59.0% | 23.5%(+35.6)#69 | 21.6%(+37.4)#2,401 |
| 70. | Washingtonville | 58.8% | 23.5%(+35.4)#70 | 21.6%(+37.2)#2,418 |
| 71. | Crystal Lakes | 58.7% | 23.5%(+35.2)#71 | 21.6%(+37.1)#2,432 |
| 72. | Kent | 58.7% | 23.5%(+35.2)#72 | 21.6%(+37.1)#2,433 |
| 73. | Manchester | 58.1% | 23.5%(+34.6)#73 | 21.6%(+36.5)#2,471 |
| 74. | Union City | 57.5% | 23.5%(+34.0)#74 | 21.6%(+35.9)#2,521 |
| 75. | Cedarville | 57.4% | 23.5%(+33.9)#75 | 21.6%(+35.8)#2,528 |
| 76. | Reedurban | 57.3% | 23.5%(+33.8)#76 | 21.6%(+35.7)#2,536 |
| 77. | Woodlawn | 57.1% | 23.5%(+33.6)#77 | 21.6%(+35.5)#2,587 |
| 78. | Morgandale | 55.8% | 23.5%(+32.4)#78 | 21.6%(+34.2)#2,657 |
| 79. | Clay Center | 55.6% | 23.5%(+32.1)#79 | 21.6%(+34.0)#2,694 |
| 80. | West Unity | 54.8% | 23.5%(+31.3)#80 | 21.6%(+33.2)#2,745 |
| 81. | Minerva | 54.7% | 23.5%(+31.2)#81 | 21.6%(+33.1)#2,750 |
| 82. | Uhrichsville | 54.5% | 23.5%(+31.0)#82 | 21.6%(+32.9)#2,773 |
| 83. | Ada | 54.3% | 23.5%(+30.8)#83 | 21.6%(+32.7)#2,783 |
| 84. | Mount Carmel | 53.9% | 23.5%(+30.4)#84 | 21.6%(+32.3)#2,818 |
| 85. | Cambridge | 53.5% | 23.5%(+30.0)#85 | 21.6%(+31.9)#2,873 |
| 86. | Archbold | 53.2% | 23.5%(+29.7)#86 | 21.6%(+31.6)#2,910 |
| 87. | Lakeview | 52.9% | 23.5%(+29.5)#87 | 21.6%(+31.3)#2,928 |
| 88. | Corning | 52.9% | 23.5%(+29.5)#88 | 21.6%(+31.3)#2,935 |
| 89. | Millville | 52.4% | 23.5%(+28.9)#89 | 21.6%(+30.8)#2,993 |
| 90. | Crooksville | 52.3% | 23.5%(+28.9)#90 | 21.6%(+30.7)#3,002 |
| 91. | Loudonville | 52.2% | 23.5%(+28.7)#91 | 21.6%(+30.6)#3,011 |
| 92. | Brady Lake | 52.0% | 23.5%(+28.5)#92 | 21.6%(+30.4)#3,029 |
| 93. | Bellefontaine | 51.8% | 23.5%(+28.4)#93 | 21.6%(+30.2)#3,039 |
| 94. | Steubenville | 51.8% | 23.5%(+28.3)#94 | 21.6%(+30.2)#3,043 |
| 95. | Piketon | 51.6% | 23.5%(+28.2)#95 | 21.6%(+30.0)#3,060 |
| 96. | Warren | 50.6% | 23.5%(+27.1)#96 | 21.6%(+29.0)#3,130 |
| 97. | Baltimore | 50.0% | 23.5%(+26.5)#97 | 21.6%(+28.4)#3,149 |
| 98. | Bridgeport | 50.0% | 23.5%(+26.5)#98 | 21.6%(+28.4)#3,171 |
| 99. | Brookfield Center | 50.0% | 23.5%(+26.5)#99 | 21.6%(+28.4)#3,179 |
| 100. | Hopedale | 50.0% | 23.5%(+26.5)#100 | 21.6%(+28.4)#3,185 |
Common Questions
What are the Top 10 Cities with the Highest Poverty Level Among Females Between Ages 18 and 24 in Ohio?
Top 10 Cities with the Highest Poverty Level Among Females Between Ages 18 and 24 in Ohio are:
#1
100.0%
#2
100.0%
#3
100.0%
#4
100.0%
#5
100.0%
#6
100.0%
#7
100.0%
#8
100.0%
#9
100.0%
#10
100.0%
What city has the Highest Poverty Level Among Females Between Ages 18 and 24 in Ohio?
West Union has the Highest Poverty Level Among Females Between Ages 18 and 24 in Ohio with 100.0%.
What is the Poverty Level Among Females Between Ages 18 and 24 in the State of Ohio?
Poverty Level Among Females Between Ages 18 and 24 in Ohio is 23.5%.
What is the Poverty Level Among Females Between Ages 18 and 24 in the United States?
Poverty Level Among Females Between Ages 18 and 24 in the United States is 21.6%.