Zip Codes with the Highest Percentage of Population Employed in Architecture & Engineering in Middletown, OH
RELATED REPORTS & OPTIONS
Architecture & Engineering
Middletown
Compare Zip Codes
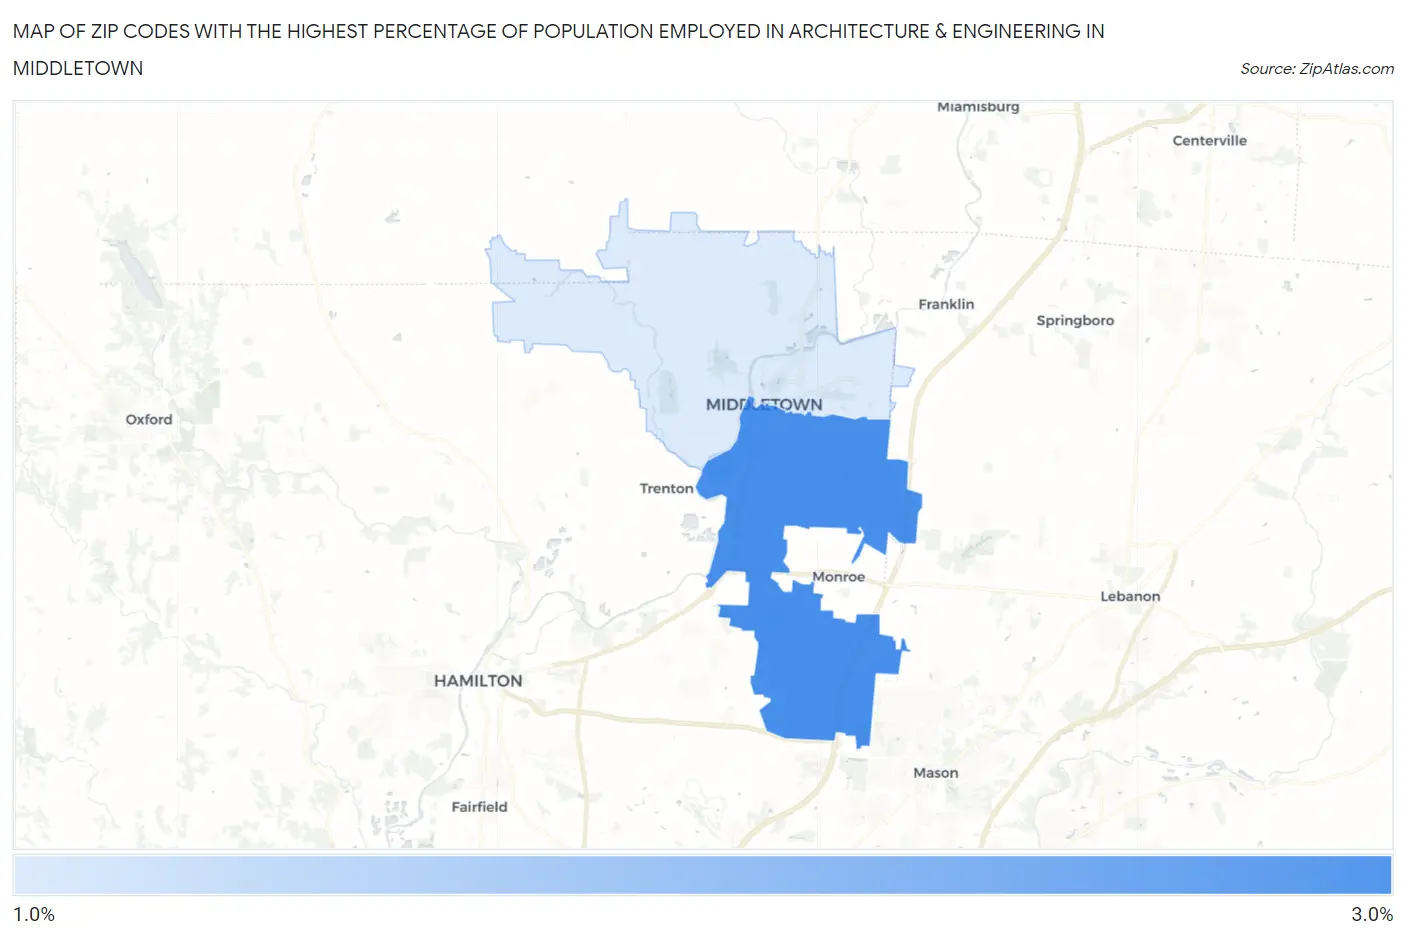
Map of Zip Codes with the Highest Percentage of Population Employed in Architecture & Engineering in Middletown
1.4%
2.7%
Zip Codes with the Highest Percentage of Population Employed in Architecture & Engineering in Middletown, OH
| Zip Code | % Employed | vs State | vs National | |
| 1. | 45044 | 2.7% | 2.1%(+0.533)#272 | 2.1%(+0.518)#6,301 |
| 2. | 45042 | 1.4% | 2.1%(-0.694)#566 | 2.1%(-0.709)#13,293 |
1
Common Questions
What are the Top Zip Codes with the Highest Percentage of Population Employed in Architecture & Engineering in Middletown, OH?
Top Zip Codes with the Highest Percentage of Population Employed in Architecture & Engineering in Middletown, OH are:
What zip code has the Highest Percentage of Population Employed in Architecture & Engineering in Middletown, OH?
45044 has the Highest Percentage of Population Employed in Architecture & Engineering in Middletown, OH with 2.7%.
What is the Percentage of Population Employed in Architecture & Engineering in Middletown, OH?
Percentage of Population Employed in Architecture & Engineering in Middletown is 1.4%.
What is the Percentage of Population Employed in Architecture & Engineering in Ohio?
Percentage of Population Employed in Architecture & Engineering in Ohio is 2.1%.
What is the Percentage of Population Employed in Architecture & Engineering in the United States?
Percentage of Population Employed in Architecture & Engineering in the United States is 2.1%.