Zip Codes with the Highest Percentage of Population Employed in Architecture & Engineering in Youngstown, OH
RELATED REPORTS & OPTIONS
Architecture & Engineering
Youngstown
Compare Zip Codes
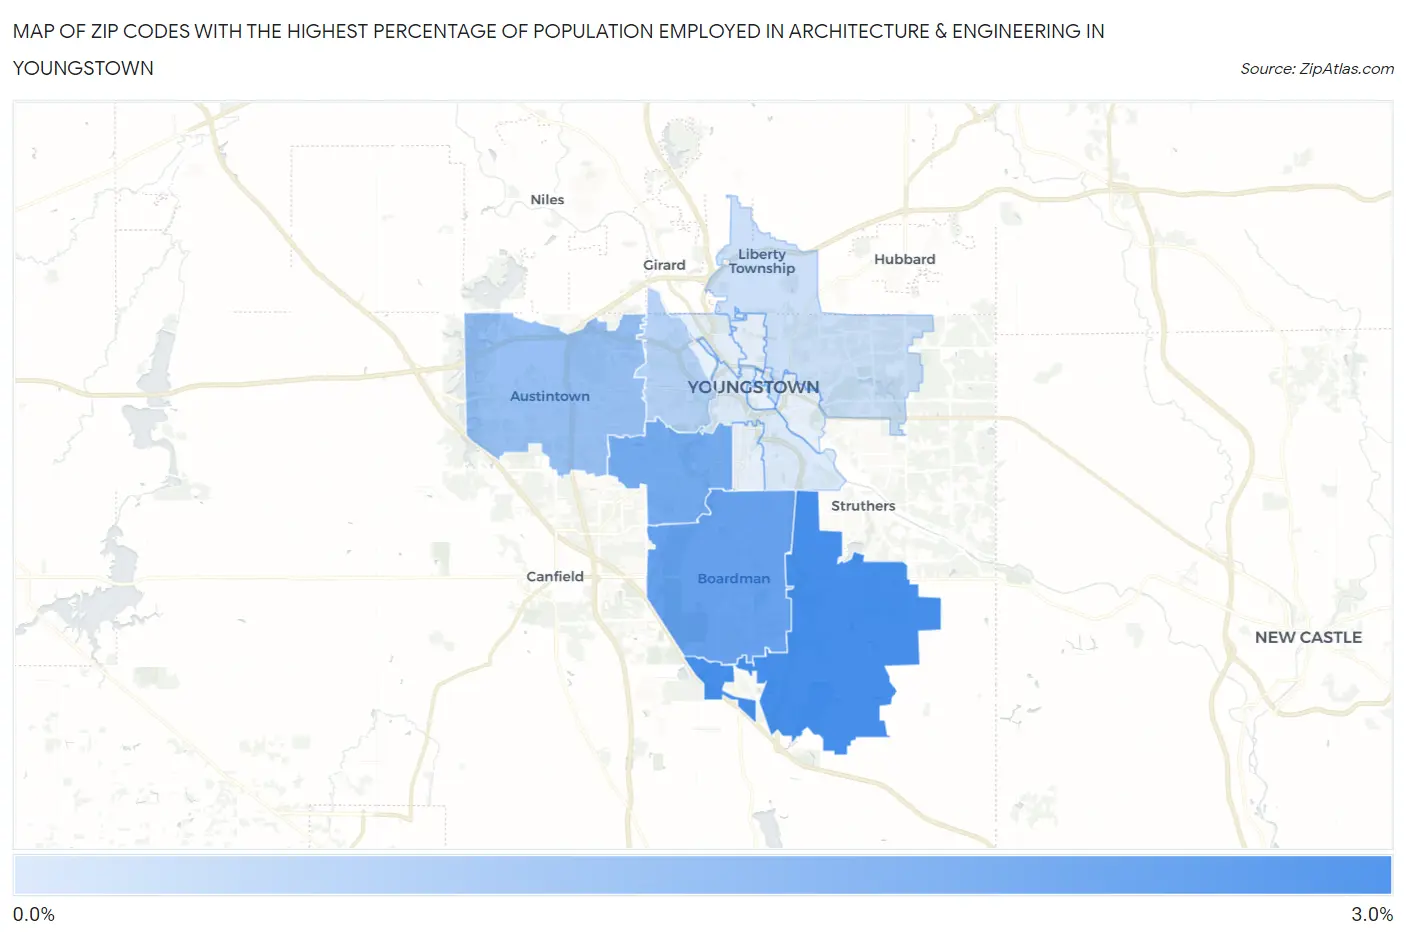
Map of Zip Codes with the Highest Percentage of Population Employed in Architecture & Engineering in Youngstown
0.24%
2.7%
Zip Codes with the Highest Percentage of Population Employed in Architecture & Engineering in Youngstown, OH
| Zip Code | % Employed | vs State | vs National | |
| 1. | 44514 | 2.7% | 2.1%(+0.581)#263 | 2.1%(+0.565)#6,102 |
| 2. | 44512 | 2.2% | 2.1%(+0.048)#381 | 2.1%(+0.033)#8,584 |
| 3. | 44511 | 2.0% | 2.1%(-0.180)#437 | 2.1%(-0.196)#9,888 |
| 4. | 44515 | 1.4% | 2.1%(-0.763)#592 | 2.1%(-0.779)#13,797 |
| 5. | 44509 | 0.87% | 2.1%(-1.26)#736 | 2.1%(-1.28)#17,579 |
| 6. | 44505 | 0.49% | 2.1%(-1.65)#840 | 2.1%(-1.66)#20,361 |
| 7. | 44502 | 0.24% | 2.1%(-1.89)#897 | 2.1%(-1.91)#21,854 |
1
Common Questions
What are the Top 10 Zip Codes with the Highest Percentage of Population Employed in Architecture & Engineering in Youngstown, OH?
Top 10 Zip Codes with the Highest Percentage of Population Employed in Architecture & Engineering in Youngstown, OH are:
What zip code has the Highest Percentage of Population Employed in Architecture & Engineering in Youngstown, OH?
44514 has the Highest Percentage of Population Employed in Architecture & Engineering in Youngstown, OH with 2.7%.
What is the Percentage of Population Employed in Architecture & Engineering in Youngstown, OH?
Percentage of Population Employed in Architecture & Engineering in Youngstown is 0.70%.
What is the Percentage of Population Employed in Architecture & Engineering in Ohio?
Percentage of Population Employed in Architecture & Engineering in Ohio is 2.1%.
What is the Percentage of Population Employed in Architecture & Engineering in the United States?
Percentage of Population Employed in Architecture & Engineering in the United States is 2.1%.