Zena, NY Map & Demographics
Zena Map
Zena Overview
$60,760
PER CAPITA INCOME
$147,708
AVG FAMILY INCOME
$110,208
AVG HOUSEHOLD INCOME
0.40
INEQUALITY / GINI INDEX
726
TOTAL POPULATION
339
MALE POPULATION
387
FEMALE POPULATION
87.60
MALES / 100 FEMALES
114.16
FEMALES / 100 MALES
59.9
MEDIAN AGE
2.4
AVG FAMILY SIZE
2.1
AVG HOUSEHOLD SIZE
400
LABOR FORCE [ PEOPLE ]
59.3%
PERCENT IN LABOR FORCE
2.0%
UNEMPLOYMENT RATE
Income in Zena
Income Overview in Zena
Per Capita Income in Zena is $60,760, while median incomes of families and households are $147,708 and $110,208 respectively.
| Characteristic | Number | Measure |
| Per Capita Income | 726 | $60,760 |
| Median Family Income | 203 | $147,708 |
| Mean Family Income | 203 | $152,800 |
| Median Household Income | 347 | $110,208 |
| Mean Household Income | 347 | $126,255 |
| Income Deficit | 203 | $0 |
| Wage / Income Gap (%) | 726 | 0.00% |
| Wage / Income Gap ($) | 726 | 100.00¢ per $1 |
| Gini / Inequality Index | 726 | 0.40 |
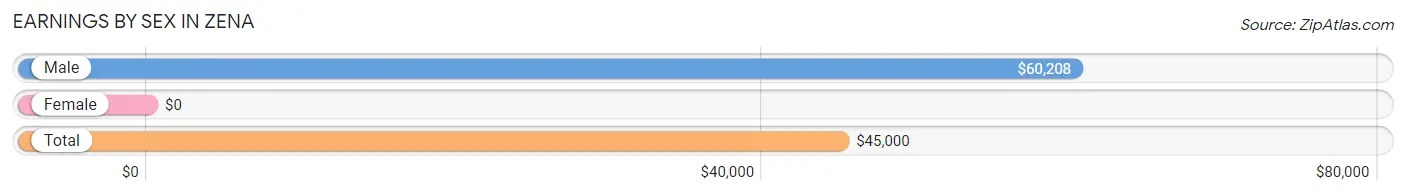
Earnings by Sex in Zena
| Sex | Number | Average Earnings |
| Male | 205 (47.4%) | $60,208 |
| Female | 227 (52.5%) | $0 |
| Total | 432 (100.0%) | $45,000 |
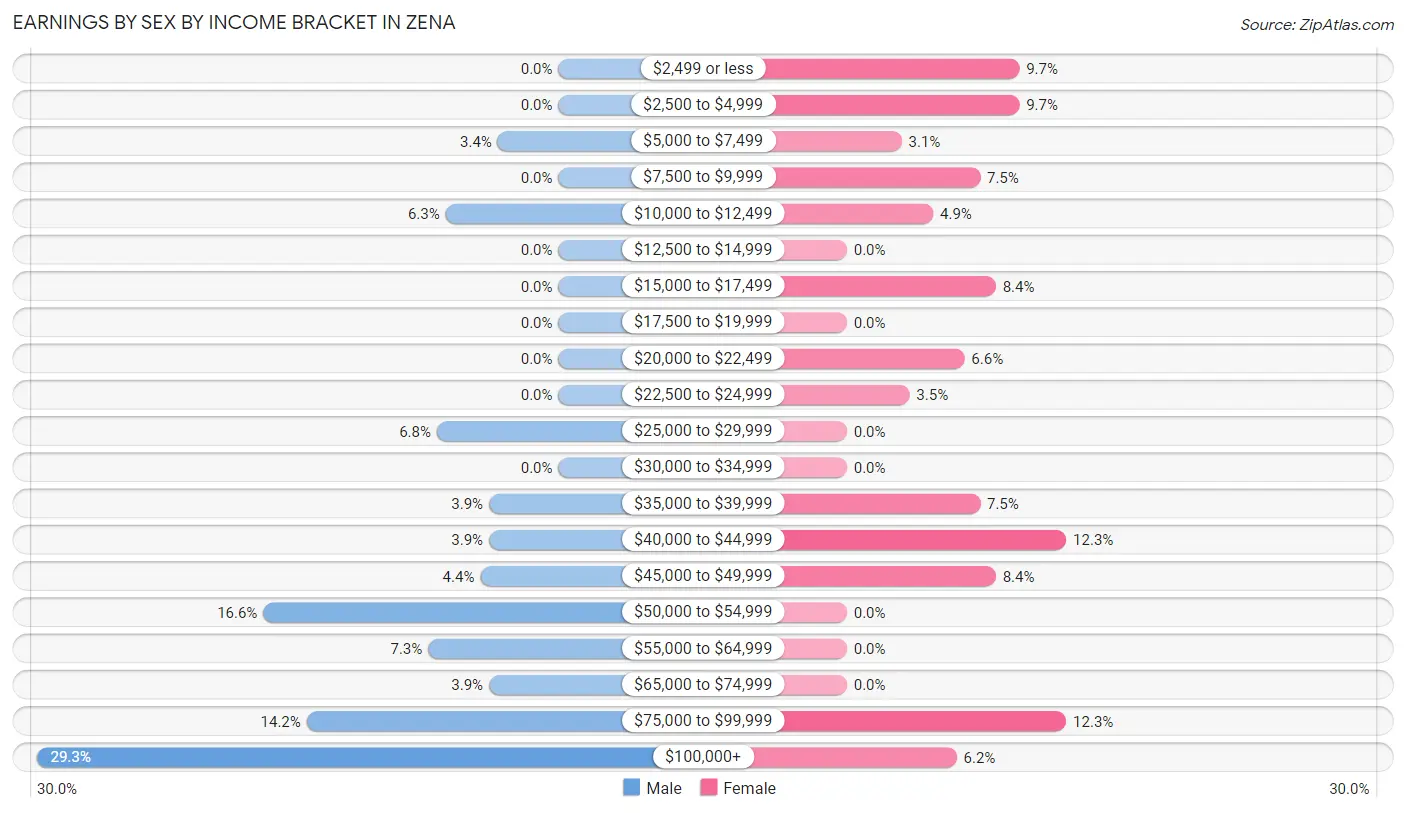
Earnings by Sex by Income Bracket in Zena
The most common earnings brackets in Zena are $100,000+ for men (60 | 29.3%) and $40,000 to $44,999 for women (28 | 12.3%).
| Income | Male | Female |
| $2,499 or less | 0 (0.0%) | 22 (9.7%) |
| $2,500 to $4,999 | 0 (0.0%) | 22 (9.7%) |
| $5,000 to $7,499 | 7 (3.4%) | 7 (3.1%) |
| $7,500 to $9,999 | 0 (0.0%) | 17 (7.5%) |
| $10,000 to $12,499 | 13 (6.3%) | 11 (4.9%) |
| $12,500 to $14,999 | 0 (0.0%) | 0 (0.0%) |
| $15,000 to $17,499 | 0 (0.0%) | 19 (8.4%) |
| $17,500 to $19,999 | 0 (0.0%) | 0 (0.0%) |
| $20,000 to $22,499 | 0 (0.0%) | 15 (6.6%) |
| $22,500 to $24,999 | 0 (0.0%) | 8 (3.5%) |
| $25,000 to $29,999 | 14 (6.8%) | 0 (0.0%) |
| $30,000 to $34,999 | 0 (0.0%) | 0 (0.0%) |
| $35,000 to $39,999 | 8 (3.9%) | 17 (7.5%) |
| $40,000 to $44,999 | 8 (3.9%) | 28 (12.3%) |
| $45,000 to $49,999 | 9 (4.4%) | 19 (8.4%) |
| $50,000 to $54,999 | 34 (16.6%) | 0 (0.0%) |
| $55,000 to $64,999 | 15 (7.3%) | 0 (0.0%) |
| $65,000 to $74,999 | 8 (3.9%) | 0 (0.0%) |
| $75,000 to $99,999 | 29 (14.1%) | 28 (12.3%) |
| $100,000+ | 60 (29.3%) | 14 (6.2%) |
| Total | 205 (100.0%) | 227 (100.0%) |
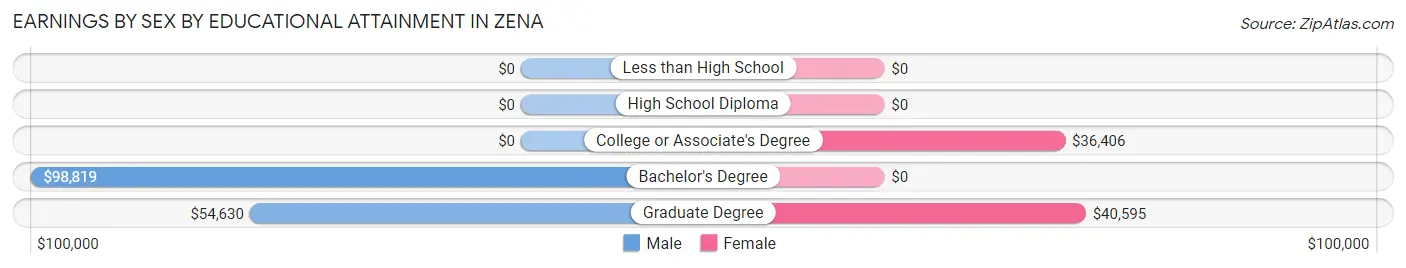
Earnings by Sex by Educational Attainment in Zena
Average earnings in Zena are $60,208 for men and $40,119 for women, a difference of 33.4%. Men with an educational attainment of bachelor's degree enjoy the highest average annual earnings of $98,819, while those with graduate degree education earn the least with $54,630. Women with an educational attainment of graduate degree earn the most with the average annual earnings of $40,595, while those with college or associate's degree education have the smallest earnings of $36,406.
| Educational Attainment | Male Income | Female Income |
| Less than High School | - | - |
| High School Diploma | - | - |
| College or Associate's Degree | - | - |
| Bachelor's Degree | $98,819 | $0 |
| Graduate Degree | $54,630 | $40,595 |
| Total | $60,208 | $40,119 |
Family Income in Zena
Family Income Brackets in Zena
According to the Zena family income data, there are 50 families falling into the $200,000+ income range, which is the most common income bracket and makes up 24.6% of all families.
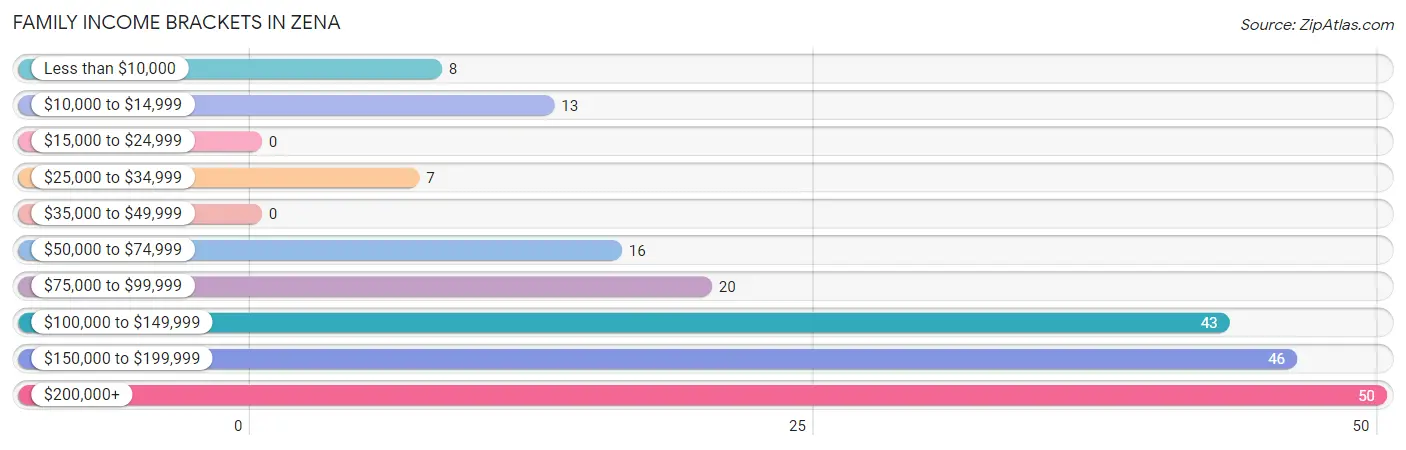
| Income Bracket | # Families | % Families |
| Less than $10,000 | 8 | 3.9% |
| $10,000 to $14,999 | 13 | 6.4% |
| $15,000 to $24,999 | 0 | 0.0% |
| $25,000 to $34,999 | 7 | 3.4% |
| $35,000 to $49,999 | 0 | 0.0% |
| $50,000 to $74,999 | 16 | 7.9% |
| $75,000 to $99,999 | 20 | 9.9% |
| $100,000 to $149,999 | 43 | 21.2% |
| $150,000 to $199,999 | 46 | 22.7% |
| $200,000+ | 50 | 24.6% |
Family Income by Famaliy Size in Zena
2-person families (162 | 79.8%) account for the highest median family income in Zena with $161,944 per family, while 2-person families (162 | 79.8%) have the highest median income of $80,972 per family member.
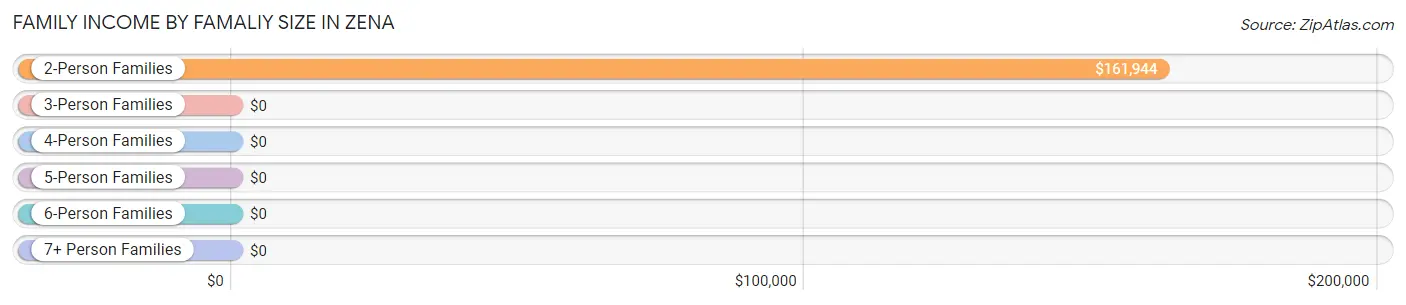
| Income Bracket | # Families | Median Income |
| 2-Person Families | 162 (79.8%) | $161,944 |
| 3-Person Families | 14 (6.9%) | $0 |
| 4-Person Families | 14 (6.9%) | $0 |
| 5-Person Families | 13 (6.4%) | $0 |
| 6-Person Families | 0 (0.0%) | $0 |
| 7+ Person Families | 0 (0.0%) | $0 |
| Total | 203 (100.0%) | $147,708 |
Family Income by Number of Earners in Zena
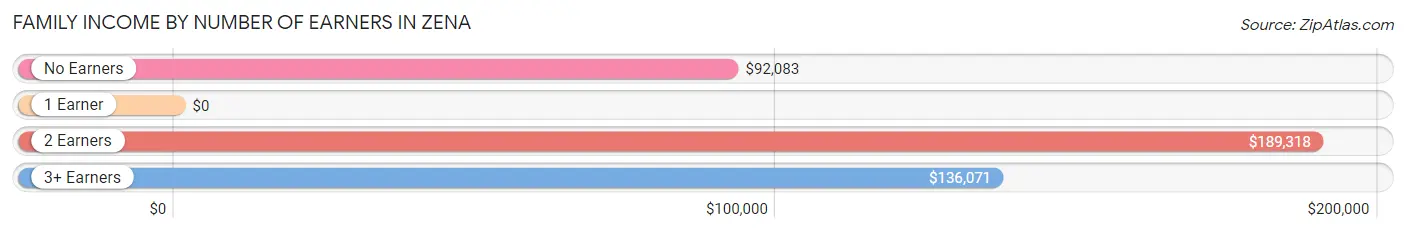
| Number of Earners | # Families | Median Income |
| No Earners | 40 (19.7%) | $92,083 |
| 1 Earner | 65 (32.0%) | $0 |
| 2 Earners | 78 (38.4%) | $189,318 |
| 3+ Earners | 20 (9.9%) | $136,071 |
| Total | 203 (100.0%) | $147,708 |
Household Income in Zena
Household Income Brackets in Zena
With 74 households falling in the category, the $200,000+ income range is the most frequent in Zena, accounting for 21.3% of all households. In contrast, only 5 households (1.4%) fall into the $35,000 to $49,999 income bracket, making it the least populous group.
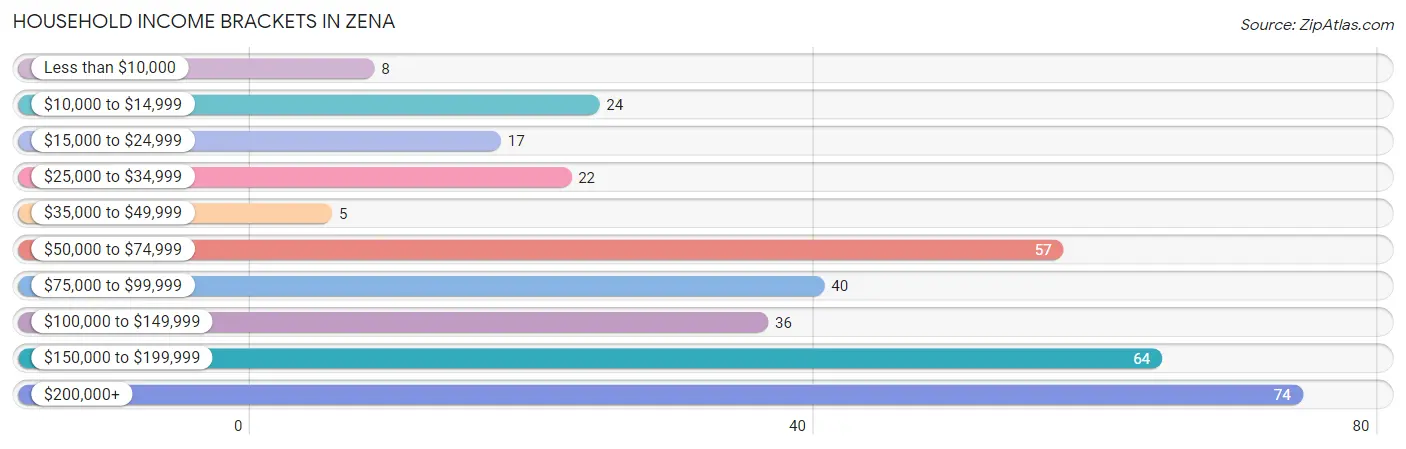
| Income Bracket | # Households | % Households |
| Less than $10,000 | 8 | 2.3% |
| $10,000 to $14,999 | 24 | 6.9% |
| $15,000 to $24,999 | 17 | 4.9% |
| $25,000 to $34,999 | 22 | 6.3% |
| $35,000 to $49,999 | 5 | 1.4% |
| $50,000 to $74,999 | 57 | 16.4% |
| $75,000 to $99,999 | 40 | 11.5% |
| $100,000 to $149,999 | 36 | 10.4% |
| $150,000 to $199,999 | 64 | 18.4% |
| $200,000+ | 74 | 21.3% |
Household Income by Householder Age in Zena
The median household income in Zena is $110,208, with the highest median household income of $186,406 found in the 25 to 44 years age bracket for the primary householder. A total of 61 households (17.6%) fall into this category.
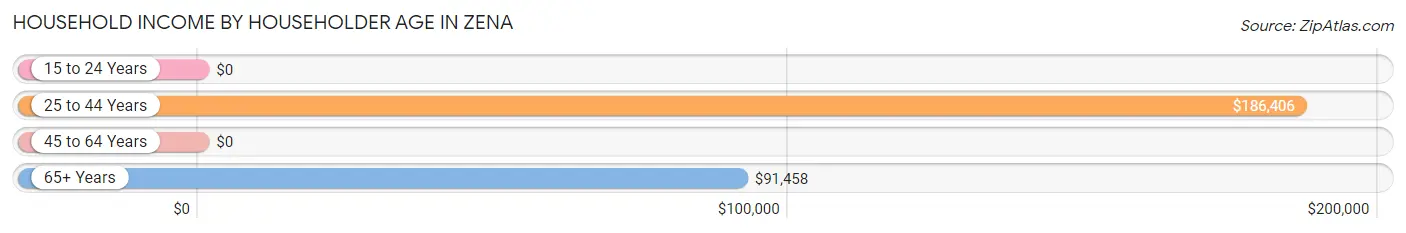
| Income Bracket | # Households | Median Income |
| 15 to 24 Years | 0 (0.0%) | $0 |
| 25 to 44 Years | 61 (17.6%) | $186,406 |
| 45 to 64 Years | 127 (36.6%) | $0 |
| 65+ Years | 159 (45.8%) | $91,458 |
| Total | 347 (100.0%) | $110,208 |
Poverty in Zena
Income Below Poverty by Sex and Age in Zena
With 20.3% poverty level for males and 13.4% for females among the residents of Zena, 12 to 14 year old males and 6 to 11 year old females are the most vulnerable to poverty, with 7 males (46.7%) and 10 females (100.0%) in their respective age groups living below the poverty level.
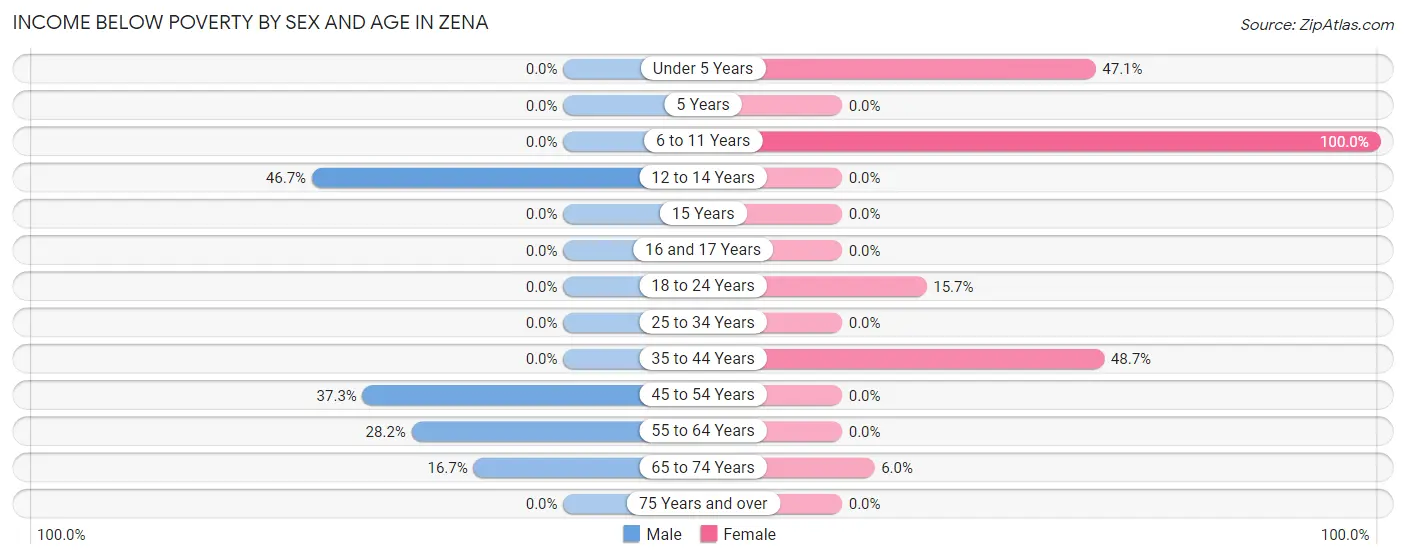
| Age Bracket | Male | Female |
| Under 5 Years | 0 (0.0%) | 8 (47.1%) |
| 5 Years | 0 (0.0%) | 0 (0.0%) |
| 6 to 11 Years | 0 (0.0%) | 10 (100.0%) |
| 12 to 14 Years | 7 (46.7%) | 0 (0.0%) |
| 15 Years | 0 (0.0%) | 0 (0.0%) |
| 16 and 17 Years | 0 (0.0%) | 0 (0.0%) |
| 18 to 24 Years | 0 (0.0%) | 8 (15.7%) |
| 25 to 34 Years | 0 (0.0%) | 0 (0.0%) |
| 35 to 44 Years | 0 (0.0%) | 18 (48.6%) |
| 45 to 54 Years | 19 (37.2%) | 0 (0.0%) |
| 55 to 64 Years | 29 (28.2%) | 0 (0.0%) |
| 65 to 74 Years | 14 (16.7%) | 8 (6.0%) |
| 75 Years and over | 0 (0.0%) | 0 (0.0%) |
| Total | 69 (20.3%) | 52 (13.4%) |
Income Above Poverty by Sex and Age in Zena
According to the poverty statistics in Zena, males aged under 5 years and females aged 25 to 34 years are the age groups that are most secure financially, with 100.0% of males and 100.0% of females in these age groups living above the poverty line.
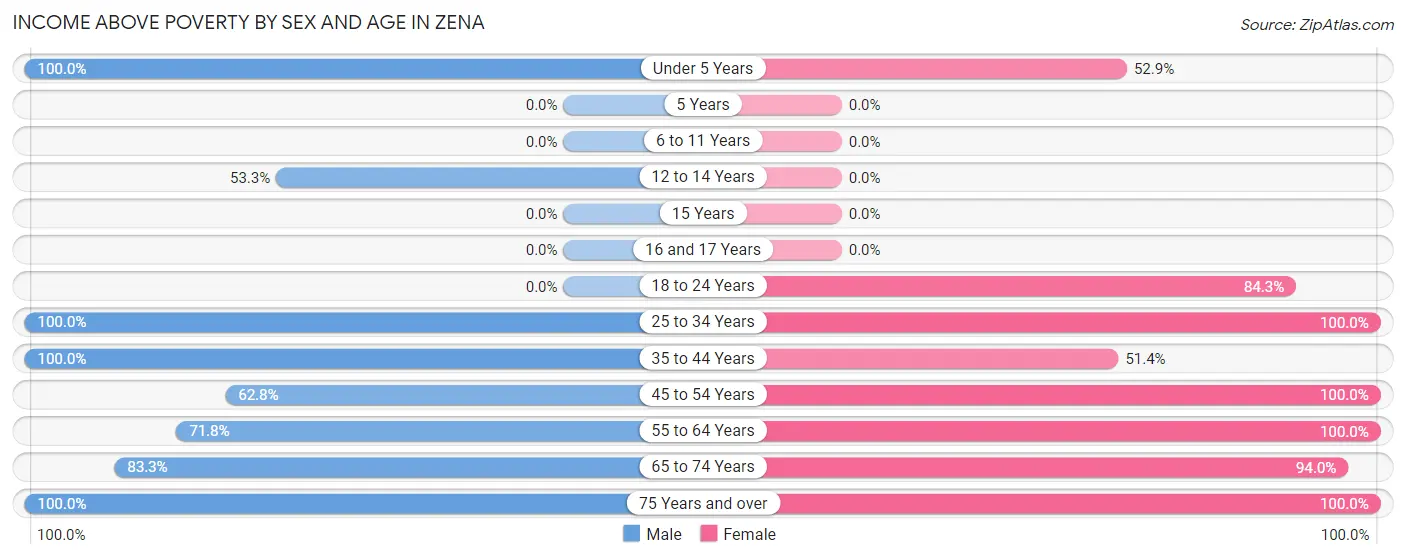
| Age Bracket | Male | Female |
| Under 5 Years | 9 (100.0%) | 9 (52.9%) |
| 5 Years | 0 (0.0%) | 0 (0.0%) |
| 6 to 11 Years | 0 (0.0%) | 0 (0.0%) |
| 12 to 14 Years | 8 (53.3%) | 0 (0.0%) |
| 15 Years | 0 (0.0%) | 0 (0.0%) |
| 16 and 17 Years | 0 (0.0%) | 0 (0.0%) |
| 18 to 24 Years | 0 (0.0%) | 43 (84.3%) |
| 25 to 34 Years | 9 (100.0%) | 29 (100.0%) |
| 35 to 44 Years | 49 (100.0%) | 19 (51.3%) |
| 45 to 54 Years | 32 (62.7%) | 15 (100.0%) |
| 55 to 64 Years | 74 (71.8%) | 79 (100.0%) |
| 65 to 74 Years | 70 (83.3%) | 125 (94.0%) |
| 75 Years and over | 19 (100.0%) | 16 (100.0%) |
| Total | 270 (79.6%) | 335 (86.6%) |
Income Below Poverty Among Married-Couple Families in Zena
The poverty statistics for married-couple families in Zena show that 11.5% or 21 of the total 183 families live below the poverty line. Families with 3 or 4 children have the highest poverty rate of 100.0%, comprising of 13 families. On the other hand, families with 1 or 2 children have the lowest poverty rate of 0.0%, which includes 0 families.
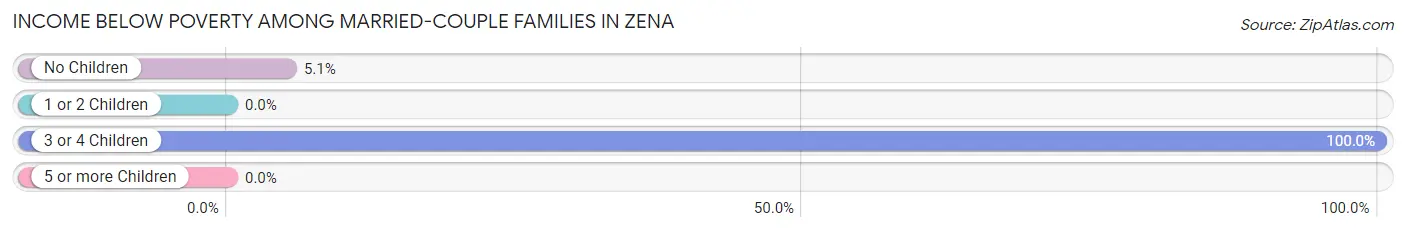
| Children | Above Poverty | Below Poverty |
| No Children | 148 (94.9%) | 8 (5.1%) |
| 1 or 2 Children | 14 (100.0%) | 0 (0.0%) |
| 3 or 4 Children | 0 (0.0%) | 13 (100.0%) |
| 5 or more Children | 0 (0.0%) | 0 (0.0%) |
| Total | 162 (88.5%) | 21 (11.5%) |
Income Below Poverty Among Single-Parent Households in Zena
| Children | Single Father | Single Mother |
| No Children | 0 (0.0%) | 0 (0.0%) |
| 1 or 2 Children | 0 (0.0%) | 0 (0.0%) |
| 3 or 4 Children | 0 (0.0%) | 0 (0.0%) |
| 5 or more Children | 0 (0.0%) | 0 (0.0%) |
| Total | 0 (0.0%) | 0 (0.0%) |
Income Below Poverty Among Married-Couple vs Single-Parent Households in Zena
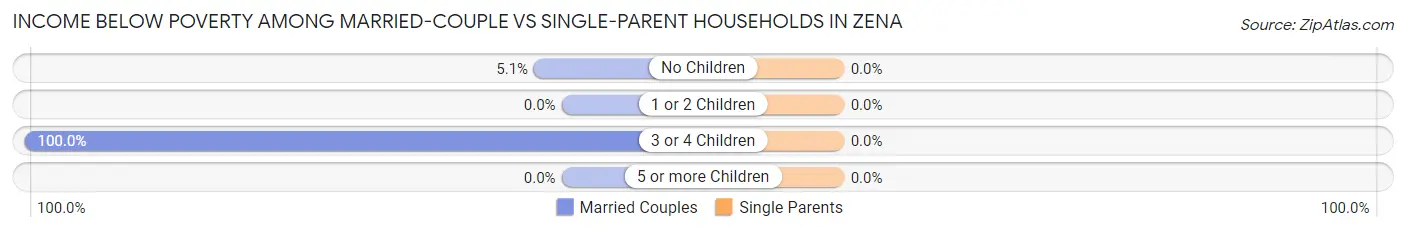
| Children | Married-Couple Families | Single-Parent Households |
| No Children | 8 (5.1%) | 0 (0.0%) |
| 1 or 2 Children | 0 (0.0%) | 0 (0.0%) |
| 3 or 4 Children | 13 (100.0%) | 0 (0.0%) |
| 5 or more Children | 0 (0.0%) | 0 (0.0%) |
| Total | 21 (11.5%) | 0 (0.0%) |
Race in Zena
The most populous races in Zena are White / Caucasian (569 | 78.4%), Asian (75 | 10.3%), and Hispanic or Latino (68 | 9.4%).
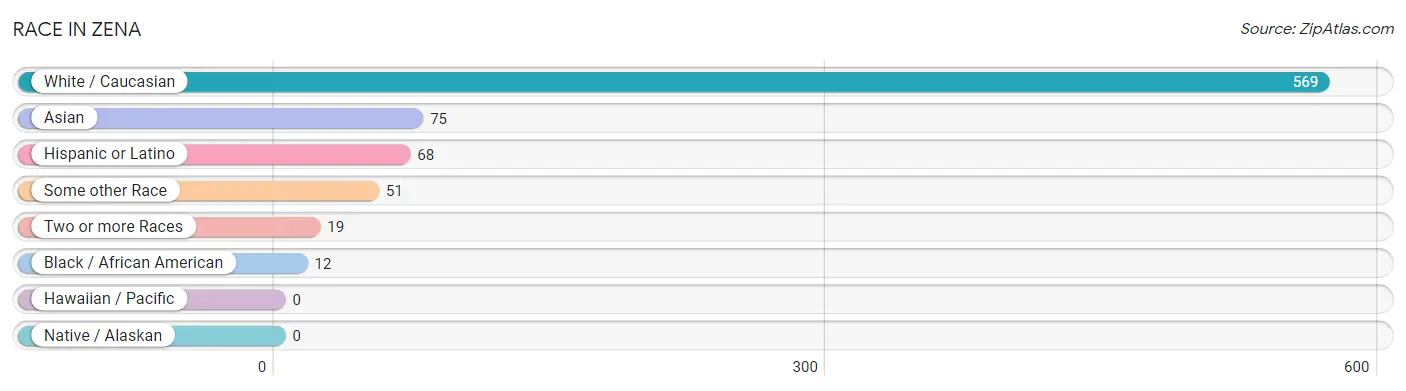
| Race | # Population | % Population |
| Asian | 75 | 10.3% |
| Black / African American | 12 | 1.7% |
| Hawaiian / Pacific | 0 | 0.0% |
| Hispanic or Latino | 68 | 9.4% |
| Native / Alaskan | 0 | 0.0% |
| White / Caucasian | 569 | 78.4% |
| Two or more Races | 19 | 2.6% |
| Some other Race | 51 | 7.0% |
| Total | 726 | 100.0% |
Ancestry in Zena
The most populous ancestries reported in Zena are Irish (161 | 22.2%), Italian (112 | 15.4%), Russian (89 | 12.3%), English (80 | 11.0%), and German (51 | 7.0%), together accounting for 67.9% of all Zena residents.
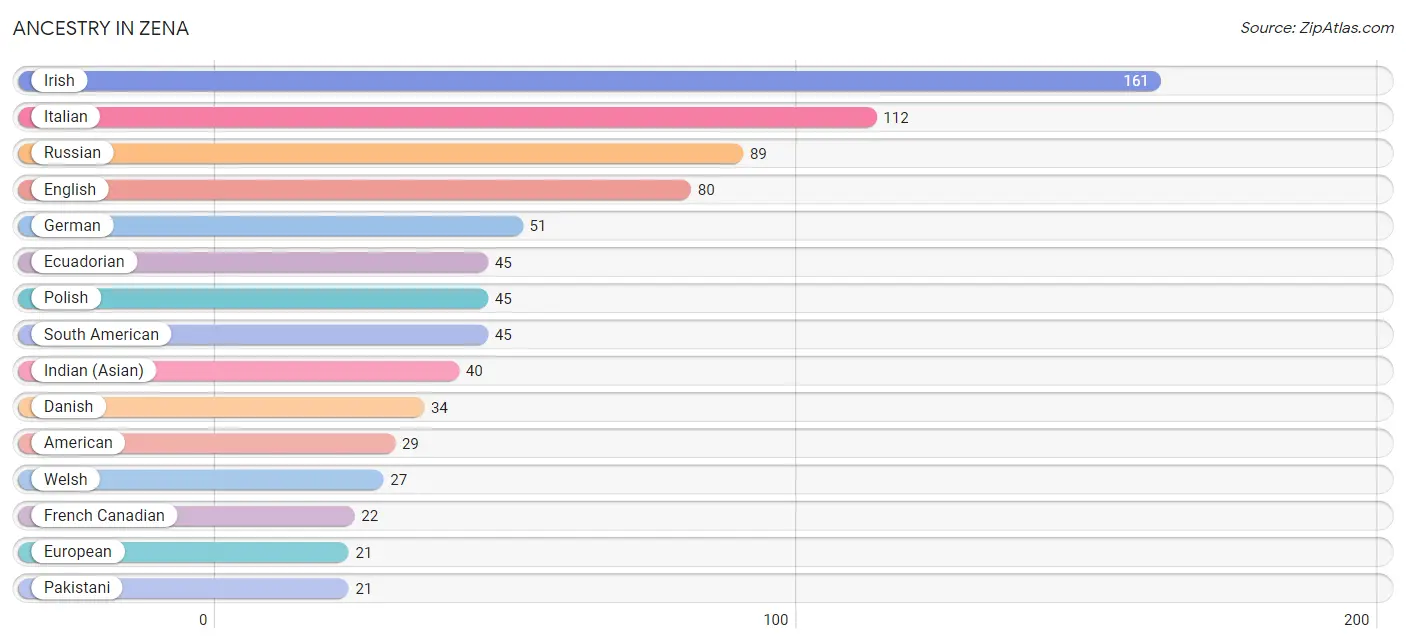
| Ancestry | # Population | % Population |
| American | 29 | 4.0% |
| Arab | 19 | 2.6% |
| Austrian | 9 | 1.2% |
| Croatian | 13 | 1.8% |
| Danish | 34 | 4.7% |
| Dutch | 8 | 1.1% |
| Eastern European | 10 | 1.4% |
| Ecuadorian | 45 | 6.2% |
| English | 80 | 11.0% |
| European | 21 | 2.9% |
| French Canadian | 22 | 3.0% |
| German | 51 | 7.0% |
| Greek | 6 | 0.8% |
| Hungarian | 6 | 0.8% |
| Indian (Asian) | 40 | 5.5% |
| Irish | 161 | 22.2% |
| Italian | 112 | 15.4% |
| Lebanese | 8 | 1.1% |
| Lithuanian | 9 | 1.2% |
| Pakistani | 21 | 2.9% |
| Polish | 45 | 6.2% |
| Romanian | 11 | 1.5% |
| Russian | 89 | 12.3% |
| South American | 45 | 6.2% |
| Syrian | 11 | 1.5% |
| Ukrainian | 6 | 0.8% |
| Welsh | 27 | 3.7% | View All 27 Rows |
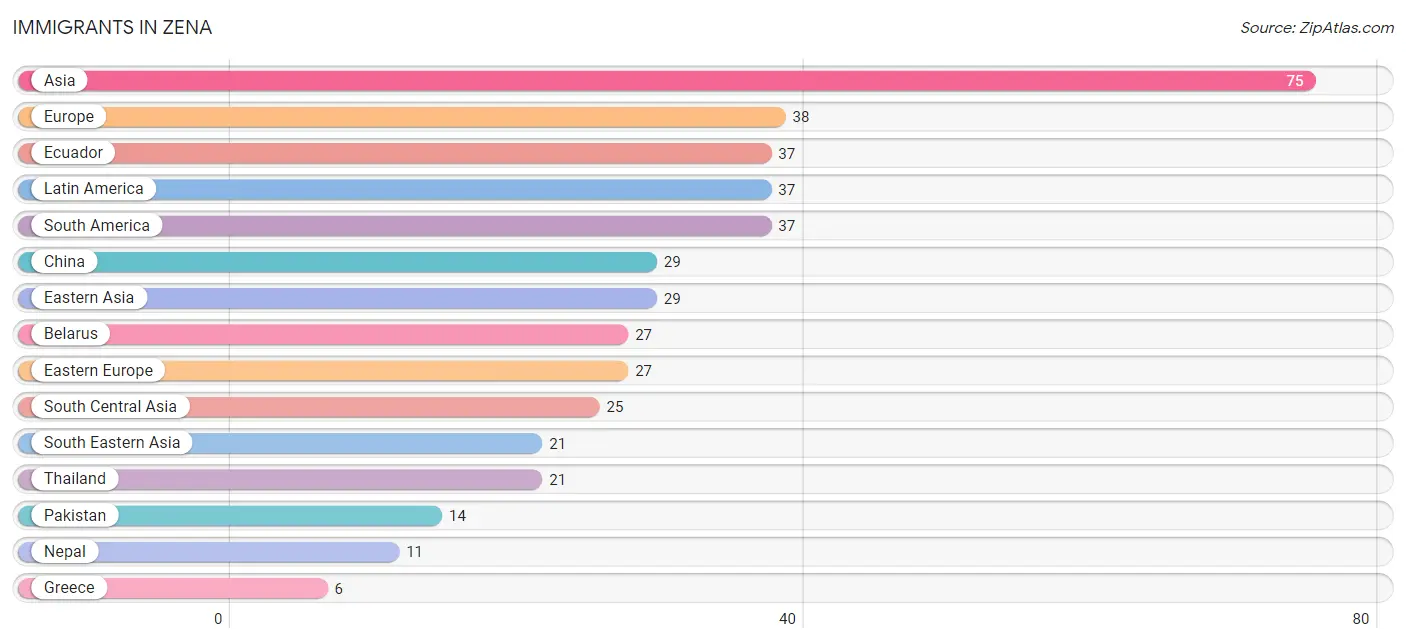
Immigrants in Zena
The most numerous immigrant groups reported in Zena came from Asia (75 | 10.3%), Europe (38 | 5.2%), Ecuador (37 | 5.1%), Latin America (37 | 5.1%), and South America (37 | 5.1%), together accounting for 30.9% of all Zena residents.
| Immigration Origin | # Population | % Population |
| Asia | 75 | 10.3% |
| Belarus | 27 | 3.7% |
| China | 29 | 4.0% |
| Eastern Asia | 29 | 4.0% |
| Eastern Europe | 27 | 3.7% |
| Ecuador | 37 | 5.1% |
| England | 5 | 0.7% |
| Europe | 38 | 5.2% |
| Greece | 6 | 0.8% |
| Latin America | 37 | 5.1% |
| Nepal | 11 | 1.5% |
| Northern Europe | 5 | 0.7% |
| Pakistan | 14 | 1.9% |
| South America | 37 | 5.1% |
| South Central Asia | 25 | 3.4% |
| South Eastern Asia | 21 | 2.9% |
| Southern Europe | 6 | 0.8% |
| Thailand | 21 | 2.9% | View All 18 Rows |
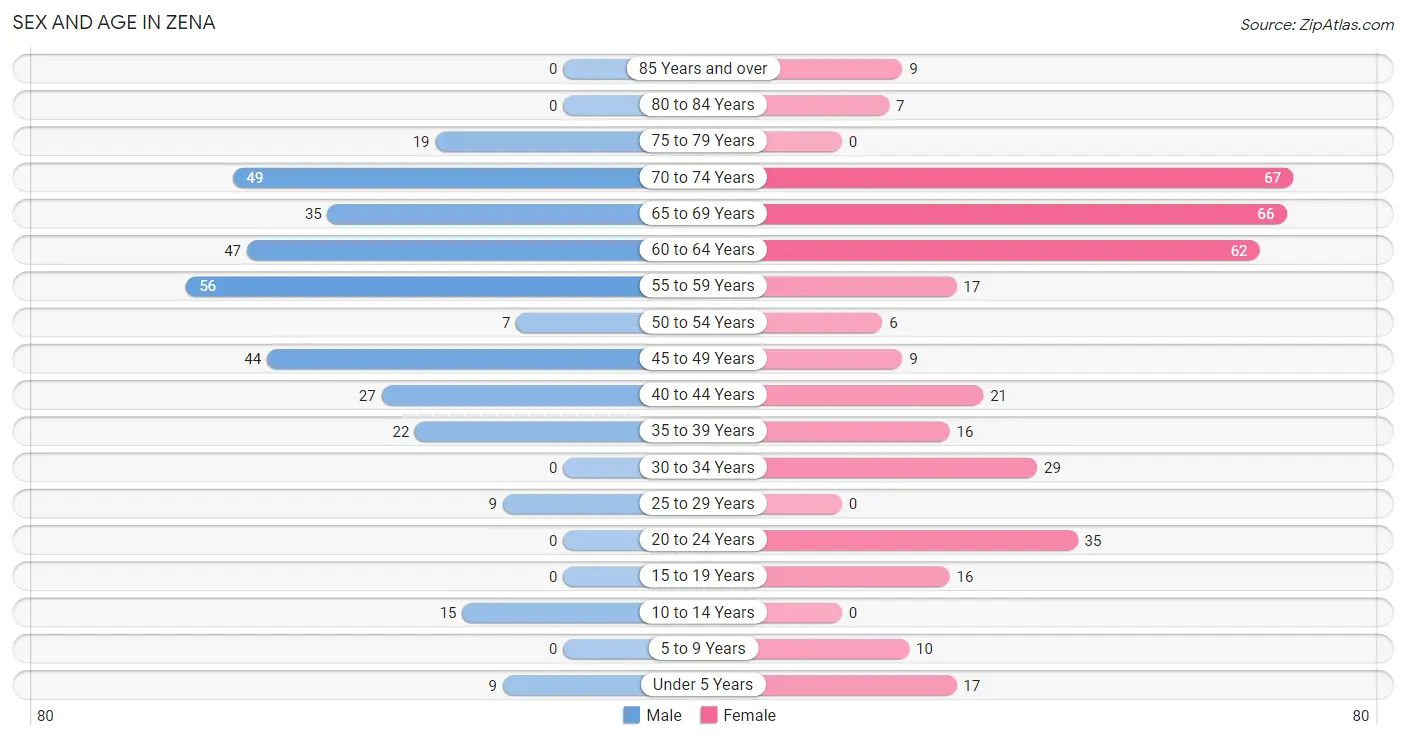
Sex and Age in Zena
Sex and Age in Zena
The most populous age groups in Zena are 55 to 59 Years (56 | 16.5%) for men and 70 to 74 Years (67 | 17.3%) for women.
| Age Bracket | Male | Female |
| Under 5 Years | 9 (2.6%) | 17 (4.4%) |
| 5 to 9 Years | 0 (0.0%) | 10 (2.6%) |
| 10 to 14 Years | 15 (4.4%) | 0 (0.0%) |
| 15 to 19 Years | 0 (0.0%) | 16 (4.1%) |
| 20 to 24 Years | 0 (0.0%) | 35 (9.0%) |
| 25 to 29 Years | 9 (2.6%) | 0 (0.0%) |
| 30 to 34 Years | 0 (0.0%) | 29 (7.5%) |
| 35 to 39 Years | 22 (6.5%) | 16 (4.1%) |
| 40 to 44 Years | 27 (8.0%) | 21 (5.4%) |
| 45 to 49 Years | 44 (13.0%) | 9 (2.3%) |
| 50 to 54 Years | 7 (2.1%) | 6 (1.5%) |
| 55 to 59 Years | 56 (16.5%) | 17 (4.4%) |
| 60 to 64 Years | 47 (13.9%) | 62 (16.0%) |
| 65 to 69 Years | 35 (10.3%) | 66 (17.1%) |
| 70 to 74 Years | 49 (14.4%) | 67 (17.3%) |
| 75 to 79 Years | 19 (5.6%) | 0 (0.0%) |
| 80 to 84 Years | 0 (0.0%) | 7 (1.8%) |
| 85 Years and over | 0 (0.0%) | 9 (2.3%) |
| Total | 339 (100.0%) | 387 (100.0%) |
Families and Households in Zena
Median Family Size in Zena
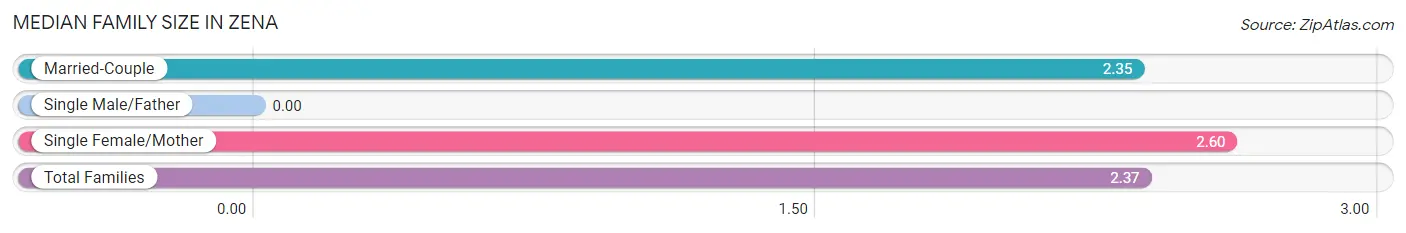
| Family Type | # Families | Family Size |
| Married-Couple | 183 (90.1%) | 2.35 |
| Single Male/Father | 0 (0.0%) | - |
| Single Female/Mother | 20 (9.9%) | 2.60 |
| Total Families | 203 (100.0%) | 2.37 |
Median Household Size in Zena
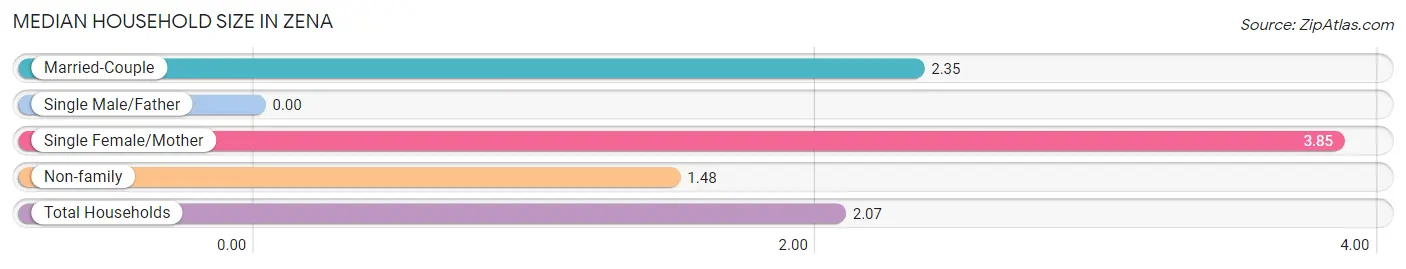
| Household Type | # Households | Household Size |
| Married-Couple | 183 (52.7%) | 2.35 |
| Single Male/Father | 0 (0.0%) | - |
| Single Female/Mother | 20 (5.8%) | 3.85 |
| Non-family | 144 (41.5%) | 1.48 |
| Total Households | 347 (100.0%) | 2.07 |
Household Size by Marriage Status in Zena
Out of a total of 347 households in Zena, 203 (58.5%) are family households, while 144 (41.5%) are nonfamily households. The most numerous type of family households are 2-person households, comprising 155, and the most common type of nonfamily households are 1-person households, comprising 113.
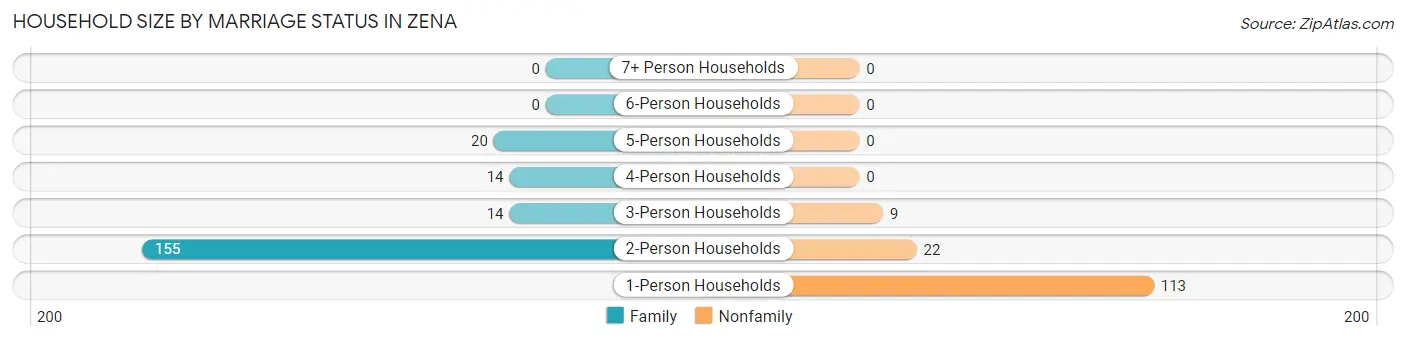
| Household Size | Family Households | Nonfamily Households |
| 1-Person Households | - | 113 (32.6%) |
| 2-Person Households | 155 (44.7%) | 22 (6.3%) |
| 3-Person Households | 14 (4.0%) | 9 (2.6%) |
| 4-Person Households | 14 (4.0%) | 0 (0.0%) |
| 5-Person Households | 20 (5.8%) | 0 (0.0%) |
| 6-Person Households | 0 (0.0%) | 0 (0.0%) |
| 7+ Person Households | 0 (0.0%) | 0 (0.0%) |
| Total | 203 (58.5%) | 144 (41.5%) |
Female Fertility in Zena
Fertility by Age in Zena
Average fertility rate in Zena is 53.0 births per 1,000 women. Women in the age bracket of 35 to 50 years have the highest fertility rate with 135.0 births per 1,000 women. Women in the age bracket of 35 to 50 years acount for 100.0% of all women with births.
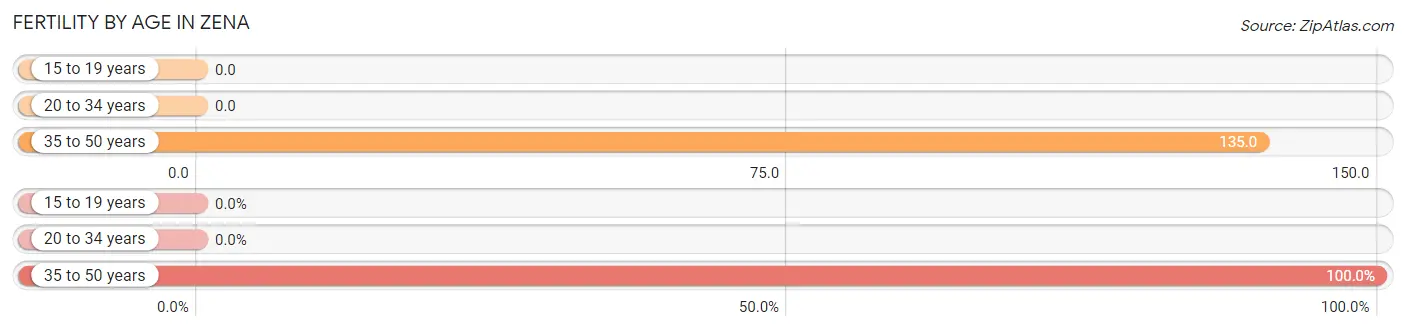
| Age Bracket | Women with Births | Births / 1,000 Women |
| 15 to 19 years | 0 (0.0%) | 0.0 |
| 20 to 34 years | 0 (0.0%) | 0.0 |
| 35 to 50 years | 7 (100.0%) | 135.0 |
| Total | 7 (100.0%) | 53.0 |
Fertility by Age by Marriage Status in Zena
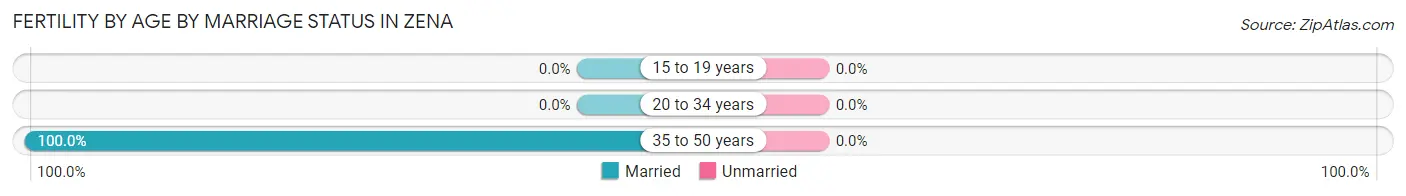
| Age Bracket | Married | Unmarried |
| 15 to 19 years | 0 (0.0%) | 0 (0.0%) |
| 20 to 34 years | 0 (0.0%) | 0 (0.0%) |
| 35 to 50 years | 7 (100.0%) | 0 (0.0%) |
| Total | 7 (100.0%) | 0 (0.0%) |
Fertility by Education in Zena
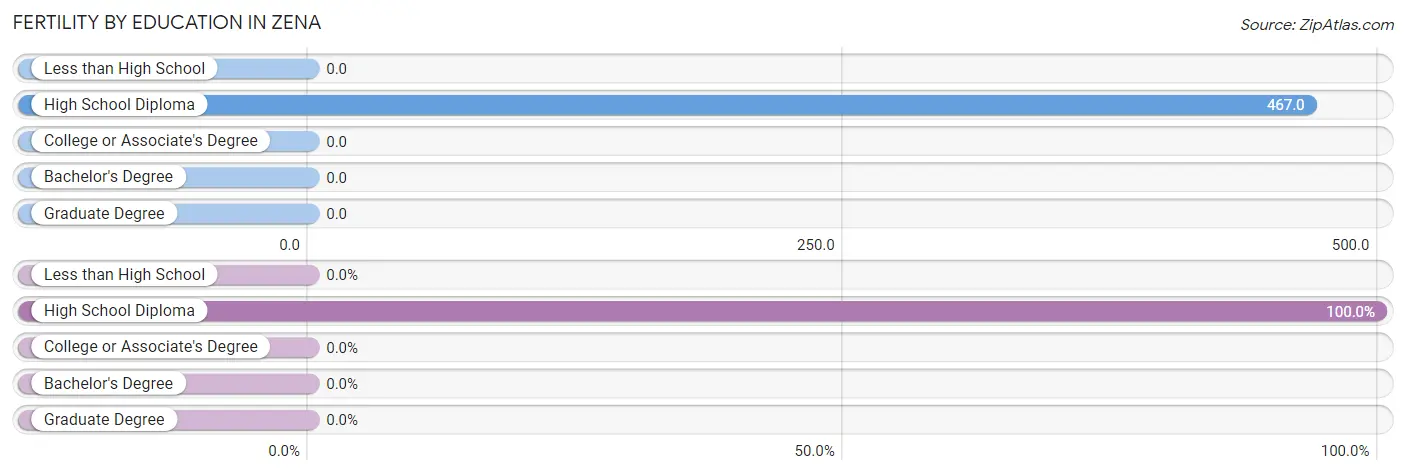
| Educational Attainment | Women with Births | Births / 1,000 Women |
| Less than High School | 0 (0.0%) | 0.0 |
| High School Diploma | 7 (100.0%) | 467.0 |
| College or Associate's Degree | 0 (0.0%) | 0.0 |
| Bachelor's Degree | 0 (0.0%) | 0.0 |
| Graduate Degree | 0 (0.0%) | 0.0 |
| Total | 7 (100.0%) | 53.0 |
Fertility by Education by Marriage Status in Zena
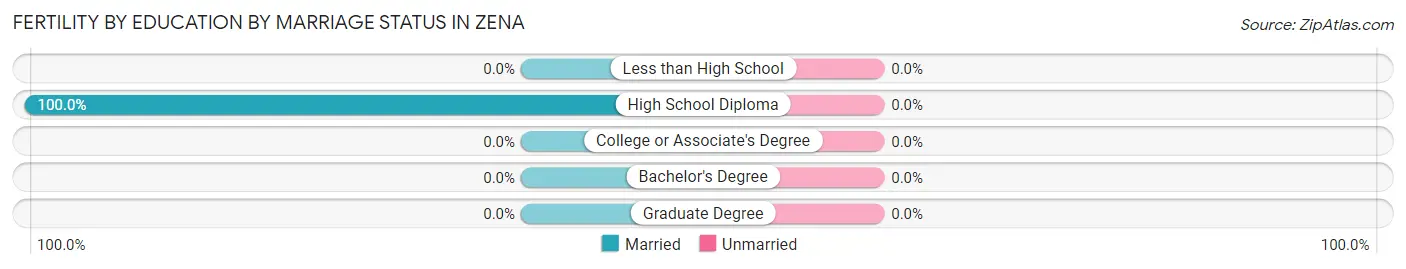
| Educational Attainment | Married | Unmarried |
| Less than High School | 0 (0.0%) | 0 (0.0%) |
| High School Diploma | 7 (100.0%) | 0 (0.0%) |
| College or Associate's Degree | 0 (0.0%) | 0 (0.0%) |
| Bachelor's Degree | 0 (0.0%) | 0 (0.0%) |
| Graduate Degree | 0 (0.0%) | 0 (0.0%) |
| Total | 7 (100.0%) | 0 (0.0%) |
Employment Characteristics in Zena
Employment by Class of Employer in Zena
Among the 392 employed individuals in Zena, private company employees (204 | 52.0%), not-for-profit organizations (74 | 18.9%), and self-employed (not incorporated) (40 | 10.2%) make up the most common classes of employment.
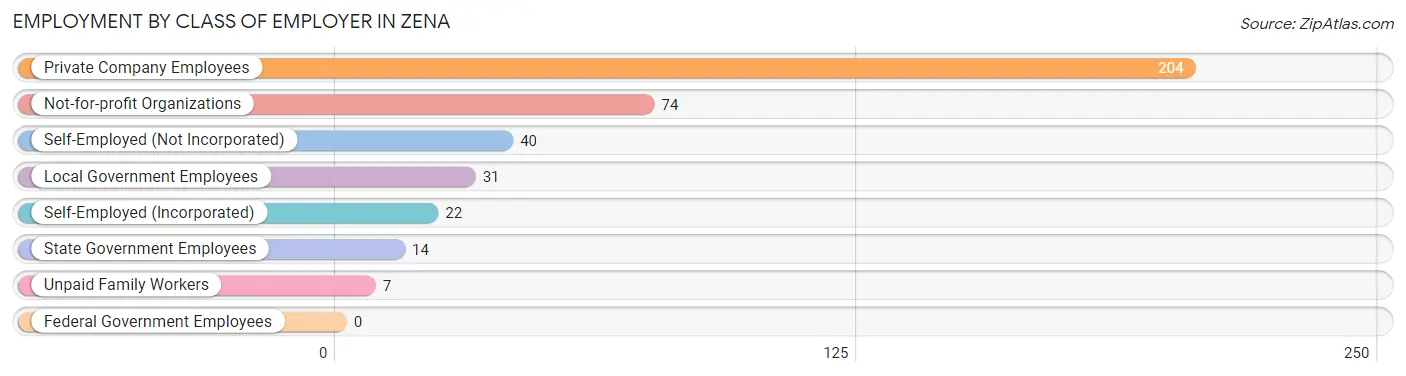
| Employer Class | # Employees | % Employees |
| Private Company Employees | 204 | 52.0% |
| Self-Employed (Incorporated) | 22 | 5.6% |
| Self-Employed (Not Incorporated) | 40 | 10.2% |
| Not-for-profit Organizations | 74 | 18.9% |
| Local Government Employees | 31 | 7.9% |
| State Government Employees | 14 | 3.6% |
| Federal Government Employees | 0 | 0.0% |
| Unpaid Family Workers | 7 | 1.8% |
| Total | 392 | 100.0% |
Employment Status by Age in Zena
According to the labor force statistics for Zena, out of the total population over 16 years of age (675), 59.3% or 400 individuals are in the labor force, with 2.0% or 8 of them unemployed. The age group with the highest labor force participation rate is 16 to 19 years, with 100.0% or 16 individuals in the labor force. Within the labor force, the 16 to 19 years age range has the highest percentage of unemployed individuals, with 50.0% or 8 of them being unemployed.
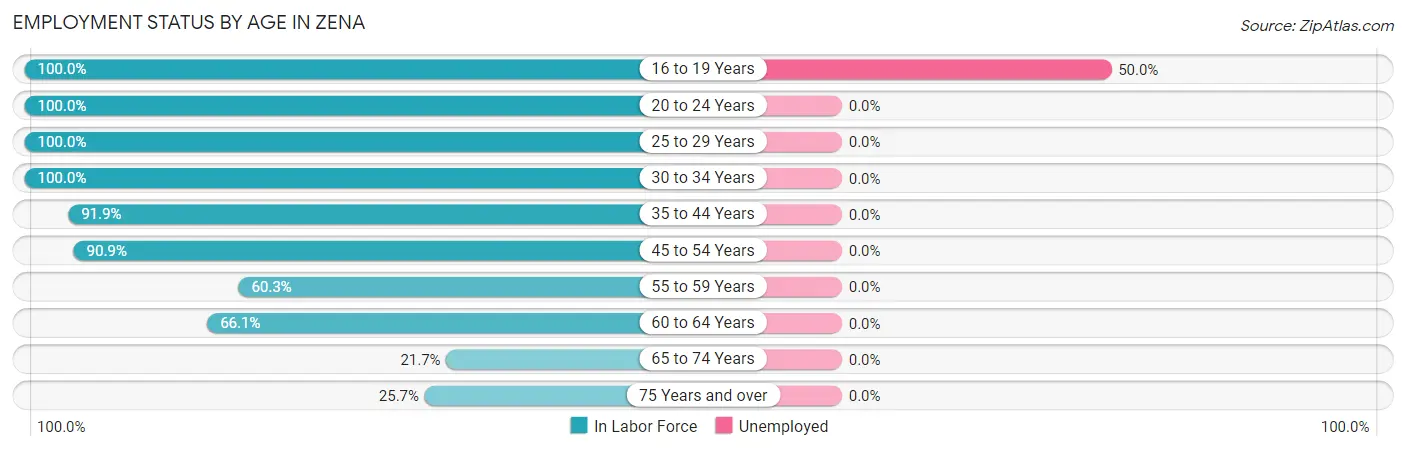
| Age Bracket | In Labor Force | Unemployed |
| 16 to 19 Years | 16 (100.0%) | 8 (50.0%) |
| 20 to 24 Years | 35 (100.0%) | 0 (0.0%) |
| 25 to 29 Years | 9 (100.0%) | 0 (0.0%) |
| 30 to 34 Years | 29 (100.0%) | 0 (0.0%) |
| 35 to 44 Years | 79 (91.9%) | 0 (0.0%) |
| 45 to 54 Years | 60 (90.9%) | 0 (0.0%) |
| 55 to 59 Years | 44 (60.3%) | 0 (0.0%) |
| 60 to 64 Years | 72 (66.1%) | 0 (0.0%) |
| 65 to 74 Years | 47 (21.7%) | 0 (0.0%) |
| 75 Years and over | 9 (25.7%) | 0 (0.0%) |
| Total | 400 (59.3%) | 8 (2.0%) |
Employment Status by Educational Attainment in Zena
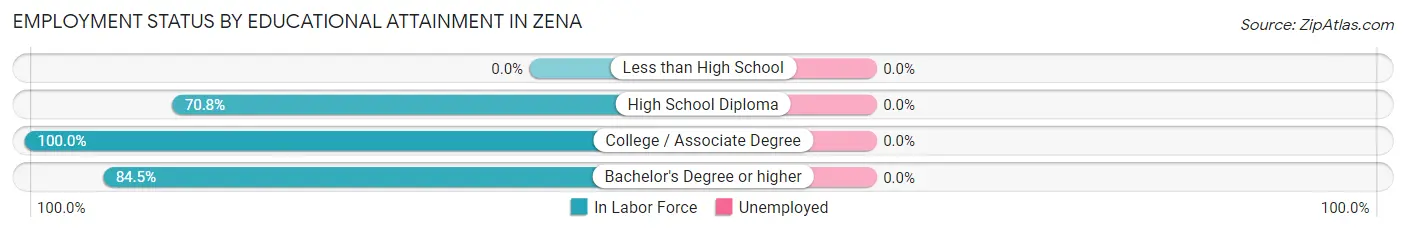
| Educational Attainment | In Labor Force | Unemployed |
| Less than High School | 0 (0.0%) | 0 (0.0%) |
| High School Diploma | 17 (70.8%) | 0 (0.0%) |
| College / Associate Degree | 75 (100.0%) | 0 (0.0%) |
| Bachelor's Degree or higher | 201 (84.5%) | 0 (0.0%) |
| Total | 293 (78.8%) | 0 (0.0%) |
Employment Occupations by Sex in Zena
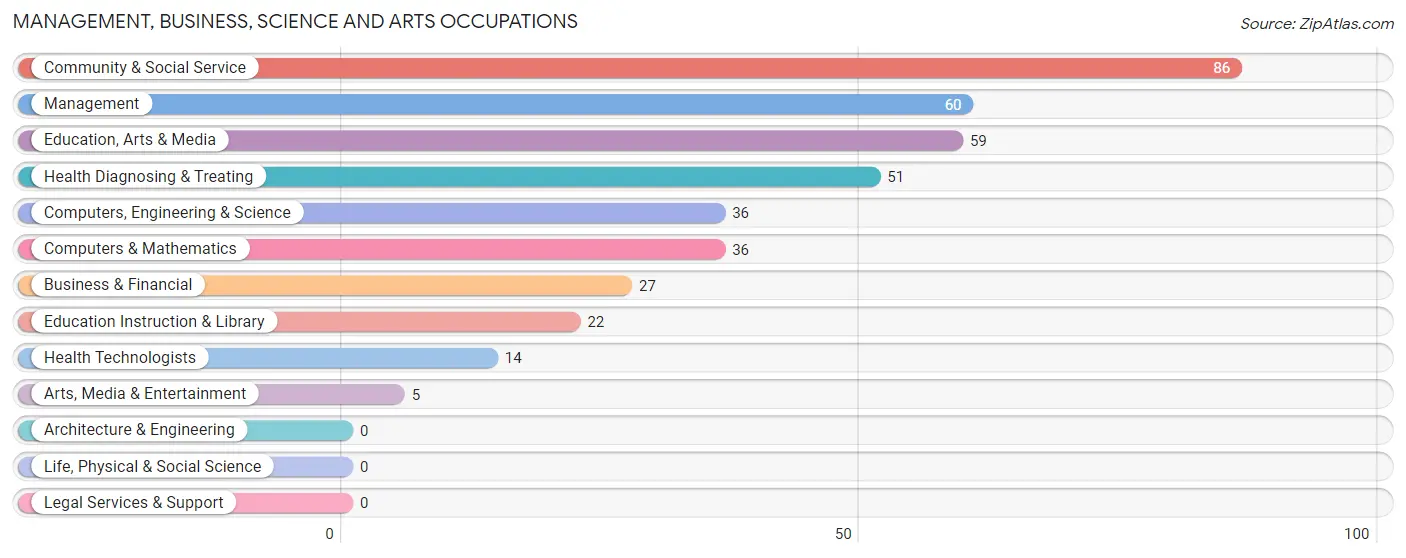
Management, Business, Science and Arts Occupations
The most common Management, Business, Science and Arts occupations in Zena are Community & Social Service (86 | 21.9%), Management (60 | 15.3%), Education, Arts & Media (59 | 15.0%), Health Diagnosing & Treating (51 | 13.0%), and Computers, Engineering & Science (36 | 9.2%).
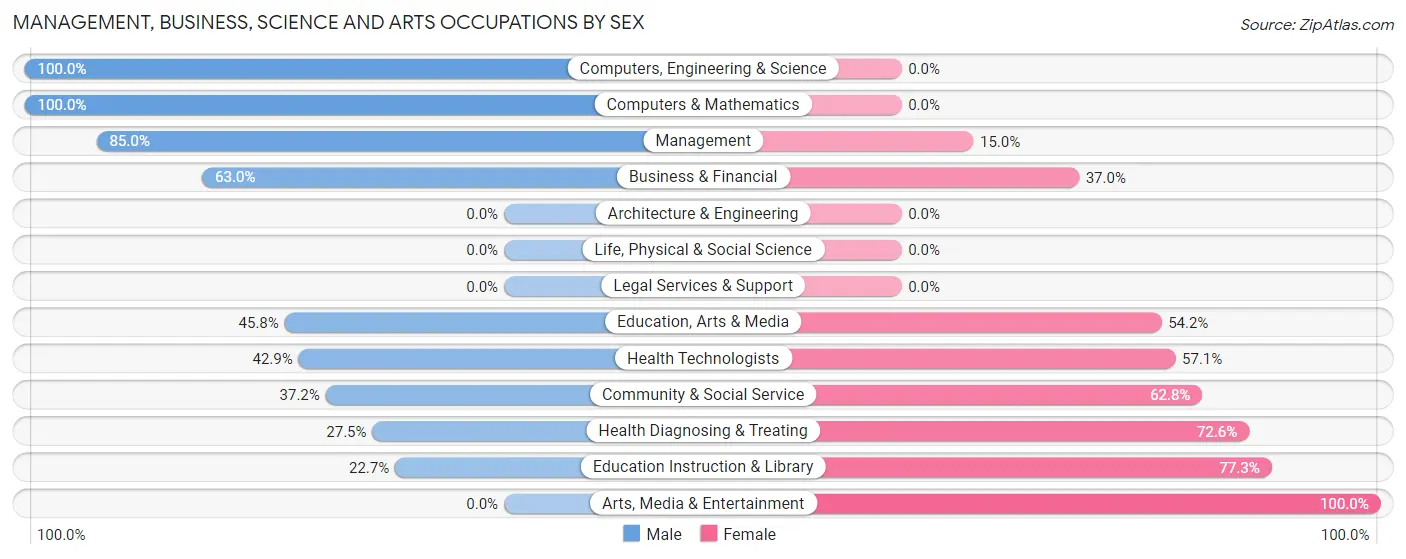
Management, Business, Science and Arts Occupations by Sex
Within the Management, Business, Science and Arts occupations in Zena, the most male-oriented occupations are Computers, Engineering & Science (100.0%), Computers & Mathematics (100.0%), and Management (85.0%), while the most female-oriented occupations are Arts, Media & Entertainment (100.0%), Education Instruction & Library (77.3%), and Health Diagnosing & Treating (72.6%).
| Occupation | Male | Female |
| Management | 51 (85.0%) | 9 (15.0%) |
| Business & Financial | 17 (63.0%) | 10 (37.0%) |
| Computers, Engineering & Science | 36 (100.0%) | 0 (0.0%) |
| Computers & Mathematics | 36 (100.0%) | 0 (0.0%) |
| Architecture & Engineering | 0 (0.0%) | 0 (0.0%) |
| Life, Physical & Social Science | 0 (0.0%) | 0 (0.0%) |
| Community & Social Service | 32 (37.2%) | 54 (62.8%) |
| Education, Arts & Media | 27 (45.8%) | 32 (54.2%) |
| Legal Services & Support | 0 (0.0%) | 0 (0.0%) |
| Education Instruction & Library | 5 (22.7%) | 17 (77.3%) |
| Arts, Media & Entertainment | 0 (0.0%) | 5 (100.0%) |
| Health Diagnosing & Treating | 14 (27.5%) | 37 (72.6%) |
| Health Technologists | 6 (42.9%) | 8 (57.1%) |
| Total (Category) | 150 (57.7%) | 110 (42.3%) |
| Total (Overall) | 205 (52.3%) | 187 (47.7%) |
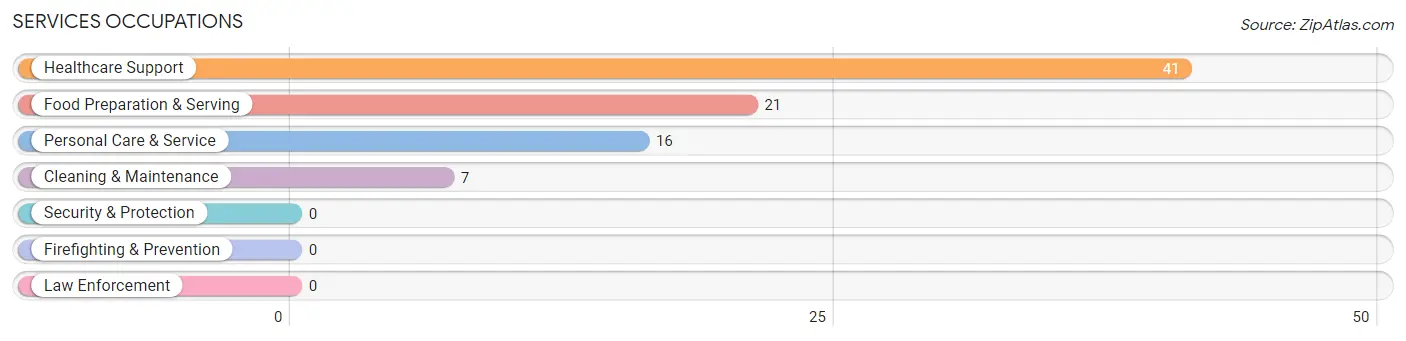
Services Occupations
The most common Services occupations in Zena are Healthcare Support (41 | 10.5%), Food Preparation & Serving (21 | 5.4%), Personal Care & Service (16 | 4.1%), and Cleaning & Maintenance (7 | 1.8%).
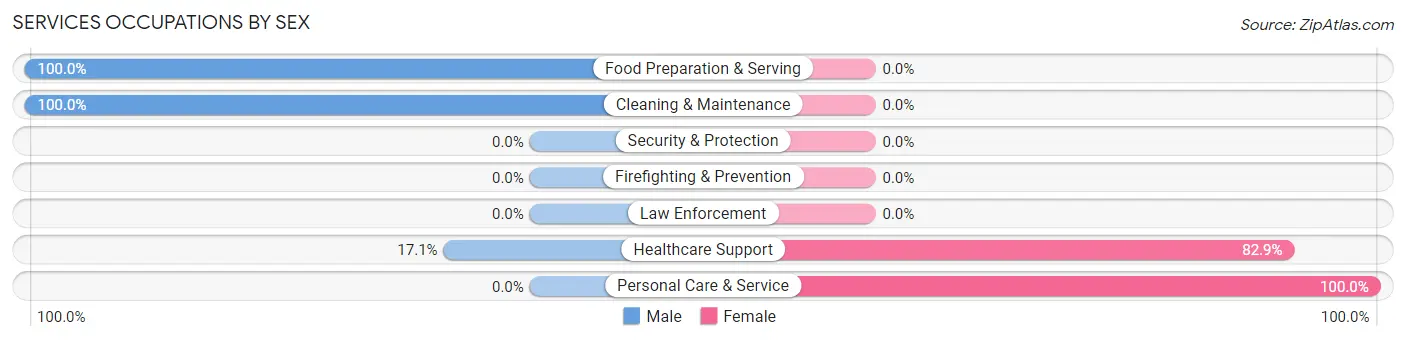
Services Occupations by Sex
Within the Services occupations in Zena, the most male-oriented occupations are Food Preparation & Serving (100.0%), Cleaning & Maintenance (100.0%), and Healthcare Support (17.1%), while the most female-oriented occupations are Personal Care & Service (100.0%), and Healthcare Support (82.9%).
| Occupation | Male | Female |
| Healthcare Support | 7 (17.1%) | 34 (82.9%) |
| Security & Protection | 0 (0.0%) | 0 (0.0%) |
| Firefighting & Prevention | 0 (0.0%) | 0 (0.0%) |
| Law Enforcement | 0 (0.0%) | 0 (0.0%) |
| Food Preparation & Serving | 21 (100.0%) | 0 (0.0%) |
| Cleaning & Maintenance | 7 (100.0%) | 0 (0.0%) |
| Personal Care & Service | 0 (0.0%) | 16 (100.0%) |
| Total (Category) | 35 (41.2%) | 50 (58.8%) |
| Total (Overall) | 205 (52.3%) | 187 (47.7%) |
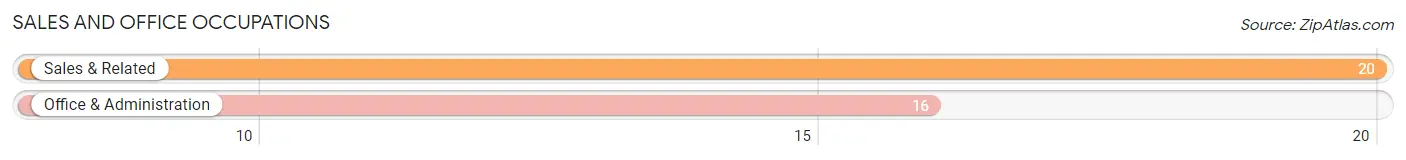
Sales and Office Occupations
The most common Sales and Office occupations in Zena are Sales & Related (20 | 5.1%), and Office & Administration (16 | 4.1%).
Sales and Office Occupations by Sex
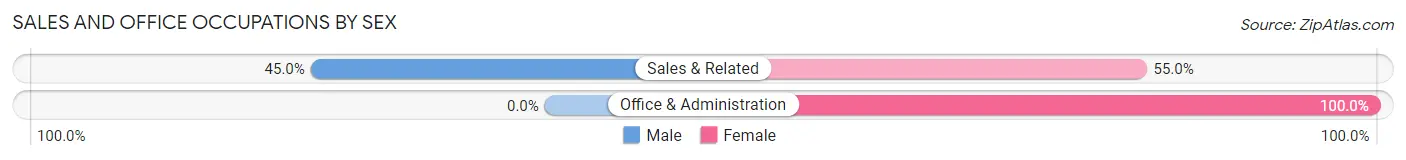
| Occupation | Male | Female |
| Sales & Related | 9 (45.0%) | 11 (55.0%) |
| Office & Administration | 0 (0.0%) | 16 (100.0%) |
| Total (Category) | 9 (25.0%) | 27 (75.0%) |
| Total (Overall) | 205 (52.3%) | 187 (47.7%) |
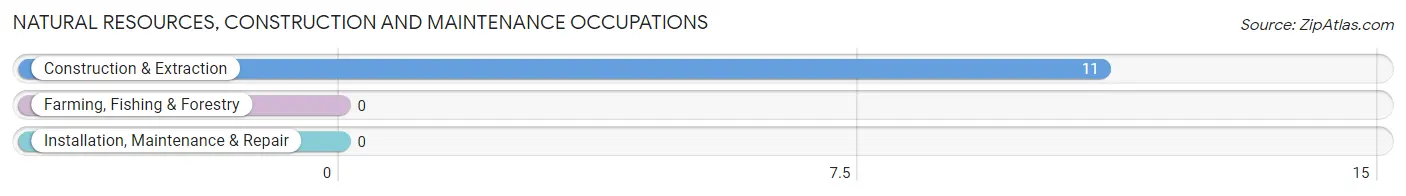
Natural Resources, Construction and Maintenance Occupations
The most common Natural Resources, Construction and Maintenance occupations in Zena are , and Construction & Extraction (11 | 2.8%).
Natural Resources, Construction and Maintenance Occupations by Sex
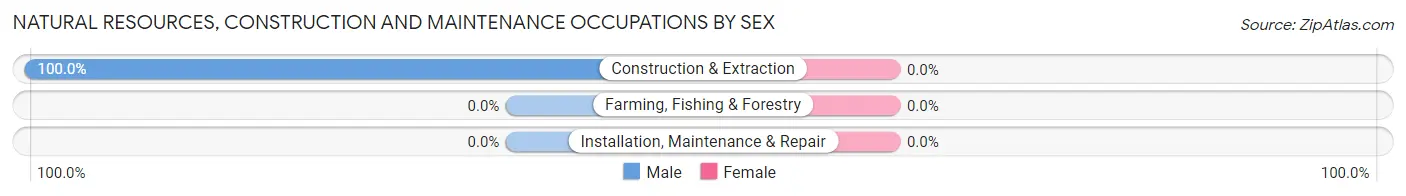
| Occupation | Male | Female |
| Farming, Fishing & Forestry | 0 (0.0%) | 0 (0.0%) |
| Construction & Extraction | 11 (100.0%) | 0 (0.0%) |
| Installation, Maintenance & Repair | 0 (0.0%) | 0 (0.0%) |
| Total (Category) | 11 (100.0%) | 0 (0.0%) |
| Total (Overall) | 205 (52.3%) | 187 (47.7%) |
Production, Transportation and Moving Occupations
Production, Transportation and Moving Occupations by Sex
| Occupation | Male | Female |
| Production | 0 (0.0%) | 0 (0.0%) |
| Transportation | 0 (0.0%) | 0 (0.0%) |
| Material Moving | 0 (0.0%) | 0 (0.0%) |
| Total (Category) | 0 (0.0%) | 0 (0.0%) |
| Total (Overall) | 205 (52.3%) | 187 (47.7%) |
Employment Industries by Sex in Zena
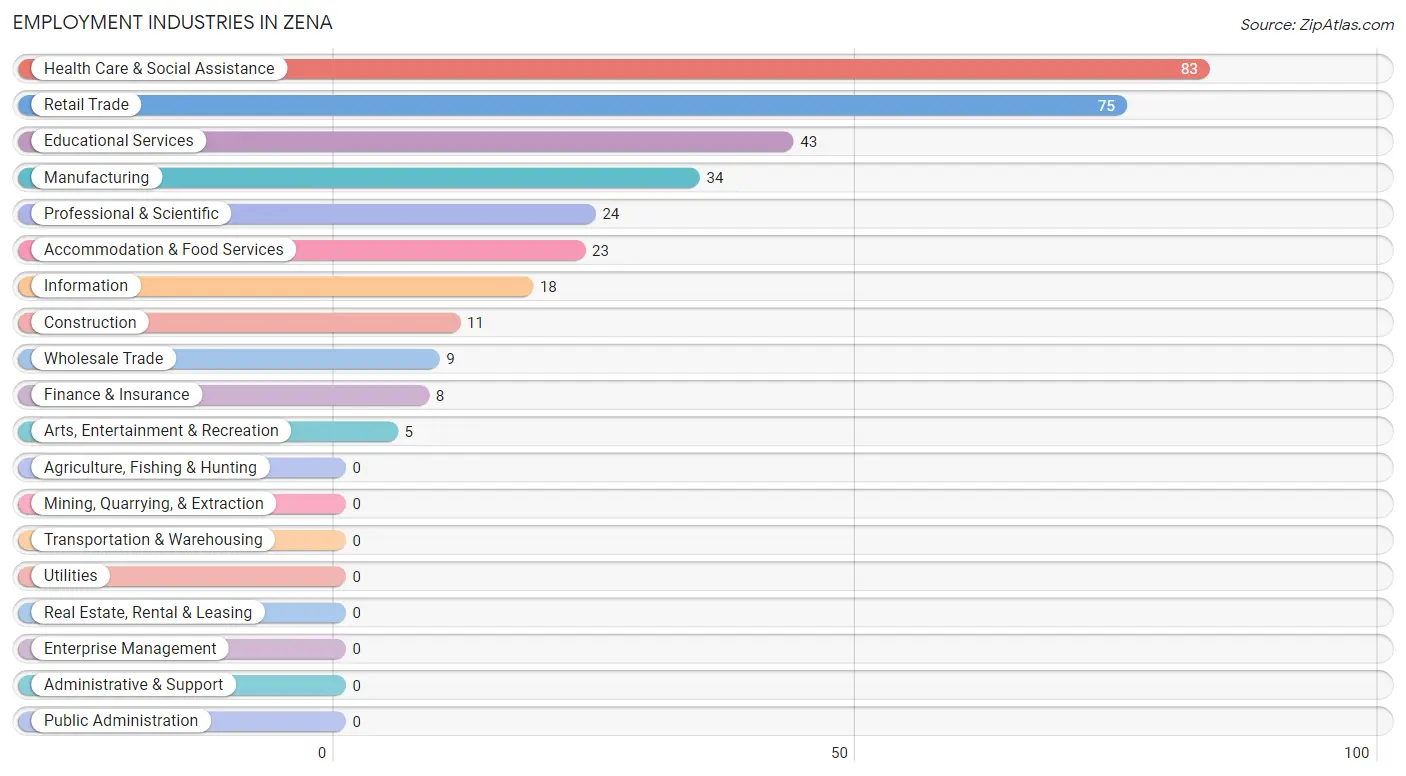
Employment Industries in Zena
The major employment industries in Zena include Health Care & Social Assistance (83 | 21.2%), Retail Trade (75 | 19.1%), Educational Services (43 | 11.0%), Manufacturing (34 | 8.7%), and Professional & Scientific (24 | 6.1%).
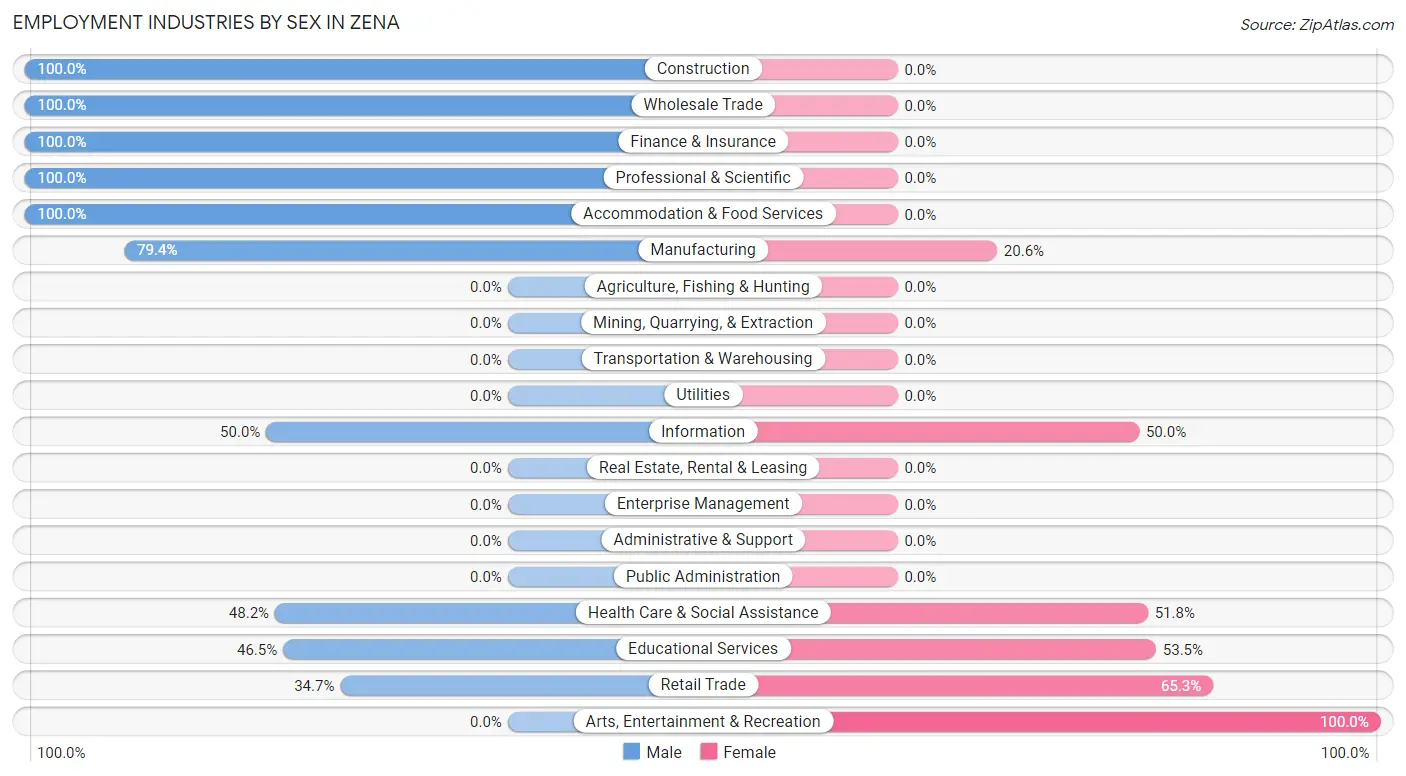
Employment Industries by Sex in Zena
The Zena industries that see more men than women are Construction (100.0%), Wholesale Trade (100.0%), and Finance & Insurance (100.0%), whereas the industries that tend to have a higher number of women are Arts, Entertainment & Recreation (100.0%), Retail Trade (65.3%), and Educational Services (53.5%).
| Industry | Male | Female |
| Agriculture, Fishing & Hunting | 0 (0.0%) | 0 (0.0%) |
| Mining, Quarrying, & Extraction | 0 (0.0%) | 0 (0.0%) |
| Construction | 11 (100.0%) | 0 (0.0%) |
| Manufacturing | 27 (79.4%) | 7 (20.6%) |
| Wholesale Trade | 9 (100.0%) | 0 (0.0%) |
| Retail Trade | 26 (34.7%) | 49 (65.3%) |
| Transportation & Warehousing | 0 (0.0%) | 0 (0.0%) |
| Utilities | 0 (0.0%) | 0 (0.0%) |
| Information | 9 (50.0%) | 9 (50.0%) |
| Finance & Insurance | 8 (100.0%) | 0 (0.0%) |
| Real Estate, Rental & Leasing | 0 (0.0%) | 0 (0.0%) |
| Professional & Scientific | 24 (100.0%) | 0 (0.0%) |
| Enterprise Management | 0 (0.0%) | 0 (0.0%) |
| Administrative & Support | 0 (0.0%) | 0 (0.0%) |
| Educational Services | 20 (46.5%) | 23 (53.5%) |
| Health Care & Social Assistance | 40 (48.2%) | 43 (51.8%) |
| Arts, Entertainment & Recreation | 0 (0.0%) | 5 (100.0%) |
| Accommodation & Food Services | 23 (100.0%) | 0 (0.0%) |
| Public Administration | 0 (0.0%) | 0 (0.0%) |
| Total | 205 (52.3%) | 187 (47.7%) |
Education in Zena
School Enrollment in Zena
The most common levels of schooling among the 50 students in Zena are college / undergraduate (16 | 32.0%), middle school (15 | 30.0%), and kindergarten (10 | 20.0%).
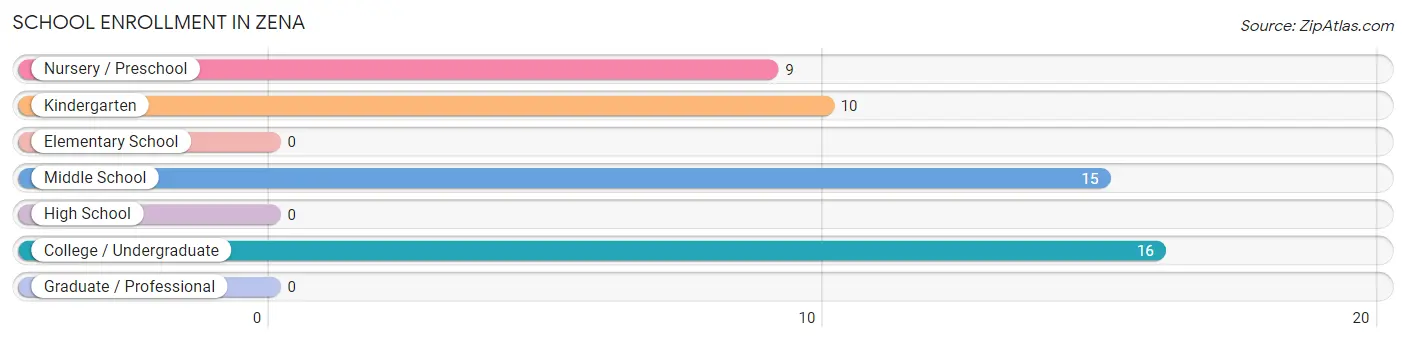
| School Level | # Students | % Students |
| Nursery / Preschool | 9 | 18.0% |
| Kindergarten | 10 | 20.0% |
| Elementary School | 0 | 0.0% |
| Middle School | 15 | 30.0% |
| High School | 0 | 0.0% |
| College / Undergraduate | 16 | 32.0% |
| Graduate / Professional | 0 | 0.0% |
| Total | 50 | 100.0% |
School Enrollment by Age by Funding Source in Zena
Out of a total of 50 students who are enrolled in schools in Zena, 8 (16.0%) attend a private institution, while the remaining 42 (84.0%) are enrolled in public schools. The age group of 20 to 24 year olds has the highest likelihood of being enrolled in private schools, with 8 (100.0% in the age bracket) enrolled. Conversely, the age group of 3 to 4 year olds has the lowest likelihood of being enrolled in a private school, with 9 (100.0% in the age bracket) attending a public institution.
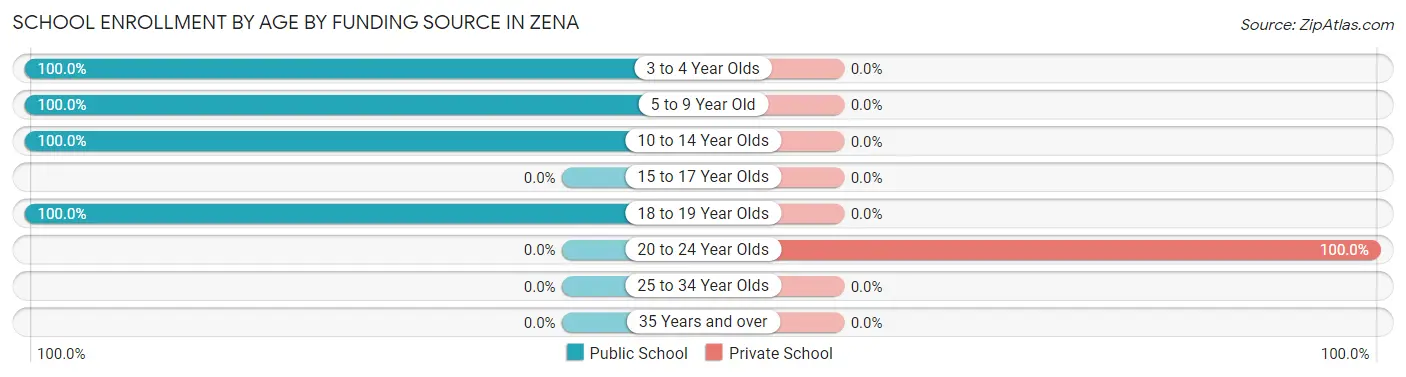
| Age Bracket | Public School | Private School |
| 3 to 4 Year Olds | 9 (100.0%) | 0 (0.0%) |
| 5 to 9 Year Old | 10 (100.0%) | 0 (0.0%) |
| 10 to 14 Year Olds | 15 (100.0%) | 0 (0.0%) |
| 15 to 17 Year Olds | 0 (0.0%) | 0 (0.0%) |
| 18 to 19 Year Olds | 8 (100.0%) | 0 (0.0%) |
| 20 to 24 Year Olds | 0 (0.0%) | 8 (100.0%) |
| 25 to 34 Year Olds | 0 (0.0%) | 0 (0.0%) |
| 35 Years and over | 0 (0.0%) | 0 (0.0%) |
| Total | 42 (84.0%) | 8 (16.0%) |
Educational Attainment by Field of Study in Zena
Visual & performing arts (60 | 14.5%), education (51 | 12.3%), business (45 | 10.8%), arts & humanities (44 | 10.6%), and science & technology (36 | 8.7%) are the most common fields of study among 415 individuals in Zena who have obtained a bachelor's degree or higher.
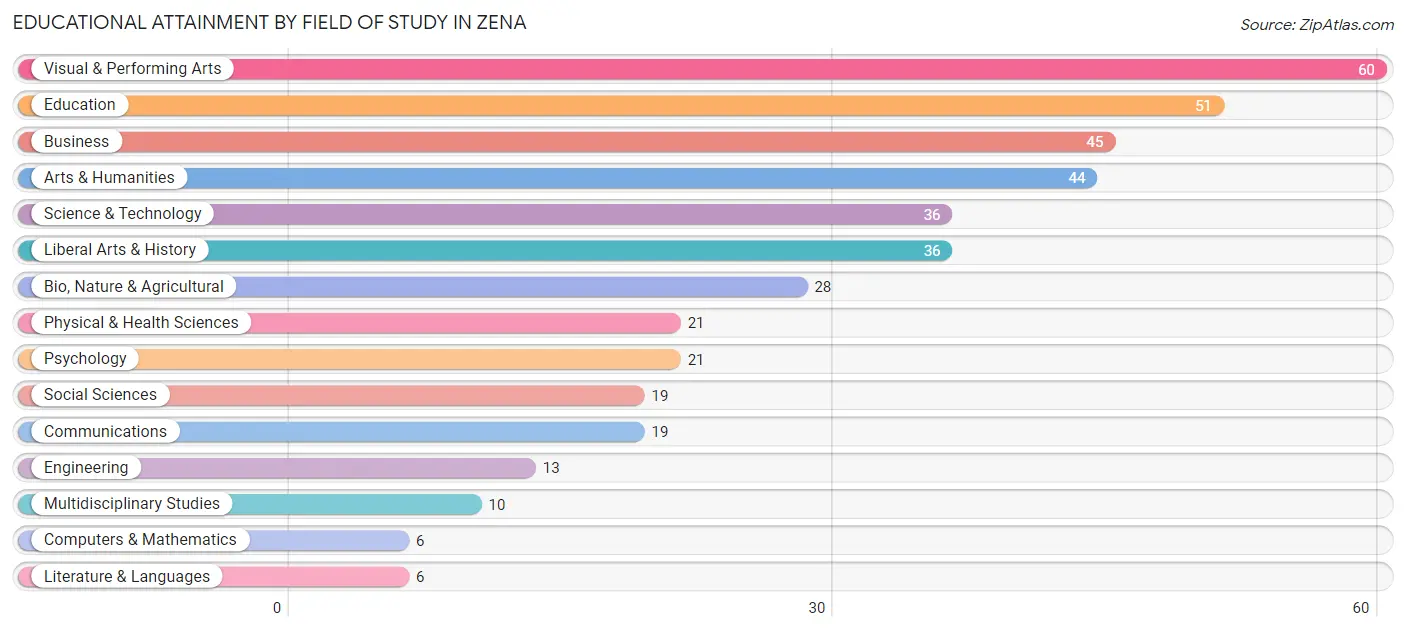
| Field of Study | # Graduates | % Graduates |
| Computers & Mathematics | 6 | 1.5% |
| Bio, Nature & Agricultural | 28 | 6.8% |
| Physical & Health Sciences | 21 | 5.1% |
| Psychology | 21 | 5.1% |
| Social Sciences | 19 | 4.6% |
| Engineering | 13 | 3.1% |
| Multidisciplinary Studies | 10 | 2.4% |
| Science & Technology | 36 | 8.7% |
| Business | 45 | 10.8% |
| Education | 51 | 12.3% |
| Literature & Languages | 6 | 1.5% |
| Liberal Arts & History | 36 | 8.7% |
| Visual & Performing Arts | 60 | 14.5% |
| Communications | 19 | 4.6% |
| Arts & Humanities | 44 | 10.6% |
| Total | 415 | 100.0% |
Transportation & Commute in Zena
Vehicle Availability by Sex in Zena
The most prevalent vehicle ownership categories in Zena are males with 1 vehicle (90, accounting for 43.9%) and females with 1 vehicle (58, making up 48.1%).
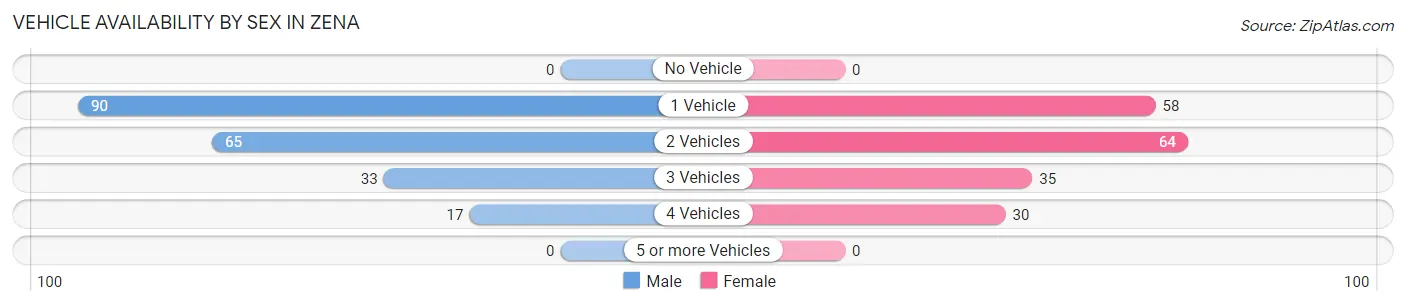
| Vehicles Available | Male | Female |
| No Vehicle | 0 (0.0%) | 0 (0.0%) |
| 1 Vehicle | 90 (43.9%) | 58 (31.0%) |
| 2 Vehicles | 65 (31.7%) | 64 (34.2%) |
| 3 Vehicles | 33 (16.1%) | 35 (18.7%) |
| 4 Vehicles | 17 (8.3%) | 30 (16.0%) |
| 5 or more Vehicles | 0 (0.0%) | 0 (0.0%) |
| Total | 205 (100.0%) | 187 (100.0%) |
Commute Time in Zena
The most frequently occuring commute durations in Zena are 20 to 24 minutes (65 commuters, 20.4%), 40 to 44 minutes (38 commuters, 11.9%), and 10 to 14 minutes (37 commuters, 11.6%).
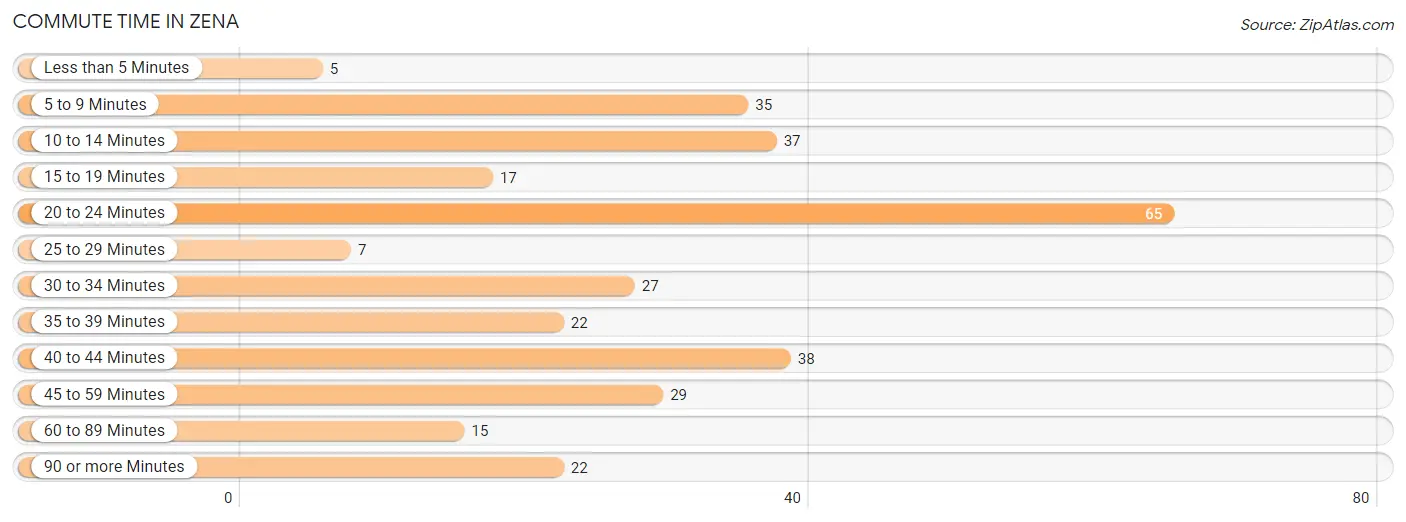
| Commute Time | # Commuters | % Commuters |
| Less than 5 Minutes | 5 | 1.6% |
| 5 to 9 Minutes | 35 | 11.0% |
| 10 to 14 Minutes | 37 | 11.6% |
| 15 to 19 Minutes | 17 | 5.3% |
| 20 to 24 Minutes | 65 | 20.4% |
| 25 to 29 Minutes | 7 | 2.2% |
| 30 to 34 Minutes | 27 | 8.5% |
| 35 to 39 Minutes | 22 | 6.9% |
| 40 to 44 Minutes | 38 | 11.9% |
| 45 to 59 Minutes | 29 | 9.1% |
| 60 to 89 Minutes | 15 | 4.7% |
| 90 or more Minutes | 22 | 6.9% |
Commute Time by Sex in Zena
The most common commute times in Zena are 30 to 34 minutes (27 commuters, 15.9%) for males and 20 to 24 minutes (41 commuters, 27.5%) for females.
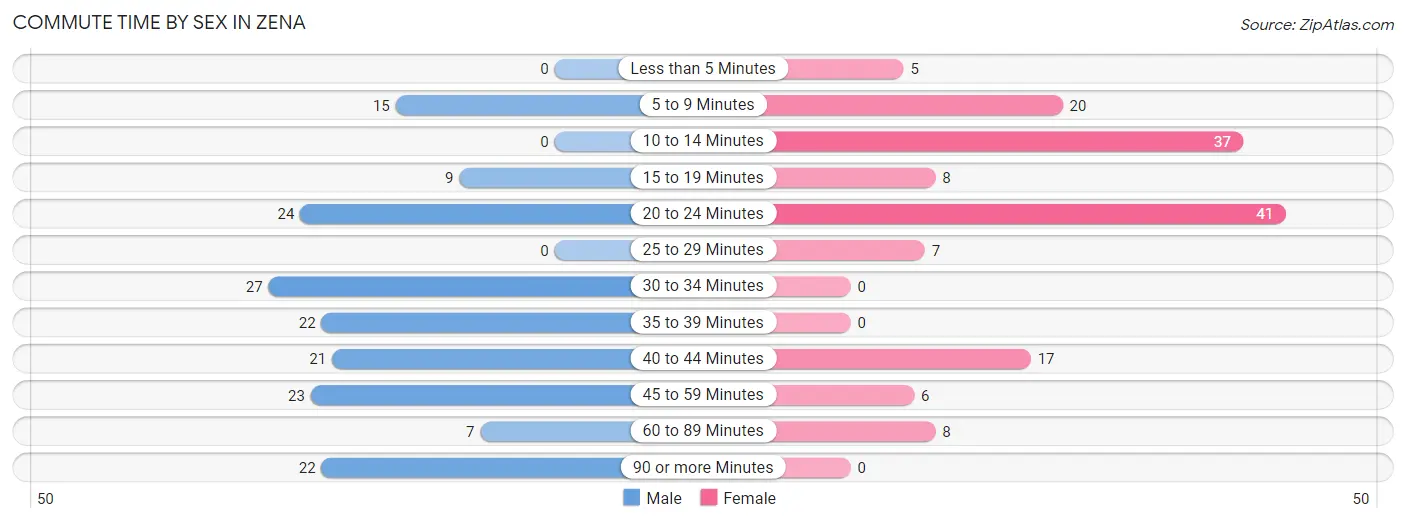
| Commute Time | Male | Female |
| Less than 5 Minutes | 0 (0.0%) | 5 (3.4%) |
| 5 to 9 Minutes | 15 (8.8%) | 20 (13.4%) |
| 10 to 14 Minutes | 0 (0.0%) | 37 (24.8%) |
| 15 to 19 Minutes | 9 (5.3%) | 8 (5.4%) |
| 20 to 24 Minutes | 24 (14.1%) | 41 (27.5%) |
| 25 to 29 Minutes | 0 (0.0%) | 7 (4.7%) |
| 30 to 34 Minutes | 27 (15.9%) | 0 (0.0%) |
| 35 to 39 Minutes | 22 (12.9%) | 0 (0.0%) |
| 40 to 44 Minutes | 21 (12.3%) | 17 (11.4%) |
| 45 to 59 Minutes | 23 (13.5%) | 6 (4.0%) |
| 60 to 89 Minutes | 7 (4.1%) | 8 (5.4%) |
| 90 or more Minutes | 22 (12.9%) | 0 (0.0%) |
Time of Departure to Work by Sex in Zena
The most frequent times of departure to work in Zena are 7:30 AM to 7:59 AM (48, 28.2%) for males and 8:30 AM to 8:59 AM (35, 23.5%) for females.
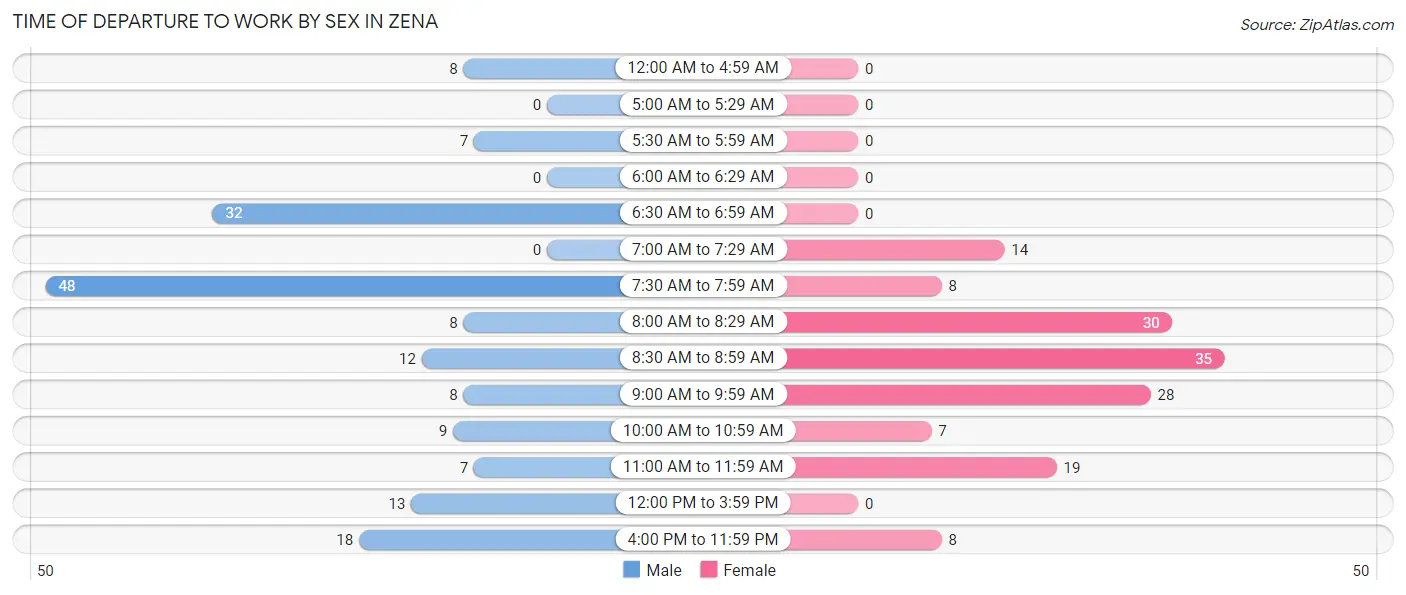
| Time of Departure | Male | Female |
| 12:00 AM to 4:59 AM | 8 (4.7%) | 0 (0.0%) |
| 5:00 AM to 5:29 AM | 0 (0.0%) | 0 (0.0%) |
| 5:30 AM to 5:59 AM | 7 (4.1%) | 0 (0.0%) |
| 6:00 AM to 6:29 AM | 0 (0.0%) | 0 (0.0%) |
| 6:30 AM to 6:59 AM | 32 (18.8%) | 0 (0.0%) |
| 7:00 AM to 7:29 AM | 0 (0.0%) | 14 (9.4%) |
| 7:30 AM to 7:59 AM | 48 (28.2%) | 8 (5.4%) |
| 8:00 AM to 8:29 AM | 8 (4.7%) | 30 (20.1%) |
| 8:30 AM to 8:59 AM | 12 (7.1%) | 35 (23.5%) |
| 9:00 AM to 9:59 AM | 8 (4.7%) | 28 (18.8%) |
| 10:00 AM to 10:59 AM | 9 (5.3%) | 7 (4.7%) |
| 11:00 AM to 11:59 AM | 7 (4.1%) | 19 (12.8%) |
| 12:00 PM to 3:59 PM | 13 (7.6%) | 0 (0.0%) |
| 4:00 PM to 11:59 PM | 18 (10.6%) | 8 (5.4%) |
| Total | 170 (100.0%) | 149 (100.0%) |
Housing Occupancy in Zena
Occupancy by Ownership in Zena
Of the total 347 dwellings in Zena, owner-occupied units account for 320 (92.2%), while renter-occupied units make up 27 (7.8%).
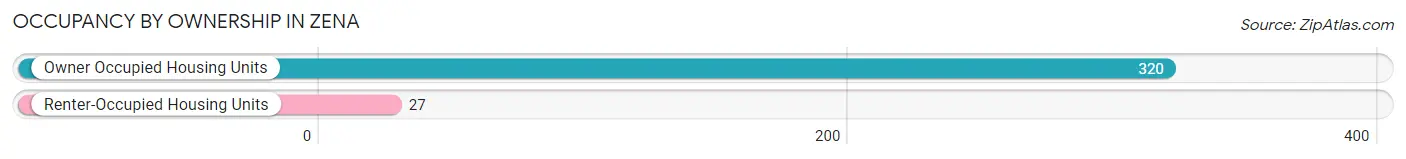
| Occupancy | # Housing Units | % Housing Units |
| Owner Occupied Housing Units | 320 | 92.2% |
| Renter-Occupied Housing Units | 27 | 7.8% |
| Total Occupied Housing Units | 347 | 100.0% |
Occupancy by Household Size in Zena
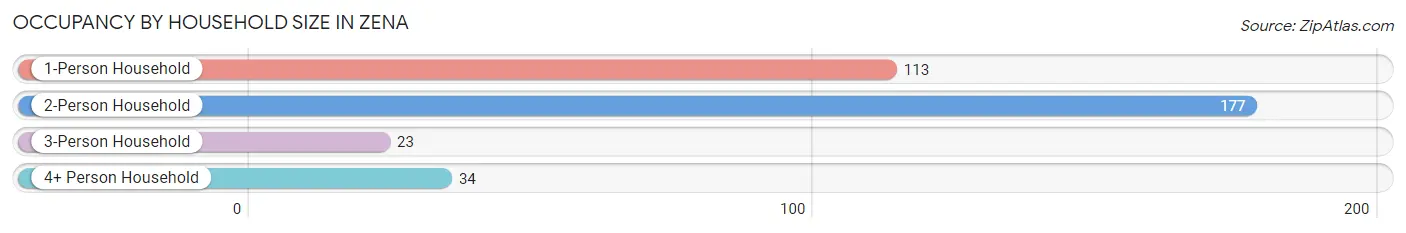
| Household Size | # Housing Units | % Housing Units |
| 1-Person Household | 113 | 32.6% |
| 2-Person Household | 177 | 51.0% |
| 3-Person Household | 23 | 6.6% |
| 4+ Person Household | 34 | 9.8% |
| Total Housing Units | 347 | 100.0% |
Occupancy by Ownership by Household Size in Zena
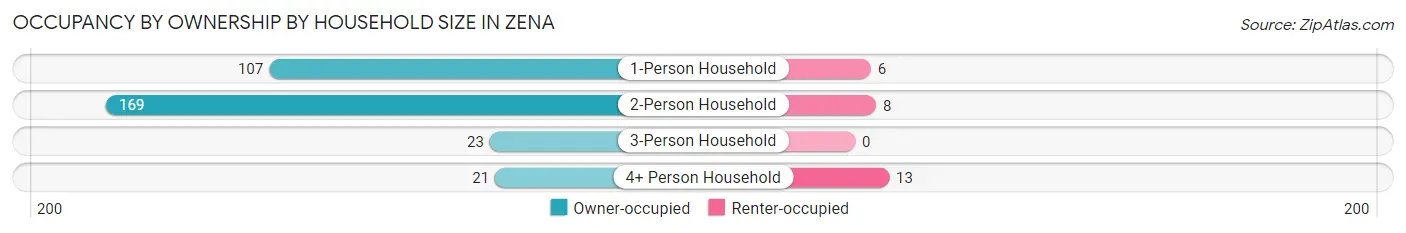
| Household Size | Owner-occupied | Renter-occupied |
| 1-Person Household | 107 (94.7%) | 6 (5.3%) |
| 2-Person Household | 169 (95.5%) | 8 (4.5%) |
| 3-Person Household | 23 (100.0%) | 0 (0.0%) |
| 4+ Person Household | 21 (61.8%) | 13 (38.2%) |
| Total Housing Units | 320 (92.2%) | 27 (7.8%) |
Occupancy by Educational Attainment in Zena
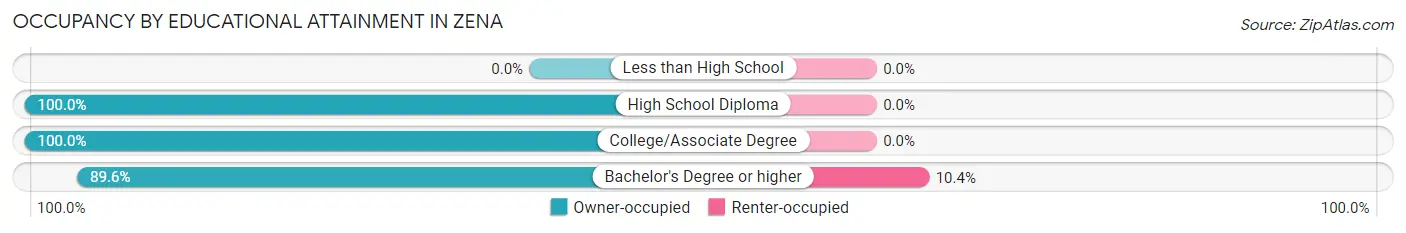
| Household Size | Owner-occupied | Renter-occupied |
| Less than High School | 0 (0.0%) | 0 (0.0%) |
| High School Diploma | 20 (100.0%) | 0 (0.0%) |
| College/Associate Degree | 68 (100.0%) | 0 (0.0%) |
| Bachelor's Degree or higher | 232 (89.6%) | 27 (10.4%) |
Occupancy by Age of Householder in Zena
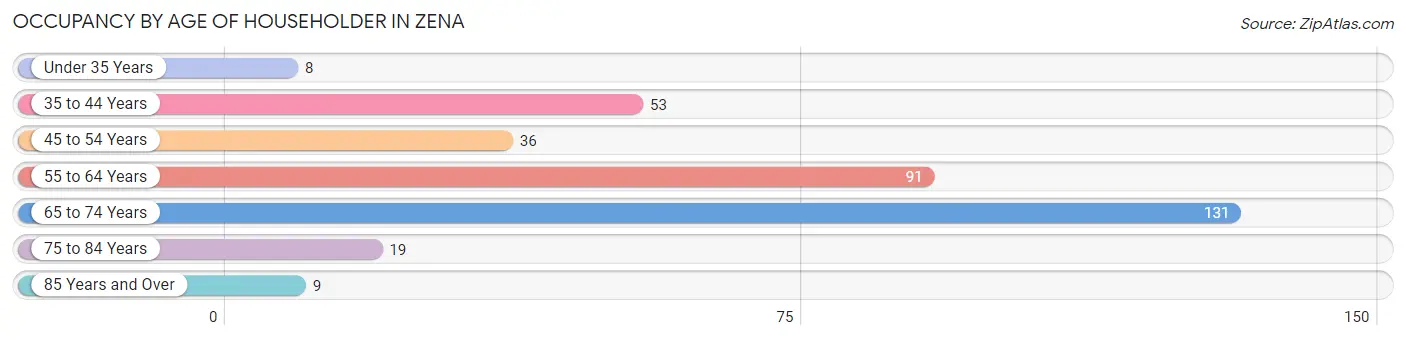
| Age Bracket | # Households | % Households |
| Under 35 Years | 8 | 2.3% |
| 35 to 44 Years | 53 | 15.3% |
| 45 to 54 Years | 36 | 10.4% |
| 55 to 64 Years | 91 | 26.2% |
| 65 to 74 Years | 131 | 37.8% |
| 75 to 84 Years | 19 | 5.5% |
| 85 Years and Over | 9 | 2.6% |
| Total | 347 | 100.0% |
Housing Finances in Zena
Median Income by Occupancy in Zena
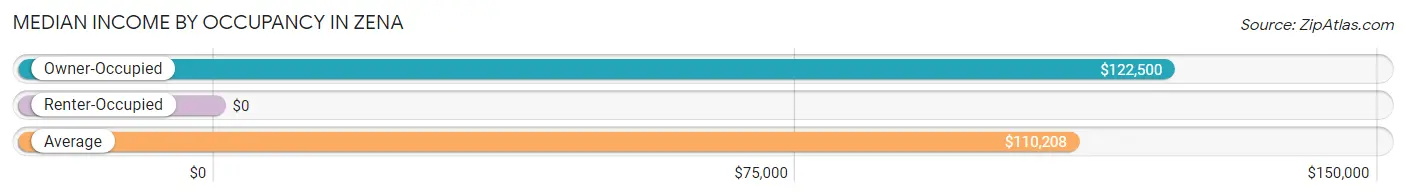
| Occupancy Type | # Households | Median Income |
| Owner-Occupied | 320 (92.2%) | $122,500 |
| Renter-Occupied | 27 (7.8%) | $0 |
| Average | 347 (100.0%) | $110,208 |
Occupancy by Householder Income Bracket in Zena
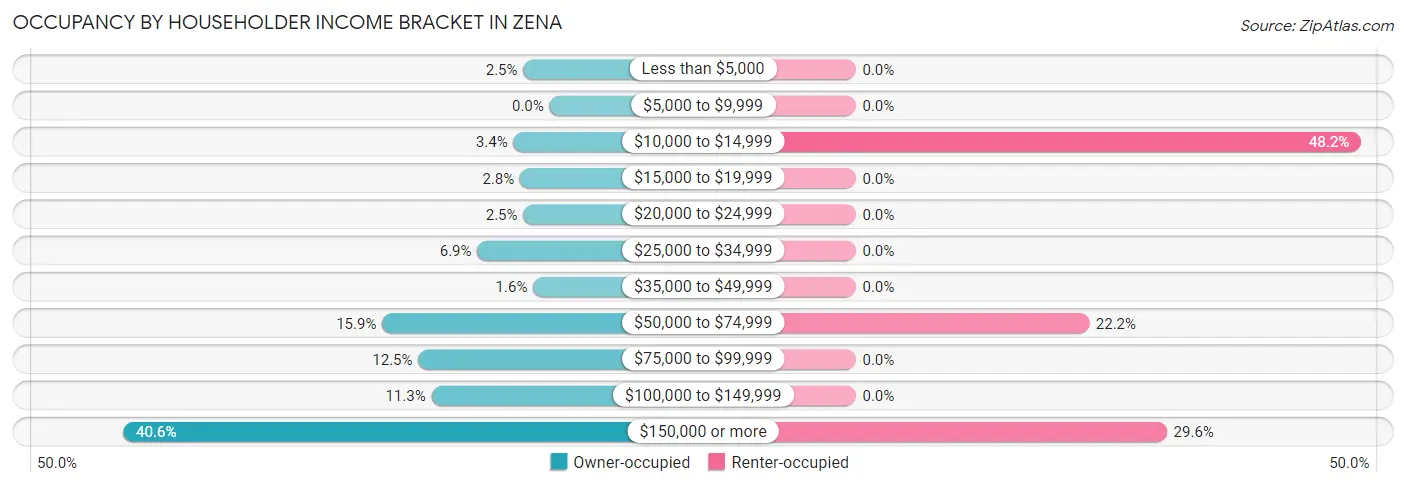
| Income Bracket | Owner-occupied | Renter-occupied |
| Less than $5,000 | 8 (2.5%) | 0 (0.0%) |
| $5,000 to $9,999 | 0 (0.0%) | 0 (0.0%) |
| $10,000 to $14,999 | 11 (3.4%) | 13 (48.1%) |
| $15,000 to $19,999 | 9 (2.8%) | 0 (0.0%) |
| $20,000 to $24,999 | 8 (2.5%) | 0 (0.0%) |
| $25,000 to $34,999 | 22 (6.9%) | 0 (0.0%) |
| $35,000 to $49,999 | 5 (1.6%) | 0 (0.0%) |
| $50,000 to $74,999 | 51 (15.9%) | 6 (22.2%) |
| $75,000 to $99,999 | 40 (12.5%) | 0 (0.0%) |
| $100,000 to $149,999 | 36 (11.3%) | 0 (0.0%) |
| $150,000 or more | 130 (40.6%) | 8 (29.6%) |
| Total | 320 (100.0%) | 27 (100.0%) |
Monthly Housing Cost Tiers in Zena
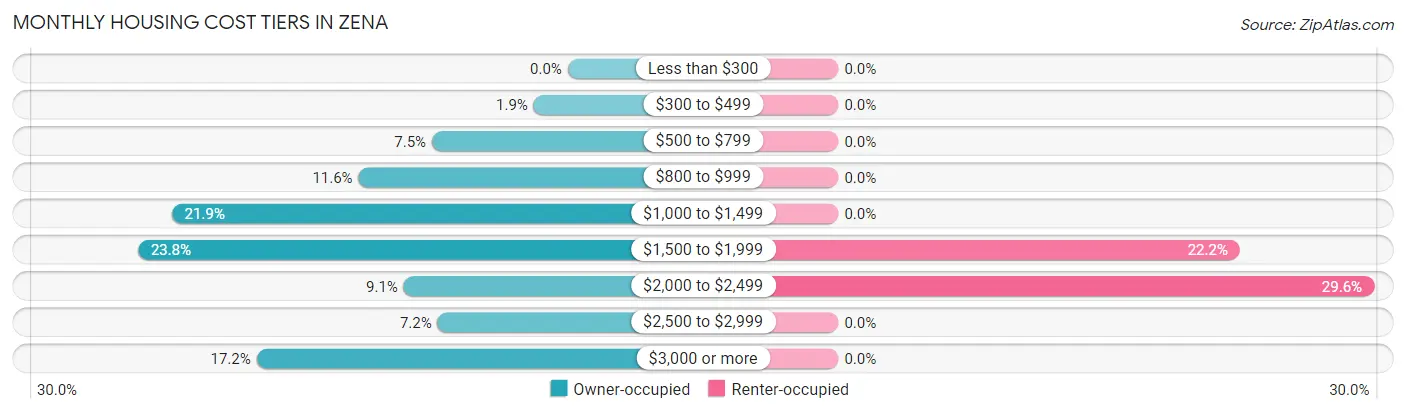
| Monthly Cost | Owner-occupied | Renter-occupied |
| Less than $300 | 0 (0.0%) | 0 (0.0%) |
| $300 to $499 | 6 (1.9%) | 0 (0.0%) |
| $500 to $799 | 24 (7.5%) | 0 (0.0%) |
| $800 to $999 | 37 (11.6%) | 0 (0.0%) |
| $1,000 to $1,499 | 70 (21.9%) | 0 (0.0%) |
| $1,500 to $1,999 | 76 (23.7%) | 6 (22.2%) |
| $2,000 to $2,499 | 29 (9.1%) | 8 (29.6%) |
| $2,500 to $2,999 | 23 (7.2%) | 0 (0.0%) |
| $3,000 or more | 55 (17.2%) | 0 (0.0%) |
| Total | 320 (100.0%) | 27 (100.0%) |
Physical Housing Characteristics in Zena
Housing Structures in Zena
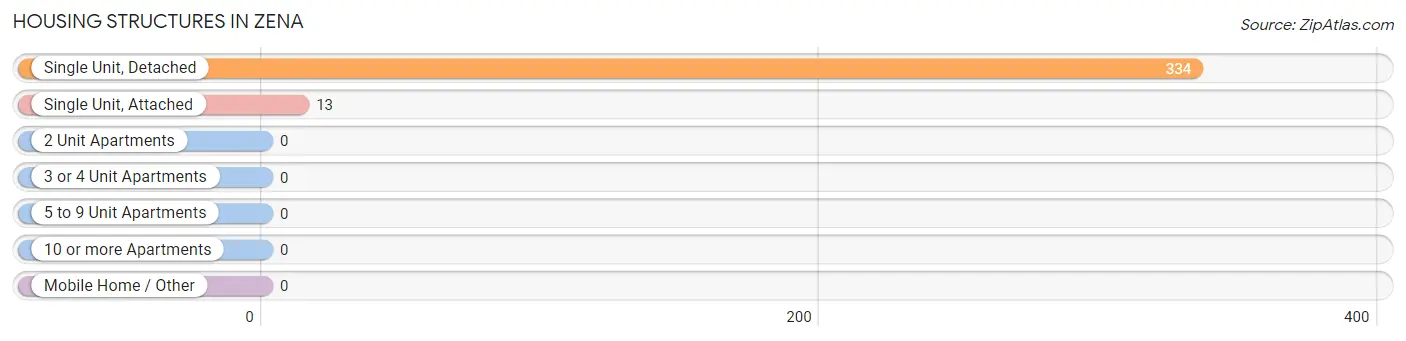
| Structure Type | # Housing Units | % Housing Units |
| Single Unit, Detached | 334 | 96.3% |
| Single Unit, Attached | 13 | 3.7% |
| 2 Unit Apartments | 0 | 0.0% |
| 3 or 4 Unit Apartments | 0 | 0.0% |
| 5 to 9 Unit Apartments | 0 | 0.0% |
| 10 or more Apartments | 0 | 0.0% |
| Mobile Home / Other | 0 | 0.0% |
| Total | 347 | 100.0% |
Housing Structures by Occupancy in Zena
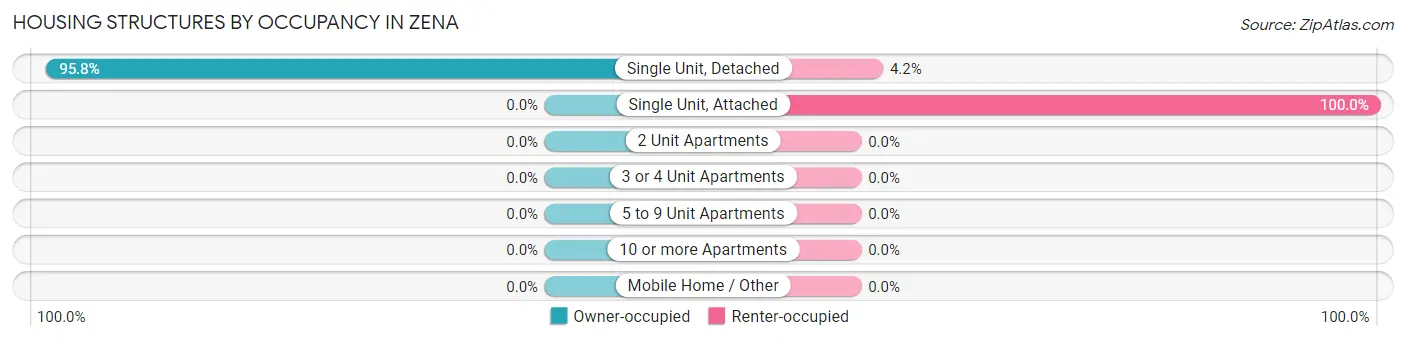
| Structure Type | Owner-occupied | Renter-occupied |
| Single Unit, Detached | 320 (95.8%) | 14 (4.2%) |
| Single Unit, Attached | 0 (0.0%) | 13 (100.0%) |
| 2 Unit Apartments | 0 (0.0%) | 0 (0.0%) |
| 3 or 4 Unit Apartments | 0 (0.0%) | 0 (0.0%) |
| 5 to 9 Unit Apartments | 0 (0.0%) | 0 (0.0%) |
| 10 or more Apartments | 0 (0.0%) | 0 (0.0%) |
| Mobile Home / Other | 0 (0.0%) | 0 (0.0%) |
| Total | 320 (92.2%) | 27 (7.8%) |
Housing Structures by Number of Rooms in Zena
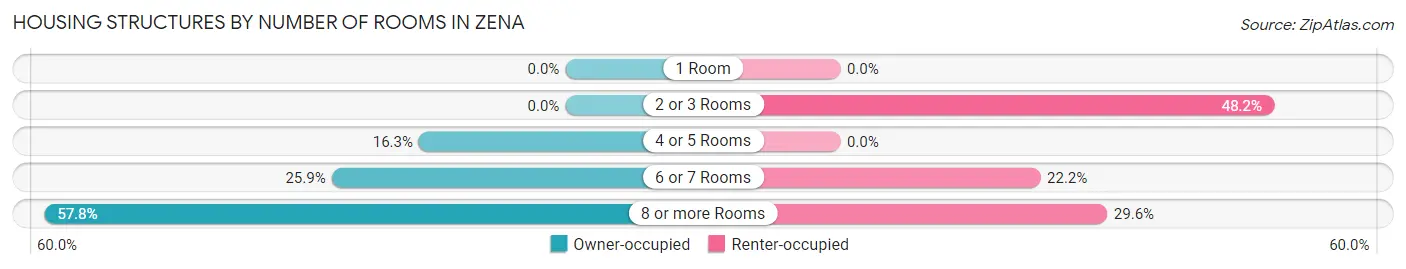
| Number of Rooms | Owner-occupied | Renter-occupied |
| 1 Room | 0 (0.0%) | 0 (0.0%) |
| 2 or 3 Rooms | 0 (0.0%) | 13 (48.1%) |
| 4 or 5 Rooms | 52 (16.3%) | 0 (0.0%) |
| 6 or 7 Rooms | 83 (25.9%) | 6 (22.2%) |
| 8 or more Rooms | 185 (57.8%) | 8 (29.6%) |
| Total | 320 (100.0%) | 27 (100.0%) |
Housing Structure by Heating Type in Zena
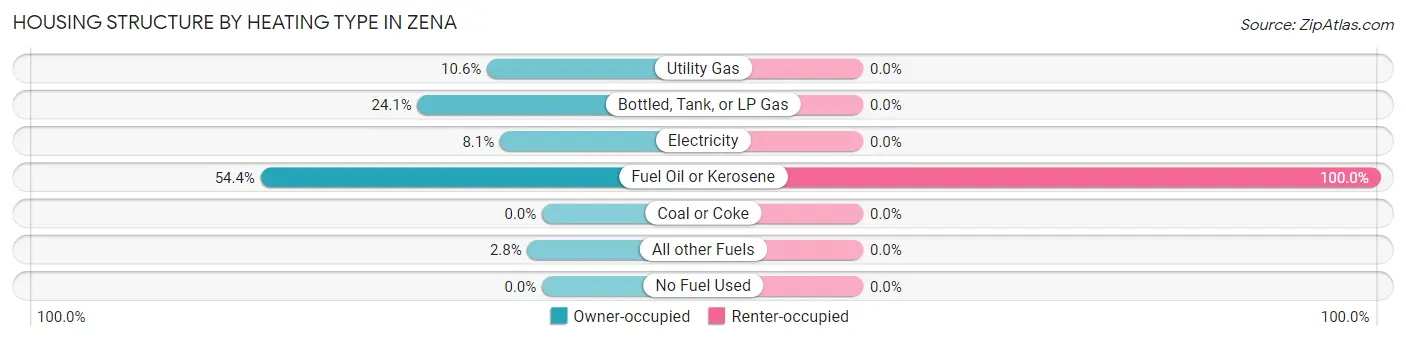
| Heating Type | Owner-occupied | Renter-occupied |
| Utility Gas | 34 (10.6%) | 0 (0.0%) |
| Bottled, Tank, or LP Gas | 77 (24.1%) | 0 (0.0%) |
| Electricity | 26 (8.1%) | 0 (0.0%) |
| Fuel Oil or Kerosene | 174 (54.4%) | 27 (100.0%) |
| Coal or Coke | 0 (0.0%) | 0 (0.0%) |
| All other Fuels | 9 (2.8%) | 0 (0.0%) |
| No Fuel Used | 0 (0.0%) | 0 (0.0%) |
| Total | 320 (100.0%) | 27 (100.0%) |
Household Vehicle Usage in Zena
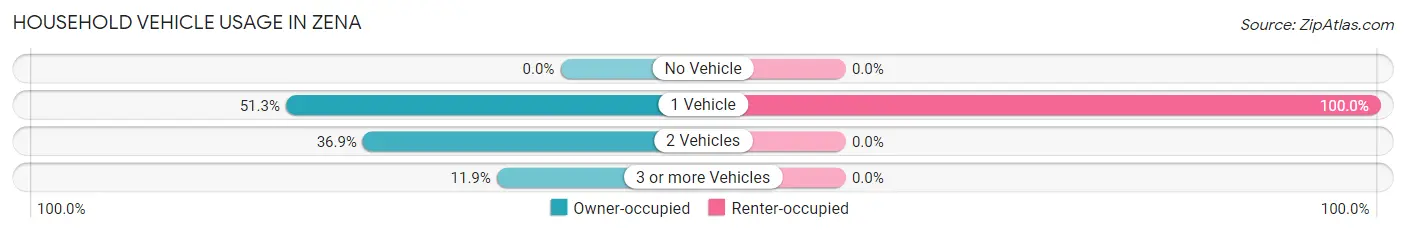
| Vehicles per Household | Owner-occupied | Renter-occupied |
| No Vehicle | 0 (0.0%) | 0 (0.0%) |
| 1 Vehicle | 164 (51.2%) | 27 (100.0%) |
| 2 Vehicles | 118 (36.9%) | 0 (0.0%) |
| 3 or more Vehicles | 38 (11.9%) | 0 (0.0%) |
| Total | 320 (100.0%) | 27 (100.0%) |
Real Estate & Mortgages in Zena
Real Estate and Mortgage Overview in Zena
| Characteristic | Without Mortgage | With Mortgage |
| Housing Units | 145 | 175 |
| Median Property Value | $390,400 | $381,300 |
| Median Household Income | $134,375 | $77 |
| Monthly Housing Costs | $1,132 | $55 |
| Real Estate Taxes | $8,467 | $0 |
Property Value by Mortgage Status in Zena
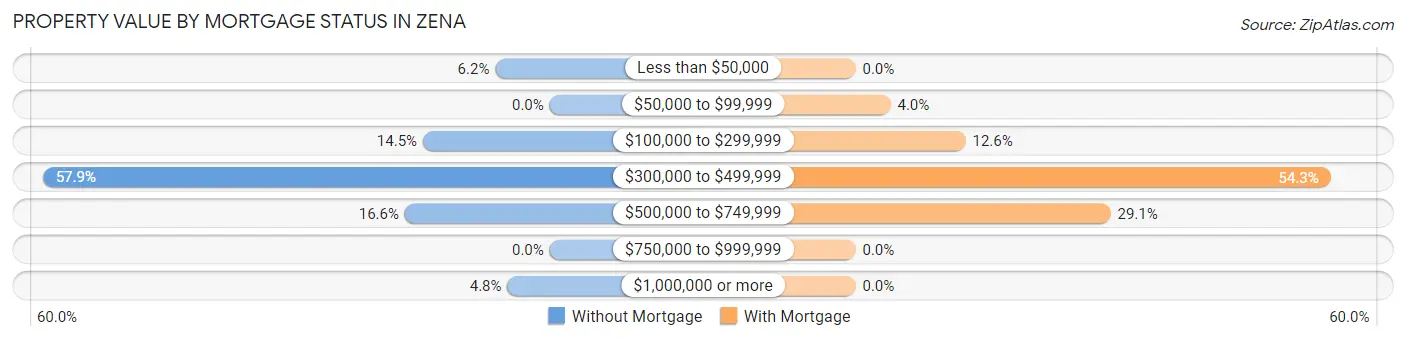
| Property Value | Without Mortgage | With Mortgage |
| Less than $50,000 | 9 (6.2%) | 0 (0.0%) |
| $50,000 to $99,999 | 0 (0.0%) | 7 (4.0%) |
| $100,000 to $299,999 | 21 (14.5%) | 22 (12.6%) |
| $300,000 to $499,999 | 84 (57.9%) | 95 (54.3%) |
| $500,000 to $749,999 | 24 (16.6%) | 51 (29.1%) |
| $750,000 to $999,999 | 0 (0.0%) | 0 (0.0%) |
| $1,000,000 or more | 7 (4.8%) | 0 (0.0%) |
| Total | 145 (100.0%) | 175 (100.0%) |
Household Income by Mortgage Status in Zena
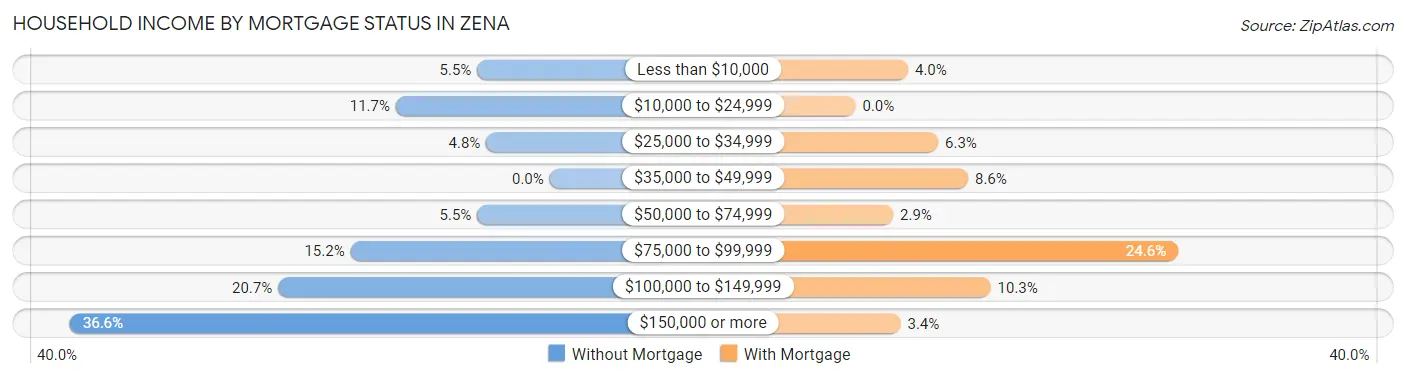
| Household Income | Without Mortgage | With Mortgage |
| Less than $10,000 | 8 (5.5%) | 7 (4.0%) |
| $10,000 to $24,999 | 17 (11.7%) | 0 (0.0%) |
| $25,000 to $34,999 | 7 (4.8%) | 11 (6.3%) |
| $35,000 to $49,999 | 0 (0.0%) | 15 (8.6%) |
| $50,000 to $74,999 | 8 (5.5%) | 5 (2.9%) |
| $75,000 to $99,999 | 22 (15.2%) | 43 (24.6%) |
| $100,000 to $149,999 | 30 (20.7%) | 18 (10.3%) |
| $150,000 or more | 53 (36.5%) | 6 (3.4%) |
| Total | 145 (100.0%) | 175 (100.0%) |
Property Value to Household Income Ratio in Zena
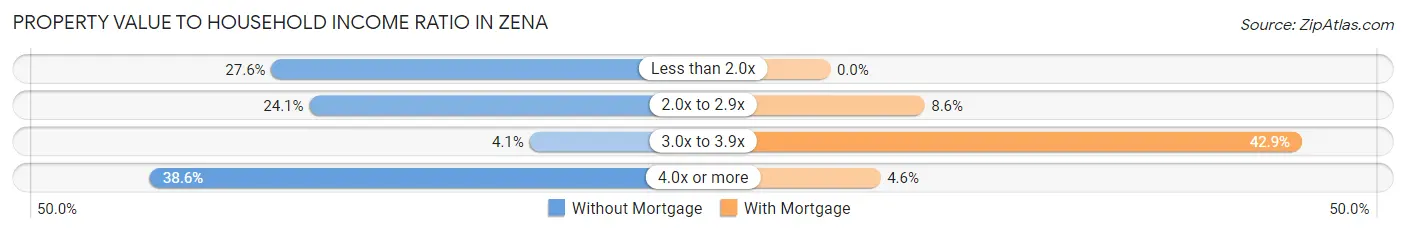
| Value-to-Income Ratio | Without Mortgage | With Mortgage |
| Less than 2.0x | 40 (27.6%) | 0 (0.0%) |
| 2.0x to 2.9x | 35 (24.1%) | 15 (8.6%) |
| 3.0x to 3.9x | 6 (4.1%) | 75 (42.9%) |
| 4.0x or more | 56 (38.6%) | 8 (4.6%) |
| Total | 145 (100.0%) | 175 (100.0%) |
Real Estate Taxes by Mortgage Status in Zena
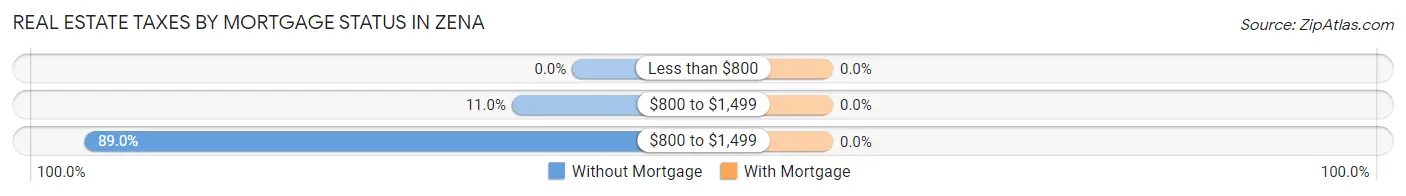
| Property Taxes | Without Mortgage | With Mortgage |
| Less than $800 | 0 (0.0%) | 0 (0.0%) |
| $800 to $1,499 | 16 (11.0%) | 0 (0.0%) |
| $800 to $1,499 | 129 (89.0%) | 0 (0.0%) |
| Total | 145 (100.0%) | 175 (100.0%) |
Health & Disability in Zena
Health Insurance Coverage by Age in Zena
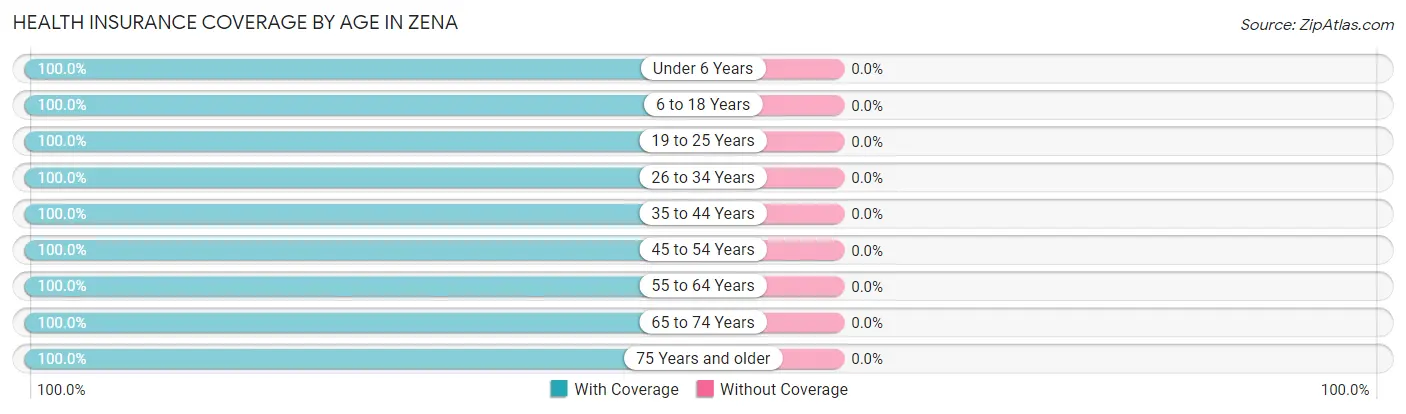
| Age Bracket | With Coverage | Without Coverage |
| Under 6 Years | 26 (100.0%) | 0 (0.0%) |
| 6 to 18 Years | 33 (100.0%) | 0 (0.0%) |
| 19 to 25 Years | 43 (100.0%) | 0 (0.0%) |
| 26 to 34 Years | 38 (100.0%) | 0 (0.0%) |
| 35 to 44 Years | 86 (100.0%) | 0 (0.0%) |
| 45 to 54 Years | 66 (100.0%) | 0 (0.0%) |
| 55 to 64 Years | 182 (100.0%) | 0 (0.0%) |
| 65 to 74 Years | 217 (100.0%) | 0 (0.0%) |
| 75 Years and older | 35 (100.0%) | 0 (0.0%) |
| Total | 726 (100.0%) | 0 (0.0%) |
Health Insurance Coverage by Citizenship Status in Zena
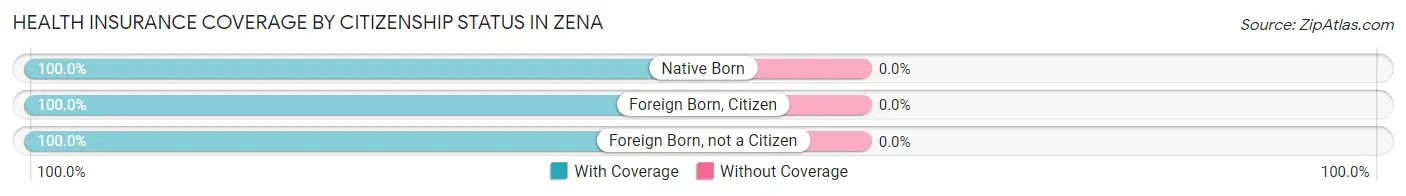
| Citizenship Status | With Coverage | Without Coverage |
| Native Born | 26 (100.0%) | 0 (0.0%) |
| Foreign Born, Citizen | 33 (100.0%) | 0 (0.0%) |
| Foreign Born, not a Citizen | 43 (100.0%) | 0 (0.0%) |
Health Insurance Coverage by Household Income in Zena
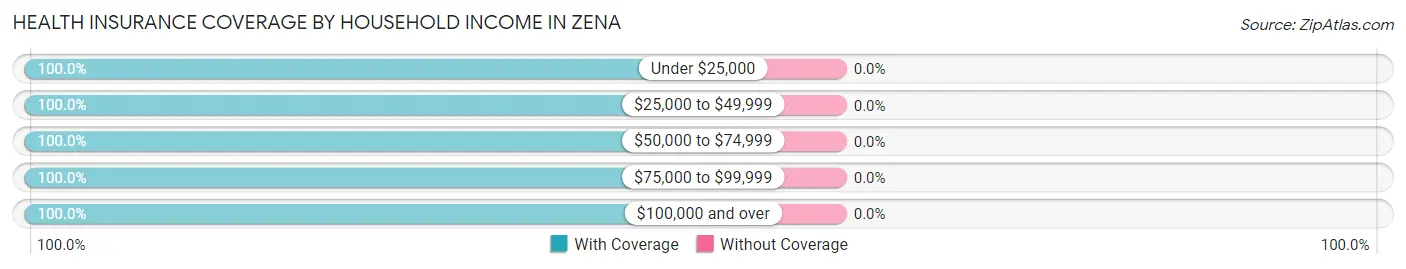
| Household Income | With Coverage | Without Coverage |
| Under $25,000 | 118 (100.0%) | 0 (0.0%) |
| $25,000 to $49,999 | 46 (100.0%) | 0 (0.0%) |
| $50,000 to $74,999 | 73 (100.0%) | 0 (0.0%) |
| $75,000 to $99,999 | 69 (100.0%) | 0 (0.0%) |
| $100,000 and over | 414 (100.0%) | 0 (0.0%) |
Public vs Private Health Insurance Coverage by Age in Zena
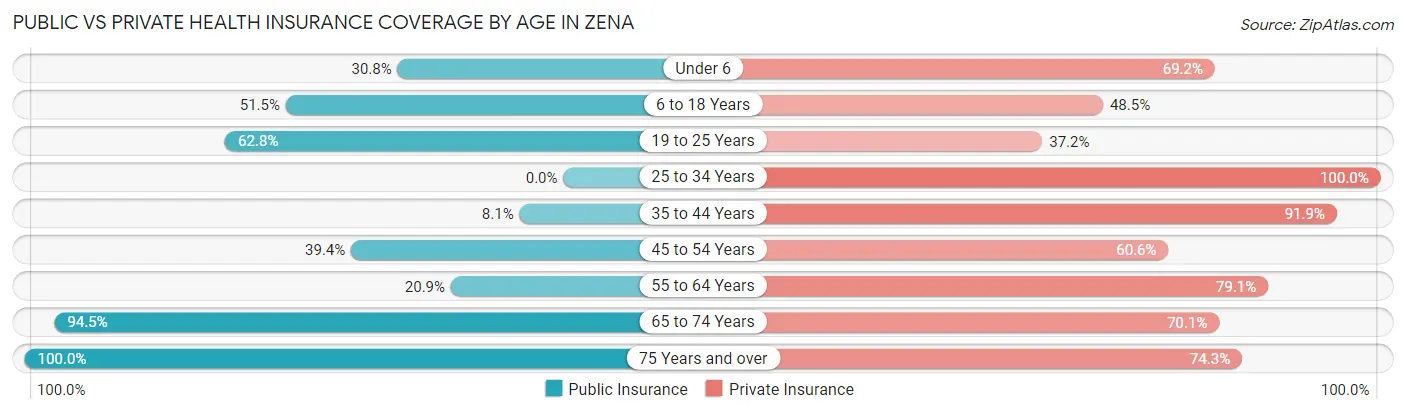
| Age Bracket | Public Insurance | Private Insurance |
| Under 6 | 8 (30.8%) | 18 (69.2%) |
| 6 to 18 Years | 17 (51.5%) | 16 (48.5%) |
| 19 to 25 Years | 27 (62.8%) | 16 (37.2%) |
| 25 to 34 Years | 0 (0.0%) | 38 (100.0%) |
| 35 to 44 Years | 7 (8.1%) | 79 (91.9%) |
| 45 to 54 Years | 26 (39.4%) | 40 (60.6%) |
| 55 to 64 Years | 38 (20.9%) | 144 (79.1%) |
| 65 to 74 Years | 205 (94.5%) | 152 (70.1%) |
| 75 Years and over | 35 (100.0%) | 26 (74.3%) |
| Total | 363 (50.0%) | 529 (72.9%) |
Disability Status by Sex by Age in Zena
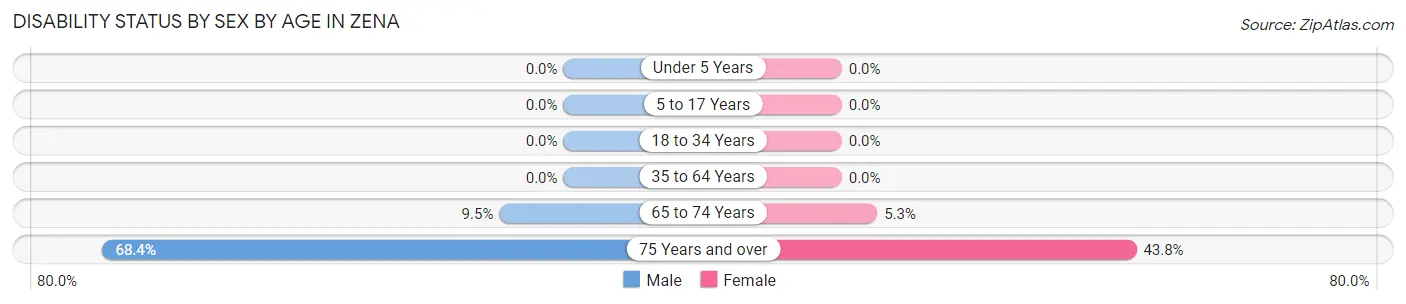
| Age Bracket | Male | Female |
| Under 5 Years | 0 (0.0%) | 0 (0.0%) |
| 5 to 17 Years | 0 (0.0%) | 0 (0.0%) |
| 18 to 34 Years | 0 (0.0%) | 0 (0.0%) |
| 35 to 64 Years | 0 (0.0%) | 0 (0.0%) |
| 65 to 74 Years | 8 (9.5%) | 7 (5.3%) |
| 75 Years and over | 13 (68.4%) | 7 (43.8%) |
Disability Class by Sex by Age in Zena
Disability Class: Hearing Difficulty
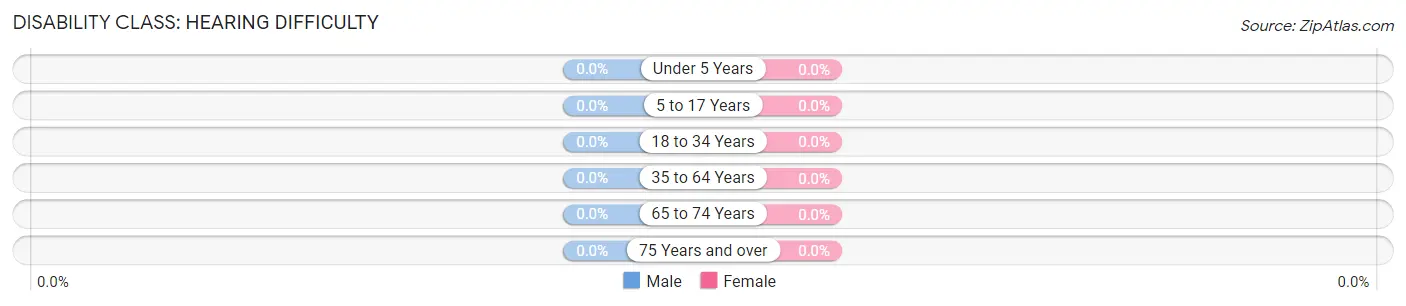
| Age Bracket | Male | Female |
| Under 5 Years | 0 (0.0%) | 0 (0.0%) |
| 5 to 17 Years | 0 (0.0%) | 0 (0.0%) |
| 18 to 34 Years | 0 (0.0%) | 0 (0.0%) |
| 35 to 64 Years | 0 (0.0%) | 0 (0.0%) |
| 65 to 74 Years | 0 (0.0%) | 0 (0.0%) |
| 75 Years and over | 0 (0.0%) | 0 (0.0%) |
Disability Class: Vision Difficulty
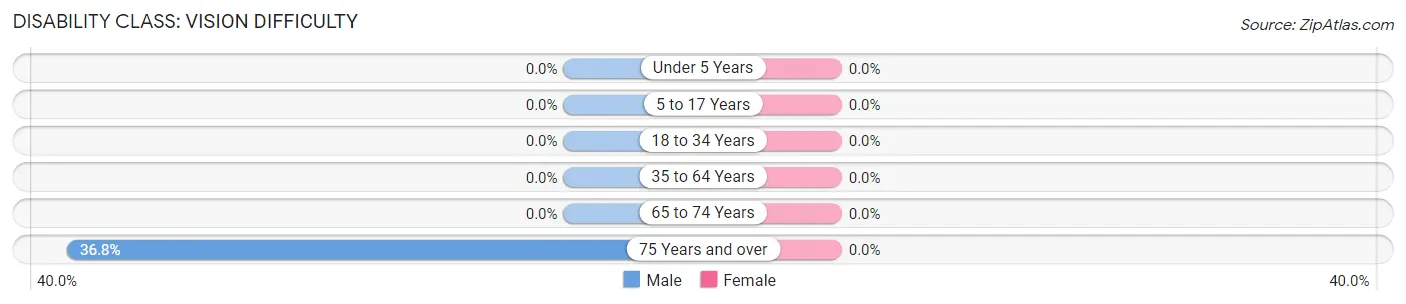
| Age Bracket | Male | Female |
| Under 5 Years | 0 (0.0%) | 0 (0.0%) |
| 5 to 17 Years | 0 (0.0%) | 0 (0.0%) |
| 18 to 34 Years | 0 (0.0%) | 0 (0.0%) |
| 35 to 64 Years | 0 (0.0%) | 0 (0.0%) |
| 65 to 74 Years | 0 (0.0%) | 0 (0.0%) |
| 75 Years and over | 7 (36.8%) | 0 (0.0%) |
Disability Class: Cognitive Difficulty
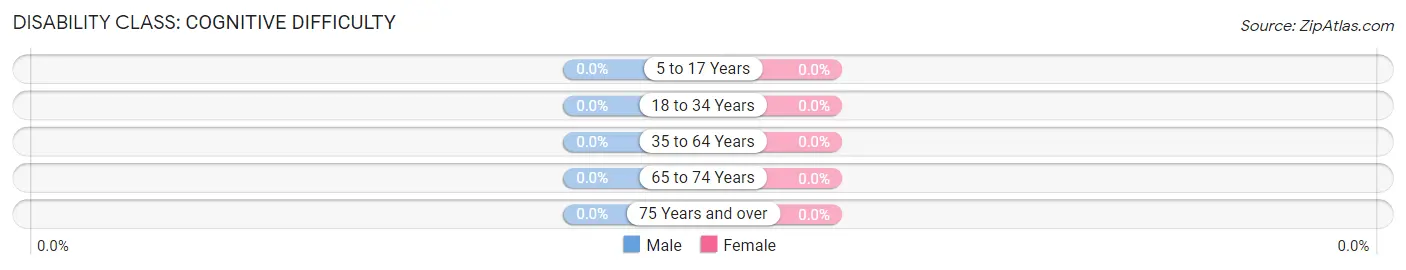
| Age Bracket | Male | Female |
| 5 to 17 Years | 0 (0.0%) | 0 (0.0%) |
| 18 to 34 Years | 0 (0.0%) | 0 (0.0%) |
| 35 to 64 Years | 0 (0.0%) | 0 (0.0%) |
| 65 to 74 Years | 0 (0.0%) | 0 (0.0%) |
| 75 Years and over | 0 (0.0%) | 0 (0.0%) |
Disability Class: Ambulatory Difficulty
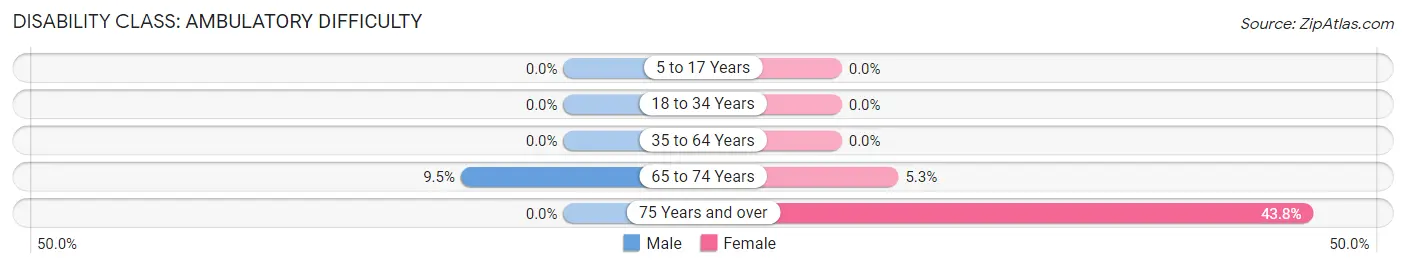
| Age Bracket | Male | Female |
| 5 to 17 Years | 0 (0.0%) | 0 (0.0%) |
| 18 to 34 Years | 0 (0.0%) | 0 (0.0%) |
| 35 to 64 Years | 0 (0.0%) | 0 (0.0%) |
| 65 to 74 Years | 8 (9.5%) | 7 (5.3%) |
| 75 Years and over | 0 (0.0%) | 7 (43.8%) |
Disability Class: Self-Care Difficulty
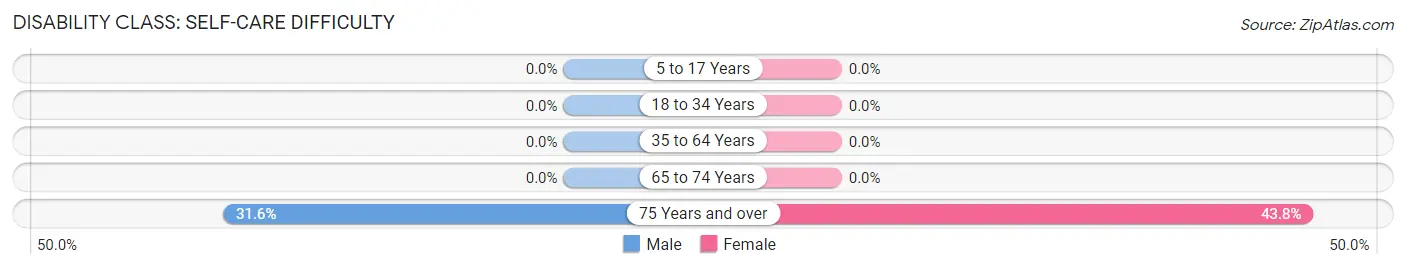
| Age Bracket | Male | Female |
| 5 to 17 Years | 0 (0.0%) | 0 (0.0%) |
| 18 to 34 Years | 0 (0.0%) | 0 (0.0%) |
| 35 to 64 Years | 0 (0.0%) | 0 (0.0%) |
| 65 to 74 Years | 0 (0.0%) | 0 (0.0%) |
| 75 Years and over | 6 (31.6%) | 7 (43.8%) |
Technology Access in Zena
Computing Device Access in Zena
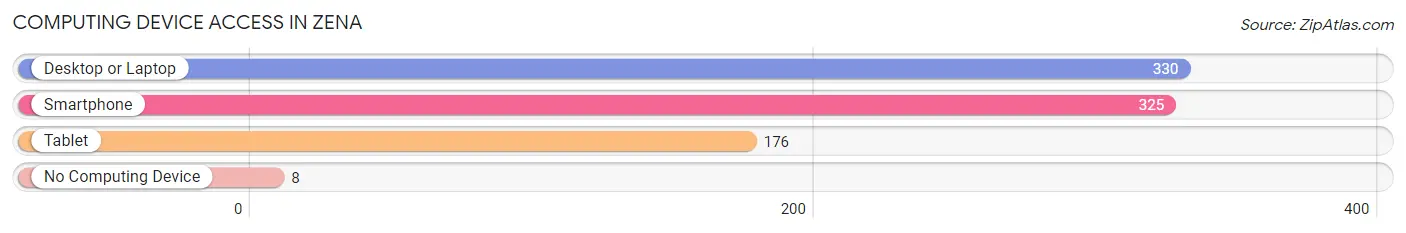
| Device Type | # Households | % Households |
| Desktop or Laptop | 330 | 95.1% |
| Smartphone | 325 | 93.7% |
| Tablet | 176 | 50.7% |
| No Computing Device | 8 | 2.3% |
| Total | 347 | 100.0% |
Internet Access in Zena
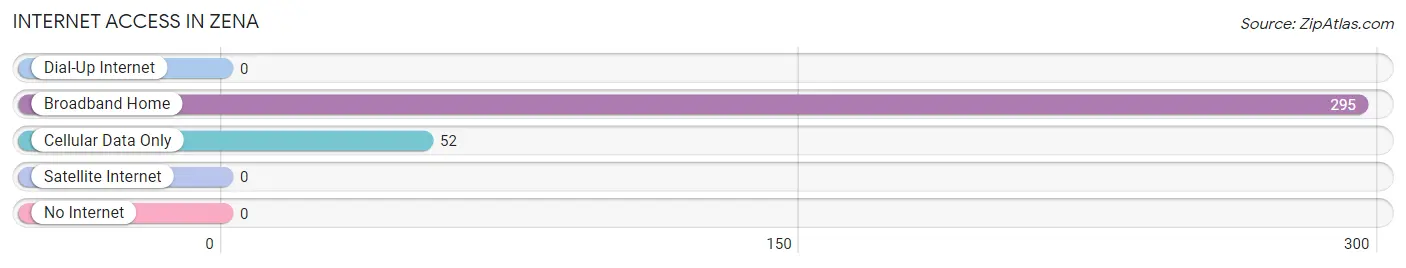
| Internet Type | # Households | % Households |
| Dial-Up Internet | 0 | 0.0% |
| Broadband Home | 295 | 85.0% |
| Cellular Data Only | 52 | 15.0% |
| Satellite Internet | 0 | 0.0% |
| No Internet | 0 | 0.0% |
| Total | 347 | 100.0% |
Zena Summary
Zena is a small hamlet located in the town of Saugerties in Ulster County, New York. It is situated on the banks of the Esopus Creek, about two miles south of the village of Saugerties. The hamlet is home to a population of about 1,000 people, and is a popular destination for outdoor recreation and relaxation.
Geography
Zena is located in the Hudson Valley region of New York, about two miles south of the village of Saugerties. The hamlet is situated on the banks of the Esopus Creek, which flows through the town of Saugerties. The terrain of the area is mostly flat, with some rolling hills and valleys. The climate is temperate, with warm summers and cold winters.
History
The hamlet of Zena was first settled in the late 1700s by Dutch and German immigrants. The area was originally known as “Zena’s Corners”, named after a local landowner. In the early 1800s, the hamlet was home to a number of small businesses, including a grist mill, a saw mill, and a blacksmith shop. The hamlet was also home to a number of farms, which produced a variety of crops, including wheat, corn, and hay.
In the late 1800s, the hamlet began to grow and develop. A post office was established in 1891, and a school was built in 1895. The hamlet was also home to a number of churches, including the Dutch Reformed Church, the Methodist Episcopal Church, and the Presbyterian Church.
Economy
The economy of Zena is largely based on tourism and outdoor recreation. The hamlet is home to a number of bed and breakfasts, as well as a number of restaurants and cafes. The area is also popular for its outdoor activities, such as fishing, hiking, and camping.
The hamlet is also home to a number of small businesses, including a grocery store, a hardware store, and a gas station. The hamlet is also home to a number of art galleries and antique shops.
Demographics
As of the 2010 census, the population of Zena was 1,000 people. The racial makeup of the hamlet was 94.2% White, 2.2% African American, 0.7% Native American, 0.7% Asian, 0.2% Pacific Islander, and 1.9% from other races. The median household income was $45,000, and the median family income was $50,000.
Conclusion
Zena is a small hamlet located in the town of Saugerties in Ulster County, New York. It is situated on the banks of the Esopus Creek, and is home to a population of about 1,000 people. The hamlet is a popular destination for outdoor recreation and relaxation, and is home to a number of small businesses. The economy of the hamlet is largely based on tourism and outdoor recreation, and the population is mostly White.
Common Questions
What is Per Capita Income in Zena?
Per Capita income in Zena is $60,760.
What is the Median Family Income in Zena?
Median Family Income in Zena is $147,708.
What is the Median Household income in Zena?
Median Household Income in Zena is $110,208.
What is Inequality or Gini Index in Zena?
Inequality or Gini Index in Zena is 0.40.
What is the Total Population of Zena?
Total Population of Zena is 726.
What is the Total Male Population of Zena?
Total Male Population of Zena is 339.
What is the Total Female Population of Zena?
Total Female Population of Zena is 387.
What is the Ratio of Males per 100 Females in Zena?
There are 87.60 Males per 100 Females in Zena.
What is the Ratio of Females per 100 Males in Zena?
There are 114.16 Females per 100 Males in Zena.
What is the Median Population Age in Zena?
Median Population Age in Zena is 59.9 Years.
What is the Average Family Size in Zena
Average Family Size in Zena is 2.4 People.
What is the Average Household Size in Zena
Average Household Size in Zena is 2.1 People.
How Large is the Labor Force in Zena?
There are 400 People in the Labor Forcein in Zena.
What is the Percentage of People in the Labor Force in Zena?
59.3% of People are in the Labor Force in Zena.
What is the Unemployment Rate in Zena?
Unemployment Rate in Zena is 2.0%.