Selden, NY Map & Demographics
Selden Map
Selden Overview
$40,923
PER CAPITA INCOME
$127,973
AVG FAMILY INCOME
$115,406
AVG HOUSEHOLD INCOME
40.8%
WAGE / INCOME GAP [ % ]
59.2¢/ $1
WAGE / INCOME GAP [ $ ]
$12,522
FAMILY INCOME DEFICIT
0.36
INEQUALITY / GINI INDEX
21,759
TOTAL POPULATION
10,802
MALE POPULATION
10,957
FEMALE POPULATION
98.59
MALES / 100 FEMALES
101.43
FEMALES / 100 MALES
38.8
MEDIAN AGE
3.5
AVG FAMILY SIZE
3.1
AVG HOUSEHOLD SIZE
11,400
LABOR FORCE [ PEOPLE ]
63.6%
PERCENT IN LABOR FORCE
5.0%
UNEMPLOYMENT RATE
Selden Zip Codes
Selden Area Codes
Income in Selden
Income Overview in Selden
Per Capita Income in Selden is $40,923, while median incomes of families and households are $127,973 and $115,406 respectively.
| Characteristic | Number | Measure |
| Per Capita Income | 21,759 | $40,923 |
| Median Family Income | 5,573 | $127,973 |
| Mean Family Income | 5,573 | $133,672 |
| Median Household Income | 6,889 | $115,406 |
| Mean Household Income | 6,889 | $125,085 |
| Income Deficit | 5,573 | $12,522 |
| Wage / Income Gap (%) | 21,759 | 40.83% |
| Wage / Income Gap ($) | 21,759 | 59.17¢ per $1 |
| Gini / Inequality Index | 21,759 | 0.36 |
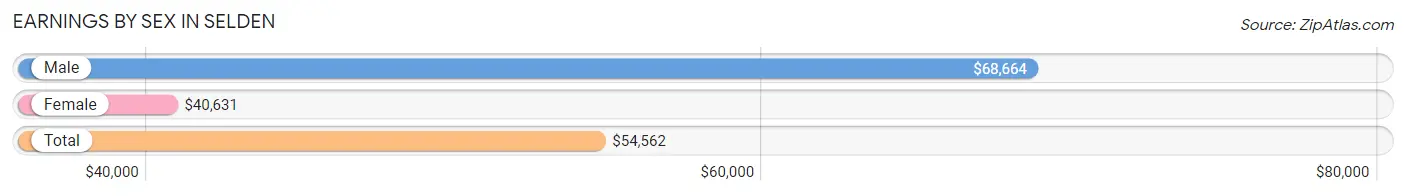
Earnings by Sex in Selden
Average Earnings in Selden are $54,562, $68,664 for men and $40,631 for women, a difference of 40.8%.
| Sex | Number | Average Earnings |
| Male | 5,823 (49.9%) | $68,664 |
| Female | 5,840 (50.1%) | $40,631 |
| Total | 11,663 (100.0%) | $54,562 |
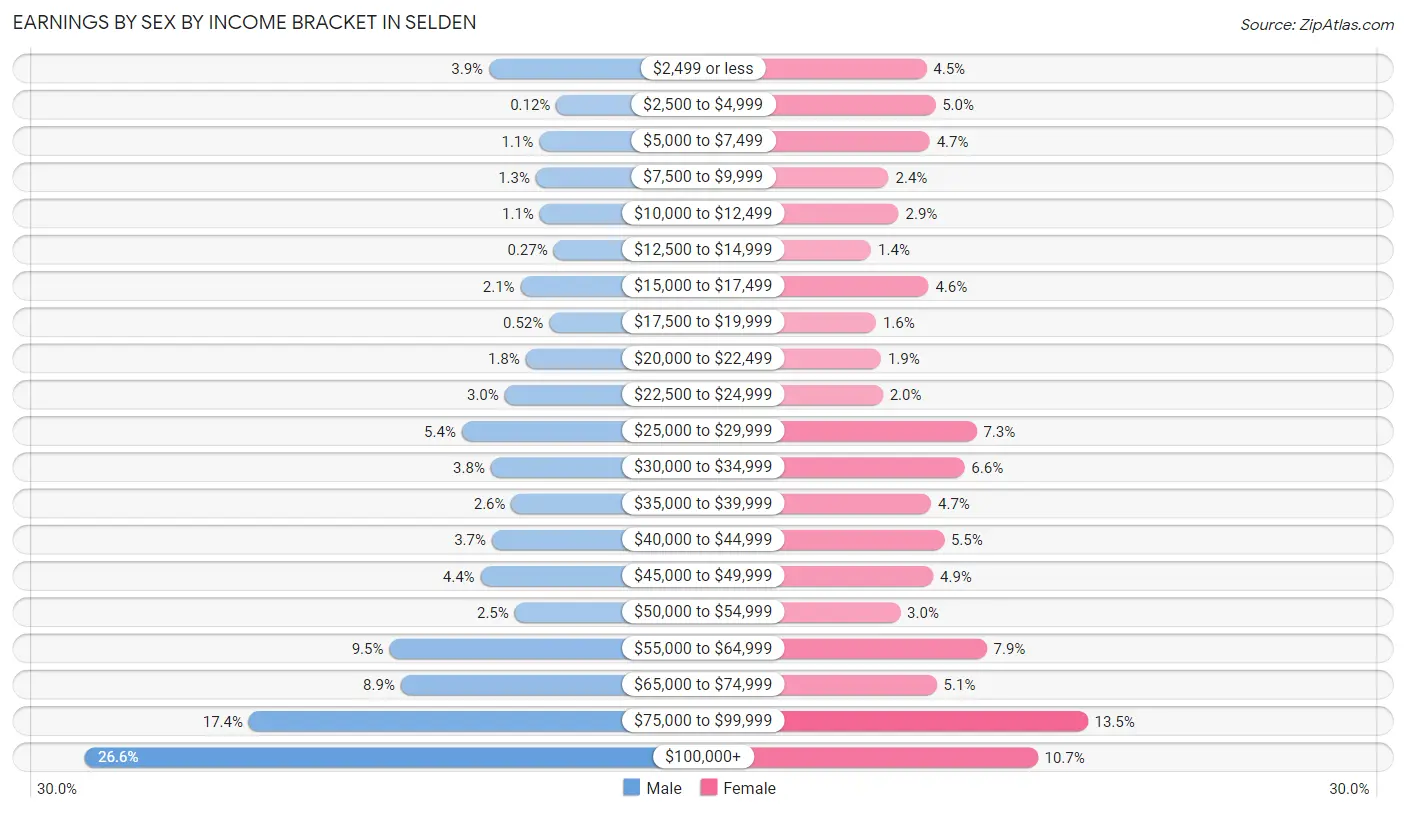
Earnings by Sex by Income Bracket in Selden
The most common earnings brackets in Selden are $100,000+ for men (1,549 | 26.6%) and $75,000 to $99,999 for women (790 | 13.5%).
| Income | Male | Female |
| $2,499 or less | 227 (3.9%) | 261 (4.5%) |
| $2,500 to $4,999 | 7 (0.1%) | 290 (5.0%) |
| $5,000 to $7,499 | 63 (1.1%) | 272 (4.7%) |
| $7,500 to $9,999 | 74 (1.3%) | 137 (2.4%) |
| $10,000 to $12,499 | 61 (1.1%) | 170 (2.9%) |
| $12,500 to $14,999 | 16 (0.3%) | 80 (1.4%) |
| $15,000 to $17,499 | 124 (2.1%) | 268 (4.6%) |
| $17,500 to $19,999 | 30 (0.5%) | 96 (1.6%) |
| $20,000 to $22,499 | 107 (1.8%) | 112 (1.9%) |
| $22,500 to $24,999 | 176 (3.0%) | 118 (2.0%) |
| $25,000 to $29,999 | 316 (5.4%) | 426 (7.3%) |
| $30,000 to $34,999 | 221 (3.8%) | 386 (6.6%) |
| $35,000 to $39,999 | 154 (2.6%) | 277 (4.7%) |
| $40,000 to $44,999 | 218 (3.7%) | 319 (5.5%) |
| $45,000 to $49,999 | 255 (4.4%) | 283 (4.9%) |
| $50,000 to $54,999 | 143 (2.5%) | 175 (3.0%) |
| $55,000 to $64,999 | 553 (9.5%) | 459 (7.9%) |
| $65,000 to $74,999 | 516 (8.9%) | 295 (5.1%) |
| $75,000 to $99,999 | 1,013 (17.4%) | 790 (13.5%) |
| $100,000+ | 1,549 (26.6%) | 626 (10.7%) |
| Total | 5,823 (100.0%) | 5,840 (100.0%) |
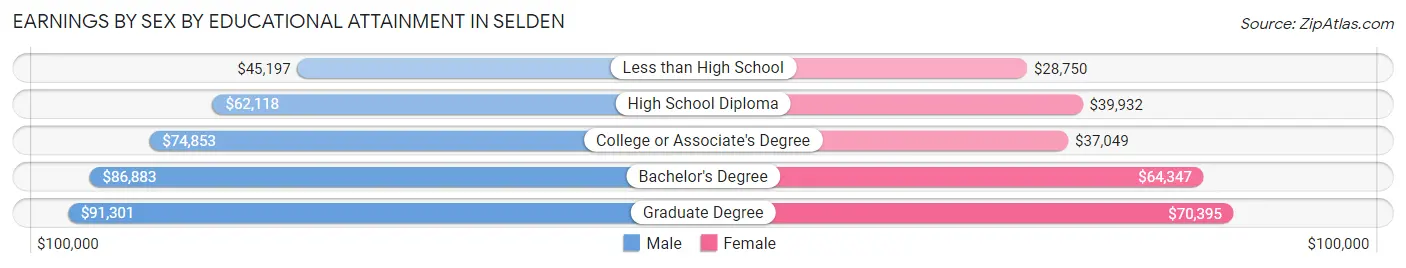
Earnings by Sex by Educational Attainment in Selden
Average earnings in Selden are $72,041 for men and $47,282 for women, a difference of 34.4%. Men with an educational attainment of graduate degree enjoy the highest average annual earnings of $91,301, while those with less than high school education earn the least with $45,197. Women with an educational attainment of graduate degree earn the most with the average annual earnings of $70,395, while those with less than high school education have the smallest earnings of $28,750.
| Educational Attainment | Male Income | Female Income |
| Less than High School | $45,197 | $28,750 |
| High School Diploma | $62,118 | $39,932 |
| College or Associate's Degree | $74,853 | $37,049 |
| Bachelor's Degree | $86,883 | $64,347 |
| Graduate Degree | $91,301 | $70,395 |
| Total | $72,041 | $47,282 |
Family Income in Selden
Family Income Brackets in Selden
According to the Selden family income data, there are 1,661 families falling into the $100,000 to $149,999 income range, which is the most common income bracket and makes up 29.8% of all families. Conversely, the $10,000 to $14,999 income bracket is the least frequent group with only 33 families (0.6%) belonging to this category.
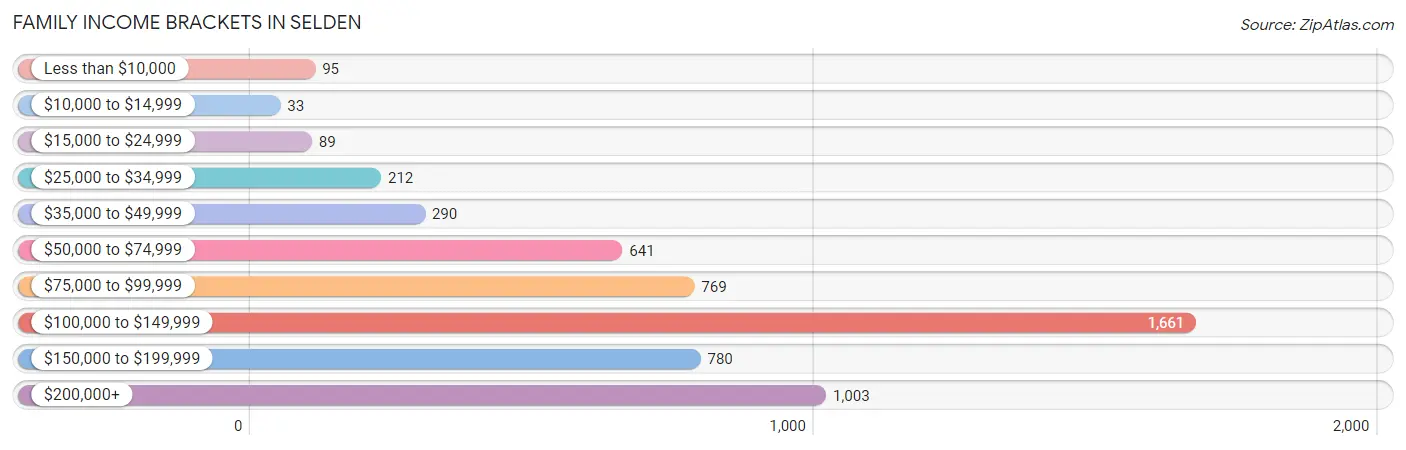
| Income Bracket | # Families | % Families |
| Less than $10,000 | 95 | 1.7% |
| $10,000 to $14,999 | 33 | 0.6% |
| $15,000 to $24,999 | 89 | 1.6% |
| $25,000 to $34,999 | 212 | 3.8% |
| $35,000 to $49,999 | 290 | 5.2% |
| $50,000 to $74,999 | 641 | 11.5% |
| $75,000 to $99,999 | 769 | 13.8% |
| $100,000 to $149,999 | 1,661 | 29.8% |
| $150,000 to $199,999 | 780 | 14.0% |
| $200,000+ | 1,003 | 18.0% |
Family Income by Famaliy Size in Selden
7+ person families (56 | 1.0%) account for the highest median family income in Selden with $194,625 per family, while 2-person families (1,811 | 32.5%) have the highest median income of $47,153 per family member.
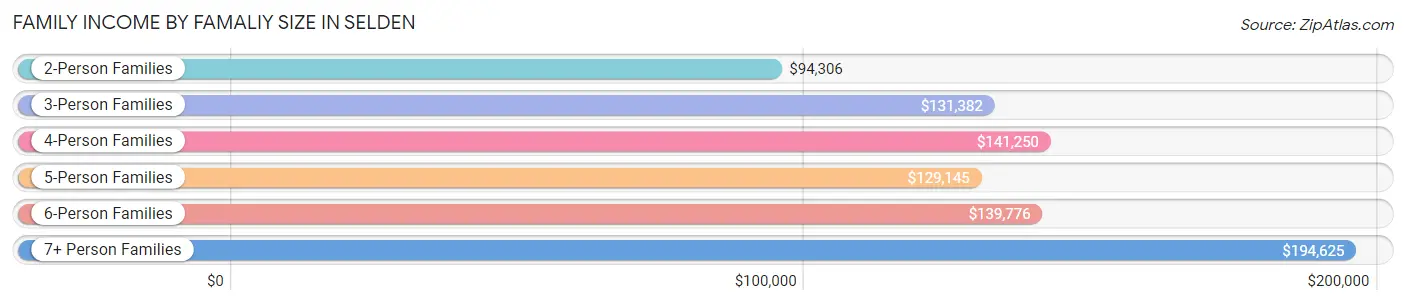
| Income Bracket | # Families | Median Income |
| 2-Person Families | 1,811 (32.5%) | $94,306 |
| 3-Person Families | 1,559 (28.0%) | $131,382 |
| 4-Person Families | 1,247 (22.4%) | $141,250 |
| 5-Person Families | 779 (14.0%) | $129,145 |
| 6-Person Families | 121 (2.2%) | $139,776 |
| 7+ Person Families | 56 (1.0%) | $194,625 |
| Total | 5,573 (100.0%) | $127,973 |
Family Income by Number of Earners in Selden
The median family income in Selden is $127,973, with families comprising 3+ earners (1,107) having the highest median family income of $172,188, while families with no earners (784) have the lowest median family income of $65,441, accounting for 19.9% and 14.1% of families, respectively.
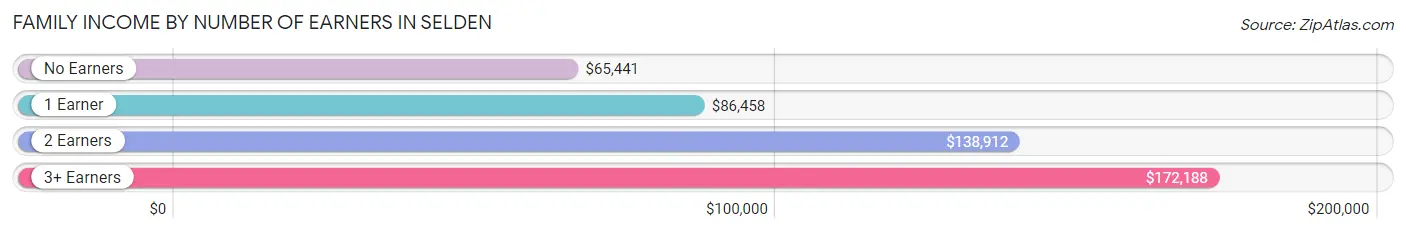
| Number of Earners | # Families | Median Income |
| No Earners | 784 (14.1%) | $65,441 |
| 1 Earner | 1,361 (24.4%) | $86,458 |
| 2 Earners | 2,321 (41.6%) | $138,912 |
| 3+ Earners | 1,107 (19.9%) | $172,188 |
| Total | 5,573 (100.0%) | $127,973 |
Household Income in Selden
Household Income Brackets in Selden
With 1,784 households falling in the category, the $100,000 to $149,999 income range is the most frequent in Selden, accounting for 25.9% of all households. In contrast, only 131 households (1.9%) fall into the $10,000 to $14,999 income bracket, making it the least populous group.
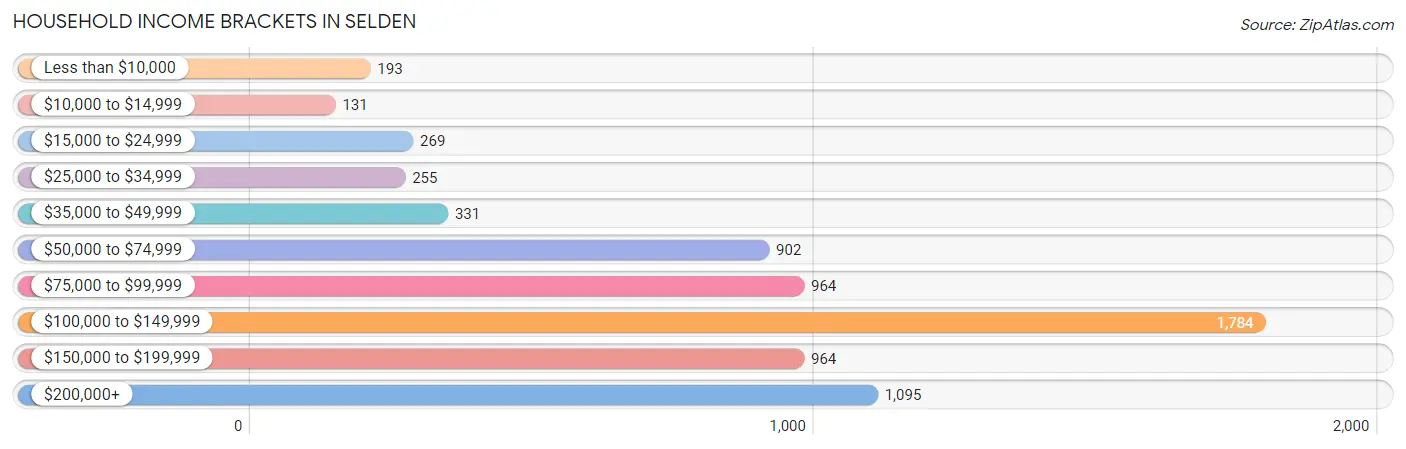
| Income Bracket | # Households | % Households |
| Less than $10,000 | 193 | 2.8% |
| $10,000 to $14,999 | 131 | 1.9% |
| $15,000 to $24,999 | 269 | 3.9% |
| $25,000 to $34,999 | 255 | 3.7% |
| $35,000 to $49,999 | 331 | 4.8% |
| $50,000 to $74,999 | 902 | 13.1% |
| $75,000 to $99,999 | 964 | 14.0% |
| $100,000 to $149,999 | 1,784 | 25.9% |
| $150,000 to $199,999 | 964 | 14.0% |
| $200,000+ | 1,095 | 15.9% |
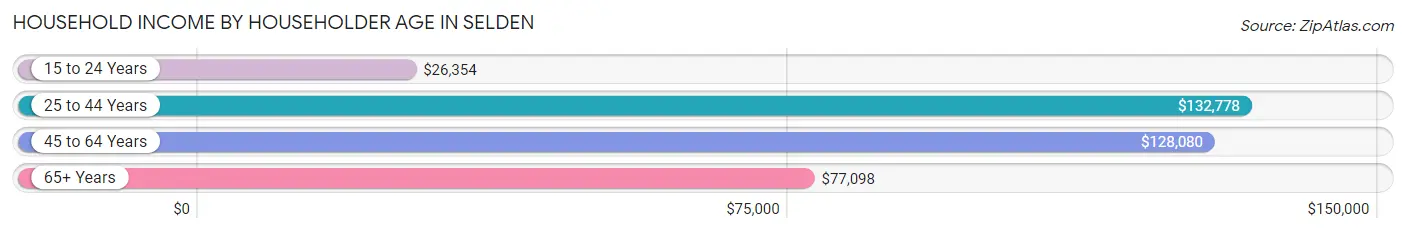
Household Income by Householder Age in Selden
The median household income in Selden is $115,406, with the highest median household income of $132,778 found in the 25 to 44 years age bracket for the primary householder. A total of 1,896 households (27.5%) fall into this category. Meanwhile, the 15 to 24 years age bracket for the primary householder has the lowest median household income of $26,354, with 136 households (2.0%) in this group.
| Income Bracket | # Households | Median Income |
| 15 to 24 Years | 136 (2.0%) | $26,354 |
| 25 to 44 Years | 1,896 (27.5%) | $132,778 |
| 45 to 64 Years | 3,051 (44.3%) | $128,080 |
| 65+ Years | 1,806 (26.2%) | $77,098 |
| Total | 6,889 (100.0%) | $115,406 |
Poverty in Selden
Income Below Poverty by Sex and Age in Selden
With 4.8% poverty level for males and 5.5% for females among the residents of Selden, 15 year old males and 12 to 14 year old females are the most vulnerable to poverty, with 28 males (34.2%) and 53 females (14.0%) in their respective age groups living below the poverty level.
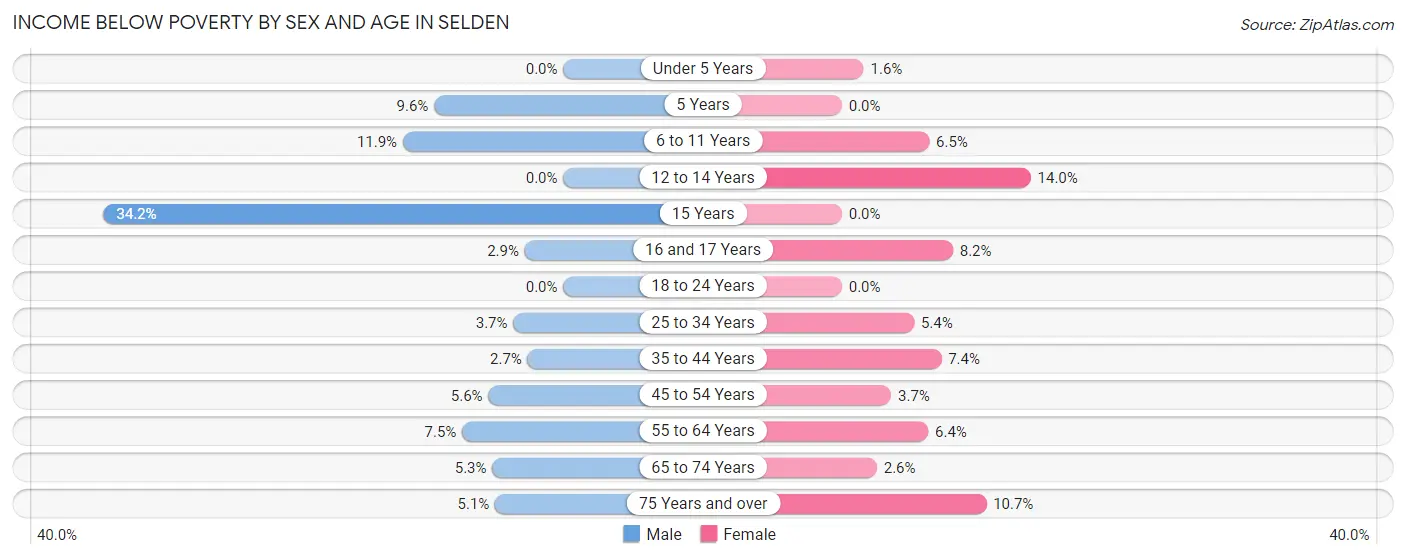
| Age Bracket | Male | Female |
| Under 5 Years | 0 (0.0%) | 9 (1.6%) |
| 5 Years | 7 (9.6%) | 0 (0.0%) |
| 6 to 11 Years | 99 (11.9%) | 44 (6.5%) |
| 12 to 14 Years | 0 (0.0%) | 53 (14.0%) |
| 15 Years | 28 (34.2%) | 0 (0.0%) |
| 16 and 17 Years | 13 (2.9%) | 31 (8.2%) |
| 18 to 24 Years | 0 (0.0%) | 0 (0.0%) |
| 25 to 34 Years | 60 (3.7%) | 76 (5.4%) |
| 35 to 44 Years | 33 (2.6%) | 105 (7.4%) |
| 45 to 54 Years | 92 (5.6%) | 51 (3.7%) |
| 55 to 64 Years | 115 (7.5%) | 87 (6.4%) |
| 65 to 74 Years | 49 (5.3%) | 25 (2.6%) |
| 75 Years and over | 21 (5.1%) | 115 (10.7%) |
| Total | 517 (4.8%) | 596 (5.5%) |
Income Above Poverty by Sex and Age in Selden
According to the poverty statistics in Selden, males aged under 5 years and females aged 5 years are the age groups that are most secure financially, with 100.0% of males and 100.0% of females in these age groups living above the poverty line.
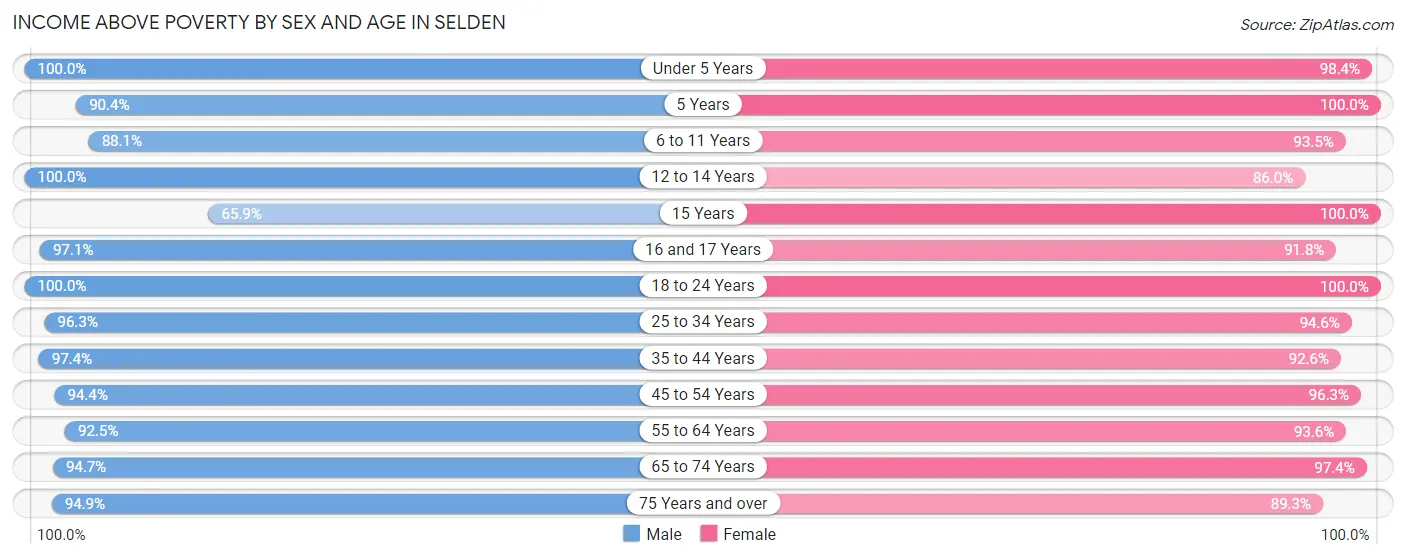
| Age Bracket | Male | Female |
| Under 5 Years | 663 (100.0%) | 548 (98.4%) |
| 5 Years | 66 (90.4%) | 116 (100.0%) |
| 6 to 11 Years | 732 (88.1%) | 635 (93.5%) |
| 12 to 14 Years | 375 (100.0%) | 325 (86.0%) |
| 15 Years | 54 (65.8%) | 20 (100.0%) |
| 16 and 17 Years | 441 (97.1%) | 345 (91.8%) |
| 18 to 24 Years | 918 (100.0%) | 1,155 (100.0%) |
| 25 to 34 Years | 1,558 (96.3%) | 1,343 (94.6%) |
| 35 to 44 Years | 1,214 (97.4%) | 1,318 (92.6%) |
| 45 to 54 Years | 1,564 (94.4%) | 1,341 (96.3%) |
| 55 to 64 Years | 1,416 (92.5%) | 1,270 (93.6%) |
| 65 to 74 Years | 881 (94.7%) | 935 (97.4%) |
| 75 Years and over | 394 (94.9%) | 958 (89.3%) |
| Total | 10,276 (95.2%) | 10,309 (94.5%) |
Income Below Poverty Among Married-Couple Families in Selden
The poverty statistics for married-couple families in Selden show that 2.0% or 84 of the total 4,145 families live below the poverty line. Families with 3 or 4 children have the highest poverty rate of 7.3%, comprising of 19 families. On the other hand, families with 5 or more children have the lowest poverty rate of 0.0%, which includes 0 families.
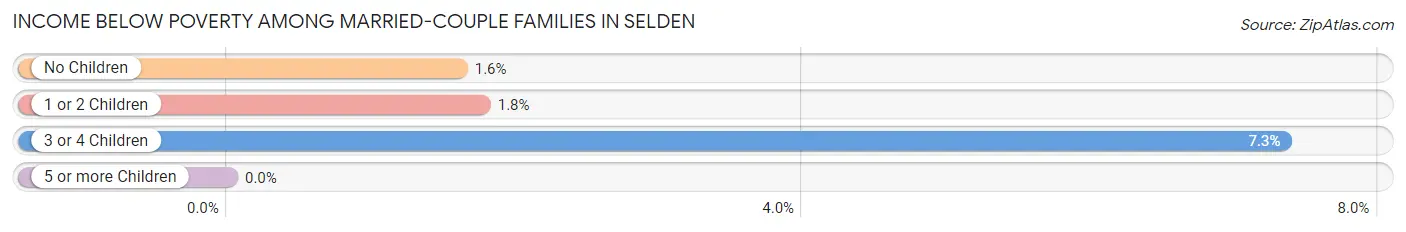
| Children | Above Poverty | Below Poverty |
| No Children | 2,033 (98.4%) | 33 (1.6%) |
| 1 or 2 Children | 1,783 (98.2%) | 32 (1.8%) |
| 3 or 4 Children | 240 (92.7%) | 19 (7.3%) |
| 5 or more Children | 5 (100.0%) | 0 (0.0%) |
| Total | 4,061 (98.0%) | 84 (2.0%) |
Income Below Poverty Among Single-Parent Households in Selden
According to the poverty data in Selden, 5.2% or 37 single-father households and 8.2% or 59 single-mother households are living below the poverty line. Among single-father households, those with 1 or 2 children have the highest poverty rate, with 37 households (29.4%) experiencing poverty. Likewise, among single-mother households, those with 1 or 2 children have the highest poverty rate, with 54 households (16.0%) falling below the poverty line.
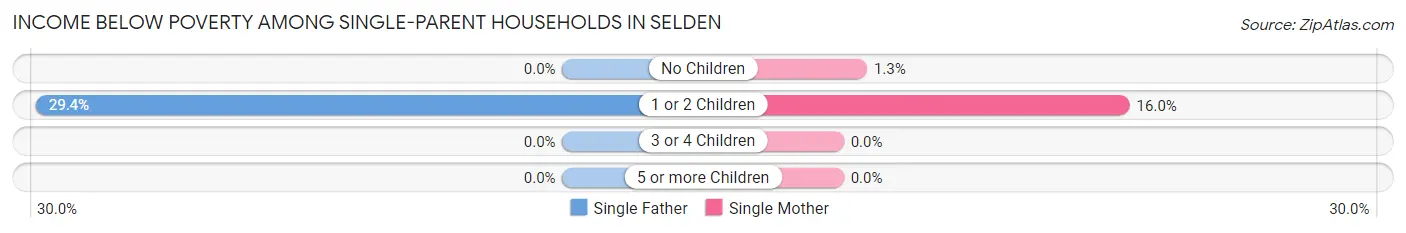
| Children | Single Father | Single Mother |
| No Children | 0 (0.0%) | 5 (1.3%) |
| 1 or 2 Children | 37 (29.4%) | 54 (16.0%) |
| 3 or 4 Children | 0 (0.0%) | 0 (0.0%) |
| 5 or more Children | 0 (0.0%) | 0 (0.0%) |
| Total | 37 (5.2%) | 59 (8.2%) |
Income Below Poverty Among Married-Couple vs Single-Parent Households in Selden
The poverty data for Selden shows that 84 of the married-couple family households (2.0%) and 96 of the single-parent households (6.7%) are living below the poverty level. Within the married-couple family households, those with 3 or 4 children have the highest poverty rate, with 19 households (7.3%) falling below the poverty line. Among the single-parent households, those with 1 or 2 children have the highest poverty rate, with 91 household (19.6%) living below poverty.
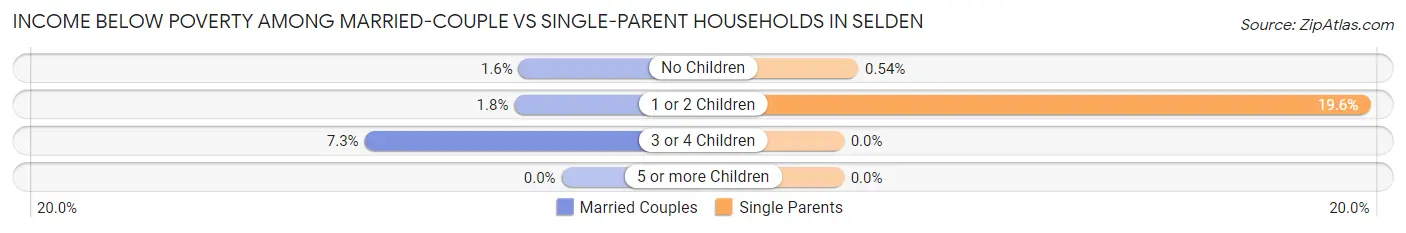
| Children | Married-Couple Families | Single-Parent Households |
| No Children | 33 (1.6%) | 5 (0.5%) |
| 1 or 2 Children | 32 (1.8%) | 91 (19.6%) |
| 3 or 4 Children | 19 (7.3%) | 0 (0.0%) |
| 5 or more Children | 0 (0.0%) | 0 (0.0%) |
| Total | 84 (2.0%) | 96 (6.7%) |
Race in Selden
The most populous races in Selden are White / Caucasian (15,515 | 71.3%), Hispanic or Latino (4,564 | 21.0%), and Two or more Races (2,823 | 13.0%).
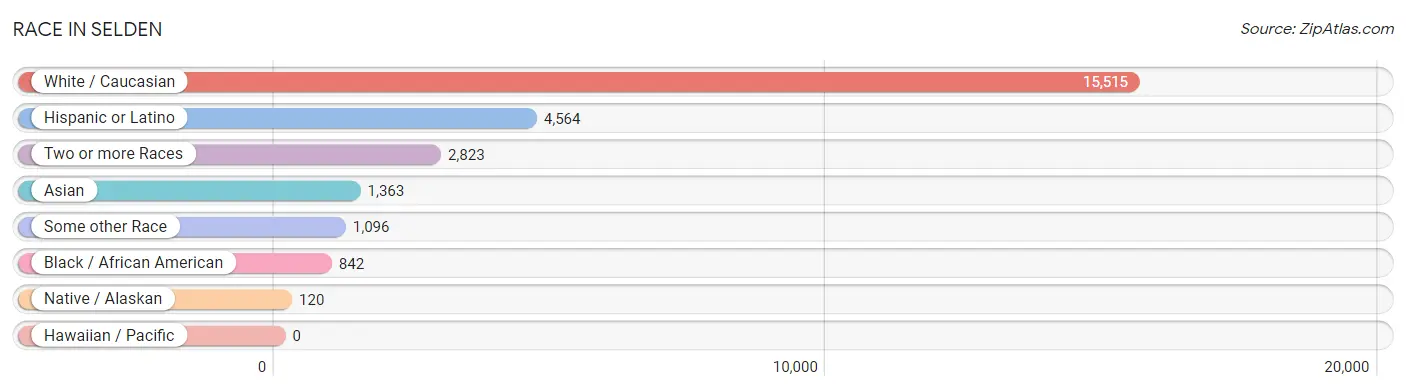
| Race | # Population | % Population |
| Asian | 1,363 | 6.3% |
| Black / African American | 842 | 3.9% |
| Hawaiian / Pacific | 0 | 0.0% |
| Hispanic or Latino | 4,564 | 21.0% |
| Native / Alaskan | 120 | 0.5% |
| White / Caucasian | 15,515 | 71.3% |
| Two or more Races | 2,823 | 13.0% |
| Some other Race | 1,096 | 5.0% |
| Total | 21,759 | 100.0% |
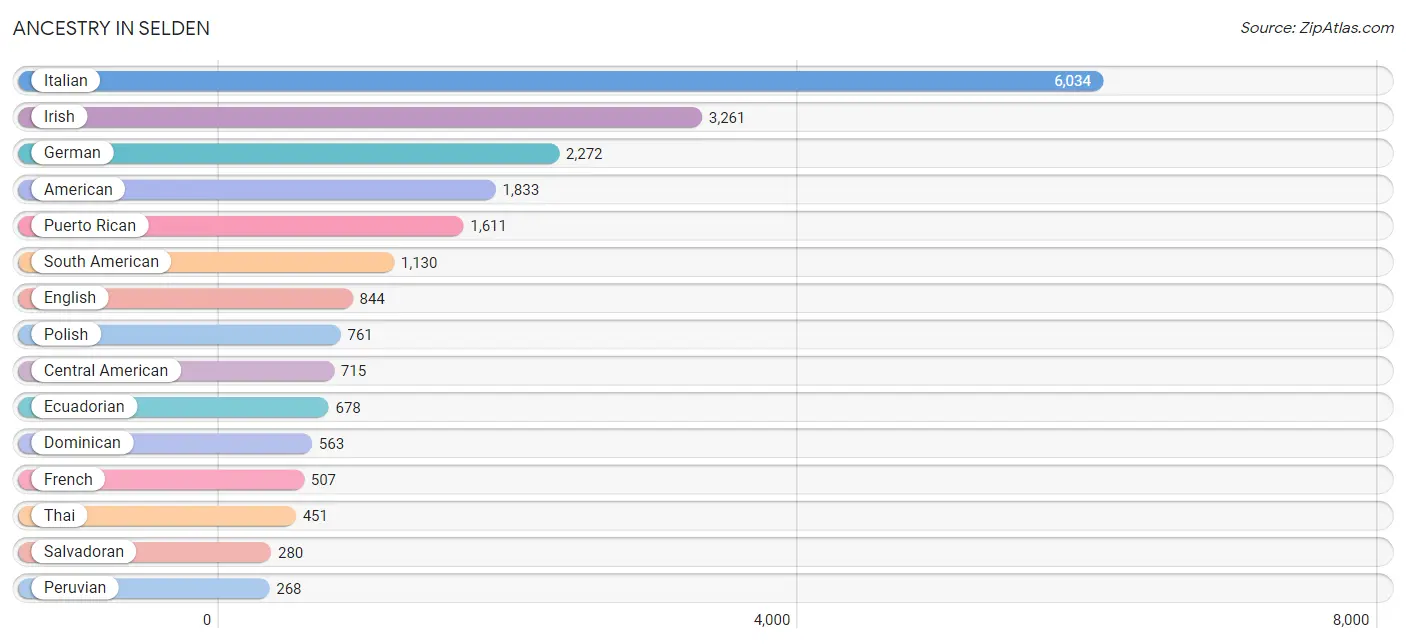
Ancestry in Selden
The most populous ancestries reported in Selden are Italian (6,034 | 27.7%), Irish (3,261 | 15.0%), German (2,272 | 10.4%), American (1,833 | 8.4%), and Puerto Rican (1,611 | 7.4%), together accounting for 69.0% of all Selden residents.
| Ancestry | # Population | % Population |
| Afghan | 51 | 0.2% |
| African | 13 | 0.1% |
| American | 1,833 | 8.4% |
| Arab | 16 | 0.1% |
| Armenian | 17 | 0.1% |
| Austrian | 64 | 0.3% |
| Basque | 10 | 0.1% |
| Belgian | 56 | 0.3% |
| Bhutanese | 63 | 0.3% |
| Brazilian | 144 | 0.7% |
| British | 10 | 0.1% |
| Burmese | 35 | 0.2% |
| Central American | 715 | 3.3% |
| Cherokee | 10 | 0.1% |
| Chilean | 34 | 0.2% |
| Colombian | 140 | 0.6% |
| Costa Rican | 183 | 0.8% |
| Croatian | 29 | 0.1% |
| Cuban | 41 | 0.2% |
| Cypriot | 7 | 0.0% |
| Czech | 51 | 0.2% |
| Danish | 32 | 0.2% |
| Dominican | 563 | 2.6% |
| Dutch | 47 | 0.2% |
| Eastern European | 61 | 0.3% |
| Ecuadorian | 678 | 3.1% |
| Egyptian | 16 | 0.1% |
| English | 844 | 3.9% |
| European | 58 | 0.3% |
| Finnish | 11 | 0.1% |
| French | 507 | 2.3% |
| French Canadian | 108 | 0.5% |
| German | 2,272 | 10.4% |
| Ghanaian | 26 | 0.1% |
| Greek | 131 | 0.6% |
| Guatemalan | 55 | 0.3% |
| Guyanese | 32 | 0.2% |
| Haitian | 73 | 0.3% |
| Honduran | 114 | 0.5% |
| Hungarian | 79 | 0.4% |
| Indian (Asian) | 165 | 0.8% |
| Indonesian | 63 | 0.3% |
| Irish | 3,261 | 15.0% |
| Iroquois | 9 | 0.0% |
| Israeli | 6 | 0.0% |
| Italian | 6,034 | 27.7% |
| Jamaican | 161 | 0.7% |
| Korean | 83 | 0.4% |
| Latvian | 6 | 0.0% |
| Lithuanian | 36 | 0.2% |
| Luxembourger | 10 | 0.1% |
| Mexican | 148 | 0.7% |
| Mongolian | 12 | 0.1% |
| Nicaraguan | 14 | 0.1% |
| Norwegian | 46 | 0.2% |
| Peruvian | 268 | 1.2% |
| Polish | 761 | 3.5% |
| Portuguese | 221 | 1.0% |
| Puerto Rican | 1,611 | 7.4% |
| Romanian | 7 | 0.0% |
| Russian | 161 | 0.7% |
| Salvadoran | 280 | 1.3% |
| Scotch-Irish | 19 | 0.1% |
| Scottish | 149 | 0.7% |
| Slovak | 7 | 0.0% |
| Slovene | 8 | 0.0% |
| South American | 1,130 | 5.2% |
| Spaniard | 66 | 0.3% |
| Spanish | 92 | 0.4% |
| Sri Lankan | 46 | 0.2% |
| Subsaharan African | 26 | 0.1% |
| Swedish | 87 | 0.4% |
| Swiss | 8 | 0.0% |
| Thai | 451 | 2.1% |
| Trinidadian and Tobagonian | 50 | 0.2% |
| Turkish | 39 | 0.2% |
| U.S. Virgin Islander | 6 | 0.0% |
| Ukrainian | 26 | 0.1% |
| Uruguayan | 10 | 0.1% |
| Vietnamese | 221 | 1.0% |
| West Indian | 64 | 0.3% | View All 81 Rows |
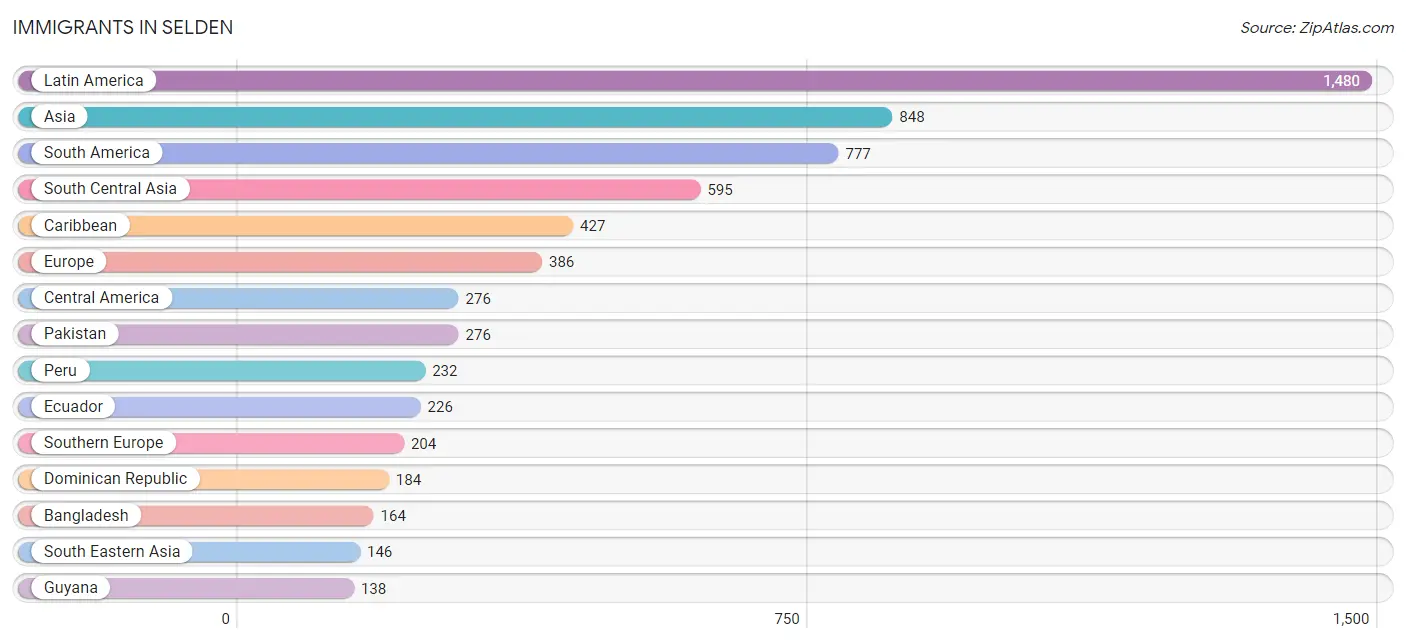
Immigrants in Selden
The most numerous immigrant groups reported in Selden came from Latin America (1,480 | 6.8%), Asia (848 | 3.9%), South America (777 | 3.6%), South Central Asia (595 | 2.7%), and Caribbean (427 | 2.0%), together accounting for 19.0% of all Selden residents.
| Immigration Origin | # Population | % Population |
| Afghanistan | 26 | 0.1% |
| Africa | 29 | 0.1% |
| Argentina | 18 | 0.1% |
| Asia | 848 | 3.9% |
| Bangladesh | 164 | 0.7% |
| Brazil | 70 | 0.3% |
| Canada | 15 | 0.1% |
| Caribbean | 427 | 2.0% |
| Central America | 276 | 1.3% |
| Chile | 17 | 0.1% |
| China | 40 | 0.2% |
| Colombia | 58 | 0.3% |
| Dominican Republic | 184 | 0.9% |
| Eastern Asia | 71 | 0.3% |
| Eastern Europe | 57 | 0.3% |
| Ecuador | 226 | 1.0% |
| Egypt | 16 | 0.1% |
| El Salvador | 115 | 0.5% |
| England | 43 | 0.2% |
| Europe | 386 | 1.8% |
| Germany | 31 | 0.1% |
| Ghana | 13 | 0.1% |
| Guatemala | 55 | 0.3% |
| Guyana | 138 | 0.6% |
| Haiti | 105 | 0.5% |
| Honduras | 58 | 0.3% |
| Hong Kong | 18 | 0.1% |
| India | 129 | 0.6% |
| Ireland | 18 | 0.1% |
| Italy | 109 | 0.5% |
| Jamaica | 99 | 0.4% |
| Korea | 31 | 0.1% |
| Latin America | 1,480 | 6.8% |
| Malaysia | 12 | 0.1% |
| Nicaragua | 14 | 0.1% |
| Northern Africa | 16 | 0.1% |
| Northern Europe | 94 | 0.4% |
| Pakistan | 276 | 1.3% |
| Peru | 232 | 1.1% |
| Philippines | 91 | 0.4% |
| Poland | 34 | 0.2% |
| Portugal | 95 | 0.4% |
| Russia | 23 | 0.1% |
| Scotland | 7 | 0.0% |
| South America | 777 | 3.6% |
| South Central Asia | 595 | 2.7% |
| South Eastern Asia | 146 | 0.7% |
| Southern Europe | 204 | 0.9% |
| Trinidad and Tobago | 39 | 0.2% |
| Turkey | 29 | 0.1% |
| Uruguay | 18 | 0.1% |
| Vietnam | 14 | 0.1% |
| Western Africa | 13 | 0.1% |
| Western Asia | 36 | 0.2% |
| Western Europe | 31 | 0.1% | View All 55 Rows |
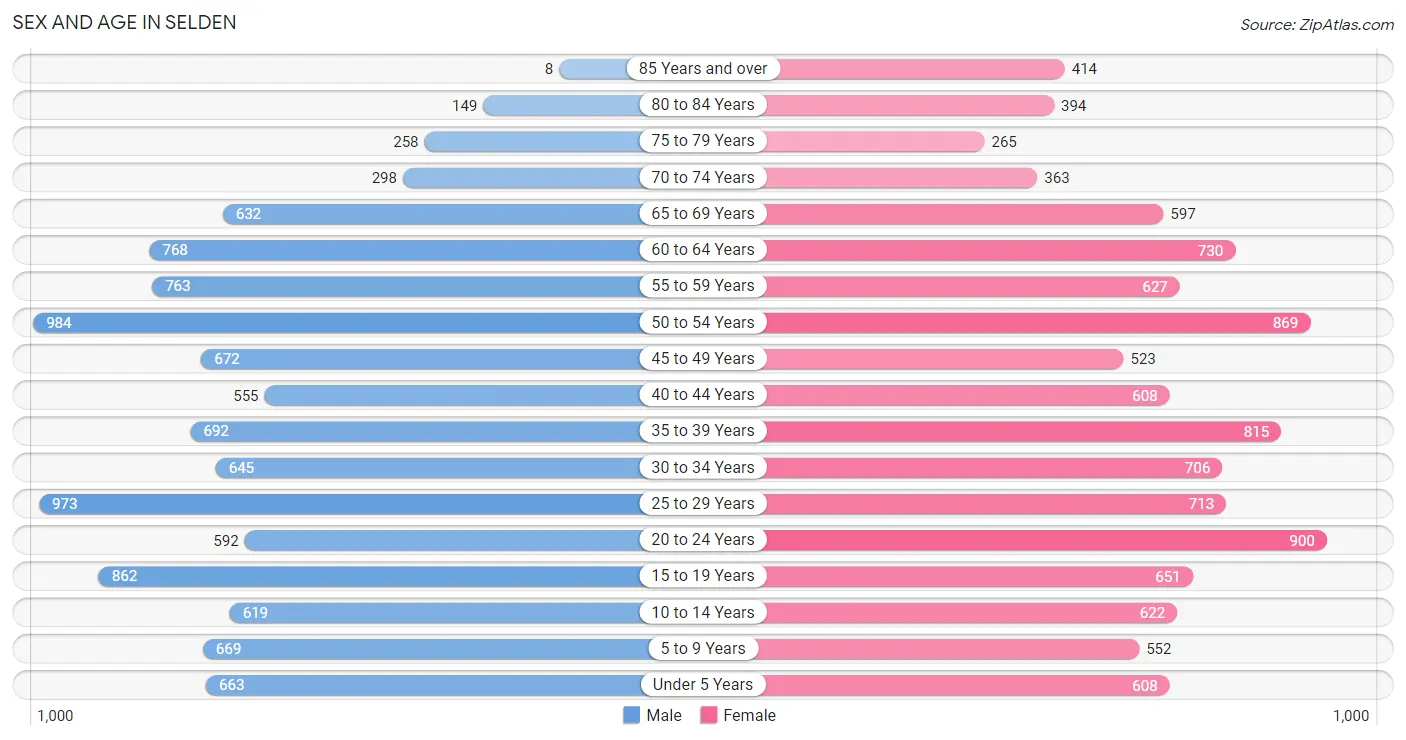
Sex and Age in Selden
Sex and Age in Selden
The most populous age groups in Selden are 50 to 54 Years (984 | 9.1%) for men and 20 to 24 Years (900 | 8.2%) for women.
| Age Bracket | Male | Female |
| Under 5 Years | 663 (6.1%) | 608 (5.6%) |
| 5 to 9 Years | 669 (6.2%) | 552 (5.0%) |
| 10 to 14 Years | 619 (5.7%) | 622 (5.7%) |
| 15 to 19 Years | 862 (8.0%) | 651 (5.9%) |
| 20 to 24 Years | 592 (5.5%) | 900 (8.2%) |
| 25 to 29 Years | 973 (9.0%) | 713 (6.5%) |
| 30 to 34 Years | 645 (6.0%) | 706 (6.4%) |
| 35 to 39 Years | 692 (6.4%) | 815 (7.4%) |
| 40 to 44 Years | 555 (5.1%) | 608 (5.6%) |
| 45 to 49 Years | 672 (6.2%) | 523 (4.8%) |
| 50 to 54 Years | 984 (9.1%) | 869 (7.9%) |
| 55 to 59 Years | 763 (7.1%) | 627 (5.7%) |
| 60 to 64 Years | 768 (7.1%) | 730 (6.7%) |
| 65 to 69 Years | 632 (5.9%) | 597 (5.4%) |
| 70 to 74 Years | 298 (2.8%) | 363 (3.3%) |
| 75 to 79 Years | 258 (2.4%) | 265 (2.4%) |
| 80 to 84 Years | 149 (1.4%) | 394 (3.6%) |
| 85 Years and over | 8 (0.1%) | 414 (3.8%) |
| Total | 10,802 (100.0%) | 10,957 (100.0%) |
Families and Households in Selden
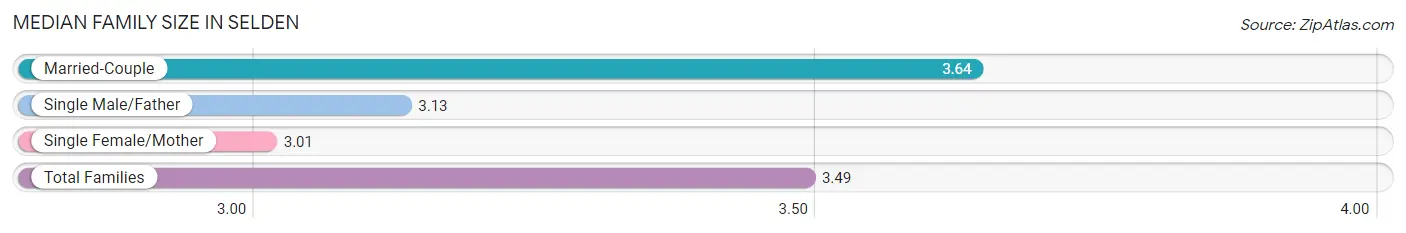
Median Family Size in Selden
The median family size in Selden is 3.49 persons per family, with married-couple families (4,145 | 74.4%) accounting for the largest median family size of 3.64 persons per family. On the other hand, single female/mother families (723 | 13.0%) represent the smallest median family size with 3.01 persons per family.
| Family Type | # Families | Family Size |
| Married-Couple | 4,145 (74.4%) | 3.64 |
| Single Male/Father | 705 (12.7%) | 3.13 |
| Single Female/Mother | 723 (13.0%) | 3.01 |
| Total Families | 5,573 (100.0%) | 3.49 |
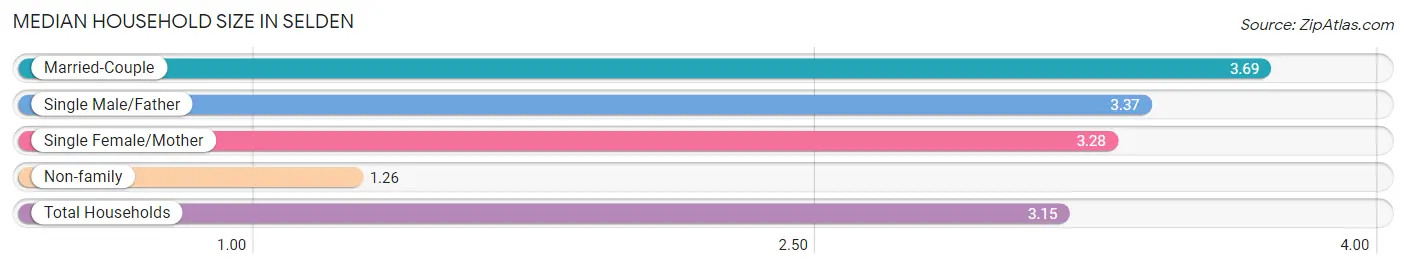
Median Household Size in Selden
The median household size in Selden is 3.15 persons per household, with married-couple households (4,145 | 60.2%) accounting for the largest median household size of 3.69 persons per household. non-family households (1,316 | 19.1%) represent the smallest median household size with 1.26 persons per household.
| Household Type | # Households | Household Size |
| Married-Couple | 4,145 (60.2%) | 3.69 |
| Single Male/Father | 705 (10.2%) | 3.37 |
| Single Female/Mother | 723 (10.5%) | 3.28 |
| Non-family | 1,316 (19.1%) | 1.26 |
| Total Households | 6,889 (100.0%) | 3.15 |
Household Size by Marriage Status in Selden
Out of a total of 6,889 households in Selden, 5,573 (80.9%) are family households, while 1,316 (19.1%) are nonfamily households. The most numerous type of family households are 2-person households, comprising 1,666, and the most common type of nonfamily households are 1-person households, comprising 1,037.
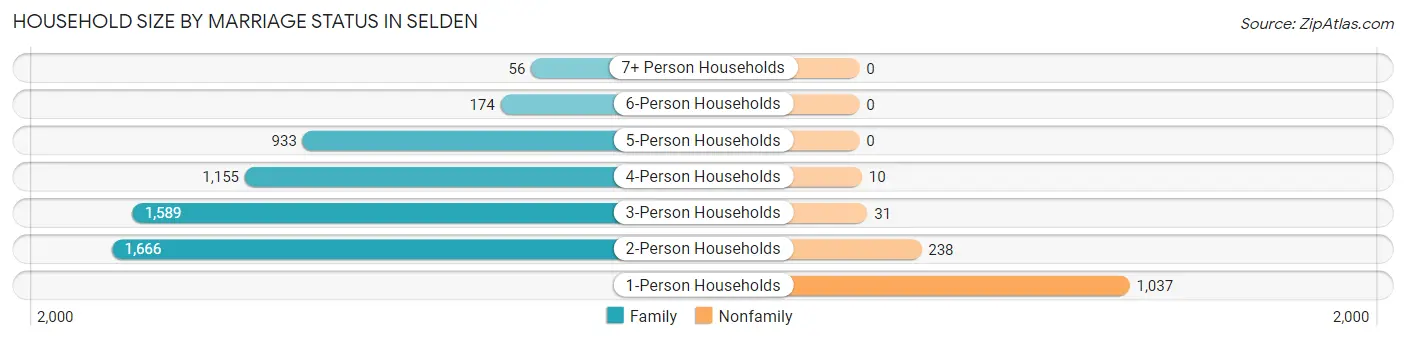
| Household Size | Family Households | Nonfamily Households |
| 1-Person Households | - | 1,037 (15.0%) |
| 2-Person Households | 1,666 (24.2%) | 238 (3.5%) |
| 3-Person Households | 1,589 (23.1%) | 31 (0.4%) |
| 4-Person Households | 1,155 (16.8%) | 10 (0.2%) |
| 5-Person Households | 933 (13.5%) | 0 (0.0%) |
| 6-Person Households | 174 (2.5%) | 0 (0.0%) |
| 7+ Person Households | 56 (0.8%) | 0 (0.0%) |
| Total | 5,573 (80.9%) | 1,316 (19.1%) |
Female Fertility in Selden
Fertility by Age in Selden
Average fertility rate in Selden is 29.0 births per 1,000 women. Women in the age bracket of 20 to 34 years have the highest fertility rate with 41.0 births per 1,000 women. Women in the age bracket of 20 to 34 years acount for 63.8% of all women with births.
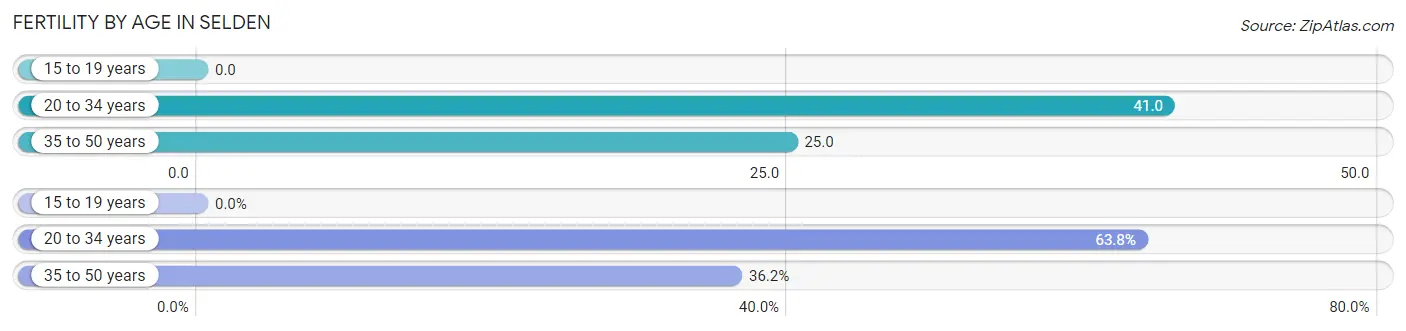
| Age Bracket | Women with Births | Births / 1,000 Women |
| 15 to 19 years | 0 (0.0%) | 0.0 |
| 20 to 34 years | 95 (63.8%) | 41.0 |
| 35 to 50 years | 54 (36.2%) | 25.0 |
| Total | 149 (100.0%) | 29.0 |
Fertility by Age by Marriage Status in Selden
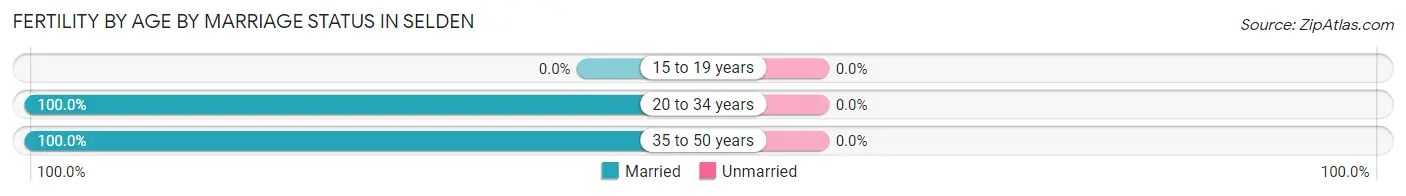
| Age Bracket | Married | Unmarried |
| 15 to 19 years | 0 (0.0%) | 0 (0.0%) |
| 20 to 34 years | 95 (100.0%) | 0 (0.0%) |
| 35 to 50 years | 54 (100.0%) | 0 (0.0%) |
| Total | 149 (100.0%) | 0 (0.0%) |
Fertility by Education in Selden
Average fertility rate in Selden is 29.0 births per 1,000 women. Women with the education attainment of bachelor's degree have the highest fertility rate of 52.0 births per 1,000 women, while women with the education attainment of high school diploma have the lowest fertility at 19.0 births per 1,000 women. Women with the education attainment of bachelor's degree represent 42.3% of all women with births.
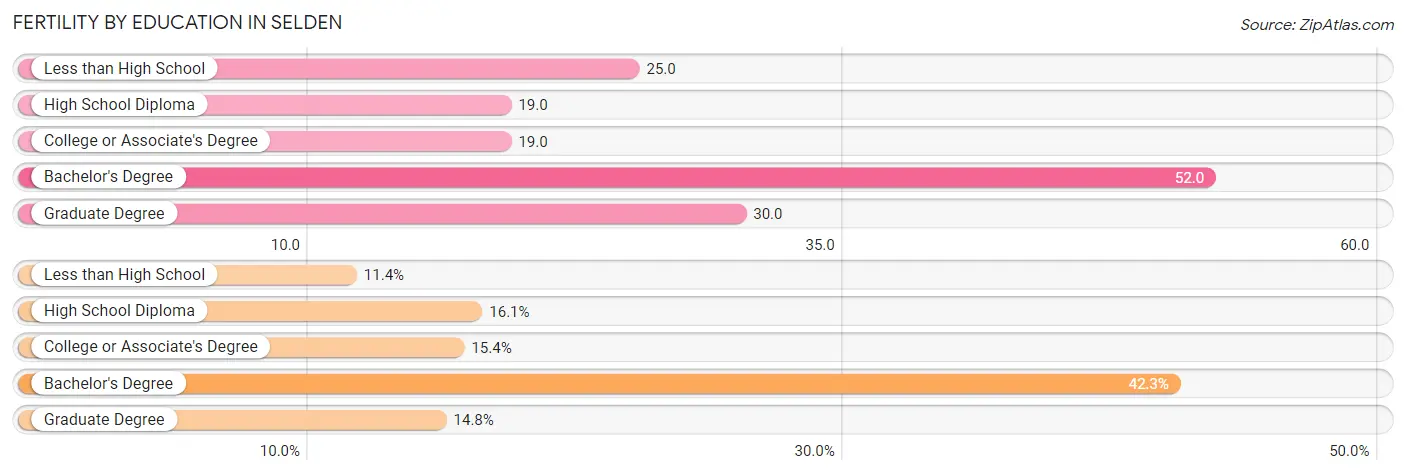
| Educational Attainment | Women with Births | Births / 1,000 Women |
| Less than High School | 17 (11.4%) | 25.0 |
| High School Diploma | 24 (16.1%) | 19.0 |
| College or Associate's Degree | 23 (15.4%) | 19.0 |
| Bachelor's Degree | 63 (42.3%) | 52.0 |
| Graduate Degree | 22 (14.8%) | 30.0 |
| Total | 149 (100.0%) | 29.0 |
Fertility by Education by Marriage Status in Selden
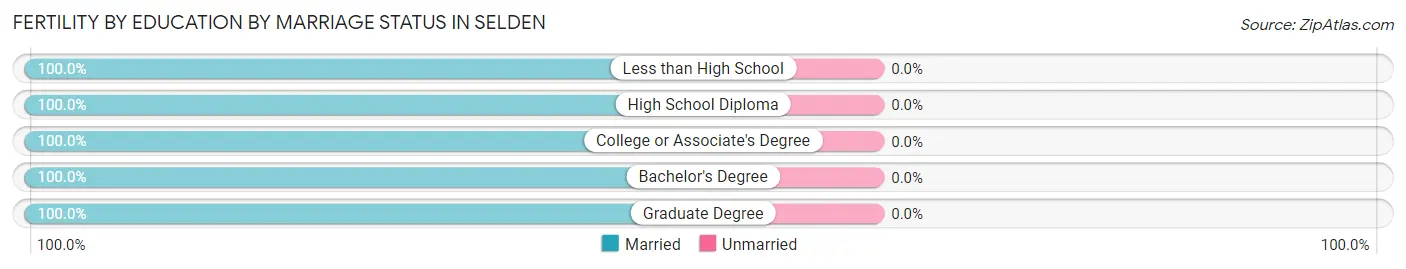
| Educational Attainment | Married | Unmarried |
| Less than High School | 17 (100.0%) | 0 (0.0%) |
| High School Diploma | 24 (100.0%) | 0 (0.0%) |
| College or Associate's Degree | 23 (100.0%) | 0 (0.0%) |
| Bachelor's Degree | 63 (100.0%) | 0 (0.0%) |
| Graduate Degree | 22 (100.0%) | 0 (0.0%) |
| Total | 149 (100.0%) | 0 (0.0%) |
Employment Characteristics in Selden
Employment by Class of Employer in Selden
Among the 10,643 employed individuals in Selden, private company employees (6,947 | 65.3%), local government employees (1,082 | 10.2%), and state government employees (903 | 8.5%) make up the most common classes of employment.
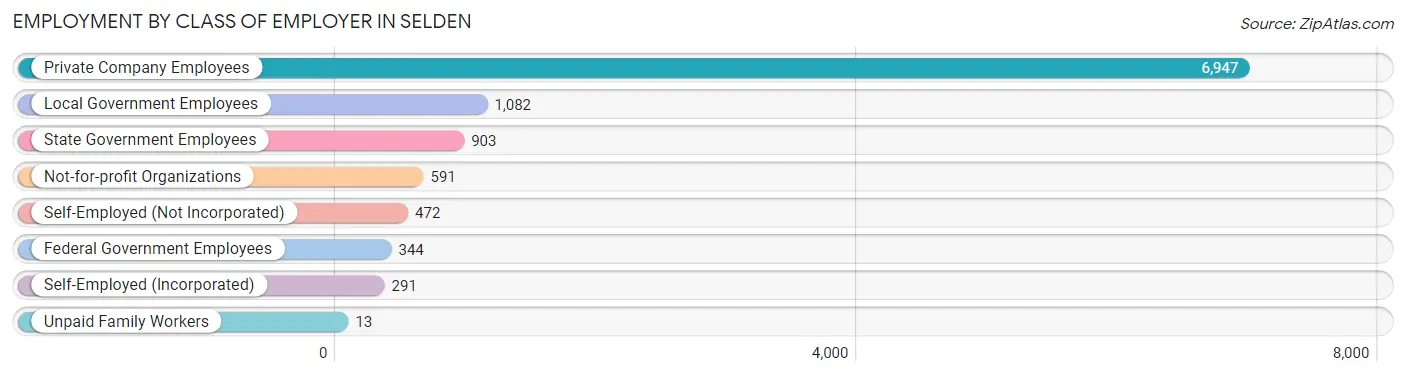
| Employer Class | # Employees | % Employees |
| Private Company Employees | 6,947 | 65.3% |
| Self-Employed (Incorporated) | 291 | 2.7% |
| Self-Employed (Not Incorporated) | 472 | 4.4% |
| Not-for-profit Organizations | 591 | 5.6% |
| Local Government Employees | 1,082 | 10.2% |
| State Government Employees | 903 | 8.5% |
| Federal Government Employees | 344 | 3.2% |
| Unpaid Family Workers | 13 | 0.1% |
| Total | 10,643 | 100.0% |
Employment Status by Age in Selden
According to the labor force statistics for Selden, out of the total population over 16 years of age (17,924), 63.6% or 11,400 individuals are in the labor force, with 5.0% or 570 of them unemployed. The age group with the highest labor force participation rate is 30 to 34 years, with 89.6% or 1,210 individuals in the labor force. Within the labor force, the 30 to 34 years age range has the highest percentage of unemployed individuals, with 12.6% or 152 of them being unemployed.
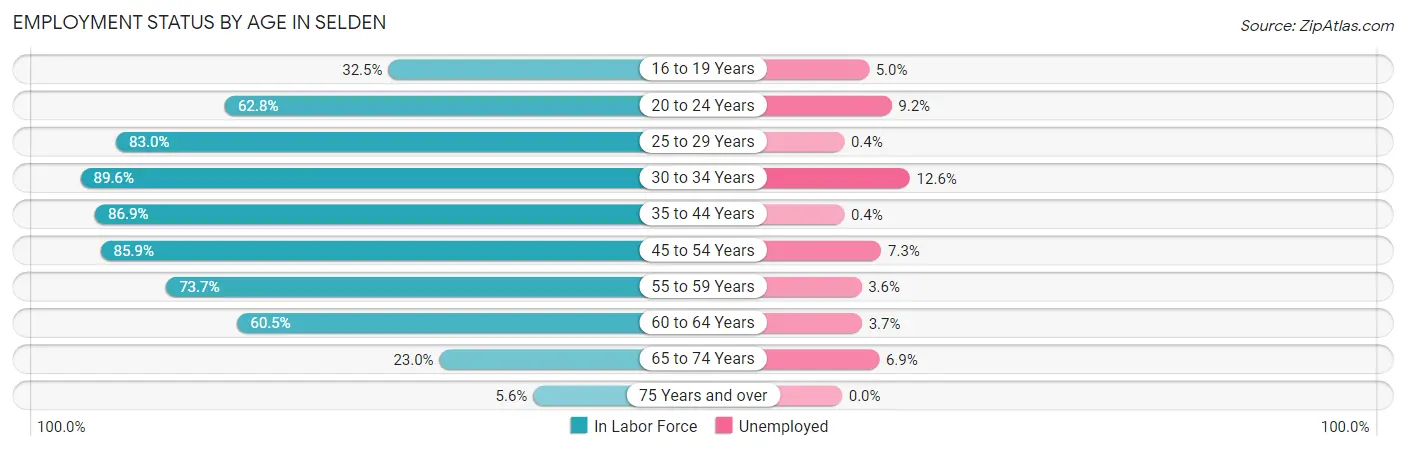
| Age Bracket | In Labor Force | Unemployed |
| 16 to 19 Years | 459 (32.5%) | 23 (5.0%) |
| 20 to 24 Years | 937 (62.8%) | 86 (9.2%) |
| 25 to 29 Years | 1,399 (83.0%) | 6 (0.4%) |
| 30 to 34 Years | 1,210 (89.6%) | 152 (12.6%) |
| 35 to 44 Years | 2,320 (86.9%) | 9 (0.4%) |
| 45 to 54 Years | 2,618 (85.9%) | 191 (7.3%) |
| 55 to 59 Years | 1,024 (73.7%) | 37 (3.6%) |
| 60 to 64 Years | 906 (60.5%) | 34 (3.7%) |
| 65 to 74 Years | 435 (23.0%) | 30 (6.9%) |
| 75 Years and over | 83 (5.6%) | 0 (0.0%) |
| Total | 11,400 (63.6%) | 570 (5.0%) |
Employment Status by Educational Attainment in Selden
According to labor force statistics for Selden, 81.4% of individuals (9,477) out of the total population between 25 and 64 years of age (11,643) are in the labor force, with 4.6% or 436 of them being unemployed. The group with the highest labor force participation rate are those with the educational attainment of bachelor's degree or higher, with 85.7% or 3,143 individuals in the labor force. Within the labor force, individuals with high school diploma education have the highest percentage of unemployment, with 6.7% or 185 of them being unemployed.
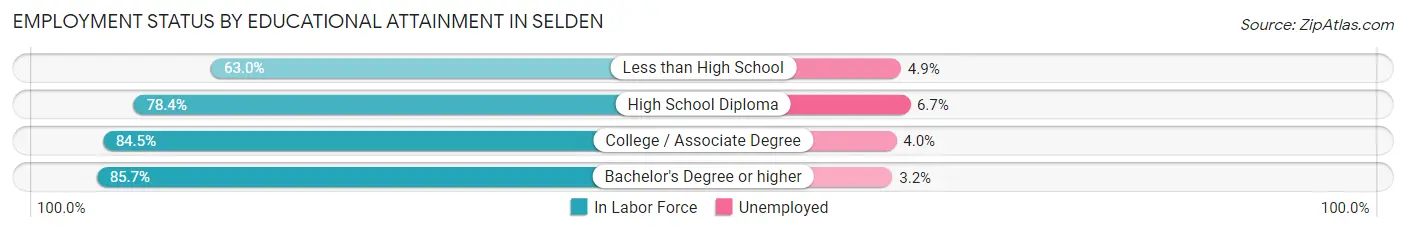
| Educational Attainment | In Labor Force | Unemployed |
| Less than High School | 549 (63.0%) | 43 (4.9%) |
| High School Diploma | 2,764 (78.4%) | 236 (6.7%) |
| College / Associate Degree | 3,023 (84.5%) | 143 (4.0%) |
| Bachelor's Degree or higher | 3,143 (85.7%) | 117 (3.2%) |
| Total | 9,477 (81.4%) | 536 (4.6%) |
Employment Occupations by Sex in Selden
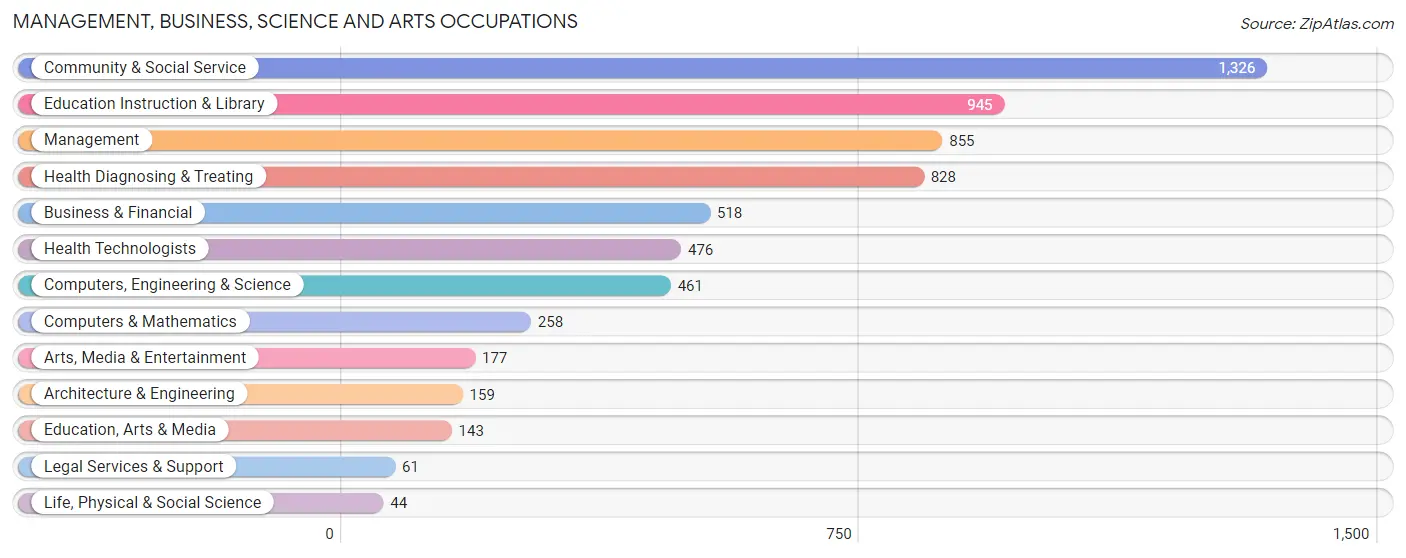
Management, Business, Science and Arts Occupations
The most common Management, Business, Science and Arts occupations in Selden are Community & Social Service (1,326 | 12.3%), Education Instruction & Library (945 | 8.8%), Management (855 | 7.9%), Health Diagnosing & Treating (828 | 7.7%), and Business & Financial (518 | 4.8%).
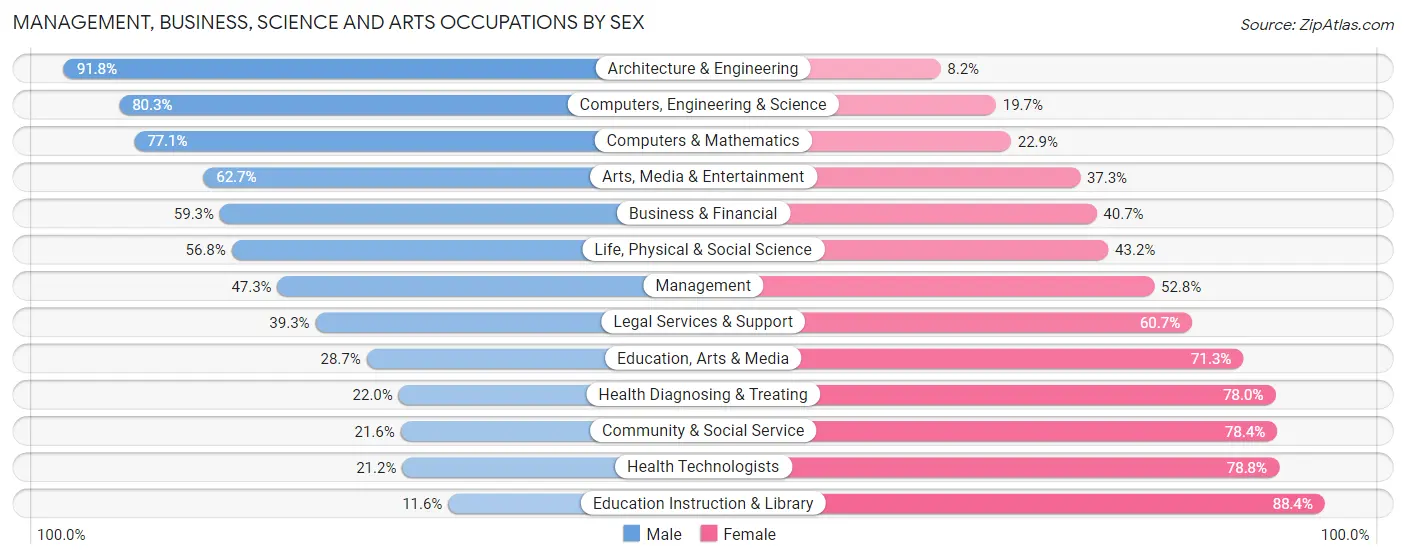
Management, Business, Science and Arts Occupations by Sex
Within the Management, Business, Science and Arts occupations in Selden, the most male-oriented occupations are Architecture & Engineering (91.8%), Computers, Engineering & Science (80.3%), and Computers & Mathematics (77.1%), while the most female-oriented occupations are Education Instruction & Library (88.4%), Health Technologists (78.8%), and Community & Social Service (78.4%).
| Occupation | Male | Female |
| Management | 404 (47.2%) | 451 (52.7%) |
| Business & Financial | 307 (59.3%) | 211 (40.7%) |
| Computers, Engineering & Science | 370 (80.3%) | 91 (19.7%) |
| Computers & Mathematics | 199 (77.1%) | 59 (22.9%) |
| Architecture & Engineering | 146 (91.8%) | 13 (8.2%) |
| Life, Physical & Social Science | 25 (56.8%) | 19 (43.2%) |
| Community & Social Service | 286 (21.6%) | 1,040 (78.4%) |
| Education, Arts & Media | 41 (28.7%) | 102 (71.3%) |
| Legal Services & Support | 24 (39.3%) | 37 (60.7%) |
| Education Instruction & Library | 110 (11.6%) | 835 (88.4%) |
| Arts, Media & Entertainment | 111 (62.7%) | 66 (37.3%) |
| Health Diagnosing & Treating | 182 (22.0%) | 646 (78.0%) |
| Health Technologists | 101 (21.2%) | 375 (78.8%) |
| Total (Category) | 1,549 (38.8%) | 2,439 (61.2%) |
| Total (Overall) | 5,458 (50.7%) | 5,310 (49.3%) |
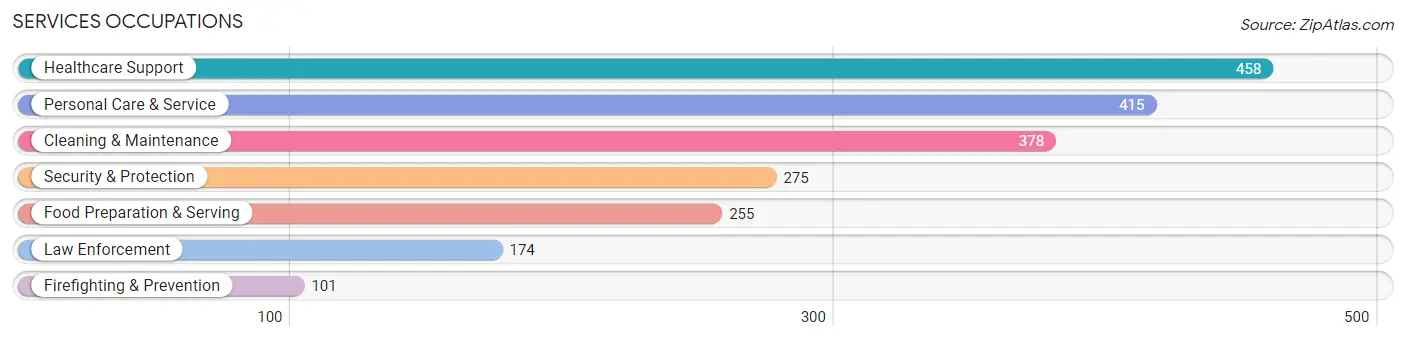
Services Occupations
The most common Services occupations in Selden are Healthcare Support (458 | 4.3%), Personal Care & Service (415 | 3.8%), Cleaning & Maintenance (378 | 3.5%), Security & Protection (275 | 2.5%), and Food Preparation & Serving (255 | 2.4%).
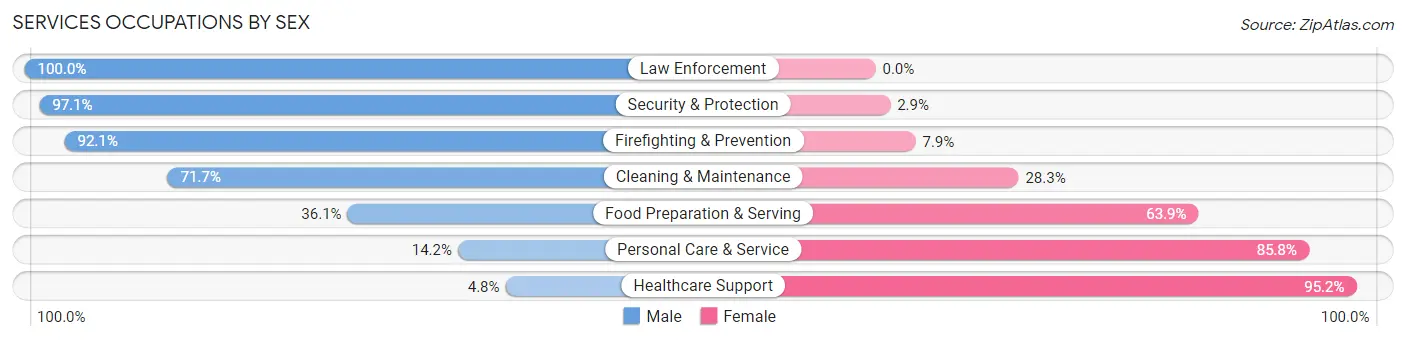
Services Occupations by Sex
Within the Services occupations in Selden, the most male-oriented occupations are Law Enforcement (100.0%), Security & Protection (97.1%), and Firefighting & Prevention (92.1%), while the most female-oriented occupations are Healthcare Support (95.2%), Personal Care & Service (85.8%), and Food Preparation & Serving (63.9%).
| Occupation | Male | Female |
| Healthcare Support | 22 (4.8%) | 436 (95.2%) |
| Security & Protection | 267 (97.1%) | 8 (2.9%) |
| Firefighting & Prevention | 93 (92.1%) | 8 (7.9%) |
| Law Enforcement | 174 (100.0%) | 0 (0.0%) |
| Food Preparation & Serving | 92 (36.1%) | 163 (63.9%) |
| Cleaning & Maintenance | 271 (71.7%) | 107 (28.3%) |
| Personal Care & Service | 59 (14.2%) | 356 (85.8%) |
| Total (Category) | 711 (39.9%) | 1,070 (60.1%) |
| Total (Overall) | 5,458 (50.7%) | 5,310 (49.3%) |
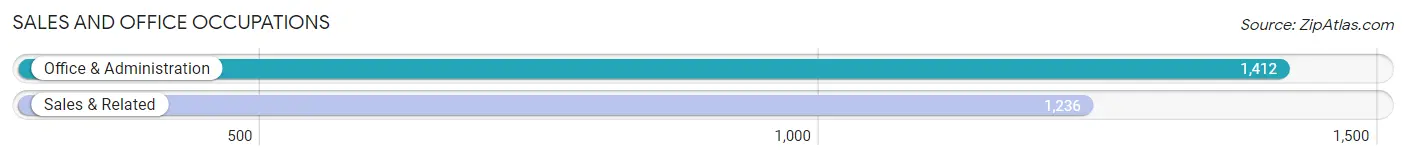
Sales and Office Occupations
The most common Sales and Office occupations in Selden are Office & Administration (1,412 | 13.1%), and Sales & Related (1,236 | 11.5%).
Sales and Office Occupations by Sex
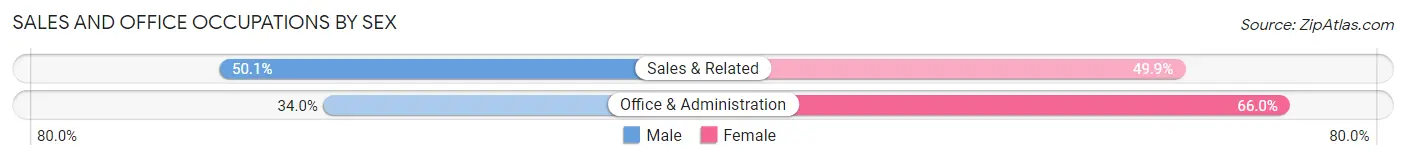
| Occupation | Male | Female |
| Sales & Related | 619 (50.1%) | 617 (49.9%) |
| Office & Administration | 480 (34.0%) | 932 (66.0%) |
| Total (Category) | 1,099 (41.5%) | 1,549 (58.5%) |
| Total (Overall) | 5,458 (50.7%) | 5,310 (49.3%) |
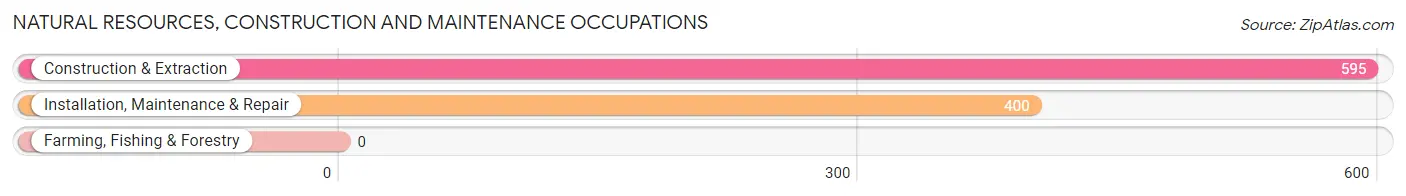
Natural Resources, Construction and Maintenance Occupations
The most common Natural Resources, Construction and Maintenance occupations in Selden are Construction & Extraction (595 | 5.5%), and Installation, Maintenance & Repair (400 | 3.7%).
Natural Resources, Construction and Maintenance Occupations by Sex
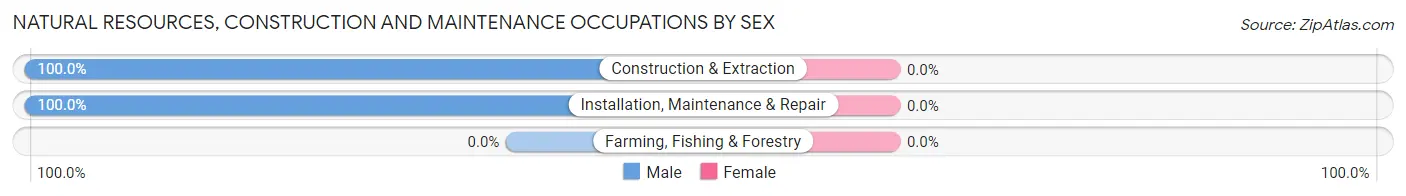
| Occupation | Male | Female |
| Farming, Fishing & Forestry | 0 (0.0%) | 0 (0.0%) |
| Construction & Extraction | 595 (100.0%) | 0 (0.0%) |
| Installation, Maintenance & Repair | 400 (100.0%) | 0 (0.0%) |
| Total (Category) | 995 (100.0%) | 0 (0.0%) |
| Total (Overall) | 5,458 (50.7%) | 5,310 (49.3%) |
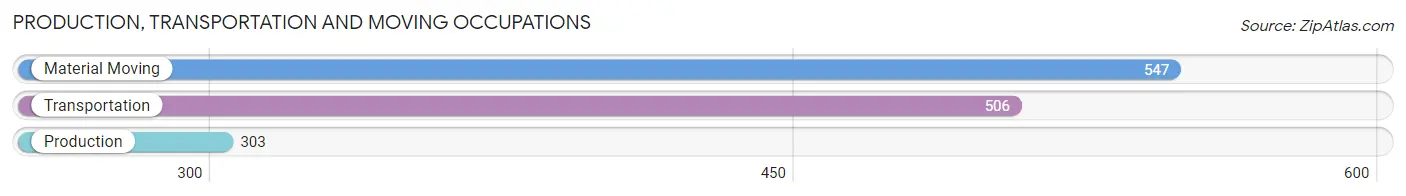
Production, Transportation and Moving Occupations
The most common Production, Transportation and Moving occupations in Selden are Material Moving (547 | 5.1%), Transportation (506 | 4.7%), and Production (303 | 2.8%).
Production, Transportation and Moving Occupations by Sex
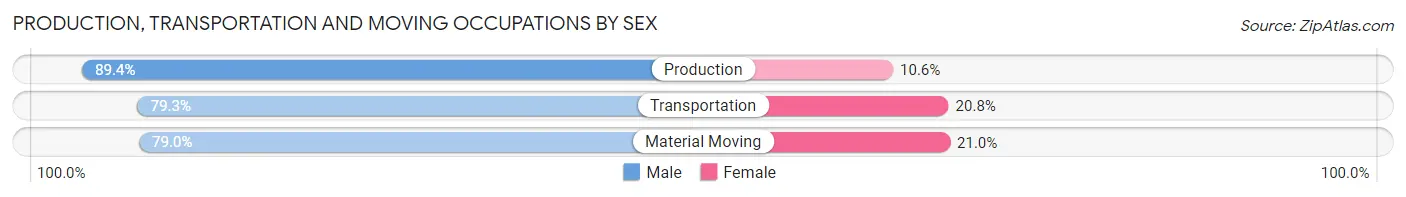
| Occupation | Male | Female |
| Production | 271 (89.4%) | 32 (10.6%) |
| Transportation | 401 (79.2%) | 105 (20.7%) |
| Material Moving | 432 (79.0%) | 115 (21.0%) |
| Total (Category) | 1,104 (81.4%) | 252 (18.6%) |
| Total (Overall) | 5,458 (50.7%) | 5,310 (49.3%) |
Employment Industries by Sex in Selden
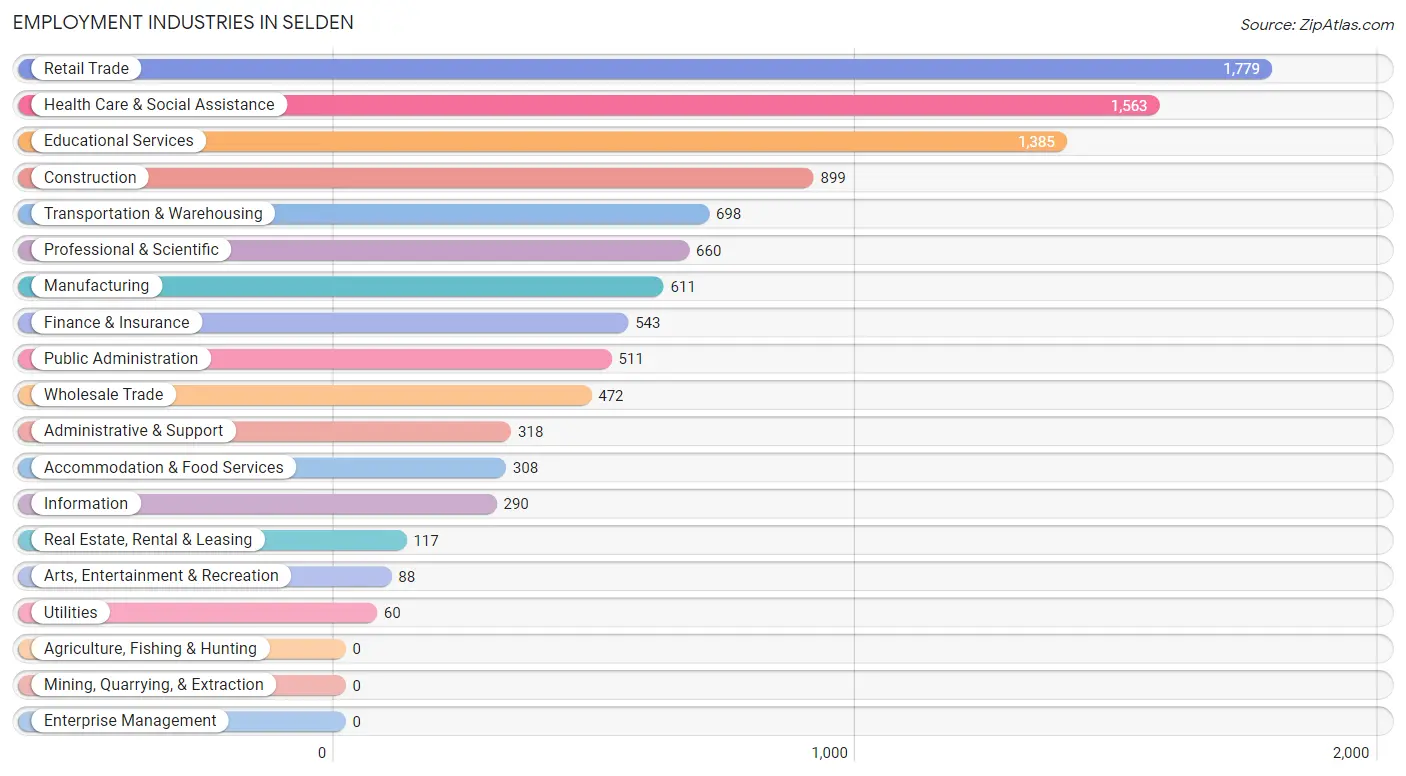
Employment Industries in Selden
The major employment industries in Selden include Retail Trade (1,779 | 16.5%), Health Care & Social Assistance (1,563 | 14.5%), Educational Services (1,385 | 12.9%), Construction (899 | 8.4%), and Transportation & Warehousing (698 | 6.5%).
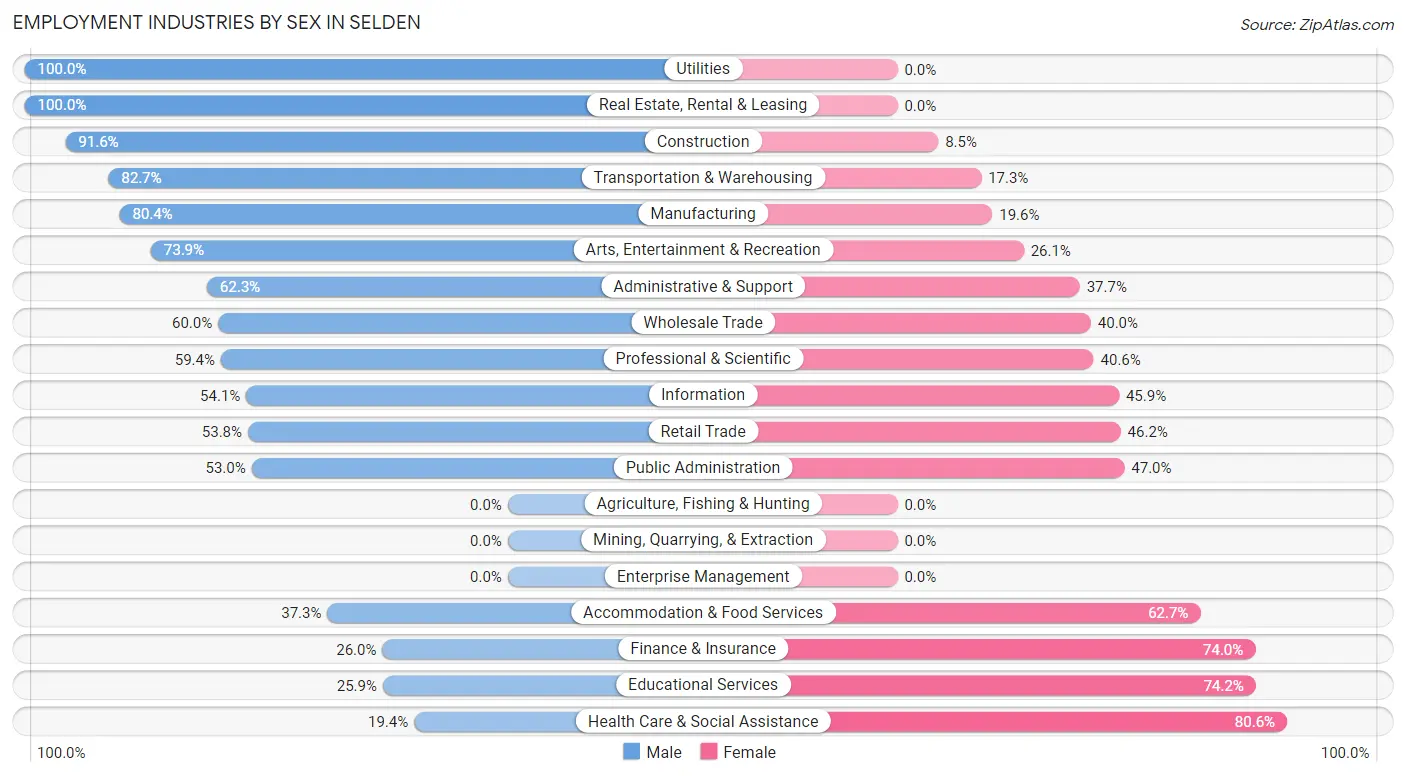
Employment Industries by Sex in Selden
The Selden industries that see more men than women are Utilities (100.0%), Real Estate, Rental & Leasing (100.0%), and Construction (91.5%), whereas the industries that tend to have a higher number of women are Health Care & Social Assistance (80.6%), Educational Services (74.2%), and Finance & Insurance (74.0%).
| Industry | Male | Female |
| Agriculture, Fishing & Hunting | 0 (0.0%) | 0 (0.0%) |
| Mining, Quarrying, & Extraction | 0 (0.0%) | 0 (0.0%) |
| Construction | 823 (91.5%) | 76 (8.5%) |
| Manufacturing | 491 (80.4%) | 120 (19.6%) |
| Wholesale Trade | 283 (60.0%) | 189 (40.0%) |
| Retail Trade | 957 (53.8%) | 822 (46.2%) |
| Transportation & Warehousing | 577 (82.7%) | 121 (17.3%) |
| Utilities | 60 (100.0%) | 0 (0.0%) |
| Information | 157 (54.1%) | 133 (45.9%) |
| Finance & Insurance | 141 (26.0%) | 402 (74.0%) |
| Real Estate, Rental & Leasing | 117 (100.0%) | 0 (0.0%) |
| Professional & Scientific | 392 (59.4%) | 268 (40.6%) |
| Enterprise Management | 0 (0.0%) | 0 (0.0%) |
| Administrative & Support | 198 (62.3%) | 120 (37.7%) |
| Educational Services | 358 (25.9%) | 1,027 (74.2%) |
| Health Care & Social Assistance | 303 (19.4%) | 1,260 (80.6%) |
| Arts, Entertainment & Recreation | 65 (73.9%) | 23 (26.1%) |
| Accommodation & Food Services | 115 (37.3%) | 193 (62.7%) |
| Public Administration | 271 (53.0%) | 240 (47.0%) |
| Total | 5,458 (50.7%) | 5,310 (49.3%) |
Education in Selden
School Enrollment in Selden
The most common levels of schooling among the 5,178 students in Selden are high school (1,457 | 28.1%), middle school (943 | 18.2%), and elementary school (872 | 16.8%).
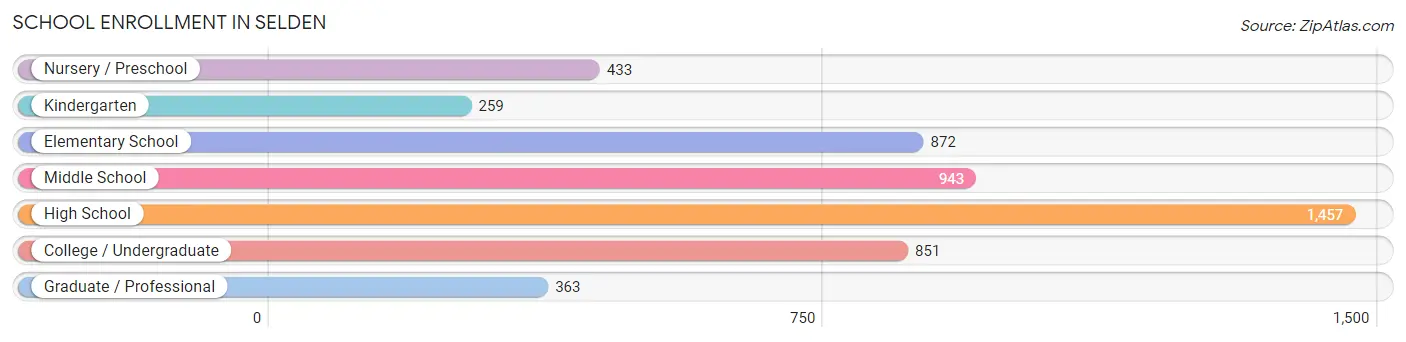
| School Level | # Students | % Students |
| Nursery / Preschool | 433 | 8.4% |
| Kindergarten | 259 | 5.0% |
| Elementary School | 872 | 16.8% |
| Middle School | 943 | 18.2% |
| High School | 1,457 | 28.1% |
| College / Undergraduate | 851 | 16.4% |
| Graduate / Professional | 363 | 7.0% |
| Total | 5,178 | 100.0% |
School Enrollment by Age by Funding Source in Selden
Out of a total of 5,178 students who are enrolled in schools in Selden, 642 (12.4%) attend a private institution, while the remaining 4,536 (87.6%) are enrolled in public schools. The age group of 3 to 4 year olds has the highest likelihood of being enrolled in private schools, with 272 (72.5% in the age bracket) enrolled. Conversely, the age group of 10 to 14 year olds has the lowest likelihood of being enrolled in a private school, with 1,208 (99.3% in the age bracket) attending a public institution.
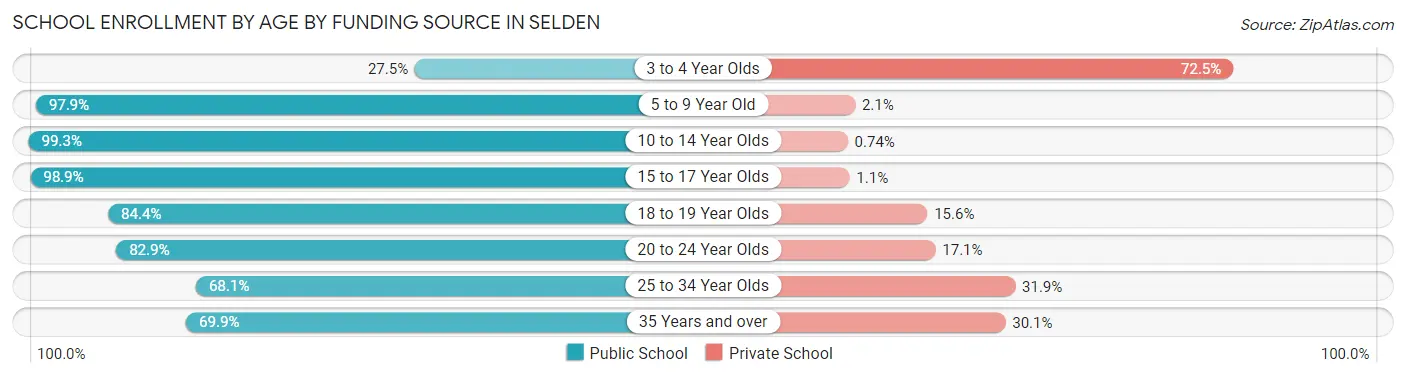
| Age Bracket | Public School | Private School |
| 3 to 4 Year Olds | 103 (27.5%) | 272 (72.5%) |
| 5 to 9 Year Old | 1,166 (97.9%) | 25 (2.1%) |
| 10 to 14 Year Olds | 1,208 (99.3%) | 9 (0.7%) |
| 15 to 17 Year Olds | 922 (98.9%) | 10 (1.1%) |
| 18 to 19 Year Olds | 358 (84.4%) | 66 (15.6%) |
| 20 to 24 Year Olds | 369 (82.9%) | 76 (17.1%) |
| 25 to 34 Year Olds | 194 (68.1%) | 91 (31.9%) |
| 35 Years and over | 216 (69.9%) | 93 (30.1%) |
| Total | 4,536 (87.6%) | 642 (12.4%) |
Educational Attainment by Field of Study in Selden
Business (892 | 18.9%), education (779 | 16.5%), science & technology (468 | 9.9%), social sciences (439 | 9.3%), and engineering (387 | 8.2%) are the most common fields of study among 4,733 individuals in Selden who have obtained a bachelor's degree or higher.
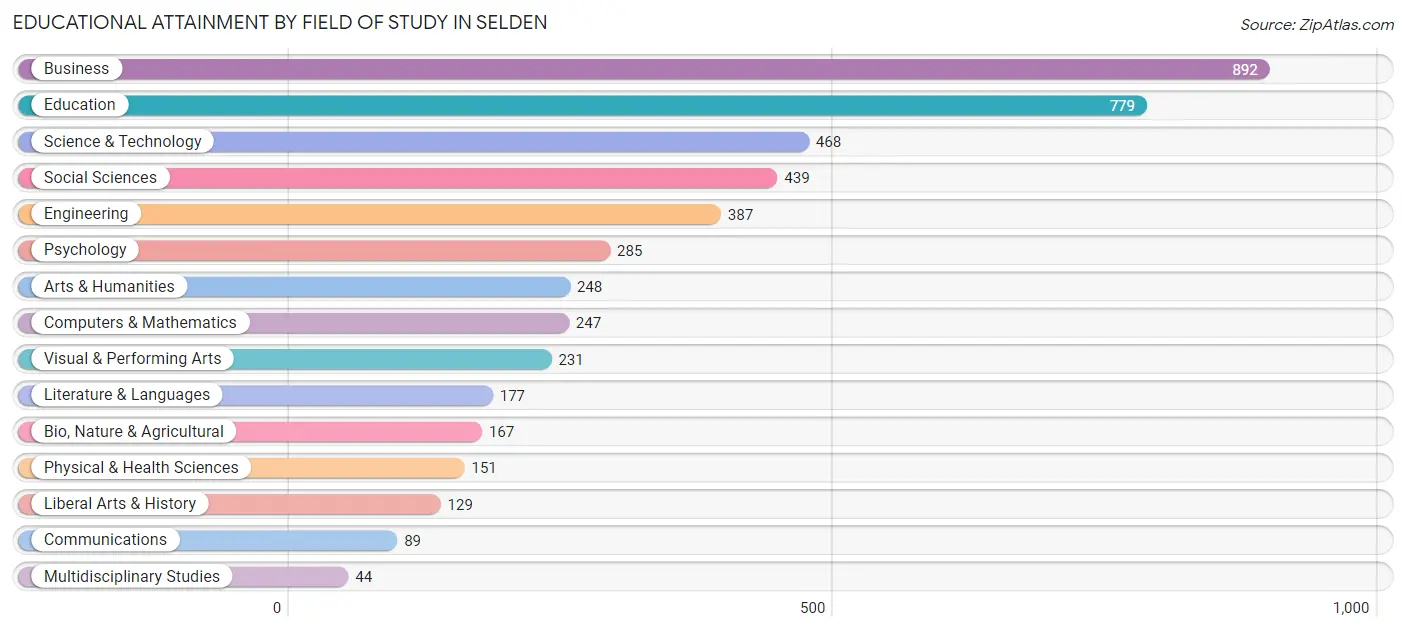
| Field of Study | # Graduates | % Graduates |
| Computers & Mathematics | 247 | 5.2% |
| Bio, Nature & Agricultural | 167 | 3.5% |
| Physical & Health Sciences | 151 | 3.2% |
| Psychology | 285 | 6.0% |
| Social Sciences | 439 | 9.3% |
| Engineering | 387 | 8.2% |
| Multidisciplinary Studies | 44 | 0.9% |
| Science & Technology | 468 | 9.9% |
| Business | 892 | 18.9% |
| Education | 779 | 16.5% |
| Literature & Languages | 177 | 3.7% |
| Liberal Arts & History | 129 | 2.7% |
| Visual & Performing Arts | 231 | 4.9% |
| Communications | 89 | 1.9% |
| Arts & Humanities | 248 | 5.2% |
| Total | 4,733 | 100.0% |
Transportation & Commute in Selden
Vehicle Availability by Sex in Selden
The most prevalent vehicle ownership categories in Selden are males with 2 vehicles (2,413, accounting for 44.5%) and females with 2 vehicles (2,057, making up 46.2%).
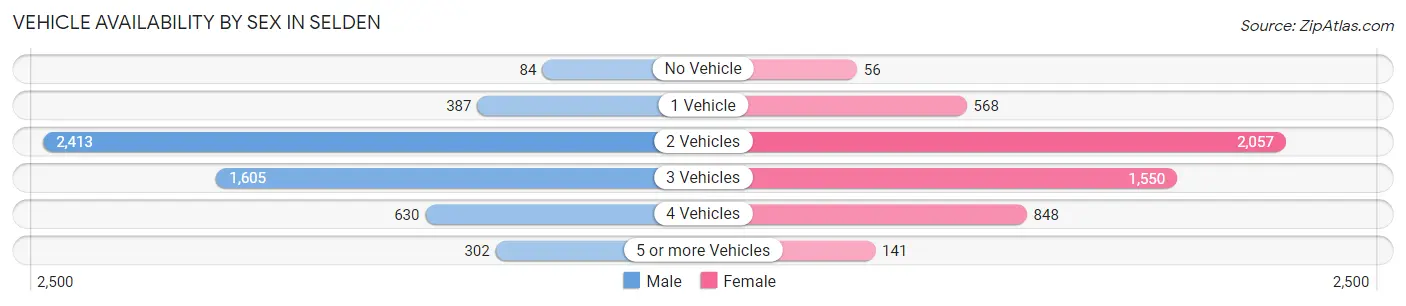
| Vehicles Available | Male | Female |
| No Vehicle | 84 (1.5%) | 56 (1.1%) |
| 1 Vehicle | 387 (7.1%) | 568 (10.9%) |
| 2 Vehicles | 2,413 (44.5%) | 2,057 (39.4%) |
| 3 Vehicles | 1,605 (29.6%) | 1,550 (29.7%) |
| 4 Vehicles | 630 (11.6%) | 848 (16.3%) |
| 5 or more Vehicles | 302 (5.6%) | 141 (2.7%) |
| Total | 5,421 (100.0%) | 5,220 (100.0%) |
Commute Time in Selden
The most frequently occuring commute durations in Selden are 15 to 19 minutes (1,759 commuters, 17.6%), 30 to 34 minutes (1,520 commuters, 15.2%), and 10 to 14 minutes (1,312 commuters, 13.2%).
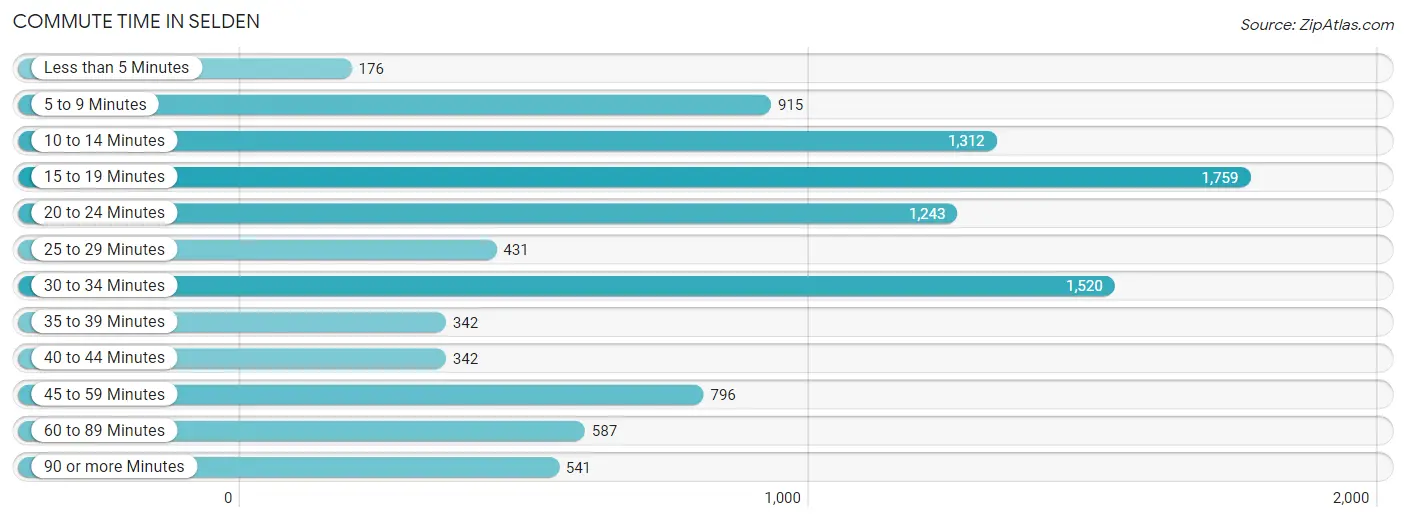
| Commute Time | # Commuters | % Commuters |
| Less than 5 Minutes | 176 | 1.8% |
| 5 to 9 Minutes | 915 | 9.2% |
| 10 to 14 Minutes | 1,312 | 13.2% |
| 15 to 19 Minutes | 1,759 | 17.6% |
| 20 to 24 Minutes | 1,243 | 12.5% |
| 25 to 29 Minutes | 431 | 4.3% |
| 30 to 34 Minutes | 1,520 | 15.2% |
| 35 to 39 Minutes | 342 | 3.4% |
| 40 to 44 Minutes | 342 | 3.4% |
| 45 to 59 Minutes | 796 | 8.0% |
| 60 to 89 Minutes | 587 | 5.9% |
| 90 or more Minutes | 541 | 5.4% |
Commute Time by Sex in Selden
The most common commute times in Selden are 30 to 34 minutes (992 commuters, 19.3%) for males and 10 to 14 minutes (936 commuters, 19.4%) for females.
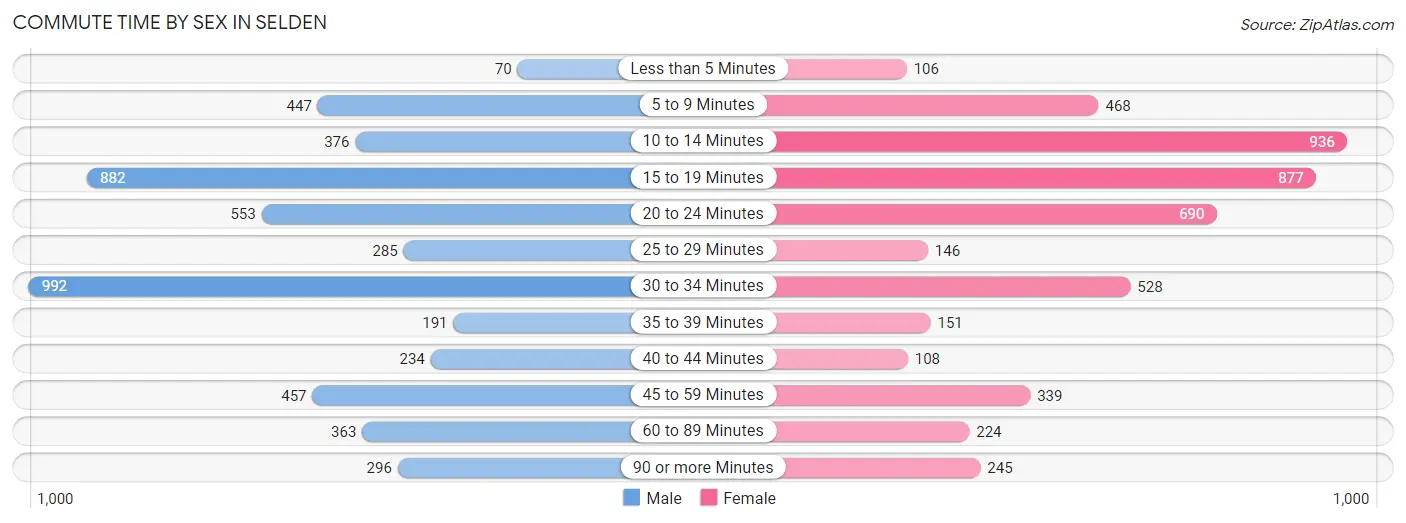
| Commute Time | Male | Female |
| Less than 5 Minutes | 70 (1.4%) | 106 (2.2%) |
| 5 to 9 Minutes | 447 (8.7%) | 468 (9.7%) |
| 10 to 14 Minutes | 376 (7.3%) | 936 (19.4%) |
| 15 to 19 Minutes | 882 (17.1%) | 877 (18.2%) |
| 20 to 24 Minutes | 553 (10.7%) | 690 (14.3%) |
| 25 to 29 Minutes | 285 (5.5%) | 146 (3.0%) |
| 30 to 34 Minutes | 992 (19.3%) | 528 (11.0%) |
| 35 to 39 Minutes | 191 (3.7%) | 151 (3.1%) |
| 40 to 44 Minutes | 234 (4.5%) | 108 (2.2%) |
| 45 to 59 Minutes | 457 (8.9%) | 339 (7.0%) |
| 60 to 89 Minutes | 363 (7.0%) | 224 (4.6%) |
| 90 or more Minutes | 296 (5.8%) | 245 (5.1%) |
Time of Departure to Work by Sex in Selden
The most frequent times of departure to work in Selden are 7:00 AM to 7:29 AM (776, 15.1%) for males and 7:00 AM to 7:29 AM (752, 15.6%) for females.
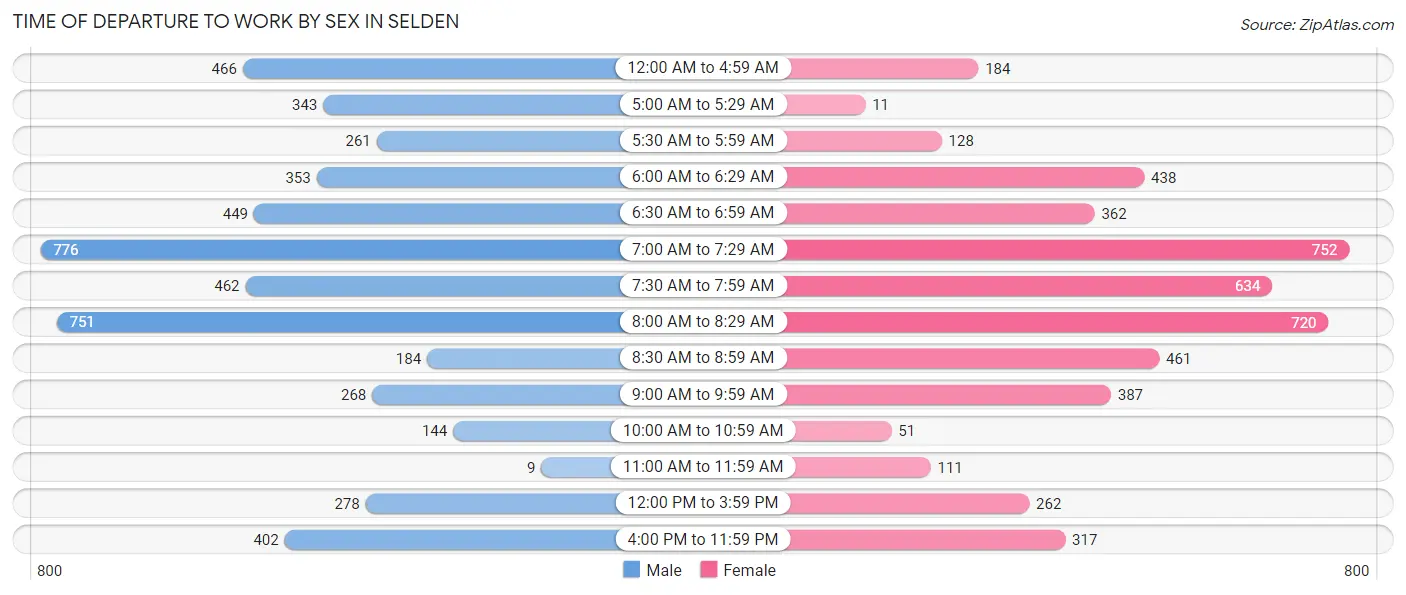
| Time of Departure | Male | Female |
| 12:00 AM to 4:59 AM | 466 (9.1%) | 184 (3.8%) |
| 5:00 AM to 5:29 AM | 343 (6.7%) | 11 (0.2%) |
| 5:30 AM to 5:59 AM | 261 (5.1%) | 128 (2.7%) |
| 6:00 AM to 6:29 AM | 353 (6.9%) | 438 (9.1%) |
| 6:30 AM to 6:59 AM | 449 (8.7%) | 362 (7.5%) |
| 7:00 AM to 7:29 AM | 776 (15.1%) | 752 (15.6%) |
| 7:30 AM to 7:59 AM | 462 (9.0%) | 634 (13.2%) |
| 8:00 AM to 8:29 AM | 751 (14.6%) | 720 (14.9%) |
| 8:30 AM to 8:59 AM | 184 (3.6%) | 461 (9.6%) |
| 9:00 AM to 9:59 AM | 268 (5.2%) | 387 (8.0%) |
| 10:00 AM to 10:59 AM | 144 (2.8%) | 51 (1.1%) |
| 11:00 AM to 11:59 AM | 9 (0.2%) | 111 (2.3%) |
| 12:00 PM to 3:59 PM | 278 (5.4%) | 262 (5.4%) |
| 4:00 PM to 11:59 PM | 402 (7.8%) | 317 (6.6%) |
| Total | 5,146 (100.0%) | 4,818 (100.0%) |
Housing Occupancy in Selden
Occupancy by Ownership in Selden
Of the total 6,889 dwellings in Selden, owner-occupied units account for 5,916 (85.9%), while renter-occupied units make up 973 (14.1%).
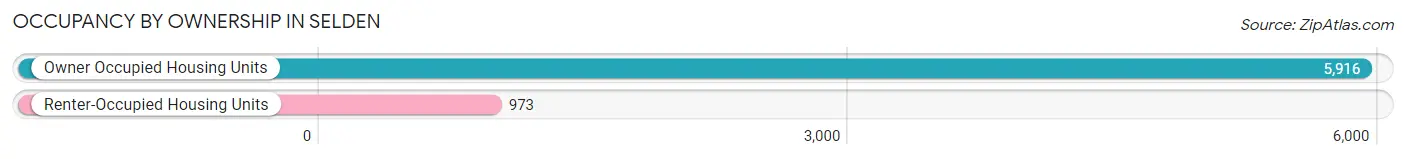
| Occupancy | # Housing Units | % Housing Units |
| Owner Occupied Housing Units | 5,916 | 85.9% |
| Renter-Occupied Housing Units | 973 | 14.1% |
| Total Occupied Housing Units | 6,889 | 100.0% |
Occupancy by Household Size in Selden
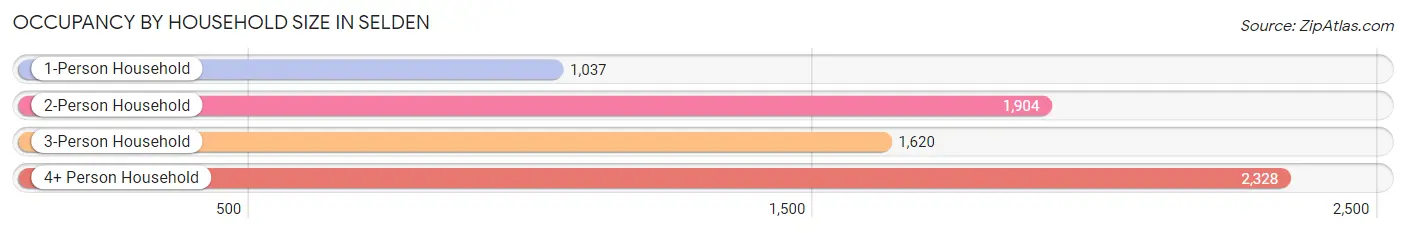
| Household Size | # Housing Units | % Housing Units |
| 1-Person Household | 1,037 | 15.0% |
| 2-Person Household | 1,904 | 27.6% |
| 3-Person Household | 1,620 | 23.5% |
| 4+ Person Household | 2,328 | 33.8% |
| Total Housing Units | 6,889 | 100.0% |
Occupancy by Ownership by Household Size in Selden
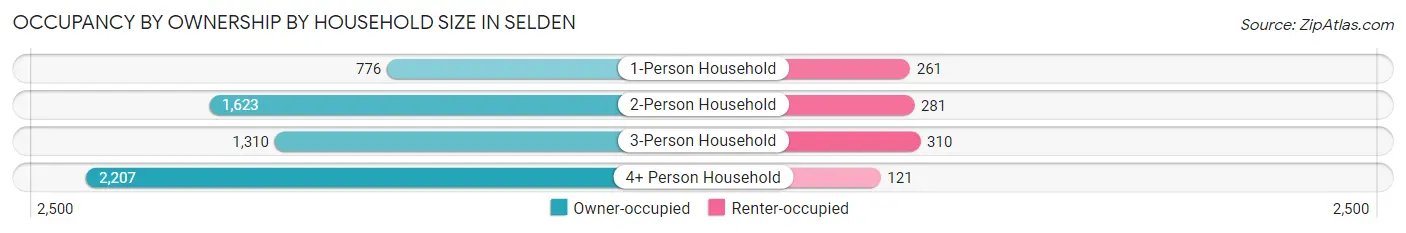
| Household Size | Owner-occupied | Renter-occupied |
| 1-Person Household | 776 (74.8%) | 261 (25.2%) |
| 2-Person Household | 1,623 (85.2%) | 281 (14.8%) |
| 3-Person Household | 1,310 (80.9%) | 310 (19.1%) |
| 4+ Person Household | 2,207 (94.8%) | 121 (5.2%) |
| Total Housing Units | 5,916 (85.9%) | 973 (14.1%) |
Occupancy by Educational Attainment in Selden
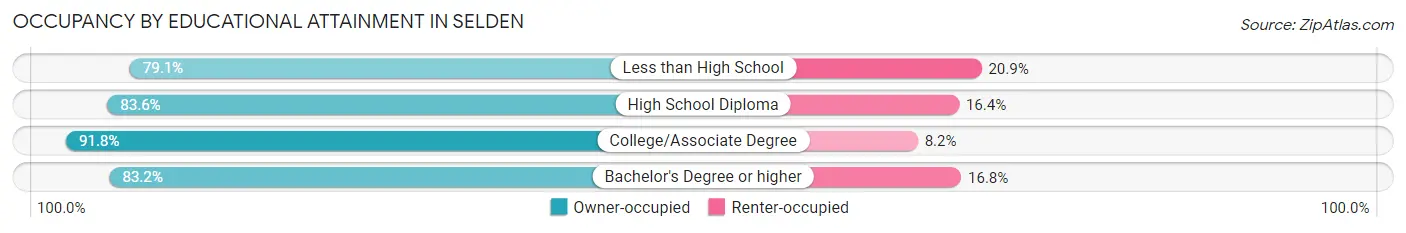
| Household Size | Owner-occupied | Renter-occupied |
| Less than High School | 288 (79.1%) | 76 (20.9%) |
| High School Diploma | 1,858 (83.6%) | 365 (16.4%) |
| College/Associate Degree | 2,051 (91.8%) | 184 (8.2%) |
| Bachelor's Degree or higher | 1,719 (83.2%) | 348 (16.8%) |
Occupancy by Age of Householder in Selden
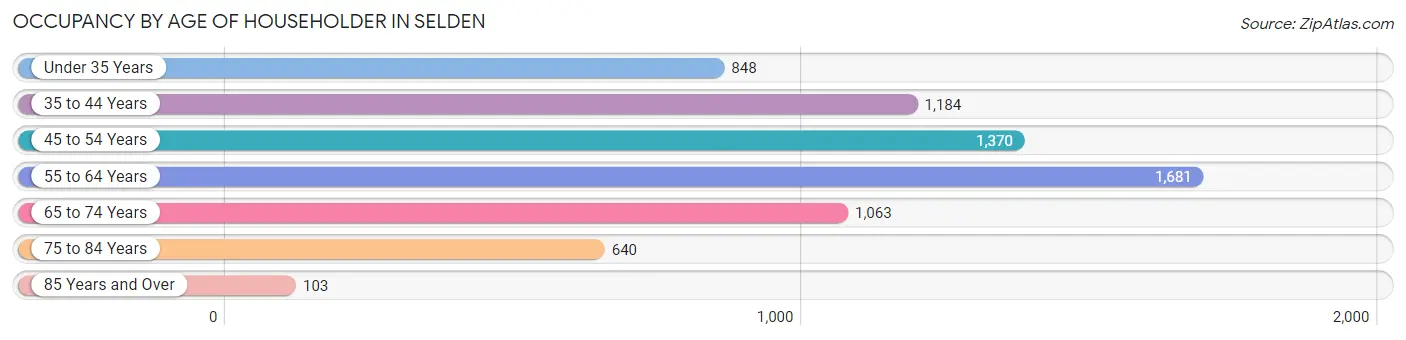
| Age Bracket | # Households | % Households |
| Under 35 Years | 848 | 12.3% |
| 35 to 44 Years | 1,184 | 17.2% |
| 45 to 54 Years | 1,370 | 19.9% |
| 55 to 64 Years | 1,681 | 24.4% |
| 65 to 74 Years | 1,063 | 15.4% |
| 75 to 84 Years | 640 | 9.3% |
| 85 Years and Over | 103 | 1.5% |
| Total | 6,889 | 100.0% |
Housing Finances in Selden
Median Income by Occupancy in Selden
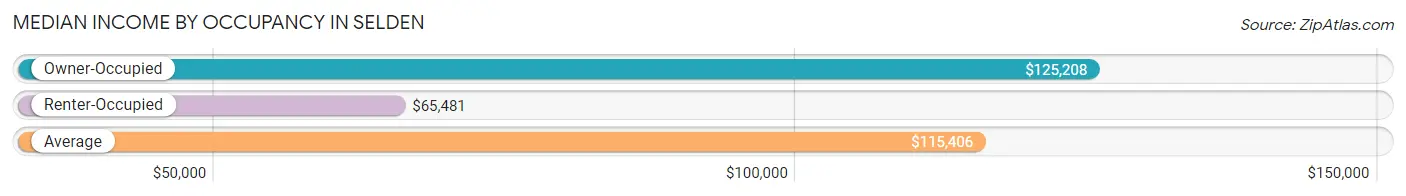
| Occupancy Type | # Households | Median Income |
| Owner-Occupied | 5,916 (85.9%) | $125,208 |
| Renter-Occupied | 973 (14.1%) | $65,481 |
| Average | 6,889 (100.0%) | $115,406 |
Occupancy by Householder Income Bracket in Selden
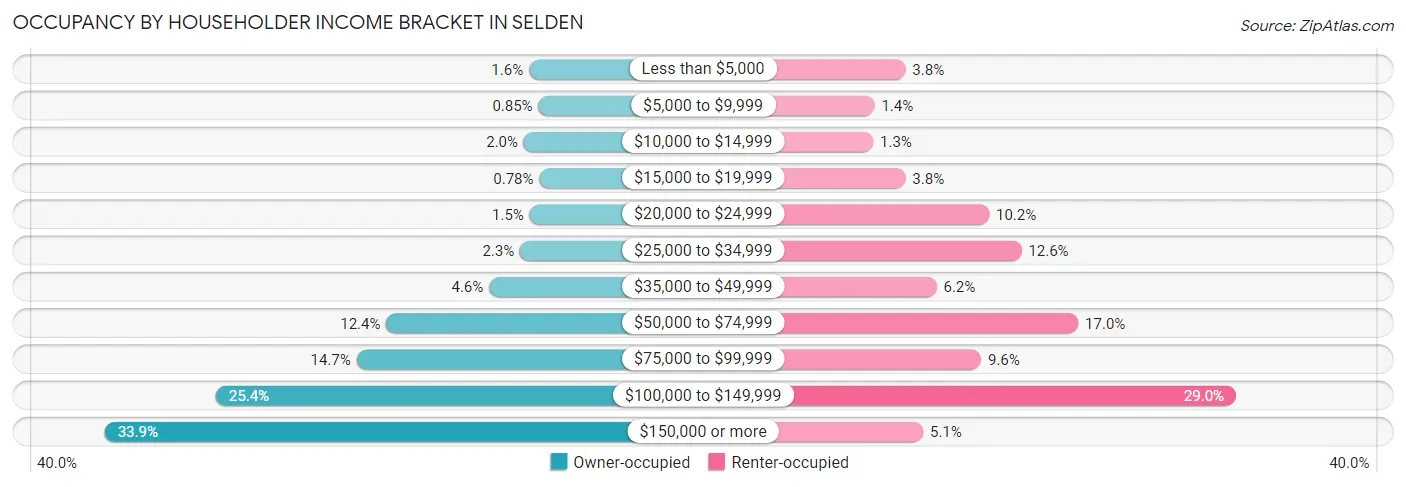
| Income Bracket | Owner-occupied | Renter-occupied |
| Less than $5,000 | 93 (1.6%) | 37 (3.8%) |
| $5,000 to $9,999 | 50 (0.9%) | 14 (1.4%) |
| $10,000 to $14,999 | 116 (2.0%) | 13 (1.3%) |
| $15,000 to $19,999 | 46 (0.8%) | 37 (3.8%) |
| $20,000 to $24,999 | 90 (1.5%) | 99 (10.2%) |
| $25,000 to $34,999 | 133 (2.2%) | 123 (12.6%) |
| $35,000 to $49,999 | 273 (4.6%) | 60 (6.2%) |
| $50,000 to $74,999 | 736 (12.4%) | 165 (17.0%) |
| $75,000 to $99,999 | 870 (14.7%) | 93 (9.6%) |
| $100,000 to $149,999 | 1,504 (25.4%) | 282 (29.0%) |
| $150,000 or more | 2,005 (33.9%) | 50 (5.1%) |
| Total | 5,916 (100.0%) | 973 (100.0%) |
Monthly Housing Cost Tiers in Selden
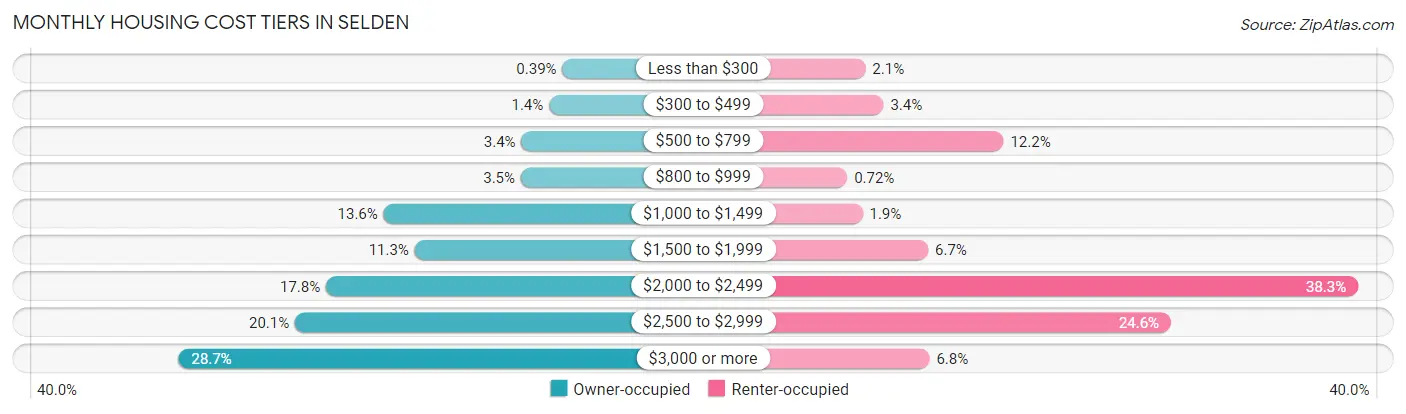
| Monthly Cost | Owner-occupied | Renter-occupied |
| Less than $300 | 23 (0.4%) | 20 (2.1%) |
| $300 to $499 | 81 (1.4%) | 33 (3.4%) |
| $500 to $799 | 202 (3.4%) | 119 (12.2%) |
| $800 to $999 | 204 (3.5%) | 7 (0.7%) |
| $1,000 to $1,499 | 802 (13.6%) | 18 (1.8%) |
| $1,500 to $1,999 | 667 (11.3%) | 65 (6.7%) |
| $2,000 to $2,499 | 1,053 (17.8%) | 373 (38.3%) |
| $2,500 to $2,999 | 1,188 (20.1%) | 239 (24.6%) |
| $3,000 or more | 1,696 (28.7%) | 66 (6.8%) |
| Total | 5,916 (100.0%) | 973 (100.0%) |
Physical Housing Characteristics in Selden
Housing Structures in Selden
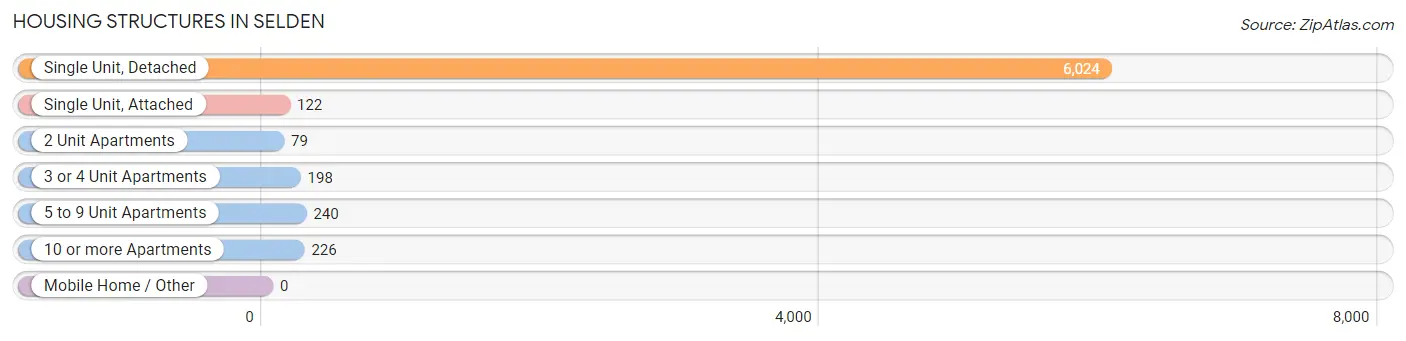
| Structure Type | # Housing Units | % Housing Units |
| Single Unit, Detached | 6,024 | 87.4% |
| Single Unit, Attached | 122 | 1.8% |
| 2 Unit Apartments | 79 | 1.1% |
| 3 or 4 Unit Apartments | 198 | 2.9% |
| 5 to 9 Unit Apartments | 240 | 3.5% |
| 10 or more Apartments | 226 | 3.3% |
| Mobile Home / Other | 0 | 0.0% |
| Total | 6,889 | 100.0% |
Housing Structures by Occupancy in Selden
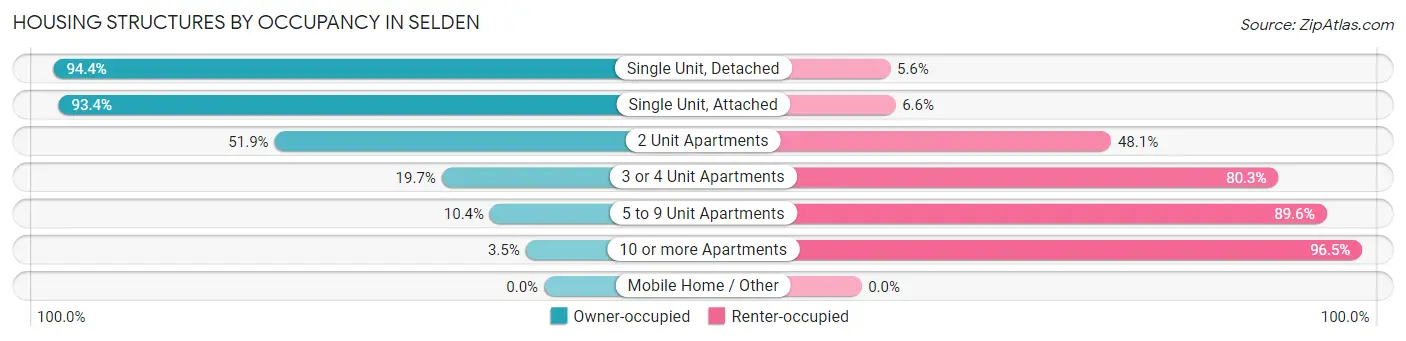
| Structure Type | Owner-occupied | Renter-occupied |
| Single Unit, Detached | 5,689 (94.4%) | 335 (5.6%) |
| Single Unit, Attached | 114 (93.4%) | 8 (6.6%) |
| 2 Unit Apartments | 41 (51.9%) | 38 (48.1%) |
| 3 or 4 Unit Apartments | 39 (19.7%) | 159 (80.3%) |
| 5 to 9 Unit Apartments | 25 (10.4%) | 215 (89.6%) |
| 10 or more Apartments | 8 (3.5%) | 218 (96.5%) |
| Mobile Home / Other | 0 (0.0%) | 0 (0.0%) |
| Total | 5,916 (85.9%) | 973 (14.1%) |
Housing Structures by Number of Rooms in Selden
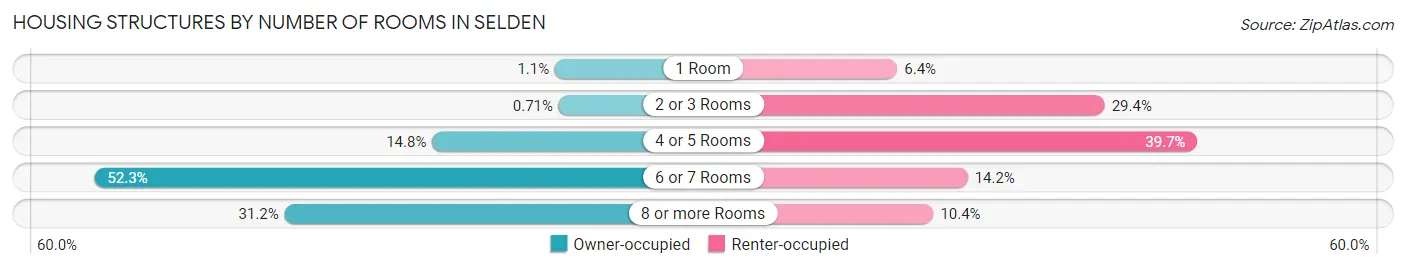
| Number of Rooms | Owner-occupied | Renter-occupied |
| 1 Room | 67 (1.1%) | 62 (6.4%) |
| 2 or 3 Rooms | 42 (0.7%) | 286 (29.4%) |
| 4 or 5 Rooms | 873 (14.8%) | 386 (39.7%) |
| 6 or 7 Rooms | 3,091 (52.2%) | 138 (14.2%) |
| 8 or more Rooms | 1,843 (31.1%) | 101 (10.4%) |
| Total | 5,916 (100.0%) | 973 (100.0%) |
Housing Structure by Heating Type in Selden
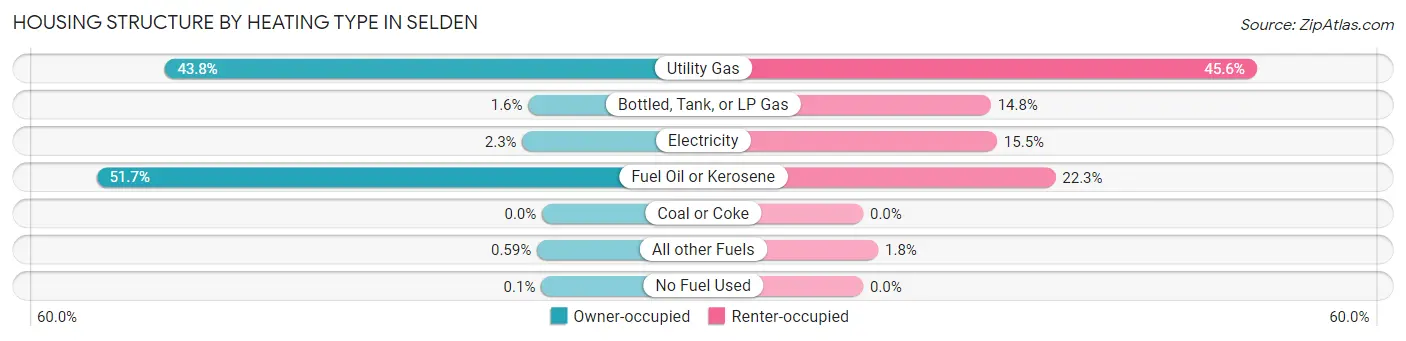
| Heating Type | Owner-occupied | Renter-occupied |
| Utility Gas | 2,590 (43.8%) | 444 (45.6%) |
| Bottled, Tank, or LP Gas | 94 (1.6%) | 144 (14.8%) |
| Electricity | 135 (2.3%) | 151 (15.5%) |
| Fuel Oil or Kerosene | 3,056 (51.7%) | 217 (22.3%) |
| Coal or Coke | 0 (0.0%) | 0 (0.0%) |
| All other Fuels | 35 (0.6%) | 17 (1.8%) |
| No Fuel Used | 6 (0.1%) | 0 (0.0%) |
| Total | 5,916 (100.0%) | 973 (100.0%) |
Household Vehicle Usage in Selden
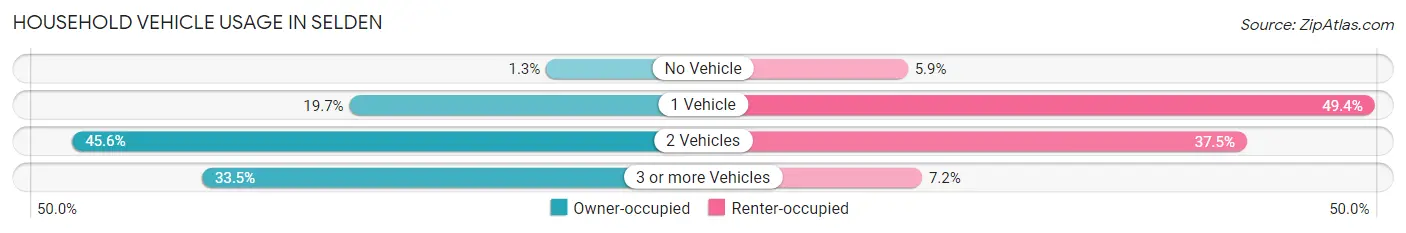
| Vehicles per Household | Owner-occupied | Renter-occupied |
| No Vehicle | 78 (1.3%) | 57 (5.9%) |
| 1 Vehicle | 1,164 (19.7%) | 481 (49.4%) |
| 2 Vehicles | 2,695 (45.6%) | 365 (37.5%) |
| 3 or more Vehicles | 1,979 (33.5%) | 70 (7.2%) |
| Total | 5,916 (100.0%) | 973 (100.0%) |
Real Estate & Mortgages in Selden
Real Estate and Mortgage Overview in Selden
| Characteristic | Without Mortgage | With Mortgage |
| Housing Units | 1,586 | 4,330 |
| Median Property Value | $413,700 | $405,100 |
| Median Household Income | $85,754 | $1,647 |
| Monthly Housing Costs | $1,280 | $1,685 |
| Real Estate Taxes | $9,251 | $31 |
Property Value by Mortgage Status in Selden
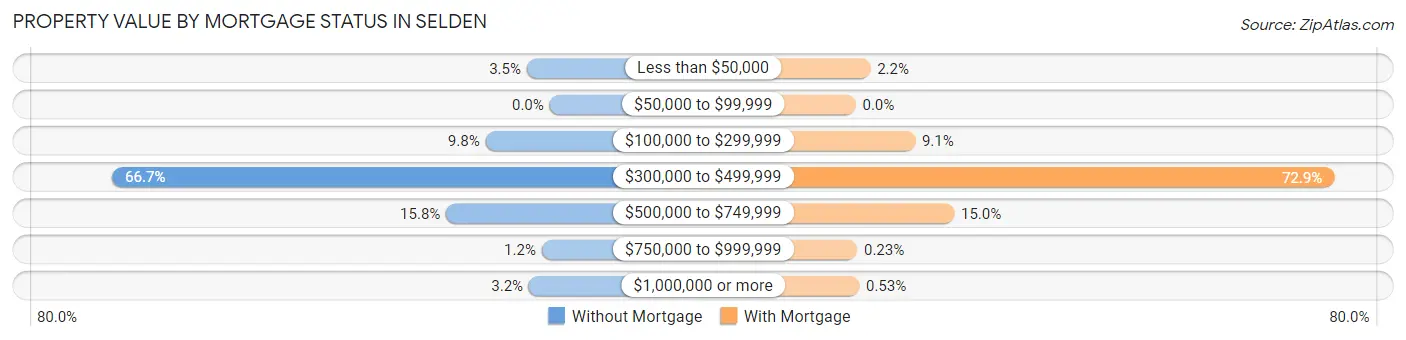
| Property Value | Without Mortgage | With Mortgage |
| Less than $50,000 | 55 (3.5%) | 97 (2.2%) |
| $50,000 to $99,999 | 0 (0.0%) | 0 (0.0%) |
| $100,000 to $299,999 | 155 (9.8%) | 392 (9.0%) |
| $300,000 to $499,999 | 1,057 (66.6%) | 3,158 (72.9%) |
| $500,000 to $749,999 | 250 (15.8%) | 650 (15.0%) |
| $750,000 to $999,999 | 19 (1.2%) | 10 (0.2%) |
| $1,000,000 or more | 50 (3.2%) | 23 (0.5%) |
| Total | 1,586 (100.0%) | 4,330 (100.0%) |
Household Income by Mortgage Status in Selden
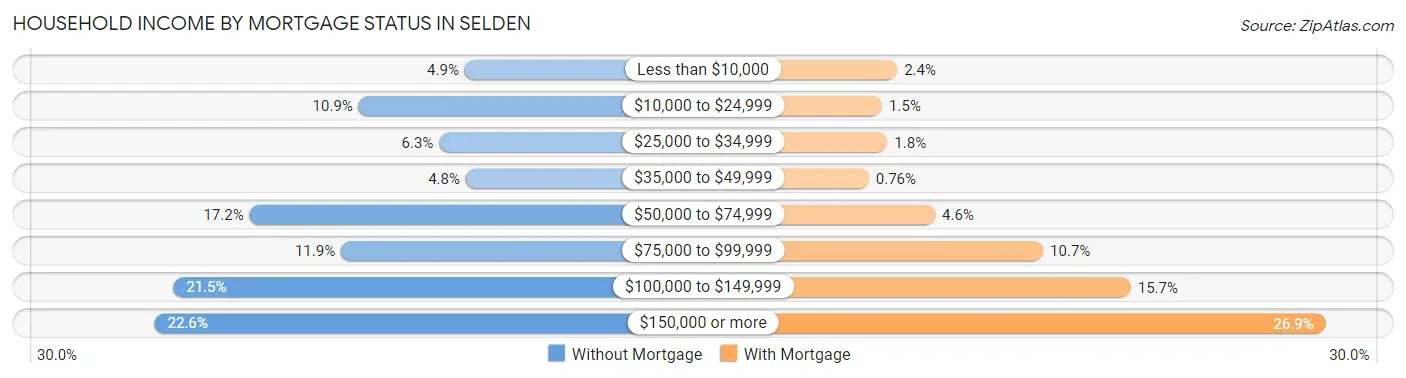
| Household Income | Without Mortgage | With Mortgage |
| Less than $10,000 | 77 (4.9%) | 103 (2.4%) |
| $10,000 to $24,999 | 173 (10.9%) | 66 (1.5%) |
| $25,000 to $34,999 | 100 (6.3%) | 79 (1.8%) |
| $35,000 to $49,999 | 76 (4.8%) | 33 (0.8%) |
| $50,000 to $74,999 | 272 (17.2%) | 197 (4.5%) |
| $75,000 to $99,999 | 189 (11.9%) | 464 (10.7%) |
| $100,000 to $149,999 | 341 (21.5%) | 681 (15.7%) |
| $150,000 or more | 358 (22.6%) | 1,163 (26.9%) |
| Total | 1,586 (100.0%) | 4,330 (100.0%) |
Property Value to Household Income Ratio in Selden
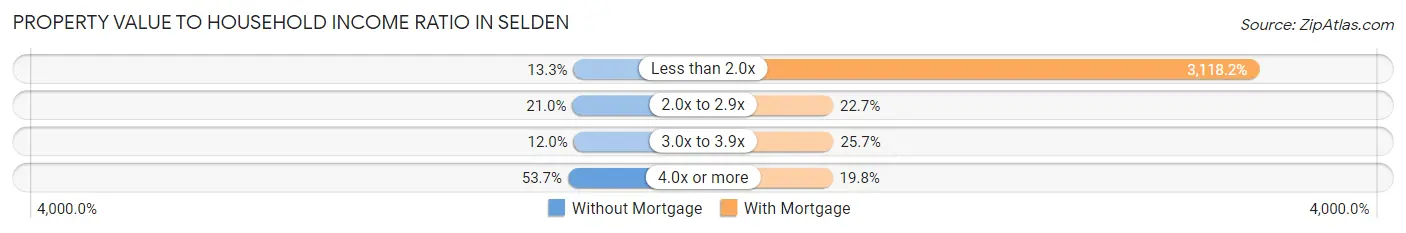
| Value-to-Income Ratio | Without Mortgage | With Mortgage |
| Less than 2.0x | 211 (13.3%) | 135,020 (3,118.2%) |
| 2.0x to 2.9x | 333 (21.0%) | 984 (22.7%) |
| 3.0x to 3.9x | 190 (12.0%) | 1,113 (25.7%) |
| 4.0x or more | 852 (53.7%) | 855 (19.8%) |
| Total | 1,586 (100.0%) | 4,330 (100.0%) |
Real Estate Taxes by Mortgage Status in Selden
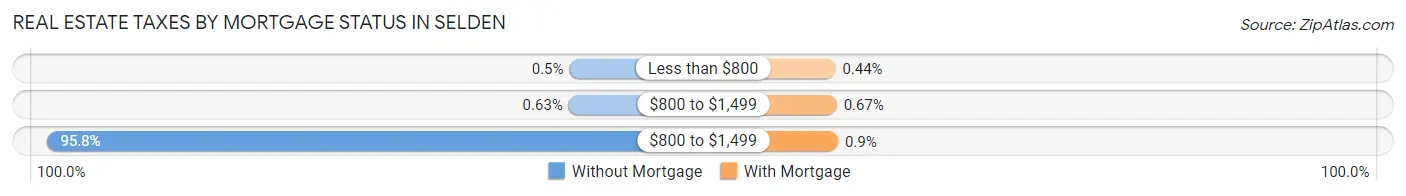
| Property Taxes | Without Mortgage | With Mortgage |
| Less than $800 | 8 (0.5%) | 19 (0.4%) |
| $800 to $1,499 | 10 (0.6%) | 29 (0.7%) |
| $800 to $1,499 | 1,520 (95.8%) | 39 (0.9%) |
| Total | 1,586 (100.0%) | 4,330 (100.0%) |
Health & Disability in Selden
Health Insurance Coverage by Age in Selden
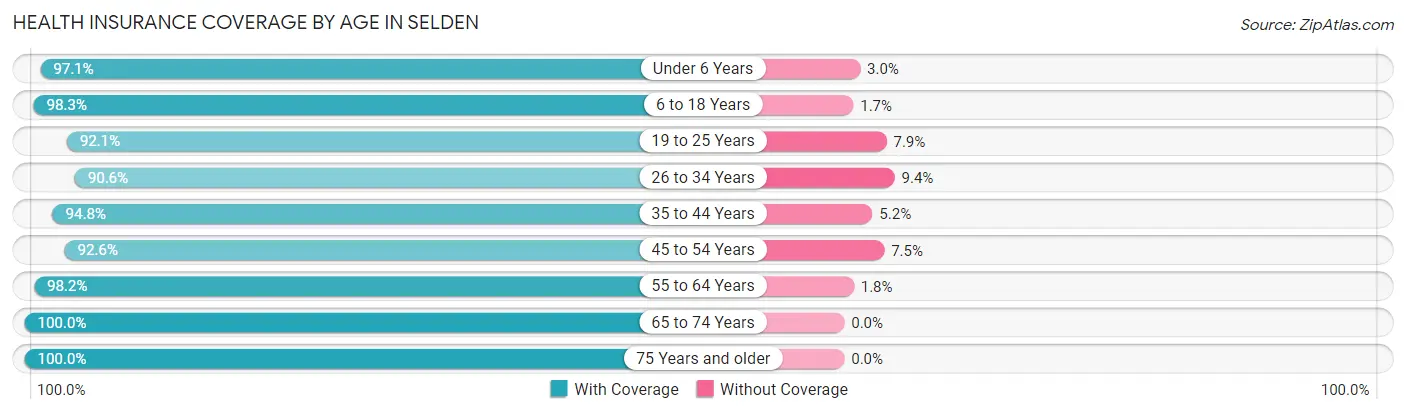
| Age Bracket | With Coverage | Without Coverage |
| Under 6 Years | 1,417 (97.1%) | 43 (2.9%) |
| 6 to 18 Years | 3,398 (98.3%) | 58 (1.7%) |
| 19 to 25 Years | 2,012 (92.1%) | 172 (7.9%) |
| 26 to 34 Years | 2,424 (90.6%) | 251 (9.4%) |
| 35 to 44 Years | 2,478 (94.8%) | 137 (5.2%) |
| 45 to 54 Years | 2,821 (92.5%) | 227 (7.4%) |
| 55 to 64 Years | 2,837 (98.2%) | 51 (1.8%) |
| 65 to 74 Years | 1,890 (100.0%) | 0 (0.0%) |
| 75 Years and older | 1,488 (100.0%) | 0 (0.0%) |
| Total | 20,765 (95.7%) | 939 (4.3%) |
Health Insurance Coverage by Citizenship Status in Selden
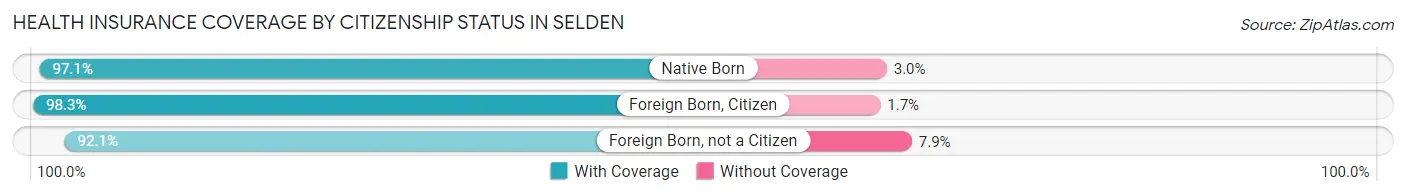
| Citizenship Status | With Coverage | Without Coverage |
| Native Born | 1,417 (97.1%) | 43 (2.9%) |
| Foreign Born, Citizen | 3,398 (98.3%) | 58 (1.7%) |
| Foreign Born, not a Citizen | 2,012 (92.1%) | 172 (7.9%) |
Health Insurance Coverage by Household Income in Selden
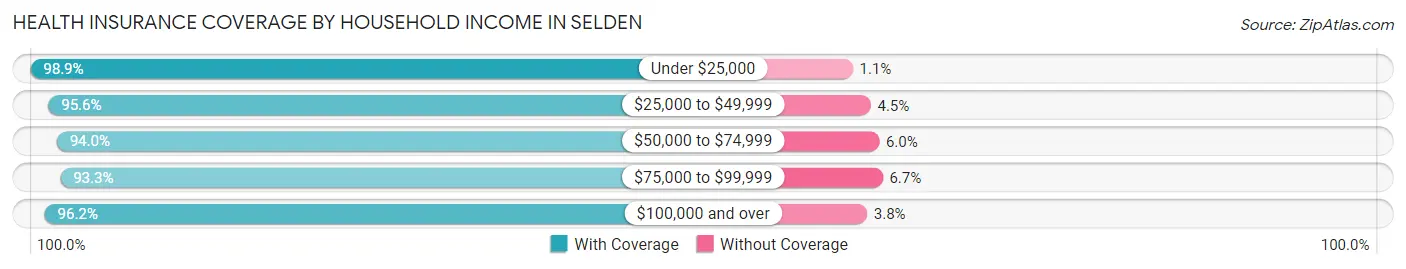
| Household Income | With Coverage | Without Coverage |
| Under $25,000 | 1,006 (98.9%) | 11 (1.1%) |
| $25,000 to $49,999 | 1,438 (95.6%) | 67 (4.4%) |
| $50,000 to $74,999 | 2,261 (94.0%) | 145 (6.0%) |
| $75,000 to $99,999 | 2,794 (93.3%) | 200 (6.7%) |
| $100,000 and over | 13,200 (96.2%) | 516 (3.8%) |
Public vs Private Health Insurance Coverage by Age in Selden
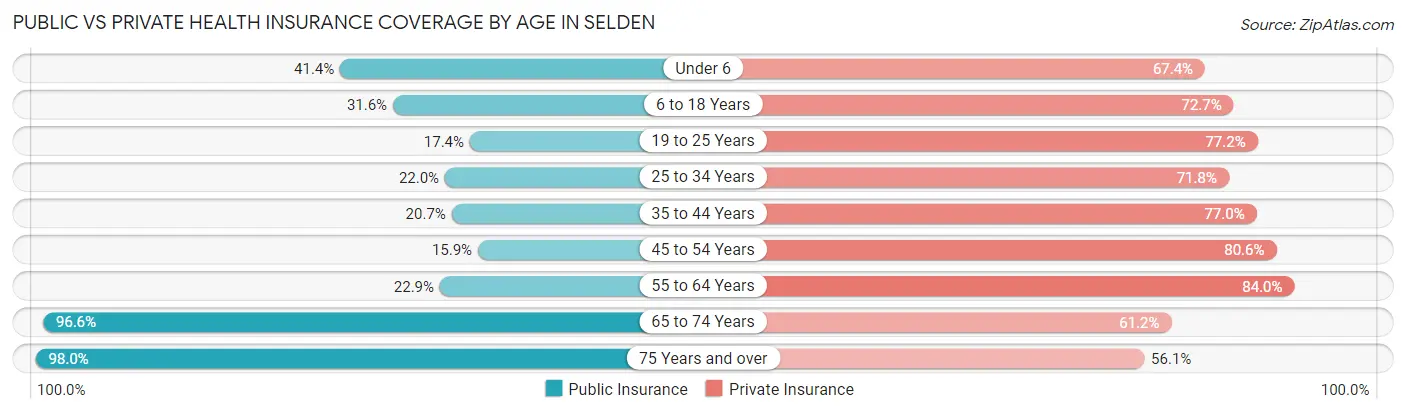
| Age Bracket | Public Insurance | Private Insurance |
| Under 6 | 605 (41.4%) | 984 (67.4%) |
| 6 to 18 Years | 1,093 (31.6%) | 2,513 (72.7%) |
| 19 to 25 Years | 379 (17.3%) | 1,685 (77.1%) |
| 25 to 34 Years | 588 (22.0%) | 1,921 (71.8%) |
| 35 to 44 Years | 542 (20.7%) | 2,013 (77.0%) |
| 45 to 54 Years | 483 (15.9%) | 2,458 (80.6%) |
| 55 to 64 Years | 662 (22.9%) | 2,426 (84.0%) |
| 65 to 74 Years | 1,826 (96.6%) | 1,156 (61.2%) |
| 75 Years and over | 1,458 (98.0%) | 835 (56.1%) |
| Total | 7,636 (35.2%) | 15,991 (73.7%) |
Disability Status by Sex by Age in Selden
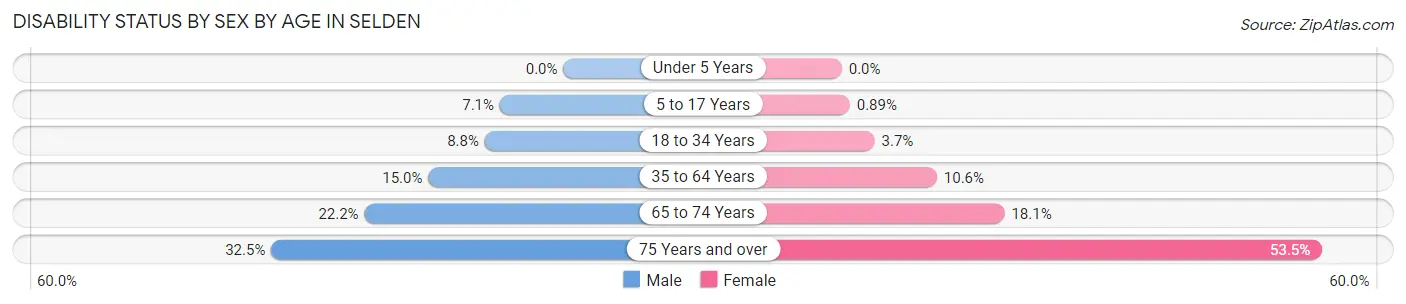
| Age Bracket | Male | Female |
| Under 5 Years | 0 (0.0%) | 0 (0.0%) |
| 5 to 17 Years | 129 (7.1%) | 14 (0.9%) |
| 18 to 34 Years | 222 (8.7%) | 94 (3.6%) |
| 35 to 64 Years | 667 (15.0%) | 436 (10.6%) |
| 65 to 74 Years | 206 (22.2%) | 174 (18.1%) |
| 75 Years and over | 135 (32.5%) | 574 (53.5%) |
Disability Class by Sex by Age in Selden
Disability Class: Hearing Difficulty
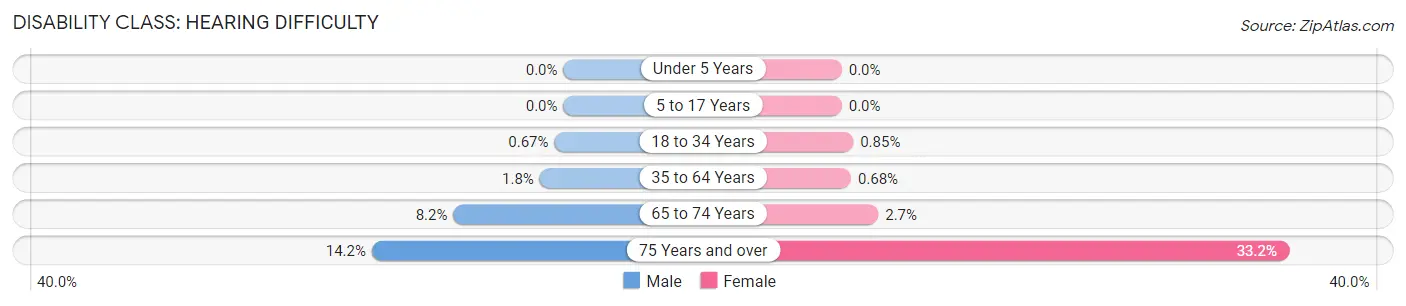
| Age Bracket | Male | Female |
| Under 5 Years | 0 (0.0%) | 0 (0.0%) |
| 5 to 17 Years | 0 (0.0%) | 0 (0.0%) |
| 18 to 34 Years | 17 (0.7%) | 22 (0.9%) |
| 35 to 64 Years | 78 (1.8%) | 28 (0.7%) |
| 65 to 74 Years | 76 (8.2%) | 26 (2.7%) |
| 75 Years and over | 59 (14.2%) | 356 (33.2%) |
Disability Class: Vision Difficulty
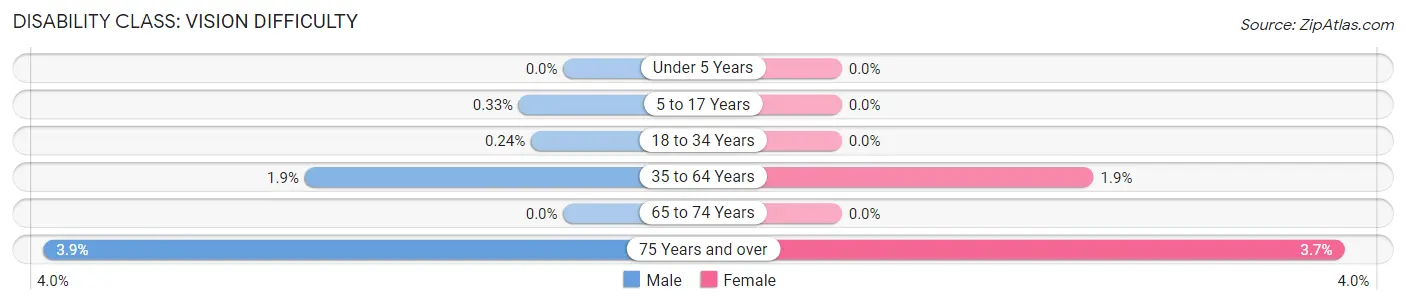
| Age Bracket | Male | Female |
| Under 5 Years | 0 (0.0%) | 0 (0.0%) |
| 5 to 17 Years | 6 (0.3%) | 0 (0.0%) |
| 18 to 34 Years | 6 (0.2%) | 0 (0.0%) |
| 35 to 64 Years | 85 (1.9%) | 77 (1.9%) |
| 65 to 74 Years | 0 (0.0%) | 0 (0.0%) |
| 75 Years and over | 16 (3.9%) | 40 (3.7%) |
Disability Class: Cognitive Difficulty
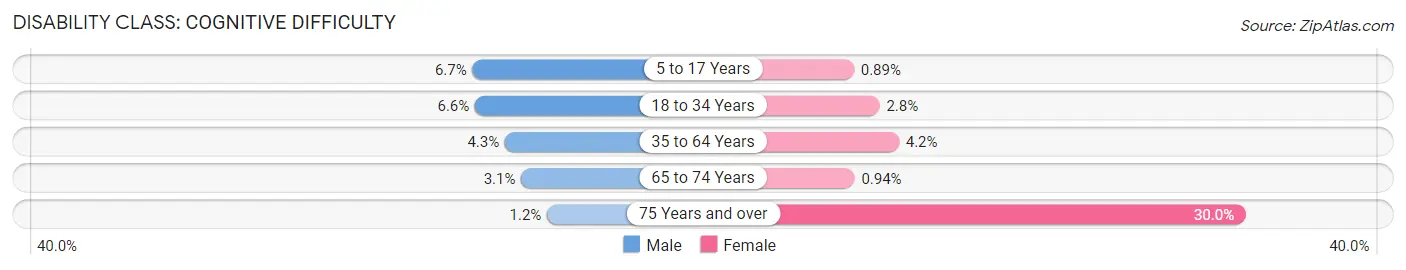
| Age Bracket | Male | Female |
| 5 to 17 Years | 123 (6.7%) | 14 (0.9%) |
| 18 to 34 Years | 166 (6.6%) | 72 (2.8%) |
| 35 to 64 Years | 192 (4.3%) | 174 (4.2%) |
| 65 to 74 Years | 29 (3.1%) | 9 (0.9%) |
| 75 Years and over | 5 (1.2%) | 322 (30.0%) |
Disability Class: Ambulatory Difficulty
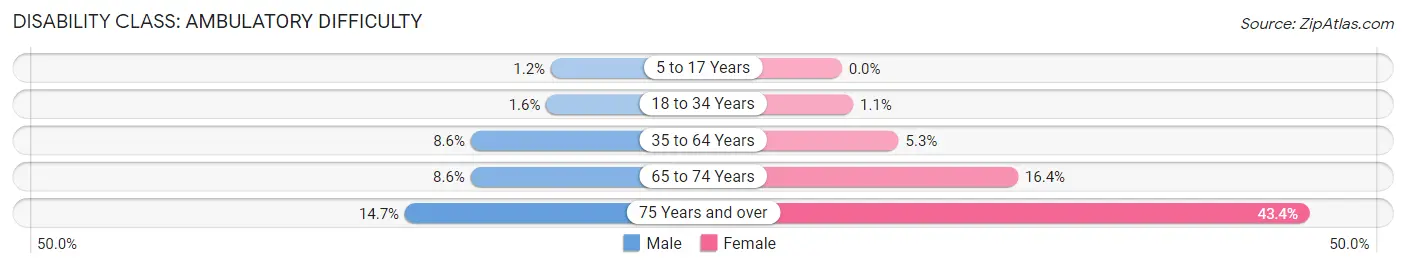
| Age Bracket | Male | Female |
| 5 to 17 Years | 21 (1.1%) | 0 (0.0%) |
| 18 to 34 Years | 40 (1.6%) | 27 (1.1%) |
| 35 to 64 Years | 381 (8.6%) | 217 (5.3%) |
| 65 to 74 Years | 80 (8.6%) | 157 (16.4%) |
| 75 Years and over | 61 (14.7%) | 466 (43.4%) |
Disability Class: Self-Care Difficulty
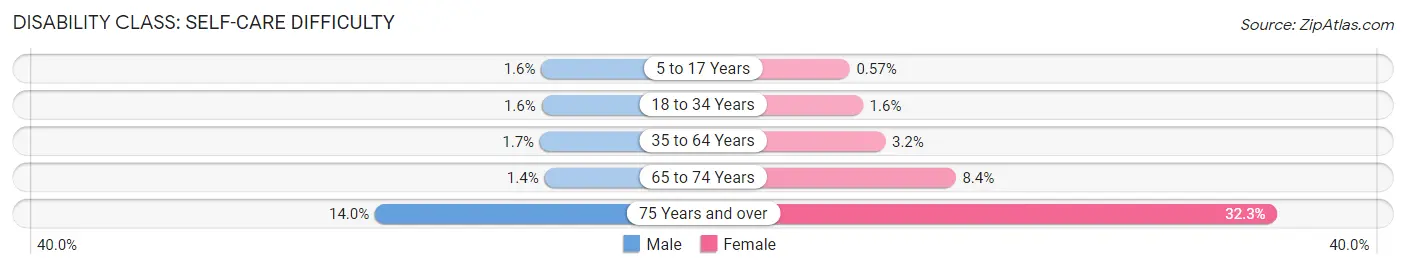
| Age Bracket | Male | Female |
| 5 to 17 Years | 30 (1.6%) | 9 (0.6%) |
| 18 to 34 Years | 41 (1.6%) | 40 (1.5%) |
| 35 to 64 Years | 77 (1.7%) | 132 (3.2%) |
| 65 to 74 Years | 13 (1.4%) | 81 (8.4%) |
| 75 Years and over | 58 (14.0%) | 347 (32.3%) |
Technology Access in Selden
Computing Device Access in Selden
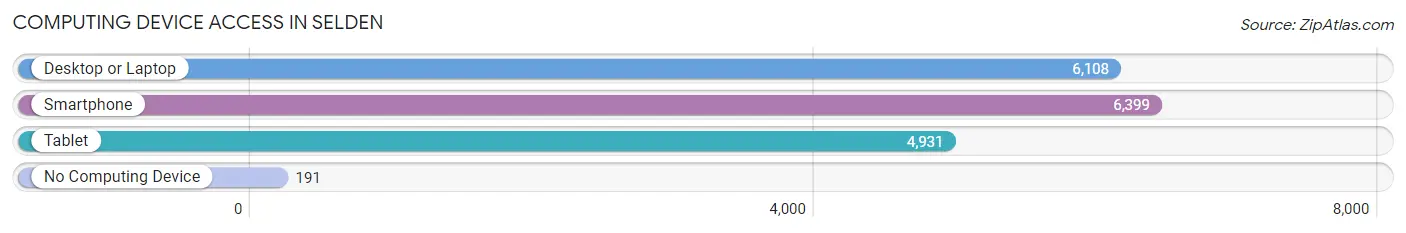
| Device Type | # Households | % Households |
| Desktop or Laptop | 6,108 | 88.7% |
| Smartphone | 6,399 | 92.9% |
| Tablet | 4,931 | 71.6% |
| No Computing Device | 191 | 2.8% |
| Total | 6,889 | 100.0% |
Internet Access in Selden
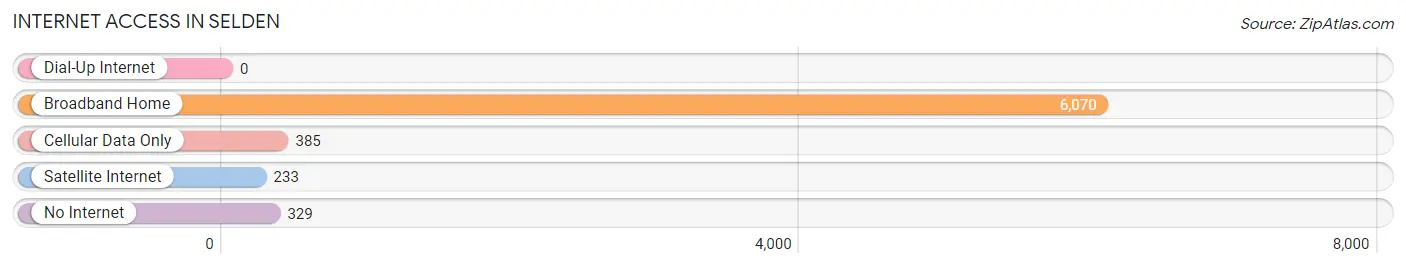
| Internet Type | # Households | % Households |
| Dial-Up Internet | 0 | 0.0% |
| Broadband Home | 6,070 | 88.1% |
| Cellular Data Only | 385 | 5.6% |
| Satellite Internet | 233 | 3.4% |
| No Internet | 329 | 4.8% |
| Total | 6,889 | 100.0% |
Selden Summary
Selden is a hamlet located in the Town of Brookhaven in Suffolk County, New York. It is situated on the north shore of Long Island, approximately 60 miles east of New York City. Selden is bordered by the hamlets of Centereach to the west, Terryville to the east, and Farmingville to the south.
History
The area that is now Selden was originally inhabited by the Secatogue Indians, a branch of the Algonquin tribe. The first European settlers arrived in the area in the late 1600s, and the hamlet was officially established in 1734. The name Selden is derived from the Selden family, who were among the first settlers in the area.
In the late 1800s, Selden was a rural farming community. The hamlet was home to several farms, including the Selden Farm, which was owned by the Selden family. The Selden Farm was one of the largest farms in the area, and it was known for its production of potatoes, corn, and other vegetables.
In the early 1900s, Selden began to experience rapid growth and development. The hamlet was home to several businesses, including a post office, a general store, and a blacksmith shop. In the 1950s, Selden experienced a population boom as more people moved to the area.
Geography
Selden is located in the Town of Brookhaven in Suffolk County, New York. It is situated on the north shore of Long Island, approximately 60 miles east of New York City. Selden is bordered by the hamlets of Centereach to the west, Terryville to the east, and Farmingville to the south.
The hamlet of Selden is located in the geographic center of the Town of Brookhaven. It is situated on the north shore of Long Island, approximately 60 miles east of New York City. The hamlet is bordered by the hamlets of Centereach to the west, Terryville to the east, and Farmingville to the south.
The terrain of Selden is mostly flat, with some rolling hills. The hamlet is located in the geographic center of the Town of Brookhaven, and it is surrounded by several bodies of water, including the Long Island Sound, the Peconic Bay, and the Great South Bay.
Economy
The economy of Selden is largely based on retail and services. The hamlet is home to several shopping centers, including the Selden Plaza Shopping Center and the Selden Commons Shopping Center. The hamlet is also home to several restaurants, banks, and other businesses.
Selden is also home to several industrial and manufacturing businesses. The hamlet is home to several large companies, including the Selden Manufacturing Company, which produces industrial equipment, and the Selden Chemical Company, which produces chemicals and other products.
Demographics
As of the 2010 census, the population of Selden was 20,861. The population of Selden is predominantly white (83.3%), with smaller percentages of African American (7.2%), Asian (4.7%), and Hispanic or Latino (3.7%) residents.
The median household income in Selden is $87,845, and the median home value is $346,400. The unemployment rate in Selden is 3.7%, which is lower than the national average of 3.9%.
Conclusion
Selden is a hamlet located in the Town of Brookhaven in Suffolk County, New York. It is situated on the north shore of Long Island, approximately 60 miles east of New York City. Selden has a long history, dating back to the late 1600s when the first European settlers arrived in the area. The hamlet is home to several businesses, including retail stores, restaurants, banks, and industrial and manufacturing companies. The population of Selden is predominantly white, with smaller percentages of African American, Asian, and Hispanic or Latino residents. The median household income in Selden is $87,845, and the median home value is $346,400.
Common Questions
What is Per Capita Income in Selden?
Per Capita income in Selden is $40,923.
What is the Median Family Income in Selden?
Median Family Income in Selden is $127,973.
What is the Median Household income in Selden?
Median Household Income in Selden is $115,406.
What is Income or Wage Gap in Selden?
Income or Wage Gap in Selden is 40.8%.
Women in Selden earn 59.2 cents for every dollar earned by a man.
What is Family Income Deficit in Selden?
Family Income Deficit in Selden is $12,522.
Families that are below poverty line in Selden earn $12,522 less on average than the poverty threshold level.
What is Inequality or Gini Index in Selden?
Inequality or Gini Index in Selden is 0.36.
What is the Total Population of Selden?
Total Population of Selden is 21,759.
What is the Total Male Population of Selden?
Total Male Population of Selden is 10,802.
What is the Total Female Population of Selden?
Total Female Population of Selden is 10,957.
What is the Ratio of Males per 100 Females in Selden?
There are 98.59 Males per 100 Females in Selden.
What is the Ratio of Females per 100 Males in Selden?
There are 101.43 Females per 100 Males in Selden.
What is the Median Population Age in Selden?
Median Population Age in Selden is 38.8 Years.
What is the Average Family Size in Selden
Average Family Size in Selden is 3.5 People.
What is the Average Household Size in Selden
Average Household Size in Selden is 3.1 People.
How Large is the Labor Force in Selden?
There are 11,400 People in the Labor Forcein in Selden.
What is the Percentage of People in the Labor Force in Selden?
63.6% of People are in the Labor Force in Selden.
What is the Unemployment Rate in Selden?
Unemployment Rate in Selden is 5.0%.