Bellerose Terrace, NY Map & Demographics
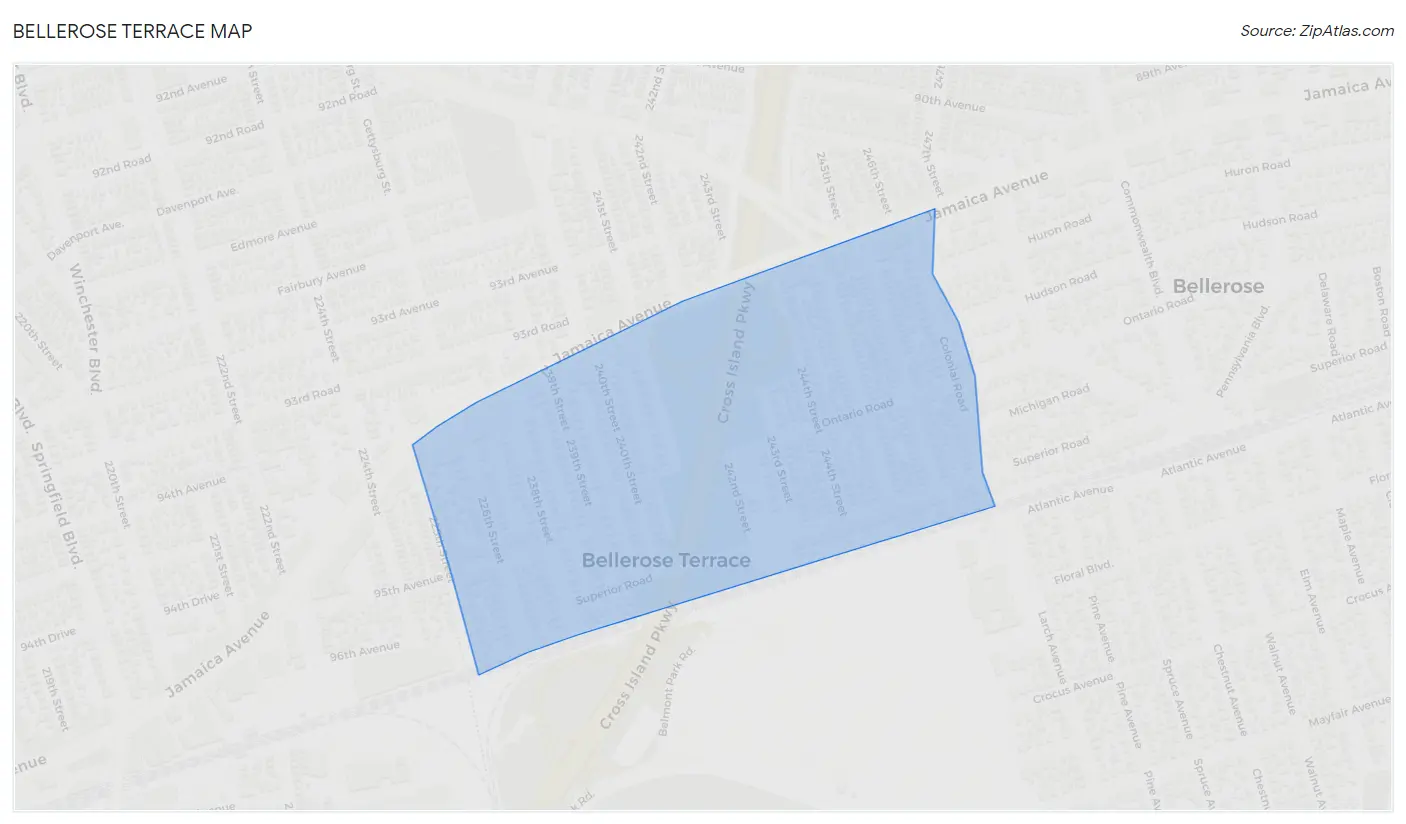
Bellerose Terrace Map
Bellerose Terrace Overview
$36,011
PER CAPITA INCOME
$153,080
AVG FAMILY INCOME
$140,893
AVG HOUSEHOLD INCOME
25.4%
WAGE / INCOME GAP [ % ]
74.6¢/ $1
WAGE / INCOME GAP [ $ ]
0.34
INEQUALITY / GINI INDEX
2,135
TOTAL POPULATION
1,132
MALE POPULATION
1,003
FEMALE POPULATION
112.86
MALES / 100 FEMALES
88.60
FEMALES / 100 MALES
45.1
MEDIAN AGE
3.2
AVG FAMILY SIZE
3.1
AVG HOUSEHOLD SIZE
1,265
LABOR FORCE [ PEOPLE ]
68.7%
PERCENT IN LABOR FORCE
11.6%
UNEMPLOYMENT RATE
Income in Bellerose Terrace
Income Overview in Bellerose Terrace
Per Capita Income in Bellerose Terrace is $36,011, while median incomes of families and households are $153,080 and $140,893 respectively.
| Characteristic | Number | Measure |
| Per Capita Income | 2,135 | $36,011 |
| Median Family Income | 623 | $153,080 |
| Mean Family Income | 623 | $132,455 |
| Median Household Income | 690 | $140,893 |
| Mean Household Income | 690 | $126,073 |
| Income Deficit | 623 | $0 |
| Wage / Income Gap (%) | 2,135 | 25.43% |
| Wage / Income Gap ($) | 2,135 | 74.57¢ per $1 |
| Gini / Inequality Index | 2,135 | 0.34 |
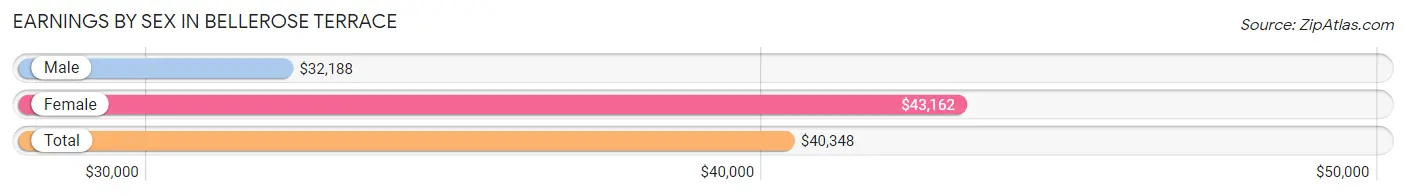
Earnings by Sex in Bellerose Terrace
Average Earnings in Bellerose Terrace are $40,348, $32,188 for men and $43,162 for women, a difference of 25.4%.
| Sex | Number | Average Earnings |
| Male | 742 (55.7%) | $32,188 |
| Female | 591 (44.3%) | $43,162 |
| Total | 1,333 (100.0%) | $40,348 |
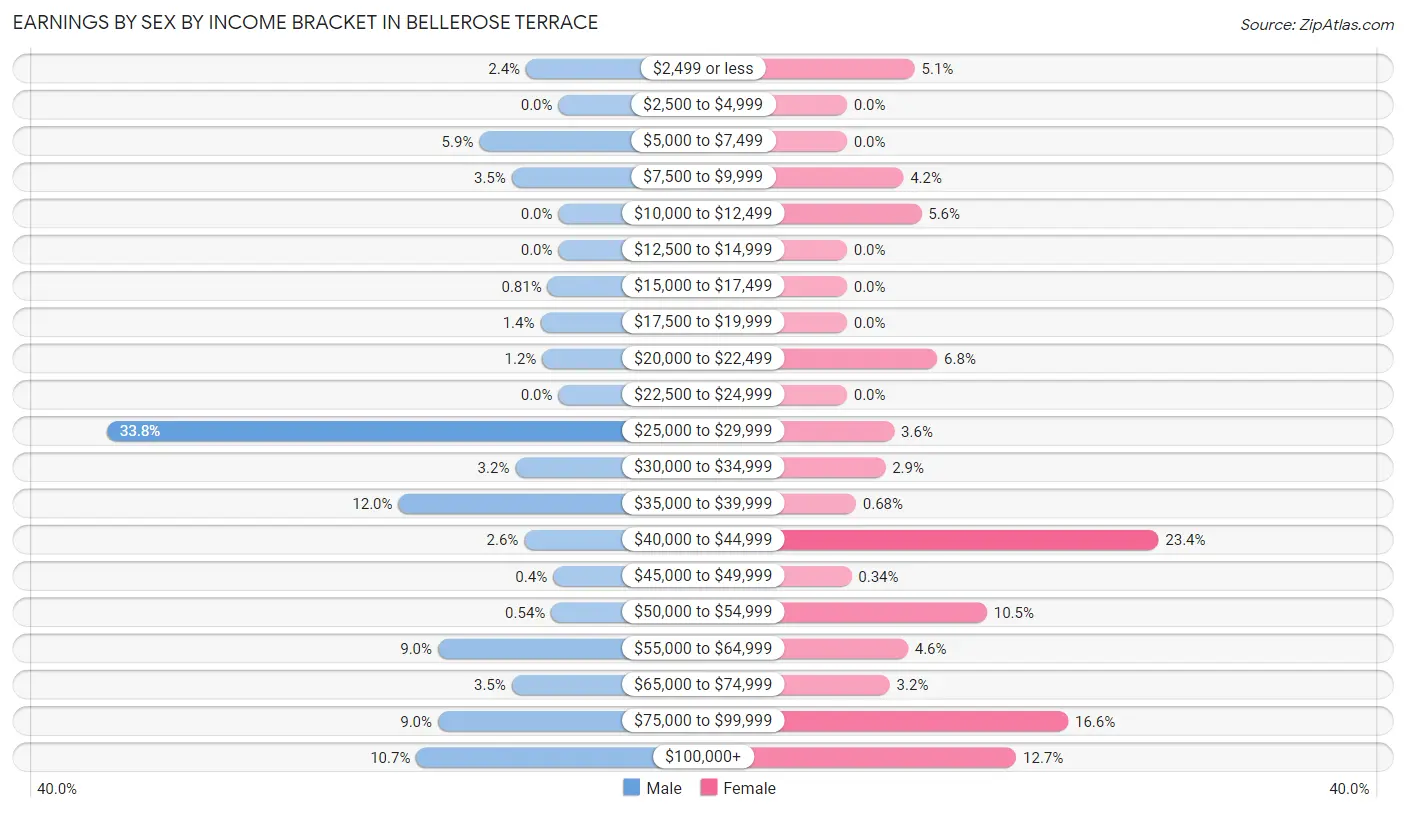
Earnings by Sex by Income Bracket in Bellerose Terrace
The most common earnings brackets in Bellerose Terrace are $25,000 to $29,999 for men (251 | 33.8%) and $40,000 to $44,999 for women (138 | 23.4%).
| Income | Male | Female |
| $2,499 or less | 18 (2.4%) | 30 (5.1%) |
| $2,500 to $4,999 | 0 (0.0%) | 0 (0.0%) |
| $5,000 to $7,499 | 44 (5.9%) | 0 (0.0%) |
| $7,500 to $9,999 | 26 (3.5%) | 25 (4.2%) |
| $10,000 to $12,499 | 0 (0.0%) | 33 (5.6%) |
| $12,500 to $14,999 | 0 (0.0%) | 0 (0.0%) |
| $15,000 to $17,499 | 6 (0.8%) | 0 (0.0%) |
| $17,500 to $19,999 | 10 (1.3%) | 0 (0.0%) |
| $20,000 to $22,499 | 9 (1.2%) | 40 (6.8%) |
| $22,500 to $24,999 | 0 (0.0%) | 0 (0.0%) |
| $25,000 to $29,999 | 251 (33.8%) | 21 (3.5%) |
| $30,000 to $34,999 | 24 (3.2%) | 17 (2.9%) |
| $35,000 to $39,999 | 89 (12.0%) | 4 (0.7%) |
| $40,000 to $44,999 | 19 (2.6%) | 138 (23.4%) |
| $45,000 to $49,999 | 3 (0.4%) | 2 (0.3%) |
| $50,000 to $54,999 | 4 (0.5%) | 62 (10.5%) |
| $55,000 to $64,999 | 67 (9.0%) | 27 (4.6%) |
| $65,000 to $74,999 | 26 (3.5%) | 19 (3.2%) |
| $75,000 to $99,999 | 67 (9.0%) | 98 (16.6%) |
| $100,000+ | 79 (10.6%) | 75 (12.7%) |
| Total | 742 (100.0%) | 591 (100.0%) |
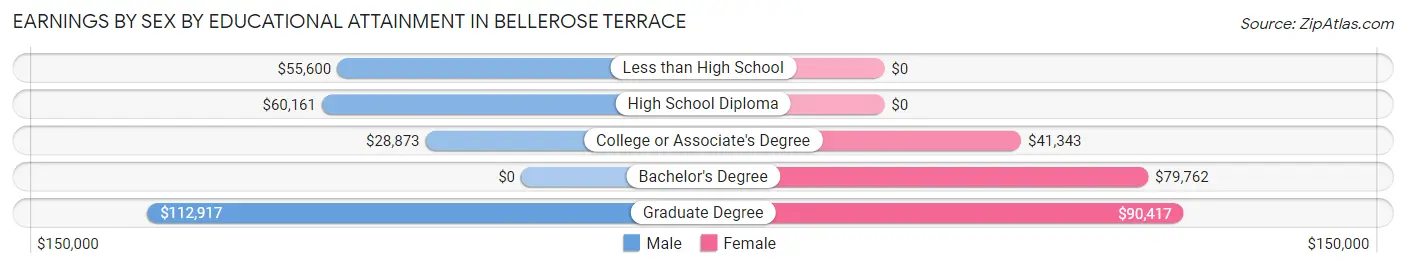
Earnings by Sex by Educational Attainment in Bellerose Terrace
Average earnings in Bellerose Terrace are $36,045 for men and $50,724 for women, a difference of 28.9%. Men with an educational attainment of graduate degree enjoy the highest average annual earnings of $112,917, while those with college or associate's degree education earn the least with $28,873. Women with an educational attainment of graduate degree earn the most with the average annual earnings of $90,417, while those with college or associate's degree education have the smallest earnings of $41,343.
| Educational Attainment | Male Income | Female Income |
| Less than High School | $55,600 | $0 |
| High School Diploma | $60,161 | $0 |
| College or Associate's Degree | $28,873 | $41,343 |
| Bachelor's Degree | - | - |
| Graduate Degree | $112,917 | $90,417 |
| Total | $36,045 | $50,724 |
Family Income in Bellerose Terrace
Family Income Brackets in Bellerose Terrace
According to the Bellerose Terrace family income data, there are 252 families falling into the $150,000 to $199,999 income range, which is the most common income bracket and makes up 40.5% of all families.
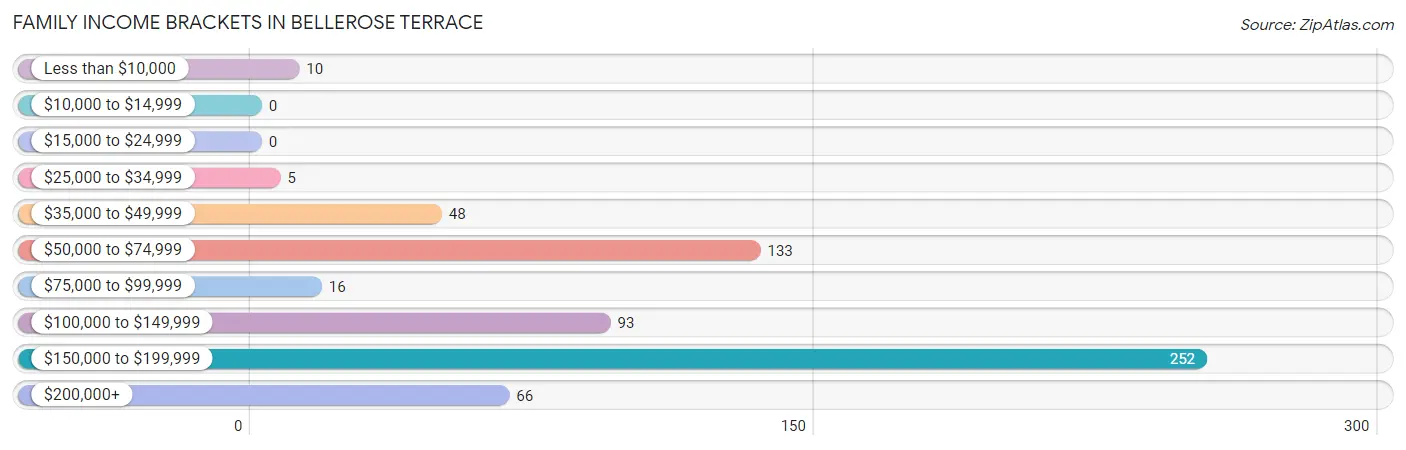
| Income Bracket | # Families | % Families |
| Less than $10,000 | 10 | 1.6% |
| $10,000 to $14,999 | 0 | 0.0% |
| $15,000 to $24,999 | 0 | 0.0% |
| $25,000 to $34,999 | 5 | 0.8% |
| $35,000 to $49,999 | 48 | 7.7% |
| $50,000 to $74,999 | 133 | 21.3% |
| $75,000 to $99,999 | 16 | 2.6% |
| $100,000 to $149,999 | 93 | 14.9% |
| $150,000 to $199,999 | 252 | 40.4% |
| $200,000+ | 66 | 10.6% |
Family Income by Famaliy Size in Bellerose Terrace
4-person families (83 | 13.3%) account for the highest median family income in Bellerose Terrace with $161,806 per family, while 2-person families (149 | 23.9%) have the highest median income of $76,852 per family member.
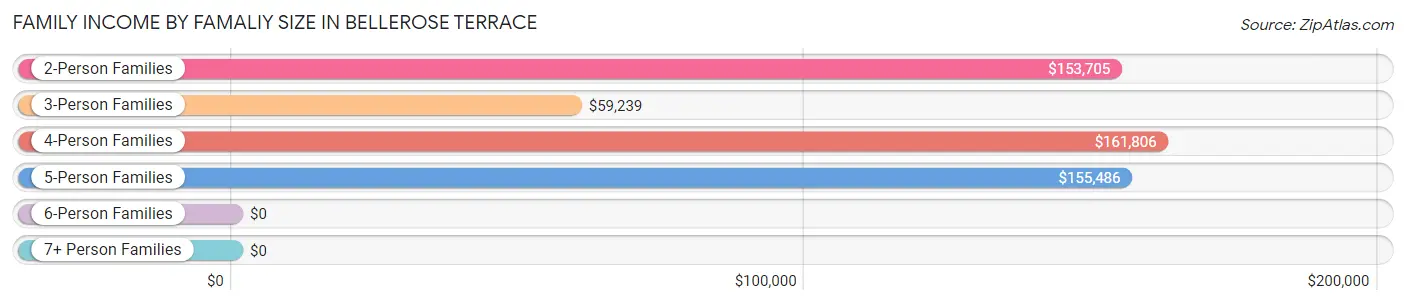
| Income Bracket | # Families | Median Income |
| 2-Person Families | 149 (23.9%) | $153,705 |
| 3-Person Families | 152 (24.4%) | $59,239 |
| 4-Person Families | 83 (13.3%) | $161,806 |
| 5-Person Families | 195 (31.3%) | $155,486 |
| 6-Person Families | 3 (0.5%) | $0 |
| 7+ Person Families | 41 (6.6%) | $0 |
| Total | 623 (100.0%) | $153,080 |
Family Income by Number of Earners in Bellerose Terrace
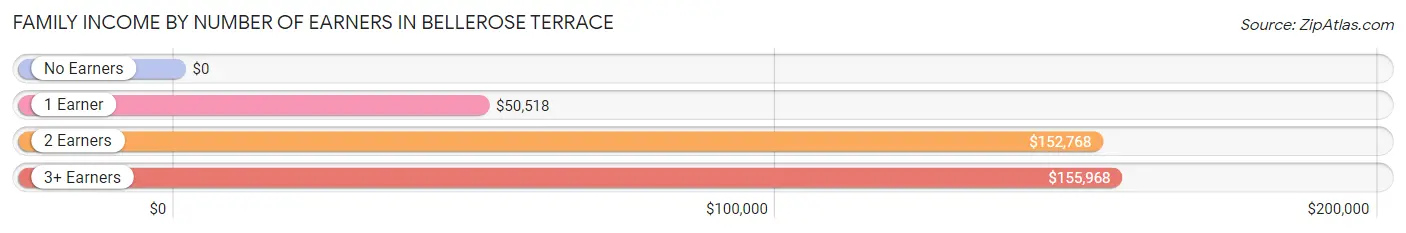
| Number of Earners | # Families | Median Income |
| No Earners | 24 (3.8%) | $0 |
| 1 Earner | 89 (14.3%) | $50,518 |
| 2 Earners | 270 (43.3%) | $152,768 |
| 3+ Earners | 240 (38.5%) | $155,968 |
| Total | 623 (100.0%) | $153,080 |
Household Income in Bellerose Terrace
Household Income Brackets in Bellerose Terrace
With 262 households falling in the category, the $150,000 to $199,999 income range is the most frequent in Bellerose Terrace, accounting for 38.0% of all households. In contrast, only 5 households (0.7%) fall into the $25,000 to $34,999 income bracket, making it the least populous group.
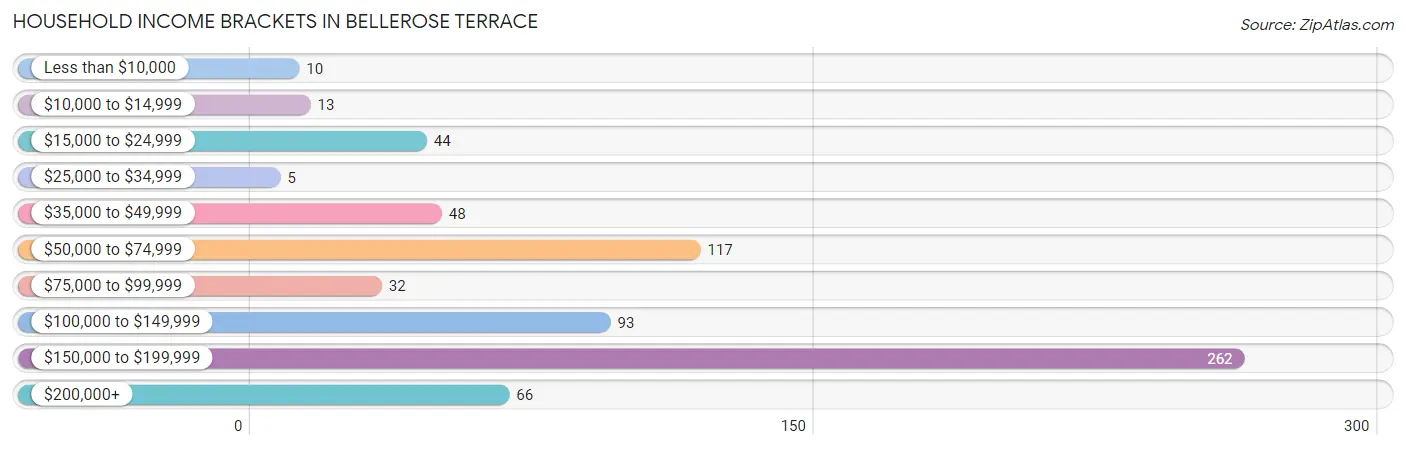
| Income Bracket | # Households | % Households |
| Less than $10,000 | 10 | 1.4% |
| $10,000 to $14,999 | 13 | 1.9% |
| $15,000 to $24,999 | 44 | 6.4% |
| $25,000 to $34,999 | 5 | 0.7% |
| $35,000 to $49,999 | 48 | 7.0% |
| $50,000 to $74,999 | 117 | 17.0% |
| $75,000 to $99,999 | 32 | 4.6% |
| $100,000 to $149,999 | 93 | 13.5% |
| $150,000 to $199,999 | 262 | 38.0% |
| $200,000+ | 66 | 9.6% |
Household Income by Householder Age in Bellerose Terrace
The median household income in Bellerose Terrace is $140,893, with the highest median household income of $160,556 found in the 25 to 44 years age bracket for the primary householder. A total of 122 households (17.7%) fall into this category.
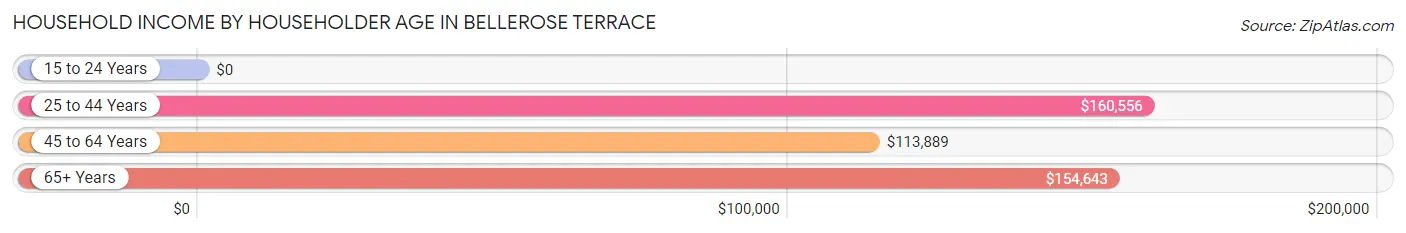
| Income Bracket | # Households | Median Income |
| 15 to 24 Years | 0 (0.0%) | $0 |
| 25 to 44 Years | 122 (17.7%) | $160,556 |
| 45 to 64 Years | 294 (42.6%) | $113,889 |
| 65+ Years | 274 (39.7%) | $154,643 |
| Total | 690 (100.0%) | $140,893 |
Poverty in Bellerose Terrace
Income Below Poverty by Sex and Age in Bellerose Terrace
With 3.3% poverty level for males and 1.3% for females among the residents of Bellerose Terrace, 45 to 54 year old males and 65 to 74 year old females are the most vulnerable to poverty, with 28 males (13.9%) and 13 females (6.6%) in their respective age groups living below the poverty level.
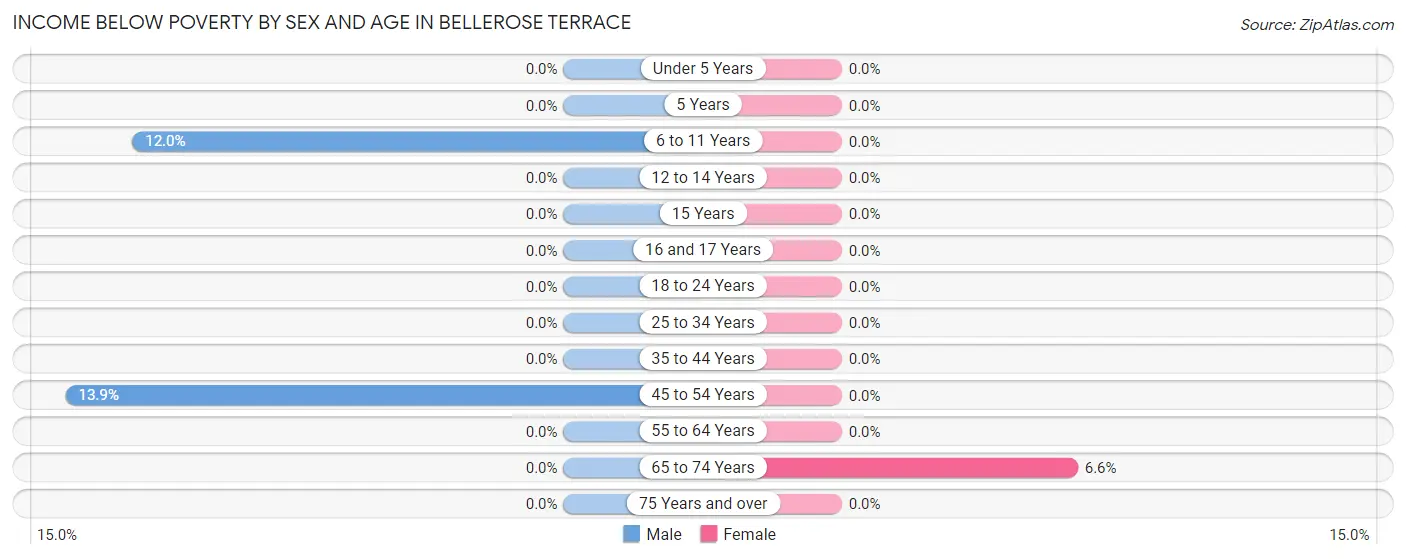
| Age Bracket | Male | Female |
| Under 5 Years | 0 (0.0%) | 0 (0.0%) |
| 5 Years | 0 (0.0%) | 0 (0.0%) |
| 6 to 11 Years | 9 (12.0%) | 0 (0.0%) |
| 12 to 14 Years | 0 (0.0%) | 0 (0.0%) |
| 15 Years | 0 (0.0%) | 0 (0.0%) |
| 16 and 17 Years | 0 (0.0%) | 0 (0.0%) |
| 18 to 24 Years | 0 (0.0%) | 0 (0.0%) |
| 25 to 34 Years | 0 (0.0%) | 0 (0.0%) |
| 35 to 44 Years | 0 (0.0%) | 0 (0.0%) |
| 45 to 54 Years | 28 (13.9%) | 0 (0.0%) |
| 55 to 64 Years | 0 (0.0%) | 0 (0.0%) |
| 65 to 74 Years | 0 (0.0%) | 13 (6.6%) |
| 75 Years and over | 0 (0.0%) | 0 (0.0%) |
| Total | 37 (3.3%) | 13 (1.3%) |
Income Above Poverty by Sex and Age in Bellerose Terrace
According to the poverty statistics in Bellerose Terrace, males aged under 5 years and females aged under 5 years are the age groups that are most secure financially, with 100.0% of males and 100.0% of females in these age groups living above the poverty line.
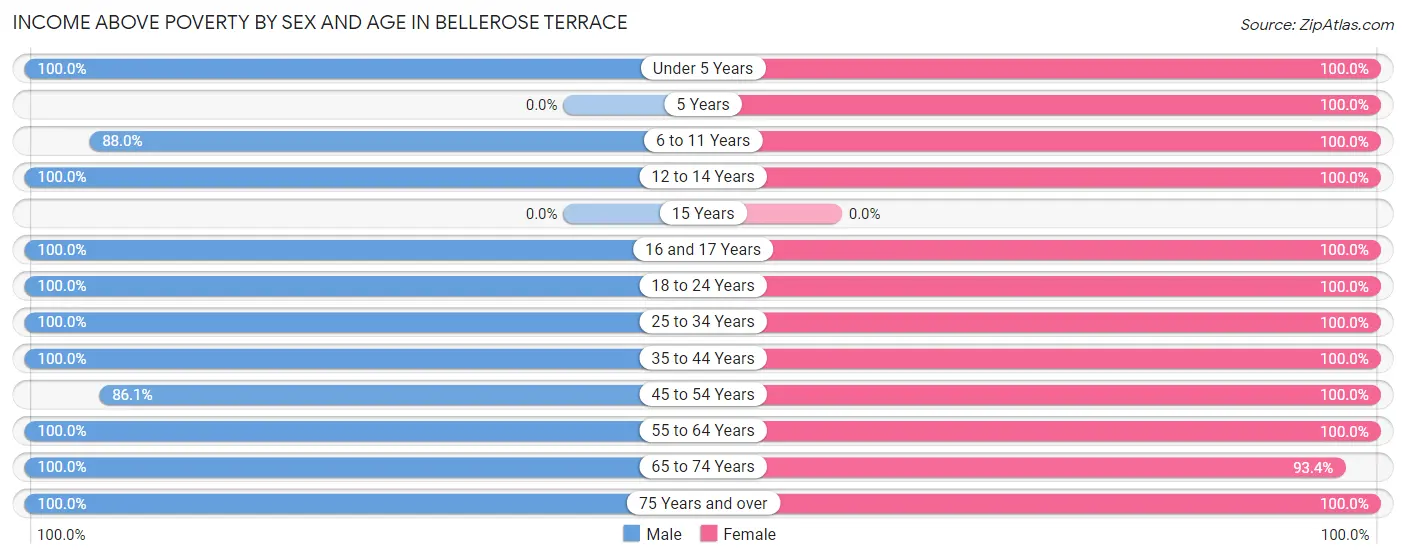
| Age Bracket | Male | Female |
| Under 5 Years | 50 (100.0%) | 13 (100.0%) |
| 5 Years | 0 (0.0%) | 12 (100.0%) |
| 6 to 11 Years | 66 (88.0%) | 43 (100.0%) |
| 12 to 14 Years | 45 (100.0%) | 56 (100.0%) |
| 15 Years | 0 (0.0%) | 0 (0.0%) |
| 16 and 17 Years | 20 (100.0%) | 32 (100.0%) |
| 18 to 24 Years | 127 (100.0%) | 88 (100.0%) |
| 25 to 34 Years | 232 (100.0%) | 91 (100.0%) |
| 35 to 44 Years | 62 (100.0%) | 110 (100.0%) |
| 45 to 54 Years | 174 (86.1%) | 169 (100.0%) |
| 55 to 64 Years | 136 (100.0%) | 156 (100.0%) |
| 65 to 74 Years | 154 (100.0%) | 185 (93.4%) |
| 75 Years and over | 29 (100.0%) | 35 (100.0%) |
| Total | 1,095 (96.7%) | 990 (98.7%) |
Income Below Poverty Among Married-Couple Families in Bellerose Terrace
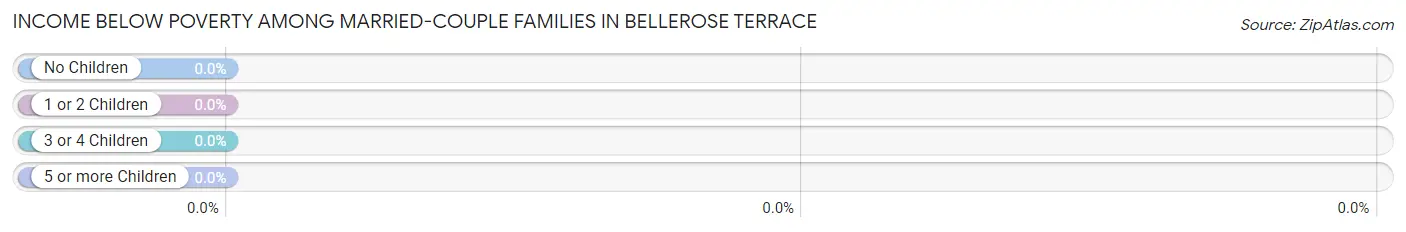
| Children | Above Poverty | Below Poverty |
| No Children | 273 (100.0%) | 0 (0.0%) |
| 1 or 2 Children | 125 (100.0%) | 0 (0.0%) |
| 3 or 4 Children | 12 (100.0%) | 0 (0.0%) |
| 5 or more Children | 0 (0.0%) | 0 (0.0%) |
| Total | 410 (100.0%) | 0 (0.0%) |
Income Below Poverty Among Single-Parent Households in Bellerose Terrace
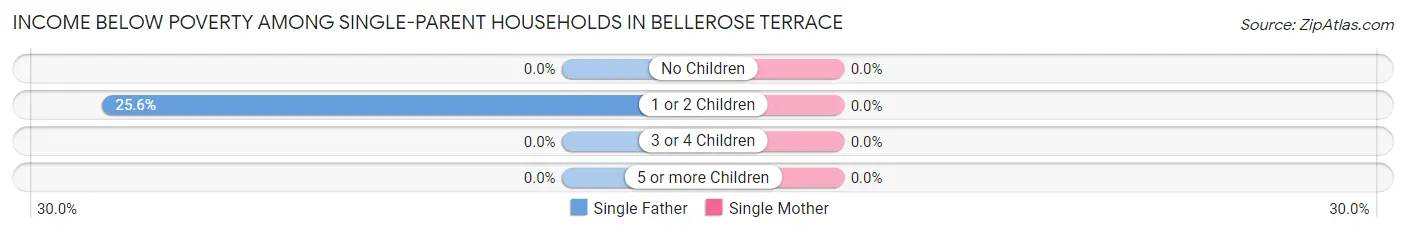
| Children | Single Father | Single Mother |
| No Children | 0 (0.0%) | 0 (0.0%) |
| 1 or 2 Children | 10 (25.6%) | 0 (0.0%) |
| 3 or 4 Children | 0 (0.0%) | 0 (0.0%) |
| 5 or more Children | 0 (0.0%) | 0 (0.0%) |
| Total | 10 (22.2%) | 0 (0.0%) |
Income Below Poverty Among Married-Couple vs Single-Parent Households in Bellerose Terrace
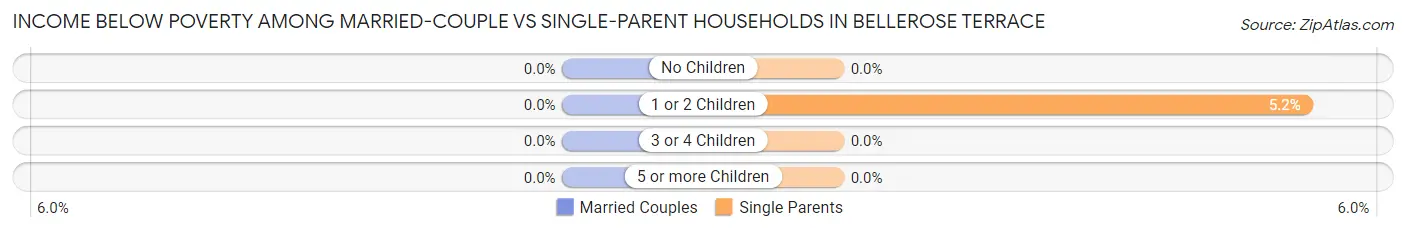
| Children | Married-Couple Families | Single-Parent Households |
| No Children | 0 (0.0%) | 0 (0.0%) |
| 1 or 2 Children | 0 (0.0%) | 10 (5.2%) |
| 3 or 4 Children | 0 (0.0%) | 0 (0.0%) |
| 5 or more Children | 0 (0.0%) | 0 (0.0%) |
| Total | 0 (0.0%) | 10 (4.7%) |
Race in Bellerose Terrace
The most populous races in Bellerose Terrace are Asian (1,043 | 48.8%), Hispanic or Latino (478 | 22.4%), and Some other Race (416 | 19.5%).
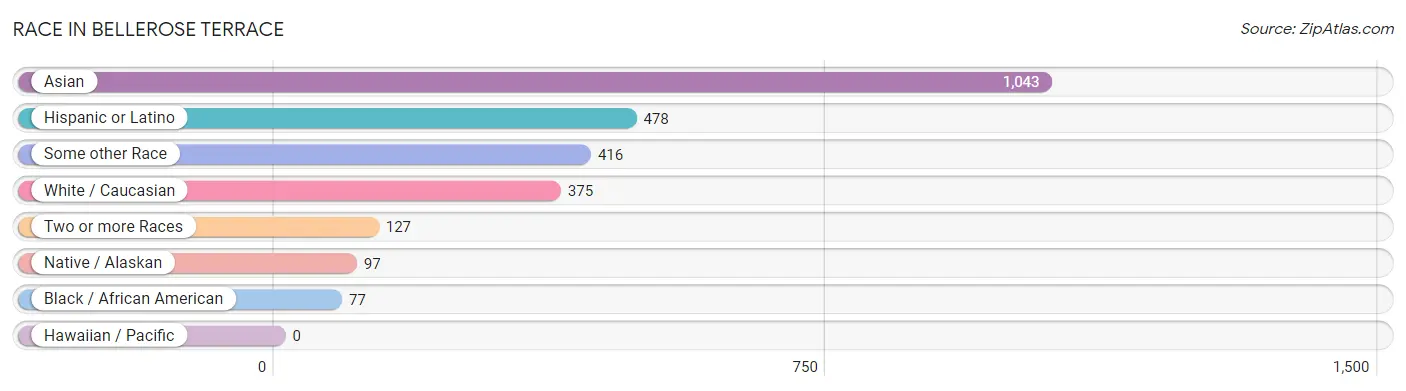
| Race | # Population | % Population |
| Asian | 1,043 | 48.8% |
| Black / African American | 77 | 3.6% |
| Hawaiian / Pacific | 0 | 0.0% |
| Hispanic or Latino | 478 | 22.4% |
| Native / Alaskan | 97 | 4.5% |
| White / Caucasian | 375 | 17.6% |
| Two or more Races | 127 | 5.9% |
| Some other Race | 416 | 19.5% |
| Total | 2,135 | 100.0% |
Ancestry in Bellerose Terrace
The most populous ancestries reported in Bellerose Terrace are Thai (347 | 16.3%), South American (227 | 10.6%), Indian (Asian) (196 | 9.2%), Colombian (182 | 8.5%), and Guyanese (139 | 6.5%), together accounting for 51.1% of all Bellerose Terrace residents.
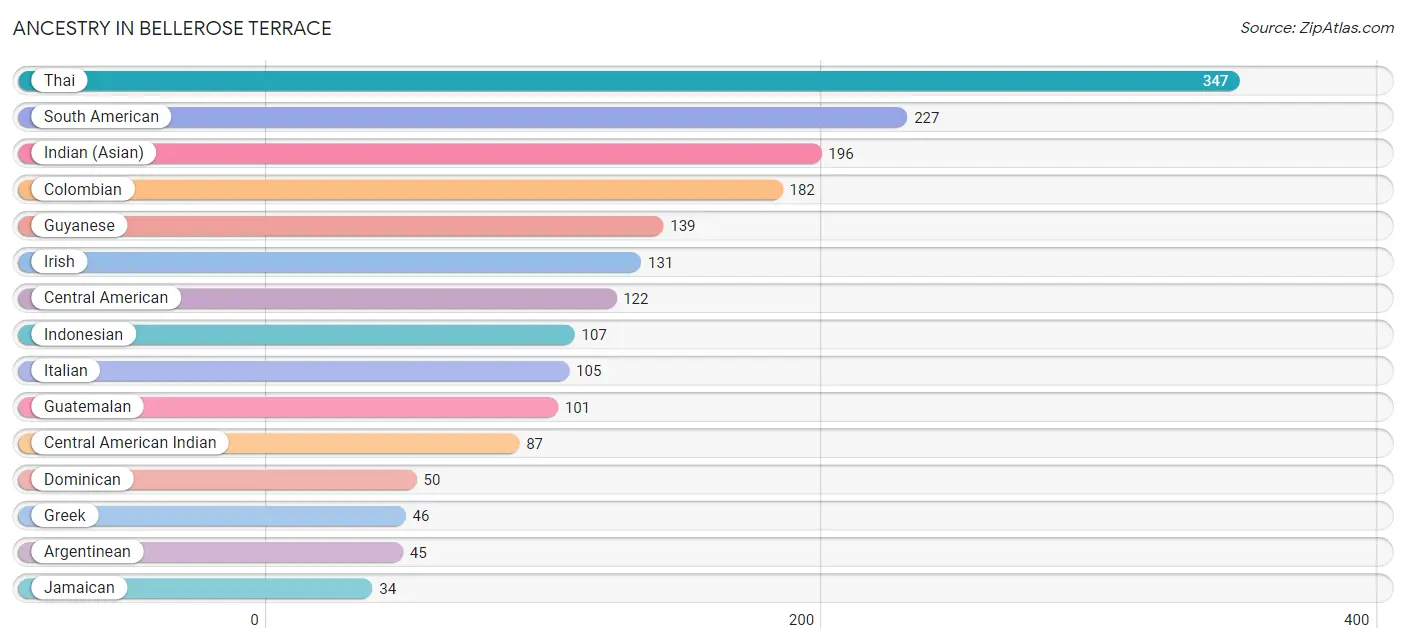
| Ancestry | # Population | % Population |
| American | 22 | 1.0% |
| Arab | 19 | 0.9% |
| Argentinean | 45 | 2.1% |
| Austrian | 3 | 0.1% |
| Central American | 122 | 5.7% |
| Central American Indian | 87 | 4.1% |
| Colombian | 182 | 8.5% |
| Dominican | 50 | 2.3% |
| French | 10 | 0.5% |
| German | 12 | 0.6% |
| Greek | 46 | 2.1% |
| Guatemalan | 101 | 4.7% |
| Guyanese | 139 | 6.5% |
| Indian (Asian) | 196 | 9.2% |
| Indonesian | 107 | 5.0% |
| Irish | 131 | 6.1% |
| Italian | 105 | 4.9% |
| Jamaican | 34 | 1.6% |
| Korean | 26 | 1.2% |
| Mexican | 30 | 1.4% |
| Moroccan | 19 | 0.9% |
| Polish | 4 | 0.2% |
| Puerto Rican | 24 | 1.1% |
| Salvadoran | 21 | 1.0% |
| South American | 227 | 10.6% |
| Spaniard | 12 | 0.6% |
| Thai | 347 | 16.3% | View All 27 Rows |
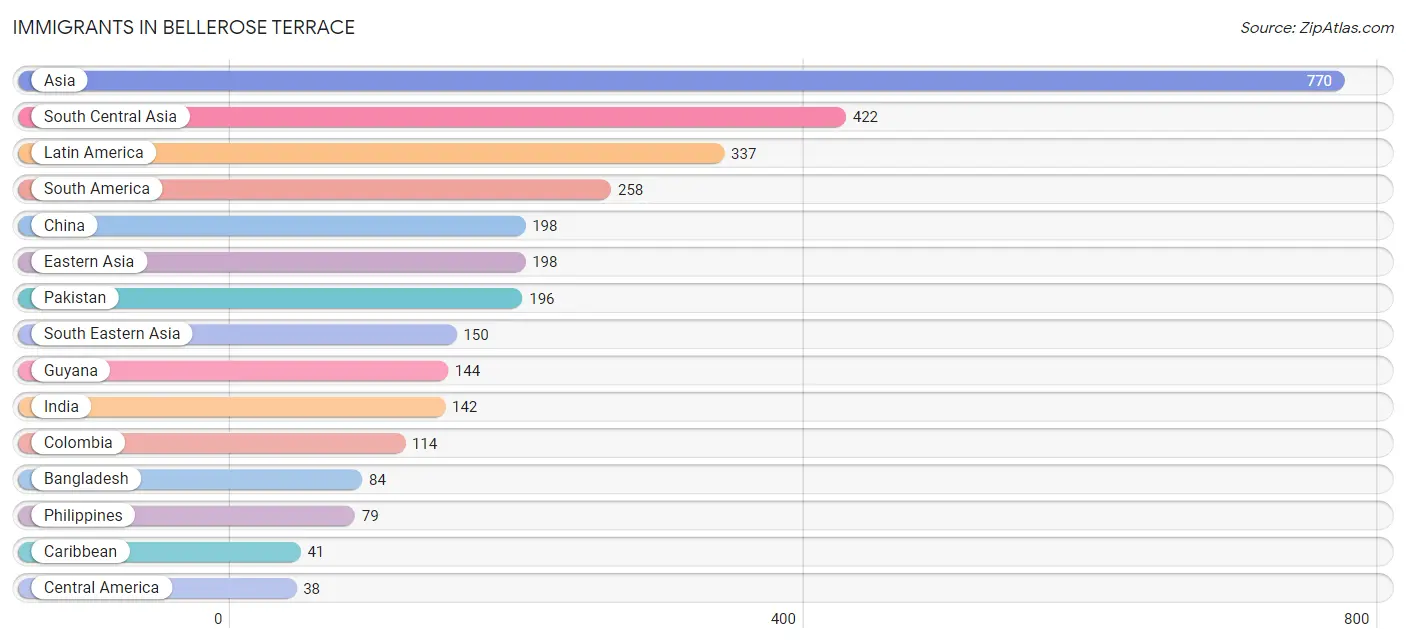
Immigrants in Bellerose Terrace
The most numerous immigrant groups reported in Bellerose Terrace came from Asia (770 | 36.1%), South Central Asia (422 | 19.8%), Latin America (337 | 15.8%), South America (258 | 12.1%), and China (198 | 9.3%), together accounting for 93.0% of all Bellerose Terrace residents.
| Immigration Origin | # Population | % Population |
| Africa | 19 | 0.9% |
| Asia | 770 | 36.1% |
| Bangladesh | 84 | 3.9% |
| Caribbean | 41 | 1.9% |
| Central America | 38 | 1.8% |
| China | 198 | 9.3% |
| Colombia | 114 | 5.3% |
| Dominican Republic | 21 | 1.0% |
| Eastern Asia | 198 | 9.3% |
| El Salvador | 4 | 0.2% |
| Europe | 33 | 1.5% |
| Greece | 4 | 0.2% |
| Guatemala | 24 | 1.1% |
| Guyana | 144 | 6.7% |
| India | 142 | 6.7% |
| Ireland | 29 | 1.4% |
| Jamaica | 20 | 0.9% |
| Latin America | 337 | 15.8% |
| Mexico | 10 | 0.5% |
| Morocco | 19 | 0.9% |
| Northern Africa | 19 | 0.9% |
| Northern Europe | 29 | 1.4% |
| Pakistan | 196 | 9.2% |
| Philippines | 79 | 3.7% |
| South America | 258 | 12.1% |
| South Central Asia | 422 | 19.8% |
| South Eastern Asia | 150 | 7.0% |
| Southern Europe | 4 | 0.2% | View All 28 Rows |
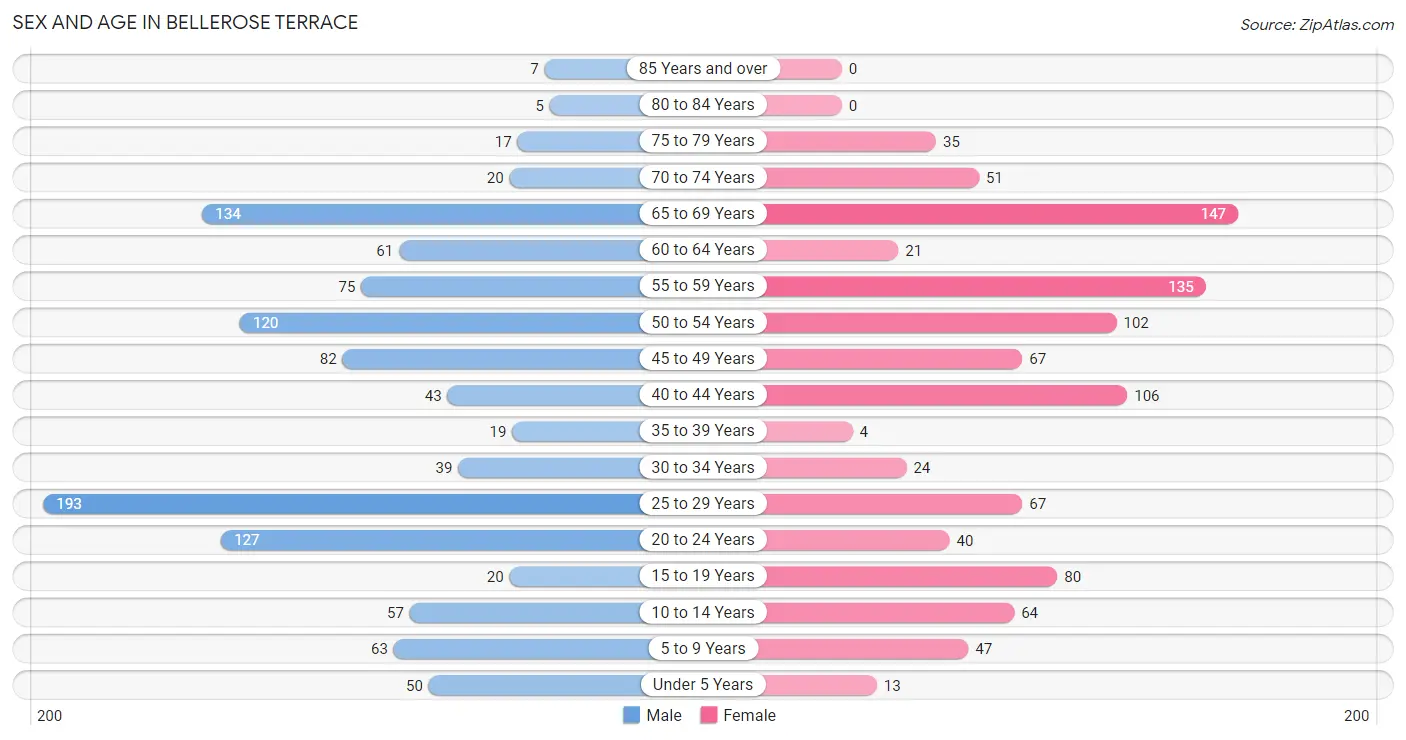
Sex and Age in Bellerose Terrace
Sex and Age in Bellerose Terrace
The most populous age groups in Bellerose Terrace are 25 to 29 Years (193 | 17.1%) for men and 65 to 69 Years (147 | 14.7%) for women.
| Age Bracket | Male | Female |
| Under 5 Years | 50 (4.4%) | 13 (1.3%) |
| 5 to 9 Years | 63 (5.6%) | 47 (4.7%) |
| 10 to 14 Years | 57 (5.0%) | 64 (6.4%) |
| 15 to 19 Years | 20 (1.8%) | 80 (8.0%) |
| 20 to 24 Years | 127 (11.2%) | 40 (4.0%) |
| 25 to 29 Years | 193 (17.1%) | 67 (6.7%) |
| 30 to 34 Years | 39 (3.5%) | 24 (2.4%) |
| 35 to 39 Years | 19 (1.7%) | 4 (0.4%) |
| 40 to 44 Years | 43 (3.8%) | 106 (10.6%) |
| 45 to 49 Years | 82 (7.2%) | 67 (6.7%) |
| 50 to 54 Years | 120 (10.6%) | 102 (10.2%) |
| 55 to 59 Years | 75 (6.6%) | 135 (13.5%) |
| 60 to 64 Years | 61 (5.4%) | 21 (2.1%) |
| 65 to 69 Years | 134 (11.8%) | 147 (14.7%) |
| 70 to 74 Years | 20 (1.8%) | 51 (5.1%) |
| 75 to 79 Years | 17 (1.5%) | 35 (3.5%) |
| 80 to 84 Years | 5 (0.4%) | 0 (0.0%) |
| 85 Years and over | 7 (0.6%) | 0 (0.0%) |
| Total | 1,132 (100.0%) | 1,003 (100.0%) |
Families and Households in Bellerose Terrace
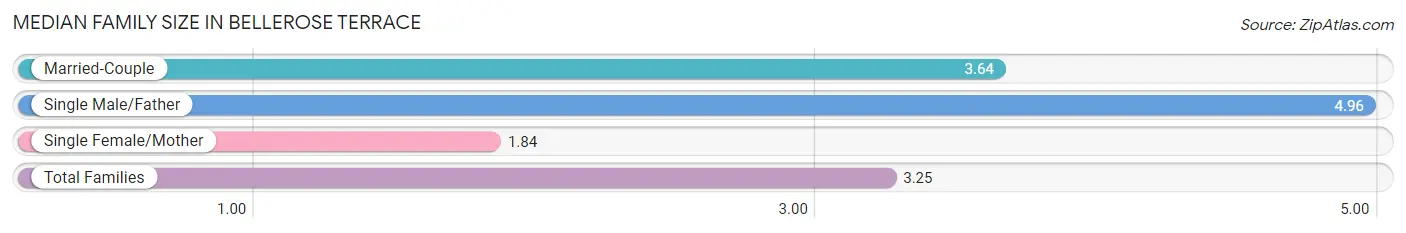
Median Family Size in Bellerose Terrace
The median family size in Bellerose Terrace is 3.25 persons per family, with single male/father families (45 | 7.2%) accounting for the largest median family size of 4.96 persons per family. On the other hand, single female/mother families (168 | 27.0%) represent the smallest median family size with 1.84 persons per family.
| Family Type | # Families | Family Size |
| Married-Couple | 410 (65.8%) | 3.64 |
| Single Male/Father | 45 (7.2%) | 4.96 |
| Single Female/Mother | 168 (27.0%) | 1.84 |
| Total Families | 623 (100.0%) | 3.25 |
Median Household Size in Bellerose Terrace
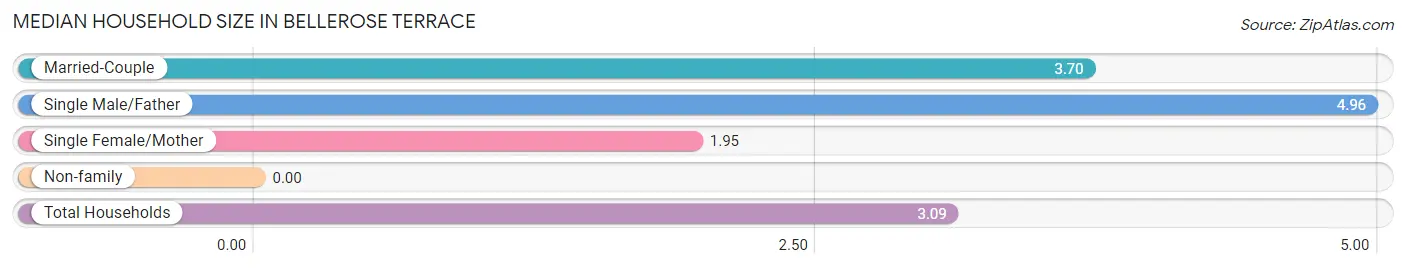
| Household Type | # Households | Household Size |
| Married-Couple | 410 (59.4%) | 3.70 |
| Single Male/Father | 45 (6.5%) | 4.96 |
| Single Female/Mother | 168 (24.3%) | 1.95 |
| Non-family | 67 (9.7%) | - |
| Total Households | 690 (100.0%) | 3.09 |
Household Size by Marriage Status in Bellerose Terrace
Out of a total of 690 households in Bellerose Terrace, 623 (90.3%) are family households, while 67 (9.7%) are nonfamily households. The most numerous type of family households are 5-person households, comprising 211, and the most common type of nonfamily households are 1-person households, comprising 67.
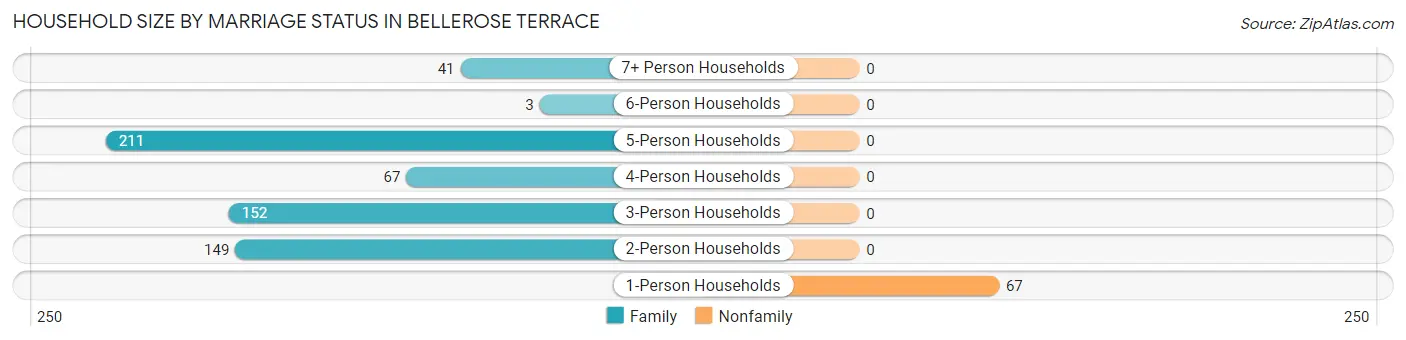
| Household Size | Family Households | Nonfamily Households |
| 1-Person Households | - | 67 (9.7%) |
| 2-Person Households | 149 (21.6%) | 0 (0.0%) |
| 3-Person Households | 152 (22.0%) | 0 (0.0%) |
| 4-Person Households | 67 (9.7%) | 0 (0.0%) |
| 5-Person Households | 211 (30.6%) | 0 (0.0%) |
| 6-Person Households | 3 (0.4%) | 0 (0.0%) |
| 7+ Person Households | 41 (5.9%) | 0 (0.0%) |
| Total | 623 (90.3%) | 67 (9.7%) |
Female Fertility in Bellerose Terrace
Fertility by Age in Bellerose Terrace
Average fertility rate in Bellerose Terrace is 39.0 births per 1,000 women. Women in the age bracket of 20 to 34 years have the highest fertility rate with 92.0 births per 1,000 women. Women in the age bracket of 20 to 34 years acount for 80.0% of all women with births.
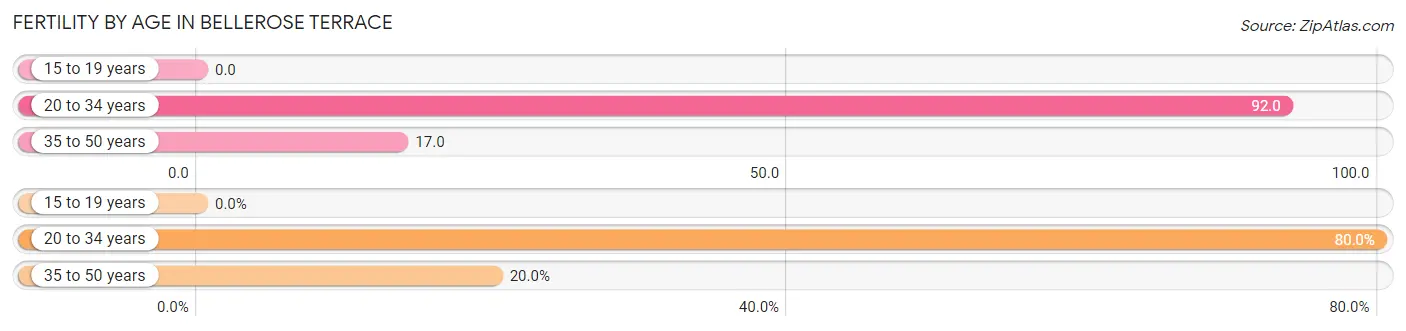
| Age Bracket | Women with Births | Births / 1,000 Women |
| 15 to 19 years | 0 (0.0%) | 0.0 |
| 20 to 34 years | 12 (80.0%) | 92.0 |
| 35 to 50 years | 3 (20.0%) | 17.0 |
| Total | 15 (100.0%) | 39.0 |
Fertility by Age by Marriage Status in Bellerose Terrace
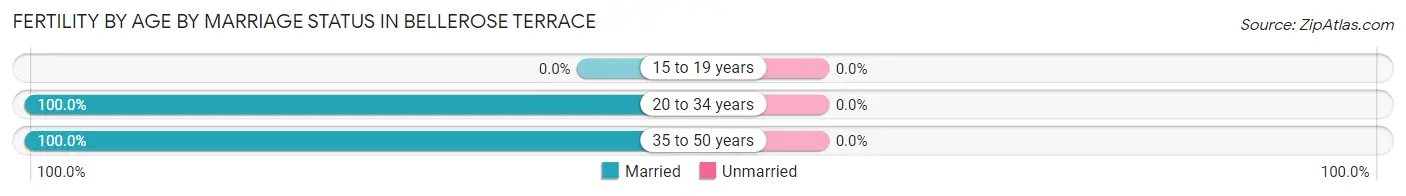
| Age Bracket | Married | Unmarried |
| 15 to 19 years | 0 (0.0%) | 0 (0.0%) |
| 20 to 34 years | 12 (100.0%) | 0 (0.0%) |
| 35 to 50 years | 3 (100.0%) | 0 (0.0%) |
| Total | 15 (100.0%) | 0 (0.0%) |
Fertility by Education in Bellerose Terrace
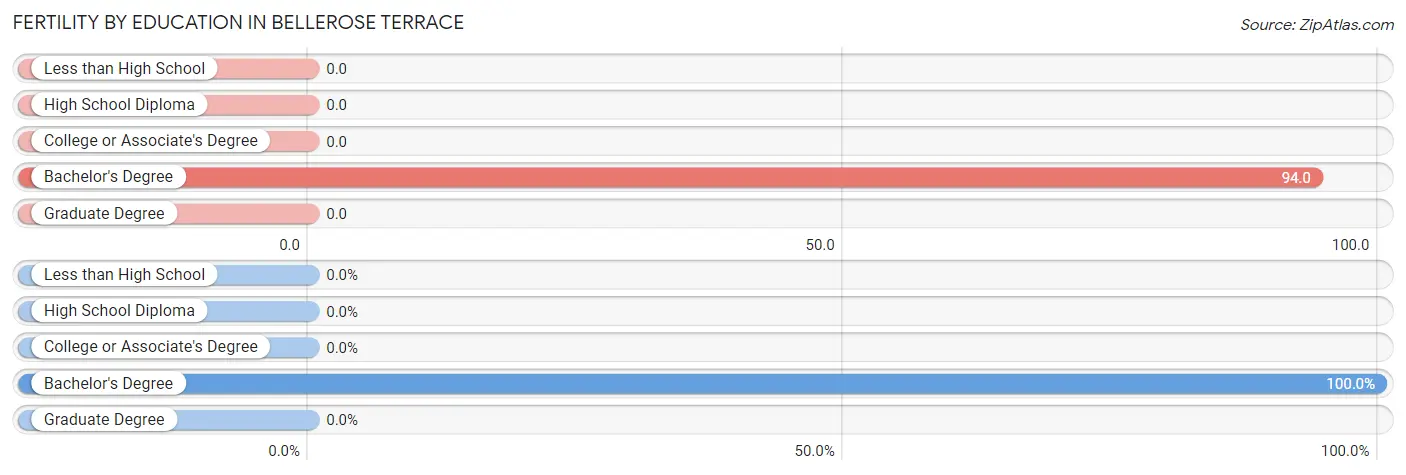
| Educational Attainment | Women with Births | Births / 1,000 Women |
| Less than High School | 0 (0.0%) | 0.0 |
| High School Diploma | 0 (0.0%) | 0.0 |
| College or Associate's Degree | 0 (0.0%) | 0.0 |
| Bachelor's Degree | 15 (100.0%) | 94.0 |
| Graduate Degree | 0 (0.0%) | 0.0 |
| Total | 15 (100.0%) | 39.0 |
Fertility by Education by Marriage Status in Bellerose Terrace
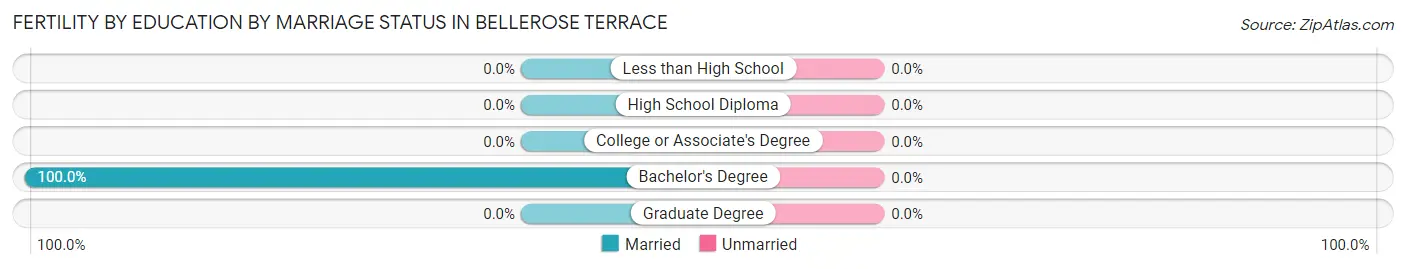
| Educational Attainment | Married | Unmarried |
| Less than High School | 0 (0.0%) | 0 (0.0%) |
| High School Diploma | 0 (0.0%) | 0 (0.0%) |
| College or Associate's Degree | 0 (0.0%) | 0 (0.0%) |
| Bachelor's Degree | 15 (100.0%) | 0 (0.0%) |
| Graduate Degree | 0 (0.0%) | 0 (0.0%) |
| Total | 15 (100.0%) | 0 (0.0%) |
Employment Characteristics in Bellerose Terrace
Employment by Class of Employer in Bellerose Terrace
Among the 1,090 employed individuals in Bellerose Terrace, private company employees (748 | 68.6%), not-for-profit organizations (134 | 12.3%), and local government employees (65 | 6.0%) make up the most common classes of employment.
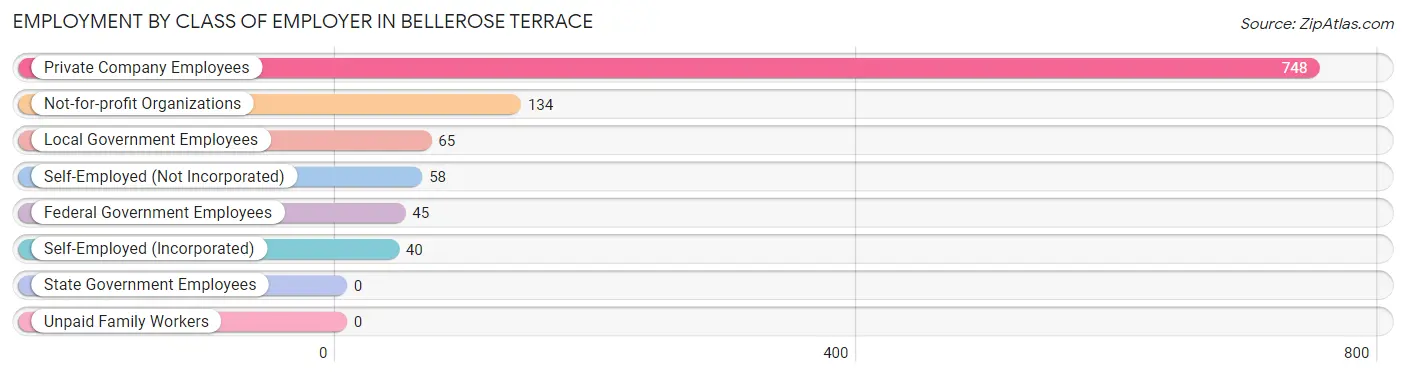
| Employer Class | # Employees | % Employees |
| Private Company Employees | 748 | 68.6% |
| Self-Employed (Incorporated) | 40 | 3.7% |
| Self-Employed (Not Incorporated) | 58 | 5.3% |
| Not-for-profit Organizations | 134 | 12.3% |
| Local Government Employees | 65 | 6.0% |
| State Government Employees | 0 | 0.0% |
| Federal Government Employees | 45 | 4.1% |
| Unpaid Family Workers | 0 | 0.0% |
| Total | 1,090 | 100.0% |
Employment Status by Age in Bellerose Terrace
According to the labor force statistics for Bellerose Terrace, out of the total population over 16 years of age (1,841), 68.7% or 1,265 individuals are in the labor force, with 11.6% or 147 of them unemployed. The age group with the highest labor force participation rate is 25 to 29 years, with 98.1% or 255 individuals in the labor force. Within the labor force, the 65 to 74 years age range has the highest percentage of unemployed individuals, with 64.0% or 121 of them being unemployed.
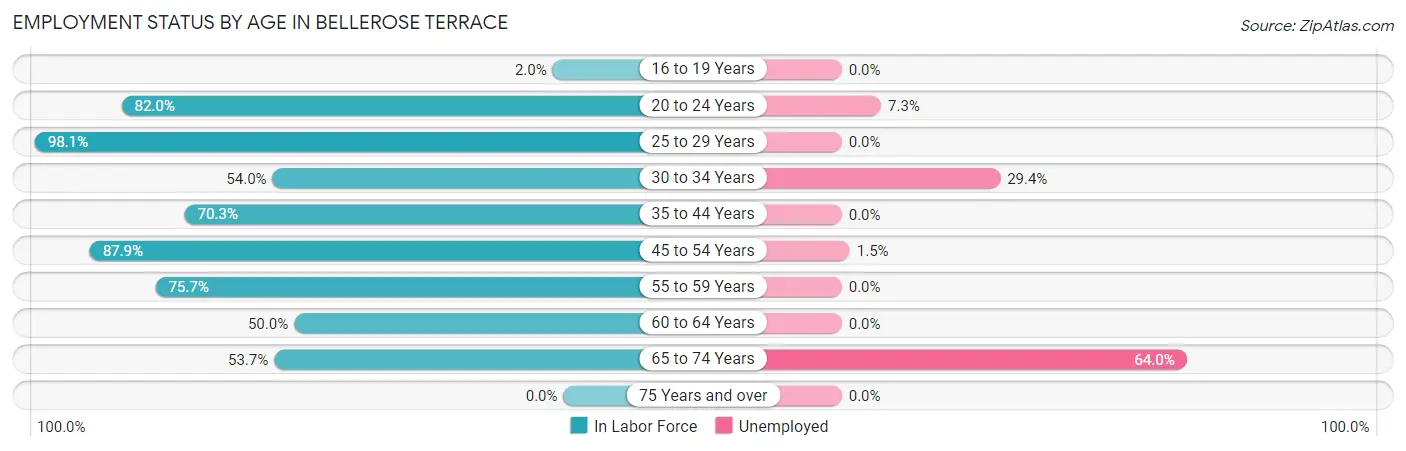
| Age Bracket | In Labor Force | Unemployed |
| 16 to 19 Years | 2 (2.0%) | 0 (0.0%) |
| 20 to 24 Years | 137 (82.0%) | 10 (7.3%) |
| 25 to 29 Years | 255 (98.1%) | 0 (0.0%) |
| 30 to 34 Years | 34 (54.0%) | 10 (29.4%) |
| 35 to 44 Years | 121 (70.3%) | 0 (0.0%) |
| 45 to 54 Years | 326 (87.9%) | 5 (1.5%) |
| 55 to 59 Years | 159 (75.7%) | 0 (0.0%) |
| 60 to 64 Years | 41 (50.0%) | 0 (0.0%) |
| 65 to 74 Years | 189 (53.7%) | 121 (64.0%) |
| 75 Years and over | 0 (0.0%) | 0 (0.0%) |
| Total | 1,265 (68.7%) | 147 (11.6%) |
Employment Status by Educational Attainment in Bellerose Terrace
According to labor force statistics for Bellerose Terrace, 80.8% of individuals (936) out of the total population between 25 and 64 years of age (1,158) are in the labor force, with 1.6% or 15 of them being unemployed. The group with the highest labor force participation rate are those with the educational attainment of bachelor's degree or higher, with 97.8% or 437 individuals in the labor force. Within the labor force, individuals with bachelor's degree or higher education have the highest percentage of unemployment, with 2.3% or 10 of them being unemployed.
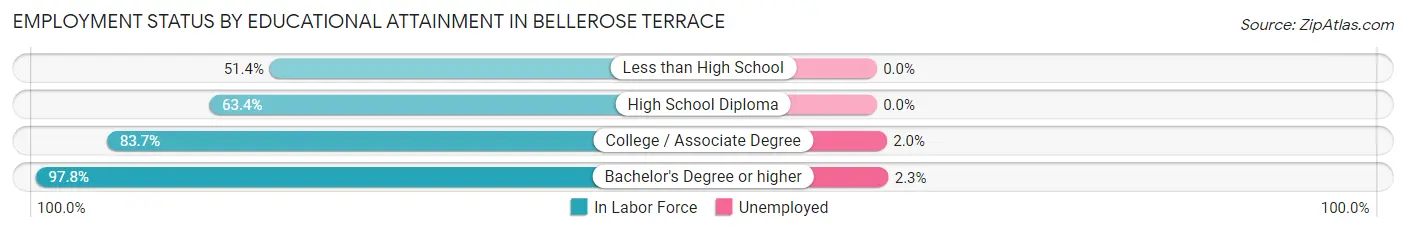
| Educational Attainment | In Labor Force | Unemployed |
| Less than High School | 54 (51.4%) | 0 (0.0%) |
| High School Diploma | 194 (63.4%) | 0 (0.0%) |
| College / Associate Degree | 251 (83.7%) | 6 (2.0%) |
| Bachelor's Degree or higher | 437 (97.8%) | 10 (2.3%) |
| Total | 936 (80.8%) | 19 (1.6%) |
Employment Occupations by Sex in Bellerose Terrace
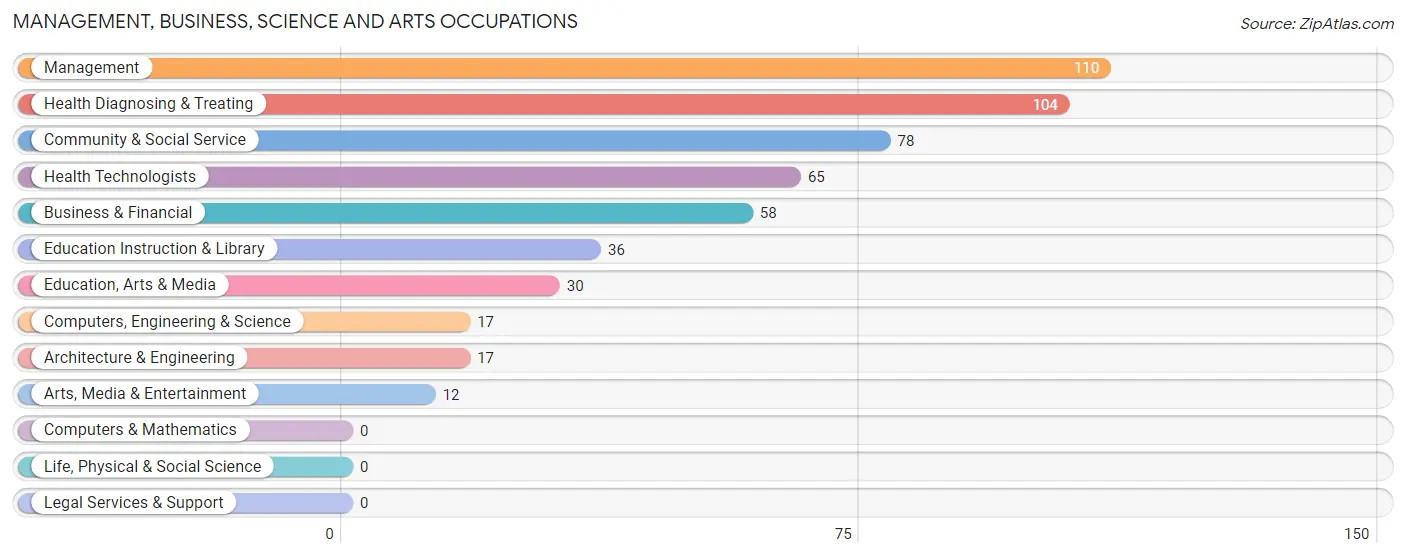
Management, Business, Science and Arts Occupations
The most common Management, Business, Science and Arts occupations in Bellerose Terrace are Management (110 | 9.8%), Health Diagnosing & Treating (104 | 9.3%), Community & Social Service (78 | 7.0%), Health Technologists (65 | 5.8%), and Business & Financial (58 | 5.2%).
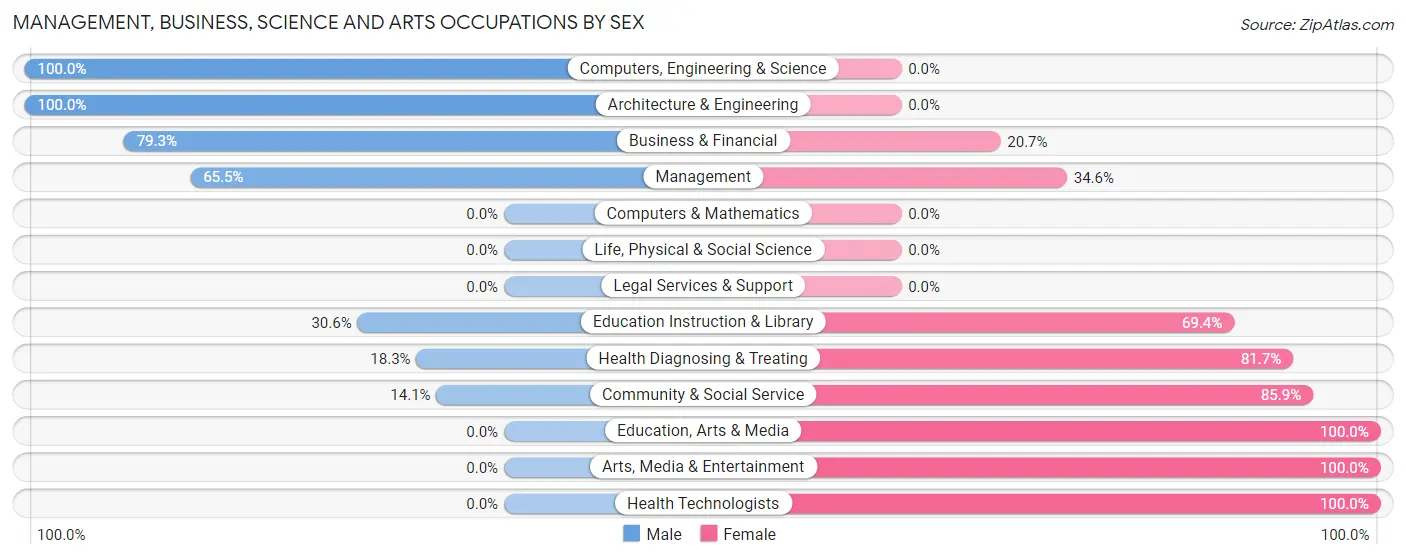
Management, Business, Science and Arts Occupations by Sex
Within the Management, Business, Science and Arts occupations in Bellerose Terrace, the most male-oriented occupations are Computers, Engineering & Science (100.0%), Architecture & Engineering (100.0%), and Business & Financial (79.3%), while the most female-oriented occupations are Education, Arts & Media (100.0%), Arts, Media & Entertainment (100.0%), and Health Technologists (100.0%).
| Occupation | Male | Female |
| Management | 72 (65.4%) | 38 (34.5%) |
| Business & Financial | 46 (79.3%) | 12 (20.7%) |
| Computers, Engineering & Science | 17 (100.0%) | 0 (0.0%) |
| Computers & Mathematics | 0 (0.0%) | 0 (0.0%) |
| Architecture & Engineering | 17 (100.0%) | 0 (0.0%) |
| Life, Physical & Social Science | 0 (0.0%) | 0 (0.0%) |
| Community & Social Service | 11 (14.1%) | 67 (85.9%) |
| Education, Arts & Media | 0 (0.0%) | 30 (100.0%) |
| Legal Services & Support | 0 (0.0%) | 0 (0.0%) |
| Education Instruction & Library | 11 (30.6%) | 25 (69.4%) |
| Arts, Media & Entertainment | 0 (0.0%) | 12 (100.0%) |
| Health Diagnosing & Treating | 19 (18.3%) | 85 (81.7%) |
| Health Technologists | 0 (0.0%) | 65 (100.0%) |
| Total (Category) | 165 (45.0%) | 202 (55.0%) |
| Total (Overall) | 720 (64.4%) | 398 (35.6%) |
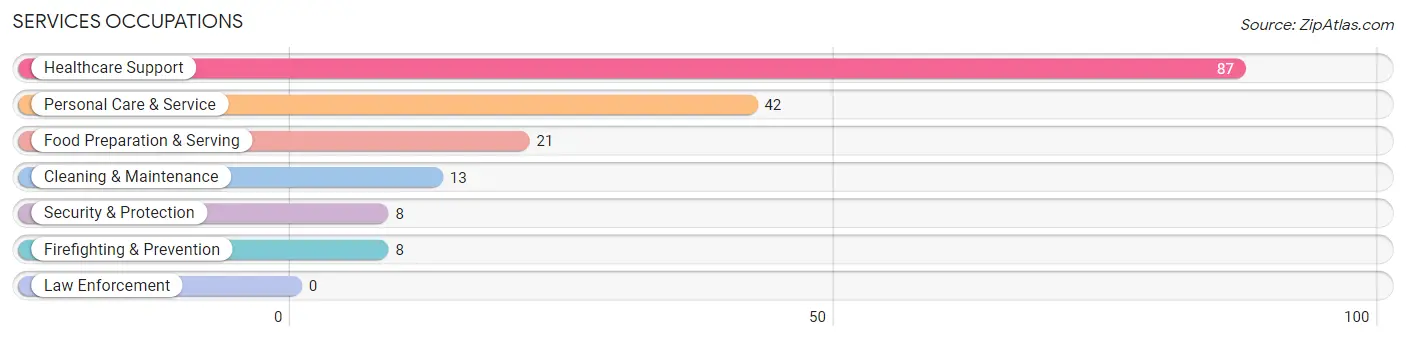
Services Occupations
The most common Services occupations in Bellerose Terrace are Healthcare Support (87 | 7.8%), Personal Care & Service (42 | 3.8%), Food Preparation & Serving (21 | 1.9%), Cleaning & Maintenance (13 | 1.2%), and Security & Protection (8 | 0.7%).
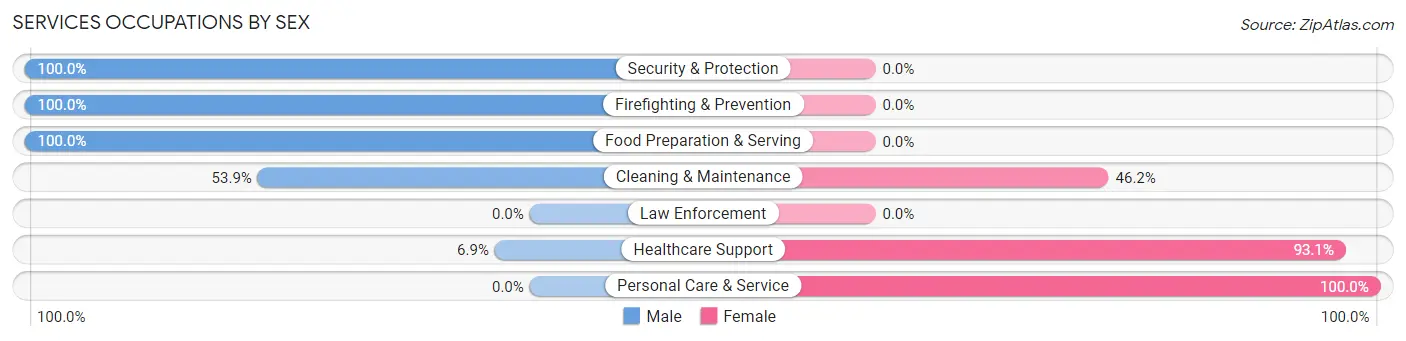
Services Occupations by Sex
Within the Services occupations in Bellerose Terrace, the most male-oriented occupations are Security & Protection (100.0%), Firefighting & Prevention (100.0%), and Food Preparation & Serving (100.0%), while the most female-oriented occupations are Personal Care & Service (100.0%), Healthcare Support (93.1%), and Cleaning & Maintenance (46.2%).
| Occupation | Male | Female |
| Healthcare Support | 6 (6.9%) | 81 (93.1%) |
| Security & Protection | 8 (100.0%) | 0 (0.0%) |
| Firefighting & Prevention | 8 (100.0%) | 0 (0.0%) |
| Law Enforcement | 0 (0.0%) | 0 (0.0%) |
| Food Preparation & Serving | 21 (100.0%) | 0 (0.0%) |
| Cleaning & Maintenance | 7 (53.8%) | 6 (46.2%) |
| Personal Care & Service | 0 (0.0%) | 42 (100.0%) |
| Total (Category) | 42 (24.6%) | 129 (75.4%) |
| Total (Overall) | 720 (64.4%) | 398 (35.6%) |
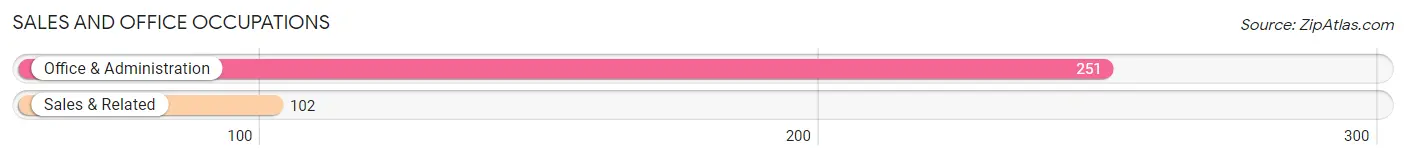
Sales and Office Occupations
The most common Sales and Office occupations in Bellerose Terrace are Office & Administration (251 | 22.5%), and Sales & Related (102 | 9.1%).
Sales and Office Occupations by Sex
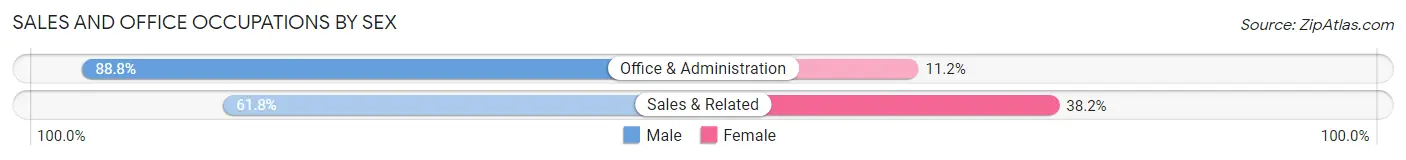
| Occupation | Male | Female |
| Sales & Related | 63 (61.8%) | 39 (38.2%) |
| Office & Administration | 223 (88.8%) | 28 (11.2%) |
| Total (Category) | 286 (81.0%) | 67 (19.0%) |
| Total (Overall) | 720 (64.4%) | 398 (35.6%) |
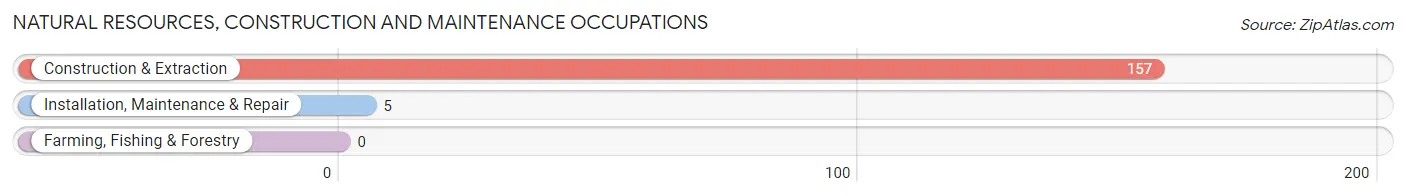
Natural Resources, Construction and Maintenance Occupations
The most common Natural Resources, Construction and Maintenance occupations in Bellerose Terrace are Construction & Extraction (157 | 14.0%), and Installation, Maintenance & Repair (5 | 0.4%).
Natural Resources, Construction and Maintenance Occupations by Sex
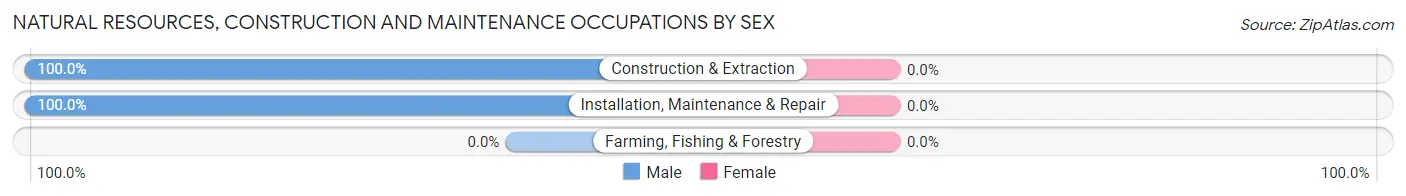
| Occupation | Male | Female |
| Farming, Fishing & Forestry | 0 (0.0%) | 0 (0.0%) |
| Construction & Extraction | 157 (100.0%) | 0 (0.0%) |
| Installation, Maintenance & Repair | 5 (100.0%) | 0 (0.0%) |
| Total (Category) | 162 (100.0%) | 0 (0.0%) |
| Total (Overall) | 720 (64.4%) | 398 (35.6%) |
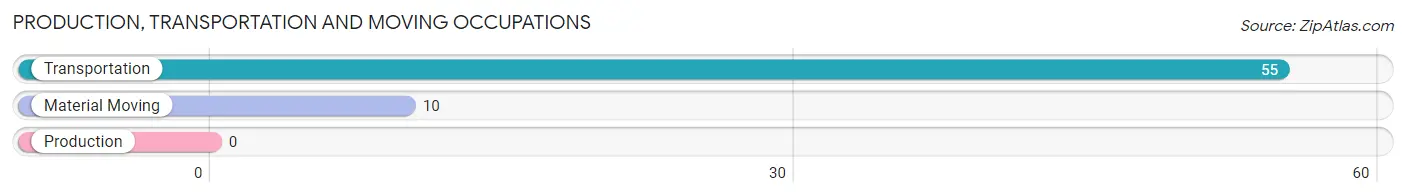
Production, Transportation and Moving Occupations
The most common Production, Transportation and Moving occupations in Bellerose Terrace are Transportation (55 | 4.9%), and Material Moving (10 | 0.9%).
Production, Transportation and Moving Occupations by Sex
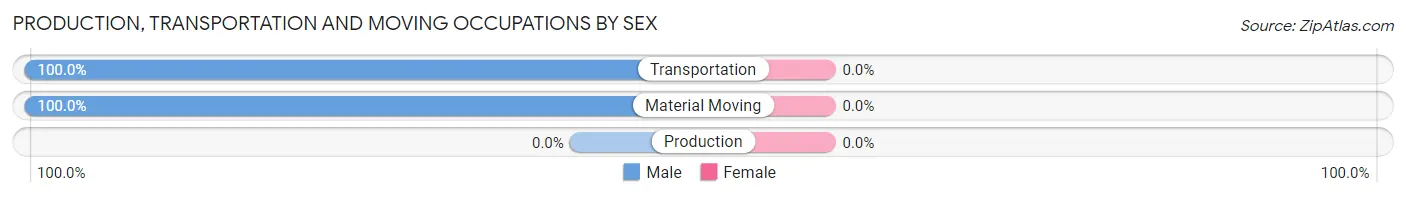
| Occupation | Male | Female |
| Production | 0 (0.0%) | 0 (0.0%) |
| Transportation | 55 (100.0%) | 0 (0.0%) |
| Material Moving | 10 (100.0%) | 0 (0.0%) |
| Total (Category) | 65 (100.0%) | 0 (0.0%) |
| Total (Overall) | 720 (64.4%) | 398 (35.6%) |
Employment Industries by Sex in Bellerose Terrace
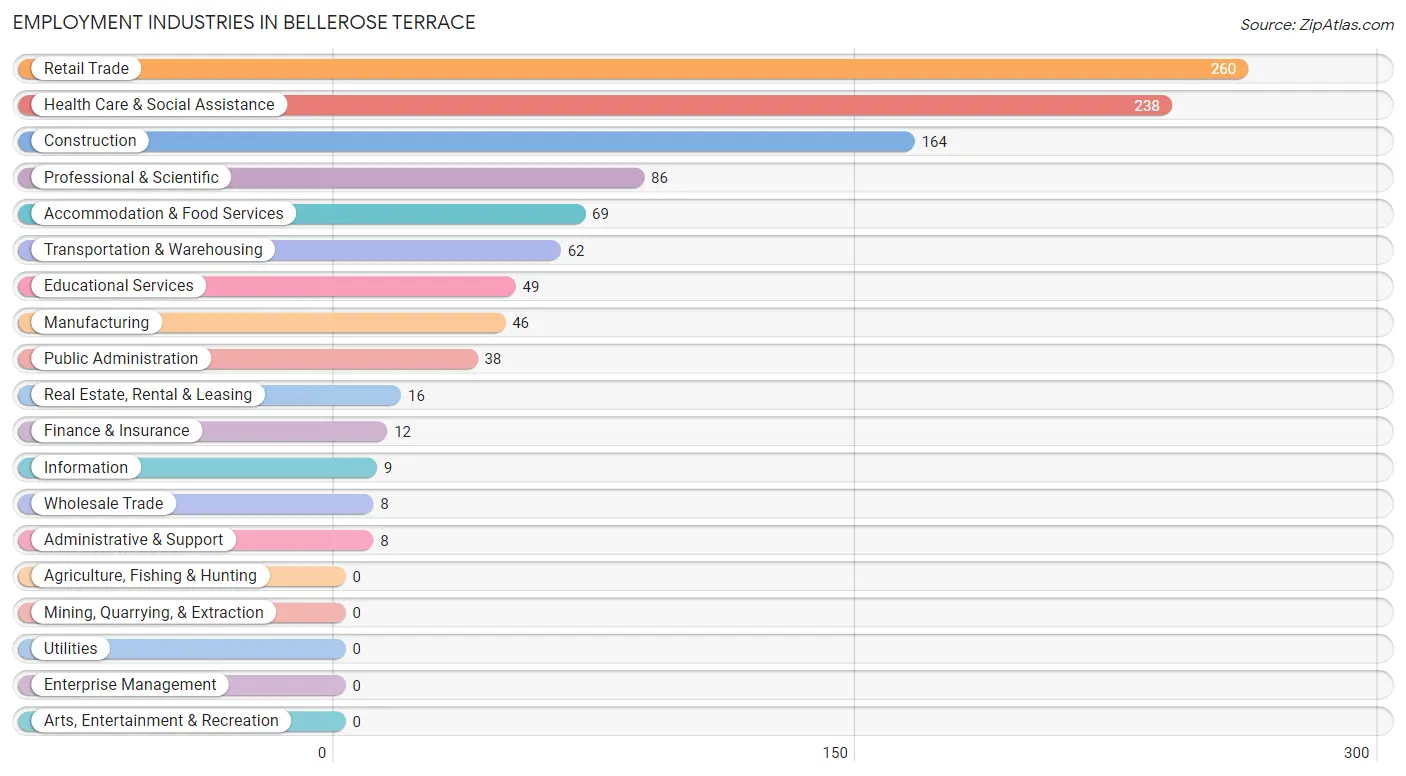
Employment Industries in Bellerose Terrace
The major employment industries in Bellerose Terrace include Retail Trade (260 | 23.3%), Health Care & Social Assistance (238 | 21.3%), Construction (164 | 14.7%), Professional & Scientific (86 | 7.7%), and Accommodation & Food Services (69 | 6.2%).
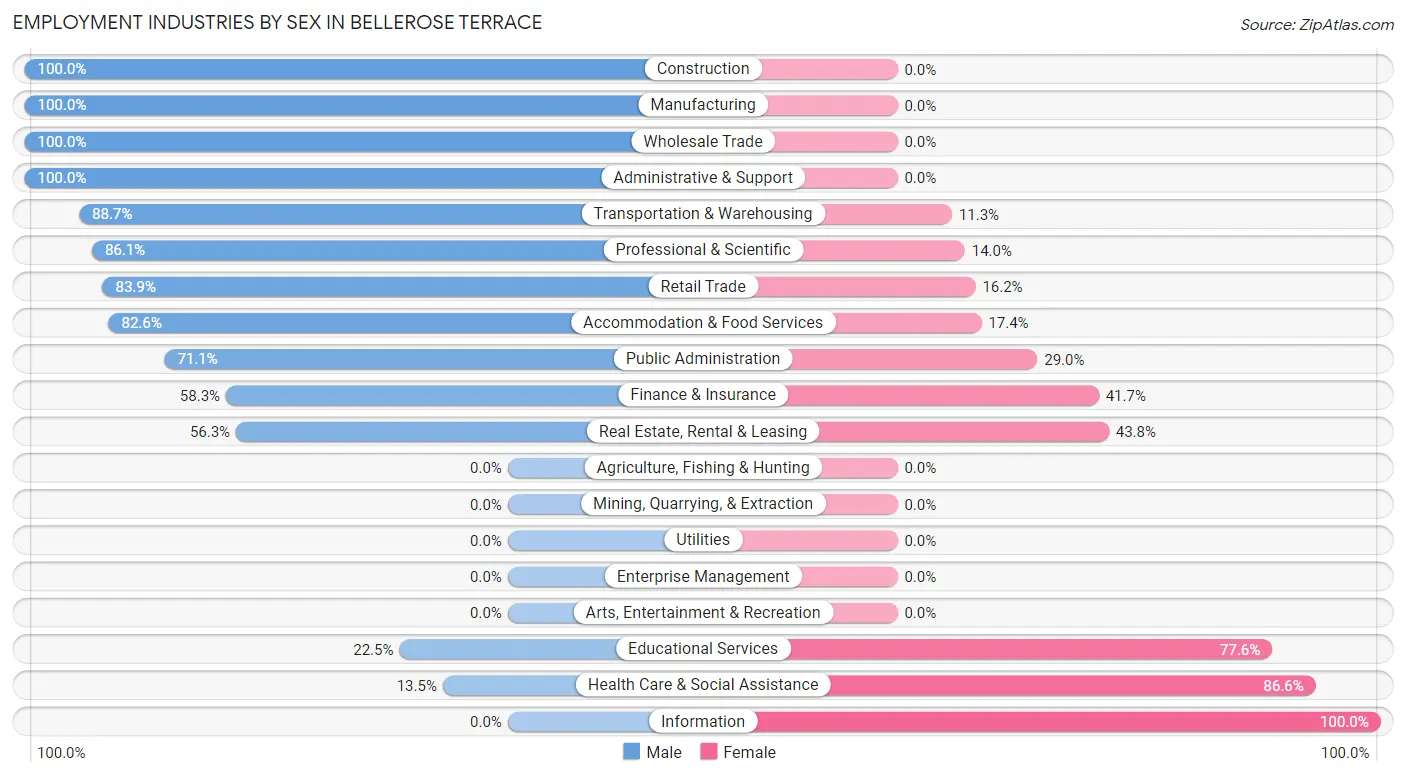
Employment Industries by Sex in Bellerose Terrace
The Bellerose Terrace industries that see more men than women are Construction (100.0%), Manufacturing (100.0%), and Wholesale Trade (100.0%), whereas the industries that tend to have a higher number of women are Information (100.0%), Health Care & Social Assistance (86.6%), and Educational Services (77.5%).
| Industry | Male | Female |
| Agriculture, Fishing & Hunting | 0 (0.0%) | 0 (0.0%) |
| Mining, Quarrying, & Extraction | 0 (0.0%) | 0 (0.0%) |
| Construction | 164 (100.0%) | 0 (0.0%) |
| Manufacturing | 46 (100.0%) | 0 (0.0%) |
| Wholesale Trade | 8 (100.0%) | 0 (0.0%) |
| Retail Trade | 218 (83.9%) | 42 (16.2%) |
| Transportation & Warehousing | 55 (88.7%) | 7 (11.3%) |
| Utilities | 0 (0.0%) | 0 (0.0%) |
| Information | 0 (0.0%) | 9 (100.0%) |
| Finance & Insurance | 7 (58.3%) | 5 (41.7%) |
| Real Estate, Rental & Leasing | 9 (56.2%) | 7 (43.8%) |
| Professional & Scientific | 74 (86.1%) | 12 (14.0%) |
| Enterprise Management | 0 (0.0%) | 0 (0.0%) |
| Administrative & Support | 8 (100.0%) | 0 (0.0%) |
| Educational Services | 11 (22.5%) | 38 (77.5%) |
| Health Care & Social Assistance | 32 (13.5%) | 206 (86.6%) |
| Arts, Entertainment & Recreation | 0 (0.0%) | 0 (0.0%) |
| Accommodation & Food Services | 57 (82.6%) | 12 (17.4%) |
| Public Administration | 27 (71.1%) | 11 (28.9%) |
| Total | 720 (64.4%) | 398 (35.6%) |
Education in Bellerose Terrace
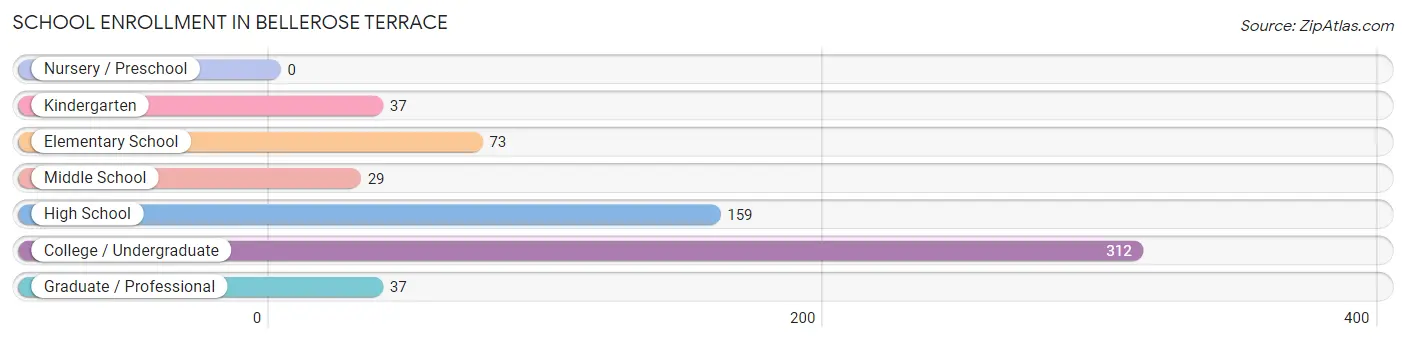
School Enrollment in Bellerose Terrace
The most common levels of schooling among the 647 students in Bellerose Terrace are college / undergraduate (312 | 48.2%), high school (159 | 24.6%), and elementary school (73 | 11.3%).
| School Level | # Students | % Students |
| Nursery / Preschool | 0 | 0.0% |
| Kindergarten | 37 | 5.7% |
| Elementary School | 73 | 11.3% |
| Middle School | 29 | 4.5% |
| High School | 159 | 24.6% |
| College / Undergraduate | 312 | 48.2% |
| Graduate / Professional | 37 | 5.7% |
| Total | 647 | 100.0% |
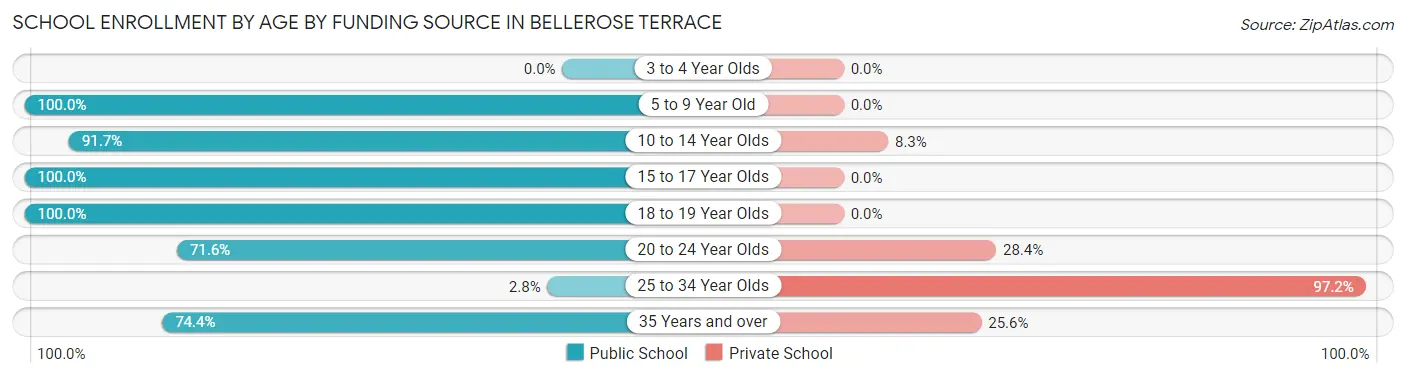
School Enrollment by Age by Funding Source in Bellerose Terrace
Out of a total of 647 students who are enrolled in schools in Bellerose Terrace, 249 (38.5%) attend a private institution, while the remaining 398 (61.5%) are enrolled in public schools. The age group of 25 to 34 year olds has the highest likelihood of being enrolled in private schools, with 209 (97.2% in the age bracket) enrolled. Conversely, the age group of 5 to 9 year old has the lowest likelihood of being enrolled in a private school, with 110 (100.0% in the age bracket) attending a public institution.
| Age Bracket | Public School | Private School |
| 3 to 4 Year Olds | 0 (0.0%) | 0 (0.0%) |
| 5 to 9 Year Old | 110 (100.0%) | 0 (0.0%) |
| 10 to 14 Year Olds | 100 (91.7%) | 9 (8.3%) |
| 15 to 17 Year Olds | 52 (100.0%) | 0 (0.0%) |
| 18 to 19 Year Olds | 48 (100.0%) | 0 (0.0%) |
| 20 to 24 Year Olds | 53 (71.6%) | 21 (28.4%) |
| 25 to 34 Year Olds | 6 (2.8%) | 209 (97.2%) |
| 35 Years and over | 29 (74.4%) | 10 (25.6%) |
| Total | 398 (61.5%) | 249 (38.5%) |
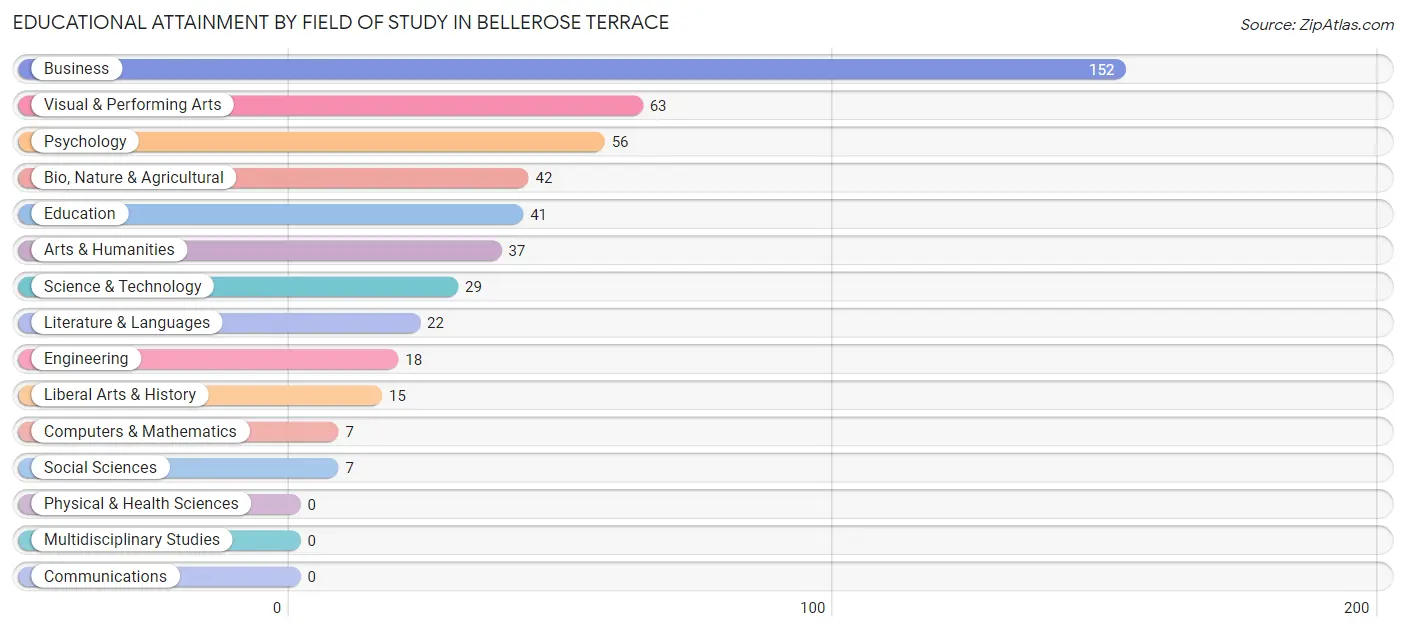
Educational Attainment by Field of Study in Bellerose Terrace
Business (152 | 31.1%), visual & performing arts (63 | 12.9%), psychology (56 | 11.5%), bio, nature & agricultural (42 | 8.6%), and education (41 | 8.4%) are the most common fields of study among 489 individuals in Bellerose Terrace who have obtained a bachelor's degree or higher.
| Field of Study | # Graduates | % Graduates |
| Computers & Mathematics | 7 | 1.4% |
| Bio, Nature & Agricultural | 42 | 8.6% |
| Physical & Health Sciences | 0 | 0.0% |
| Psychology | 56 | 11.5% |
| Social Sciences | 7 | 1.4% |
| Engineering | 18 | 3.7% |
| Multidisciplinary Studies | 0 | 0.0% |
| Science & Technology | 29 | 5.9% |
| Business | 152 | 31.1% |
| Education | 41 | 8.4% |
| Literature & Languages | 22 | 4.5% |
| Liberal Arts & History | 15 | 3.1% |
| Visual & Performing Arts | 63 | 12.9% |
| Communications | 0 | 0.0% |
| Arts & Humanities | 37 | 7.6% |
| Total | 489 | 100.0% |
Transportation & Commute in Bellerose Terrace
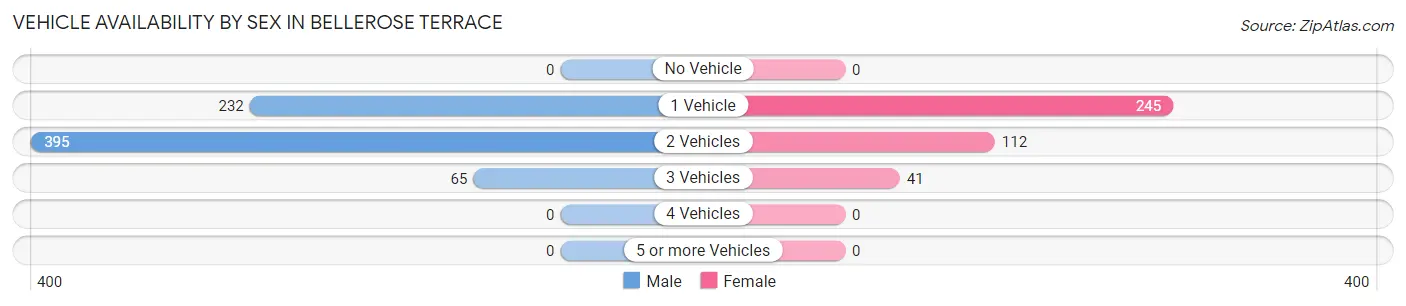
Vehicle Availability by Sex in Bellerose Terrace
The most prevalent vehicle ownership categories in Bellerose Terrace are males with 2 vehicles (395, accounting for 57.1%) and females with 2 vehicles (112, making up 99.3%).
| Vehicles Available | Male | Female |
| No Vehicle | 0 (0.0%) | 0 (0.0%) |
| 1 Vehicle | 232 (33.5%) | 245 (61.6%) |
| 2 Vehicles | 395 (57.1%) | 112 (28.1%) |
| 3 Vehicles | 65 (9.4%) | 41 (10.3%) |
| 4 Vehicles | 0 (0.0%) | 0 (0.0%) |
| 5 or more Vehicles | 0 (0.0%) | 0 (0.0%) |
| Total | 692 (100.0%) | 398 (100.0%) |
Commute Time in Bellerose Terrace
The most frequently occuring commute durations in Bellerose Terrace are 60 to 89 minutes (172 commuters, 20.6%), 20 to 24 minutes (162 commuters, 19.4%), and 40 to 44 minutes (112 commuters, 13.4%).
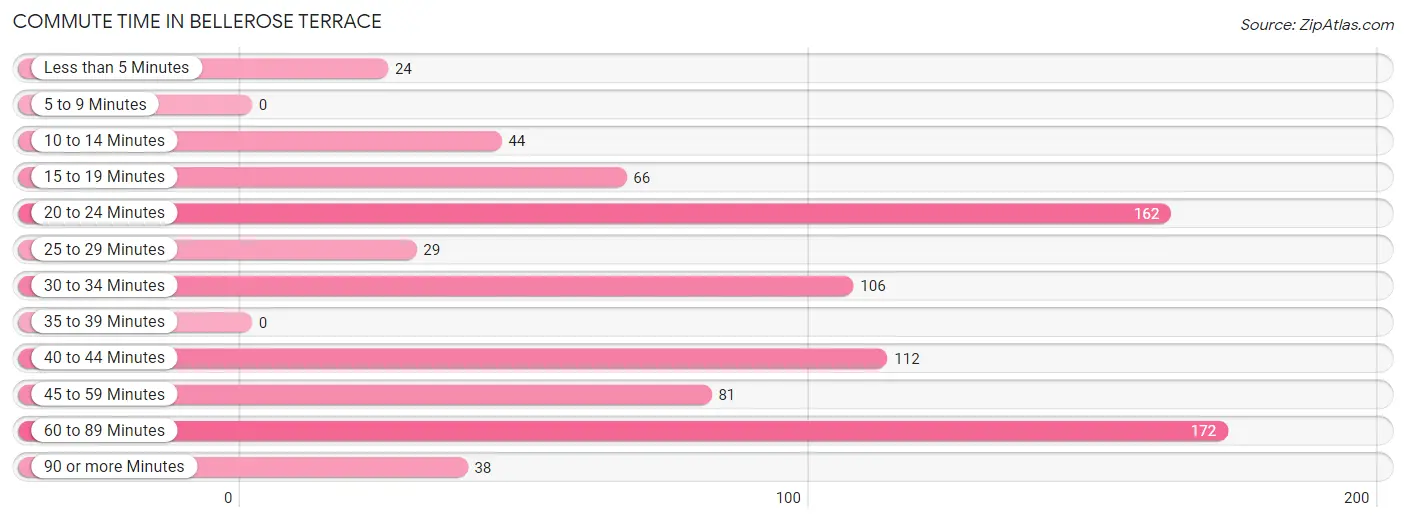
| Commute Time | # Commuters | % Commuters |
| Less than 5 Minutes | 24 | 2.9% |
| 5 to 9 Minutes | 0 | 0.0% |
| 10 to 14 Minutes | 44 | 5.3% |
| 15 to 19 Minutes | 66 | 7.9% |
| 20 to 24 Minutes | 162 | 19.4% |
| 25 to 29 Minutes | 29 | 3.5% |
| 30 to 34 Minutes | 106 | 12.7% |
| 35 to 39 Minutes | 0 | 0.0% |
| 40 to 44 Minutes | 112 | 13.4% |
| 45 to 59 Minutes | 81 | 9.7% |
| 60 to 89 Minutes | 172 | 20.6% |
| 90 or more Minutes | 38 | 4.6% |
Commute Time by Sex in Bellerose Terrace
The most common commute times in Bellerose Terrace are 60 to 89 minutes (138 commuters, 30.1%) for males and 20 to 24 minutes (85 commuters, 22.7%) for females.
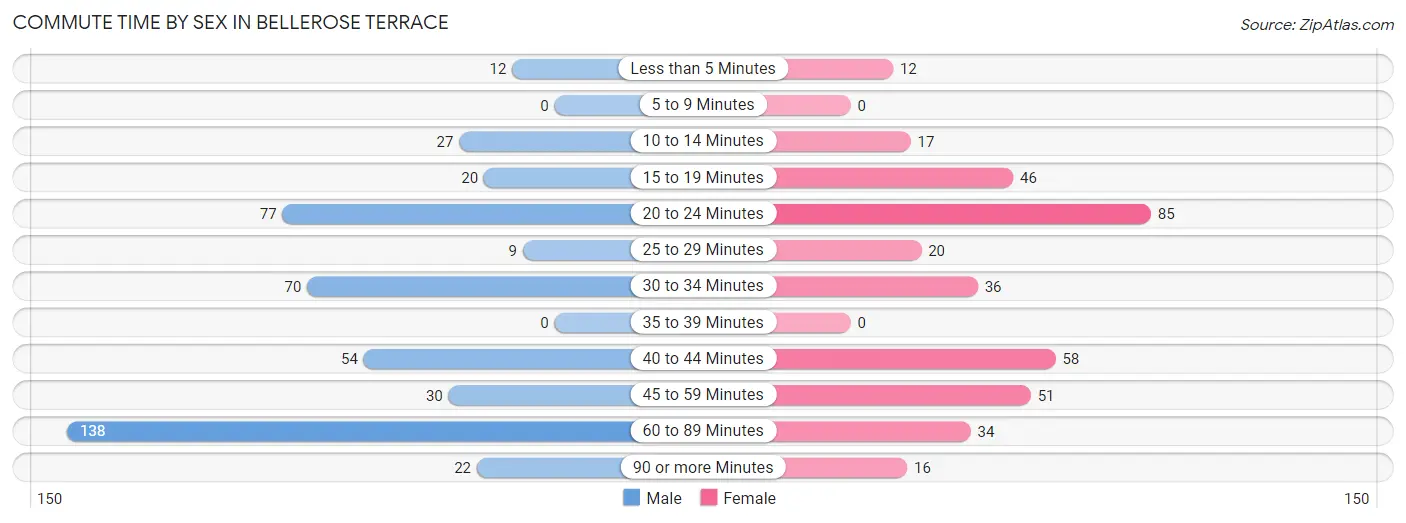
| Commute Time | Male | Female |
| Less than 5 Minutes | 12 (2.6%) | 12 (3.2%) |
| 5 to 9 Minutes | 0 (0.0%) | 0 (0.0%) |
| 10 to 14 Minutes | 27 (5.9%) | 17 (4.5%) |
| 15 to 19 Minutes | 20 (4.4%) | 46 (12.3%) |
| 20 to 24 Minutes | 77 (16.8%) | 85 (22.7%) |
| 25 to 29 Minutes | 9 (2.0%) | 20 (5.3%) |
| 30 to 34 Minutes | 70 (15.2%) | 36 (9.6%) |
| 35 to 39 Minutes | 0 (0.0%) | 0 (0.0%) |
| 40 to 44 Minutes | 54 (11.8%) | 58 (15.5%) |
| 45 to 59 Minutes | 30 (6.5%) | 51 (13.6%) |
| 60 to 89 Minutes | 138 (30.1%) | 34 (9.1%) |
| 90 or more Minutes | 22 (4.8%) | 16 (4.3%) |
Time of Departure to Work by Sex in Bellerose Terrace
The most frequent times of departure to work in Bellerose Terrace are 7:00 AM to 7:29 AM (136, 29.6%) for males and 7:00 AM to 7:29 AM (124, 33.1%) for females.
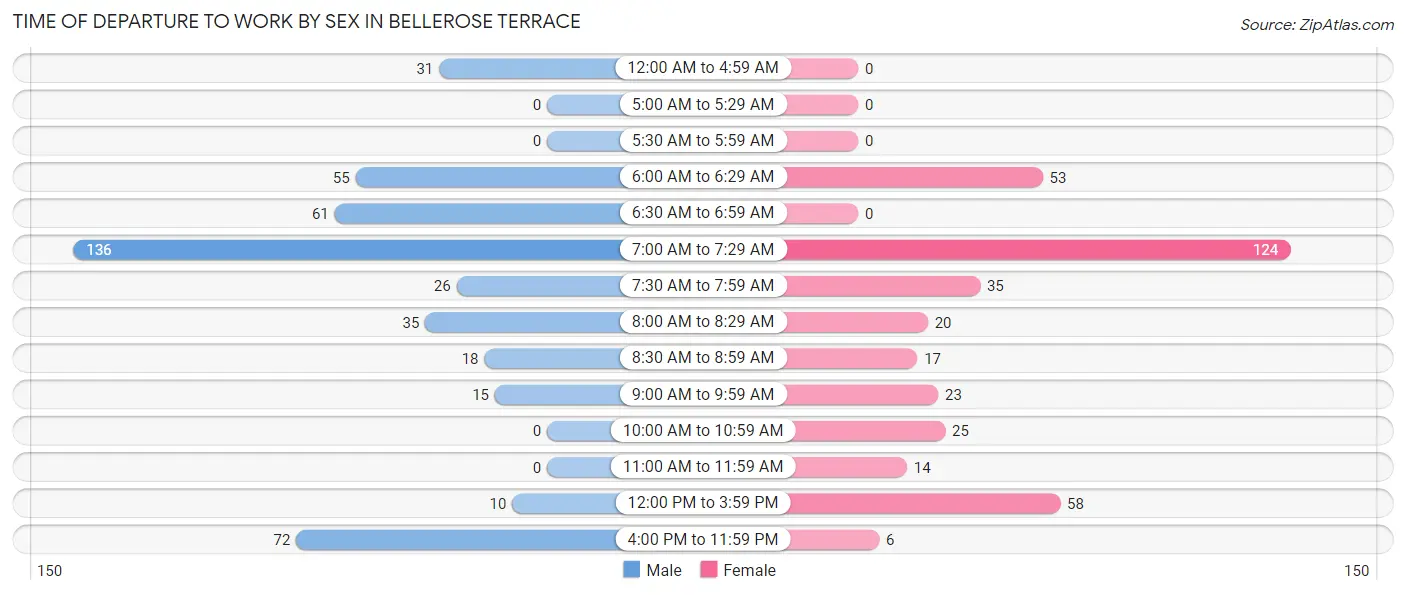
| Time of Departure | Male | Female |
| 12:00 AM to 4:59 AM | 31 (6.8%) | 0 (0.0%) |
| 5:00 AM to 5:29 AM | 0 (0.0%) | 0 (0.0%) |
| 5:30 AM to 5:59 AM | 0 (0.0%) | 0 (0.0%) |
| 6:00 AM to 6:29 AM | 55 (12.0%) | 53 (14.1%) |
| 6:30 AM to 6:59 AM | 61 (13.3%) | 0 (0.0%) |
| 7:00 AM to 7:29 AM | 136 (29.6%) | 124 (33.1%) |
| 7:30 AM to 7:59 AM | 26 (5.7%) | 35 (9.3%) |
| 8:00 AM to 8:29 AM | 35 (7.6%) | 20 (5.3%) |
| 8:30 AM to 8:59 AM | 18 (3.9%) | 17 (4.5%) |
| 9:00 AM to 9:59 AM | 15 (3.3%) | 23 (6.1%) |
| 10:00 AM to 10:59 AM | 0 (0.0%) | 25 (6.7%) |
| 11:00 AM to 11:59 AM | 0 (0.0%) | 14 (3.7%) |
| 12:00 PM to 3:59 PM | 10 (2.2%) | 58 (15.5%) |
| 4:00 PM to 11:59 PM | 72 (15.7%) | 6 (1.6%) |
| Total | 459 (100.0%) | 375 (100.0%) |
Housing Occupancy in Bellerose Terrace
Occupancy by Ownership in Bellerose Terrace
Of the total 690 dwellings in Bellerose Terrace, owner-occupied units account for 578 (83.8%), while renter-occupied units make up 112 (16.2%).
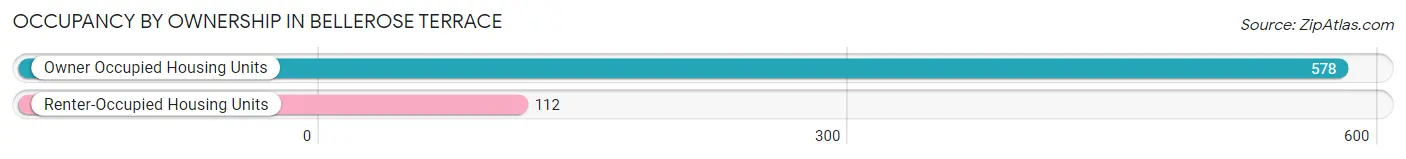
| Occupancy | # Housing Units | % Housing Units |
| Owner Occupied Housing Units | 578 | 83.8% |
| Renter-Occupied Housing Units | 112 | 16.2% |
| Total Occupied Housing Units | 690 | 100.0% |
Occupancy by Household Size in Bellerose Terrace
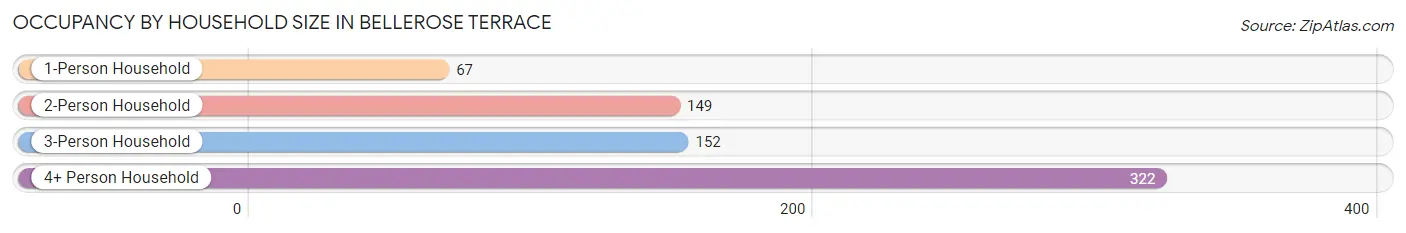
| Household Size | # Housing Units | % Housing Units |
| 1-Person Household | 67 | 9.7% |
| 2-Person Household | 149 | 21.6% |
| 3-Person Household | 152 | 22.0% |
| 4+ Person Household | 322 | 46.7% |
| Total Housing Units | 690 | 100.0% |
Occupancy by Ownership by Household Size in Bellerose Terrace
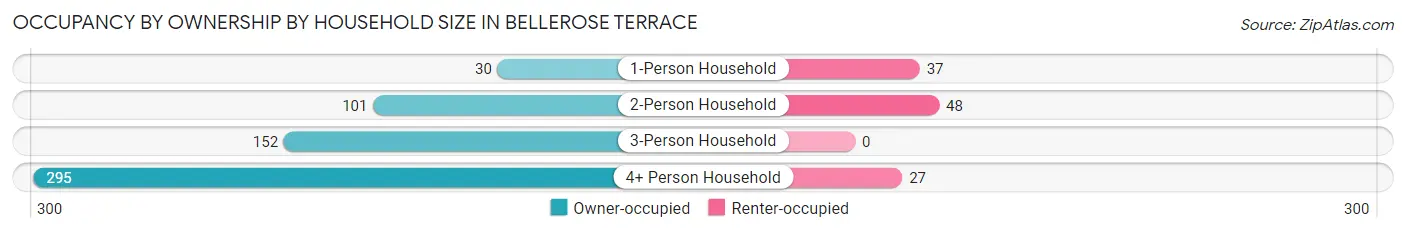
| Household Size | Owner-occupied | Renter-occupied |
| 1-Person Household | 30 (44.8%) | 37 (55.2%) |
| 2-Person Household | 101 (67.8%) | 48 (32.2%) |
| 3-Person Household | 152 (100.0%) | 0 (0.0%) |
| 4+ Person Household | 295 (91.6%) | 27 (8.4%) |
| Total Housing Units | 578 (83.8%) | 112 (16.2%) |
Occupancy by Educational Attainment in Bellerose Terrace
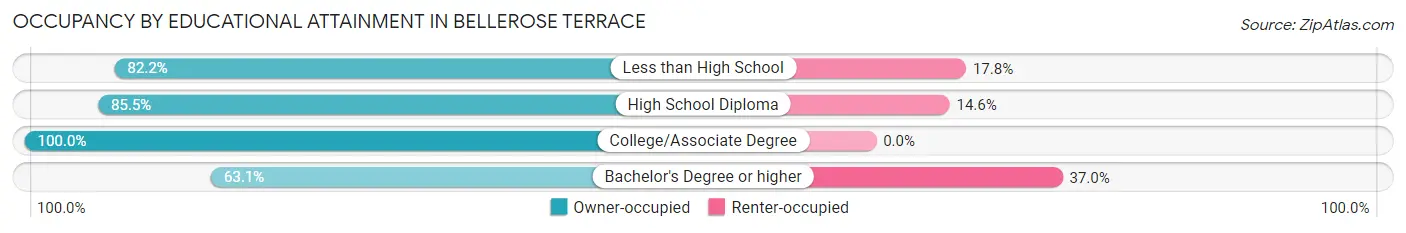
| Household Size | Owner-occupied | Renter-occupied |
| Less than High School | 60 (82.2%) | 13 (17.8%) |
| High School Diploma | 141 (85.5%) | 24 (14.5%) |
| College/Associate Degree | 249 (100.0%) | 0 (0.0%) |
| Bachelor's Degree or higher | 128 (63.0%) | 75 (36.9%) |
Occupancy by Age of Householder in Bellerose Terrace
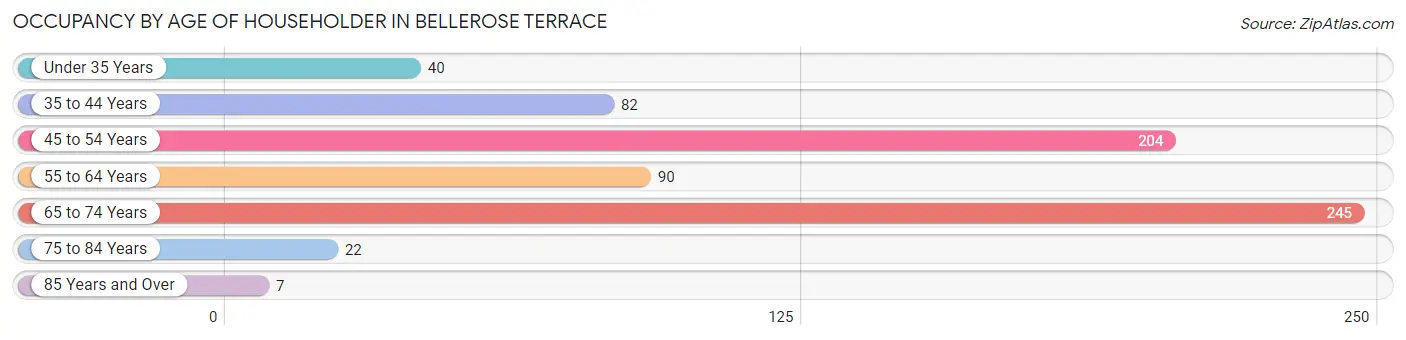
| Age Bracket | # Households | % Households |
| Under 35 Years | 40 | 5.8% |
| 35 to 44 Years | 82 | 11.9% |
| 45 to 54 Years | 204 | 29.6% |
| 55 to 64 Years | 90 | 13.0% |
| 65 to 74 Years | 245 | 35.5% |
| 75 to 84 Years | 22 | 3.2% |
| 85 Years and Over | 7 | 1.0% |
| Total | 690 | 100.0% |
Housing Finances in Bellerose Terrace
Median Income by Occupancy in Bellerose Terrace
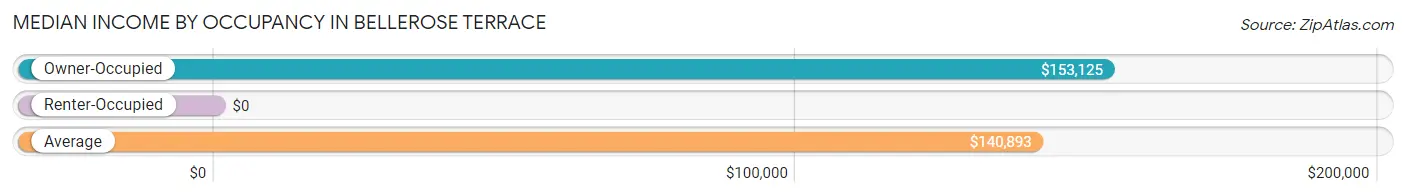
| Occupancy Type | # Households | Median Income |
| Owner-Occupied | 578 (83.8%) | $153,125 |
| Renter-Occupied | 112 (16.2%) | $0 |
| Average | 690 (100.0%) | $140,893 |
Occupancy by Householder Income Bracket in Bellerose Terrace
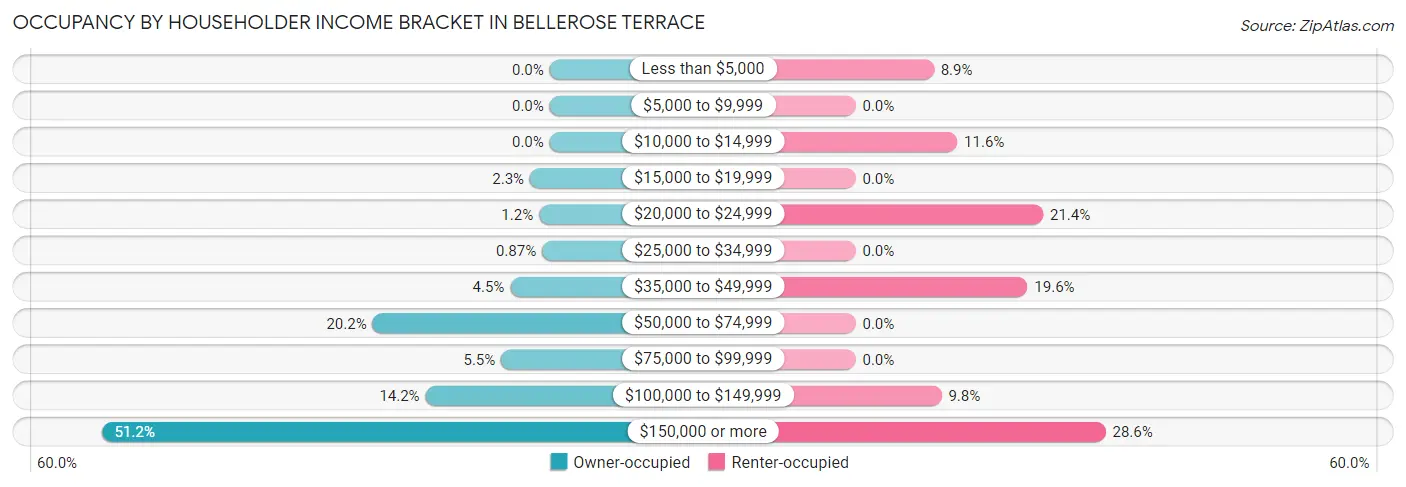
| Income Bracket | Owner-occupied | Renter-occupied |
| Less than $5,000 | 0 (0.0%) | 10 (8.9%) |
| $5,000 to $9,999 | 0 (0.0%) | 0 (0.0%) |
| $10,000 to $14,999 | 0 (0.0%) | 13 (11.6%) |
| $15,000 to $19,999 | 13 (2.2%) | 0 (0.0%) |
| $20,000 to $24,999 | 7 (1.2%) | 24 (21.4%) |
| $25,000 to $34,999 | 5 (0.9%) | 0 (0.0%) |
| $35,000 to $49,999 | 26 (4.5%) | 22 (19.6%) |
| $50,000 to $74,999 | 117 (20.2%) | 0 (0.0%) |
| $75,000 to $99,999 | 32 (5.5%) | 0 (0.0%) |
| $100,000 to $149,999 | 82 (14.2%) | 11 (9.8%) |
| $150,000 or more | 296 (51.2%) | 32 (28.6%) |
| Total | 578 (100.0%) | 112 (100.0%) |
Monthly Housing Cost Tiers in Bellerose Terrace
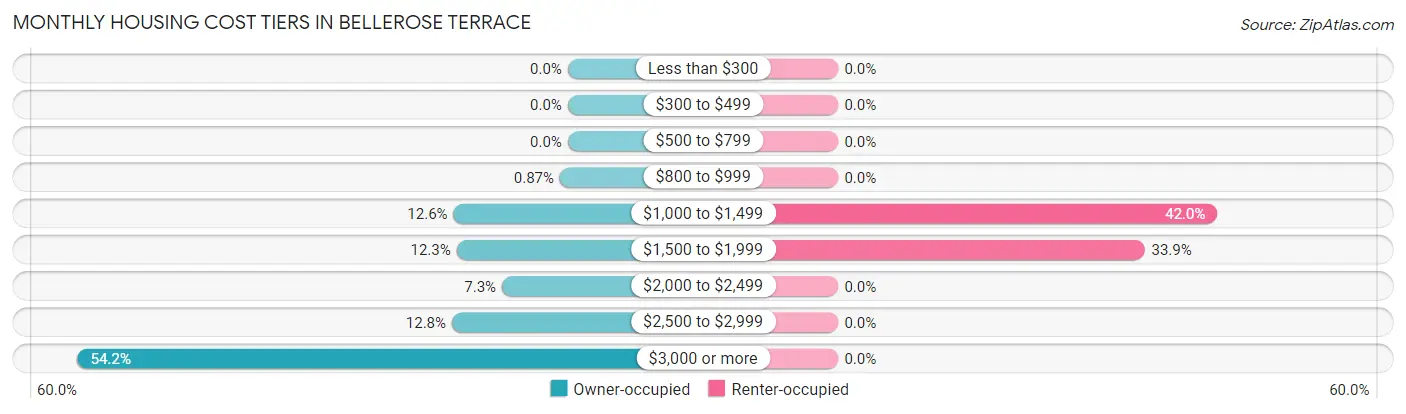
| Monthly Cost | Owner-occupied | Renter-occupied |
| Less than $300 | 0 (0.0%) | 0 (0.0%) |
| $300 to $499 | 0 (0.0%) | 0 (0.0%) |
| $500 to $799 | 0 (0.0%) | 0 (0.0%) |
| $800 to $999 | 5 (0.9%) | 0 (0.0%) |
| $1,000 to $1,499 | 73 (12.6%) | 47 (42.0%) |
| $1,500 to $1,999 | 71 (12.3%) | 38 (33.9%) |
| $2,000 to $2,499 | 42 (7.3%) | 0 (0.0%) |
| $2,500 to $2,999 | 74 (12.8%) | 0 (0.0%) |
| $3,000 or more | 313 (54.1%) | 0 (0.0%) |
| Total | 578 (100.0%) | 112 (100.0%) |
Physical Housing Characteristics in Bellerose Terrace
Housing Structures in Bellerose Terrace
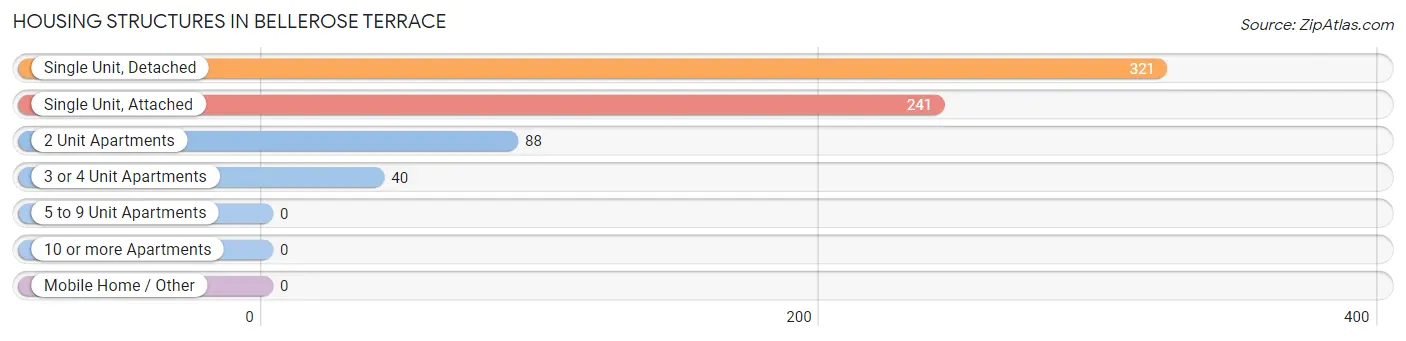
| Structure Type | # Housing Units | % Housing Units |
| Single Unit, Detached | 321 | 46.5% |
| Single Unit, Attached | 241 | 34.9% |
| 2 Unit Apartments | 88 | 12.8% |
| 3 or 4 Unit Apartments | 40 | 5.8% |
| 5 to 9 Unit Apartments | 0 | 0.0% |
| 10 or more Apartments | 0 | 0.0% |
| Mobile Home / Other | 0 | 0.0% |
| Total | 690 | 100.0% |
Housing Structures by Occupancy in Bellerose Terrace
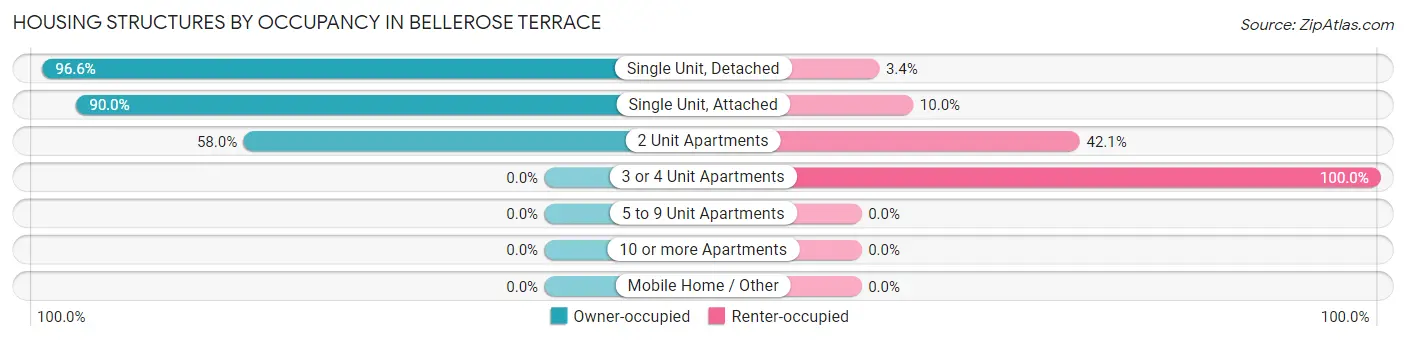
| Structure Type | Owner-occupied | Renter-occupied |
| Single Unit, Detached | 310 (96.6%) | 11 (3.4%) |
| Single Unit, Attached | 217 (90.0%) | 24 (10.0%) |
| 2 Unit Apartments | 51 (58.0%) | 37 (42.0%) |
| 3 or 4 Unit Apartments | 0 (0.0%) | 40 (100.0%) |
| 5 to 9 Unit Apartments | 0 (0.0%) | 0 (0.0%) |
| 10 or more Apartments | 0 (0.0%) | 0 (0.0%) |
| Mobile Home / Other | 0 (0.0%) | 0 (0.0%) |
| Total | 578 (83.8%) | 112 (16.2%) |
Housing Structures by Number of Rooms in Bellerose Terrace
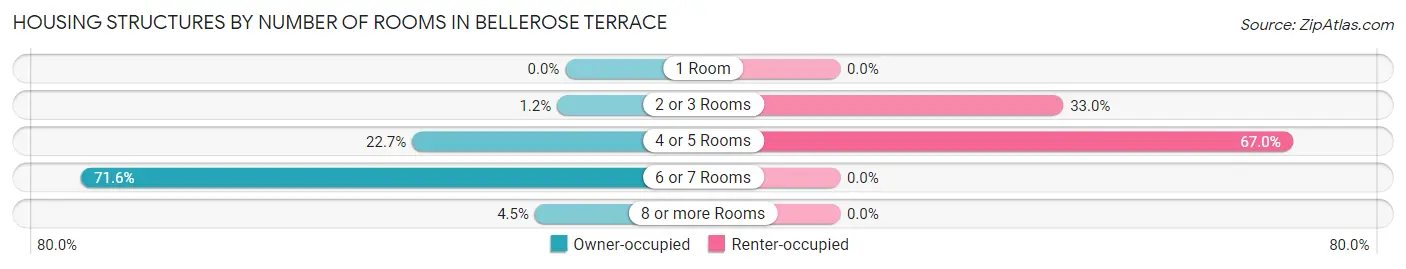
| Number of Rooms | Owner-occupied | Renter-occupied |
| 1 Room | 0 (0.0%) | 0 (0.0%) |
| 2 or 3 Rooms | 7 (1.2%) | 37 (33.0%) |
| 4 or 5 Rooms | 131 (22.7%) | 75 (67.0%) |
| 6 or 7 Rooms | 414 (71.6%) | 0 (0.0%) |
| 8 or more Rooms | 26 (4.5%) | 0 (0.0%) |
| Total | 578 (100.0%) | 112 (100.0%) |
Housing Structure by Heating Type in Bellerose Terrace
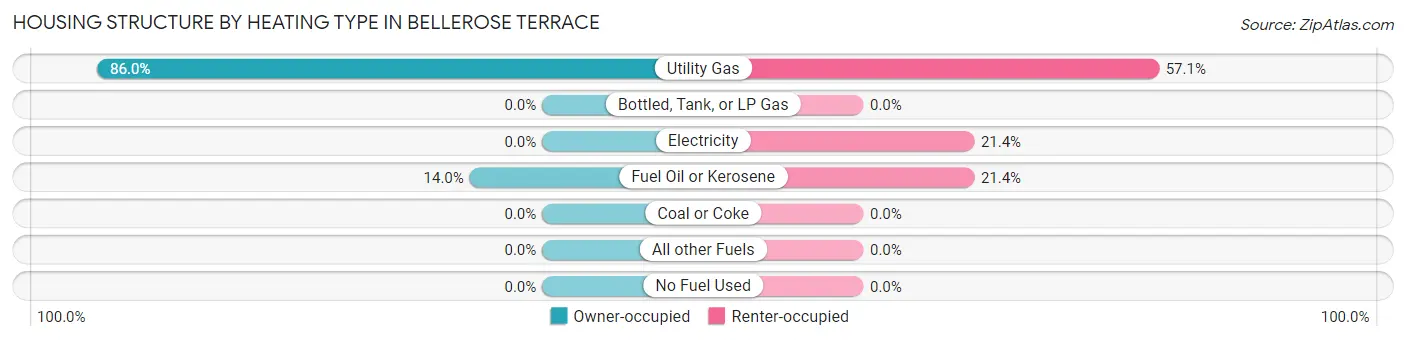
| Heating Type | Owner-occupied | Renter-occupied |
| Utility Gas | 497 (86.0%) | 64 (57.1%) |
| Bottled, Tank, or LP Gas | 0 (0.0%) | 0 (0.0%) |
| Electricity | 0 (0.0%) | 24 (21.4%) |
| Fuel Oil or Kerosene | 81 (14.0%) | 24 (21.4%) |
| Coal or Coke | 0 (0.0%) | 0 (0.0%) |
| All other Fuels | 0 (0.0%) | 0 (0.0%) |
| No Fuel Used | 0 (0.0%) | 0 (0.0%) |
| Total | 578 (100.0%) | 112 (100.0%) |
Household Vehicle Usage in Bellerose Terrace
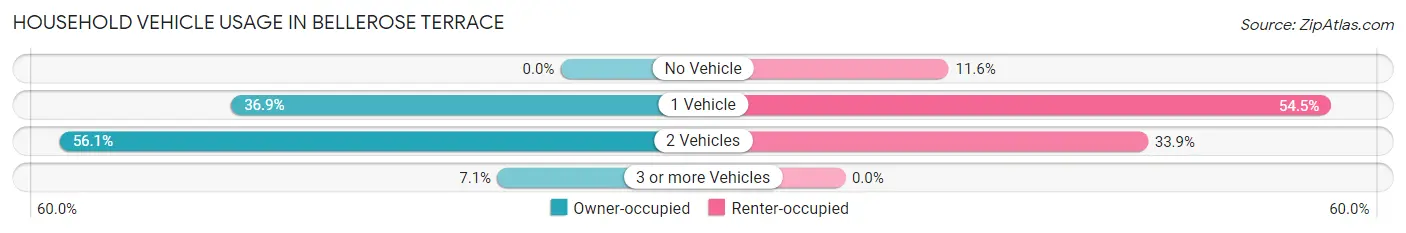
| Vehicles per Household | Owner-occupied | Renter-occupied |
| No Vehicle | 0 (0.0%) | 13 (11.6%) |
| 1 Vehicle | 213 (36.8%) | 61 (54.5%) |
| 2 Vehicles | 324 (56.1%) | 38 (33.9%) |
| 3 or more Vehicles | 41 (7.1%) | 0 (0.0%) |
| Total | 578 (100.0%) | 112 (100.0%) |
Real Estate & Mortgages in Bellerose Terrace
Real Estate and Mortgage Overview in Bellerose Terrace
| Characteristic | Without Mortgage | With Mortgage |
| Housing Units | 55 | 523 |
| Median Property Value | $713,200 | $530,400 |
| Median Household Income | $177,688 | $267 |
| Monthly Housing Costs | $1,340 | $313 |
| Real Estate Taxes | $9,107 | $28 |
Property Value by Mortgage Status in Bellerose Terrace
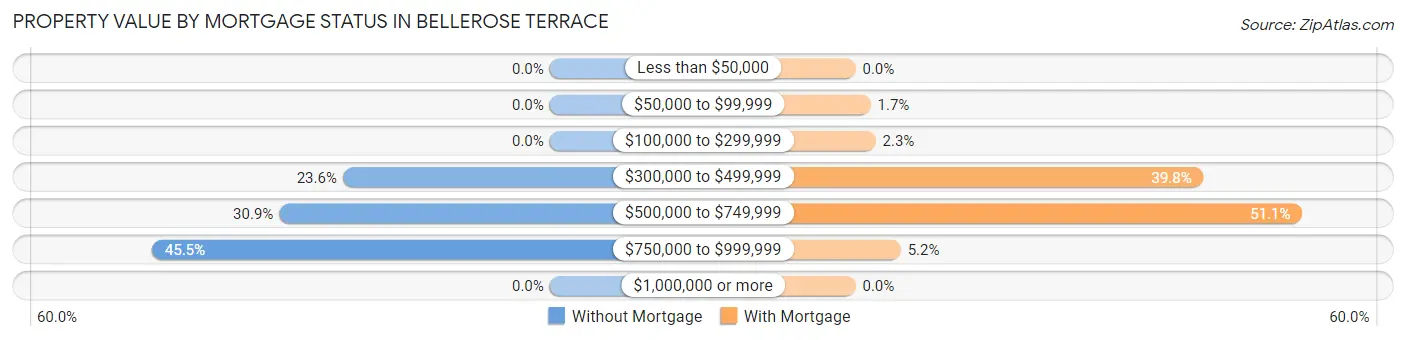
| Property Value | Without Mortgage | With Mortgage |
| Less than $50,000 | 0 (0.0%) | 0 (0.0%) |
| $50,000 to $99,999 | 0 (0.0%) | 9 (1.7%) |
| $100,000 to $299,999 | 0 (0.0%) | 12 (2.3%) |
| $300,000 to $499,999 | 13 (23.6%) | 208 (39.8%) |
| $500,000 to $749,999 | 17 (30.9%) | 267 (51.0%) |
| $750,000 to $999,999 | 25 (45.5%) | 27 (5.2%) |
| $1,000,000 or more | 0 (0.0%) | 0 (0.0%) |
| Total | 55 (100.0%) | 523 (100.0%) |
Household Income by Mortgage Status in Bellerose Terrace
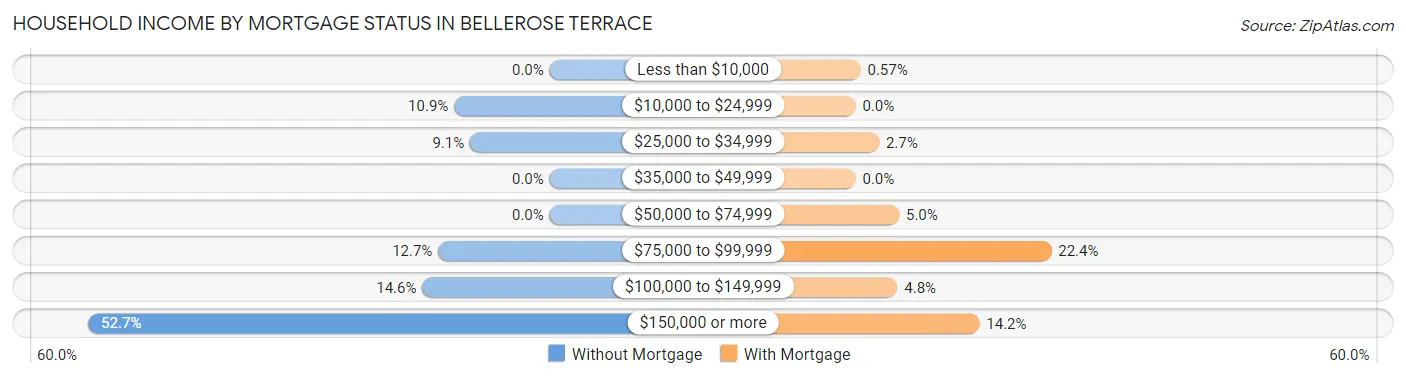
| Household Income | Without Mortgage | With Mortgage |
| Less than $10,000 | 0 (0.0%) | 3 (0.6%) |
| $10,000 to $24,999 | 6 (10.9%) | 0 (0.0%) |
| $25,000 to $34,999 | 5 (9.1%) | 14 (2.7%) |
| $35,000 to $49,999 | 0 (0.0%) | 0 (0.0%) |
| $50,000 to $74,999 | 0 (0.0%) | 26 (5.0%) |
| $75,000 to $99,999 | 7 (12.7%) | 117 (22.4%) |
| $100,000 to $149,999 | 8 (14.5%) | 25 (4.8%) |
| $150,000 or more | 29 (52.7%) | 74 (14.1%) |
| Total | 55 (100.0%) | 523 (100.0%) |
Property Value to Household Income Ratio in Bellerose Terrace
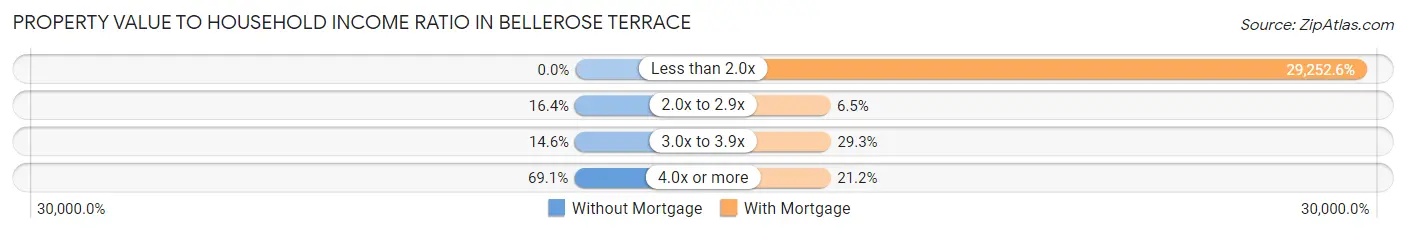
| Value-to-Income Ratio | Without Mortgage | With Mortgage |
| Less than 2.0x | 0 (0.0%) | 152,991 (29,252.6%) |
| 2.0x to 2.9x | 9 (16.4%) | 34 (6.5%) |
| 3.0x to 3.9x | 8 (14.5%) | 153 (29.2%) |
| 4.0x or more | 38 (69.1%) | 111 (21.2%) |
| Total | 55 (100.0%) | 523 (100.0%) |
Real Estate Taxes by Mortgage Status in Bellerose Terrace
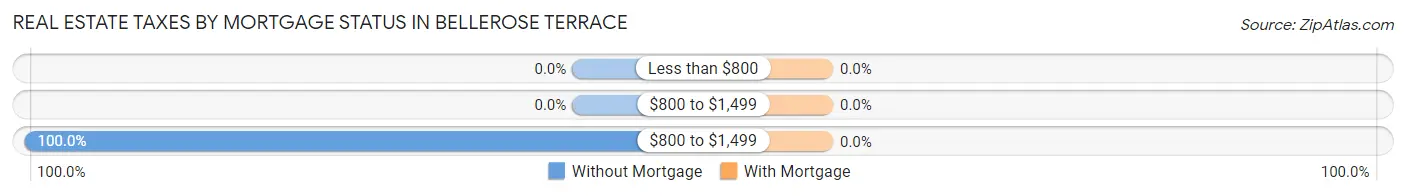
| Property Taxes | Without Mortgage | With Mortgage |
| Less than $800 | 0 (0.0%) | 0 (0.0%) |
| $800 to $1,499 | 0 (0.0%) | 0 (0.0%) |
| $800 to $1,499 | 55 (100.0%) | 0 (0.0%) |
| Total | 55 (100.0%) | 523 (100.0%) |
Health & Disability in Bellerose Terrace
Health Insurance Coverage by Age in Bellerose Terrace
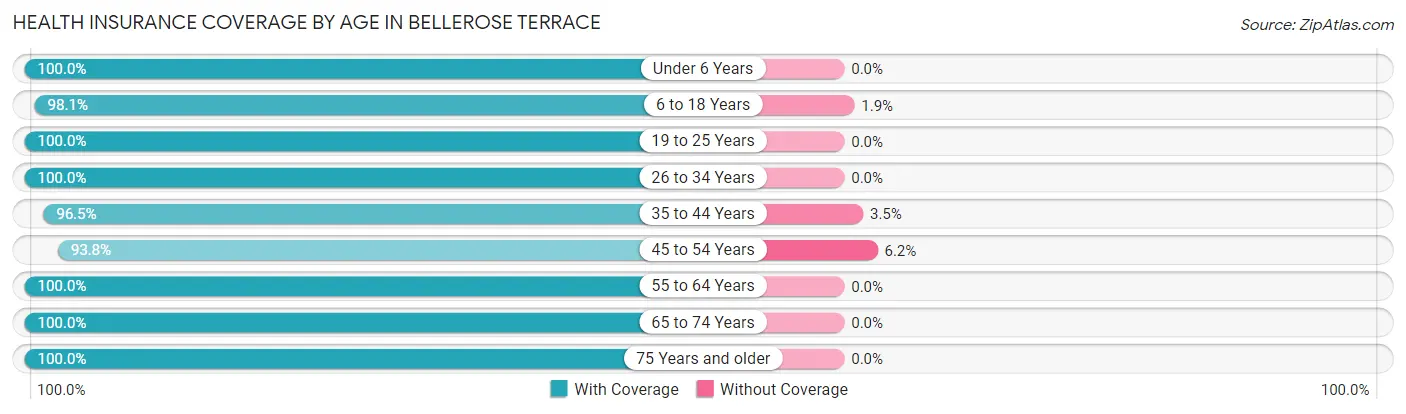
| Age Bracket | With Coverage | Without Coverage |
| Under 6 Years | 75 (100.0%) | 0 (0.0%) |
| 6 to 18 Years | 313 (98.1%) | 6 (1.9%) |
| 19 to 25 Years | 167 (100.0%) | 0 (0.0%) |
| 26 to 34 Years | 323 (100.0%) | 0 (0.0%) |
| 35 to 44 Years | 166 (96.5%) | 6 (3.5%) |
| 45 to 54 Years | 348 (93.8%) | 23 (6.2%) |
| 55 to 64 Years | 292 (100.0%) | 0 (0.0%) |
| 65 to 74 Years | 352 (100.0%) | 0 (0.0%) |
| 75 Years and older | 64 (100.0%) | 0 (0.0%) |
| Total | 2,100 (98.4%) | 35 (1.6%) |
Health Insurance Coverage by Citizenship Status in Bellerose Terrace
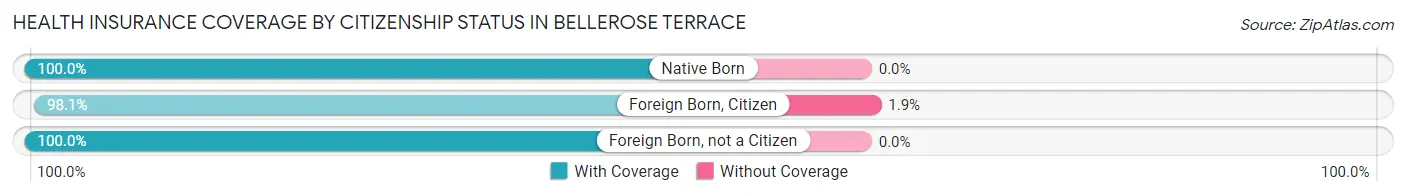
| Citizenship Status | With Coverage | Without Coverage |
| Native Born | 75 (100.0%) | 0 (0.0%) |
| Foreign Born, Citizen | 313 (98.1%) | 6 (1.9%) |
| Foreign Born, not a Citizen | 167 (100.0%) | 0 (0.0%) |
Health Insurance Coverage by Household Income in Bellerose Terrace
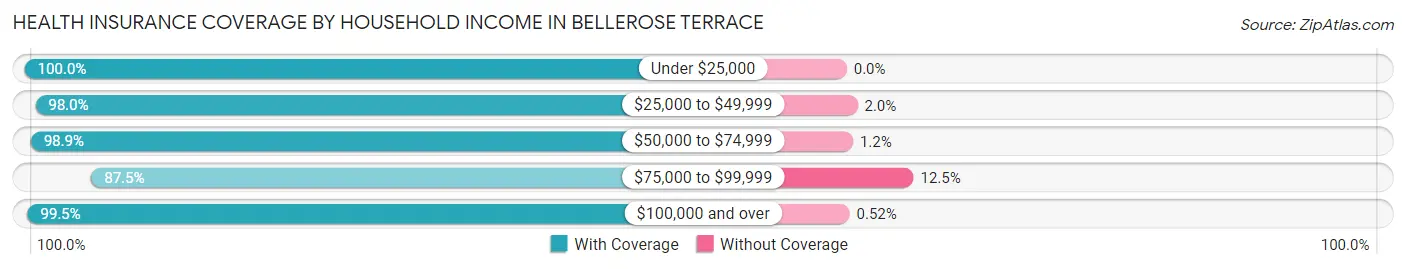
| Household Income | With Coverage | Without Coverage |
| Under $25,000 | 76 (100.0%) | 0 (0.0%) |
| $25,000 to $49,999 | 244 (98.0%) | 5 (2.0%) |
| $50,000 to $74,999 | 516 (98.9%) | 6 (1.1%) |
| $75,000 to $99,999 | 126 (87.5%) | 18 (12.5%) |
| $100,000 and over | 1,138 (99.5%) | 6 (0.5%) |
Public vs Private Health Insurance Coverage by Age in Bellerose Terrace
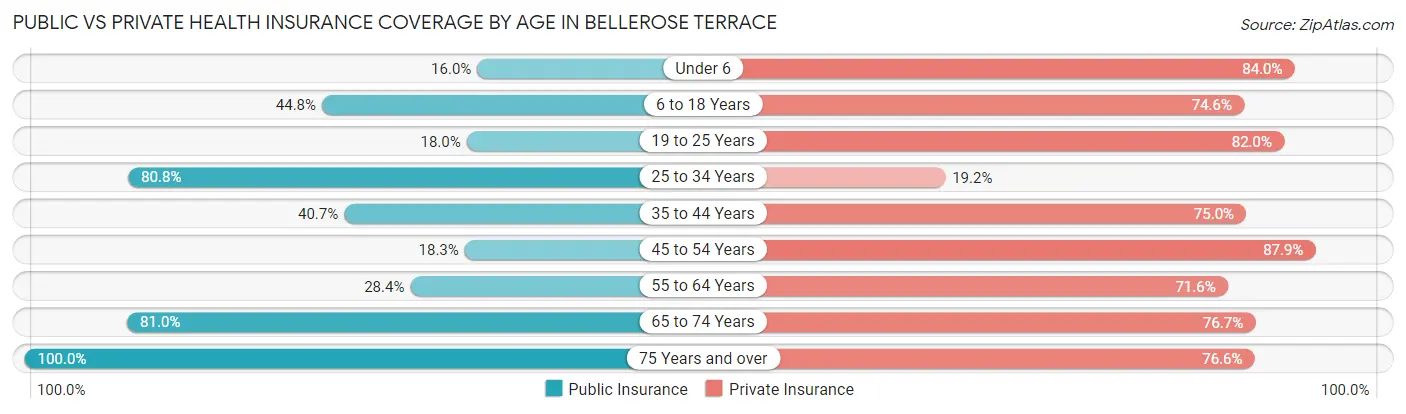
| Age Bracket | Public Insurance | Private Insurance |
| Under 6 | 12 (16.0%) | 63 (84.0%) |
| 6 to 18 Years | 143 (44.8%) | 238 (74.6%) |
| 19 to 25 Years | 30 (18.0%) | 137 (82.0%) |
| 25 to 34 Years | 261 (80.8%) | 62 (19.2%) |
| 35 to 44 Years | 70 (40.7%) | 129 (75.0%) |
| 45 to 54 Years | 68 (18.3%) | 326 (87.9%) |
| 55 to 64 Years | 83 (28.4%) | 209 (71.6%) |
| 65 to 74 Years | 285 (81.0%) | 270 (76.7%) |
| 75 Years and over | 64 (100.0%) | 49 (76.6%) |
| Total | 1,016 (47.6%) | 1,483 (69.5%) |
Disability Status by Sex by Age in Bellerose Terrace
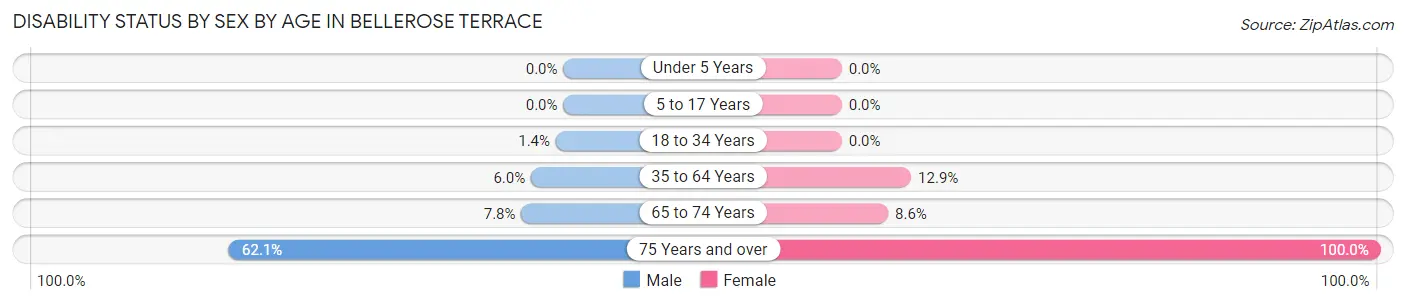
| Age Bracket | Male | Female |
| Under 5 Years | 0 (0.0%) | 0 (0.0%) |
| 5 to 17 Years | 0 (0.0%) | 0 (0.0%) |
| 18 to 34 Years | 5 (1.4%) | 0 (0.0%) |
| 35 to 64 Years | 24 (6.0%) | 56 (12.9%) |
| 65 to 74 Years | 12 (7.8%) | 17 (8.6%) |
| 75 Years and over | 18 (62.1%) | 35 (100.0%) |
Disability Class by Sex by Age in Bellerose Terrace
Disability Class: Hearing Difficulty
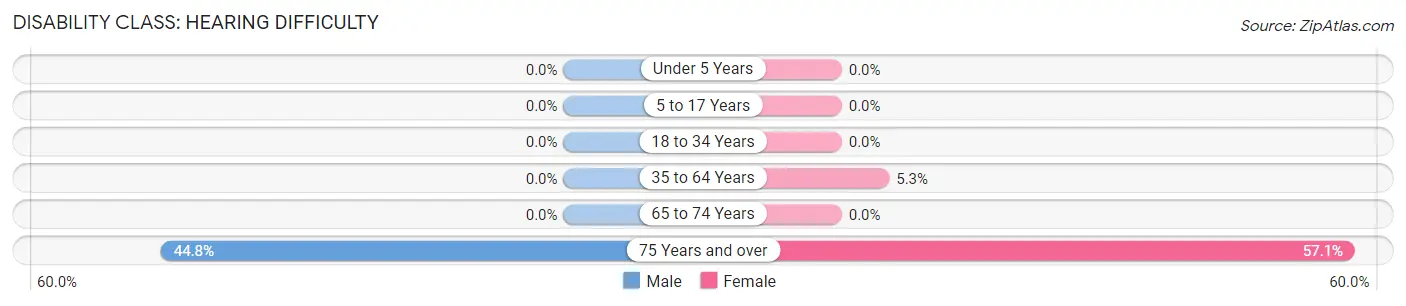
| Age Bracket | Male | Female |
| Under 5 Years | 0 (0.0%) | 0 (0.0%) |
| 5 to 17 Years | 0 (0.0%) | 0 (0.0%) |
| 18 to 34 Years | 0 (0.0%) | 0 (0.0%) |
| 35 to 64 Years | 0 (0.0%) | 23 (5.3%) |
| 65 to 74 Years | 0 (0.0%) | 0 (0.0%) |
| 75 Years and over | 13 (44.8%) | 20 (57.1%) |
Disability Class: Vision Difficulty
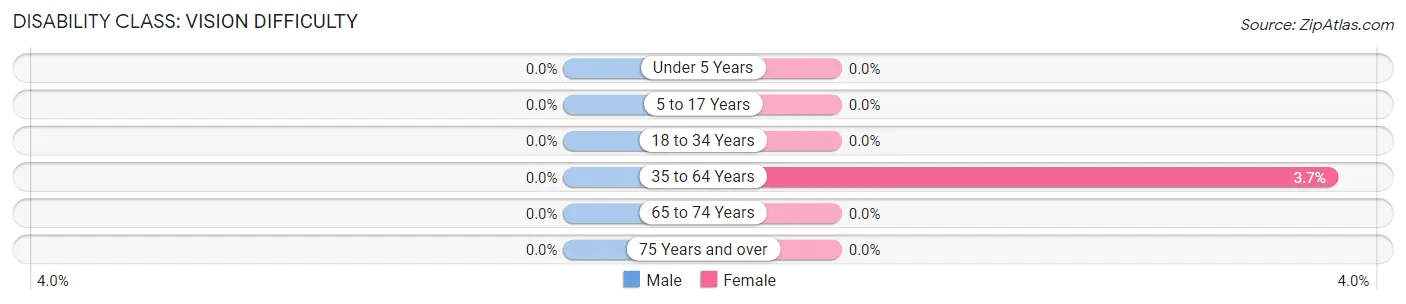
| Age Bracket | Male | Female |
| Under 5 Years | 0 (0.0%) | 0 (0.0%) |
| 5 to 17 Years | 0 (0.0%) | 0 (0.0%) |
| 18 to 34 Years | 0 (0.0%) | 0 (0.0%) |
| 35 to 64 Years | 0 (0.0%) | 16 (3.7%) |
| 65 to 74 Years | 0 (0.0%) | 0 (0.0%) |
| 75 Years and over | 0 (0.0%) | 0 (0.0%) |
Disability Class: Cognitive Difficulty
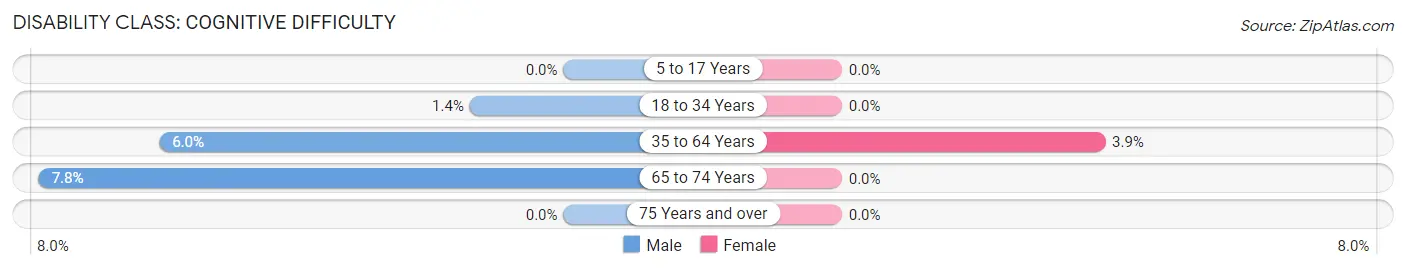
| Age Bracket | Male | Female |
| 5 to 17 Years | 0 (0.0%) | 0 (0.0%) |
| 18 to 34 Years | 5 (1.4%) | 0 (0.0%) |
| 35 to 64 Years | 24 (6.0%) | 17 (3.9%) |
| 65 to 74 Years | 12 (7.8%) | 0 (0.0%) |
| 75 Years and over | 0 (0.0%) | 0 (0.0%) |
Disability Class: Ambulatory Difficulty
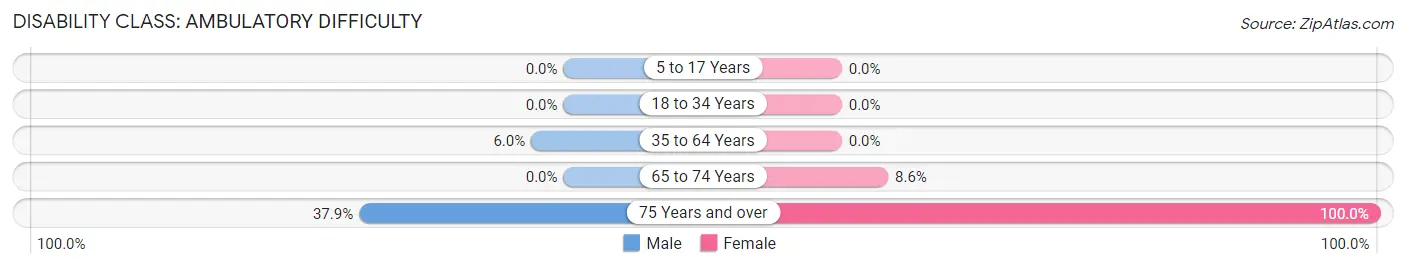
| Age Bracket | Male | Female |
| 5 to 17 Years | 0 (0.0%) | 0 (0.0%) |
| 18 to 34 Years | 0 (0.0%) | 0 (0.0%) |
| 35 to 64 Years | 24 (6.0%) | 0 (0.0%) |
| 65 to 74 Years | 0 (0.0%) | 17 (8.6%) |
| 75 Years and over | 11 (37.9%) | 35 (100.0%) |
Disability Class: Self-Care Difficulty
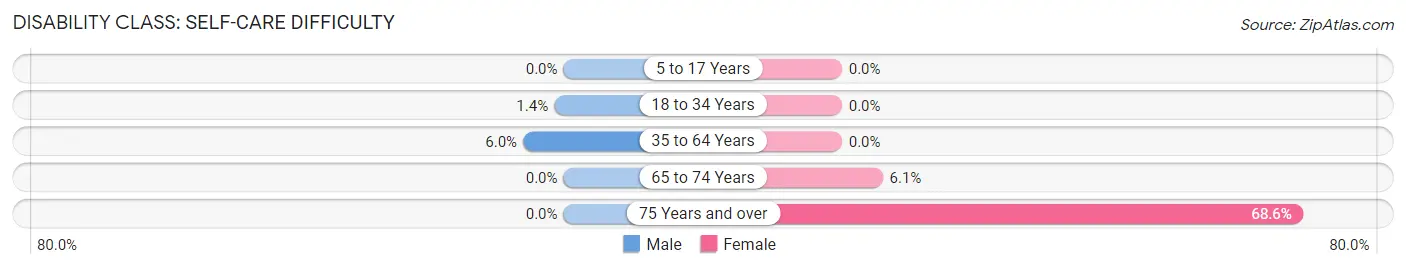
| Age Bracket | Male | Female |
| 5 to 17 Years | 0 (0.0%) | 0 (0.0%) |
| 18 to 34 Years | 5 (1.4%) | 0 (0.0%) |
| 35 to 64 Years | 24 (6.0%) | 0 (0.0%) |
| 65 to 74 Years | 0 (0.0%) | 12 (6.1%) |
| 75 Years and over | 0 (0.0%) | 24 (68.6%) |
Technology Access in Bellerose Terrace
Computing Device Access in Bellerose Terrace
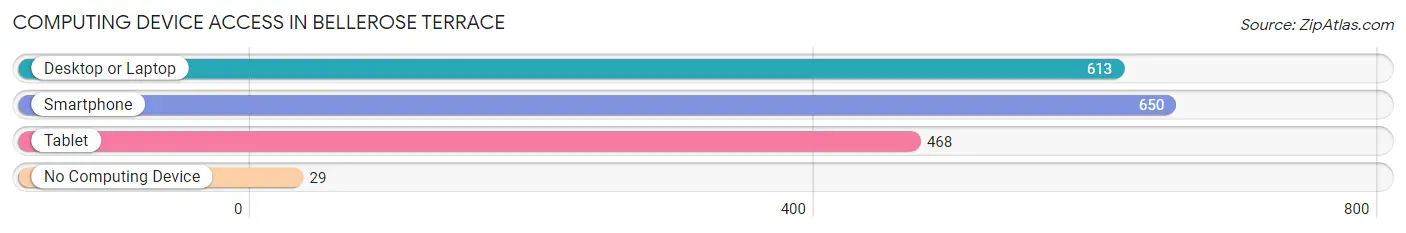
| Device Type | # Households | % Households |
| Desktop or Laptop | 613 | 88.8% |
| Smartphone | 650 | 94.2% |
| Tablet | 468 | 67.8% |
| No Computing Device | 29 | 4.2% |
| Total | 690 | 100.0% |
Internet Access in Bellerose Terrace
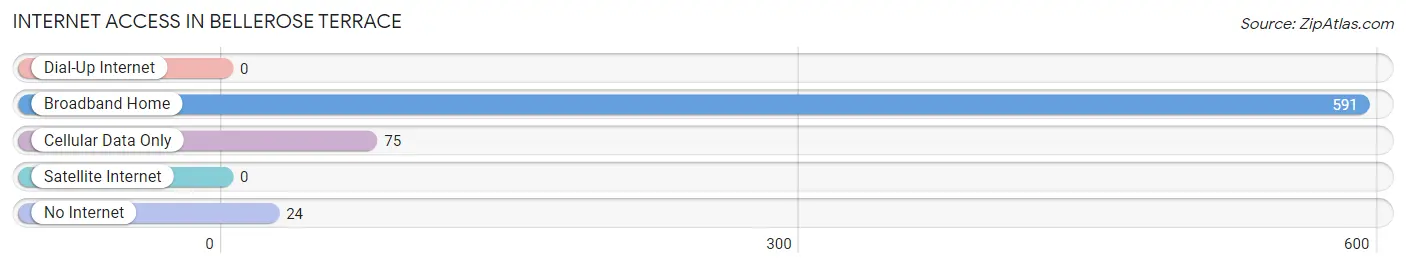
| Internet Type | # Households | % Households |
| Dial-Up Internet | 0 | 0.0% |
| Broadband Home | 591 | 85.7% |
| Cellular Data Only | 75 | 10.9% |
| Satellite Internet | 0 | 0.0% |
| No Internet | 24 | 3.5% |
| Total | 690 | 100.0% |
Bellerose Terrace Summary
Bellerose Terrace is a hamlet located in the Town of Hempstead in Nassau County, New York. It is situated on the south shore of Long Island, approximately 25 miles east of Manhattan. The hamlet is bordered by the hamlets of Bellerose, Floral Park, and Queens Village. As of the 2010 census, the population of Bellerose Terrace was 4,845.
History
The area that is now Bellerose Terrace was originally inhabited by the Matinecock Native American tribe. The first European settlers arrived in the area in the mid-17th century. The hamlet was originally known as "Little Plains" and was part of the Town of Hempstead. In the late 19th century, the area was renamed "Bellerose Terrace" after the nearby hamlet of Bellerose.
Geography
Bellerose Terrace is located at 40°42'25" North, 73°43'17" West (40.706944, -73.721389). The hamlet has a total area of 0.6 square miles, all of which is land. It is situated on the south shore of Long Island, approximately 25 miles east of Manhattan.
Economy
Bellerose Terrace is primarily a residential community, with most of its residents commuting to nearby cities for work. The hamlet is home to several small businesses, including restaurants, retail stores, and professional services.
Demographics
As of the 2010 census, the population of Bellerose Terrace was 4,845. The racial makeup of the hamlet was 79.2% White, 8.2% African American, 0.2% Native American, 6.2% Asian, and 4.2% from other races. Hispanic or Latino of any race were 11.3% of the population. The median household income was $90,945, and the median family income was $103,945.
Conclusion
Bellerose Terrace is a small hamlet located in the Town of Hempstead in Nassau County, New York. It is situated on the south shore of Long Island, approximately 25 miles east of Manhattan. The hamlet is primarily a residential community, with most of its residents commuting to nearby cities for work. As of the 2010 census, the population of Bellerose Terrace was 4,845. The racial makeup of the hamlet was 79.2% White, 8.2% African American, 0.2% Native American, 6.2% Asian, and 4.2% from other races. Hispanic or Latino of any race were 11.3% of the population. The median household income was $90,945, and the median family income was $103,945.
Common Questions
What is Per Capita Income in Bellerose Terrace?
Per Capita income in Bellerose Terrace is $36,011.
What is the Median Family Income in Bellerose Terrace?
Median Family Income in Bellerose Terrace is $153,080.
What is the Median Household income in Bellerose Terrace?
Median Household Income in Bellerose Terrace is $140,893.
What is Income or Wage Gap in Bellerose Terrace?
Income or Wage Gap in Bellerose Terrace is 25.4%.
Women in Bellerose Terrace earn 74.6 cents for every dollar earned by a man.
What is Inequality or Gini Index in Bellerose Terrace?
Inequality or Gini Index in Bellerose Terrace is 0.34.
What is the Total Population of Bellerose Terrace?
Total Population of Bellerose Terrace is 2,135.
What is the Total Male Population of Bellerose Terrace?
Total Male Population of Bellerose Terrace is 1,132.
What is the Total Female Population of Bellerose Terrace?
Total Female Population of Bellerose Terrace is 1,003.
What is the Ratio of Males per 100 Females in Bellerose Terrace?
There are 112.86 Males per 100 Females in Bellerose Terrace.
What is the Ratio of Females per 100 Males in Bellerose Terrace?
There are 88.60 Females per 100 Males in Bellerose Terrace.
What is the Median Population Age in Bellerose Terrace?
Median Population Age in Bellerose Terrace is 45.1 Years.
What is the Average Family Size in Bellerose Terrace
Average Family Size in Bellerose Terrace is 3.2 People.
What is the Average Household Size in Bellerose Terrace
Average Household Size in Bellerose Terrace is 3.1 People.
How Large is the Labor Force in Bellerose Terrace?
There are 1,265 People in the Labor Forcein in Bellerose Terrace.
What is the Percentage of People in the Labor Force in Bellerose Terrace?
68.7% of People are in the Labor Force in Bellerose Terrace.
What is the Unemployment Rate in Bellerose Terrace?
Unemployment Rate in Bellerose Terrace is 11.6%.