Buchanan, NY Map & Demographics
Buchanan Map
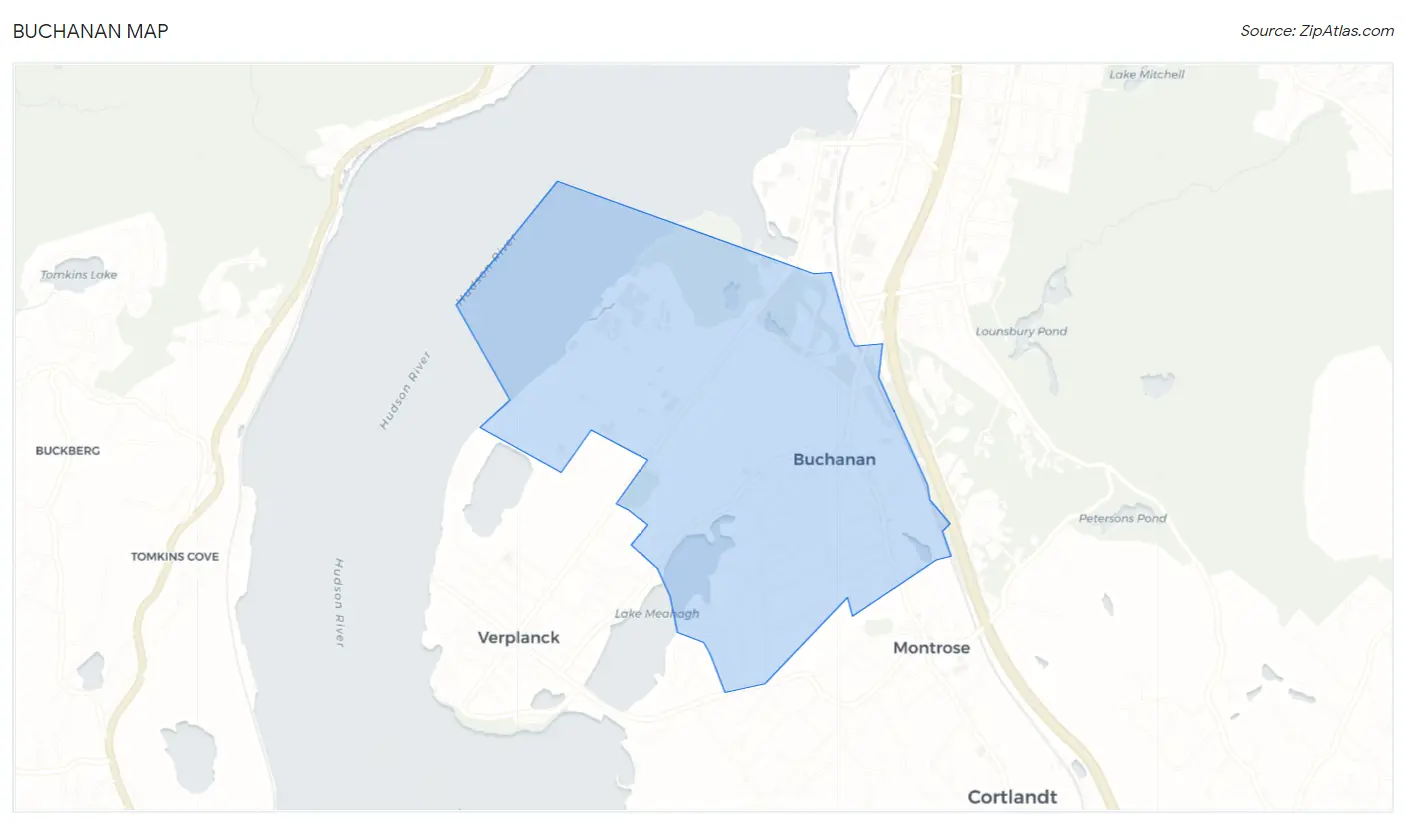
Buchanan Overview
$61,404
PER CAPITA INCOME
$147,344
AVG FAMILY INCOME
$133,646
AVG HOUSEHOLD INCOME
25.9%
WAGE / INCOME GAP [ % ]
74.1¢/ $1
WAGE / INCOME GAP [ $ ]
0.44
INEQUALITY / GINI INDEX
2,272
TOTAL POPULATION
1,125
MALE POPULATION
1,147
FEMALE POPULATION
98.08
MALES / 100 FEMALES
101.96
FEMALES / 100 MALES
42.3
MEDIAN AGE
3.3
AVG FAMILY SIZE
2.9
AVG HOUSEHOLD SIZE
1,207
LABOR FORCE [ PEOPLE ]
65.3%
PERCENT IN LABOR FORCE
2.6%
UNEMPLOYMENT RATE
Buchanan Zip Codes
Buchanan Area Codes
Income in Buchanan
Income Overview in Buchanan
Per Capita Income in Buchanan is $61,404, while median incomes of families and households are $147,344 and $133,646 respectively.
| Characteristic | Number | Measure |
| Per Capita Income | 2,272 | $61,404 |
| Median Family Income | 615 | $147,344 |
| Mean Family Income | 615 | $185,343 |
| Median Household Income | 787 | $133,646 |
| Mean Household Income | 787 | $167,894 |
| Income Deficit | 615 | $0 |
| Wage / Income Gap (%) | 2,272 | 25.93% |
| Wage / Income Gap ($) | 2,272 | 74.07¢ per $1 |
| Gini / Inequality Index | 2,272 | 0.44 |
Earnings by Sex in Buchanan
Average Earnings in Buchanan are $56,708, $70,724 for men and $52,386 for women, a difference of 25.9%.
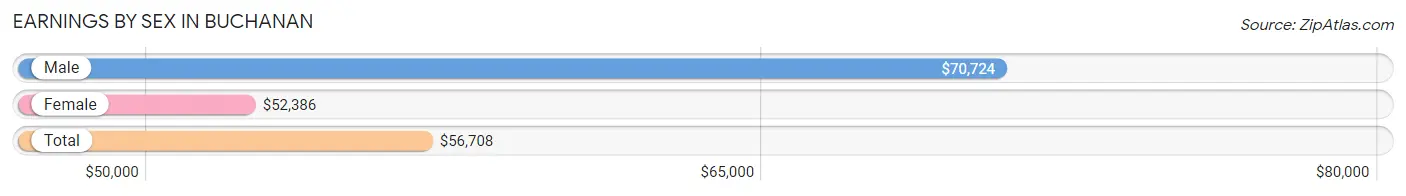
| Sex | Number | Average Earnings |
| Male | 681 (50.5%) | $70,724 |
| Female | 667 (49.5%) | $52,386 |
| Total | 1,348 (100.0%) | $56,708 |
Earnings by Sex by Income Bracket in Buchanan
The most common earnings brackets in Buchanan are $100,000+ for men (217 | 31.9%) and $75,000 to $99,999 for women (140 | 21.0%).
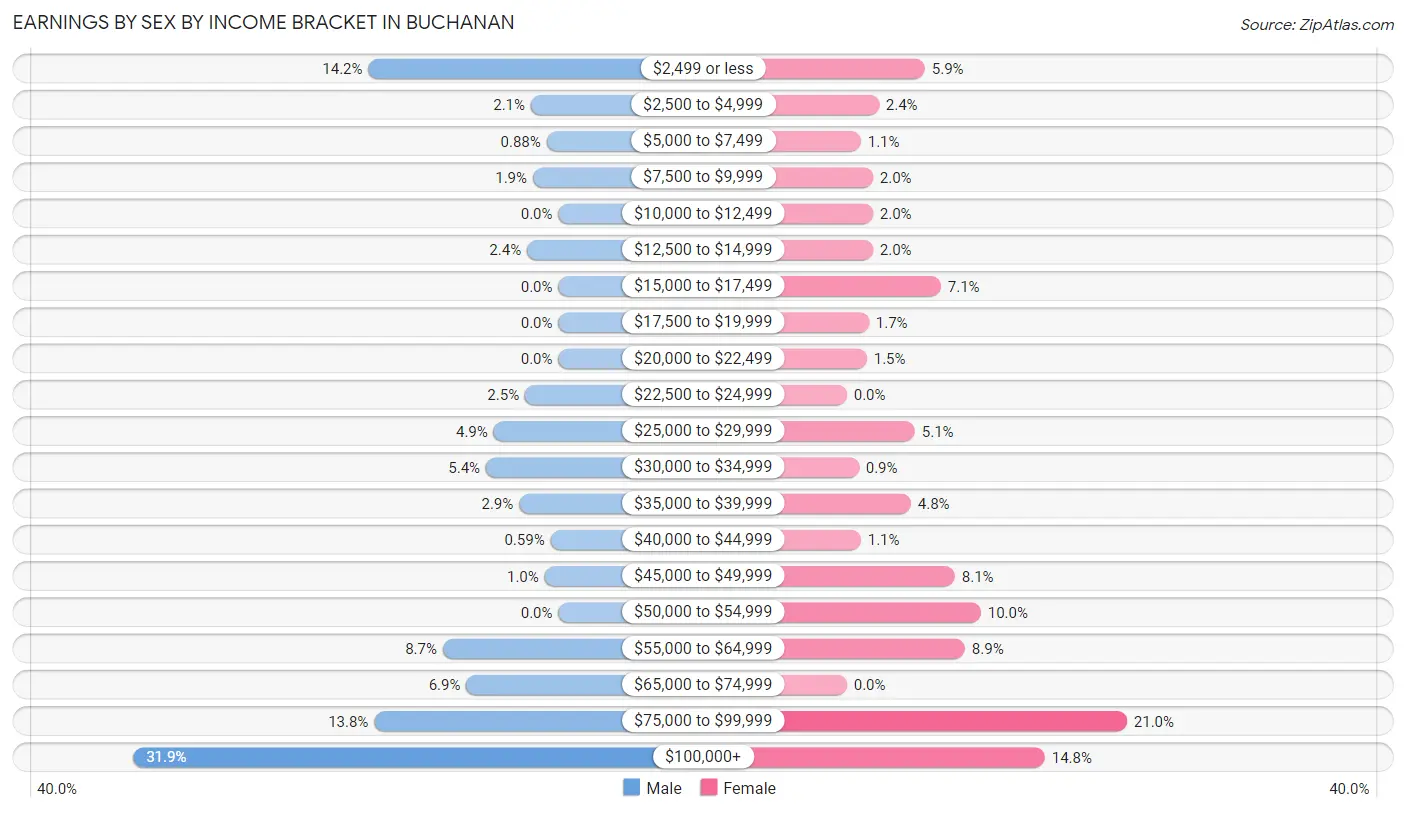
| Income | Male | Female |
| $2,499 or less | 97 (14.2%) | 39 (5.9%) |
| $2,500 to $4,999 | 14 (2.1%) | 16 (2.4%) |
| $5,000 to $7,499 | 6 (0.9%) | 7 (1.1%) |
| $7,500 to $9,999 | 13 (1.9%) | 13 (1.9%) |
| $10,000 to $12,499 | 0 (0.0%) | 13 (1.9%) |
| $12,500 to $14,999 | 16 (2.4%) | 13 (1.9%) |
| $15,000 to $17,499 | 0 (0.0%) | 47 (7.0%) |
| $17,500 to $19,999 | 0 (0.0%) | 11 (1.7%) |
| $20,000 to $22,499 | 0 (0.0%) | 10 (1.5%) |
| $22,500 to $24,999 | 17 (2.5%) | 0 (0.0%) |
| $25,000 to $29,999 | 33 (4.9%) | 34 (5.1%) |
| $30,000 to $34,999 | 37 (5.4%) | 6 (0.9%) |
| $35,000 to $39,999 | 20 (2.9%) | 32 (4.8%) |
| $40,000 to $44,999 | 4 (0.6%) | 7 (1.1%) |
| $45,000 to $49,999 | 7 (1.0%) | 54 (8.1%) |
| $50,000 to $54,999 | 0 (0.0%) | 67 (10.0%) |
| $55,000 to $64,999 | 59 (8.7%) | 59 (8.8%) |
| $65,000 to $74,999 | 47 (6.9%) | 0 (0.0%) |
| $75,000 to $99,999 | 94 (13.8%) | 140 (21.0%) |
| $100,000+ | 217 (31.9%) | 99 (14.8%) |
| Total | 681 (100.0%) | 667 (100.0%) |
Earnings by Sex by Educational Attainment in Buchanan
Average earnings in Buchanan are $81,167 for men and $53,199 for women, a difference of 34.5%. Men with an educational attainment of graduate degree enjoy the highest average annual earnings of $127,500, while those with high school diploma education earn the least with $71,316. Women with an educational attainment of graduate degree earn the most with the average annual earnings of $81,667, while those with high school diploma education have the smallest earnings of $45,625.
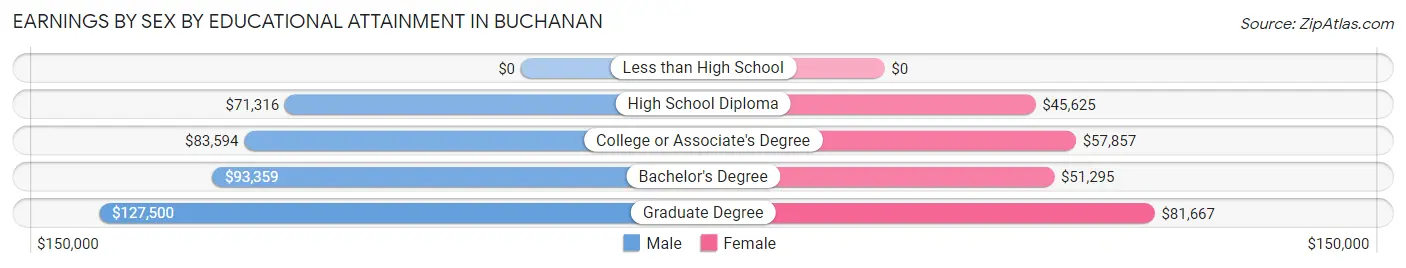
| Educational Attainment | Male Income | Female Income |
| Less than High School | - | - |
| High School Diploma | $71,316 | $45,625 |
| College or Associate's Degree | $83,594 | $57,857 |
| Bachelor's Degree | $93,359 | $51,295 |
| Graduate Degree | $127,500 | $81,667 |
| Total | $81,167 | $53,199 |
Family Income in Buchanan
Family Income Brackets in Buchanan
According to the Buchanan family income data, there are 180 families falling into the $200,000+ income range, which is the most common income bracket and makes up 29.3% of all families.
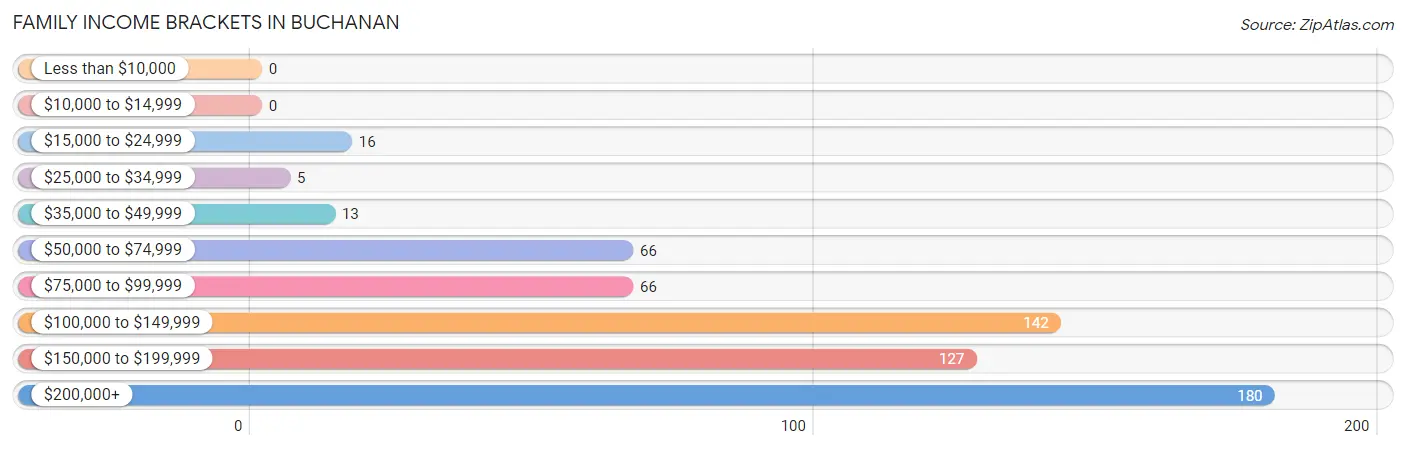
| Income Bracket | # Families | % Families |
| Less than $10,000 | 0 | 0.0% |
| $10,000 to $14,999 | 0 | 0.0% |
| $15,000 to $24,999 | 16 | 2.6% |
| $25,000 to $34,999 | 5 | 0.8% |
| $35,000 to $49,999 | 13 | 2.1% |
| $50,000 to $74,999 | 66 | 10.7% |
| $75,000 to $99,999 | 66 | 10.7% |
| $100,000 to $149,999 | 142 | 23.1% |
| $150,000 to $199,999 | 127 | 20.7% |
| $200,000+ | 180 | 29.3% |
Family Income by Famaliy Size in Buchanan
3-person families (264 | 42.9%) account for the highest median family income in Buchanan with $165,426 per family, while 3-person families (264 | 42.9%) have the highest median income of $55,142 per family member.
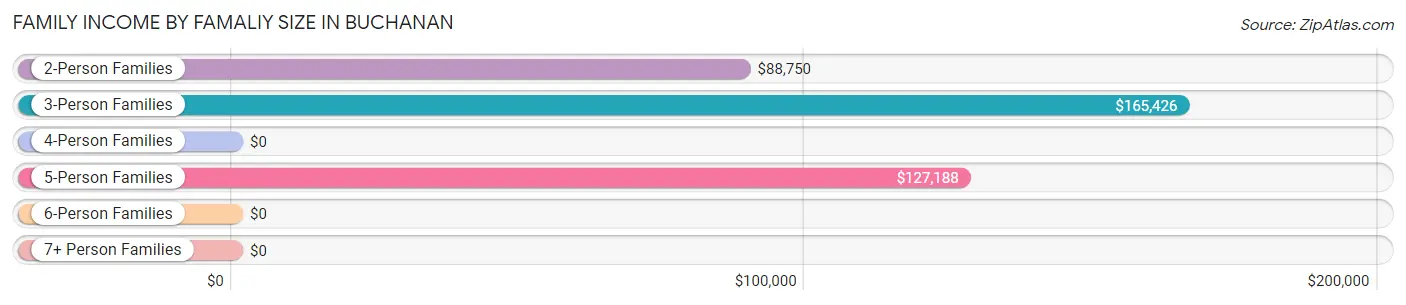
| Income Bracket | # Families | Median Income |
| 2-Person Families | 209 (34.0%) | $88,750 |
| 3-Person Families | 264 (42.9%) | $165,426 |
| 4-Person Families | 79 (12.9%) | $0 |
| 5-Person Families | 56 (9.1%) | $127,188 |
| 6-Person Families | 7 (1.1%) | $0 |
| 7+ Person Families | 0 (0.0%) | $0 |
| Total | 615 (100.0%) | $147,344 |
Family Income by Number of Earners in Buchanan
The median family income in Buchanan is $147,344, with families comprising 3+ earners (124) having the highest median family income of $250,001, while families with no earners (78) have the lowest median family income of $70,000, accounting for 20.2% and 12.7% of families, respectively.
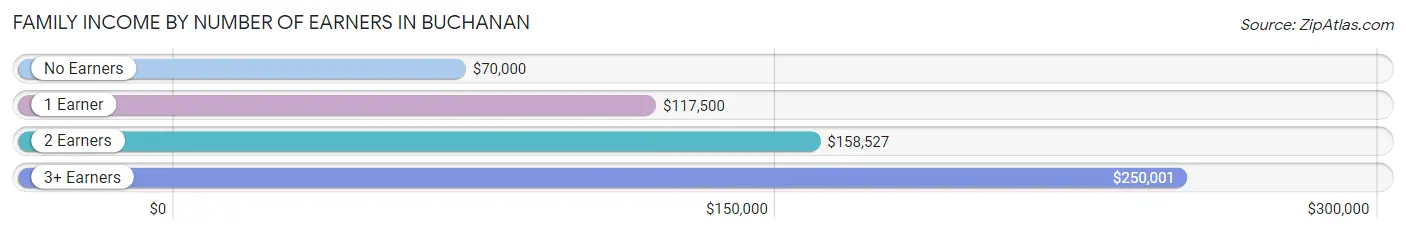
| Number of Earners | # Families | Median Income |
| No Earners | 78 (12.7%) | $70,000 |
| 1 Earner | 104 (16.9%) | $117,500 |
| 2 Earners | 309 (50.2%) | $158,527 |
| 3+ Earners | 124 (20.2%) | $250,001 |
| Total | 615 (100.0%) | $147,344 |
Household Income in Buchanan
Household Income Brackets in Buchanan
With 191 households falling in the category, the $200,000+ income range is the most frequent in Buchanan, accounting for 24.3% of all households. In contrast, only 16 households (2.0%) fall into the $10,000 to $14,999 income bracket, making it the least populous group.
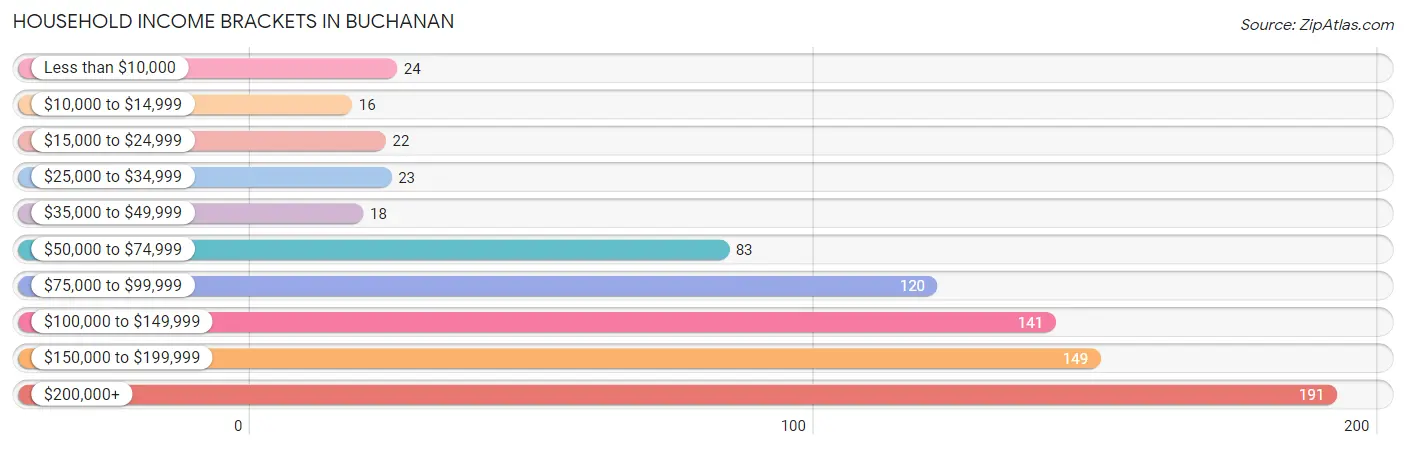
| Income Bracket | # Households | % Households |
| Less than $10,000 | 24 | 3.0% |
| $10,000 to $14,999 | 16 | 2.0% |
| $15,000 to $24,999 | 22 | 2.8% |
| $25,000 to $34,999 | 23 | 2.9% |
| $35,000 to $49,999 | 18 | 2.3% |
| $50,000 to $74,999 | 83 | 10.5% |
| $75,000 to $99,999 | 120 | 15.2% |
| $100,000 to $149,999 | 141 | 17.9% |
| $150,000 to $199,999 | 149 | 18.9% |
| $200,000+ | 191 | 24.3% |
Household Income by Householder Age in Buchanan
The median household income in Buchanan is $133,646, with the highest median household income of $158,661 found in the 25 to 44 years age bracket for the primary householder. A total of 166 households (21.1%) fall into this category.
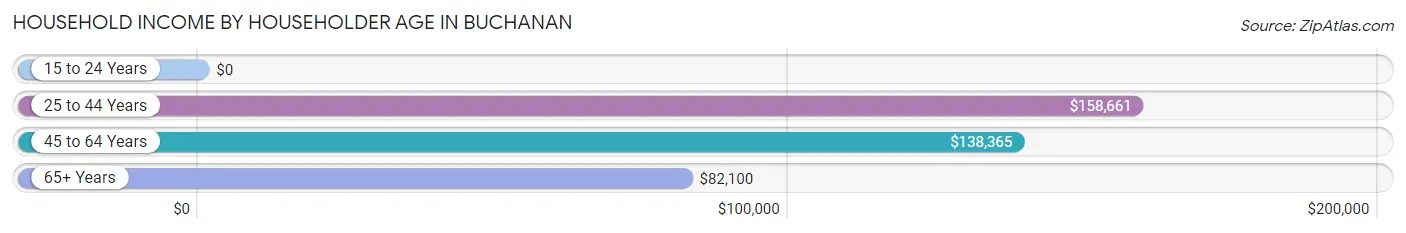
| Income Bracket | # Households | Median Income |
| 15 to 24 Years | 0 (0.0%) | $0 |
| 25 to 44 Years | 166 (21.1%) | $158,661 |
| 45 to 64 Years | 381 (48.4%) | $138,365 |
| 65+ Years | 240 (30.5%) | $82,100 |
| Total | 787 (100.0%) | $133,646 |
Poverty in Buchanan
Income Below Poverty by Sex and Age in Buchanan
With 3.5% poverty level for males and 3.9% for females among the residents of Buchanan, 65 to 74 year old males and 15 year old females are the most vulnerable to poverty, with 22 males (22.9%) and 7 females (12.5%) in their respective age groups living below the poverty level.
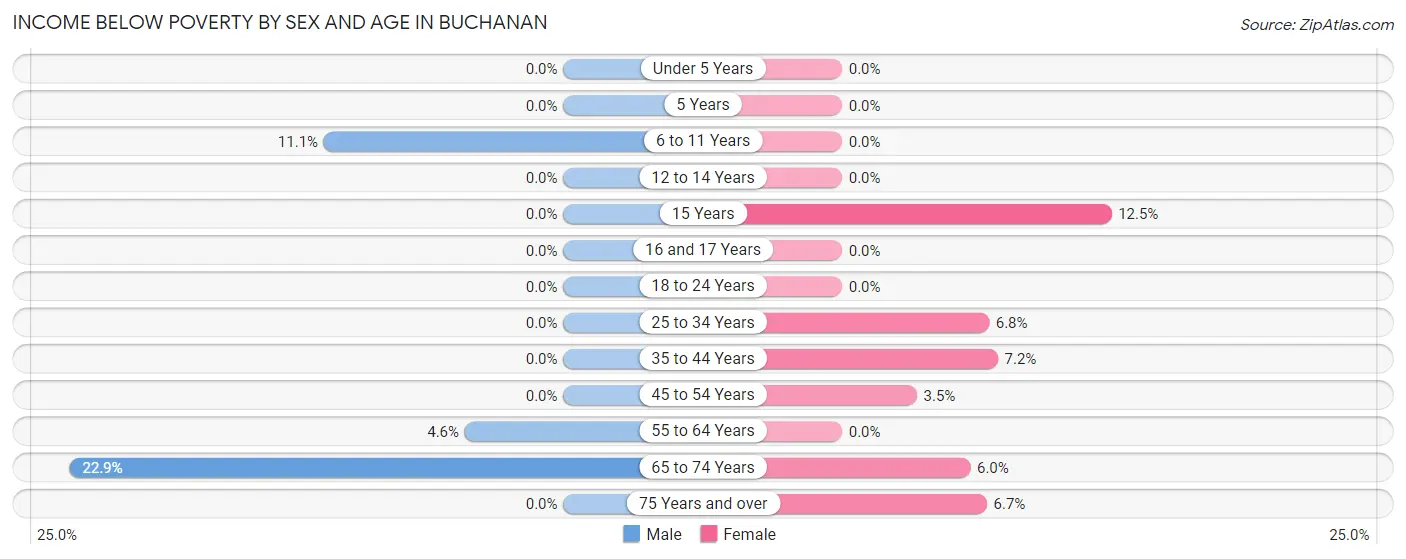
| Age Bracket | Male | Female |
| Under 5 Years | 0 (0.0%) | 0 (0.0%) |
| 5 Years | 0 (0.0%) | 0 (0.0%) |
| 6 to 11 Years | 7 (11.1%) | 0 (0.0%) |
| 12 to 14 Years | 0 (0.0%) | 0 (0.0%) |
| 15 Years | 0 (0.0%) | 7 (12.5%) |
| 16 and 17 Years | 0 (0.0%) | 0 (0.0%) |
| 18 to 24 Years | 0 (0.0%) | 0 (0.0%) |
| 25 to 34 Years | 0 (0.0%) | 12 (6.8%) |
| 35 to 44 Years | 0 (0.0%) | 6 (7.2%) |
| 45 to 54 Years | 0 (0.0%) | 6 (3.5%) |
| 55 to 64 Years | 10 (4.6%) | 0 (0.0%) |
| 65 to 74 Years | 22 (22.9%) | 5 (5.9%) |
| 75 Years and over | 0 (0.0%) | 9 (6.7%) |
| Total | 39 (3.5%) | 45 (3.9%) |
Income Above Poverty by Sex and Age in Buchanan
According to the poverty statistics in Buchanan, males aged under 5 years and females aged under 5 years are the age groups that are most secure financially, with 100.0% of males and 100.0% of females in these age groups living above the poverty line.
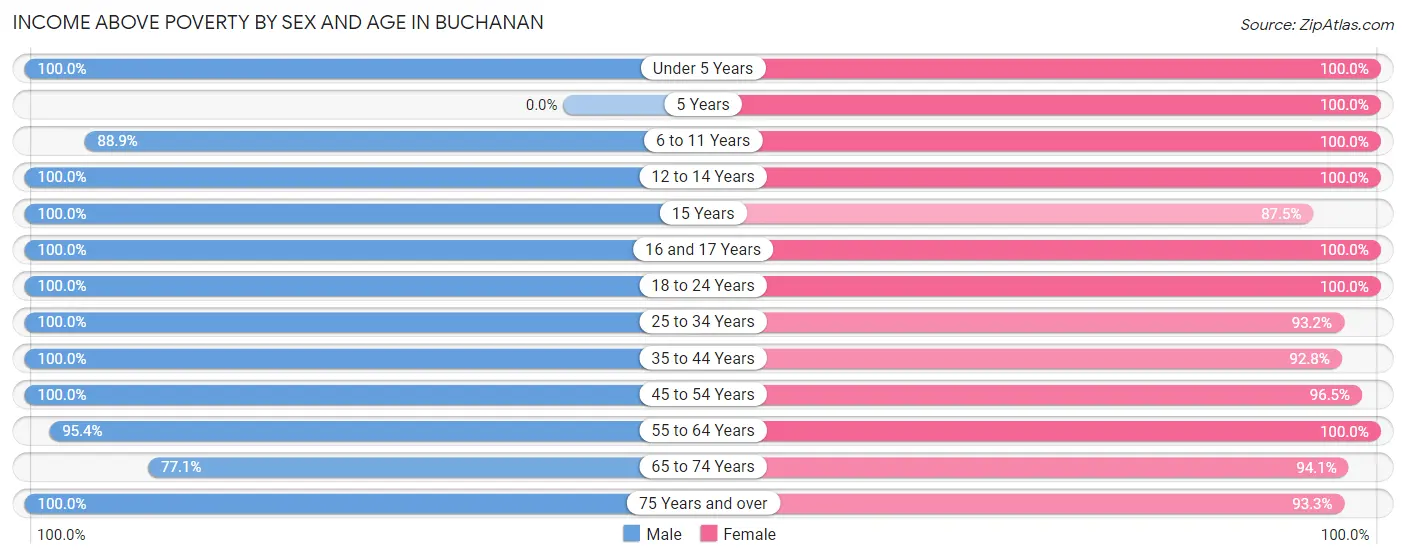
| Age Bracket | Male | Female |
| Under 5 Years | 22 (100.0%) | 97 (100.0%) |
| 5 Years | 0 (0.0%) | 30 (100.0%) |
| 6 to 11 Years | 56 (88.9%) | 25 (100.0%) |
| 12 to 14 Years | 98 (100.0%) | 26 (100.0%) |
| 15 Years | 6 (100.0%) | 49 (87.5%) |
| 16 and 17 Years | 7 (100.0%) | 15 (100.0%) |
| 18 to 24 Years | 155 (100.0%) | 61 (100.0%) |
| 25 to 34 Years | 143 (100.0%) | 164 (93.2%) |
| 35 to 44 Years | 127 (100.0%) | 77 (92.8%) |
| 45 to 54 Years | 91 (100.0%) | 167 (96.5%) |
| 55 to 64 Years | 209 (95.4%) | 187 (100.0%) |
| 65 to 74 Years | 74 (77.1%) | 79 (94.1%) |
| 75 Years and over | 98 (100.0%) | 125 (93.3%) |
| Total | 1,086 (96.5%) | 1,102 (96.1%) |
Income Below Poverty Among Married-Couple Families in Buchanan
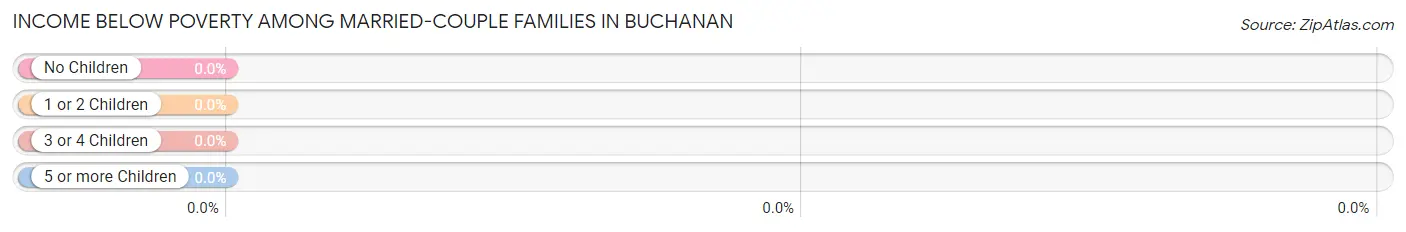
| Children | Above Poverty | Below Poverty |
| No Children | 265 (100.0%) | 0 (0.0%) |
| 1 or 2 Children | 221 (100.0%) | 0 (0.0%) |
| 3 or 4 Children | 19 (100.0%) | 0 (0.0%) |
| 5 or more Children | 0 (0.0%) | 0 (0.0%) |
| Total | 505 (100.0%) | 0 (0.0%) |
Income Below Poverty Among Single-Parent Households in Buchanan
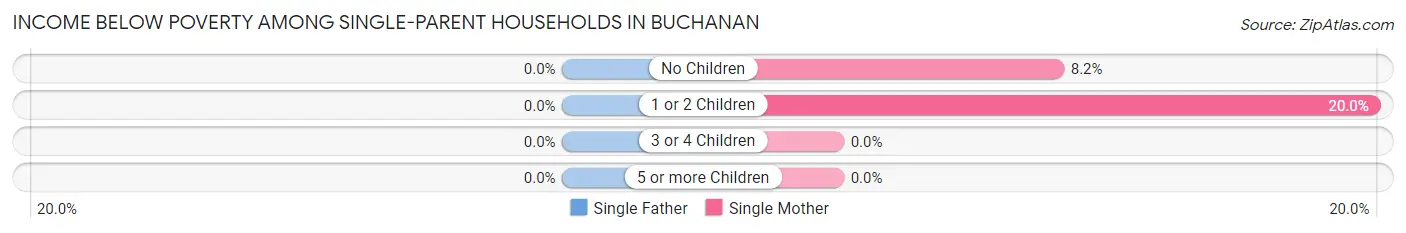
| Children | Single Father | Single Mother |
| No Children | 0 (0.0%) | 5 (8.2%) |
| 1 or 2 Children | 0 (0.0%) | 6 (20.0%) |
| 3 or 4 Children | 0 (0.0%) | 0 (0.0%) |
| 5 or more Children | 0 (0.0%) | 0 (0.0%) |
| Total | 0 (0.0%) | 11 (12.1%) |
Income Below Poverty Among Married-Couple vs Single-Parent Households in Buchanan
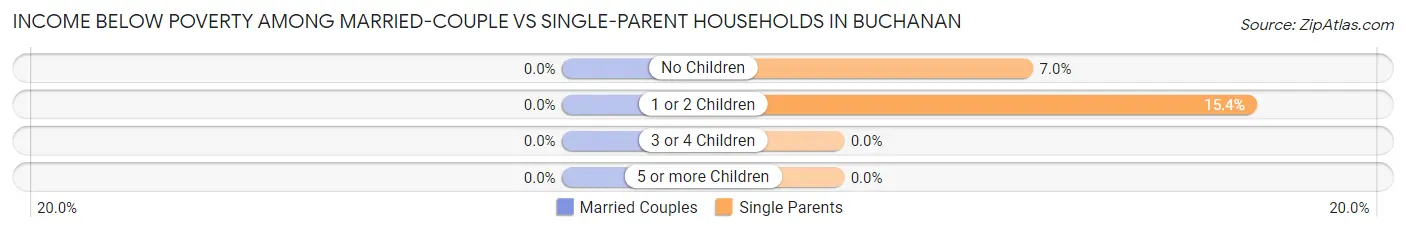
| Children | Married-Couple Families | Single-Parent Households |
| No Children | 0 (0.0%) | 5 (7.0%) |
| 1 or 2 Children | 0 (0.0%) | 6 (15.4%) |
| 3 or 4 Children | 0 (0.0%) | 0 (0.0%) |
| 5 or more Children | 0 (0.0%) | 0 (0.0%) |
| Total | 0 (0.0%) | 11 (10.0%) |
Race in Buchanan
The most populous races in Buchanan are White / Caucasian (1,569 | 69.1%), Hispanic or Latino (416 | 18.3%), and Two or more Races (284 | 12.5%).
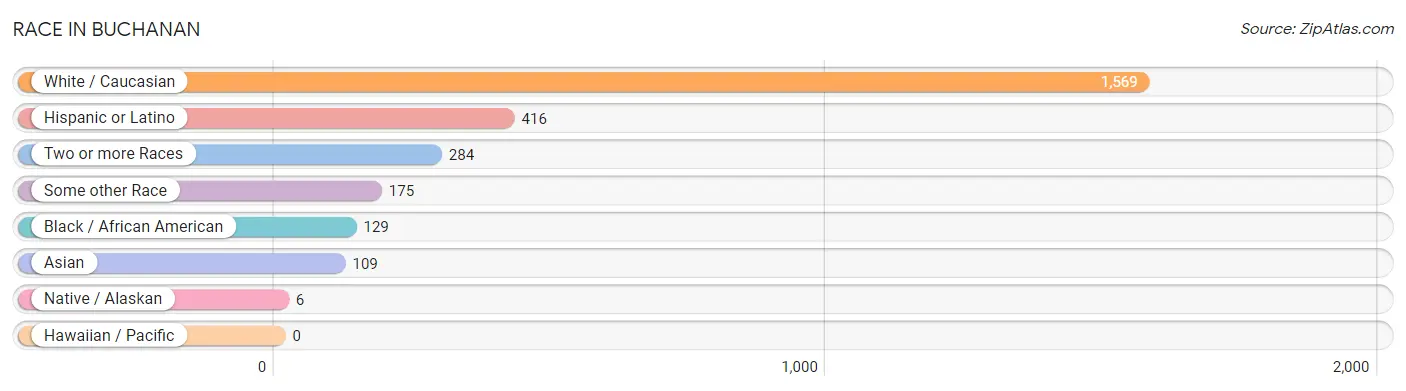
| Race | # Population | % Population |
| Asian | 109 | 4.8% |
| Black / African American | 129 | 5.7% |
| Hawaiian / Pacific | 0 | 0.0% |
| Hispanic or Latino | 416 | 18.3% |
| Native / Alaskan | 6 | 0.3% |
| White / Caucasian | 1,569 | 69.1% |
| Two or more Races | 284 | 12.5% |
| Some other Race | 175 | 7.7% |
| Total | 2,272 | 100.0% |
Ancestry in Buchanan
The most populous ancestries reported in Buchanan are Italian (583 | 25.7%), Irish (510 | 22.5%), South American (290 | 12.8%), German (241 | 10.6%), and Uruguayan (151 | 6.7%), together accounting for 78.1% of all Buchanan residents.
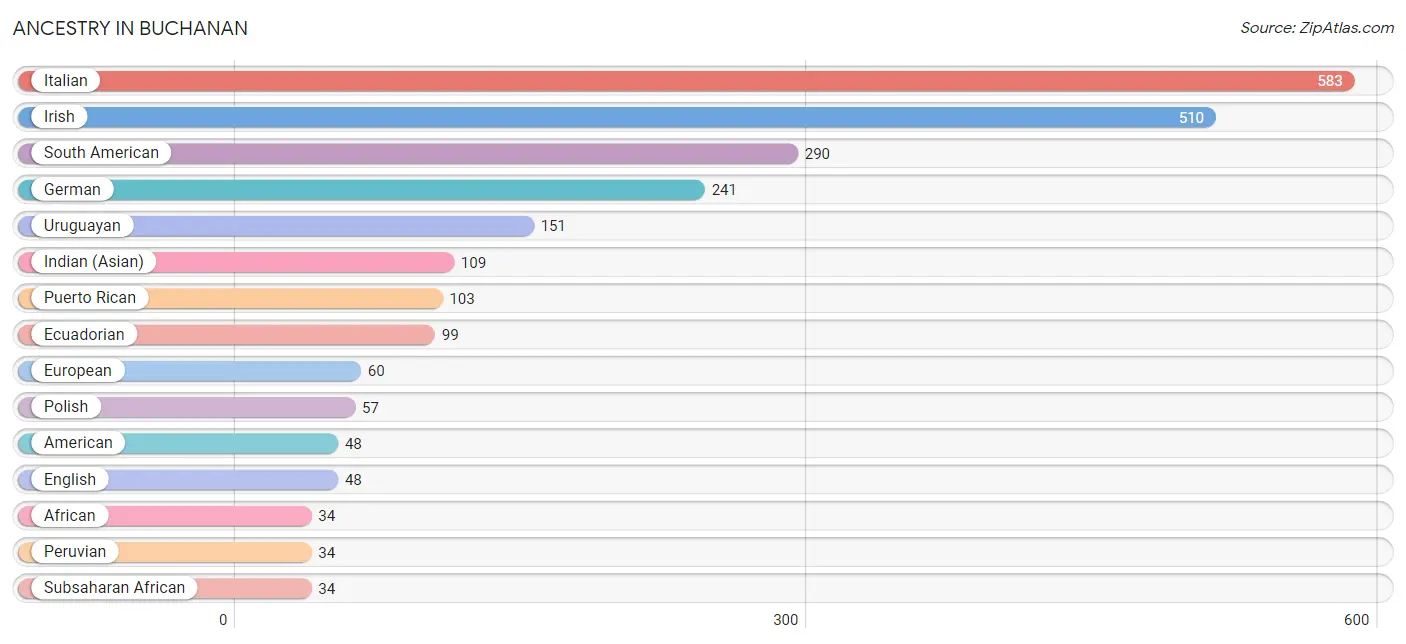
| Ancestry | # Population | % Population |
| African | 34 | 1.5% |
| American | 48 | 2.1% |
| Arab | 8 | 0.4% |
| Austrian | 27 | 1.2% |
| Belgian | 6 | 0.3% |
| Brazilian | 20 | 0.9% |
| British | 26 | 1.1% |
| Canadian | 6 | 0.3% |
| Chilean | 6 | 0.3% |
| Czech | 10 | 0.4% |
| Czechoslovakian | 12 | 0.5% |
| Dutch | 8 | 0.4% |
| Ecuadorian | 99 | 4.4% |
| English | 48 | 2.1% |
| European | 60 | 2.6% |
| French | 28 | 1.2% |
| French Canadian | 15 | 0.7% |
| German | 241 | 10.6% |
| Hungarian | 26 | 1.1% |
| Indian (Asian) | 109 | 4.8% |
| Irish | 510 | 22.5% |
| Italian | 583 | 25.7% |
| Peruvian | 34 | 1.5% |
| Polish | 57 | 2.5% |
| Portuguese | 20 | 0.9% |
| Puerto Rican | 103 | 4.5% |
| Russian | 11 | 0.5% |
| Scandinavian | 13 | 0.6% |
| Scotch-Irish | 7 | 0.3% |
| Scottish | 20 | 0.9% |
| Slovak | 4 | 0.2% |
| South American | 290 | 12.8% |
| Subsaharan African | 34 | 1.5% |
| Uruguayan | 151 | 6.7% |
| Welsh | 7 | 0.3% | View All 35 Rows |
Immigrants in Buchanan
The most numerous immigrant groups reported in Buchanan came from Latin America (98 | 4.3%), South America (87 | 3.8%), Asia (57 | 2.5%), China (57 | 2.5%), and Eastern Asia (57 | 2.5%), together accounting for 15.7% of all Buchanan residents.
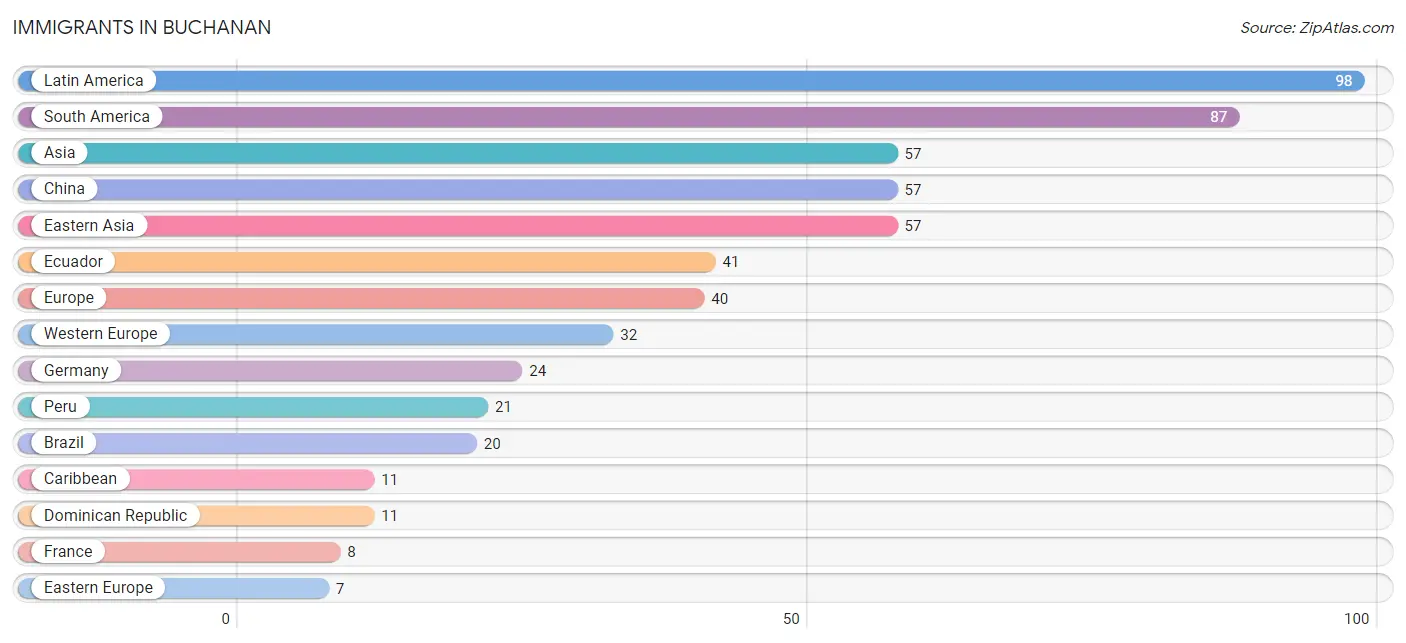
| Immigration Origin | # Population | % Population |
| Asia | 57 | 2.5% |
| Brazil | 20 | 0.9% |
| Caribbean | 11 | 0.5% |
| China | 57 | 2.5% |
| Dominican Republic | 11 | 0.5% |
| Eastern Asia | 57 | 2.5% |
| Eastern Europe | 7 | 0.3% |
| Ecuador | 41 | 1.8% |
| Europe | 40 | 1.8% |
| France | 8 | 0.4% |
| Germany | 24 | 1.1% |
| Italy | 1 | 0.0% |
| Latin America | 98 | 4.3% |
| Peru | 21 | 0.9% |
| Poland | 7 | 0.3% |
| South America | 87 | 3.8% |
| Southern Europe | 1 | 0.0% |
| Uruguay | 5 | 0.2% |
| Western Europe | 32 | 1.4% | View All 19 Rows |
Sex and Age in Buchanan
Sex and Age in Buchanan
The most populous age groups in Buchanan are 20 to 24 Years (138 | 12.3%) for men and 45 to 49 Years (132 | 11.5%) for women.
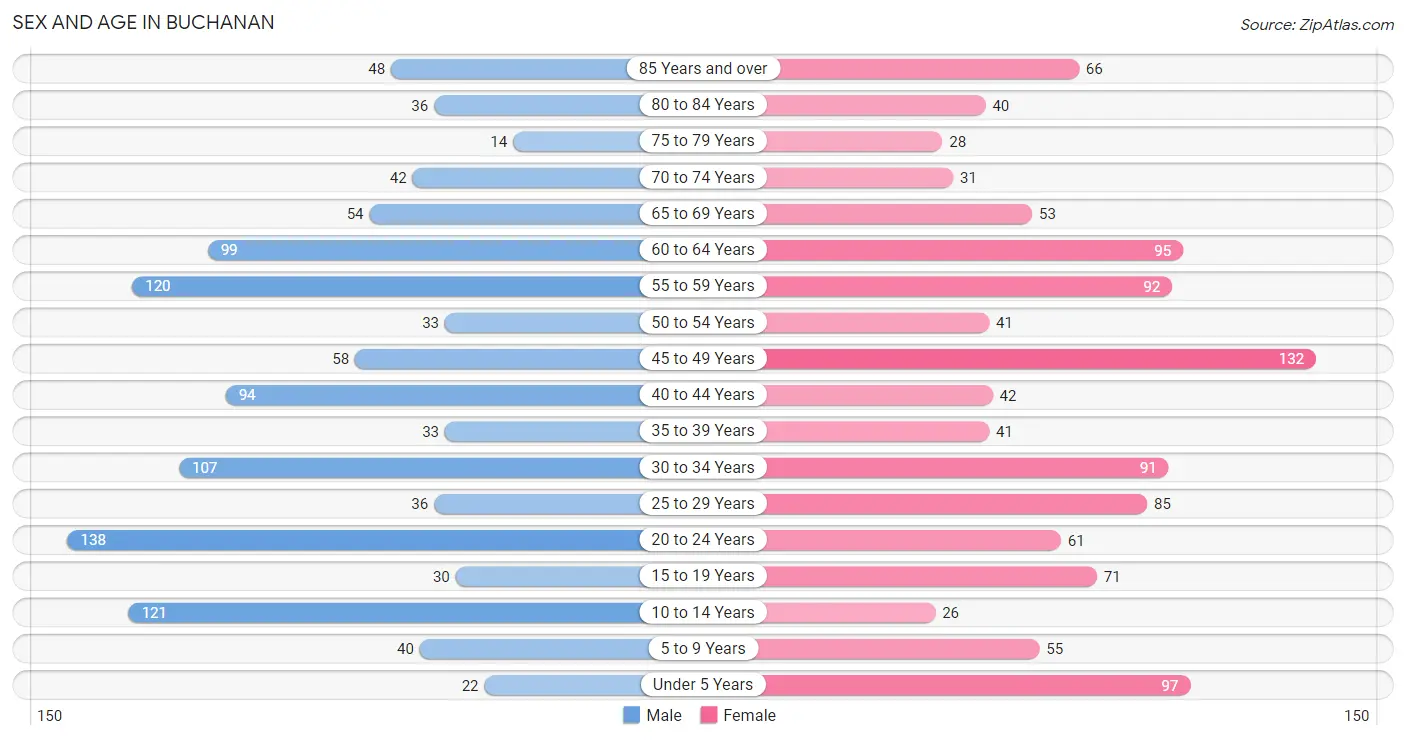
| Age Bracket | Male | Female |
| Under 5 Years | 22 (2.0%) | 97 (8.5%) |
| 5 to 9 Years | 40 (3.6%) | 55 (4.8%) |
| 10 to 14 Years | 121 (10.8%) | 26 (2.3%) |
| 15 to 19 Years | 30 (2.7%) | 71 (6.2%) |
| 20 to 24 Years | 138 (12.3%) | 61 (5.3%) |
| 25 to 29 Years | 36 (3.2%) | 85 (7.4%) |
| 30 to 34 Years | 107 (9.5%) | 91 (7.9%) |
| 35 to 39 Years | 33 (2.9%) | 41 (3.6%) |
| 40 to 44 Years | 94 (8.4%) | 42 (3.7%) |
| 45 to 49 Years | 58 (5.2%) | 132 (11.5%) |
| 50 to 54 Years | 33 (2.9%) | 41 (3.6%) |
| 55 to 59 Years | 120 (10.7%) | 92 (8.0%) |
| 60 to 64 Years | 99 (8.8%) | 95 (8.3%) |
| 65 to 69 Years | 54 (4.8%) | 53 (4.6%) |
| 70 to 74 Years | 42 (3.7%) | 31 (2.7%) |
| 75 to 79 Years | 14 (1.2%) | 28 (2.4%) |
| 80 to 84 Years | 36 (3.2%) | 40 (3.5%) |
| 85 Years and over | 48 (4.3%) | 66 (5.8%) |
| Total | 1,125 (100.0%) | 1,147 (100.0%) |
Families and Households in Buchanan
Median Family Size in Buchanan
The median family size in Buchanan is 3.33 persons per family, with married-couple families (505 | 82.1%) accounting for the largest median family size of 3.44 persons per family. On the other hand, single female/mother families (91 | 14.8%) represent the smallest median family size with 2.77 persons per family.
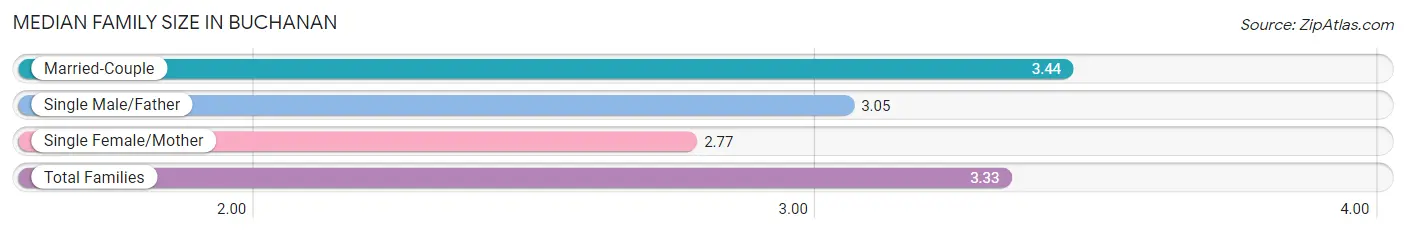
| Family Type | # Families | Family Size |
| Married-Couple | 505 (82.1%) | 3.44 |
| Single Male/Father | 19 (3.1%) | 3.05 |
| Single Female/Mother | 91 (14.8%) | 2.77 |
| Total Families | 615 (100.0%) | 3.33 |
Median Household Size in Buchanan
The median household size in Buchanan is 2.86 persons per household, with married-couple households (505 | 64.2%) accounting for the largest median household size of 3.47 persons per household. non-family households (172 | 21.9%) represent the smallest median household size with 1.04 persons per household.
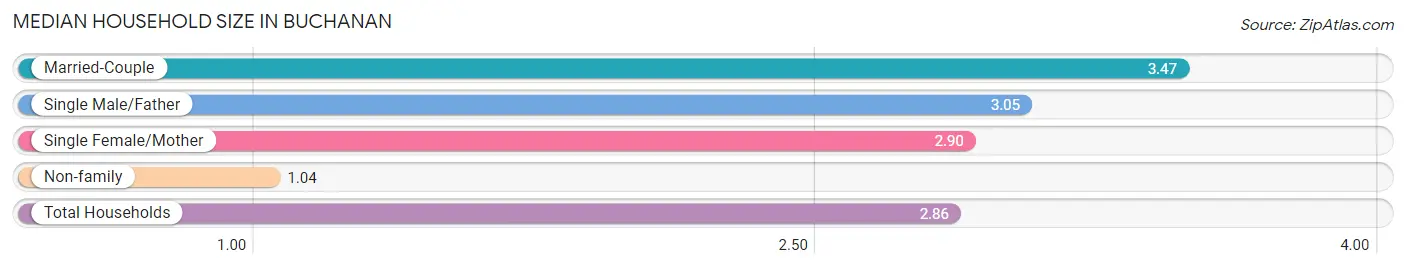
| Household Type | # Households | Household Size |
| Married-Couple | 505 (64.2%) | 3.47 |
| Single Male/Father | 19 (2.4%) | 3.05 |
| Single Female/Mother | 91 (11.6%) | 2.90 |
| Non-family | 172 (21.9%) | 1.04 |
| Total Households | 787 (100.0%) | 2.86 |
Household Size by Marriage Status in Buchanan
Out of a total of 787 households in Buchanan, 615 (78.1%) are family households, while 172 (21.9%) are nonfamily households. The most numerous type of family households are 3-person households, comprising 245, and the most common type of nonfamily households are 1-person households, comprising 165.
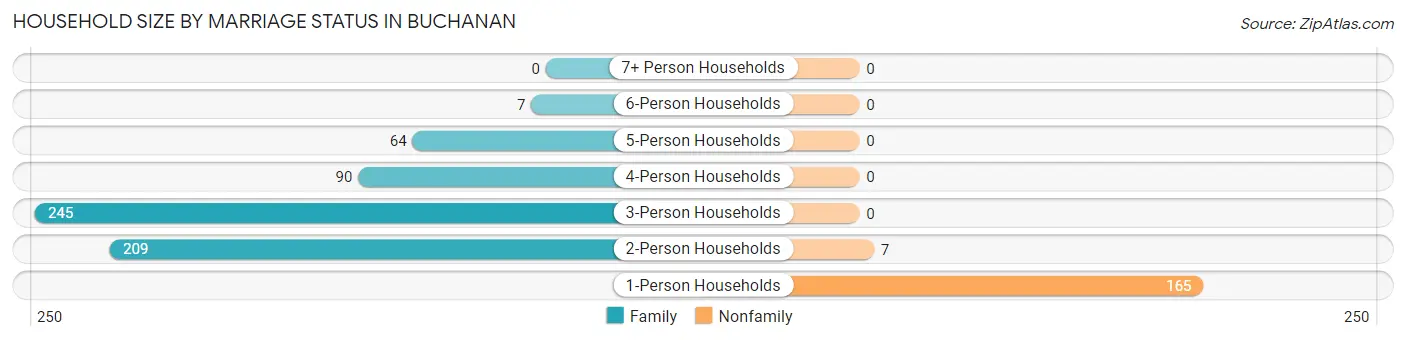
| Household Size | Family Households | Nonfamily Households |
| 1-Person Households | - | 165 (21.0%) |
| 2-Person Households | 209 (26.6%) | 7 (0.9%) |
| 3-Person Households | 245 (31.1%) | 0 (0.0%) |
| 4-Person Households | 90 (11.4%) | 0 (0.0%) |
| 5-Person Households | 64 (8.1%) | 0 (0.0%) |
| 6-Person Households | 7 (0.9%) | 0 (0.0%) |
| 7+ Person Households | 0 (0.0%) | 0 (0.0%) |
| Total | 615 (78.1%) | 172 (21.9%) |
Female Fertility in Buchanan
Fertility by Age in Buchanan

| Age Bracket | Women with Births | Births / 1,000 Women |
| 15 to 19 years | 0 (0.0%) | 0.0 |
| 20 to 34 years | 0 (0.0%) | 0.0 |
| 35 to 50 years | 0 (0.0%) | 0.0 |
| Total | 0 (0.0%) | 0.0 |
Fertility by Age by Marriage Status in Buchanan
| Age Bracket | Married | Unmarried |
| 15 to 19 years | 0 (0.0%) | 0 (0.0%) |
| 20 to 34 years | 0 (0.0%) | 0 (0.0%) |
| 35 to 50 years | 0 (0.0%) | 0 (0.0%) |
| Total | 0 (0.0%) | 0 (0.0%) |
Fertility by Education in Buchanan
| Educational Attainment | Women with Births | Births / 1,000 Women |
| Less than High School | 0 (0.0%) | 0.0 |
| High School Diploma | 0 (0.0%) | 0.0 |
| College or Associate's Degree | 0 (0.0%) | 0.0 |
| Bachelor's Degree | 0 (0.0%) | 0.0 |
| Graduate Degree | 0 (0.0%) | 0.0 |
| Total | 0 (0.0%) | 0.0 |
Fertility by Education by Marriage Status in Buchanan
| Educational Attainment | Married | Unmarried |
| Less than High School | 0 (0.0%) | 0 (0.0%) |
| High School Diploma | 0 (0.0%) | 0 (0.0%) |
| College or Associate's Degree | 0 (0.0%) | 0 (0.0%) |
| Bachelor's Degree | 0 (0.0%) | 0 (0.0%) |
| Graduate Degree | 0 (0.0%) | 0 (0.0%) |
| Total | 0 (0.0%) | 0 (0.0%) |
Employment Characteristics in Buchanan
Employment by Class of Employer in Buchanan
Among the 1,146 employed individuals in Buchanan, private company employees (707 | 61.7%), local government employees (171 | 14.9%), and not-for-profit organizations (120 | 10.5%) make up the most common classes of employment.
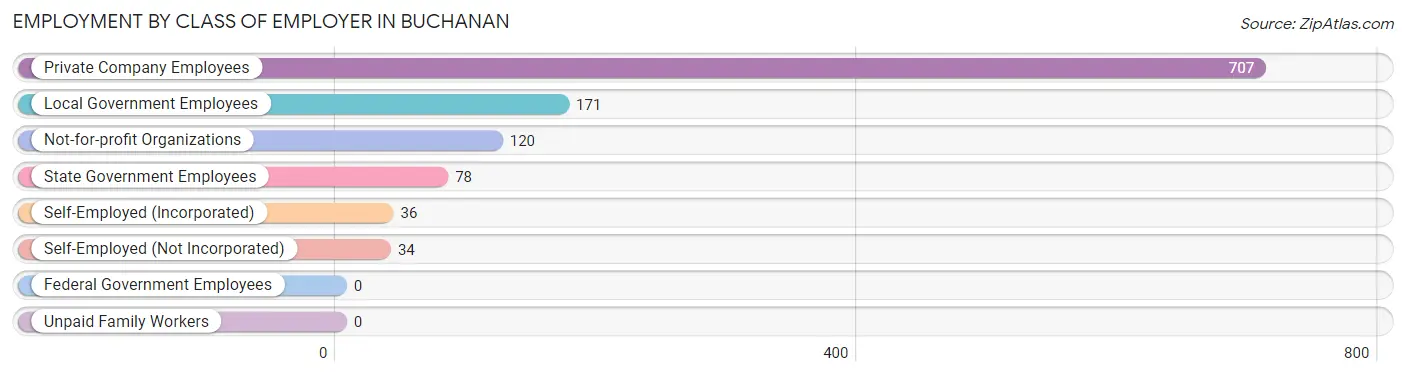
| Employer Class | # Employees | % Employees |
| Private Company Employees | 707 | 61.7% |
| Self-Employed (Incorporated) | 36 | 3.1% |
| Self-Employed (Not Incorporated) | 34 | 3.0% |
| Not-for-profit Organizations | 120 | 10.5% |
| Local Government Employees | 171 | 14.9% |
| State Government Employees | 78 | 6.8% |
| Federal Government Employees | 0 | 0.0% |
| Unpaid Family Workers | 0 | 0.0% |
| Total | 1,146 | 100.0% |
Employment Status by Age in Buchanan
According to the labor force statistics for Buchanan, out of the total population over 16 years of age (1,849), 65.3% or 1,207 individuals are in the labor force, with 2.6% or 31 of them unemployed. The age group with the highest labor force participation rate is 25 to 29 years, with 100.0% or 121 individuals in the labor force. Within the labor force, the 20 to 24 years age range has the highest percentage of unemployed individuals, with 10.9% or 12 of them being unemployed.
| Age Bracket | In Labor Force | Unemployed |
| 16 to 19 Years | 0 (0.0%) | 0 (0.0%) |
| 20 to 24 Years | 110 (55.3%) | 12 (10.9%) |
| 25 to 29 Years | 121 (100.0%) | 0 (0.0%) |
| 30 to 34 Years | 186 (93.9%) | 0 (0.0%) |
| 35 to 44 Years | 204 (97.1%) | 0 (0.0%) |
| 45 to 54 Years | 231 (87.5%) | 0 (0.0%) |
| 55 to 59 Years | 148 (69.8%) | 14 (9.5%) |
| 60 to 64 Years | 136 (70.1%) | 5 (3.7%) |
| 65 to 74 Years | 65 (36.1%) | 0 (0.0%) |
| 75 Years and over | 7 (3.0%) | 0 (0.0%) |
| Total | 1,207 (65.3%) | 31 (2.6%) |
Employment Status by Educational Attainment in Buchanan
According to labor force statistics for Buchanan, 85.6% of individuals (1,026) out of the total population between 25 and 64 years of age (1,199) are in the labor force, with 1.9% or 19 of them being unemployed. The group with the highest labor force participation rate are those with the educational attainment of bachelor's degree or higher, with 87.5% or 554 individuals in the labor force. Within the labor force, individuals with high school diploma education have the highest percentage of unemployment, with 4.7% or 7 of them being unemployed.
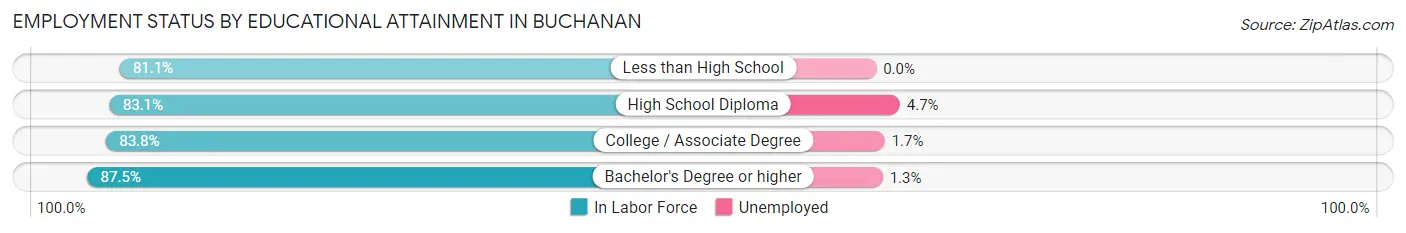
| Educational Attainment | In Labor Force | Unemployed |
| Less than High School | 30 (81.1%) | 0 (0.0%) |
| High School Diploma | 148 (83.1%) | 8 (4.7%) |
| College / Associate Degree | 294 (83.8%) | 6 (1.7%) |
| Bachelor's Degree or higher | 554 (87.5%) | 8 (1.3%) |
| Total | 1,026 (85.6%) | 23 (1.9%) |
Employment Occupations by Sex in Buchanan
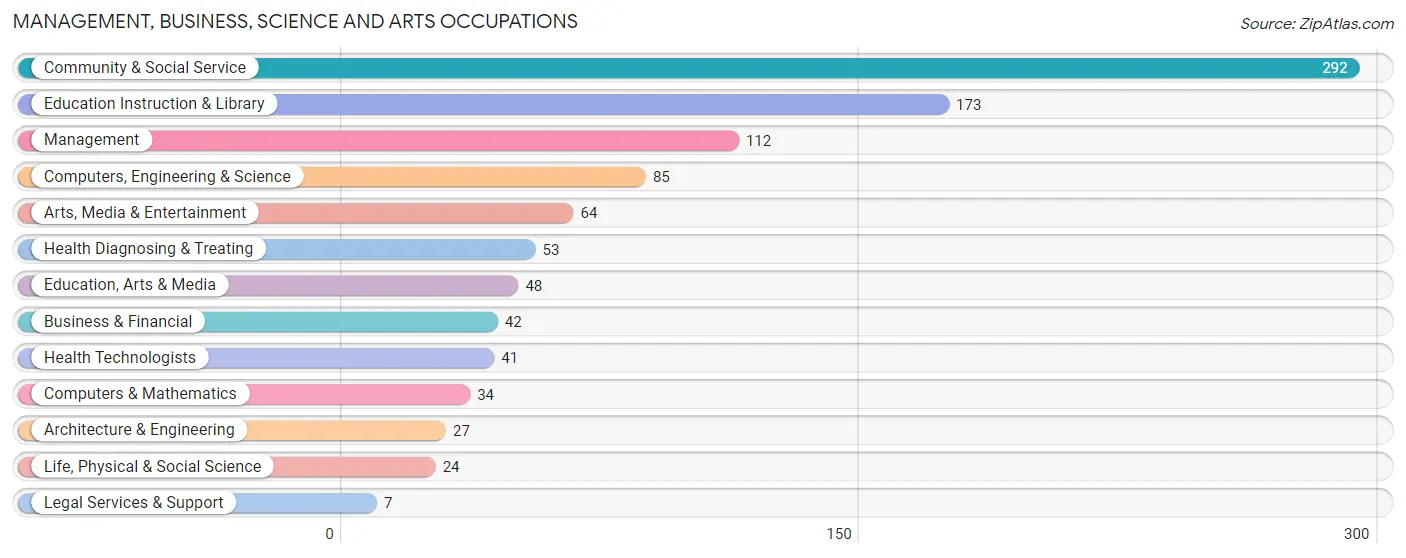
Management, Business, Science and Arts Occupations
The most common Management, Business, Science and Arts occupations in Buchanan are Community & Social Service (292 | 24.8%), Education Instruction & Library (173 | 14.7%), Management (112 | 9.5%), Computers, Engineering & Science (85 | 7.2%), and Arts, Media & Entertainment (64 | 5.4%).
Management, Business, Science and Arts Occupations by Sex
Within the Management, Business, Science and Arts occupations in Buchanan, the most male-oriented occupations are Management (67.9%), Business & Financial (59.5%), and Arts, Media & Entertainment (56.2%), while the most female-oriented occupations are Architecture & Engineering (100.0%), Life, Physical & Social Science (100.0%), and Education, Arts & Media (100.0%).
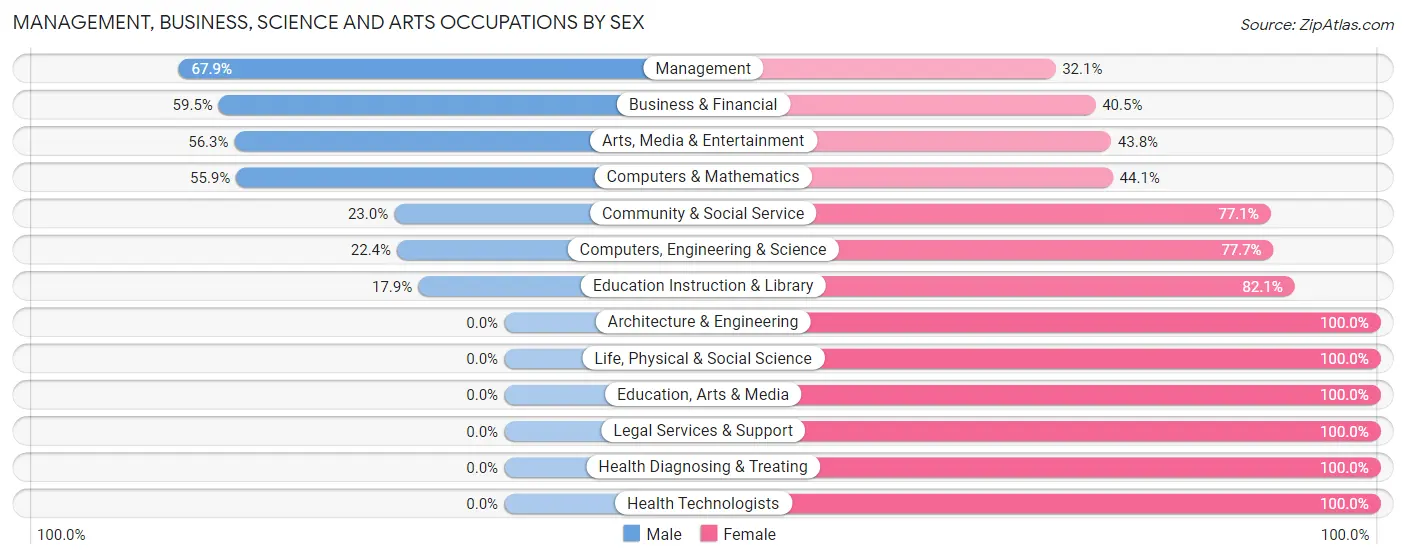
| Occupation | Male | Female |
| Management | 76 (67.9%) | 36 (32.1%) |
| Business & Financial | 25 (59.5%) | 17 (40.5%) |
| Computers, Engineering & Science | 19 (22.4%) | 66 (77.6%) |
| Computers & Mathematics | 19 (55.9%) | 15 (44.1%) |
| Architecture & Engineering | 0 (0.0%) | 27 (100.0%) |
| Life, Physical & Social Science | 0 (0.0%) | 24 (100.0%) |
| Community & Social Service | 67 (23.0%) | 225 (77.0%) |
| Education, Arts & Media | 0 (0.0%) | 48 (100.0%) |
| Legal Services & Support | 0 (0.0%) | 7 (100.0%) |
| Education Instruction & Library | 31 (17.9%) | 142 (82.1%) |
| Arts, Media & Entertainment | 36 (56.2%) | 28 (43.8%) |
| Health Diagnosing & Treating | 0 (0.0%) | 53 (100.0%) |
| Health Technologists | 0 (0.0%) | 41 (100.0%) |
| Total (Category) | 187 (32.0%) | 397 (68.0%) |
| Total (Overall) | 569 (48.3%) | 608 (51.7%) |
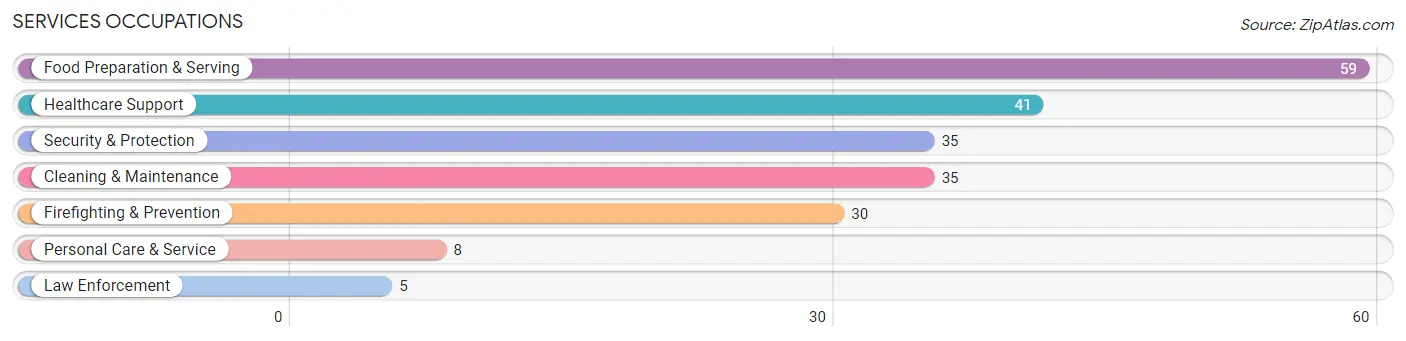
Services Occupations
The most common Services occupations in Buchanan are Food Preparation & Serving (59 | 5.0%), Healthcare Support (41 | 3.5%), Security & Protection (35 | 3.0%), Cleaning & Maintenance (35 | 3.0%), and Firefighting & Prevention (30 | 2.5%).
Services Occupations by Sex
Within the Services occupations in Buchanan, the most male-oriented occupations are Security & Protection (100.0%), Firefighting & Prevention (100.0%), and Law Enforcement (100.0%), while the most female-oriented occupations are Healthcare Support (82.9%), Cleaning & Maintenance (37.1%), and Food Preparation & Serving (27.1%).
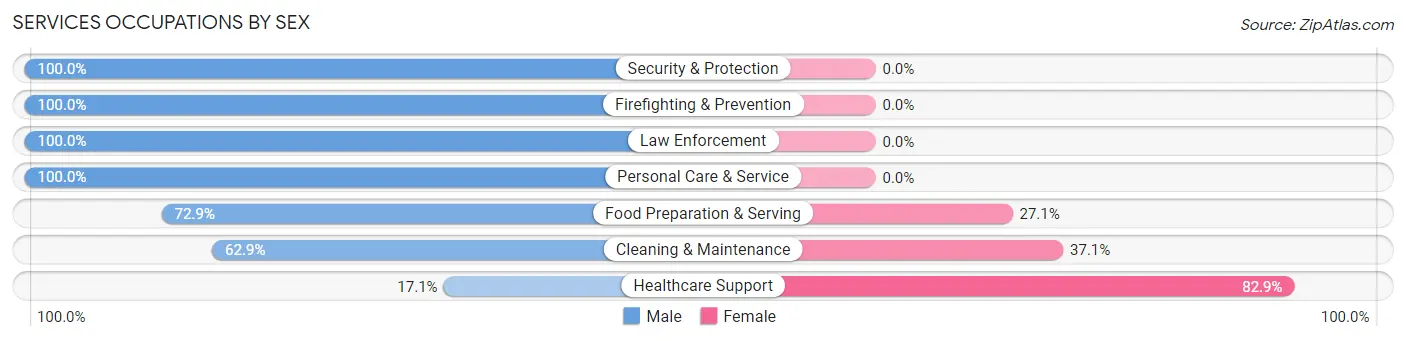
| Occupation | Male | Female |
| Healthcare Support | 7 (17.1%) | 34 (82.9%) |
| Security & Protection | 35 (100.0%) | 0 (0.0%) |
| Firefighting & Prevention | 30 (100.0%) | 0 (0.0%) |
| Law Enforcement | 5 (100.0%) | 0 (0.0%) |
| Food Preparation & Serving | 43 (72.9%) | 16 (27.1%) |
| Cleaning & Maintenance | 22 (62.9%) | 13 (37.1%) |
| Personal Care & Service | 8 (100.0%) | 0 (0.0%) |
| Total (Category) | 115 (64.6%) | 63 (35.4%) |
| Total (Overall) | 569 (48.3%) | 608 (51.7%) |
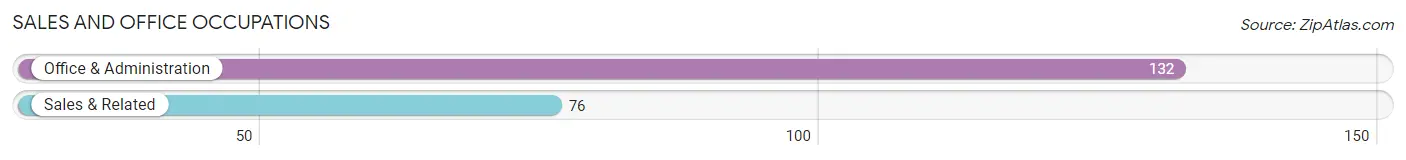
Sales and Office Occupations
The most common Sales and Office occupations in Buchanan are Office & Administration (132 | 11.2%), and Sales & Related (76 | 6.5%).
Sales and Office Occupations by Sex
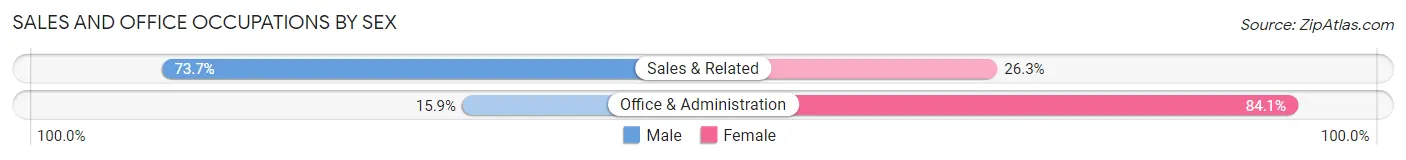
| Occupation | Male | Female |
| Sales & Related | 56 (73.7%) | 20 (26.3%) |
| Office & Administration | 21 (15.9%) | 111 (84.1%) |
| Total (Category) | 77 (37.0%) | 131 (63.0%) |
| Total (Overall) | 569 (48.3%) | 608 (51.7%) |
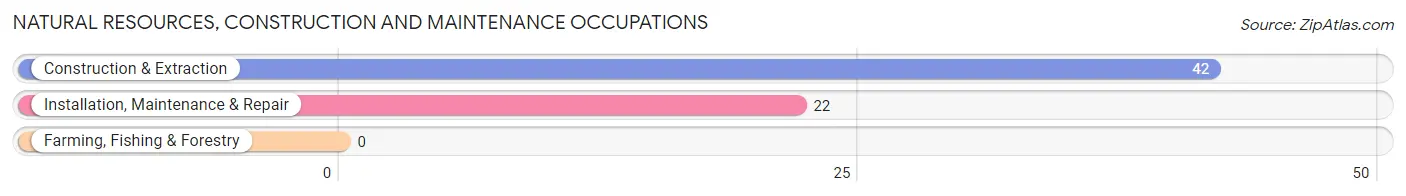
Natural Resources, Construction and Maintenance Occupations
The most common Natural Resources, Construction and Maintenance occupations in Buchanan are Construction & Extraction (42 | 3.6%), and Installation, Maintenance & Repair (22 | 1.9%).
Natural Resources, Construction and Maintenance Occupations by Sex
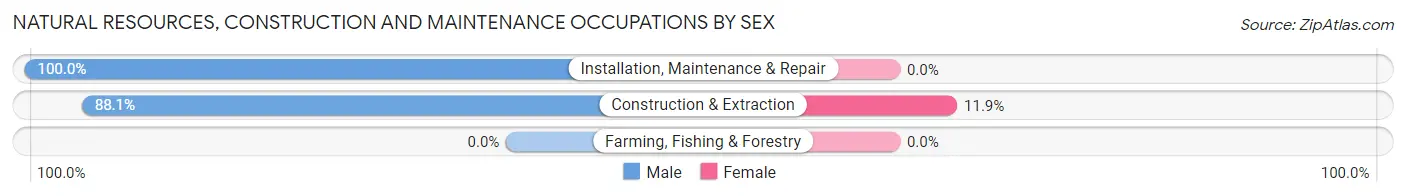
| Occupation | Male | Female |
| Farming, Fishing & Forestry | 0 (0.0%) | 0 (0.0%) |
| Construction & Extraction | 37 (88.1%) | 5 (11.9%) |
| Installation, Maintenance & Repair | 22 (100.0%) | 0 (0.0%) |
| Total (Category) | 59 (92.2%) | 5 (7.8%) |
| Total (Overall) | 569 (48.3%) | 608 (51.7%) |
Production, Transportation and Moving Occupations
The most common Production, Transportation and Moving occupations in Buchanan are Transportation (85 | 7.2%), Material Moving (31 | 2.6%), and Production (27 | 2.3%).
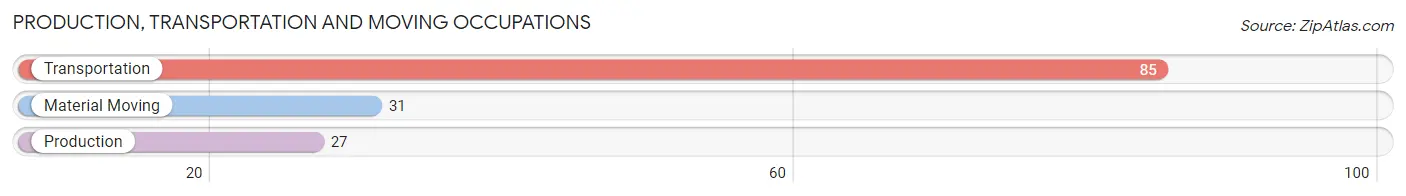
Production, Transportation and Moving Occupations by Sex
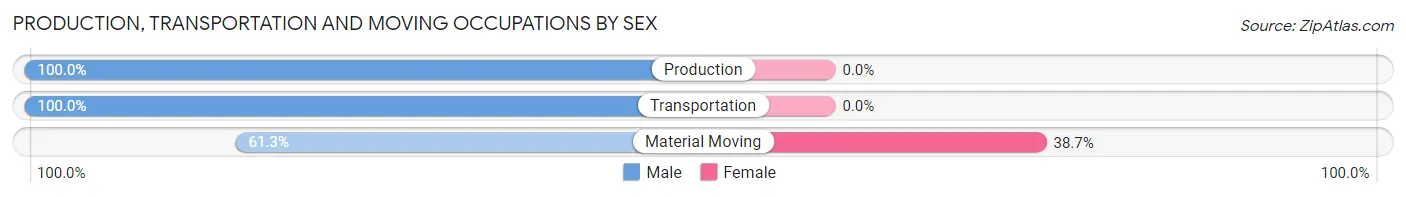
| Occupation | Male | Female |
| Production | 27 (100.0%) | 0 (0.0%) |
| Transportation | 85 (100.0%) | 0 (0.0%) |
| Material Moving | 19 (61.3%) | 12 (38.7%) |
| Total (Category) | 131 (91.6%) | 12 (8.4%) |
| Total (Overall) | 569 (48.3%) | 608 (51.7%) |
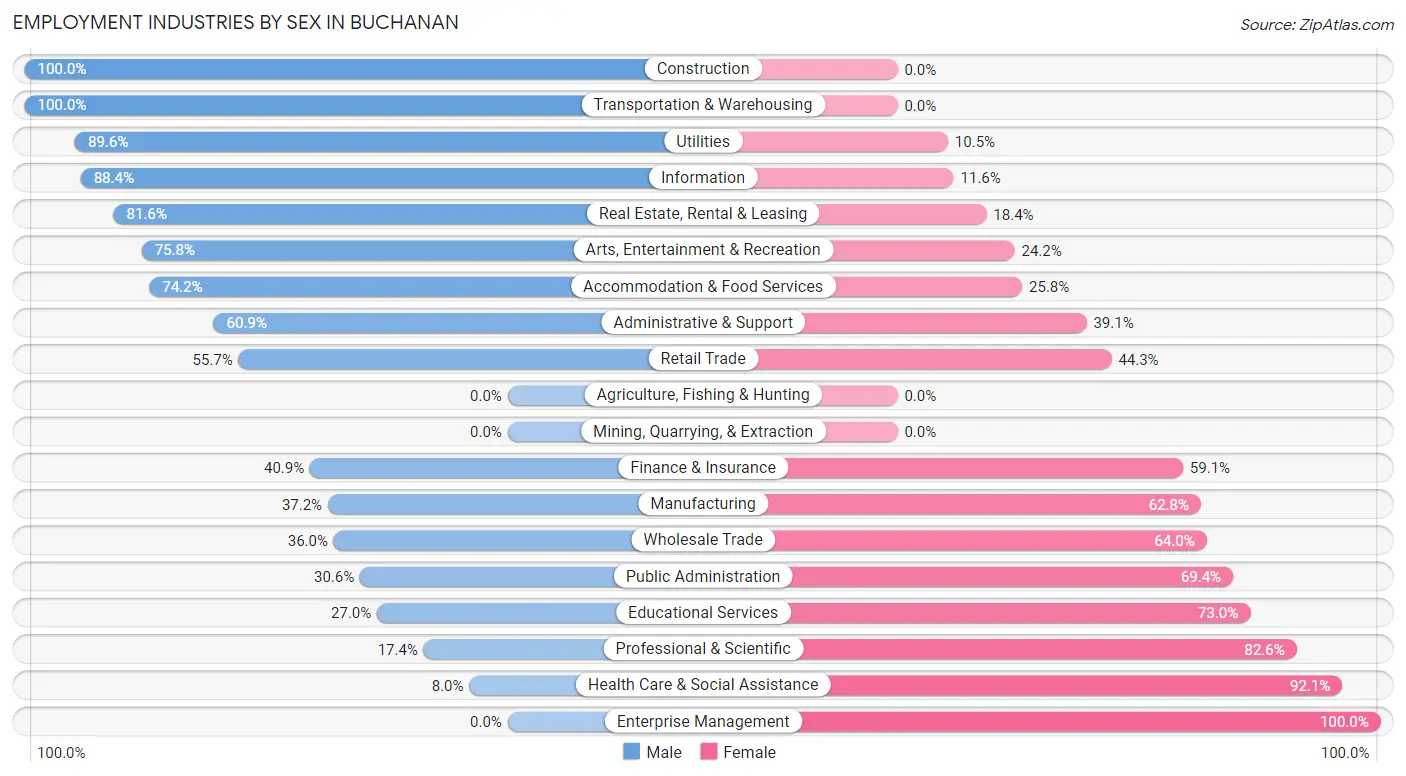
Employment Industries by Sex in Buchanan
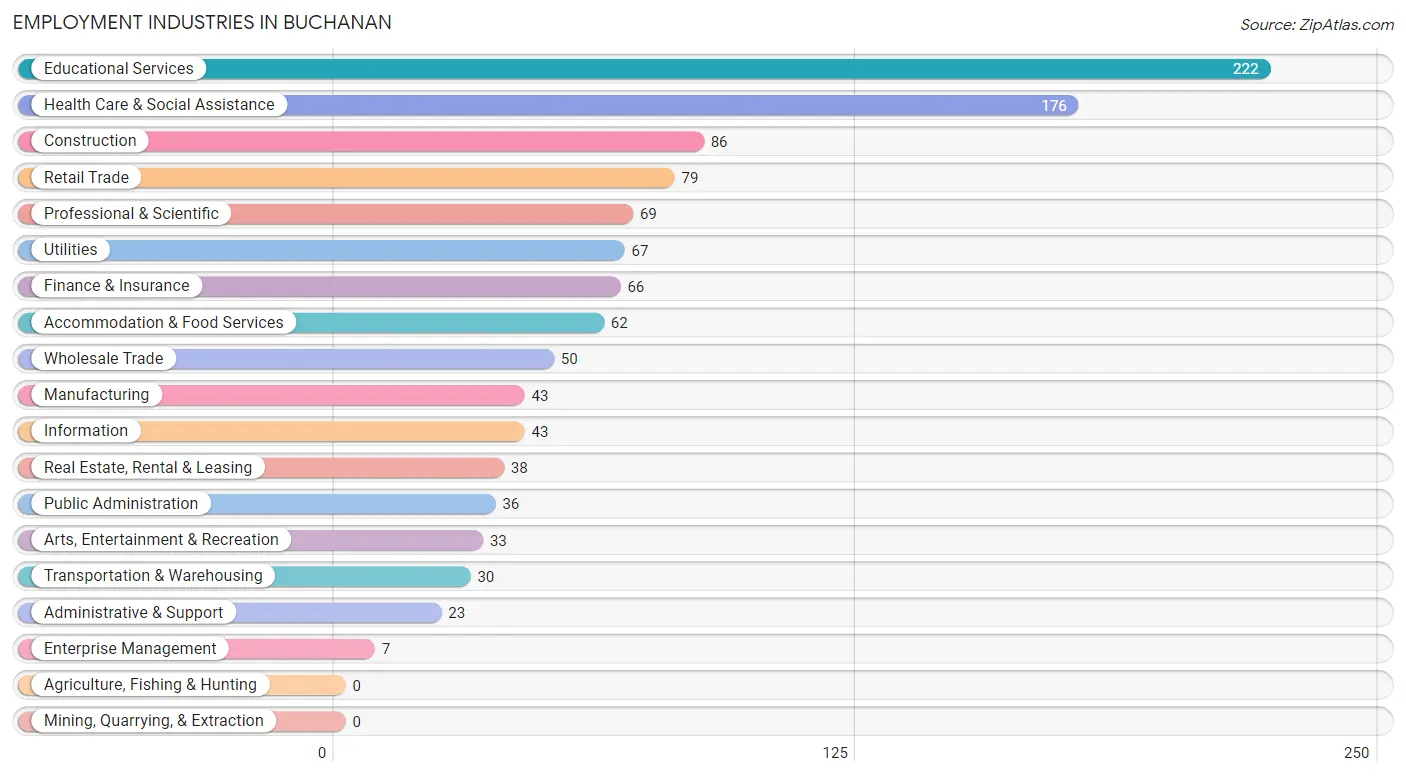
Employment Industries in Buchanan
The major employment industries in Buchanan include Educational Services (222 | 18.9%), Health Care & Social Assistance (176 | 14.9%), Construction (86 | 7.3%), Retail Trade (79 | 6.7%), and Professional & Scientific (69 | 5.9%).
Employment Industries by Sex in Buchanan
The Buchanan industries that see more men than women are Construction (100.0%), Transportation & Warehousing (100.0%), and Utilities (89.5%), whereas the industries that tend to have a higher number of women are Enterprise Management (100.0%), Health Care & Social Assistance (92.0%), and Professional & Scientific (82.6%).
| Industry | Male | Female |
| Agriculture, Fishing & Hunting | 0 (0.0%) | 0 (0.0%) |
| Mining, Quarrying, & Extraction | 0 (0.0%) | 0 (0.0%) |
| Construction | 86 (100.0%) | 0 (0.0%) |
| Manufacturing | 16 (37.2%) | 27 (62.8%) |
| Wholesale Trade | 18 (36.0%) | 32 (64.0%) |
| Retail Trade | 44 (55.7%) | 35 (44.3%) |
| Transportation & Warehousing | 30 (100.0%) | 0 (0.0%) |
| Utilities | 60 (89.5%) | 7 (10.4%) |
| Information | 38 (88.4%) | 5 (11.6%) |
| Finance & Insurance | 27 (40.9%) | 39 (59.1%) |
| Real Estate, Rental & Leasing | 31 (81.6%) | 7 (18.4%) |
| Professional & Scientific | 12 (17.4%) | 57 (82.6%) |
| Enterprise Management | 0 (0.0%) | 7 (100.0%) |
| Administrative & Support | 14 (60.9%) | 9 (39.1%) |
| Educational Services | 60 (27.0%) | 162 (73.0%) |
| Health Care & Social Assistance | 14 (8.0%) | 162 (92.0%) |
| Arts, Entertainment & Recreation | 25 (75.8%) | 8 (24.2%) |
| Accommodation & Food Services | 46 (74.2%) | 16 (25.8%) |
| Public Administration | 11 (30.6%) | 25 (69.4%) |
| Total | 569 (48.3%) | 608 (51.7%) |
Education in Buchanan
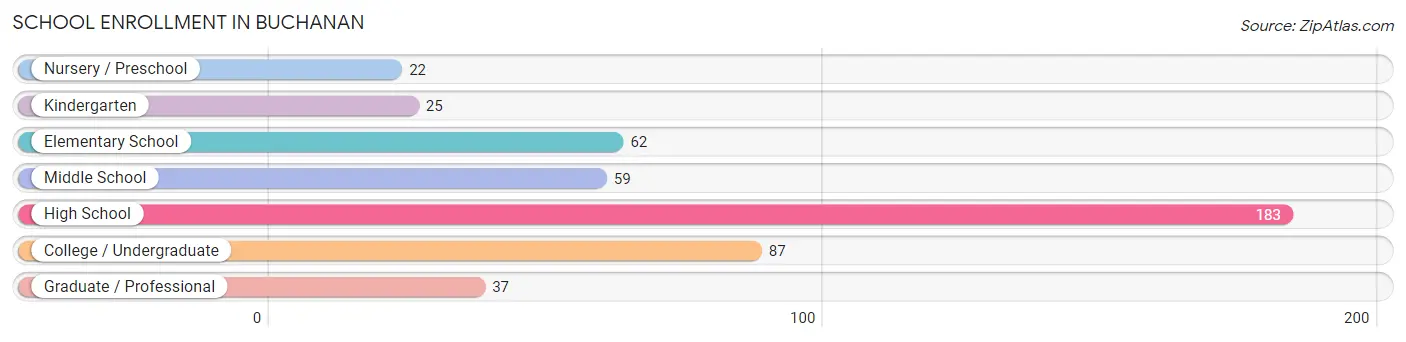
School Enrollment in Buchanan
The most common levels of schooling among the 475 students in Buchanan are high school (183 | 38.5%), college / undergraduate (87 | 18.3%), and elementary school (62 | 13.1%).
| School Level | # Students | % Students |
| Nursery / Preschool | 22 | 4.6% |
| Kindergarten | 25 | 5.3% |
| Elementary School | 62 | 13.1% |
| Middle School | 59 | 12.4% |
| High School | 183 | 38.5% |
| College / Undergraduate | 87 | 18.3% |
| Graduate / Professional | 37 | 7.8% |
| Total | 475 | 100.0% |
School Enrollment by Age by Funding Source in Buchanan
Out of a total of 475 students who are enrolled in schools in Buchanan, 132 (27.8%) attend a private institution, while the remaining 343 (72.2%) are enrolled in public schools. The age group of 35 years and over has the highest likelihood of being enrolled in private schools, with 32 (84.2% in the age bracket) enrolled. Conversely, the age group of 15 to 17 year olds has the lowest likelihood of being enrolled in a private school, with 84 (100.0% in the age bracket) attending a public institution.
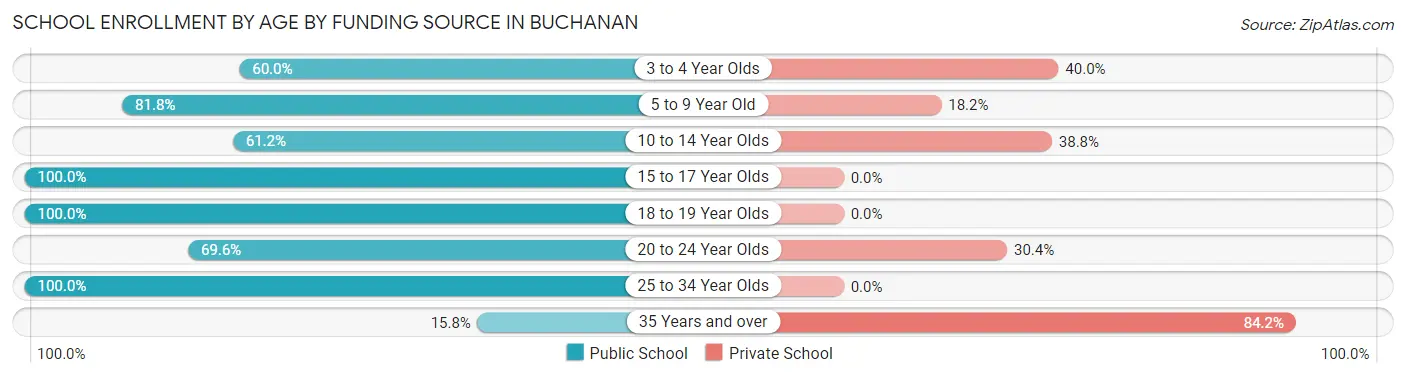
| Age Bracket | Public School | Private School |
| 3 to 4 Year Olds | 9 (60.0%) | 6 (40.0%) |
| 5 to 9 Year Old | 72 (81.8%) | 16 (18.2%) |
| 10 to 14 Year Olds | 90 (61.2%) | 57 (38.8%) |
| 15 to 17 Year Olds | 84 (100.0%) | 0 (0.0%) |
| 18 to 19 Year Olds | 17 (100.0%) | 0 (0.0%) |
| 20 to 24 Year Olds | 48 (69.6%) | 21 (30.4%) |
| 25 to 34 Year Olds | 17 (100.0%) | 0 (0.0%) |
| 35 Years and over | 6 (15.8%) | 32 (84.2%) |
| Total | 343 (72.2%) | 132 (27.8%) |
Educational Attainment by Field of Study in Buchanan
Business (308 | 39.3%), psychology (114 | 14.6%), education (77 | 9.8%), literature & languages (51 | 6.5%), and engineering (38 | 4.9%) are the most common fields of study among 783 individuals in Buchanan who have obtained a bachelor's degree or higher.
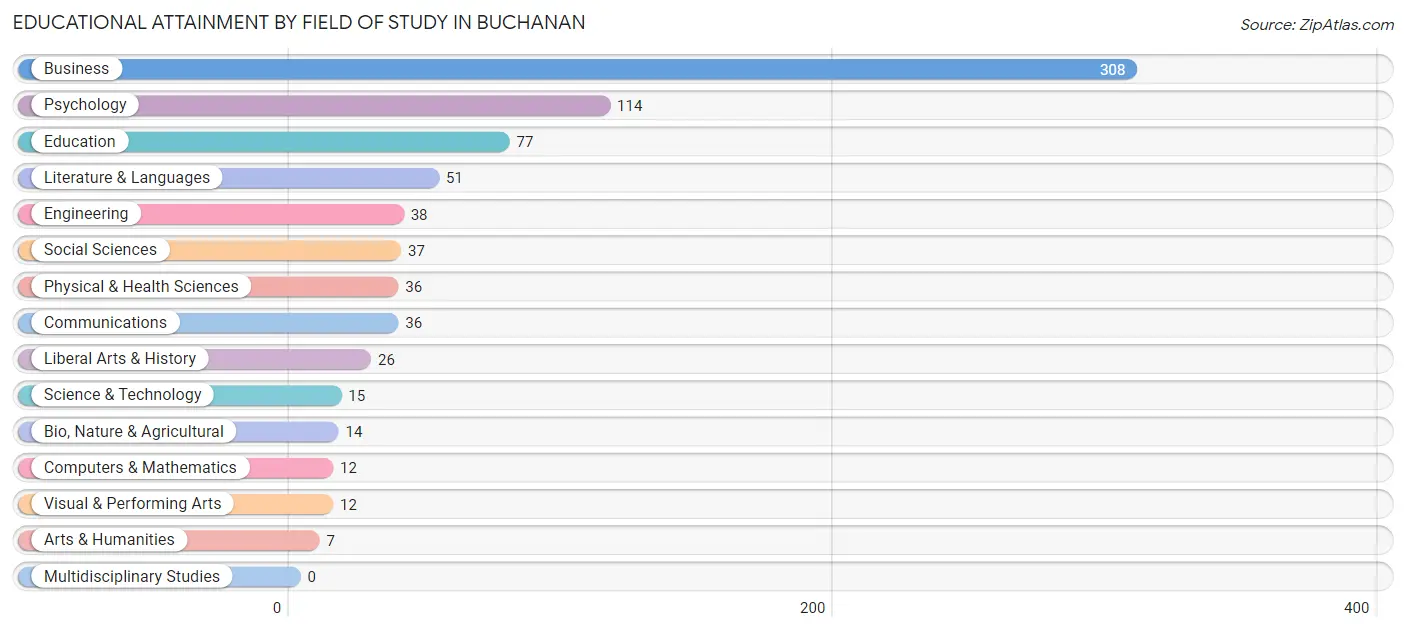
| Field of Study | # Graduates | % Graduates |
| Computers & Mathematics | 12 | 1.5% |
| Bio, Nature & Agricultural | 14 | 1.8% |
| Physical & Health Sciences | 36 | 4.6% |
| Psychology | 114 | 14.6% |
| Social Sciences | 37 | 4.7% |
| Engineering | 38 | 4.9% |
| Multidisciplinary Studies | 0 | 0.0% |
| Science & Technology | 15 | 1.9% |
| Business | 308 | 39.3% |
| Education | 77 | 9.8% |
| Literature & Languages | 51 | 6.5% |
| Liberal Arts & History | 26 | 3.3% |
| Visual & Performing Arts | 12 | 1.5% |
| Communications | 36 | 4.6% |
| Arts & Humanities | 7 | 0.9% |
| Total | 783 | 100.0% |
Transportation & Commute in Buchanan
Vehicle Availability by Sex in Buchanan
The most prevalent vehicle ownership categories in Buchanan are males with 2 vehicles (183, accounting for 32.7%) and females with 2 vehicles (238, making up 31.2%).
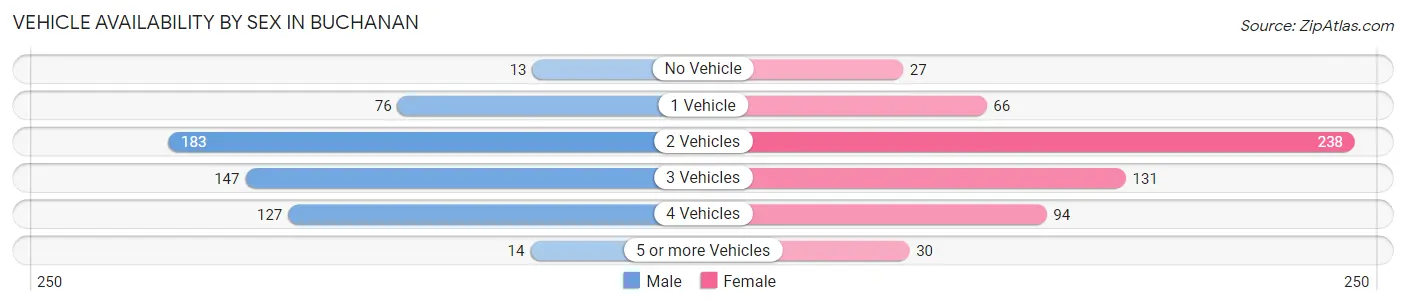
| Vehicles Available | Male | Female |
| No Vehicle | 13 (2.3%) | 27 (4.6%) |
| 1 Vehicle | 76 (13.6%) | 66 (11.3%) |
| 2 Vehicles | 183 (32.7%) | 238 (40.6%) |
| 3 Vehicles | 147 (26.3%) | 131 (22.4%) |
| 4 Vehicles | 127 (22.7%) | 94 (16.0%) |
| 5 or more Vehicles | 14 (2.5%) | 30 (5.1%) |
| Total | 560 (100.0%) | 586 (100.0%) |
Commute Time in Buchanan
The most frequently occuring commute durations in Buchanan are 45 to 59 minutes (224 commuters, 21.2%), 60 to 89 minutes (164 commuters, 15.5%), and 30 to 34 minutes (128 commuters, 12.1%).
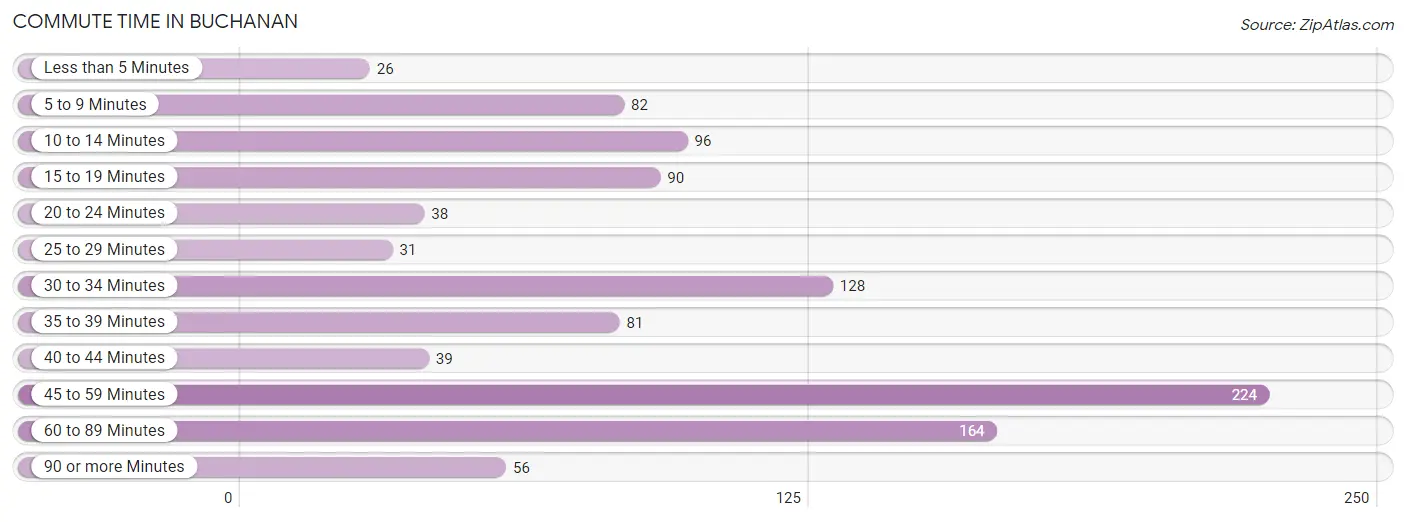
| Commute Time | # Commuters | % Commuters |
| Less than 5 Minutes | 26 | 2.5% |
| 5 to 9 Minutes | 82 | 7.8% |
| 10 to 14 Minutes | 96 | 9.1% |
| 15 to 19 Minutes | 90 | 8.5% |
| 20 to 24 Minutes | 38 | 3.6% |
| 25 to 29 Minutes | 31 | 2.9% |
| 30 to 34 Minutes | 128 | 12.1% |
| 35 to 39 Minutes | 81 | 7.7% |
| 40 to 44 Minutes | 39 | 3.7% |
| 45 to 59 Minutes | 224 | 21.2% |
| 60 to 89 Minutes | 164 | 15.5% |
| 90 or more Minutes | 56 | 5.3% |
Commute Time by Sex in Buchanan
The most common commute times in Buchanan are 60 to 89 minutes (121 commuters, 22.8%) for males and 45 to 59 minutes (126 commuters, 24.0%) for females.
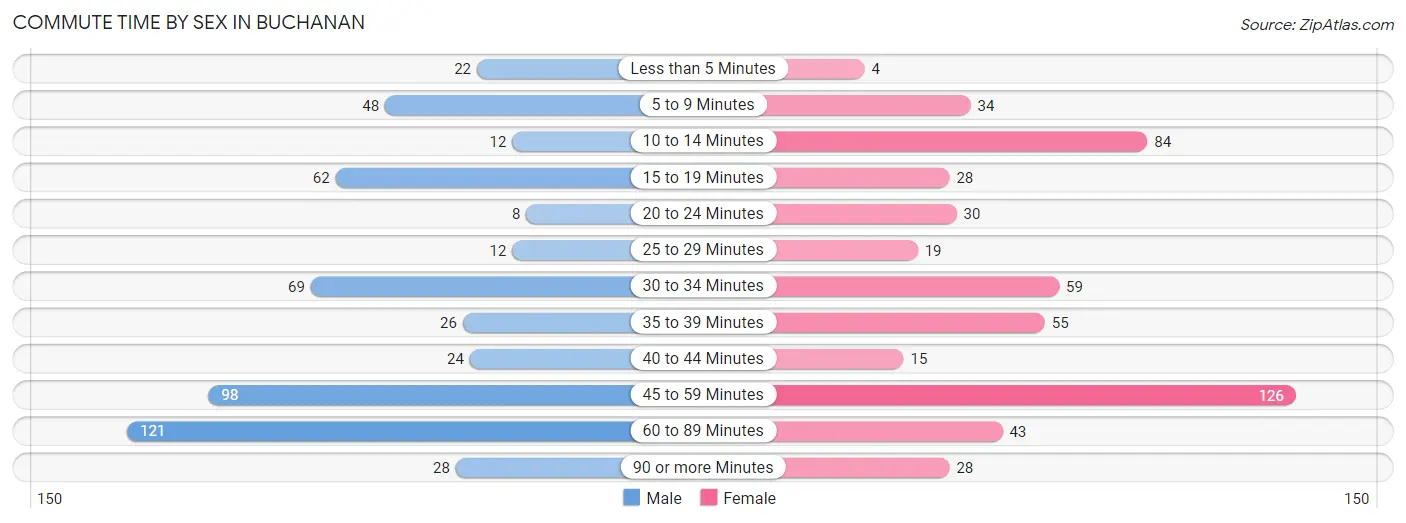
| Commute Time | Male | Female |
| Less than 5 Minutes | 22 (4.2%) | 4 (0.8%) |
| 5 to 9 Minutes | 48 (9.1%) | 34 (6.5%) |
| 10 to 14 Minutes | 12 (2.3%) | 84 (16.0%) |
| 15 to 19 Minutes | 62 (11.7%) | 28 (5.3%) |
| 20 to 24 Minutes | 8 (1.5%) | 30 (5.7%) |
| 25 to 29 Minutes | 12 (2.3%) | 19 (3.6%) |
| 30 to 34 Minutes | 69 (13.0%) | 59 (11.2%) |
| 35 to 39 Minutes | 26 (4.9%) | 55 (10.5%) |
| 40 to 44 Minutes | 24 (4.5%) | 15 (2.9%) |
| 45 to 59 Minutes | 98 (18.5%) | 126 (24.0%) |
| 60 to 89 Minutes | 121 (22.8%) | 43 (8.2%) |
| 90 or more Minutes | 28 (5.3%) | 28 (5.3%) |
Time of Departure to Work by Sex in Buchanan
The most frequent times of departure to work in Buchanan are 6:30 AM to 6:59 AM (100, 18.9%) for males and 8:00 AM to 8:29 AM (126, 24.0%) for females.
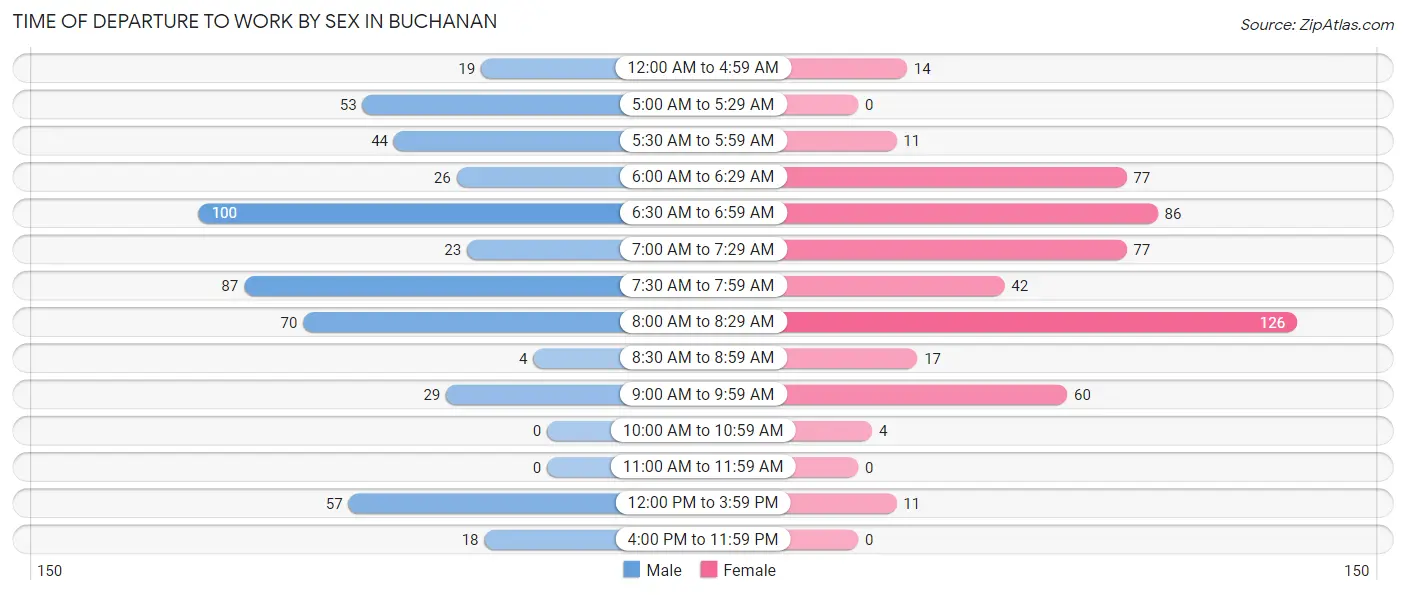
| Time of Departure | Male | Female |
| 12:00 AM to 4:59 AM | 19 (3.6%) | 14 (2.7%) |
| 5:00 AM to 5:29 AM | 53 (10.0%) | 0 (0.0%) |
| 5:30 AM to 5:59 AM | 44 (8.3%) | 11 (2.1%) |
| 6:00 AM to 6:29 AM | 26 (4.9%) | 77 (14.7%) |
| 6:30 AM to 6:59 AM | 100 (18.9%) | 86 (16.4%) |
| 7:00 AM to 7:29 AM | 23 (4.3%) | 77 (14.7%) |
| 7:30 AM to 7:59 AM | 87 (16.4%) | 42 (8.0%) |
| 8:00 AM to 8:29 AM | 70 (13.2%) | 126 (24.0%) |
| 8:30 AM to 8:59 AM | 4 (0.7%) | 17 (3.2%) |
| 9:00 AM to 9:59 AM | 29 (5.5%) | 60 (11.4%) |
| 10:00 AM to 10:59 AM | 0 (0.0%) | 4 (0.8%) |
| 11:00 AM to 11:59 AM | 0 (0.0%) | 0 (0.0%) |
| 12:00 PM to 3:59 PM | 57 (10.7%) | 11 (2.1%) |
| 4:00 PM to 11:59 PM | 18 (3.4%) | 0 (0.0%) |
| Total | 530 (100.0%) | 525 (100.0%) |
Housing Occupancy in Buchanan
Occupancy by Ownership in Buchanan
Of the total 787 dwellings in Buchanan, owner-occupied units account for 658 (83.6%), while renter-occupied units make up 129 (16.4%).
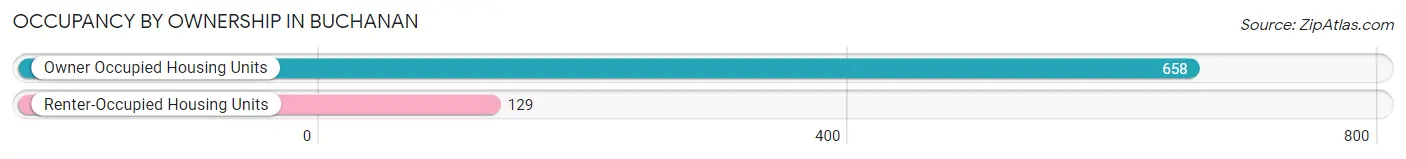
| Occupancy | # Housing Units | % Housing Units |
| Owner Occupied Housing Units | 658 | 83.6% |
| Renter-Occupied Housing Units | 129 | 16.4% |
| Total Occupied Housing Units | 787 | 100.0% |
Occupancy by Household Size in Buchanan
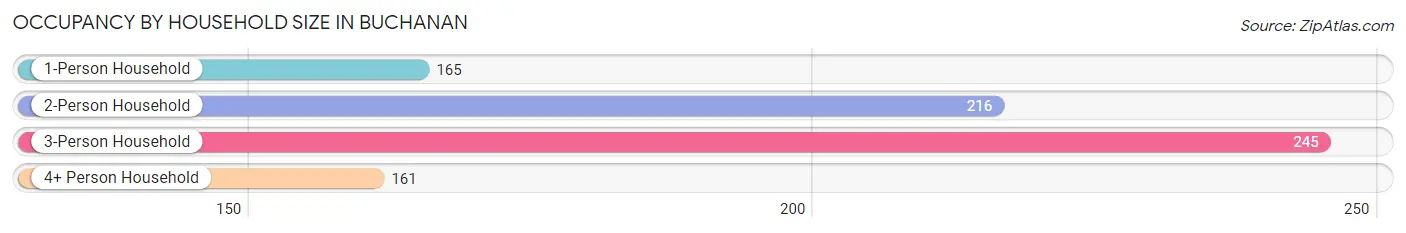
| Household Size | # Housing Units | % Housing Units |
| 1-Person Household | 165 | 21.0% |
| 2-Person Household | 216 | 27.5% |
| 3-Person Household | 245 | 31.1% |
| 4+ Person Household | 161 | 20.5% |
| Total Housing Units | 787 | 100.0% |
Occupancy by Ownership by Household Size in Buchanan
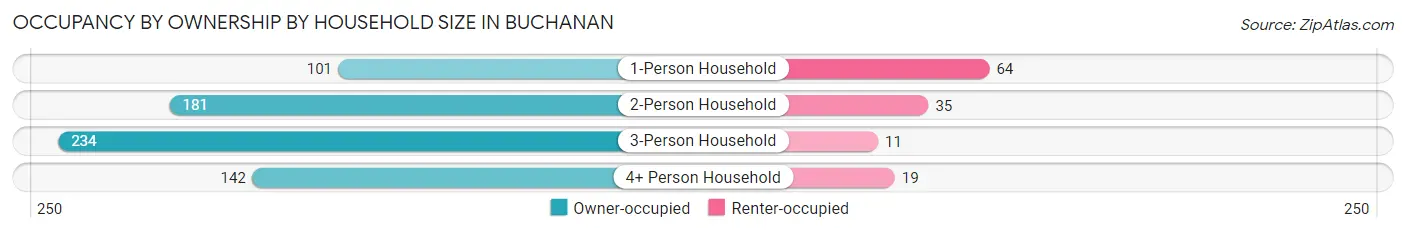
| Household Size | Owner-occupied | Renter-occupied |
| 1-Person Household | 101 (61.2%) | 64 (38.8%) |
| 2-Person Household | 181 (83.8%) | 35 (16.2%) |
| 3-Person Household | 234 (95.5%) | 11 (4.5%) |
| 4+ Person Household | 142 (88.2%) | 19 (11.8%) |
| Total Housing Units | 658 (83.6%) | 129 (16.4%) |
Occupancy by Educational Attainment in Buchanan
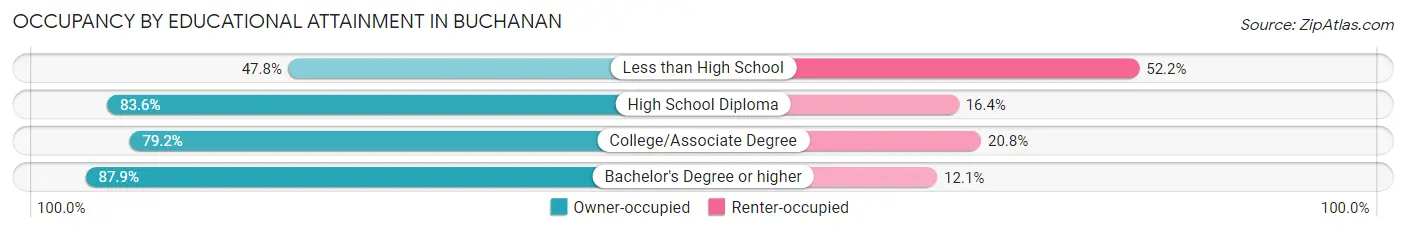
| Household Size | Owner-occupied | Renter-occupied |
| Less than High School | 11 (47.8%) | 12 (52.2%) |
| High School Diploma | 138 (83.6%) | 27 (16.4%) |
| College/Associate Degree | 160 (79.2%) | 42 (20.8%) |
| Bachelor's Degree or higher | 349 (87.9%) | 48 (12.1%) |
Occupancy by Age of Householder in Buchanan
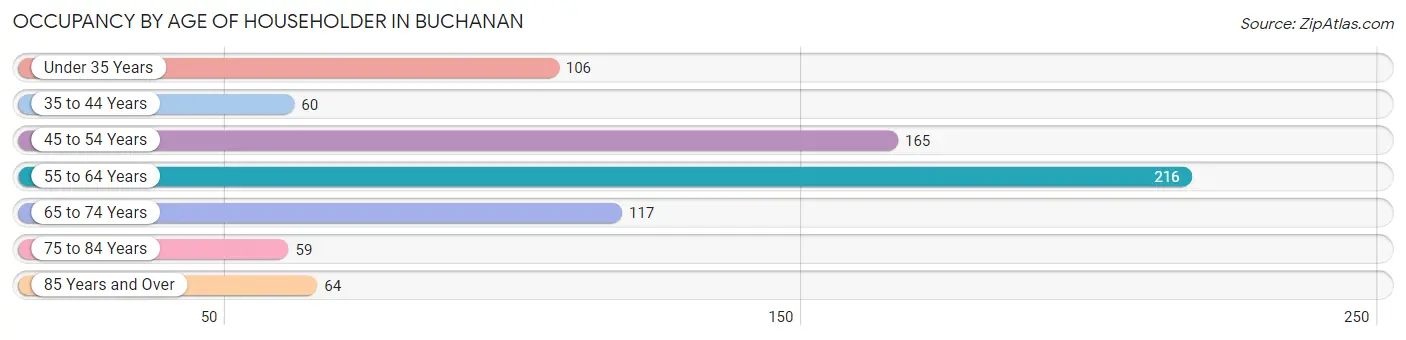
| Age Bracket | # Households | % Households |
| Under 35 Years | 106 | 13.5% |
| 35 to 44 Years | 60 | 7.6% |
| 45 to 54 Years | 165 | 21.0% |
| 55 to 64 Years | 216 | 27.5% |
| 65 to 74 Years | 117 | 14.9% |
| 75 to 84 Years | 59 | 7.5% |
| 85 Years and Over | 64 | 8.1% |
| Total | 787 | 100.0% |
Housing Finances in Buchanan
Median Income by Occupancy in Buchanan
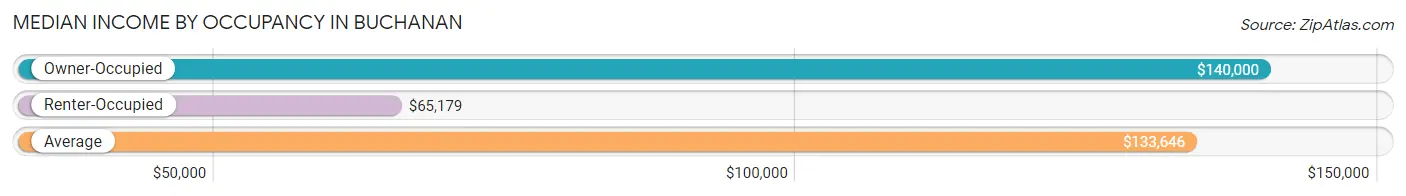
| Occupancy Type | # Households | Median Income |
| Owner-Occupied | 658 (83.6%) | $140,000 |
| Renter-Occupied | 129 (16.4%) | $65,179 |
| Average | 787 (100.0%) | $133,646 |
Occupancy by Householder Income Bracket in Buchanan
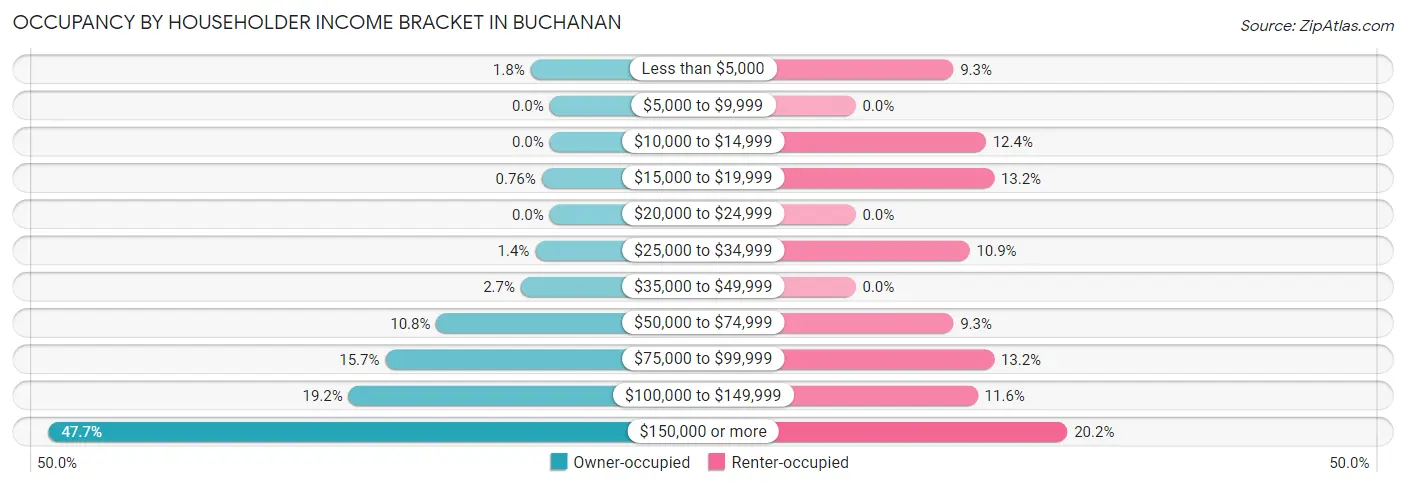
| Income Bracket | Owner-occupied | Renter-occupied |
| Less than $5,000 | 12 (1.8%) | 12 (9.3%) |
| $5,000 to $9,999 | 0 (0.0%) | 0 (0.0%) |
| $10,000 to $14,999 | 0 (0.0%) | 16 (12.4%) |
| $15,000 to $19,999 | 5 (0.8%) | 17 (13.2%) |
| $20,000 to $24,999 | 0 (0.0%) | 0 (0.0%) |
| $25,000 to $34,999 | 9 (1.4%) | 14 (10.8%) |
| $35,000 to $49,999 | 18 (2.7%) | 0 (0.0%) |
| $50,000 to $74,999 | 71 (10.8%) | 12 (9.3%) |
| $75,000 to $99,999 | 103 (15.7%) | 17 (13.2%) |
| $100,000 to $149,999 | 126 (19.2%) | 15 (11.6%) |
| $150,000 or more | 314 (47.7%) | 26 (20.2%) |
| Total | 658 (100.0%) | 129 (100.0%) |
Monthly Housing Cost Tiers in Buchanan
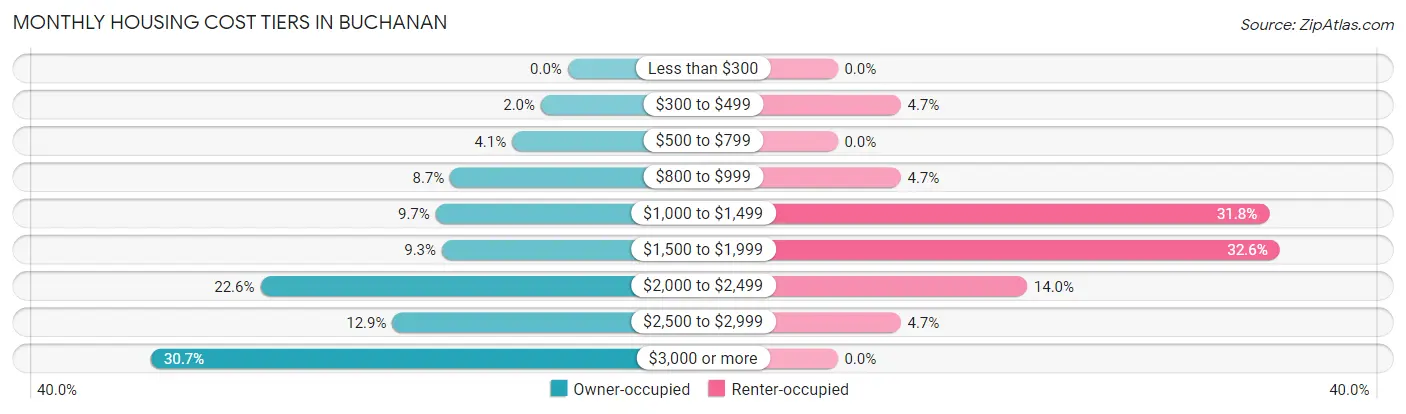
| Monthly Cost | Owner-occupied | Renter-occupied |
| Less than $300 | 0 (0.0%) | 0 (0.0%) |
| $300 to $499 | 13 (2.0%) | 6 (4.6%) |
| $500 to $799 | 27 (4.1%) | 0 (0.0%) |
| $800 to $999 | 57 (8.7%) | 6 (4.6%) |
| $1,000 to $1,499 | 64 (9.7%) | 41 (31.8%) |
| $1,500 to $1,999 | 61 (9.3%) | 42 (32.6%) |
| $2,000 to $2,499 | 149 (22.6%) | 18 (14.0%) |
| $2,500 to $2,999 | 85 (12.9%) | 6 (4.6%) |
| $3,000 or more | 202 (30.7%) | 0 (0.0%) |
| Total | 658 (100.0%) | 129 (100.0%) |
Physical Housing Characteristics in Buchanan
Housing Structures in Buchanan
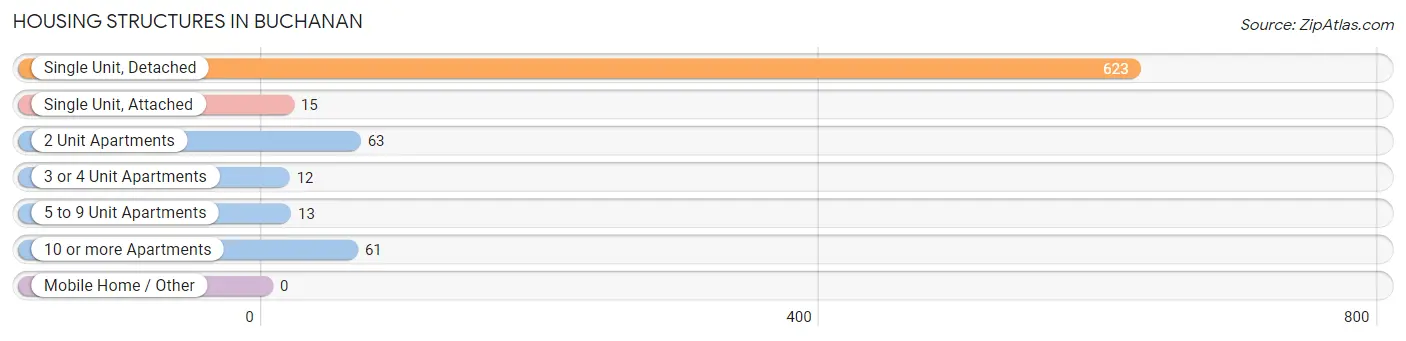
| Structure Type | # Housing Units | % Housing Units |
| Single Unit, Detached | 623 | 79.2% |
| Single Unit, Attached | 15 | 1.9% |
| 2 Unit Apartments | 63 | 8.0% |
| 3 or 4 Unit Apartments | 12 | 1.5% |
| 5 to 9 Unit Apartments | 13 | 1.7% |
| 10 or more Apartments | 61 | 7.7% |
| Mobile Home / Other | 0 | 0.0% |
| Total | 787 | 100.0% |
Housing Structures by Occupancy in Buchanan
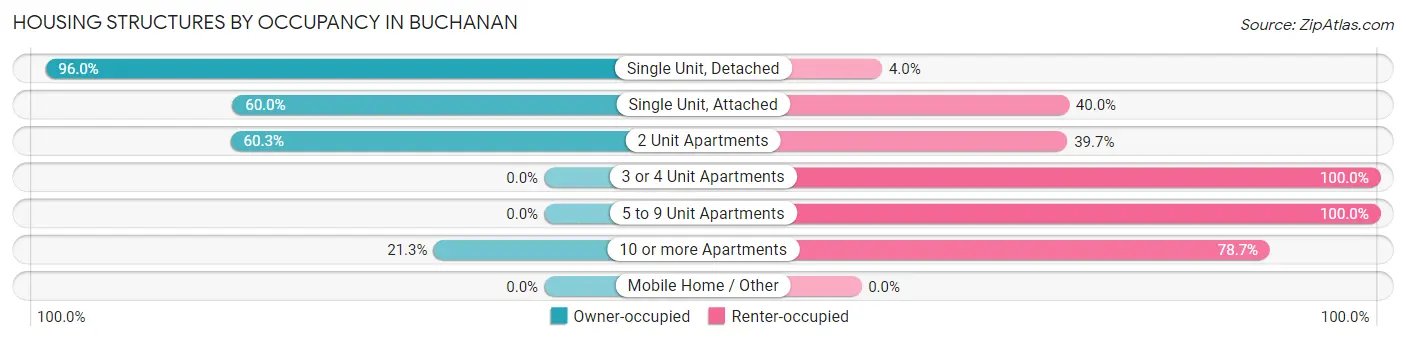
| Structure Type | Owner-occupied | Renter-occupied |
| Single Unit, Detached | 598 (96.0%) | 25 (4.0%) |
| Single Unit, Attached | 9 (60.0%) | 6 (40.0%) |
| 2 Unit Apartments | 38 (60.3%) | 25 (39.7%) |
| 3 or 4 Unit Apartments | 0 (0.0%) | 12 (100.0%) |
| 5 to 9 Unit Apartments | 0 (0.0%) | 13 (100.0%) |
| 10 or more Apartments | 13 (21.3%) | 48 (78.7%) |
| Mobile Home / Other | 0 (0.0%) | 0 (0.0%) |
| Total | 658 (83.6%) | 129 (16.4%) |
Housing Structures by Number of Rooms in Buchanan
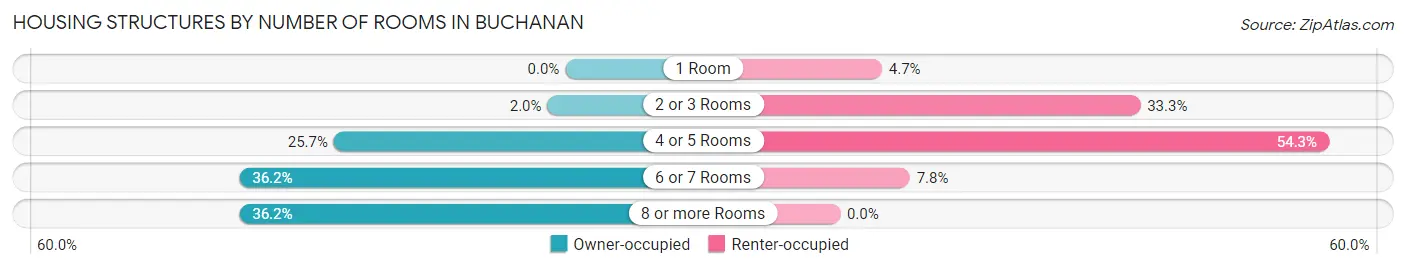
| Number of Rooms | Owner-occupied | Renter-occupied |
| 1 Room | 0 (0.0%) | 6 (4.6%) |
| 2 or 3 Rooms | 13 (2.0%) | 43 (33.3%) |
| 4 or 5 Rooms | 169 (25.7%) | 70 (54.3%) |
| 6 or 7 Rooms | 238 (36.2%) | 10 (7.7%) |
| 8 or more Rooms | 238 (36.2%) | 0 (0.0%) |
| Total | 658 (100.0%) | 129 (100.0%) |
Housing Structure by Heating Type in Buchanan
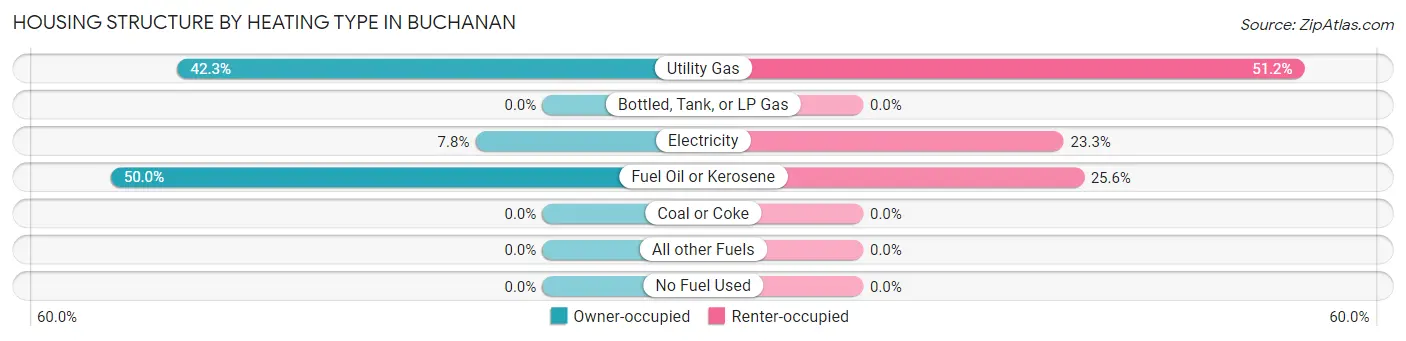
| Heating Type | Owner-occupied | Renter-occupied |
| Utility Gas | 278 (42.2%) | 66 (51.2%) |
| Bottled, Tank, or LP Gas | 0 (0.0%) | 0 (0.0%) |
| Electricity | 51 (7.7%) | 30 (23.3%) |
| Fuel Oil or Kerosene | 329 (50.0%) | 33 (25.6%) |
| Coal or Coke | 0 (0.0%) | 0 (0.0%) |
| All other Fuels | 0 (0.0%) | 0 (0.0%) |
| No Fuel Used | 0 (0.0%) | 0 (0.0%) |
| Total | 658 (100.0%) | 129 (100.0%) |
Household Vehicle Usage in Buchanan
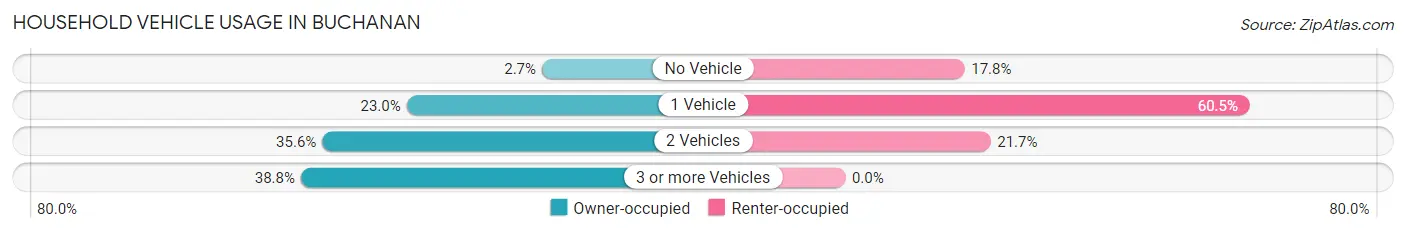
| Vehicles per Household | Owner-occupied | Renter-occupied |
| No Vehicle | 18 (2.7%) | 23 (17.8%) |
| 1 Vehicle | 151 (23.0%) | 78 (60.5%) |
| 2 Vehicles | 234 (35.6%) | 28 (21.7%) |
| 3 or more Vehicles | 255 (38.8%) | 0 (0.0%) |
| Total | 658 (100.0%) | 129 (100.0%) |
Real Estate & Mortgages in Buchanan
Real Estate and Mortgage Overview in Buchanan
| Characteristic | Without Mortgage | With Mortgage |
| Housing Units | 248 | 410 |
| Median Property Value | $464,800 | $458,800 |
| Median Household Income | $98,750 | $262 |
| Monthly Housing Costs | $1,253 | $163 |
| Real Estate Taxes | $9,545 | $11 |
Property Value by Mortgage Status in Buchanan
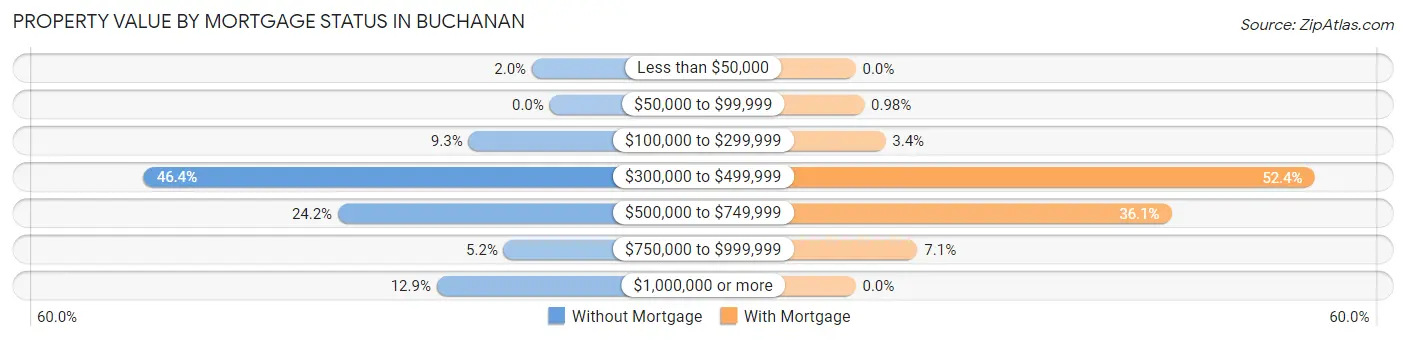
| Property Value | Without Mortgage | With Mortgage |
| Less than $50,000 | 5 (2.0%) | 0 (0.0%) |
| $50,000 to $99,999 | 0 (0.0%) | 4 (1.0%) |
| $100,000 to $299,999 | 23 (9.3%) | 14 (3.4%) |
| $300,000 to $499,999 | 115 (46.4%) | 215 (52.4%) |
| $500,000 to $749,999 | 60 (24.2%) | 148 (36.1%) |
| $750,000 to $999,999 | 13 (5.2%) | 29 (7.1%) |
| $1,000,000 or more | 32 (12.9%) | 0 (0.0%) |
| Total | 248 (100.0%) | 410 (100.0%) |
Household Income by Mortgage Status in Buchanan
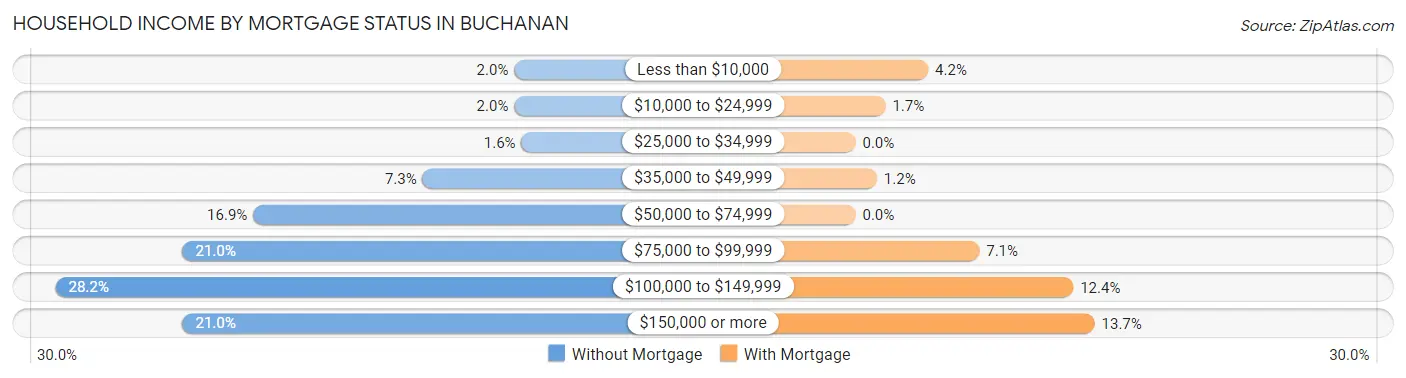
| Household Income | Without Mortgage | With Mortgage |
| Less than $10,000 | 5 (2.0%) | 17 (4.2%) |
| $10,000 to $24,999 | 5 (2.0%) | 7 (1.7%) |
| $25,000 to $34,999 | 4 (1.6%) | 0 (0.0%) |
| $35,000 to $49,999 | 18 (7.3%) | 5 (1.2%) |
| $50,000 to $74,999 | 42 (16.9%) | 0 (0.0%) |
| $75,000 to $99,999 | 52 (21.0%) | 29 (7.1%) |
| $100,000 to $149,999 | 70 (28.2%) | 51 (12.4%) |
| $150,000 or more | 52 (21.0%) | 56 (13.7%) |
| Total | 248 (100.0%) | 410 (100.0%) |
Property Value to Household Income Ratio in Buchanan
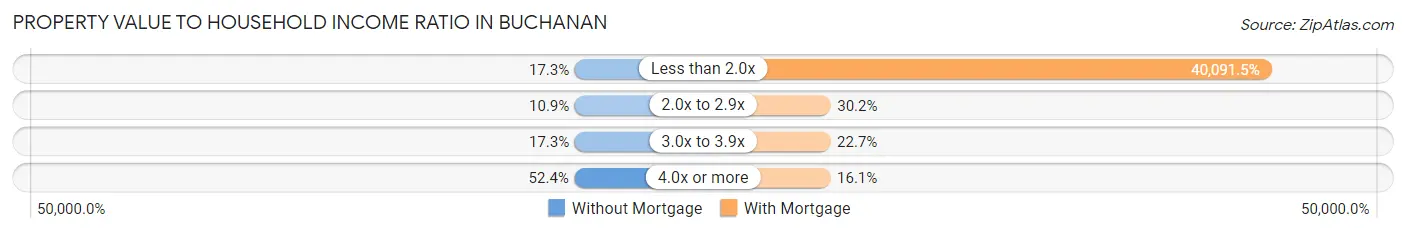
| Value-to-Income Ratio | Without Mortgage | With Mortgage |
| Less than 2.0x | 43 (17.3%) | 164,375 (40,091.5%) |
| 2.0x to 2.9x | 27 (10.9%) | 124 (30.2%) |
| 3.0x to 3.9x | 43 (17.3%) | 93 (22.7%) |
| 4.0x or more | 130 (52.4%) | 66 (16.1%) |
| Total | 248 (100.0%) | 410 (100.0%) |
Real Estate Taxes by Mortgage Status in Buchanan
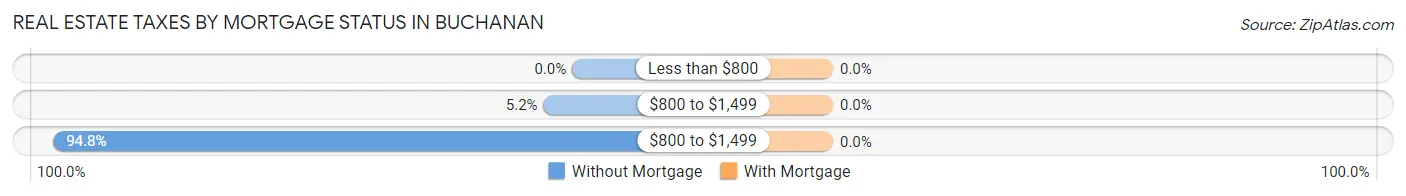
| Property Taxes | Without Mortgage | With Mortgage |
| Less than $800 | 0 (0.0%) | 0 (0.0%) |
| $800 to $1,499 | 13 (5.2%) | 0 (0.0%) |
| $800 to $1,499 | 235 (94.8%) | 0 (0.0%) |
| Total | 248 (100.0%) | 410 (100.0%) |
Health & Disability in Buchanan
Health Insurance Coverage by Age in Buchanan
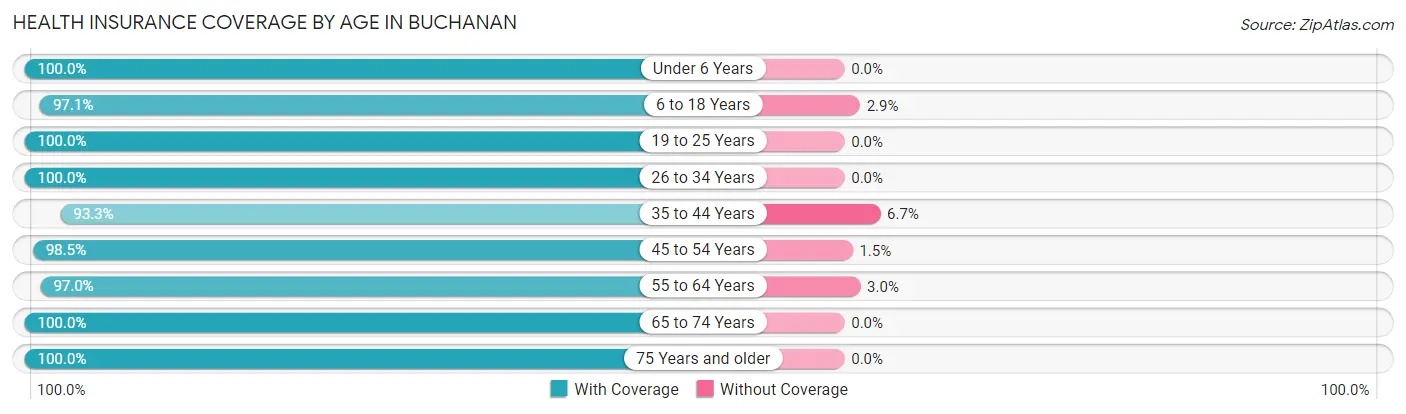
| Age Bracket | With Coverage | Without Coverage |
| Under 6 Years | 149 (100.0%) | 0 (0.0%) |
| 6 to 18 Years | 304 (97.1%) | 9 (2.9%) |
| 19 to 25 Years | 216 (100.0%) | 0 (0.0%) |
| 26 to 34 Years | 302 (100.0%) | 0 (0.0%) |
| 35 to 44 Years | 196 (93.3%) | 14 (6.7%) |
| 45 to 54 Years | 260 (98.5%) | 4 (1.5%) |
| 55 to 64 Years | 394 (97.0%) | 12 (3.0%) |
| 65 to 74 Years | 180 (100.0%) | 0 (0.0%) |
| 75 Years and older | 232 (100.0%) | 0 (0.0%) |
| Total | 2,233 (98.3%) | 39 (1.7%) |
Health Insurance Coverage by Citizenship Status in Buchanan
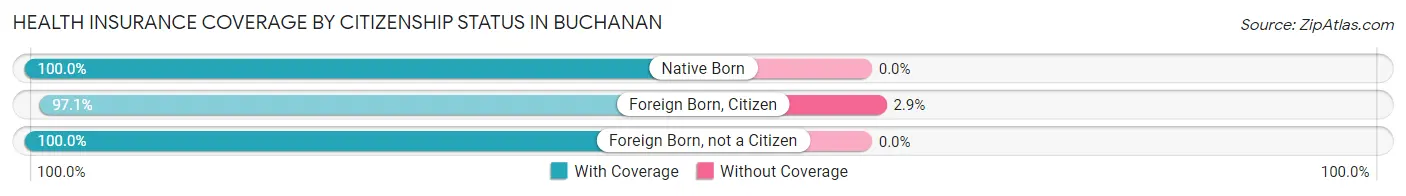
| Citizenship Status | With Coverage | Without Coverage |
| Native Born | 149 (100.0%) | 0 (0.0%) |
| Foreign Born, Citizen | 304 (97.1%) | 9 (2.9%) |
| Foreign Born, not a Citizen | 216 (100.0%) | 0 (0.0%) |
Health Insurance Coverage by Household Income in Buchanan
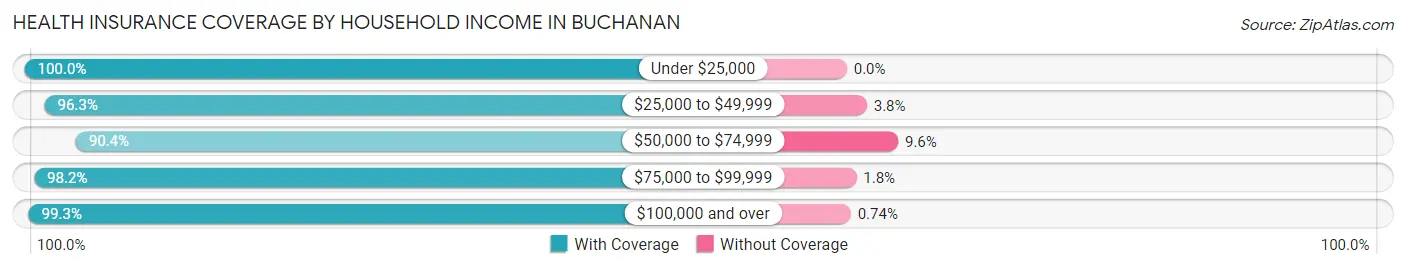
| Household Income | With Coverage | Without Coverage |
| Under $25,000 | 70 (100.0%) | 0 (0.0%) |
| $25,000 to $49,999 | 154 (96.3%) | 6 (3.7%) |
| $50,000 to $74,999 | 160 (90.4%) | 17 (9.6%) |
| $75,000 to $99,999 | 220 (98.2%) | 4 (1.8%) |
| $100,000 and over | 1,610 (99.3%) | 12 (0.7%) |
Public vs Private Health Insurance Coverage by Age in Buchanan
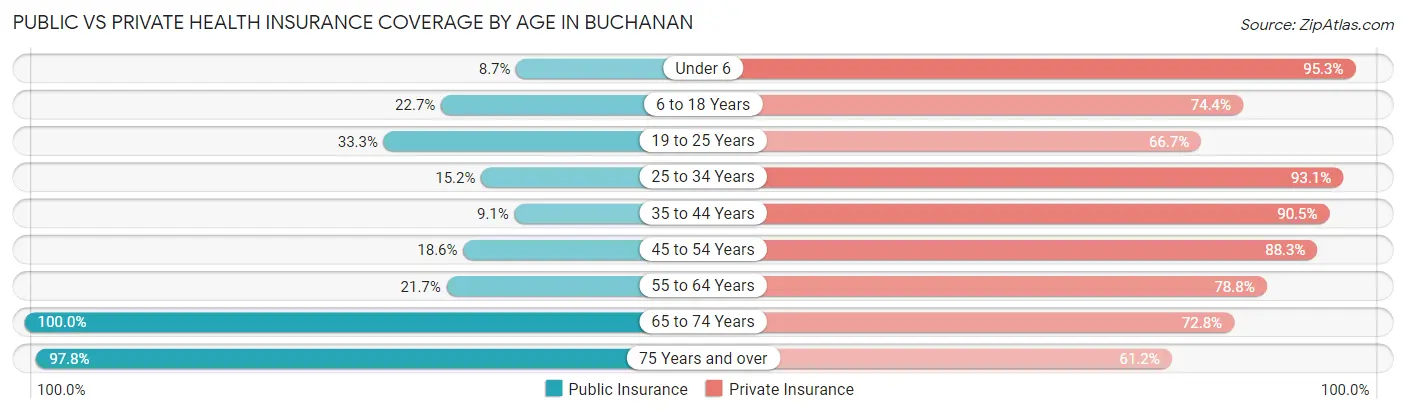
| Age Bracket | Public Insurance | Private Insurance |
| Under 6 | 13 (8.7%) | 142 (95.3%) |
| 6 to 18 Years | 71 (22.7%) | 233 (74.4%) |
| 19 to 25 Years | 72 (33.3%) | 144 (66.7%) |
| 25 to 34 Years | 46 (15.2%) | 281 (93.0%) |
| 35 to 44 Years | 19 (9.0%) | 190 (90.5%) |
| 45 to 54 Years | 49 (18.6%) | 233 (88.3%) |
| 55 to 64 Years | 88 (21.7%) | 320 (78.8%) |
| 65 to 74 Years | 180 (100.0%) | 131 (72.8%) |
| 75 Years and over | 227 (97.8%) | 142 (61.2%) |
| Total | 765 (33.7%) | 1,816 (79.9%) |
Disability Status by Sex by Age in Buchanan
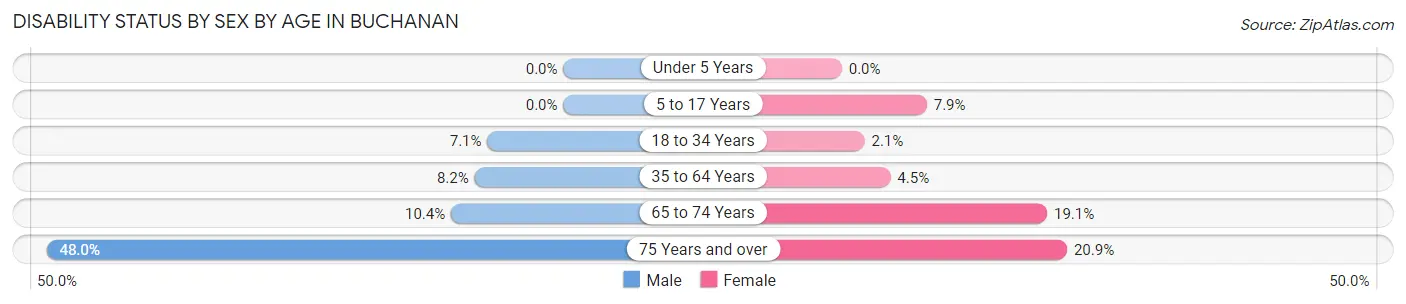
| Age Bracket | Male | Female |
| Under 5 Years | 0 (0.0%) | 0 (0.0%) |
| 5 to 17 Years | 0 (0.0%) | 12 (7.9%) |
| 18 to 34 Years | 21 (7.0%) | 5 (2.1%) |
| 35 to 64 Years | 36 (8.2%) | 20 (4.5%) |
| 65 to 74 Years | 10 (10.4%) | 16 (19.1%) |
| 75 Years and over | 47 (48.0%) | 28 (20.9%) |
Disability Class by Sex by Age in Buchanan
Disability Class: Hearing Difficulty
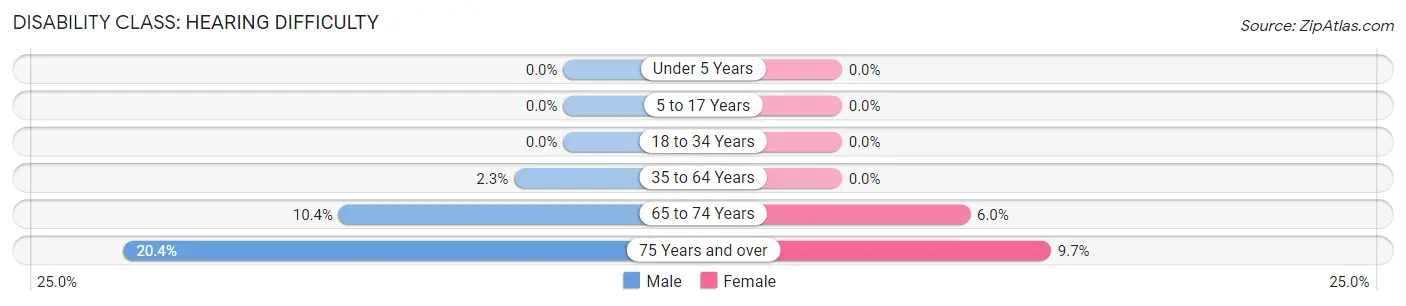
| Age Bracket | Male | Female |
| Under 5 Years | 0 (0.0%) | 0 (0.0%) |
| 5 to 17 Years | 0 (0.0%) | 0 (0.0%) |
| 18 to 34 Years | 0 (0.0%) | 0 (0.0%) |
| 35 to 64 Years | 10 (2.3%) | 0 (0.0%) |
| 65 to 74 Years | 10 (10.4%) | 5 (5.9%) |
| 75 Years and over | 20 (20.4%) | 13 (9.7%) |
Disability Class: Vision Difficulty
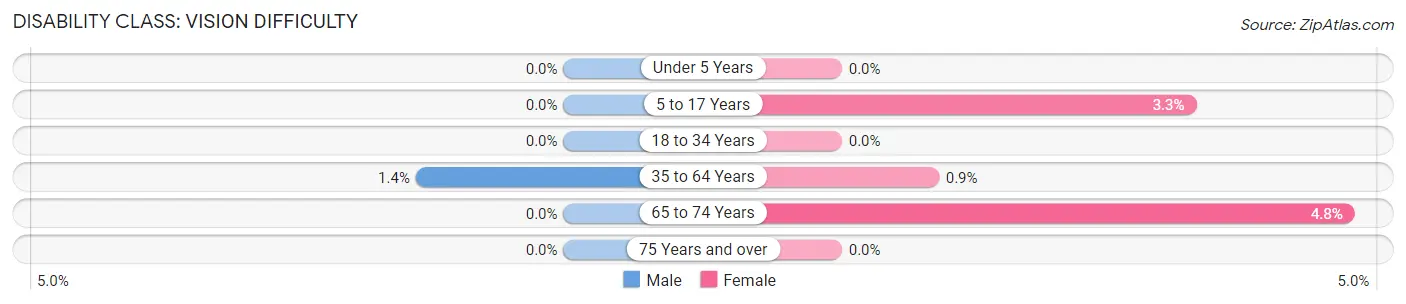
| Age Bracket | Male | Female |
| Under 5 Years | 0 (0.0%) | 0 (0.0%) |
| 5 to 17 Years | 0 (0.0%) | 5 (3.3%) |
| 18 to 34 Years | 0 (0.0%) | 0 (0.0%) |
| 35 to 64 Years | 6 (1.4%) | 4 (0.9%) |
| 65 to 74 Years | 0 (0.0%) | 4 (4.8%) |
| 75 Years and over | 0 (0.0%) | 0 (0.0%) |
Disability Class: Cognitive Difficulty
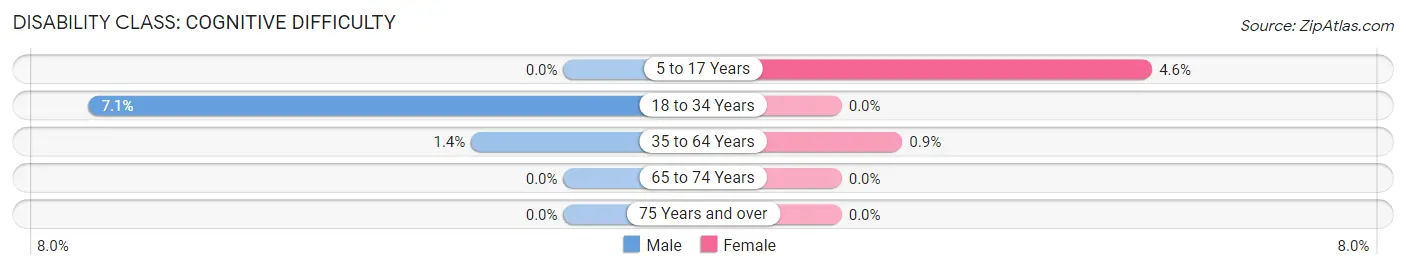
| Age Bracket | Male | Female |
| 5 to 17 Years | 0 (0.0%) | 7 (4.6%) |
| 18 to 34 Years | 21 (7.0%) | 0 (0.0%) |
| 35 to 64 Years | 6 (1.4%) | 4 (0.9%) |
| 65 to 74 Years | 0 (0.0%) | 0 (0.0%) |
| 75 Years and over | 0 (0.0%) | 0 (0.0%) |
Disability Class: Ambulatory Difficulty
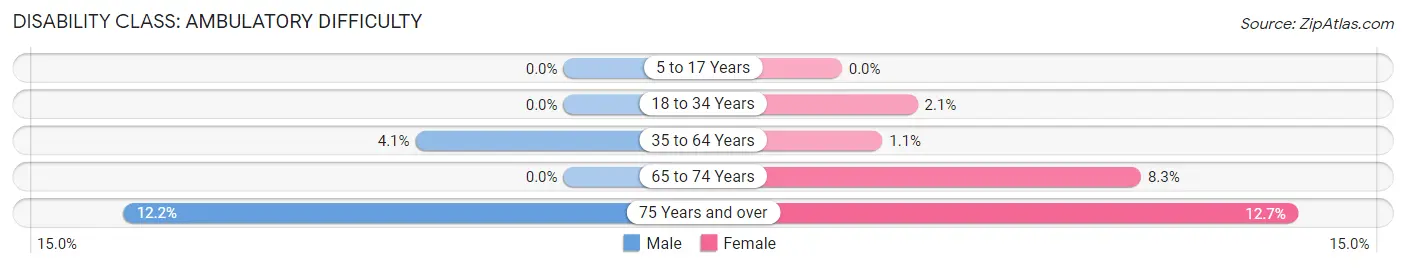
| Age Bracket | Male | Female |
| 5 to 17 Years | 0 (0.0%) | 0 (0.0%) |
| 18 to 34 Years | 0 (0.0%) | 5 (2.1%) |
| 35 to 64 Years | 18 (4.1%) | 5 (1.1%) |
| 65 to 74 Years | 0 (0.0%) | 7 (8.3%) |
| 75 Years and over | 12 (12.2%) | 17 (12.7%) |
Disability Class: Self-Care Difficulty
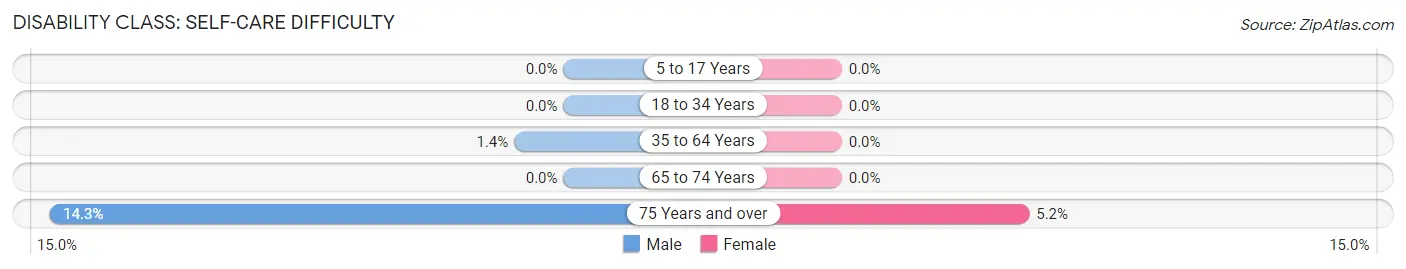
| Age Bracket | Male | Female |
| 5 to 17 Years | 0 (0.0%) | 0 (0.0%) |
| 18 to 34 Years | 0 (0.0%) | 0 (0.0%) |
| 35 to 64 Years | 6 (1.4%) | 0 (0.0%) |
| 65 to 74 Years | 0 (0.0%) | 0 (0.0%) |
| 75 Years and over | 14 (14.3%) | 7 (5.2%) |
Technology Access in Buchanan
Computing Device Access in Buchanan
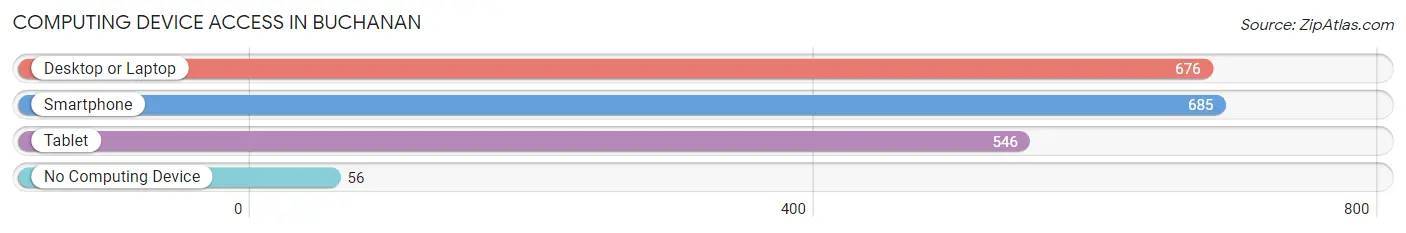
| Device Type | # Households | % Households |
| Desktop or Laptop | 676 | 85.9% |
| Smartphone | 685 | 87.0% |
| Tablet | 546 | 69.4% |
| No Computing Device | 56 | 7.1% |
| Total | 787 | 100.0% |
Internet Access in Buchanan
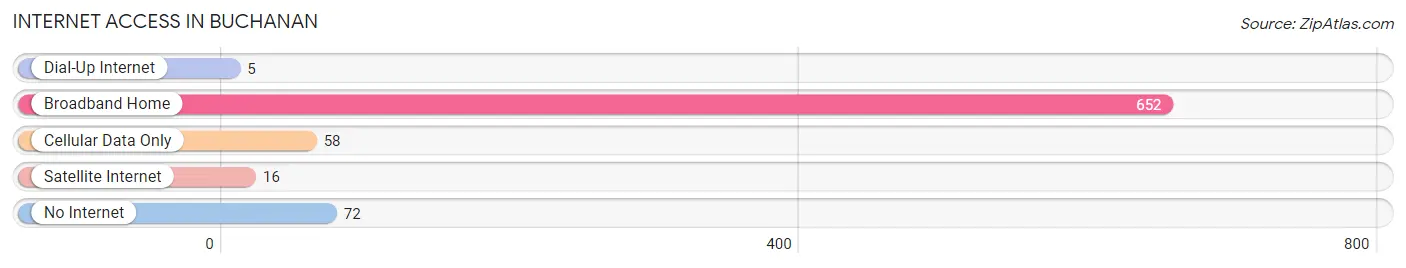
| Internet Type | # Households | % Households |
| Dial-Up Internet | 5 | 0.6% |
| Broadband Home | 652 | 82.9% |
| Cellular Data Only | 58 | 7.4% |
| Satellite Internet | 16 | 2.0% |
| No Internet | 72 | 9.1% |
| Total | 787 | 100.0% |
Buchanan Summary
Buchanan is a village located in the Town of Cortlandt in Westchester County, New York. The village is situated on the east bank of the Hudson River, approximately 40 miles north of New York City. The village has a population of approximately 4,000 people and covers an area of 1.2 square miles.
History
The area that is now the village of Buchanan was originally inhabited by the Wappinger Indians. The first European settlers arrived in the area in the late 17th century. The village was originally known as “Buchanan’s Landing” and was named after the Buchanan family, who were among the first settlers. The village was officially incorporated in 1849.
In the 19th century, the village was a popular destination for wealthy New Yorkers who wanted to escape the hustle and bustle of the city. The village was home to several large estates, including the Buchanan Estate, which was owned by the family for whom the village was named.
Geography
Buchanan is located in the Town of Cortlandt in Westchester County, New York. The village is situated on the east bank of the Hudson River, approximately 40 miles north of New York City. The village has a total area of 1.2 square miles, all of which is land. The village is bordered by the towns of Peekskill to the north, Yorktown to the east, and Cortlandt to the south and west.
The village is located in a hilly area, with elevations ranging from sea level to over 500 feet. The highest point in the village is located at the intersection of Old Albany Post Road and Croton Avenue, which has an elevation of 517 feet.
Economy
The economy of Buchanan is largely based on tourism and retail. The village is home to several small businesses, including restaurants, shops, and galleries. The village is also home to several large employers, including the Buchanan Estate, which is a popular tourist destination.
The village is also home to several industrial and manufacturing businesses, including a paper mill and a printing company. The village is also home to several educational institutions, including the Buchanan School of Arts and Sciences.
Demographics
As of the 2010 census, the village of Buchanan had a population of 4,000 people. The racial makeup of the village was 87.3% White, 5.2% African American, 0.3% Native American, 2.2% Asian, and 4.9% from other races. Hispanic or Latino of any race were 8.2% of the population.
The median household income in the village was $68,750, and the median family income was $77,500. The per capita income for the village was $30,000. About 8.2% of families and 10.2% of the population were below the poverty line, including 14.2% of those under age 18 and 5.2% of those age 65 or over.
Common Questions
What is Per Capita Income in Buchanan?
Per Capita income in Buchanan is $61,404.
What is the Median Family Income in Buchanan?
Median Family Income in Buchanan is $147,344.
What is the Median Household income in Buchanan?
Median Household Income in Buchanan is $133,646.
What is Income or Wage Gap in Buchanan?
Income or Wage Gap in Buchanan is 25.9%.
Women in Buchanan earn 74.1 cents for every dollar earned by a man.
What is Inequality or Gini Index in Buchanan?
Inequality or Gini Index in Buchanan is 0.44.
What is the Total Population of Buchanan?
Total Population of Buchanan is 2,272.
What is the Total Male Population of Buchanan?
Total Male Population of Buchanan is 1,125.
What is the Total Female Population of Buchanan?
Total Female Population of Buchanan is 1,147.
What is the Ratio of Males per 100 Females in Buchanan?
There are 98.08 Males per 100 Females in Buchanan.
What is the Ratio of Females per 100 Males in Buchanan?
There are 101.96 Females per 100 Males in Buchanan.
What is the Median Population Age in Buchanan?
Median Population Age in Buchanan is 42.3 Years.
What is the Average Family Size in Buchanan
Average Family Size in Buchanan is 3.3 People.
What is the Average Household Size in Buchanan
Average Household Size in Buchanan is 2.9 People.
How Large is the Labor Force in Buchanan?
There are 1,207 People in the Labor Forcein in Buchanan.
What is the Percentage of People in the Labor Force in Buchanan?
65.3% of People are in the Labor Force in Buchanan.
What is the Unemployment Rate in Buchanan?
Unemployment Rate in Buchanan is 2.6%.