Locust Valley, NY Map & Demographics
Locust Valley Map
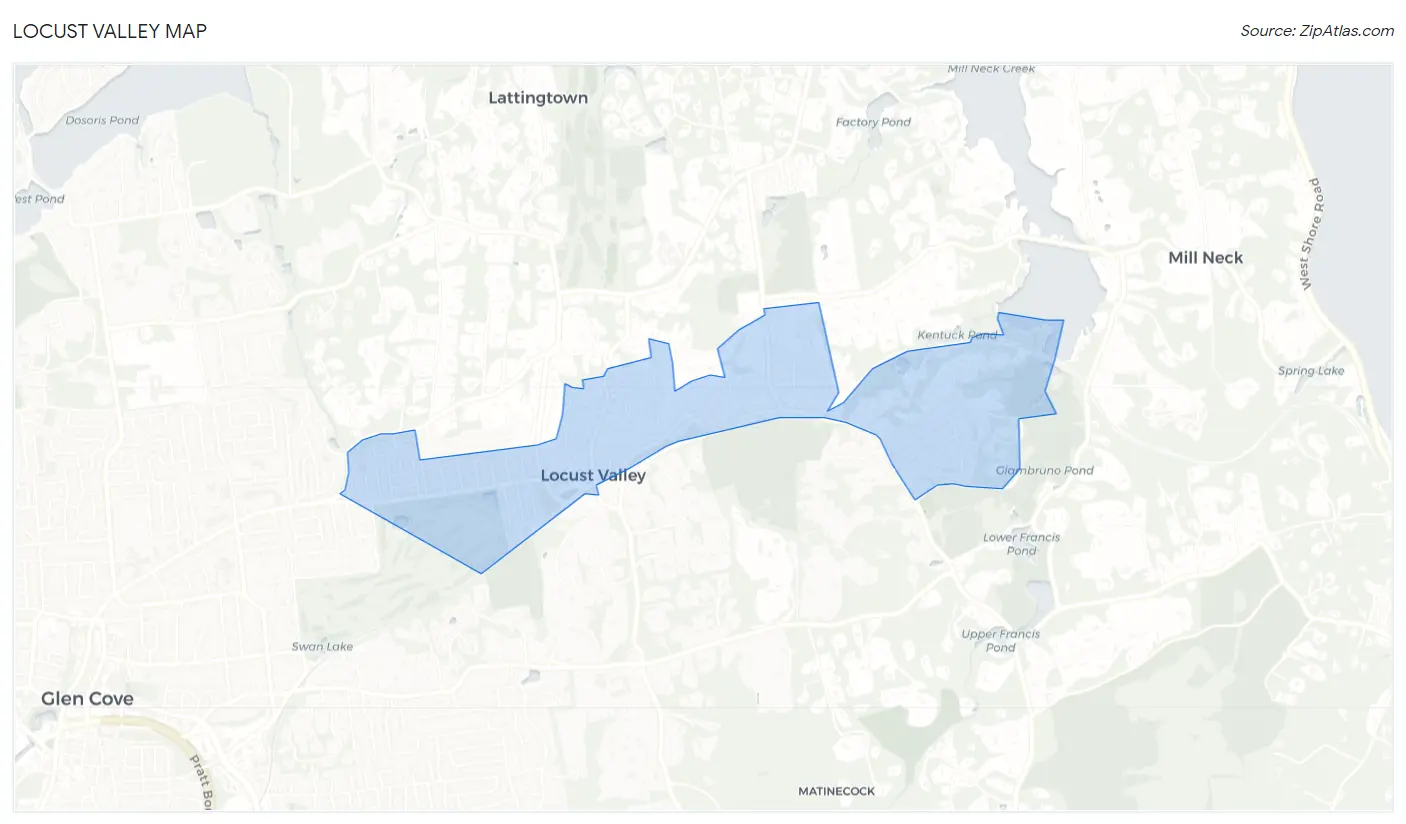
Locust Valley Overview
$89,333
PER CAPITA INCOME
$167,667
AVG FAMILY INCOME
$134,063
AVG HOUSEHOLD INCOME
41.7%
WAGE / INCOME GAP [ % ]
58.3¢/ $1
WAGE / INCOME GAP [ $ ]
0.56
INEQUALITY / GINI INDEX
3,611
TOTAL POPULATION
1,914
MALE POPULATION
1,697
FEMALE POPULATION
112.79
MALES / 100 FEMALES
88.66
FEMALES / 100 MALES
43.5
MEDIAN AGE
3.2
AVG FAMILY SIZE
2.9
AVG HOUSEHOLD SIZE
1,727
LABOR FORCE [ PEOPLE ]
65.3%
PERCENT IN LABOR FORCE
3.2%
UNEMPLOYMENT RATE
Locust Valley Zip Codes
Locust Valley Area Codes
Income in Locust Valley
Income Overview in Locust Valley
Per Capita Income in Locust Valley is $89,333, while median incomes of families and households are $167,667 and $134,063 respectively.
| Characteristic | Number | Measure |
| Per Capita Income | 3,611 | $89,333 |
| Median Family Income | 1,016 | $167,667 |
| Mean Family Income | 1,016 | $302,938 |
| Median Household Income | 1,258 | $134,063 |
| Mean Household Income | 1,258 | $258,372 |
| Income Deficit | 1,016 | $0 |
| Wage / Income Gap (%) | 3,611 | 41.70% |
| Wage / Income Gap ($) | 3,611 | 58.30¢ per $1 |
| Gini / Inequality Index | 3,611 | 0.56 |
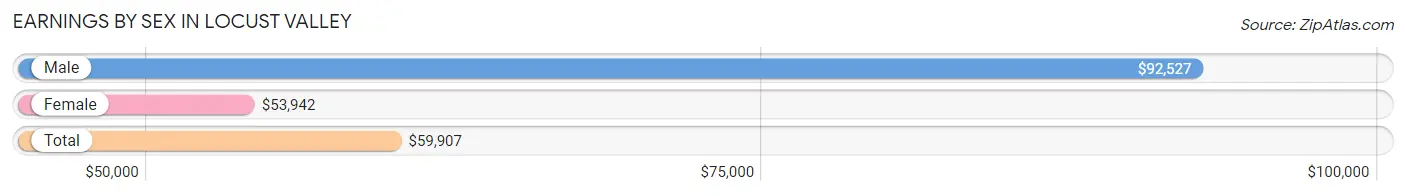
Earnings by Sex in Locust Valley
Average Earnings in Locust Valley are $59,907, $92,527 for men and $53,942 for women, a difference of 41.7%.
| Sex | Number | Average Earnings |
| Male | 925 (52.7%) | $92,527 |
| Female | 829 (47.3%) | $53,942 |
| Total | 1,754 (100.0%) | $59,907 |
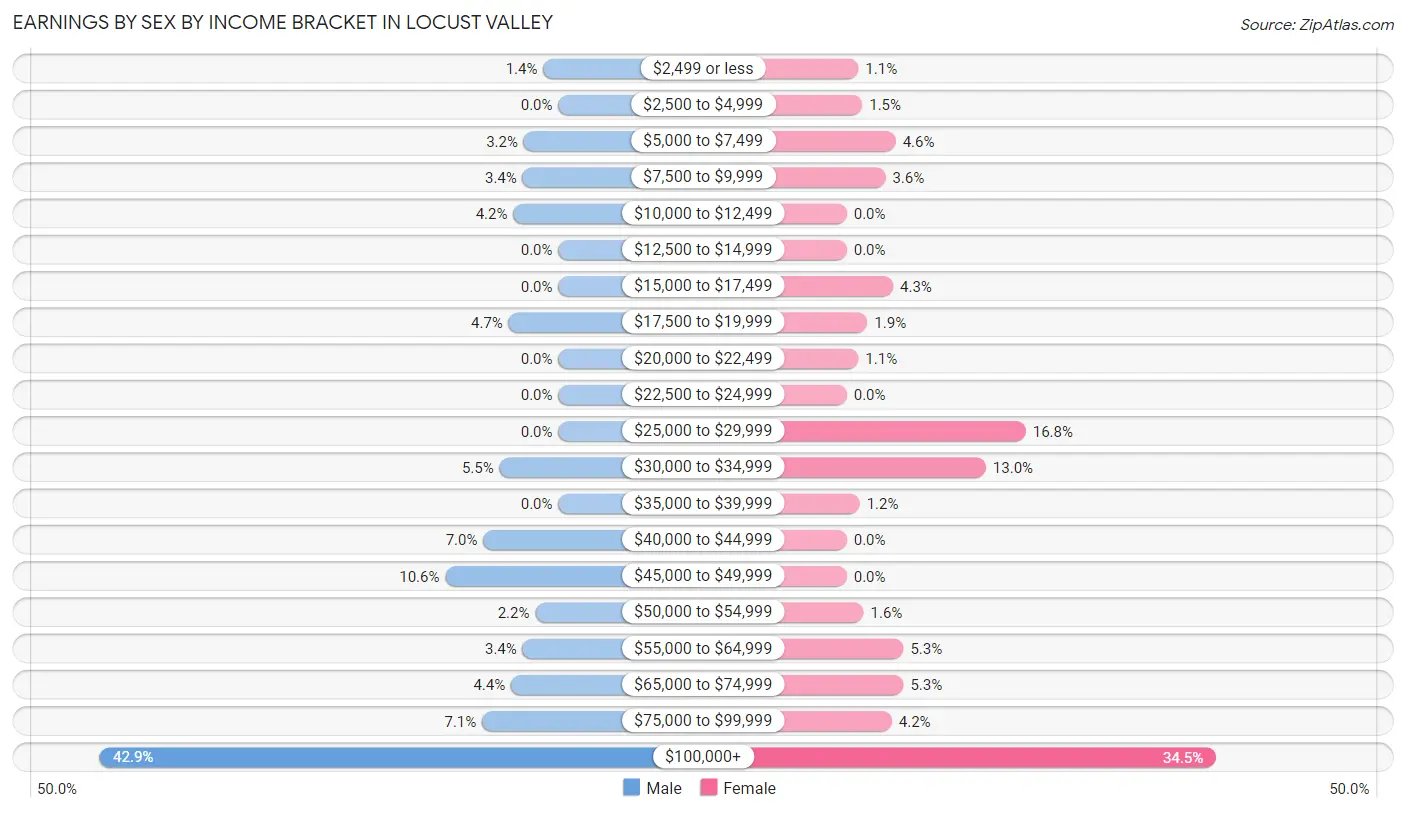
Earnings by Sex by Income Bracket in Locust Valley
The most common earnings brackets in Locust Valley are $100,000+ for men (397 | 42.9%) and $100,000+ for women (286 | 34.5%).
| Income | Male | Female |
| $2,499 or less | 13 (1.4%) | 9 (1.1%) |
| $2,500 to $4,999 | 0 (0.0%) | 12 (1.5%) |
| $5,000 to $7,499 | 30 (3.2%) | 38 (4.6%) |
| $7,500 to $9,999 | 31 (3.4%) | 30 (3.6%) |
| $10,000 to $12,499 | 39 (4.2%) | 0 (0.0%) |
| $12,500 to $14,999 | 0 (0.0%) | 0 (0.0%) |
| $15,000 to $17,499 | 0 (0.0%) | 36 (4.3%) |
| $17,500 to $19,999 | 43 (4.6%) | 16 (1.9%) |
| $20,000 to $22,499 | 0 (0.0%) | 9 (1.1%) |
| $22,500 to $24,999 | 0 (0.0%) | 0 (0.0%) |
| $25,000 to $29,999 | 0 (0.0%) | 139 (16.8%) |
| $30,000 to $34,999 | 51 (5.5%) | 108 (13.0%) |
| $35,000 to $39,999 | 0 (0.0%) | 10 (1.2%) |
| $40,000 to $44,999 | 65 (7.0%) | 0 (0.0%) |
| $45,000 to $49,999 | 98 (10.6%) | 0 (0.0%) |
| $50,000 to $54,999 | 20 (2.2%) | 13 (1.6%) |
| $55,000 to $64,999 | 31 (3.4%) | 44 (5.3%) |
| $65,000 to $74,999 | 41 (4.4%) | 44 (5.3%) |
| $75,000 to $99,999 | 66 (7.1%) | 35 (4.2%) |
| $100,000+ | 397 (42.9%) | 286 (34.5%) |
| Total | 925 (100.0%) | 829 (100.0%) |
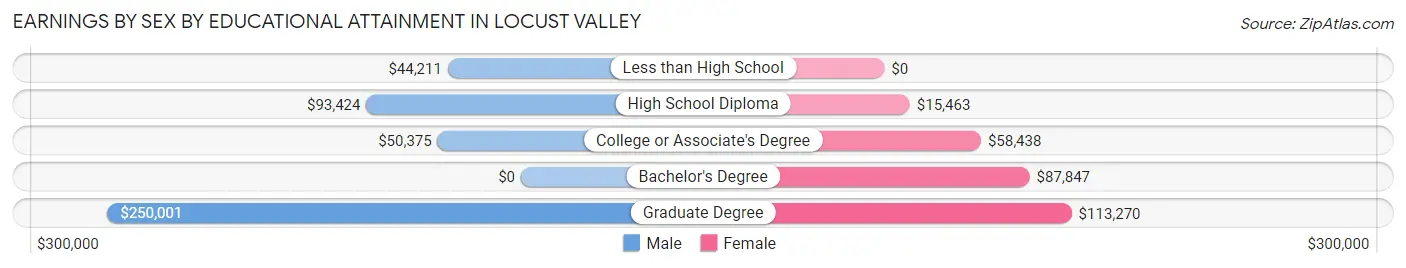
Earnings by Sex by Educational Attainment in Locust Valley
Average earnings in Locust Valley are $98,684 for men and $58,807 for women, a difference of 40.4%. Men with an educational attainment of graduate degree enjoy the highest average annual earnings of $250,001, while those with less than high school education earn the least with $44,211. Women with an educational attainment of graduate degree earn the most with the average annual earnings of $113,270, while those with high school diploma education have the smallest earnings of $15,463.
| Educational Attainment | Male Income | Female Income |
| Less than High School | $44,211 | $0 |
| High School Diploma | $93,424 | $15,463 |
| College or Associate's Degree | $50,375 | $58,438 |
| Bachelor's Degree | - | - |
| Graduate Degree | $250,001 | $113,270 |
| Total | $98,684 | $58,807 |
Family Income in Locust Valley
Family Income Brackets in Locust Valley
According to the Locust Valley family income data, there are 462 families falling into the $200,000+ income range, which is the most common income bracket and makes up 45.5% of all families.
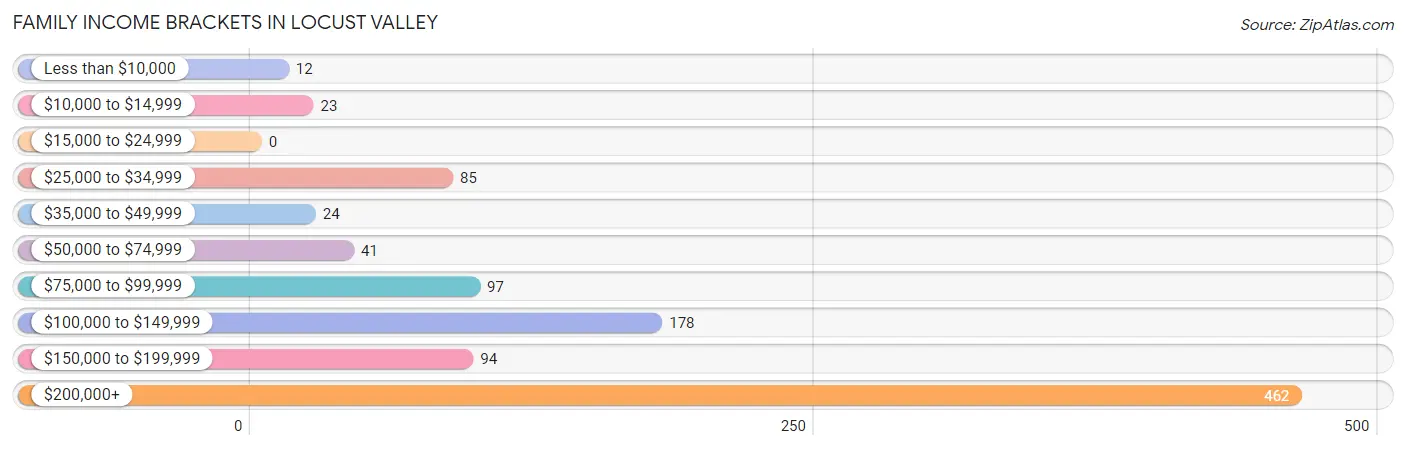
| Income Bracket | # Families | % Families |
| Less than $10,000 | 12 | 1.2% |
| $10,000 to $14,999 | 23 | 2.3% |
| $15,000 to $24,999 | 0 | 0.0% |
| $25,000 to $34,999 | 85 | 8.4% |
| $35,000 to $49,999 | 24 | 2.4% |
| $50,000 to $74,999 | 41 | 4.0% |
| $75,000 to $99,999 | 97 | 9.5% |
| $100,000 to $149,999 | 178 | 17.5% |
| $150,000 to $199,999 | 94 | 9.3% |
| $200,000+ | 462 | 45.5% |
Family Income by Famaliy Size in Locust Valley
5-person families (59 | 5.8%) account for the highest median family income in Locust Valley with $250,001 per family, while 2-person families (440 | 43.3%) have the highest median income of $76,666 per family member.
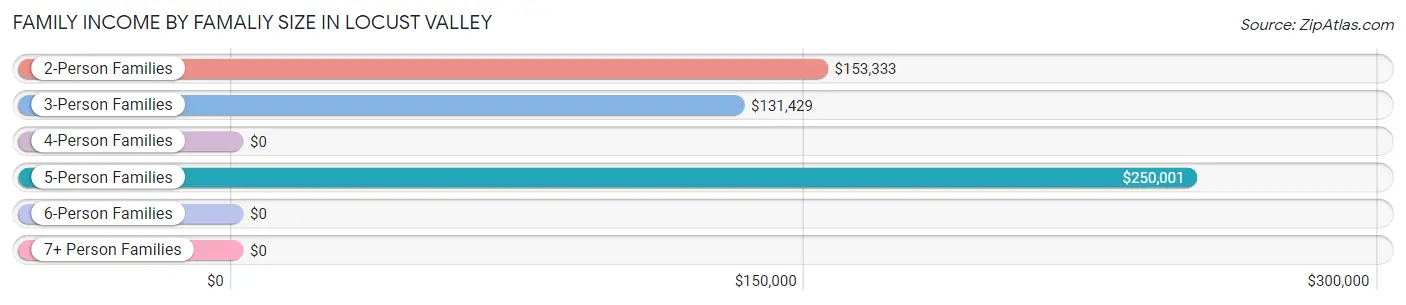
| Income Bracket | # Families | Median Income |
| 2-Person Families | 440 (43.3%) | $153,333 |
| 3-Person Families | 174 (17.1%) | $131,429 |
| 4-Person Families | 327 (32.2%) | $0 |
| 5-Person Families | 59 (5.8%) | $250,001 |
| 6-Person Families | 0 (0.0%) | $0 |
| 7+ Person Families | 16 (1.6%) | $0 |
| Total | 1,016 (100.0%) | $167,667 |
Family Income by Number of Earners in Locust Valley
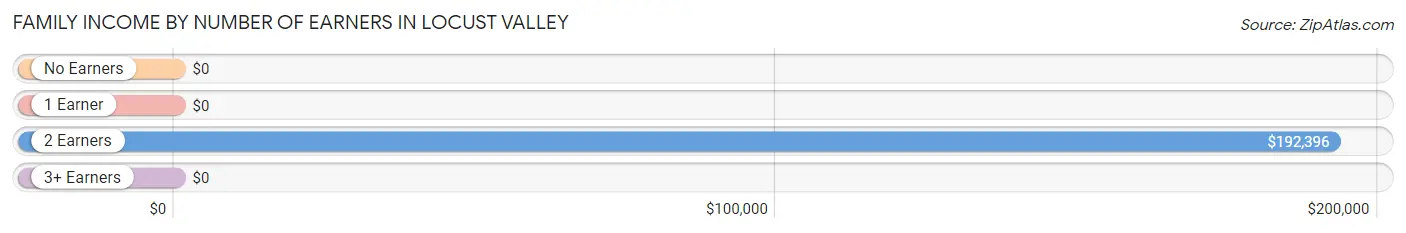
| Number of Earners | # Families | Median Income |
| No Earners | 137 (13.5%) | $0 |
| 1 Earner | 322 (31.7%) | $0 |
| 2 Earners | 477 (46.9%) | $192,396 |
| 3+ Earners | 80 (7.9%) | $0 |
| Total | 1,016 (100.0%) | $167,667 |
Household Income in Locust Valley
Household Income Brackets in Locust Valley
With 462 households falling in the category, the $200,000+ income range is the most frequent in Locust Valley, accounting for 36.7% of all households. In contrast, only 23 households (1.8%) fall into the $10,000 to $14,999 income bracket, making it the least populous group.
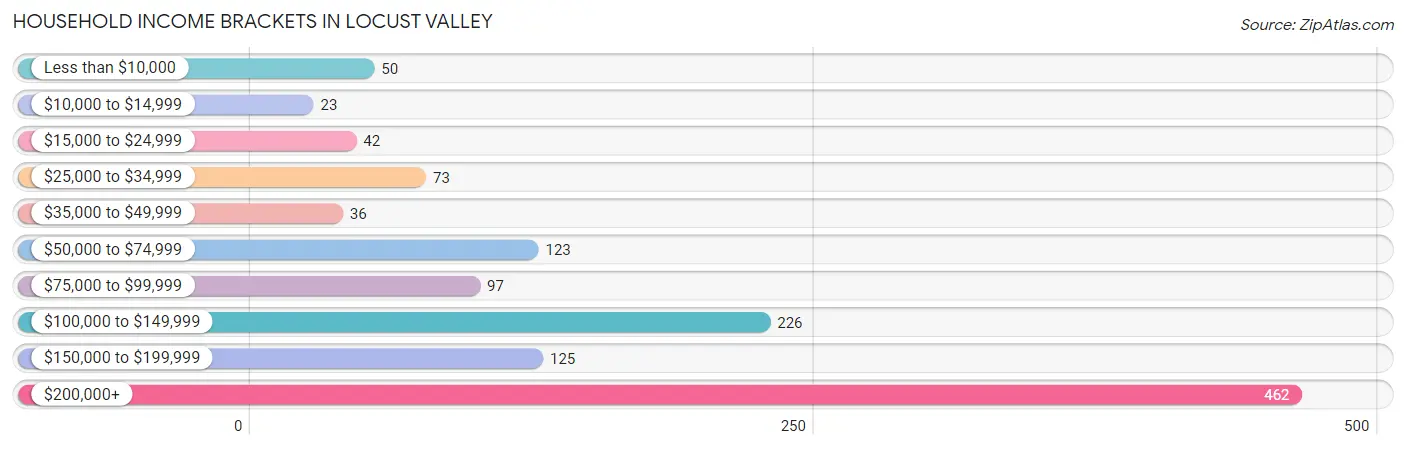
| Income Bracket | # Households | % Households |
| Less than $10,000 | 50 | 4.0% |
| $10,000 to $14,999 | 23 | 1.8% |
| $15,000 to $24,999 | 42 | 3.3% |
| $25,000 to $34,999 | 73 | 5.8% |
| $35,000 to $49,999 | 36 | 2.9% |
| $50,000 to $74,999 | 123 | 9.8% |
| $75,000 to $99,999 | 97 | 7.7% |
| $100,000 to $149,999 | 226 | 18.0% |
| $150,000 to $199,999 | 125 | 9.9% |
| $200,000+ | 462 | 36.7% |
Household Income by Householder Age in Locust Valley
The median household income in Locust Valley is $134,063, with the highest median household income of $160,000 found in the 25 to 44 years age bracket for the primary householder. A total of 234 households (18.6%) fall into this category. Meanwhile, the 15 to 24 years age bracket for the primary householder has the lowest median household income of $0, with 23 households (1.8%) in this group.
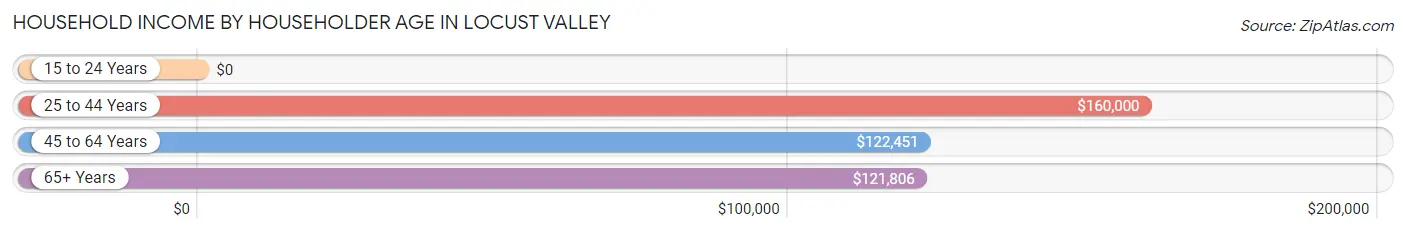
| Income Bracket | # Households | Median Income |
| 15 to 24 Years | 23 (1.8%) | $0 |
| 25 to 44 Years | 234 (18.6%) | $160,000 |
| 45 to 64 Years | 642 (51.0%) | $122,451 |
| 65+ Years | 359 (28.5%) | $121,806 |
| Total | 1,258 (100.0%) | $134,063 |
Poverty in Locust Valley
Income Below Poverty by Sex and Age in Locust Valley
With 4.5% poverty level for males and 3.8% for females among the residents of Locust Valley, 6 to 11 year old males and 65 to 74 year old females are the most vulnerable to poverty, with 23 males (16.9%) and 19 females (8.4%) in their respective age groups living below the poverty level.
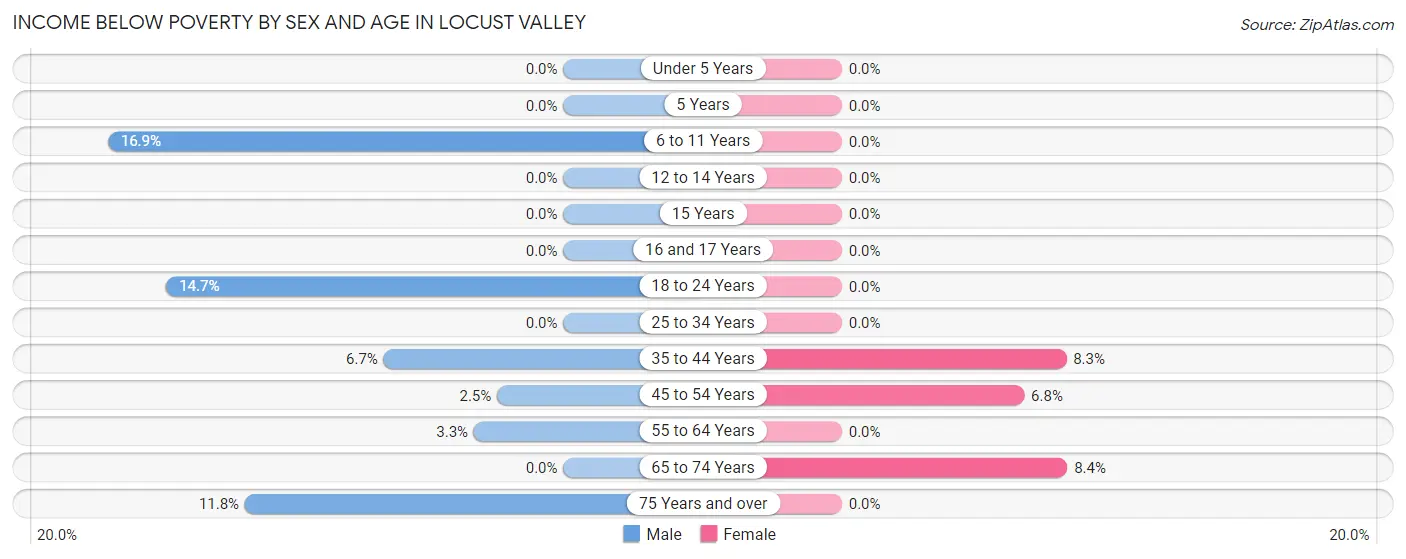
| Age Bracket | Male | Female |
| Under 5 Years | 0 (0.0%) | 0 (0.0%) |
| 5 Years | 0 (0.0%) | 0 (0.0%) |
| 6 to 11 Years | 23 (16.9%) | 0 (0.0%) |
| 12 to 14 Years | 0 (0.0%) | 0 (0.0%) |
| 15 Years | 0 (0.0%) | 0 (0.0%) |
| 16 and 17 Years | 0 (0.0%) | 0 (0.0%) |
| 18 to 24 Years | 23 (14.7%) | 0 (0.0%) |
| 25 to 34 Years | 0 (0.0%) | 0 (0.0%) |
| 35 to 44 Years | 12 (6.7%) | 20 (8.3%) |
| 45 to 54 Years | 7 (2.5%) | 26 (6.8%) |
| 55 to 64 Years | 7 (3.3%) | 0 (0.0%) |
| 65 to 74 Years | 0 (0.0%) | 19 (8.4%) |
| 75 Years and over | 13 (11.8%) | 0 (0.0%) |
| Total | 85 (4.5%) | 65 (3.8%) |
Income Above Poverty by Sex and Age in Locust Valley
According to the poverty statistics in Locust Valley, males aged under 5 years and females aged under 5 years are the age groups that are most secure financially, with 100.0% of males and 100.0% of females in these age groups living above the poverty line.
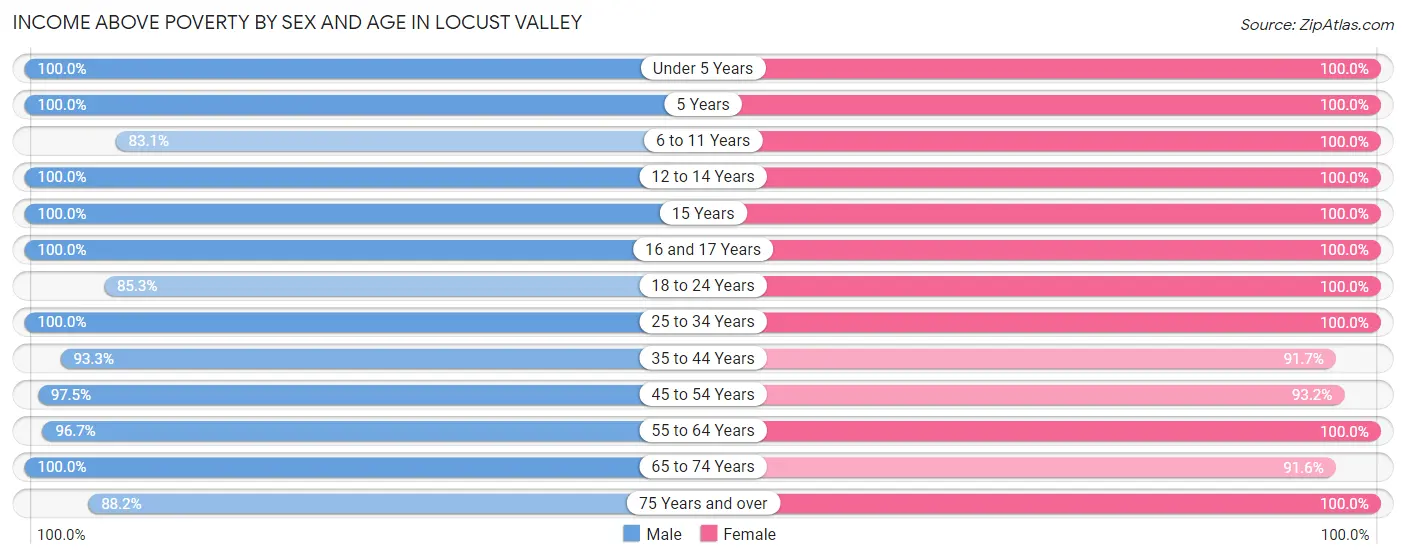
| Age Bracket | Male | Female |
| Under 5 Years | 98 (100.0%) | 100 (100.0%) |
| 5 Years | 15 (100.0%) | 12 (100.0%) |
| 6 to 11 Years | 113 (83.1%) | 102 (100.0%) |
| 12 to 14 Years | 262 (100.0%) | 84 (100.0%) |
| 15 Years | 136 (100.0%) | 13 (100.0%) |
| 16 and 17 Years | 20 (100.0%) | 22 (100.0%) |
| 18 to 24 Years | 133 (85.3%) | 48 (100.0%) |
| 25 to 34 Years | 151 (100.0%) | 93 (100.0%) |
| 35 to 44 Years | 168 (93.3%) | 220 (91.7%) |
| 45 to 54 Years | 277 (97.5%) | 358 (93.2%) |
| 55 to 64 Years | 204 (96.7%) | 238 (100.0%) |
| 65 to 74 Years | 146 (100.0%) | 208 (91.6%) |
| 75 Years and over | 97 (88.2%) | 134 (100.0%) |
| Total | 1,820 (95.5%) | 1,632 (96.2%) |
Income Below Poverty Among Married-Couple Families in Locust Valley
The poverty statistics for married-couple families in Locust Valley show that 1.4% or 12 of the total 839 families live below the poverty line. Families with 1 or 2 children have the highest poverty rate of 4.2%, comprising of 12 families. On the other hand, families with no children have the lowest poverty rate of 0.0%, which includes 0 families.
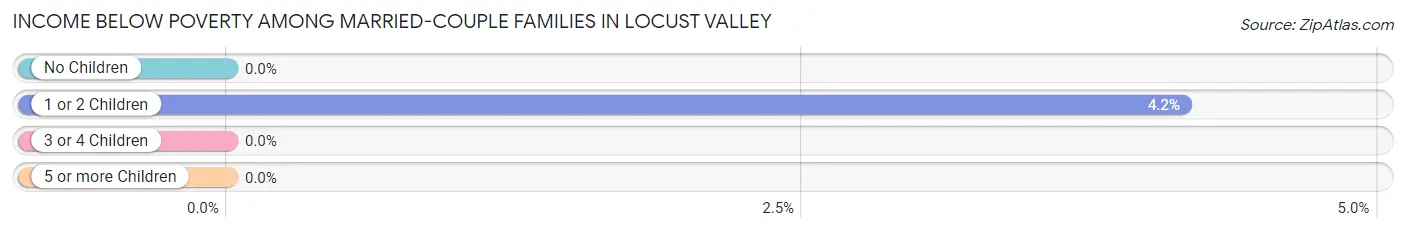
| Children | Above Poverty | Below Poverty |
| No Children | 489 (100.0%) | 0 (0.0%) |
| 1 or 2 Children | 277 (95.9%) | 12 (4.2%) |
| 3 or 4 Children | 61 (100.0%) | 0 (0.0%) |
| 5 or more Children | 0 (0.0%) | 0 (0.0%) |
| Total | 827 (98.6%) | 12 (1.4%) |
Income Below Poverty Among Single-Parent Households in Locust Valley
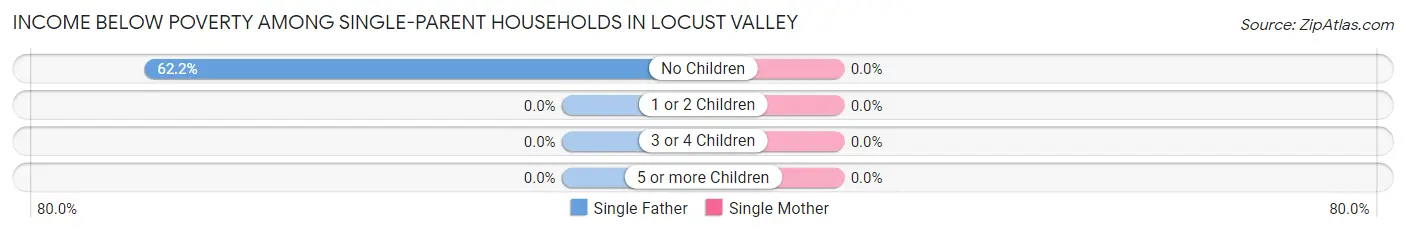
| Children | Single Father | Single Mother |
| No Children | 23 (62.2%) | 0 (0.0%) |
| 1 or 2 Children | 0 (0.0%) | 0 (0.0%) |
| 3 or 4 Children | 0 (0.0%) | 0 (0.0%) |
| 5 or more Children | 0 (0.0%) | 0 (0.0%) |
| Total | 23 (62.2%) | 0 (0.0%) |
Income Below Poverty Among Married-Couple vs Single-Parent Households in Locust Valley
The poverty data for Locust Valley shows that 12 of the married-couple family households (1.4%) and 23 of the single-parent households (13.0%) are living below the poverty level. Within the married-couple family households, those with 1 or 2 children have the highest poverty rate, with 12 households (4.2%) falling below the poverty line. Among the single-parent households, those with no children have the highest poverty rate, with 23 household (37.1%) living below poverty.
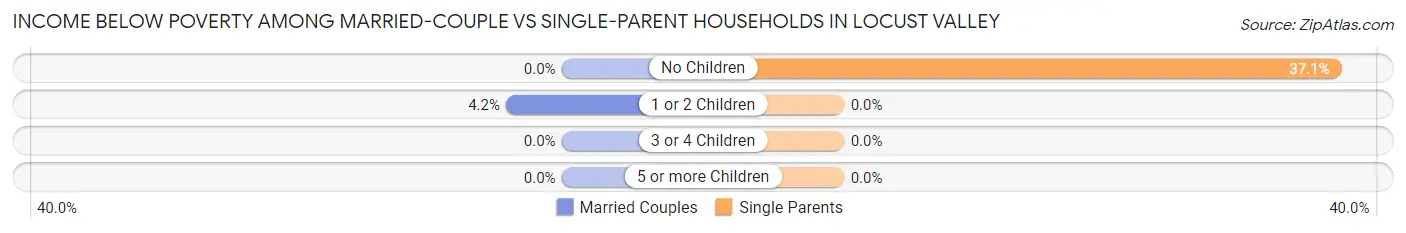
| Children | Married-Couple Families | Single-Parent Households |
| No Children | 0 (0.0%) | 23 (37.1%) |
| 1 or 2 Children | 12 (4.2%) | 0 (0.0%) |
| 3 or 4 Children | 0 (0.0%) | 0 (0.0%) |
| 5 or more Children | 0 (0.0%) | 0 (0.0%) |
| Total | 12 (1.4%) | 23 (13.0%) |
Race in Locust Valley
The most populous races in Locust Valley are White / Caucasian (3,133 | 86.8%), Hispanic or Latino (717 | 19.9%), and Two or more Races (242 | 6.7%).
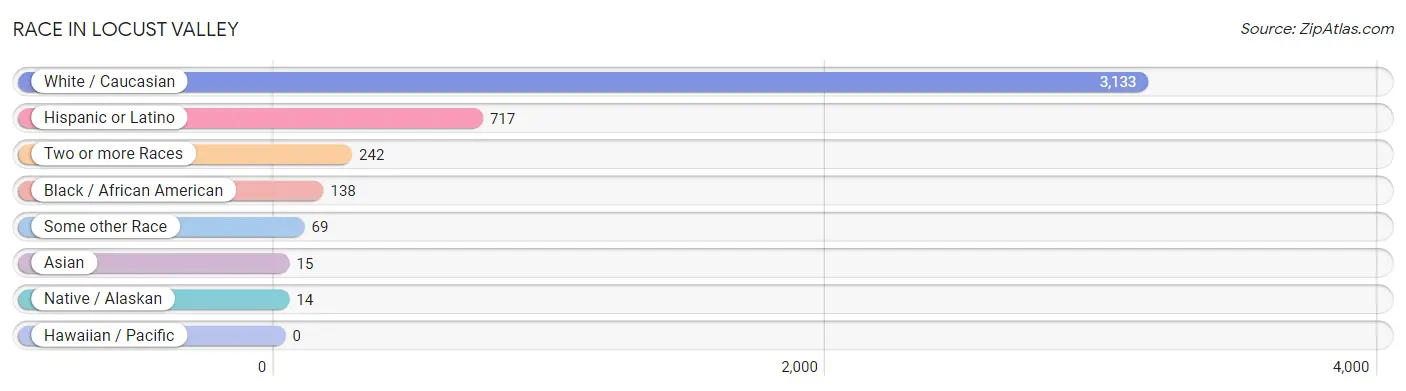
| Race | # Population | % Population |
| Asian | 15 | 0.4% |
| Black / African American | 138 | 3.8% |
| Hawaiian / Pacific | 0 | 0.0% |
| Hispanic or Latino | 717 | 19.9% |
| Native / Alaskan | 14 | 0.4% |
| White / Caucasian | 3,133 | 86.8% |
| Two or more Races | 242 | 6.7% |
| Some other Race | 69 | 1.9% |
| Total | 3,611 | 100.0% |
Ancestry in Locust Valley
The most populous ancestries reported in Locust Valley are Italian (992 | 27.5%), Irish (564 | 15.6%), Central American (358 | 9.9%), German (333 | 9.2%), and Polish (304 | 8.4%), together accounting for 70.6% of all Locust Valley residents.
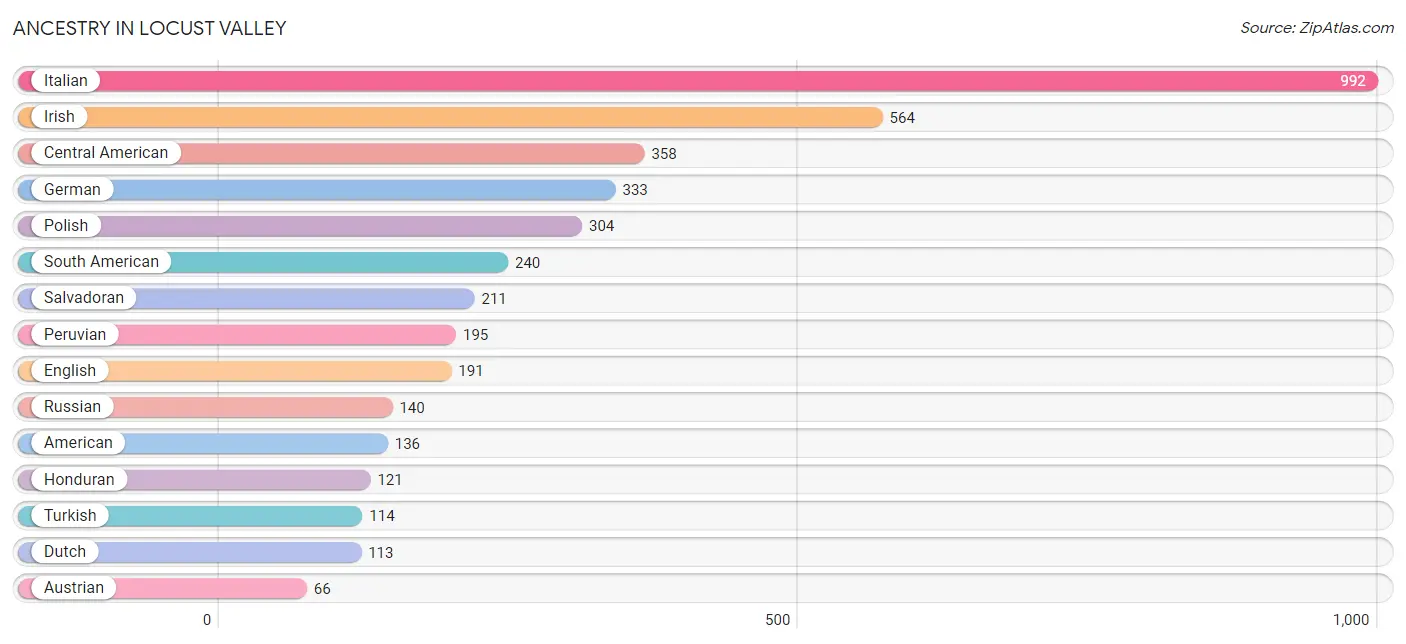
| Ancestry | # Population | % Population |
| American | 136 | 3.8% |
| Arab | 19 | 0.5% |
| Argentinean | 29 | 0.8% |
| Austrian | 66 | 1.8% |
| British | 29 | 0.8% |
| Central American | 358 | 9.9% |
| Chilean | 16 | 0.4% |
| Cypriot | 7 | 0.2% |
| Danish | 23 | 0.6% |
| Dutch | 113 | 3.1% |
| Eastern European | 21 | 0.6% |
| Egyptian | 19 | 0.5% |
| English | 191 | 5.3% |
| European | 34 | 0.9% |
| Finnish | 44 | 1.2% |
| French | 46 | 1.3% |
| German | 333 | 9.2% |
| Greek | 29 | 0.8% |
| Guatemalan | 7 | 0.2% |
| Honduran | 121 | 3.4% |
| Hungarian | 11 | 0.3% |
| Indian (Asian) | 11 | 0.3% |
| Irish | 564 | 15.6% |
| Italian | 992 | 27.5% |
| Lithuanian | 31 | 0.9% |
| Nicaraguan | 19 | 0.5% |
| Norwegian | 37 | 1.0% |
| Pakistani | 9 | 0.3% |
| Peruvian | 195 | 5.4% |
| Polish | 304 | 8.4% |
| Portuguese | 62 | 1.7% |
| Puerto Rican | 22 | 0.6% |
| Romanian | 15 | 0.4% |
| Russian | 140 | 3.9% |
| Salvadoran | 211 | 5.8% |
| Scandinavian | 21 | 0.6% |
| Scotch-Irish | 16 | 0.4% |
| Slavic | 13 | 0.4% |
| Slovene | 8 | 0.2% |
| South American | 240 | 6.7% |
| South American Indian | 29 | 0.8% |
| Spaniard | 16 | 0.4% |
| Spanish | 15 | 0.4% |
| Swedish | 13 | 0.4% |
| Turkish | 114 | 3.2% |
| Ukrainian | 9 | 0.3% |
| Welsh | 16 | 0.4% | View All 47 Rows |
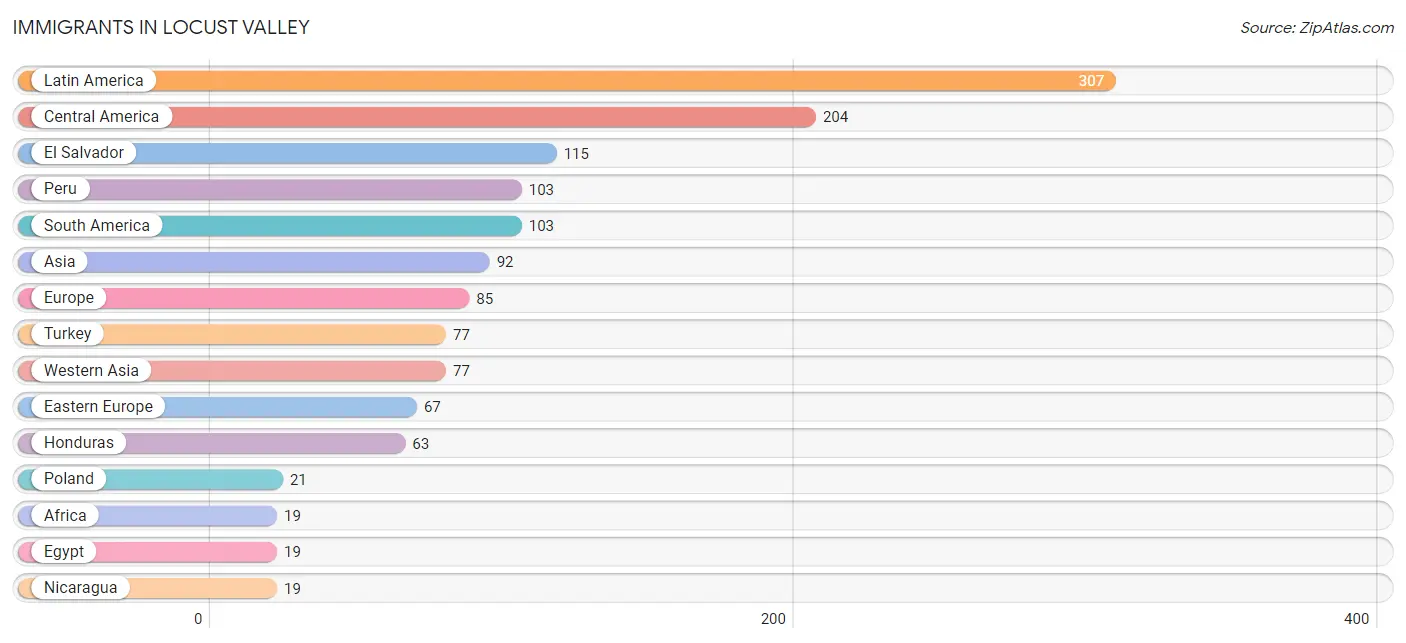
Immigrants in Locust Valley
The most numerous immigrant groups reported in Locust Valley came from Latin America (307 | 8.5%), Central America (204 | 5.7%), El Salvador (115 | 3.2%), Peru (103 | 2.9%), and South America (103 | 2.9%), together accounting for 23.0% of all Locust Valley residents.
| Immigration Origin | # Population | % Population |
| Africa | 19 | 0.5% |
| Asia | 92 | 2.5% |
| Central America | 204 | 5.7% |
| China | 6 | 0.2% |
| Eastern Asia | 6 | 0.2% |
| Eastern Europe | 67 | 1.9% |
| Egypt | 19 | 0.5% |
| El Salvador | 115 | 3.2% |
| Europe | 85 | 2.4% |
| Guatemala | 7 | 0.2% |
| Honduras | 63 | 1.7% |
| Latin America | 307 | 8.5% |
| Nicaragua | 19 | 0.5% |
| Northern Africa | 19 | 0.5% |
| Northern Europe | 6 | 0.2% |
| Peru | 103 | 2.9% |
| Poland | 21 | 0.6% |
| Portugal | 12 | 0.3% |
| Russia | 18 | 0.5% |
| South America | 103 | 2.9% |
| South Eastern Asia | 9 | 0.3% |
| Southern Europe | 12 | 0.3% |
| Taiwan | 6 | 0.2% |
| Thailand | 9 | 0.3% |
| Turkey | 77 | 2.1% |
| Ukraine | 9 | 0.3% |
| Western Asia | 77 | 2.1% | View All 27 Rows |
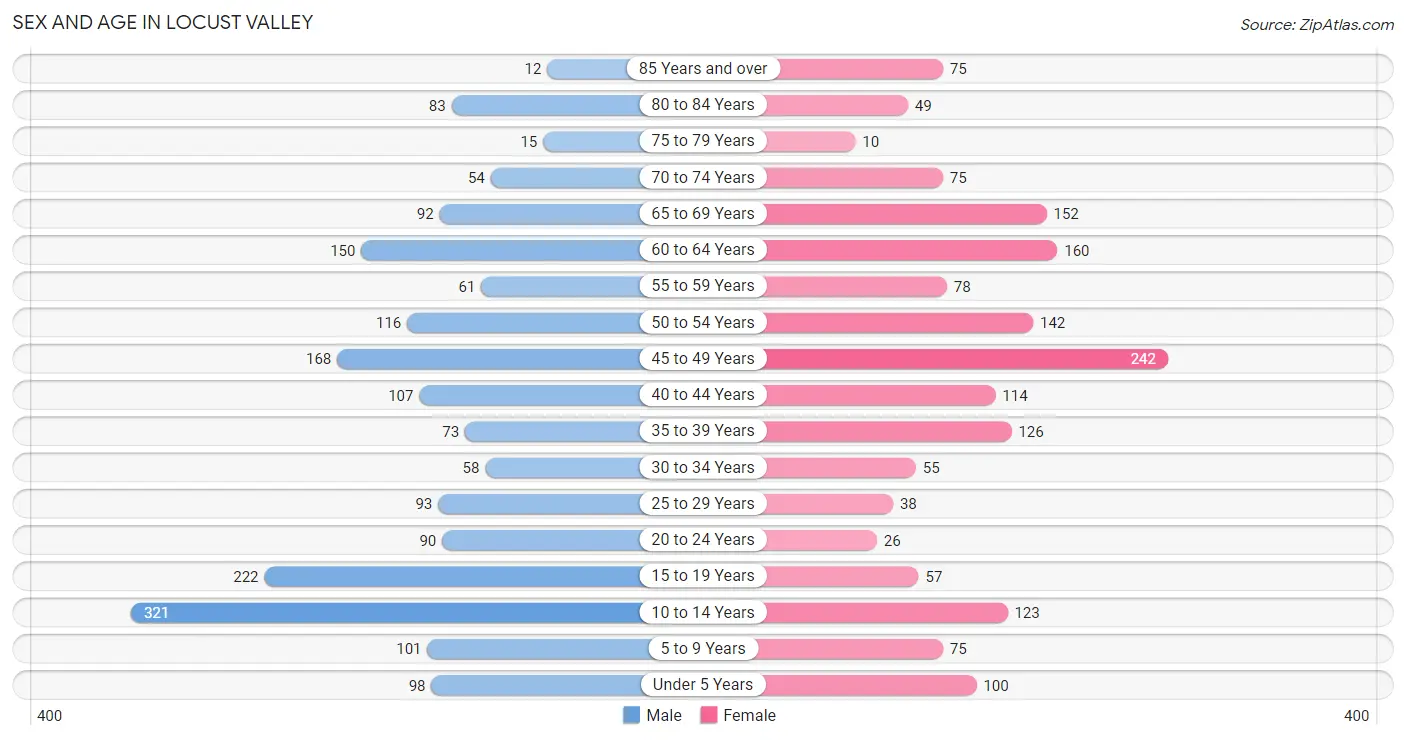
Sex and Age in Locust Valley
Sex and Age in Locust Valley
The most populous age groups in Locust Valley are 10 to 14 Years (321 | 16.8%) for men and 45 to 49 Years (242 | 14.3%) for women.
| Age Bracket | Male | Female |
| Under 5 Years | 98 (5.1%) | 100 (5.9%) |
| 5 to 9 Years | 101 (5.3%) | 75 (4.4%) |
| 10 to 14 Years | 321 (16.8%) | 123 (7.2%) |
| 15 to 19 Years | 222 (11.6%) | 57 (3.4%) |
| 20 to 24 Years | 90 (4.7%) | 26 (1.5%) |
| 25 to 29 Years | 93 (4.9%) | 38 (2.2%) |
| 30 to 34 Years | 58 (3.0%) | 55 (3.2%) |
| 35 to 39 Years | 73 (3.8%) | 126 (7.4%) |
| 40 to 44 Years | 107 (5.6%) | 114 (6.7%) |
| 45 to 49 Years | 168 (8.8%) | 242 (14.3%) |
| 50 to 54 Years | 116 (6.1%) | 142 (8.4%) |
| 55 to 59 Years | 61 (3.2%) | 78 (4.6%) |
| 60 to 64 Years | 150 (7.8%) | 160 (9.4%) |
| 65 to 69 Years | 92 (4.8%) | 152 (9.0%) |
| 70 to 74 Years | 54 (2.8%) | 75 (4.4%) |
| 75 to 79 Years | 15 (0.8%) | 10 (0.6%) |
| 80 to 84 Years | 83 (4.3%) | 49 (2.9%) |
| 85 Years and over | 12 (0.6%) | 75 (4.4%) |
| Total | 1,914 (100.0%) | 1,697 (100.0%) |
Families and Households in Locust Valley
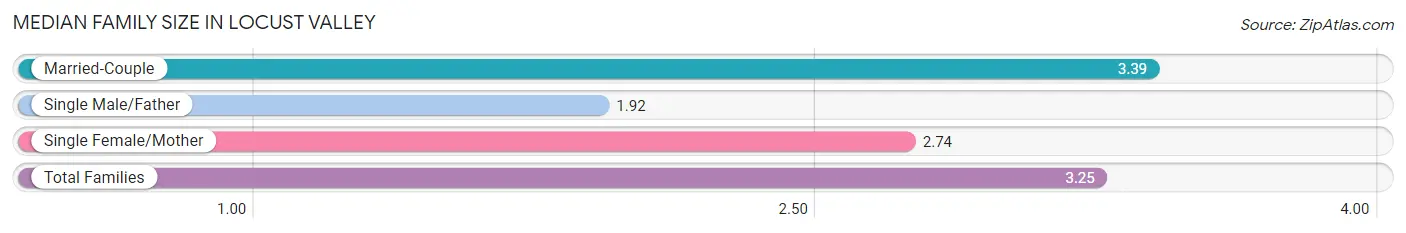
Median Family Size in Locust Valley
The median family size in Locust Valley is 3.25 persons per family, with married-couple families (839 | 82.6%) accounting for the largest median family size of 3.39 persons per family. On the other hand, single male/father families (37 | 3.6%) represent the smallest median family size with 1.92 persons per family.
| Family Type | # Families | Family Size |
| Married-Couple | 839 (82.6%) | 3.39 |
| Single Male/Father | 37 (3.6%) | 1.92 |
| Single Female/Mother | 140 (13.8%) | 2.74 |
| Total Families | 1,016 (100.0%) | 3.25 |
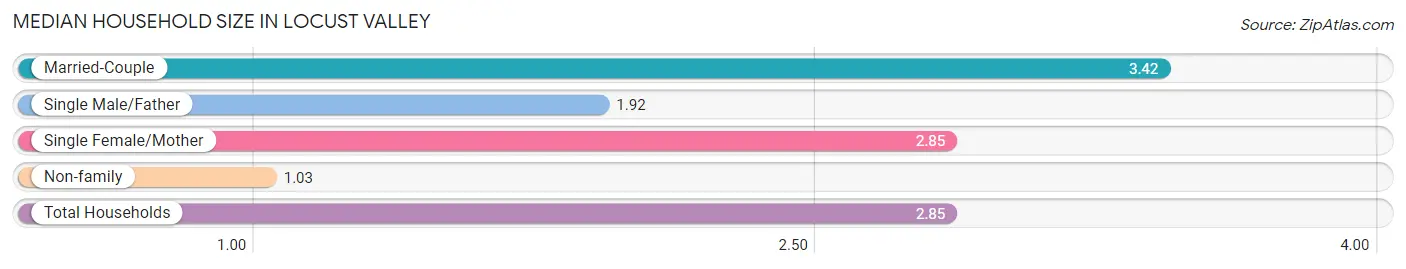
Median Household Size in Locust Valley
The median household size in Locust Valley is 2.85 persons per household, with married-couple households (839 | 66.7%) accounting for the largest median household size of 3.42 persons per household. non-family households (242 | 19.2%) represent the smallest median household size with 1.03 persons per household.
| Household Type | # Households | Household Size |
| Married-Couple | 839 (66.7%) | 3.42 |
| Single Male/Father | 37 (2.9%) | 1.92 |
| Single Female/Mother | 140 (11.1%) | 2.85 |
| Non-family | 242 (19.2%) | 1.03 |
| Total Households | 1,258 (100.0%) | 2.85 |
Household Size by Marriage Status in Locust Valley
Out of a total of 1,258 households in Locust Valley, 1,016 (80.8%) are family households, while 242 (19.2%) are nonfamily households. The most numerous type of family households are 2-person households, comprising 440, and the most common type of nonfamily households are 1-person households, comprising 235.
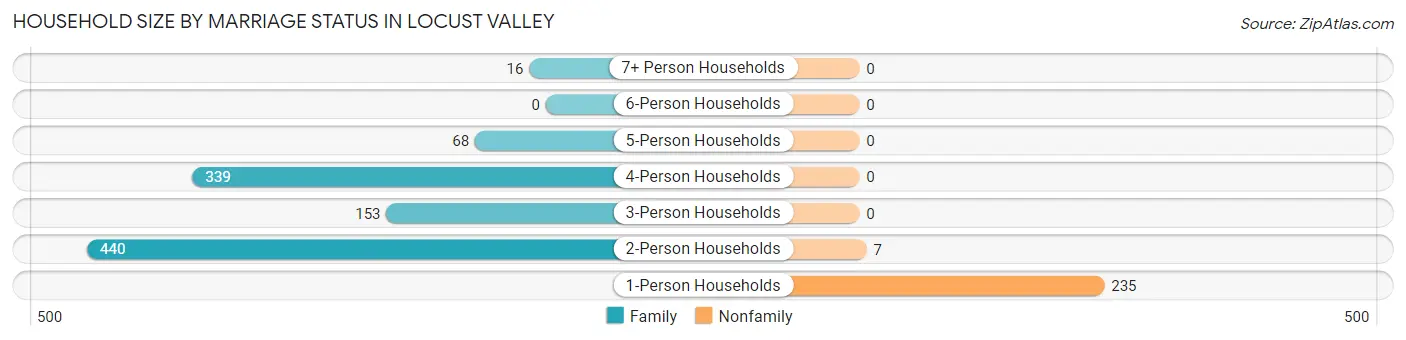
| Household Size | Family Households | Nonfamily Households |
| 1-Person Households | - | 235 (18.7%) |
| 2-Person Households | 440 (35.0%) | 7 (0.6%) |
| 3-Person Households | 153 (12.2%) | 0 (0.0%) |
| 4-Person Households | 339 (27.0%) | 0 (0.0%) |
| 5-Person Households | 68 (5.4%) | 0 (0.0%) |
| 6-Person Households | 0 (0.0%) | 0 (0.0%) |
| 7+ Person Households | 16 (1.3%) | 0 (0.0%) |
| Total | 1,016 (80.8%) | 242 (19.2%) |
Female Fertility in Locust Valley
Fertility by Age in Locust Valley
Average fertility rate in Locust Valley is 43.0 births per 1,000 women. Women in the age bracket of 20 to 34 years have the highest fertility rate with 126.0 births per 1,000 women. Women in the age bracket of 35 to 50 years acount for 51.6% of all women with births.
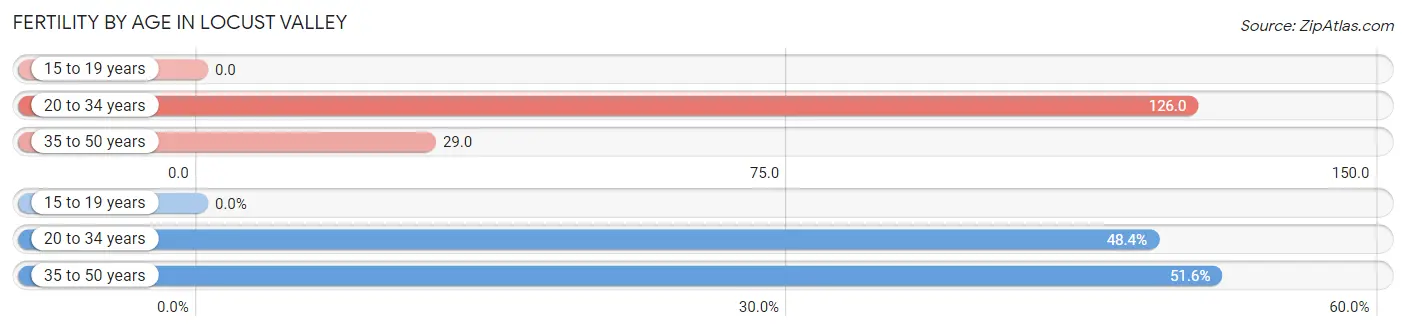
| Age Bracket | Women with Births | Births / 1,000 Women |
| 15 to 19 years | 0 (0.0%) | 0.0 |
| 20 to 34 years | 15 (48.4%) | 126.0 |
| 35 to 50 years | 16 (51.6%) | 29.0 |
| Total | 31 (100.0%) | 43.0 |
Fertility by Age by Marriage Status in Locust Valley
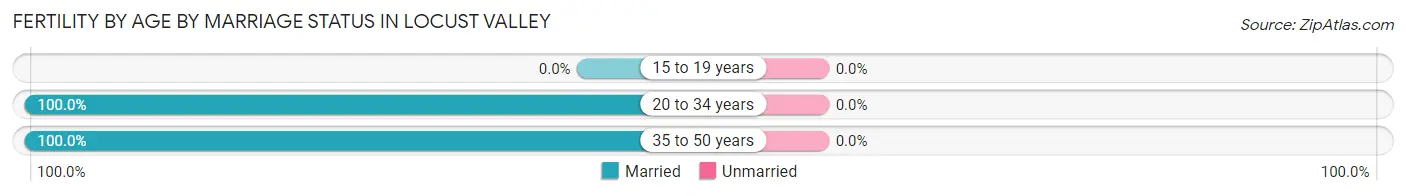
| Age Bracket | Married | Unmarried |
| 15 to 19 years | 0 (0.0%) | 0 (0.0%) |
| 20 to 34 years | 15 (100.0%) | 0 (0.0%) |
| 35 to 50 years | 16 (100.0%) | 0 (0.0%) |
| Total | 31 (100.0%) | 0 (0.0%) |
Fertility by Education in Locust Valley
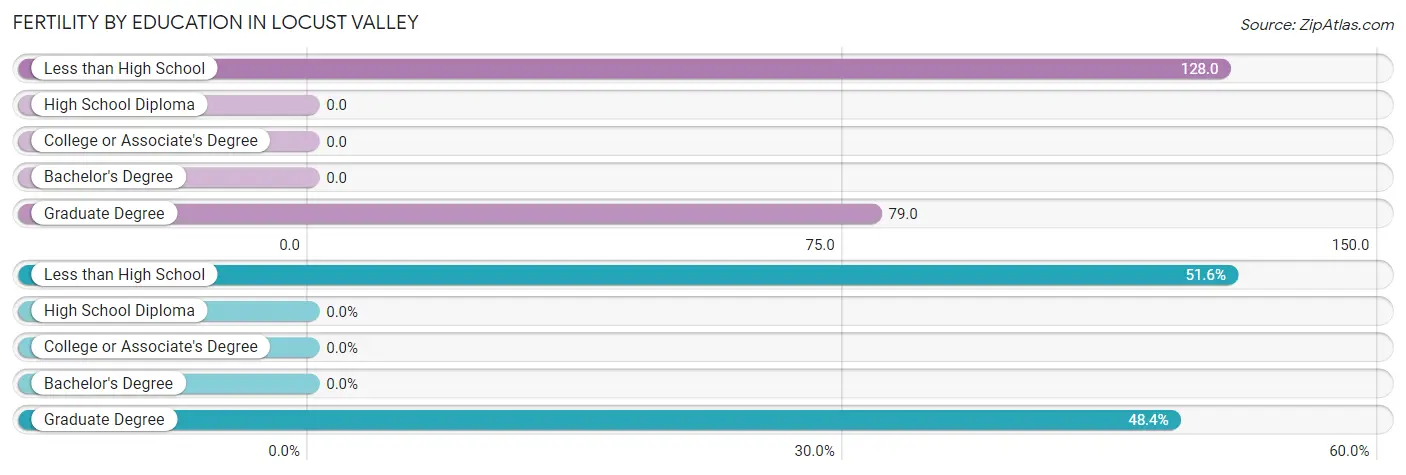
| Educational Attainment | Women with Births | Births / 1,000 Women |
| Less than High School | 16 (51.6%) | 128.0 |
| High School Diploma | 0 (0.0%) | 0.0 |
| College or Associate's Degree | 0 (0.0%) | 0.0 |
| Bachelor's Degree | 0 (0.0%) | 0.0 |
| Graduate Degree | 15 (48.4%) | 79.0 |
| Total | 31 (100.0%) | 43.0 |
Fertility by Education by Marriage Status in Locust Valley
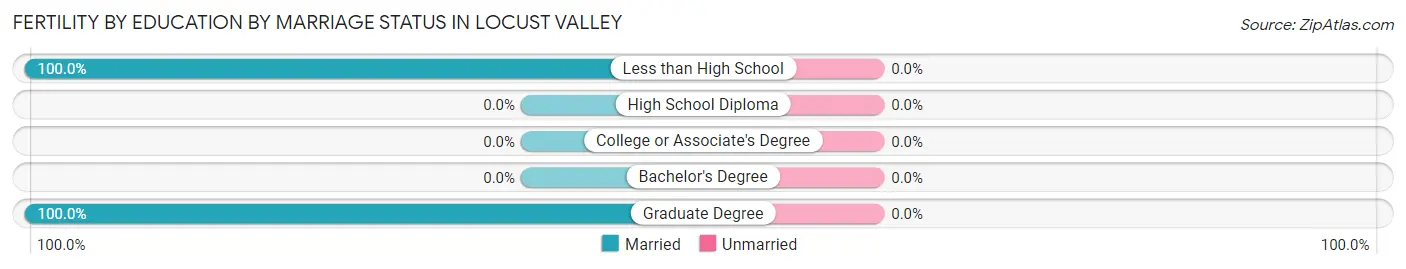
| Educational Attainment | Married | Unmarried |
| Less than High School | 16 (100.0%) | 0 (0.0%) |
| High School Diploma | 0 (0.0%) | 0 (0.0%) |
| College or Associate's Degree | 0 (0.0%) | 0 (0.0%) |
| Bachelor's Degree | 0 (0.0%) | 0 (0.0%) |
| Graduate Degree | 15 (100.0%) | 0 (0.0%) |
| Total | 31 (100.0%) | 0 (0.0%) |
Employment Characteristics in Locust Valley
Employment by Class of Employer in Locust Valley
Among the 1,621 employed individuals in Locust Valley, private company employees (1,038 | 64.0%), not-for-profit organizations (153 | 9.4%), and self-employed (incorporated) (112 | 6.9%) make up the most common classes of employment.
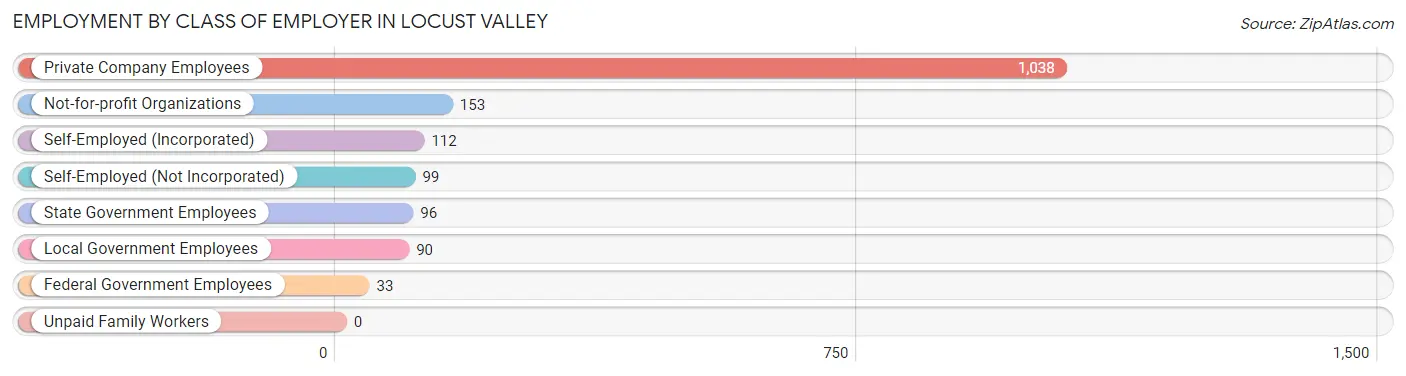
| Employer Class | # Employees | % Employees |
| Private Company Employees | 1,038 | 64.0% |
| Self-Employed (Incorporated) | 112 | 6.9% |
| Self-Employed (Not Incorporated) | 99 | 6.1% |
| Not-for-profit Organizations | 153 | 9.4% |
| Local Government Employees | 90 | 5.6% |
| State Government Employees | 96 | 5.9% |
| Federal Government Employees | 33 | 2.0% |
| Unpaid Family Workers | 0 | 0.0% |
| Total | 1,621 | 100.0% |
Employment Status by Age in Locust Valley
According to the labor force statistics for Locust Valley, out of the total population over 16 years of age (2,644), 65.3% or 1,727 individuals are in the labor force, with 3.2% or 55 of them unemployed. The age group with the highest labor force participation rate is 20 to 24 years, with 100.0% or 116 individuals in the labor force. Within the labor force, the 55 to 59 years age range has the highest percentage of unemployed individuals, with 19.9% or 27 of them being unemployed.
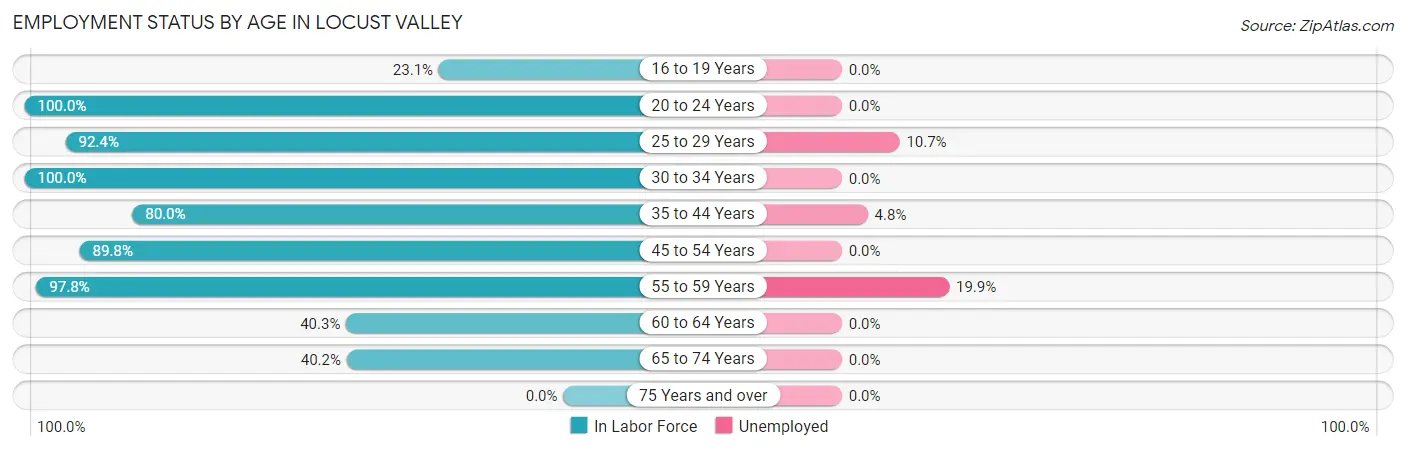
| Age Bracket | In Labor Force | Unemployed |
| 16 to 19 Years | 30 (23.1%) | 0 (0.0%) |
| 20 to 24 Years | 116 (100.0%) | 0 (0.0%) |
| 25 to 29 Years | 121 (92.4%) | 13 (10.7%) |
| 30 to 34 Years | 113 (100.0%) | 0 (0.0%) |
| 35 to 44 Years | 336 (80.0%) | 16 (4.8%) |
| 45 to 54 Years | 600 (89.8%) | 0 (0.0%) |
| 55 to 59 Years | 136 (97.8%) | 27 (19.9%) |
| 60 to 64 Years | 125 (40.3%) | 0 (0.0%) |
| 65 to 74 Years | 150 (40.2%) | 0 (0.0%) |
| 75 Years and over | 0 (0.0%) | 0 (0.0%) |
| Total | 1,727 (65.3%) | 55 (3.2%) |
Employment Status by Educational Attainment in Locust Valley
According to labor force statistics for Locust Valley, 80.3% of individuals (1,430) out of the total population between 25 and 64 years of age (1,781) are in the labor force, with 3.9% or 56 of them being unemployed. The group with the highest labor force participation rate are those with the educational attainment of bachelor's degree or higher, with 85.8% or 871 individuals in the labor force. Within the labor force, individuals with high school diploma education have the highest percentage of unemployment, with 29.7% or 27 of them being unemployed.
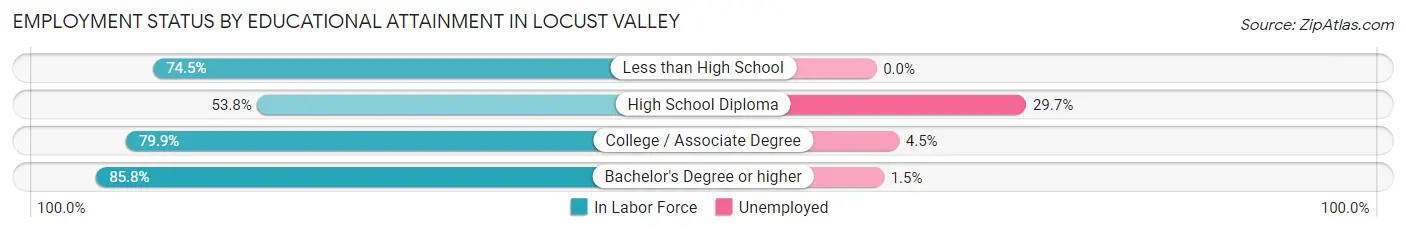
| Educational Attainment | In Labor Force | Unemployed |
| Less than High School | 111 (74.5%) | 0 (0.0%) |
| High School Diploma | 91 (53.8%) | 50 (29.7%) |
| College / Associate Degree | 358 (79.9%) | 20 (4.5%) |
| Bachelor's Degree or higher | 871 (85.8%) | 15 (1.5%) |
| Total | 1,430 (80.3%) | 69 (3.9%) |
Employment Occupations by Sex in Locust Valley
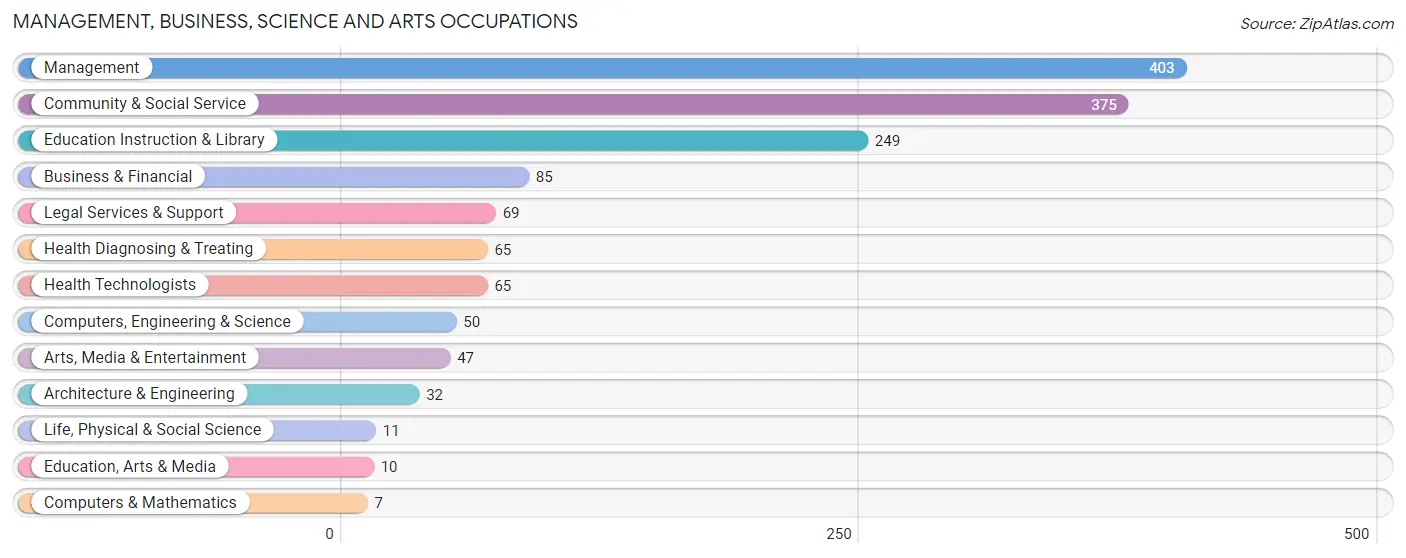
Management, Business, Science and Arts Occupations
The most common Management, Business, Science and Arts occupations in Locust Valley are Management (403 | 24.1%), Community & Social Service (375 | 22.4%), Education Instruction & Library (249 | 14.9%), Business & Financial (85 | 5.1%), and Legal Services & Support (69 | 4.1%).
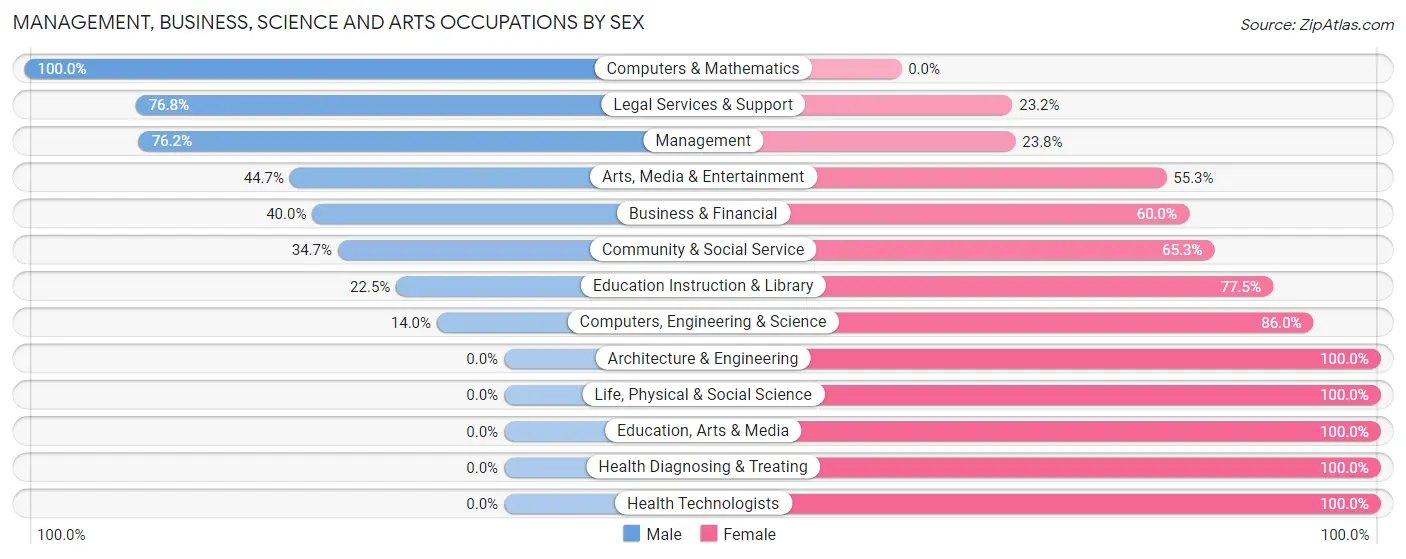
Management, Business, Science and Arts Occupations by Sex
Within the Management, Business, Science and Arts occupations in Locust Valley, the most male-oriented occupations are Computers & Mathematics (100.0%), Legal Services & Support (76.8%), and Management (76.2%), while the most female-oriented occupations are Architecture & Engineering (100.0%), Life, Physical & Social Science (100.0%), and Education, Arts & Media (100.0%).
| Occupation | Male | Female |
| Management | 307 (76.2%) | 96 (23.8%) |
| Business & Financial | 34 (40.0%) | 51 (60.0%) |
| Computers, Engineering & Science | 7 (14.0%) | 43 (86.0%) |
| Computers & Mathematics | 7 (100.0%) | 0 (0.0%) |
| Architecture & Engineering | 0 (0.0%) | 32 (100.0%) |
| Life, Physical & Social Science | 0 (0.0%) | 11 (100.0%) |
| Community & Social Service | 130 (34.7%) | 245 (65.3%) |
| Education, Arts & Media | 0 (0.0%) | 10 (100.0%) |
| Legal Services & Support | 53 (76.8%) | 16 (23.2%) |
| Education Instruction & Library | 56 (22.5%) | 193 (77.5%) |
| Arts, Media & Entertainment | 21 (44.7%) | 26 (55.3%) |
| Health Diagnosing & Treating | 0 (0.0%) | 65 (100.0%) |
| Health Technologists | 0 (0.0%) | 65 (100.0%) |
| Total (Category) | 478 (48.9%) | 500 (51.1%) |
| Total (Overall) | 902 (54.0%) | 769 (46.0%) |
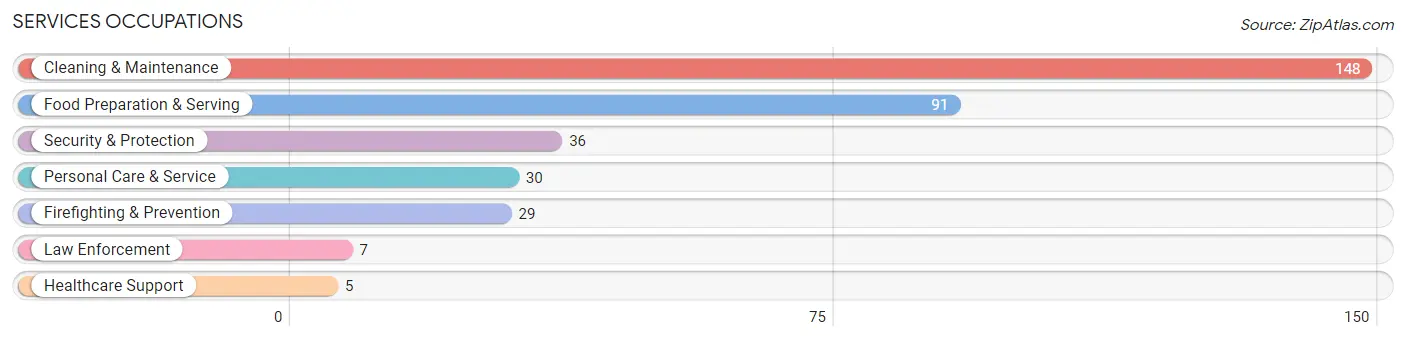
Services Occupations
The most common Services occupations in Locust Valley are Cleaning & Maintenance (148 | 8.9%), Food Preparation & Serving (91 | 5.4%), Security & Protection (36 | 2.1%), Personal Care & Service (30 | 1.8%), and Firefighting & Prevention (29 | 1.7%).
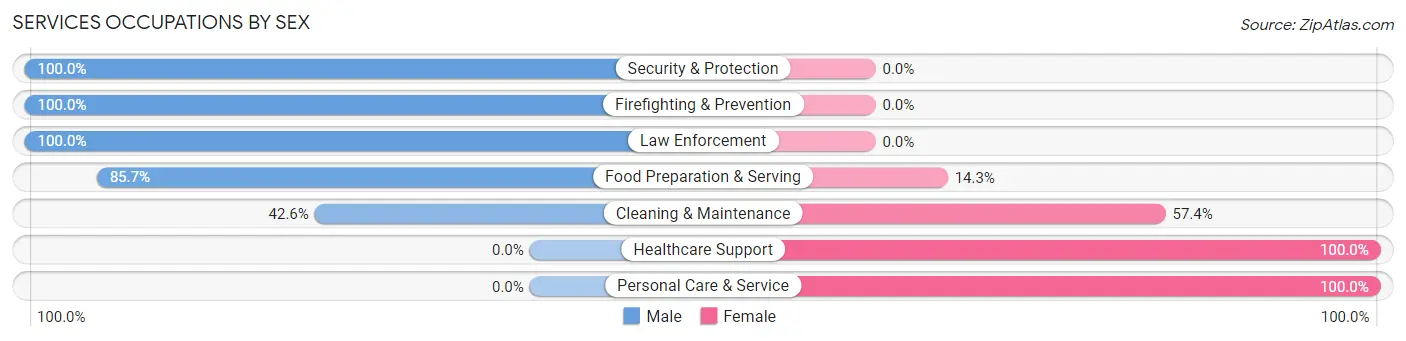
Services Occupations by Sex
Within the Services occupations in Locust Valley, the most male-oriented occupations are Security & Protection (100.0%), Firefighting & Prevention (100.0%), and Law Enforcement (100.0%), while the most female-oriented occupations are Healthcare Support (100.0%), Personal Care & Service (100.0%), and Cleaning & Maintenance (57.4%).
| Occupation | Male | Female |
| Healthcare Support | 0 (0.0%) | 5 (100.0%) |
| Security & Protection | 36 (100.0%) | 0 (0.0%) |
| Firefighting & Prevention | 29 (100.0%) | 0 (0.0%) |
| Law Enforcement | 7 (100.0%) | 0 (0.0%) |
| Food Preparation & Serving | 78 (85.7%) | 13 (14.3%) |
| Cleaning & Maintenance | 63 (42.6%) | 85 (57.4%) |
| Personal Care & Service | 0 (0.0%) | 30 (100.0%) |
| Total (Category) | 177 (57.1%) | 133 (42.9%) |
| Total (Overall) | 902 (54.0%) | 769 (46.0%) |
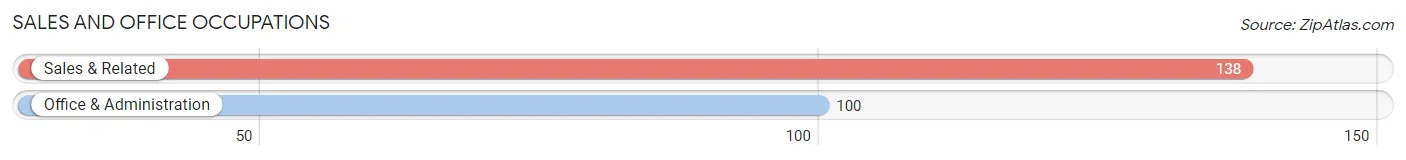
Sales and Office Occupations
The most common Sales and Office occupations in Locust Valley are Sales & Related (138 | 8.3%), and Office & Administration (100 | 6.0%).
Sales and Office Occupations by Sex
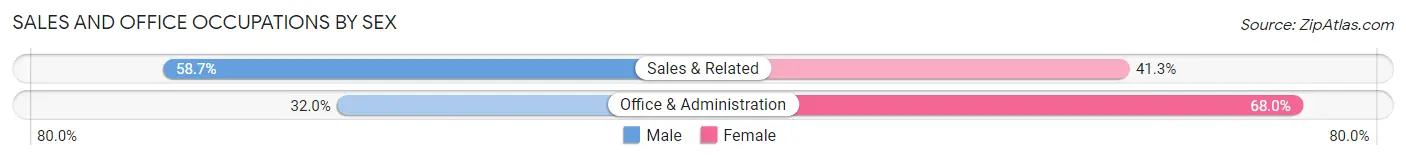
| Occupation | Male | Female |
| Sales & Related | 81 (58.7%) | 57 (41.3%) |
| Office & Administration | 32 (32.0%) | 68 (68.0%) |
| Total (Category) | 113 (47.5%) | 125 (52.5%) |
| Total (Overall) | 902 (54.0%) | 769 (46.0%) |
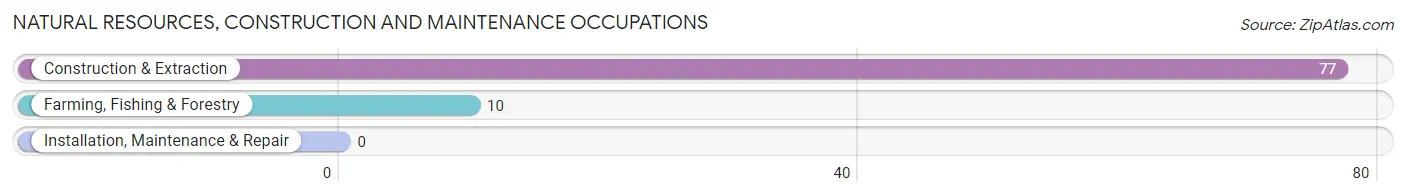
Natural Resources, Construction and Maintenance Occupations
The most common Natural Resources, Construction and Maintenance occupations in Locust Valley are Construction & Extraction (77 | 4.6%), and Farming, Fishing & Forestry (10 | 0.6%).
Natural Resources, Construction and Maintenance Occupations by Sex
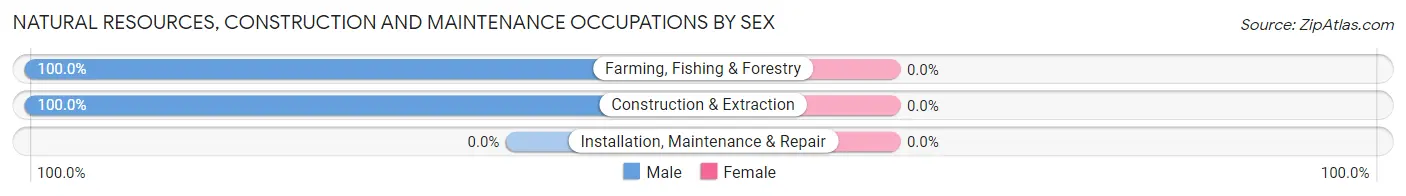
| Occupation | Male | Female |
| Farming, Fishing & Forestry | 10 (100.0%) | 0 (0.0%) |
| Construction & Extraction | 77 (100.0%) | 0 (0.0%) |
| Installation, Maintenance & Repair | 0 (0.0%) | 0 (0.0%) |
| Total (Category) | 87 (100.0%) | 0 (0.0%) |
| Total (Overall) | 902 (54.0%) | 769 (46.0%) |
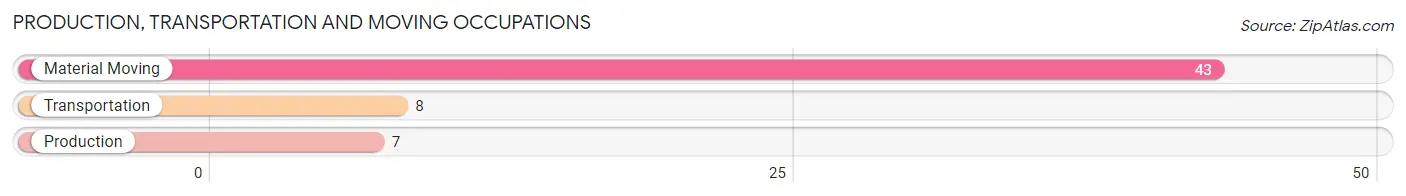
Production, Transportation and Moving Occupations
The most common Production, Transportation and Moving occupations in Locust Valley are Material Moving (43 | 2.6%), Transportation (8 | 0.5%), and Production (7 | 0.4%).
Production, Transportation and Moving Occupations by Sex
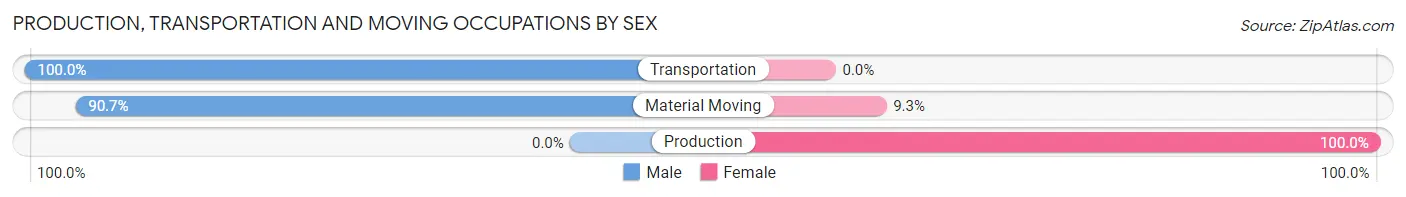
| Occupation | Male | Female |
| Production | 0 (0.0%) | 7 (100.0%) |
| Transportation | 8 (100.0%) | 0 (0.0%) |
| Material Moving | 39 (90.7%) | 4 (9.3%) |
| Total (Category) | 47 (81.0%) | 11 (19.0%) |
| Total (Overall) | 902 (54.0%) | 769 (46.0%) |
Employment Industries by Sex in Locust Valley
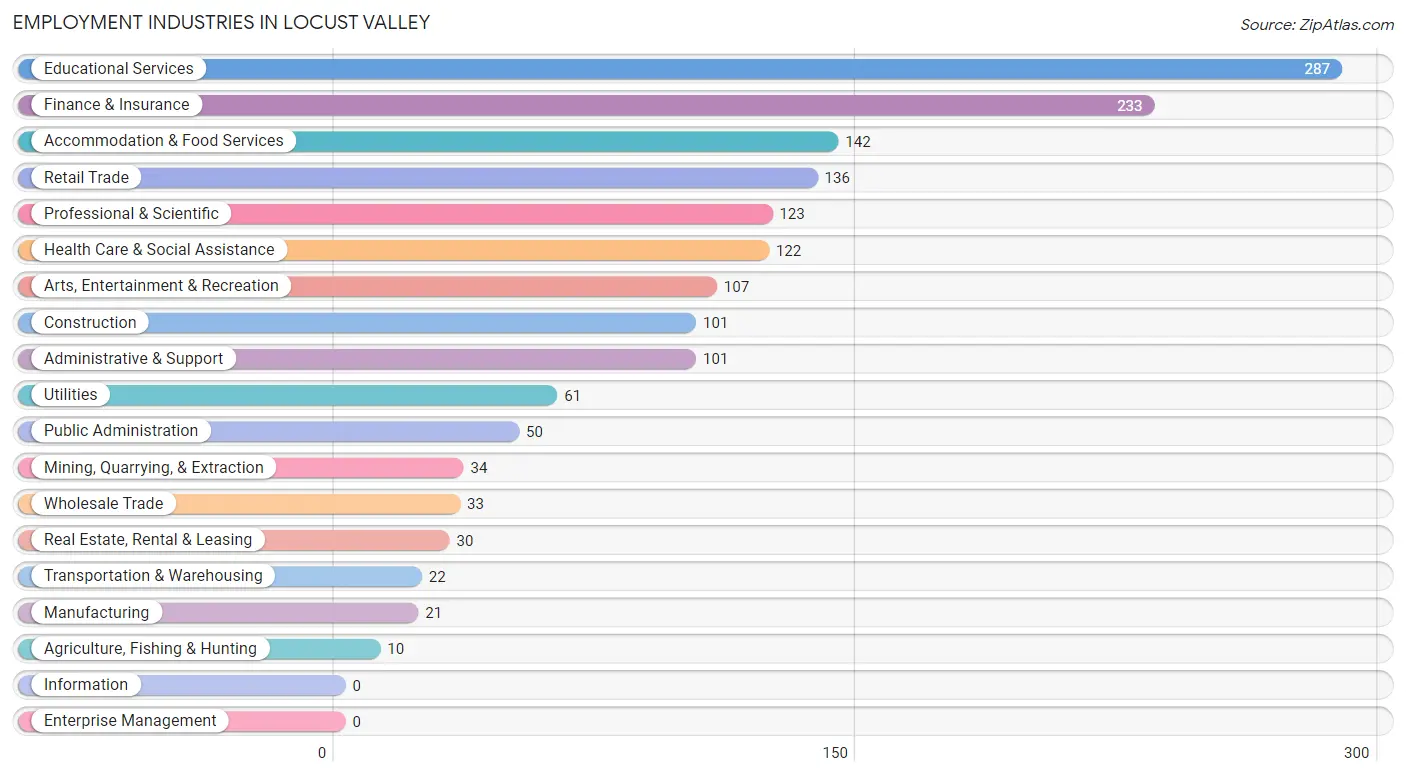
Employment Industries in Locust Valley
The major employment industries in Locust Valley include Educational Services (287 | 17.2%), Finance & Insurance (233 | 13.9%), Accommodation & Food Services (142 | 8.5%), Retail Trade (136 | 8.1%), and Professional & Scientific (123 | 7.4%).
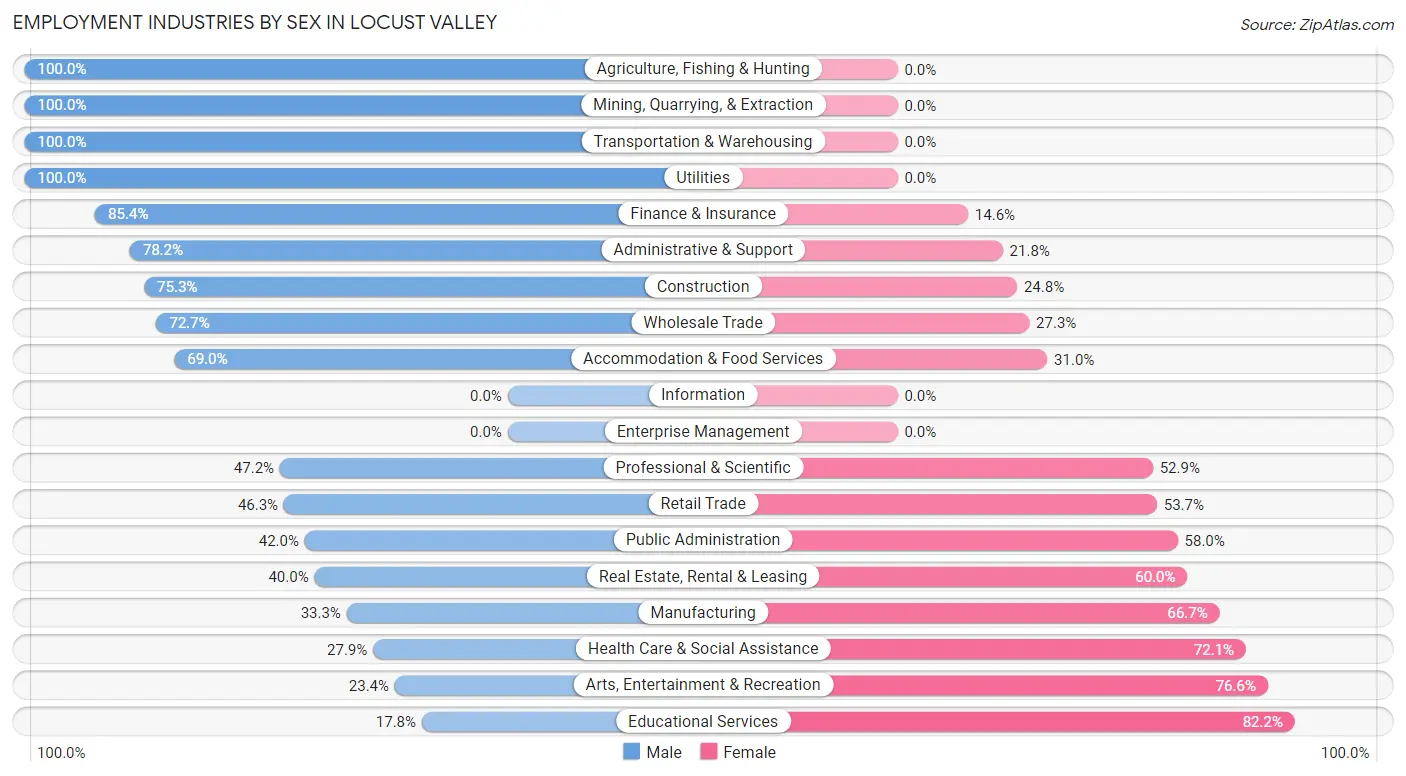
Employment Industries by Sex in Locust Valley
The Locust Valley industries that see more men than women are Agriculture, Fishing & Hunting (100.0%), Mining, Quarrying, & Extraction (100.0%), and Transportation & Warehousing (100.0%), whereas the industries that tend to have a higher number of women are Educational Services (82.2%), Arts, Entertainment & Recreation (76.6%), and Health Care & Social Assistance (72.1%).
| Industry | Male | Female |
| Agriculture, Fishing & Hunting | 10 (100.0%) | 0 (0.0%) |
| Mining, Quarrying, & Extraction | 34 (100.0%) | 0 (0.0%) |
| Construction | 76 (75.2%) | 25 (24.7%) |
| Manufacturing | 7 (33.3%) | 14 (66.7%) |
| Wholesale Trade | 24 (72.7%) | 9 (27.3%) |
| Retail Trade | 63 (46.3%) | 73 (53.7%) |
| Transportation & Warehousing | 22 (100.0%) | 0 (0.0%) |
| Utilities | 61 (100.0%) | 0 (0.0%) |
| Information | 0 (0.0%) | 0 (0.0%) |
| Finance & Insurance | 199 (85.4%) | 34 (14.6%) |
| Real Estate, Rental & Leasing | 12 (40.0%) | 18 (60.0%) |
| Professional & Scientific | 58 (47.1%) | 65 (52.8%) |
| Enterprise Management | 0 (0.0%) | 0 (0.0%) |
| Administrative & Support | 79 (78.2%) | 22 (21.8%) |
| Educational Services | 51 (17.8%) | 236 (82.2%) |
| Health Care & Social Assistance | 34 (27.9%) | 88 (72.1%) |
| Arts, Entertainment & Recreation | 25 (23.4%) | 82 (76.6%) |
| Accommodation & Food Services | 98 (69.0%) | 44 (31.0%) |
| Public Administration | 21 (42.0%) | 29 (58.0%) |
| Total | 902 (54.0%) | 769 (46.0%) |
Education in Locust Valley
School Enrollment in Locust Valley
The most common levels of schooling among the 1,005 students in Locust Valley are middle school (408 | 40.6%), high school (230 | 22.9%), and elementary school (140 | 13.9%).
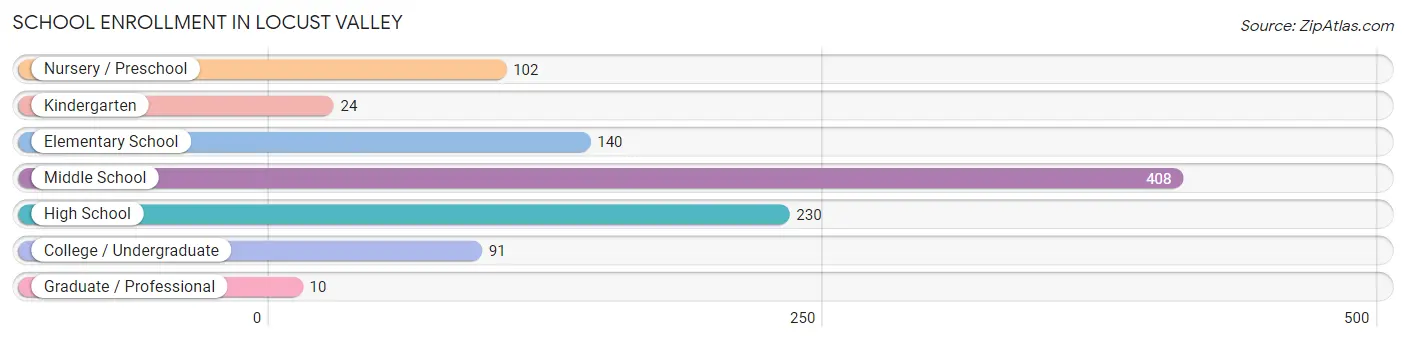
| School Level | # Students | % Students |
| Nursery / Preschool | 102 | 10.2% |
| Kindergarten | 24 | 2.4% |
| Elementary School | 140 | 13.9% |
| Middle School | 408 | 40.6% |
| High School | 230 | 22.9% |
| College / Undergraduate | 91 | 9.0% |
| Graduate / Professional | 10 | 1.0% |
| Total | 1,005 | 100.0% |
School Enrollment by Age by Funding Source in Locust Valley
Out of a total of 1,005 students who are enrolled in schools in Locust Valley, 285 (28.4%) attend a private institution, while the remaining 720 (71.6%) are enrolled in public schools. The age group of 20 to 24 year olds has the highest likelihood of being enrolled in private schools, with 23 (100.0% in the age bracket) enrolled. Conversely, the age group of 5 to 9 year old has the lowest likelihood of being enrolled in a private school, with 148 (90.2% in the age bracket) attending a public institution.
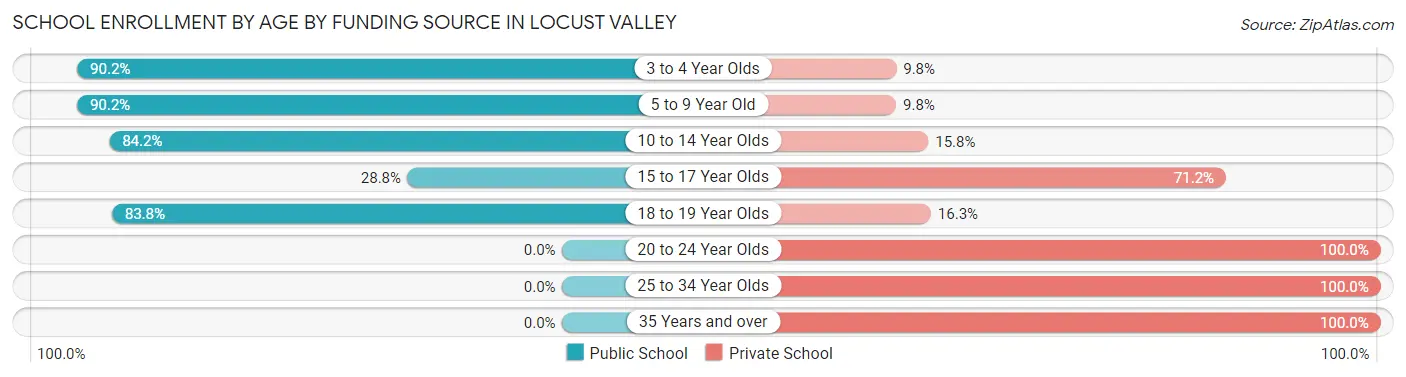
| Age Bracket | Public School | Private School |
| 3 to 4 Year Olds | 92 (90.2%) | 10 (9.8%) |
| 5 to 9 Year Old | 148 (90.2%) | 16 (9.8%) |
| 10 to 14 Year Olds | 358 (84.2%) | 67 (15.8%) |
| 15 to 17 Year Olds | 55 (28.8%) | 136 (71.2%) |
| 18 to 19 Year Olds | 67 (83.8%) | 13 (16.3%) |
| 20 to 24 Year Olds | 0 (0.0%) | 23 (100.0%) |
| 25 to 34 Year Olds | 0 (0.0%) | 10 (100.0%) |
| 35 Years and over | 0 (0.0%) | 10 (100.0%) |
| Total | 720 (71.6%) | 285 (28.4%) |
Educational Attainment by Field of Study in Locust Valley
Business (419 | 31.4%), education (194 | 14.5%), social sciences (103 | 7.7%), psychology (100 | 7.5%), and communications (93 | 7.0%) are the most common fields of study among 1,335 individuals in Locust Valley who have obtained a bachelor's degree or higher.
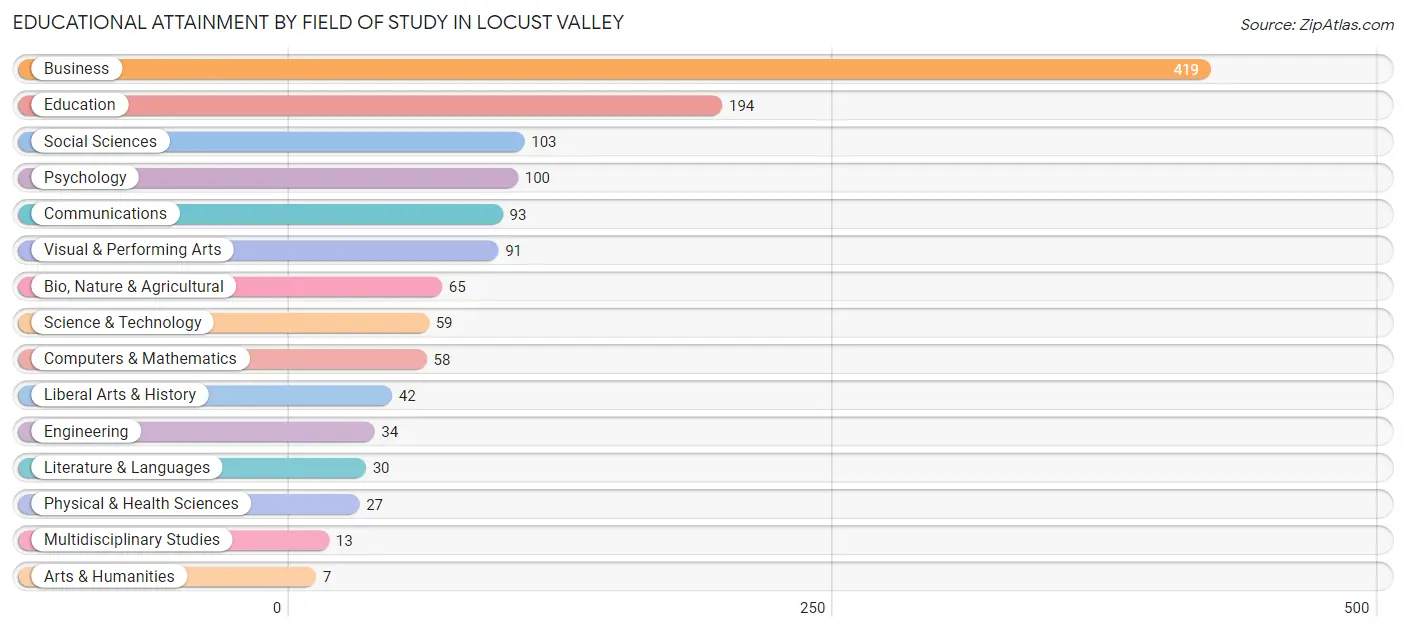
| Field of Study | # Graduates | % Graduates |
| Computers & Mathematics | 58 | 4.3% |
| Bio, Nature & Agricultural | 65 | 4.9% |
| Physical & Health Sciences | 27 | 2.0% |
| Psychology | 100 | 7.5% |
| Social Sciences | 103 | 7.7% |
| Engineering | 34 | 2.5% |
| Multidisciplinary Studies | 13 | 1.0% |
| Science & Technology | 59 | 4.4% |
| Business | 419 | 31.4% |
| Education | 194 | 14.5% |
| Literature & Languages | 30 | 2.2% |
| Liberal Arts & History | 42 | 3.2% |
| Visual & Performing Arts | 91 | 6.8% |
| Communications | 93 | 7.0% |
| Arts & Humanities | 7 | 0.5% |
| Total | 1,335 | 100.0% |
Transportation & Commute in Locust Valley
Vehicle Availability by Sex in Locust Valley
The most prevalent vehicle ownership categories in Locust Valley are males with 2 vehicles (344, accounting for 39.6%) and females with 2 vehicles (295, making up 45.9%).
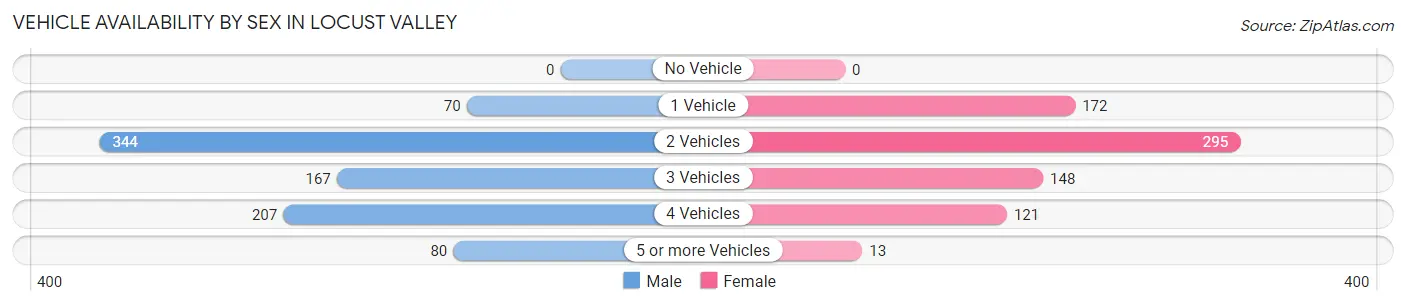
| Vehicles Available | Male | Female |
| No Vehicle | 0 (0.0%) | 0 (0.0%) |
| 1 Vehicle | 70 (8.1%) | 172 (23.0%) |
| 2 Vehicles | 344 (39.6%) | 295 (39.4%) |
| 3 Vehicles | 167 (19.2%) | 148 (19.8%) |
| 4 Vehicles | 207 (23.8%) | 121 (16.2%) |
| 5 or more Vehicles | 80 (9.2%) | 13 (1.7%) |
| Total | 868 (100.0%) | 749 (100.0%) |
Commute Time in Locust Valley
The most frequently occuring commute durations in Locust Valley are 10 to 14 minutes (191 commuters, 14.9%), 20 to 24 minutes (165 commuters, 12.9%), and 60 to 89 minutes (159 commuters, 12.4%).
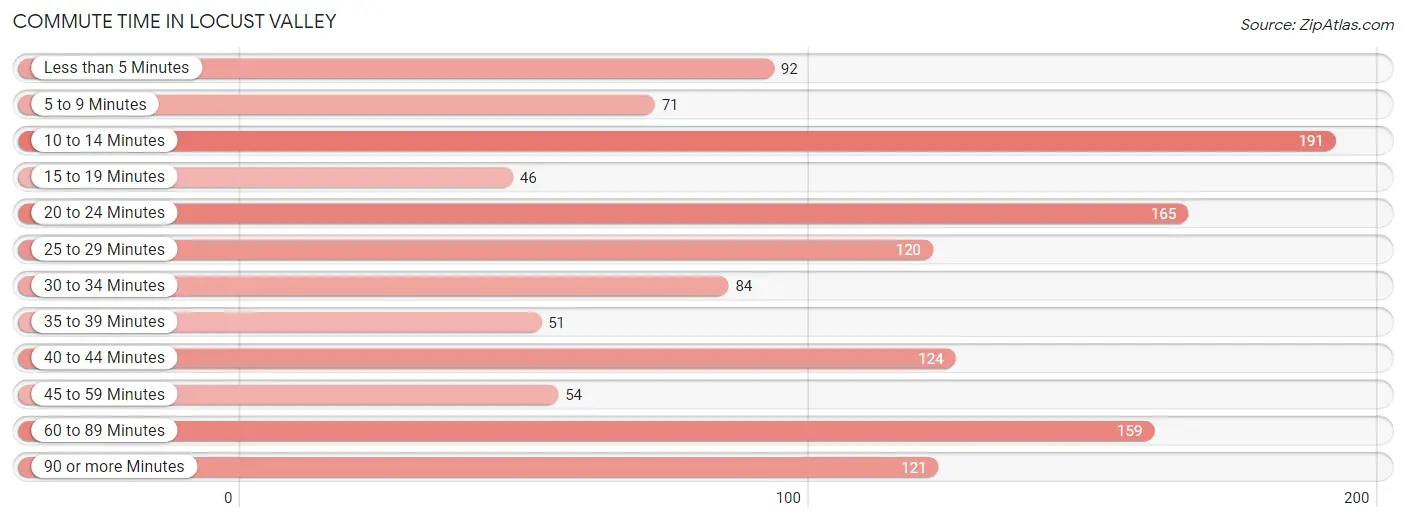
| Commute Time | # Commuters | % Commuters |
| Less than 5 Minutes | 92 | 7.2% |
| 5 to 9 Minutes | 71 | 5.6% |
| 10 to 14 Minutes | 191 | 14.9% |
| 15 to 19 Minutes | 46 | 3.6% |
| 20 to 24 Minutes | 165 | 12.9% |
| 25 to 29 Minutes | 120 | 9.4% |
| 30 to 34 Minutes | 84 | 6.6% |
| 35 to 39 Minutes | 51 | 4.0% |
| 40 to 44 Minutes | 124 | 9.7% |
| 45 to 59 Minutes | 54 | 4.2% |
| 60 to 89 Minutes | 159 | 12.4% |
| 90 or more Minutes | 121 | 9.5% |
Commute Time by Sex in Locust Valley
The most common commute times in Locust Valley are 40 to 44 minutes (105 commuters, 15.1%) for males and 20 to 24 minutes (100 commuters, 17.2%) for females.
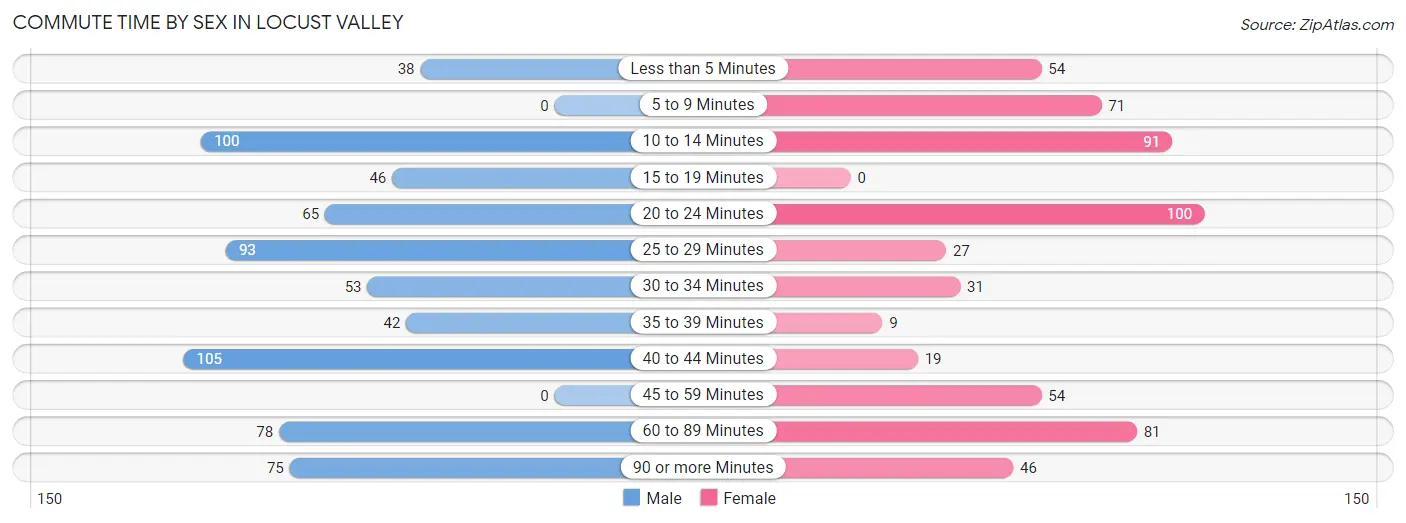
| Commute Time | Male | Female |
| Less than 5 Minutes | 38 (5.5%) | 54 (9.3%) |
| 5 to 9 Minutes | 0 (0.0%) | 71 (12.2%) |
| 10 to 14 Minutes | 100 (14.4%) | 91 (15.6%) |
| 15 to 19 Minutes | 46 (6.6%) | 0 (0.0%) |
| 20 to 24 Minutes | 65 (9.3%) | 100 (17.2%) |
| 25 to 29 Minutes | 93 (13.4%) | 27 (4.6%) |
| 30 to 34 Minutes | 53 (7.6%) | 31 (5.3%) |
| 35 to 39 Minutes | 42 (6.0%) | 9 (1.5%) |
| 40 to 44 Minutes | 105 (15.1%) | 19 (3.3%) |
| 45 to 59 Minutes | 0 (0.0%) | 54 (9.3%) |
| 60 to 89 Minutes | 78 (11.2%) | 81 (13.9%) |
| 90 or more Minutes | 75 (10.8%) | 46 (7.9%) |
Time of Departure to Work by Sex in Locust Valley
The most frequent times of departure to work in Locust Valley are 7:00 AM to 7:29 AM (145, 20.9%) for males and 7:30 AM to 7:59 AM (153, 26.2%) for females.
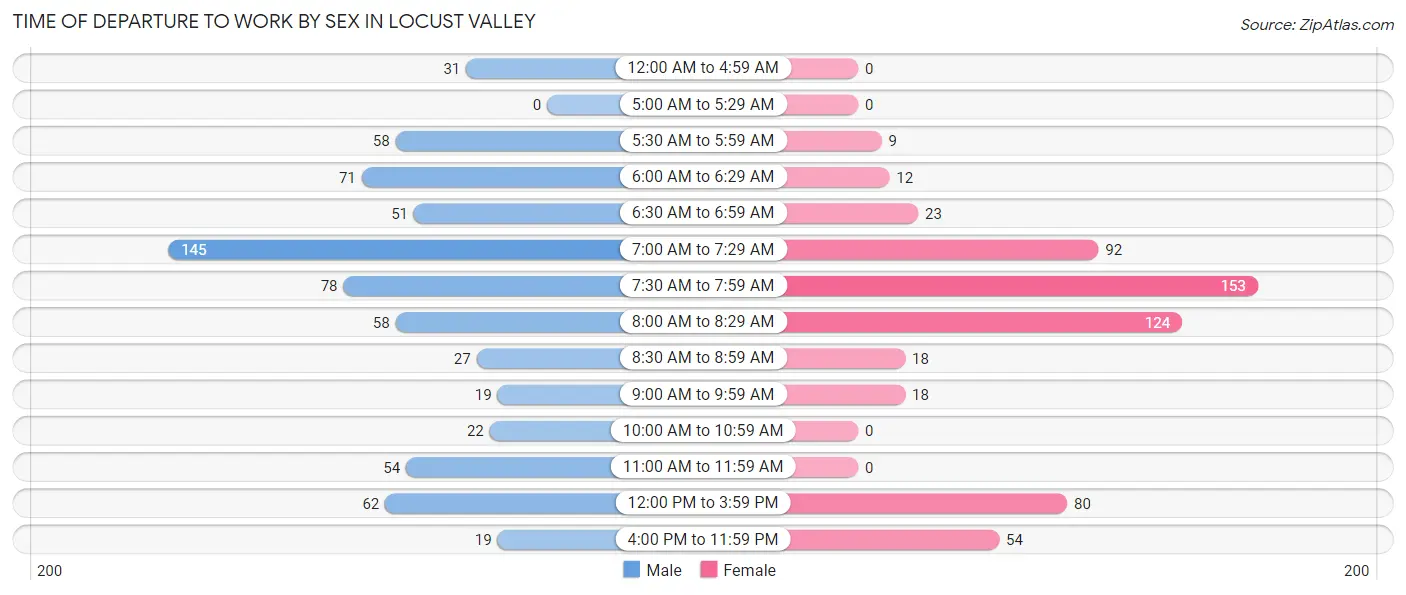
| Time of Departure | Male | Female |
| 12:00 AM to 4:59 AM | 31 (4.5%) | 0 (0.0%) |
| 5:00 AM to 5:29 AM | 0 (0.0%) | 0 (0.0%) |
| 5:30 AM to 5:59 AM | 58 (8.4%) | 9 (1.5%) |
| 6:00 AM to 6:29 AM | 71 (10.2%) | 12 (2.1%) |
| 6:30 AM to 6:59 AM | 51 (7.3%) | 23 (4.0%) |
| 7:00 AM to 7:29 AM | 145 (20.9%) | 92 (15.8%) |
| 7:30 AM to 7:59 AM | 78 (11.2%) | 153 (26.2%) |
| 8:00 AM to 8:29 AM | 58 (8.4%) | 124 (21.3%) |
| 8:30 AM to 8:59 AM | 27 (3.9%) | 18 (3.1%) |
| 9:00 AM to 9:59 AM | 19 (2.7%) | 18 (3.1%) |
| 10:00 AM to 10:59 AM | 22 (3.2%) | 0 (0.0%) |
| 11:00 AM to 11:59 AM | 54 (7.8%) | 0 (0.0%) |
| 12:00 PM to 3:59 PM | 62 (8.9%) | 80 (13.7%) |
| 4:00 PM to 11:59 PM | 19 (2.7%) | 54 (9.3%) |
| Total | 695 (100.0%) | 583 (100.0%) |
Housing Occupancy in Locust Valley
Occupancy by Ownership in Locust Valley
Of the total 1,258 dwellings in Locust Valley, owner-occupied units account for 937 (74.5%), while renter-occupied units make up 321 (25.5%).
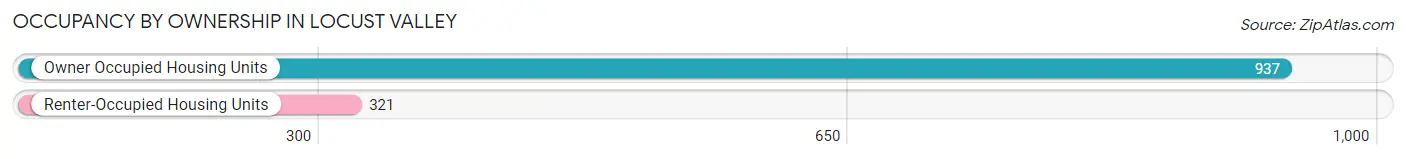
| Occupancy | # Housing Units | % Housing Units |
| Owner Occupied Housing Units | 937 | 74.5% |
| Renter-Occupied Housing Units | 321 | 25.5% |
| Total Occupied Housing Units | 1,258 | 100.0% |
Occupancy by Household Size in Locust Valley
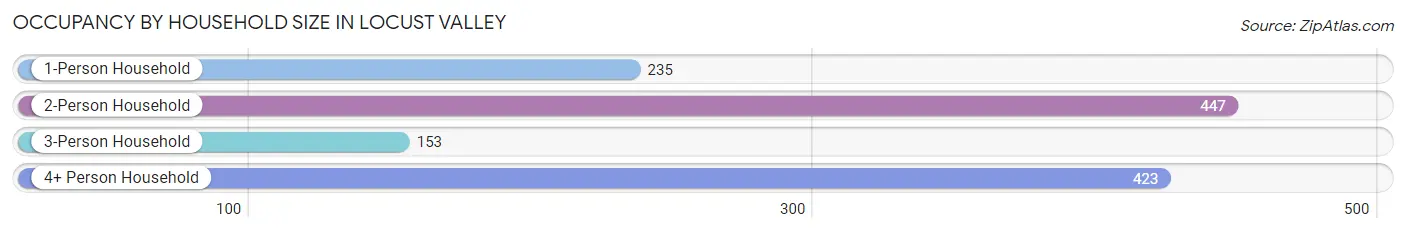
| Household Size | # Housing Units | % Housing Units |
| 1-Person Household | 235 | 18.7% |
| 2-Person Household | 447 | 35.5% |
| 3-Person Household | 153 | 12.2% |
| 4+ Person Household | 423 | 33.6% |
| Total Housing Units | 1,258 | 100.0% |
Occupancy by Ownership by Household Size in Locust Valley
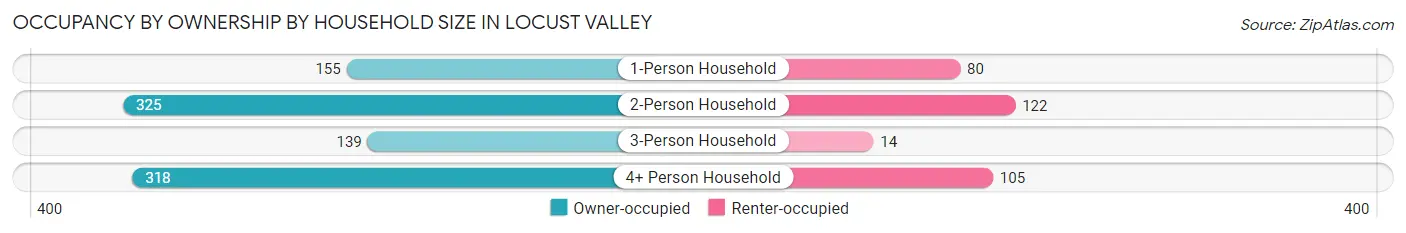
| Household Size | Owner-occupied | Renter-occupied |
| 1-Person Household | 155 (66.0%) | 80 (34.0%) |
| 2-Person Household | 325 (72.7%) | 122 (27.3%) |
| 3-Person Household | 139 (90.8%) | 14 (9.1%) |
| 4+ Person Household | 318 (75.2%) | 105 (24.8%) |
| Total Housing Units | 937 (74.5%) | 321 (25.5%) |
Occupancy by Educational Attainment in Locust Valley
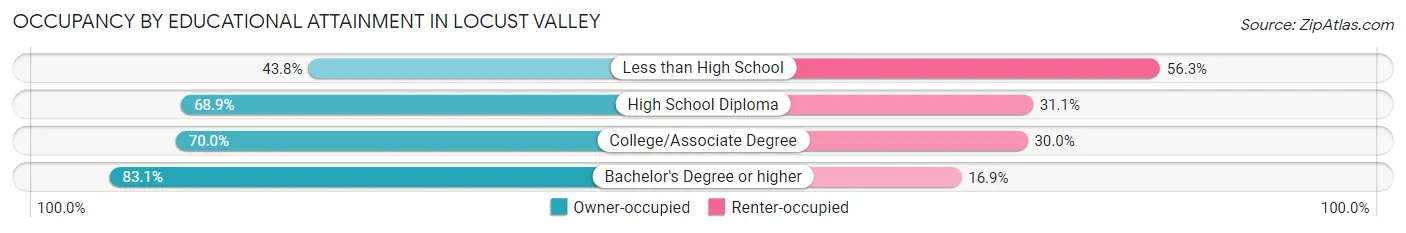
| Household Size | Owner-occupied | Renter-occupied |
| Less than High School | 49 (43.8%) | 63 (56.2%) |
| High School Diploma | 91 (68.9%) | 41 (31.1%) |
| College/Associate Degree | 245 (70.0%) | 105 (30.0%) |
| Bachelor's Degree or higher | 552 (83.1%) | 112 (16.9%) |
Occupancy by Age of Householder in Locust Valley
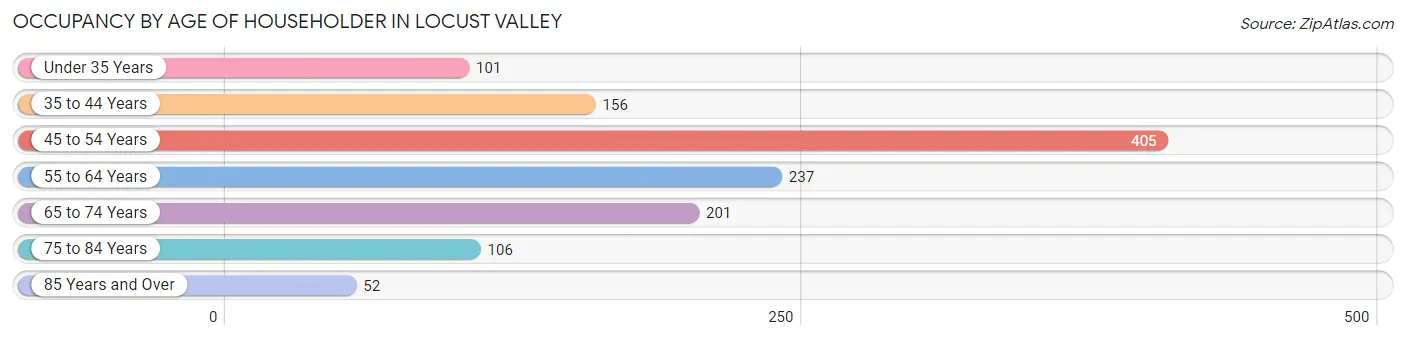
| Age Bracket | # Households | % Households |
| Under 35 Years | 101 | 8.0% |
| 35 to 44 Years | 156 | 12.4% |
| 45 to 54 Years | 405 | 32.2% |
| 55 to 64 Years | 237 | 18.8% |
| 65 to 74 Years | 201 | 16.0% |
| 75 to 84 Years | 106 | 8.4% |
| 85 Years and Over | 52 | 4.1% |
| Total | 1,258 | 100.0% |
Housing Finances in Locust Valley
Median Income by Occupancy in Locust Valley
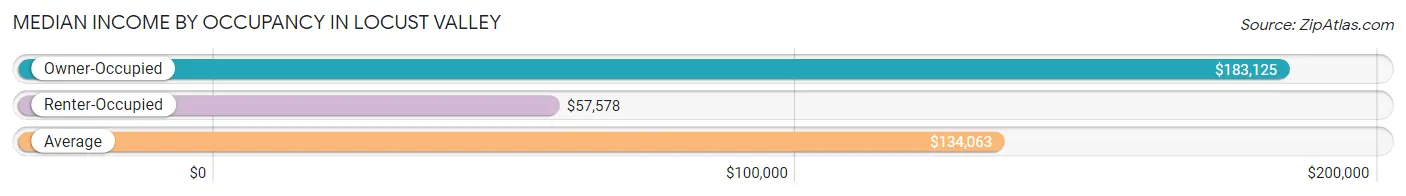
| Occupancy Type | # Households | Median Income |
| Owner-Occupied | 937 (74.5%) | $183,125 |
| Renter-Occupied | 321 (25.5%) | $57,578 |
| Average | 1,258 (100.0%) | $134,063 |
Occupancy by Householder Income Bracket in Locust Valley
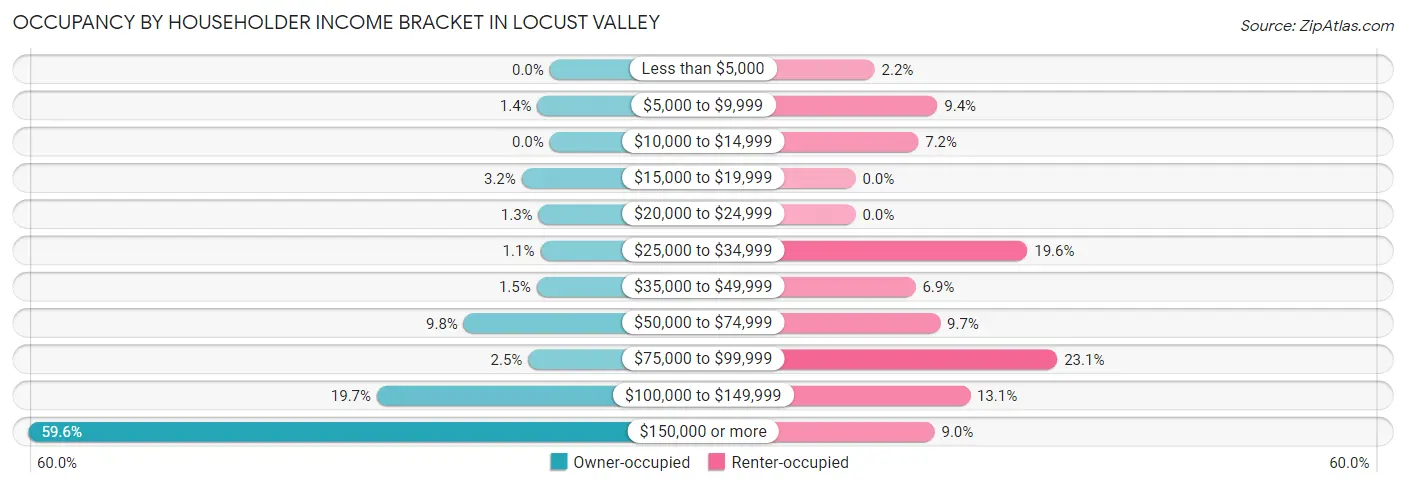
| Income Bracket | Owner-occupied | Renter-occupied |
| Less than $5,000 | 0 (0.0%) | 7 (2.2%) |
| $5,000 to $9,999 | 13 (1.4%) | 30 (9.3%) |
| $10,000 to $14,999 | 0 (0.0%) | 23 (7.2%) |
| $15,000 to $19,999 | 30 (3.2%) | 0 (0.0%) |
| $20,000 to $24,999 | 12 (1.3%) | 0 (0.0%) |
| $25,000 to $34,999 | 10 (1.1%) | 63 (19.6%) |
| $35,000 to $49,999 | 14 (1.5%) | 22 (6.9%) |
| $50,000 to $74,999 | 92 (9.8%) | 31 (9.7%) |
| $75,000 to $99,999 | 23 (2.5%) | 74 (23.1%) |
| $100,000 to $149,999 | 185 (19.7%) | 42 (13.1%) |
| $150,000 or more | 558 (59.6%) | 29 (9.0%) |
| Total | 937 (100.0%) | 321 (100.0%) |
Monthly Housing Cost Tiers in Locust Valley
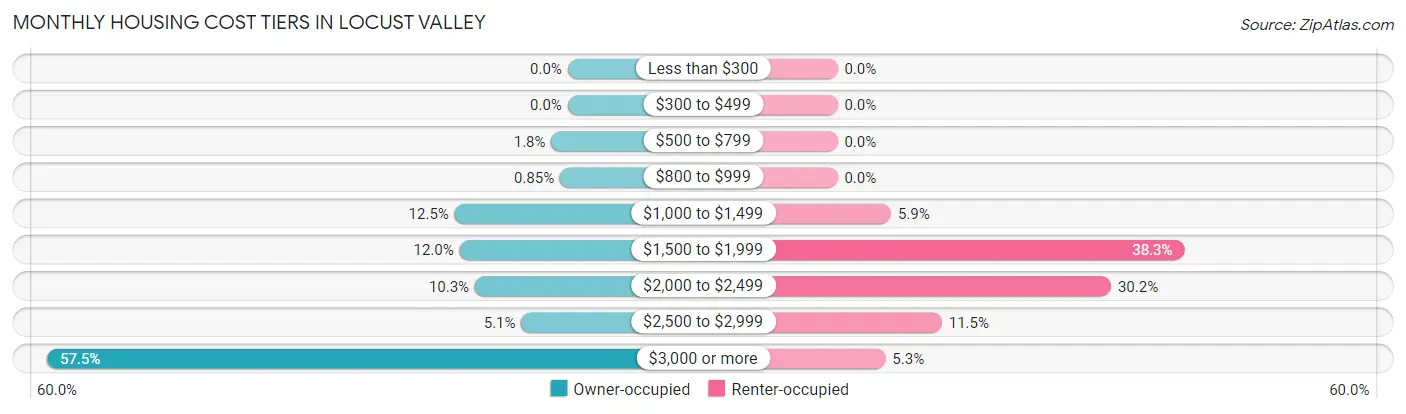
| Monthly Cost | Owner-occupied | Renter-occupied |
| Less than $300 | 0 (0.0%) | 0 (0.0%) |
| $300 to $499 | 0 (0.0%) | 0 (0.0%) |
| $500 to $799 | 17 (1.8%) | 0 (0.0%) |
| $800 to $999 | 8 (0.9%) | 0 (0.0%) |
| $1,000 to $1,499 | 117 (12.5%) | 19 (5.9%) |
| $1,500 to $1,999 | 112 (11.9%) | 123 (38.3%) |
| $2,000 to $2,499 | 96 (10.2%) | 97 (30.2%) |
| $2,500 to $2,999 | 48 (5.1%) | 37 (11.5%) |
| $3,000 or more | 539 (57.5%) | 17 (5.3%) |
| Total | 937 (100.0%) | 321 (100.0%) |
Physical Housing Characteristics in Locust Valley
Housing Structures in Locust Valley
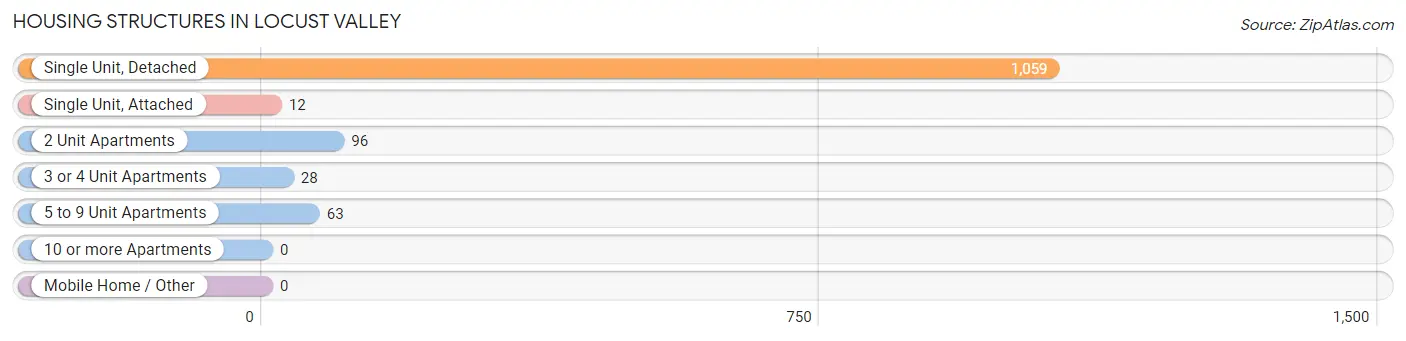
| Structure Type | # Housing Units | % Housing Units |
| Single Unit, Detached | 1,059 | 84.2% |
| Single Unit, Attached | 12 | 0.9% |
| 2 Unit Apartments | 96 | 7.6% |
| 3 or 4 Unit Apartments | 28 | 2.2% |
| 5 to 9 Unit Apartments | 63 | 5.0% |
| 10 or more Apartments | 0 | 0.0% |
| Mobile Home / Other | 0 | 0.0% |
| Total | 1,258 | 100.0% |
Housing Structures by Occupancy in Locust Valley
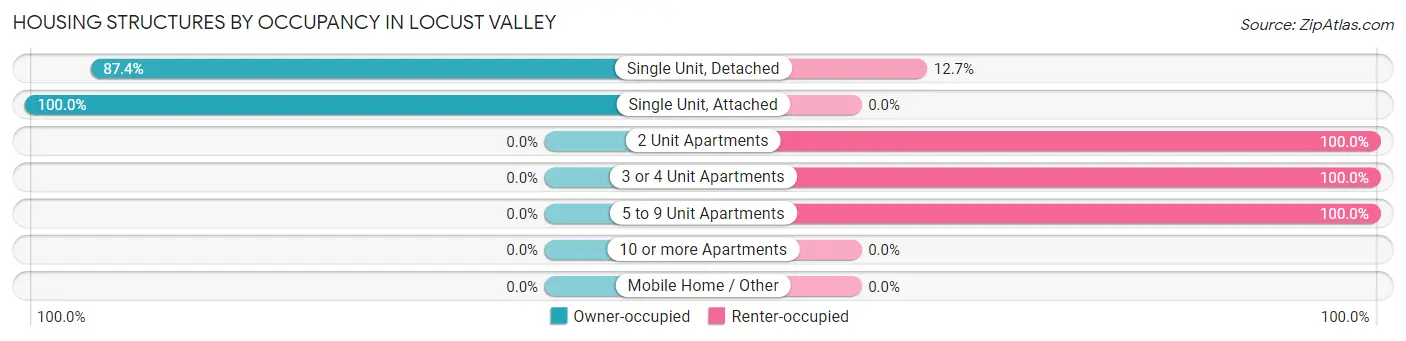
| Structure Type | Owner-occupied | Renter-occupied |
| Single Unit, Detached | 925 (87.4%) | 134 (12.7%) |
| Single Unit, Attached | 12 (100.0%) | 0 (0.0%) |
| 2 Unit Apartments | 0 (0.0%) | 96 (100.0%) |
| 3 or 4 Unit Apartments | 0 (0.0%) | 28 (100.0%) |
| 5 to 9 Unit Apartments | 0 (0.0%) | 63 (100.0%) |
| 10 or more Apartments | 0 (0.0%) | 0 (0.0%) |
| Mobile Home / Other | 0 (0.0%) | 0 (0.0%) |
| Total | 937 (74.5%) | 321 (25.5%) |
Housing Structures by Number of Rooms in Locust Valley
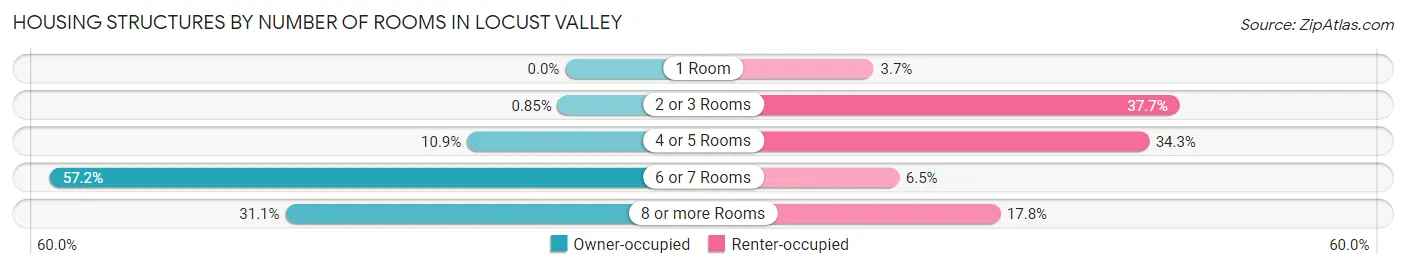
| Number of Rooms | Owner-occupied | Renter-occupied |
| 1 Room | 0 (0.0%) | 12 (3.7%) |
| 2 or 3 Rooms | 8 (0.9%) | 121 (37.7%) |
| 4 or 5 Rooms | 102 (10.9%) | 110 (34.3%) |
| 6 or 7 Rooms | 536 (57.2%) | 21 (6.5%) |
| 8 or more Rooms | 291 (31.1%) | 57 (17.8%) |
| Total | 937 (100.0%) | 321 (100.0%) |
Housing Structure by Heating Type in Locust Valley
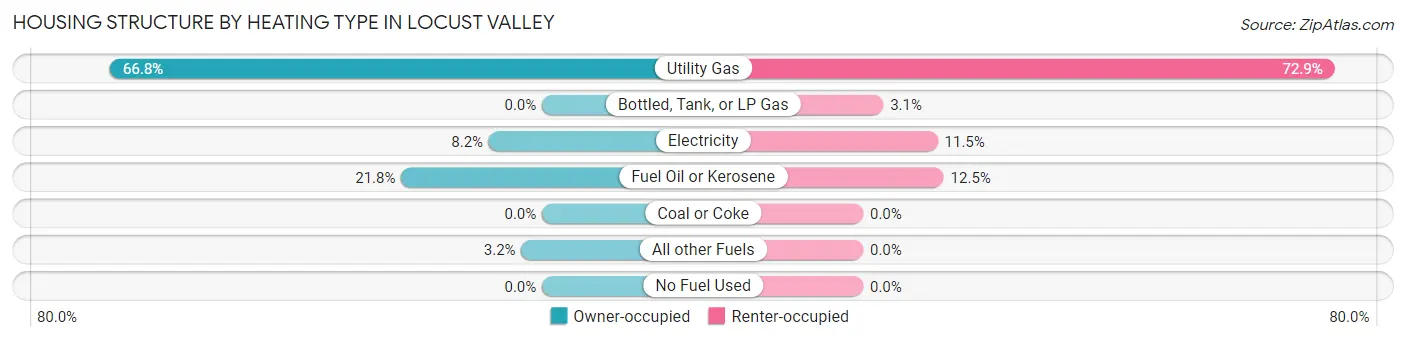
| Heating Type | Owner-occupied | Renter-occupied |
| Utility Gas | 626 (66.8%) | 234 (72.9%) |
| Bottled, Tank, or LP Gas | 0 (0.0%) | 10 (3.1%) |
| Electricity | 77 (8.2%) | 37 (11.5%) |
| Fuel Oil or Kerosene | 204 (21.8%) | 40 (12.5%) |
| Coal or Coke | 0 (0.0%) | 0 (0.0%) |
| All other Fuels | 30 (3.2%) | 0 (0.0%) |
| No Fuel Used | 0 (0.0%) | 0 (0.0%) |
| Total | 937 (100.0%) | 321 (100.0%) |
Household Vehicle Usage in Locust Valley
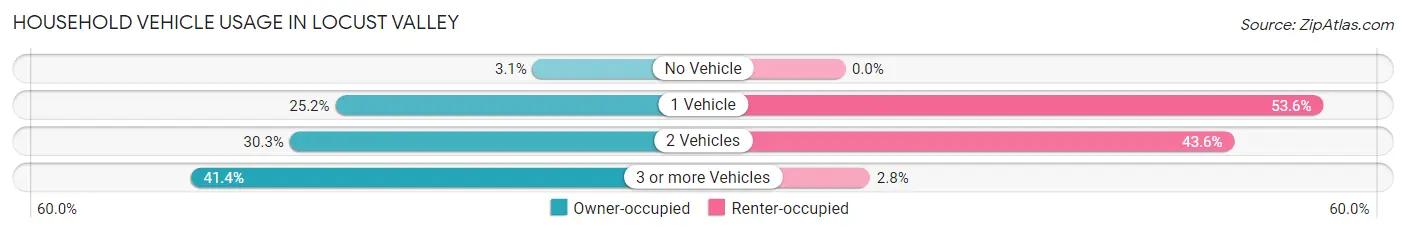
| Vehicles per Household | Owner-occupied | Renter-occupied |
| No Vehicle | 29 (3.1%) | 0 (0.0%) |
| 1 Vehicle | 236 (25.2%) | 172 (53.6%) |
| 2 Vehicles | 284 (30.3%) | 140 (43.6%) |
| 3 or more Vehicles | 388 (41.4%) | 9 (2.8%) |
| Total | 937 (100.0%) | 321 (100.0%) |
Real Estate & Mortgages in Locust Valley
Real Estate and Mortgage Overview in Locust Valley
| Characteristic | Without Mortgage | With Mortgage |
| Housing Units | 265 | 672 |
| Median Property Value | $622,100 | $738,100 |
| Median Household Income | - | - |
| Monthly Housing Costs | $1,441 | $511 |
| Real Estate Taxes | $10,001 | $12 |
Property Value by Mortgage Status in Locust Valley
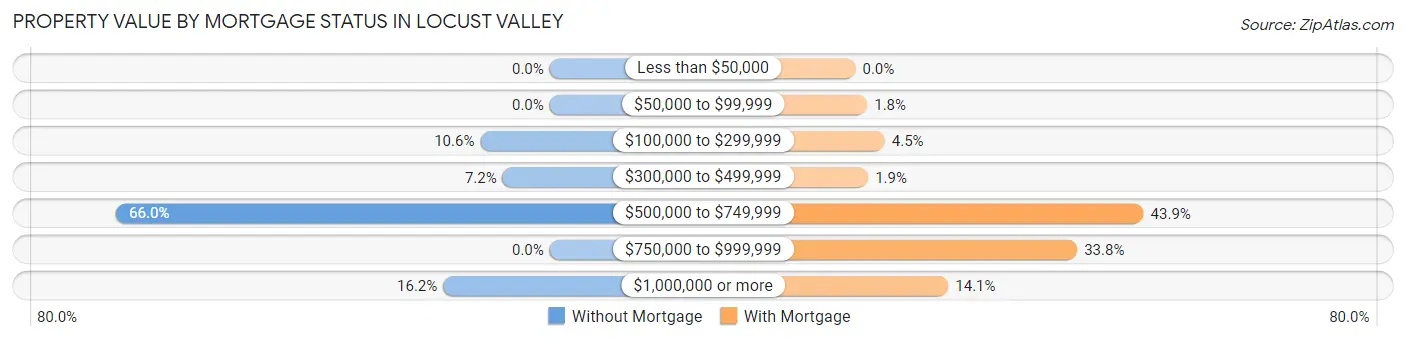
| Property Value | Without Mortgage | With Mortgage |
| Less than $50,000 | 0 (0.0%) | 0 (0.0%) |
| $50,000 to $99,999 | 0 (0.0%) | 12 (1.8%) |
| $100,000 to $299,999 | 28 (10.6%) | 30 (4.5%) |
| $300,000 to $499,999 | 19 (7.2%) | 13 (1.9%) |
| $500,000 to $749,999 | 175 (66.0%) | 295 (43.9%) |
| $750,000 to $999,999 | 0 (0.0%) | 227 (33.8%) |
| $1,000,000 or more | 43 (16.2%) | 95 (14.1%) |
| Total | 265 (100.0%) | 672 (100.0%) |
Household Income by Mortgage Status in Locust Valley
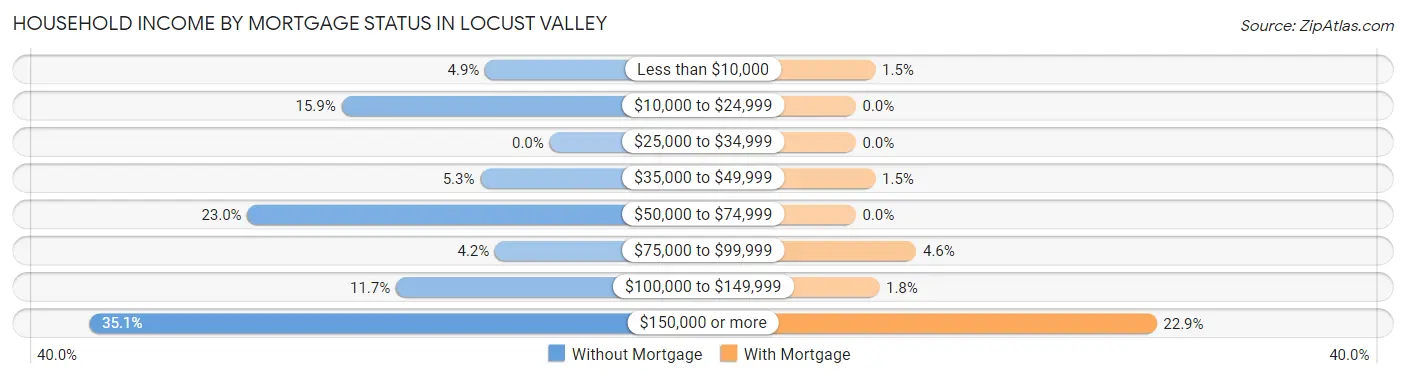
| Household Income | Without Mortgage | With Mortgage |
| Less than $10,000 | 13 (4.9%) | 10 (1.5%) |
| $10,000 to $24,999 | 42 (15.9%) | 0 (0.0%) |
| $25,000 to $34,999 | 0 (0.0%) | 0 (0.0%) |
| $35,000 to $49,999 | 14 (5.3%) | 10 (1.5%) |
| $50,000 to $74,999 | 61 (23.0%) | 0 (0.0%) |
| $75,000 to $99,999 | 11 (4.2%) | 31 (4.6%) |
| $100,000 to $149,999 | 31 (11.7%) | 12 (1.8%) |
| $150,000 or more | 93 (35.1%) | 154 (22.9%) |
| Total | 265 (100.0%) | 672 (100.0%) |
Property Value to Household Income Ratio in Locust Valley
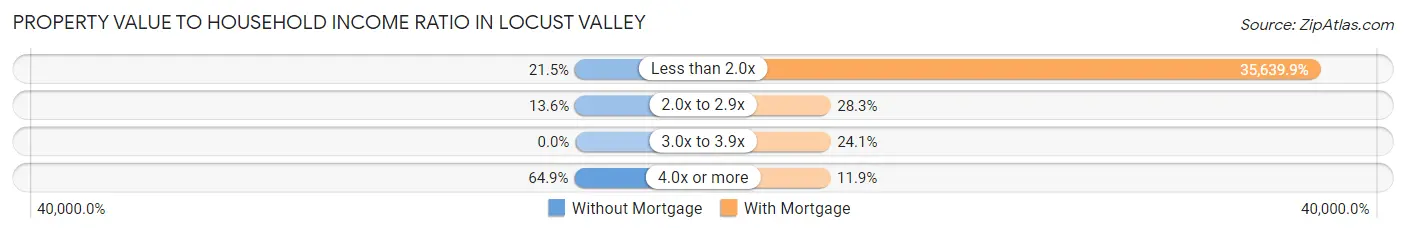
| Value-to-Income Ratio | Without Mortgage | With Mortgage |
| Less than 2.0x | 57 (21.5%) | 239,500 (35,639.9%) |
| 2.0x to 2.9x | 36 (13.6%) | 190 (28.3%) |
| 3.0x to 3.9x | 0 (0.0%) | 162 (24.1%) |
| 4.0x or more | 172 (64.9%) | 80 (11.9%) |
| Total | 265 (100.0%) | 672 (100.0%) |
Real Estate Taxes by Mortgage Status in Locust Valley
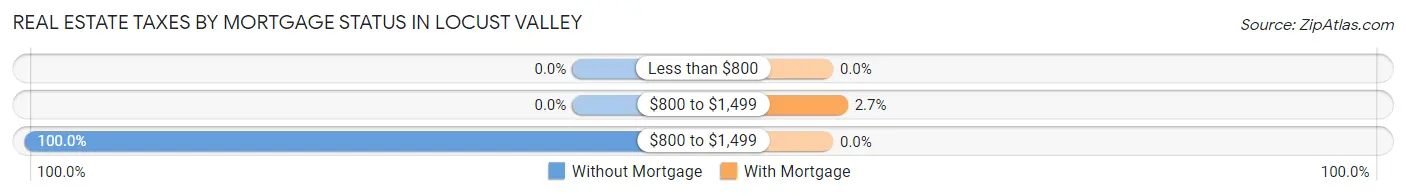
| Property Taxes | Without Mortgage | With Mortgage |
| Less than $800 | 0 (0.0%) | 0 (0.0%) |
| $800 to $1,499 | 0 (0.0%) | 18 (2.7%) |
| $800 to $1,499 | 265 (100.0%) | 0 (0.0%) |
| Total | 265 (100.0%) | 672 (100.0%) |
Health & Disability in Locust Valley
Health Insurance Coverage by Age in Locust Valley
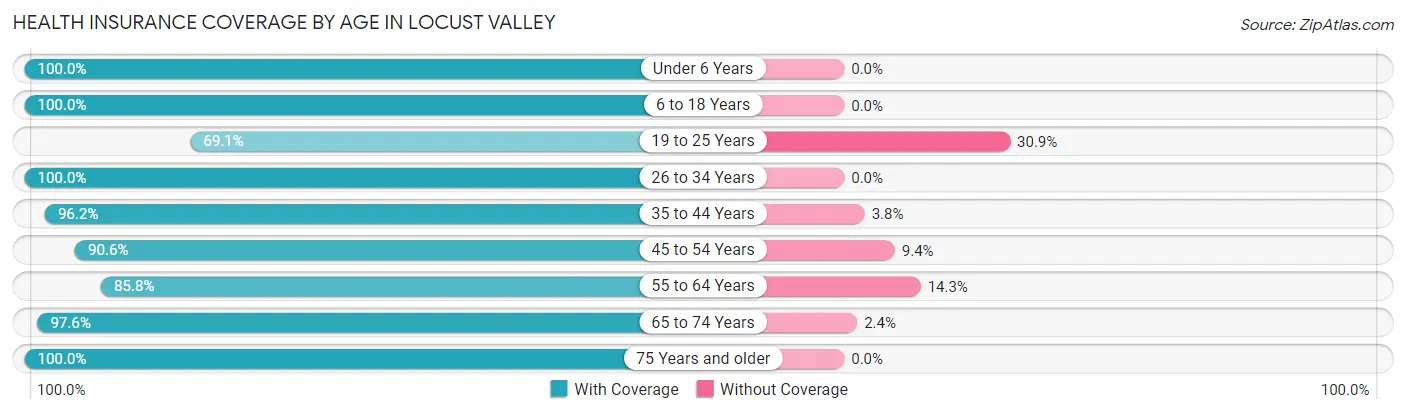
| Age Bracket | With Coverage | Without Coverage |
| Under 6 Years | 234 (100.0%) | 0 (0.0%) |
| 6 to 18 Years | 833 (100.0%) | 0 (0.0%) |
| 19 to 25 Years | 143 (69.1%) | 64 (30.9%) |
| 26 to 34 Years | 183 (100.0%) | 0 (0.0%) |
| 35 to 44 Years | 404 (96.2%) | 16 (3.8%) |
| 45 to 54 Years | 605 (90.6%) | 63 (9.4%) |
| 55 to 64 Years | 385 (85.8%) | 64 (14.2%) |
| 65 to 74 Years | 364 (97.6%) | 9 (2.4%) |
| 75 Years and older | 244 (100.0%) | 0 (0.0%) |
| Total | 3,395 (94.0%) | 216 (6.0%) |
Health Insurance Coverage by Citizenship Status in Locust Valley
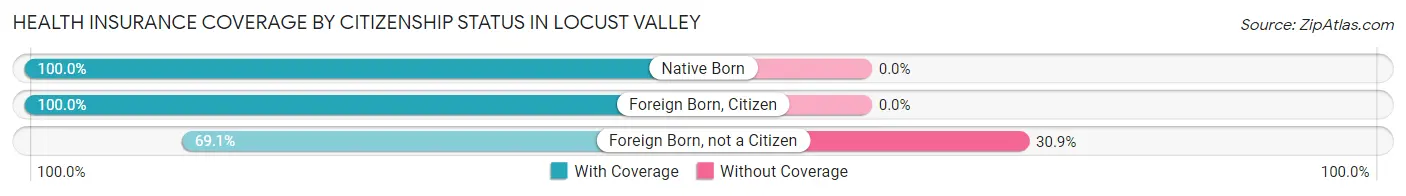
| Citizenship Status | With Coverage | Without Coverage |
| Native Born | 234 (100.0%) | 0 (0.0%) |
| Foreign Born, Citizen | 833 (100.0%) | 0 (0.0%) |
| Foreign Born, not a Citizen | 143 (69.1%) | 64 (30.9%) |
Health Insurance Coverage by Household Income in Locust Valley
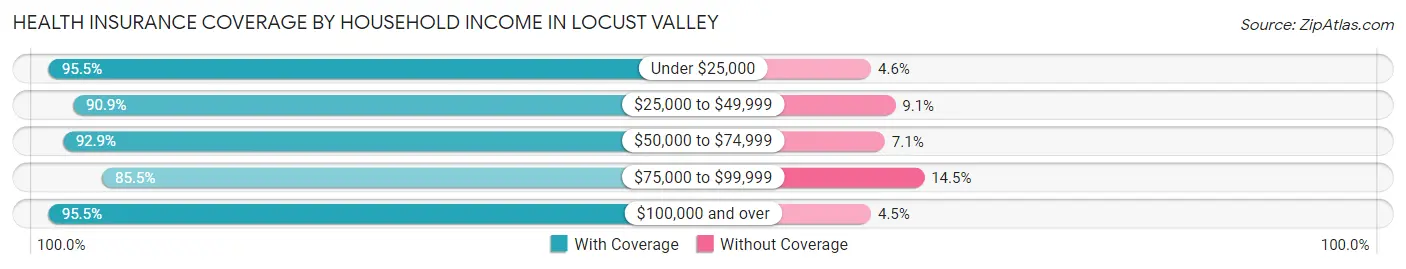
| Household Income | With Coverage | Without Coverage |
| Under $25,000 | 168 (95.5%) | 8 (4.5%) |
| $25,000 to $49,999 | 190 (90.9%) | 19 (9.1%) |
| $50,000 to $74,999 | 208 (92.9%) | 16 (7.1%) |
| $75,000 to $99,999 | 324 (85.5%) | 55 (14.5%) |
| $100,000 and over | 2,480 (95.5%) | 118 (4.5%) |
Public vs Private Health Insurance Coverage by Age in Locust Valley
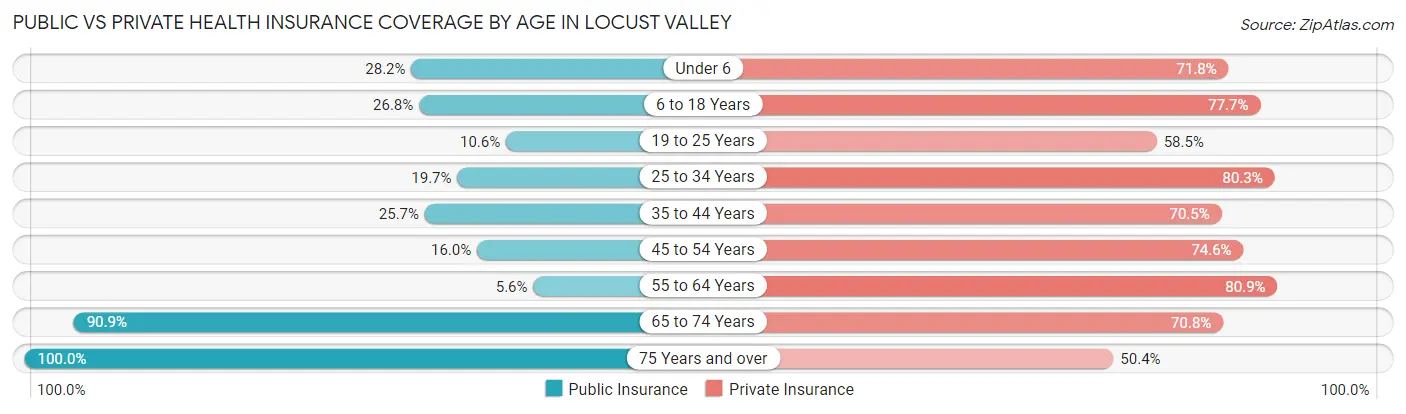
| Age Bracket | Public Insurance | Private Insurance |
| Under 6 | 66 (28.2%) | 168 (71.8%) |
| 6 to 18 Years | 223 (26.8%) | 647 (77.7%) |
| 19 to 25 Years | 22 (10.6%) | 121 (58.5%) |
| 25 to 34 Years | 36 (19.7%) | 147 (80.3%) |
| 35 to 44 Years | 108 (25.7%) | 296 (70.5%) |
| 45 to 54 Years | 107 (16.0%) | 498 (74.6%) |
| 55 to 64 Years | 25 (5.6%) | 363 (80.8%) |
| 65 to 74 Years | 339 (90.9%) | 264 (70.8%) |
| 75 Years and over | 244 (100.0%) | 123 (50.4%) |
| Total | 1,170 (32.4%) | 2,627 (72.8%) |
Disability Status by Sex by Age in Locust Valley
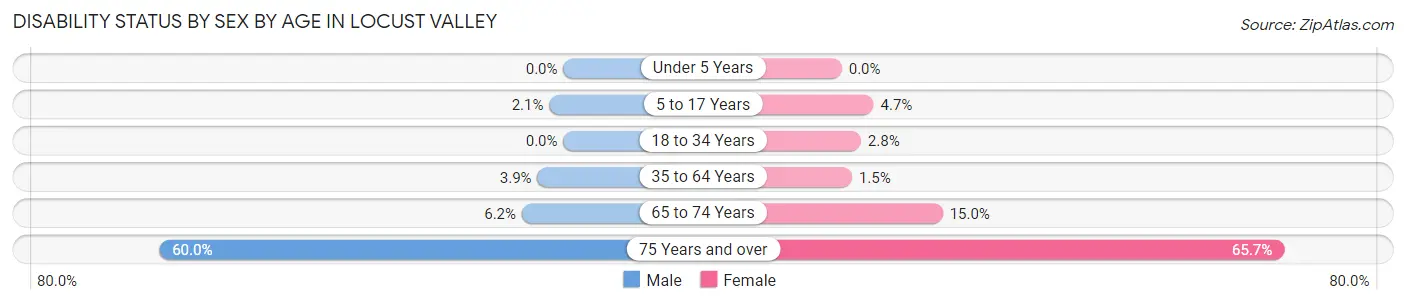
| Age Bracket | Male | Female |
| Under 5 Years | 0 (0.0%) | 0 (0.0%) |
| 5 to 17 Years | 12 (2.1%) | 11 (4.7%) |
| 18 to 34 Years | 0 (0.0%) | 4 (2.8%) |
| 35 to 64 Years | 26 (3.8%) | 13 (1.5%) |
| 65 to 74 Years | 9 (6.2%) | 34 (15.0%) |
| 75 Years and over | 66 (60.0%) | 88 (65.7%) |
Disability Class by Sex by Age in Locust Valley
Disability Class: Hearing Difficulty
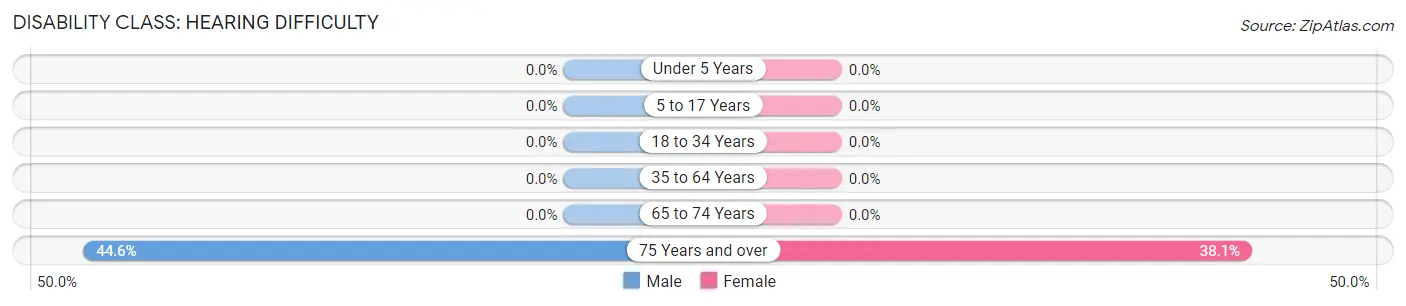
| Age Bracket | Male | Female |
| Under 5 Years | 0 (0.0%) | 0 (0.0%) |
| 5 to 17 Years | 0 (0.0%) | 0 (0.0%) |
| 18 to 34 Years | 0 (0.0%) | 0 (0.0%) |
| 35 to 64 Years | 0 (0.0%) | 0 (0.0%) |
| 65 to 74 Years | 0 (0.0%) | 0 (0.0%) |
| 75 Years and over | 49 (44.6%) | 51 (38.1%) |
Disability Class: Vision Difficulty
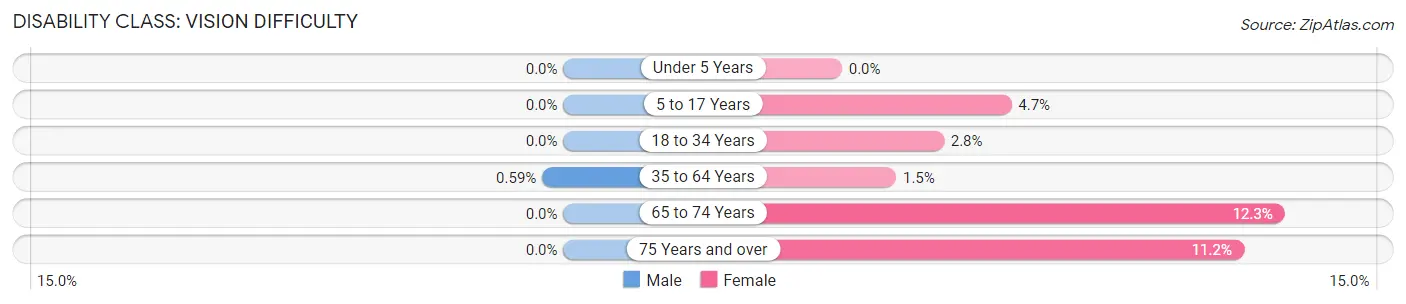
| Age Bracket | Male | Female |
| Under 5 Years | 0 (0.0%) | 0 (0.0%) |
| 5 to 17 Years | 0 (0.0%) | 11 (4.7%) |
| 18 to 34 Years | 0 (0.0%) | 4 (2.8%) |
| 35 to 64 Years | 4 (0.6%) | 13 (1.5%) |
| 65 to 74 Years | 0 (0.0%) | 28 (12.3%) |
| 75 Years and over | 0 (0.0%) | 15 (11.2%) |
Disability Class: Cognitive Difficulty
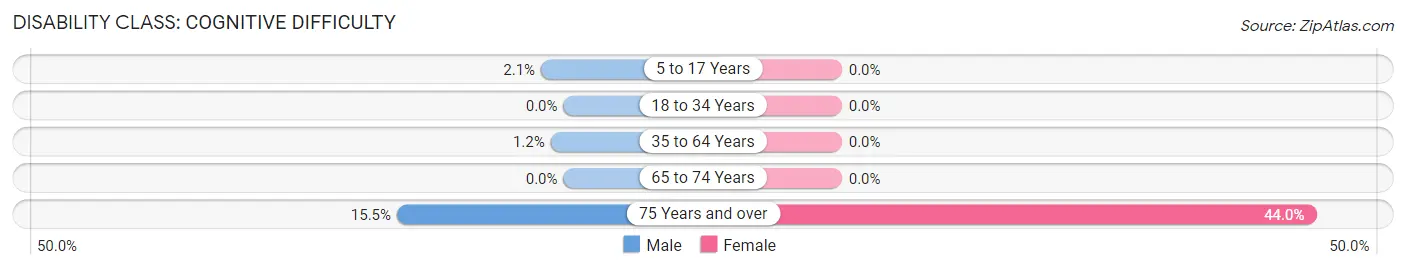
| Age Bracket | Male | Female |
| 5 to 17 Years | 12 (2.1%) | 0 (0.0%) |
| 18 to 34 Years | 0 (0.0%) | 0 (0.0%) |
| 35 to 64 Years | 8 (1.2%) | 0 (0.0%) |
| 65 to 74 Years | 0 (0.0%) | 0 (0.0%) |
| 75 Years and over | 17 (15.4%) | 59 (44.0%) |
Disability Class: Ambulatory Difficulty
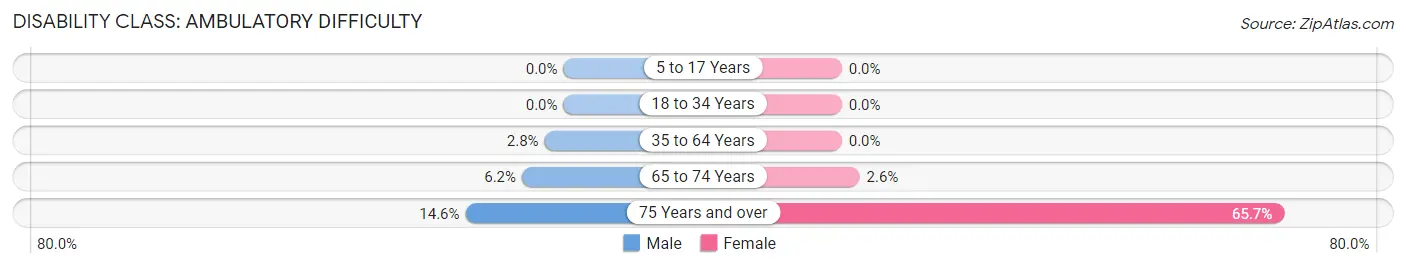
| Age Bracket | Male | Female |
| 5 to 17 Years | 0 (0.0%) | 0 (0.0%) |
| 18 to 34 Years | 0 (0.0%) | 0 (0.0%) |
| 35 to 64 Years | 19 (2.8%) | 0 (0.0%) |
| 65 to 74 Years | 9 (6.2%) | 6 (2.6%) |
| 75 Years and over | 16 (14.5%) | 88 (65.7%) |
Disability Class: Self-Care Difficulty
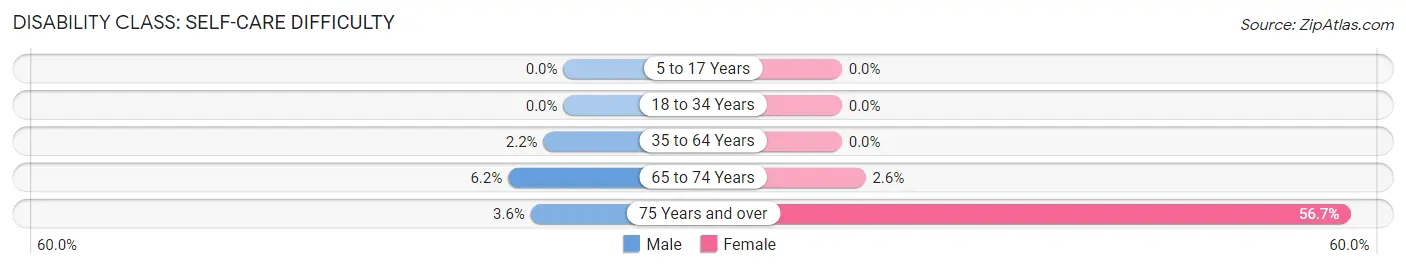
| Age Bracket | Male | Female |
| 5 to 17 Years | 0 (0.0%) | 0 (0.0%) |
| 18 to 34 Years | 0 (0.0%) | 0 (0.0%) |
| 35 to 64 Years | 15 (2.2%) | 0 (0.0%) |
| 65 to 74 Years | 9 (6.2%) | 6 (2.6%) |
| 75 Years and over | 4 (3.6%) | 76 (56.7%) |
Technology Access in Locust Valley
Computing Device Access in Locust Valley
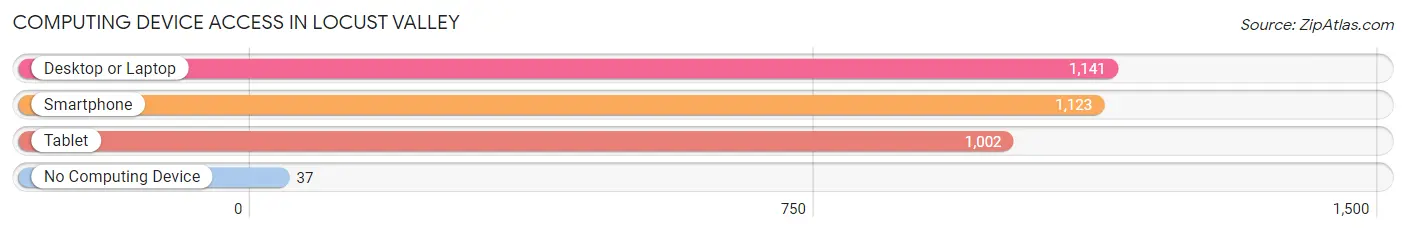
| Device Type | # Households | % Households |
| Desktop or Laptop | 1,141 | 90.7% |
| Smartphone | 1,123 | 89.3% |
| Tablet | 1,002 | 79.6% |
| No Computing Device | 37 | 2.9% |
| Total | 1,258 | 100.0% |
Internet Access in Locust Valley
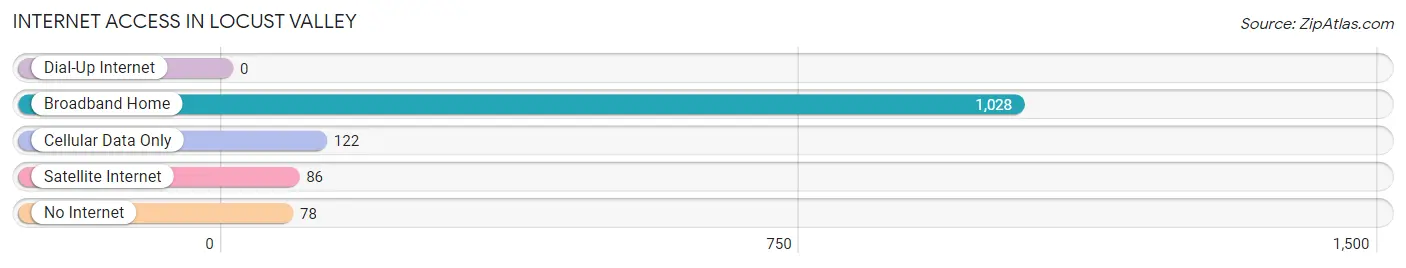
| Internet Type | # Households | % Households |
| Dial-Up Internet | 0 | 0.0% |
| Broadband Home | 1,028 | 81.7% |
| Cellular Data Only | 122 | 9.7% |
| Satellite Internet | 86 | 6.8% |
| No Internet | 78 | 6.2% |
| Total | 1,258 | 100.0% |
Locust Valley Summary
Locust Valley is a hamlet located in the Town of Oyster Bay in Nassau County, New York. It is situated on the North Shore of Long Island, approximately 25 miles east of Manhattan. The hamlet is known for its affluent population, beautiful scenery, and historic sites.
History
The area that is now Locust Valley was originally inhabited by the Matinecock Native American tribe. The first European settlers arrived in the area in the late 1600s, and the hamlet was officially established in 1767. The hamlet was named after the locust trees that grew in the area.
In the late 1800s, Locust Valley became a popular summer destination for wealthy New Yorkers. Many of these visitors built large estates in the area, and the hamlet soon became known as a wealthy enclave.
In the early 1900s, Locust Valley was home to several prominent families, including the Phipps, the Vanderbilts, and the Whitneys. These families built large estates in the area, and many of these estates still stand today.
Geography
Locust Valley is located on the North Shore of Long Island, approximately 25 miles east of Manhattan. The hamlet is bordered by the Town of Oyster Bay to the west, the Town of North Hempstead to the east, and the Town of Hempstead to the south.
The hamlet is situated on a peninsula that juts out into Long Island Sound. The peninsula is surrounded by several bodies of water, including Hempstead Harbor, Oyster Bay Harbor, and Cold Spring Harbor.
The hamlet is home to several parks and nature preserves, including Caumsett State Historic Park, Muttontown Preserve, and the Cold Spring Harbor State Park.
Economy
The economy of Locust Valley is largely based on tourism and real estate. The hamlet is home to several luxury resorts, including the Locust Valley Inn and the Locust Valley Country Club.
The hamlet is also home to several large corporations, including the Phipps Corporation, the Vanderbilt Corporation, and the Whitney Corporation. These companies employ many of the residents of Locust Valley.
Demographics
As of the 2010 census, the population of Locust Valley was 5,919. The median household income was $150,000, and the median home value was $1,000,000.
The population of Locust Valley is predominantly white (90.2%), with small percentages of African American (2.3%), Asian (3.2%), and Hispanic (2.3%) residents.
Conclusion
Locust Valley is a hamlet located in the Town of Oyster Bay in Nassau County, New York. It is situated on the North Shore of Long Island, approximately 25 miles east of Manhattan. The hamlet is known for its affluent population, beautiful scenery, and historic sites. The economy of Locust Valley is largely based on tourism and real estate, and the population is predominantly white.
Common Questions
What is Per Capita Income in Locust Valley?
Per Capita income in Locust Valley is $89,333.
What is the Median Family Income in Locust Valley?
Median Family Income in Locust Valley is $167,667.
What is the Median Household income in Locust Valley?
Median Household Income in Locust Valley is $134,063.
What is Income or Wage Gap in Locust Valley?
Income or Wage Gap in Locust Valley is 41.7%.
Women in Locust Valley earn 58.3 cents for every dollar earned by a man.
What is Inequality or Gini Index in Locust Valley?
Inequality or Gini Index in Locust Valley is 0.56.
What is the Total Population of Locust Valley?
Total Population of Locust Valley is 3,611.
What is the Total Male Population of Locust Valley?
Total Male Population of Locust Valley is 1,914.
What is the Total Female Population of Locust Valley?
Total Female Population of Locust Valley is 1,697.
What is the Ratio of Males per 100 Females in Locust Valley?
There are 112.79 Males per 100 Females in Locust Valley.
What is the Ratio of Females per 100 Males in Locust Valley?
There are 88.66 Females per 100 Males in Locust Valley.
What is the Median Population Age in Locust Valley?
Median Population Age in Locust Valley is 43.5 Years.
What is the Average Family Size in Locust Valley
Average Family Size in Locust Valley is 3.2 People.
What is the Average Household Size in Locust Valley
Average Household Size in Locust Valley is 2.9 People.
How Large is the Labor Force in Locust Valley?
There are 1,727 People in the Labor Forcein in Locust Valley.
What is the Percentage of People in the Labor Force in Locust Valley?
65.3% of People are in the Labor Force in Locust Valley.
What is the Unemployment Rate in Locust Valley?
Unemployment Rate in Locust Valley is 3.2%.