Oceanside, NY Map & Demographics
Oceanside Map
Oceanside Overview
$58,400
PER CAPITA INCOME
$152,119
AVG FAMILY INCOME
$136,997
AVG HOUSEHOLD INCOME
13.1%
WAGE / INCOME GAP [ % ]
86.9¢/ $1
WAGE / INCOME GAP [ $ ]
0.40
INEQUALITY / GINI INDEX
31,488
TOTAL POPULATION
16,313
MALE POPULATION
15,175
FEMALE POPULATION
107.50
MALES / 100 FEMALES
93.02
FEMALES / 100 MALES
45.8
MEDIAN AGE
3.3
AVG FAMILY SIZE
2.9
AVG HOUSEHOLD SIZE
17,439
LABOR FORCE [ PEOPLE ]
67.1%
PERCENT IN LABOR FORCE
5.9%
UNEMPLOYMENT RATE
Oceanside Zip Codes
Oceanside Area Codes
Income in Oceanside
Income Overview in Oceanside
Per Capita Income in Oceanside is $58,400, while median incomes of families and households are $152,119 and $136,997 respectively.
| Characteristic | Number | Measure |
| Per Capita Income | 31,488 | $58,400 |
| Median Family Income | 8,553 | $152,119 |
| Mean Family Income | 8,553 | $185,386 |
| Median Household Income | 10,811 | $136,997 |
| Mean Household Income | 10,811 | $165,295 |
| Income Deficit | 8,553 | $0 |
| Wage / Income Gap (%) | 31,488 | 13.14% |
| Wage / Income Gap ($) | 31,488 | 86.86¢ per $1 |
| Gini / Inequality Index | 31,488 | 0.40 |
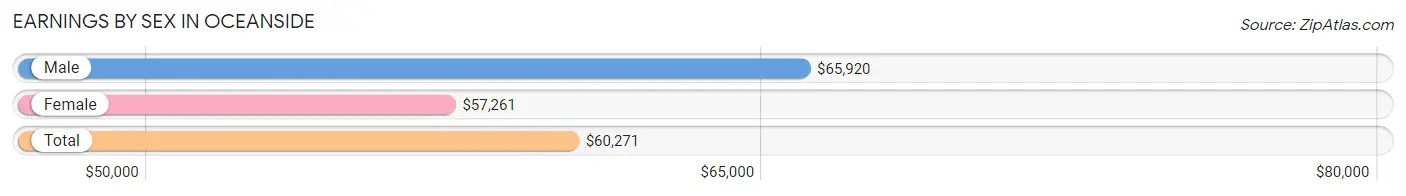
Earnings by Sex in Oceanside
Average Earnings in Oceanside are $60,271, $65,920 for men and $57,261 for women, a difference of 13.1%.
| Sex | Number | Average Earnings |
| Male | 9,223 (52.1%) | $65,920 |
| Female | 8,473 (47.9%) | $57,261 |
| Total | 17,696 (100.0%) | $60,271 |
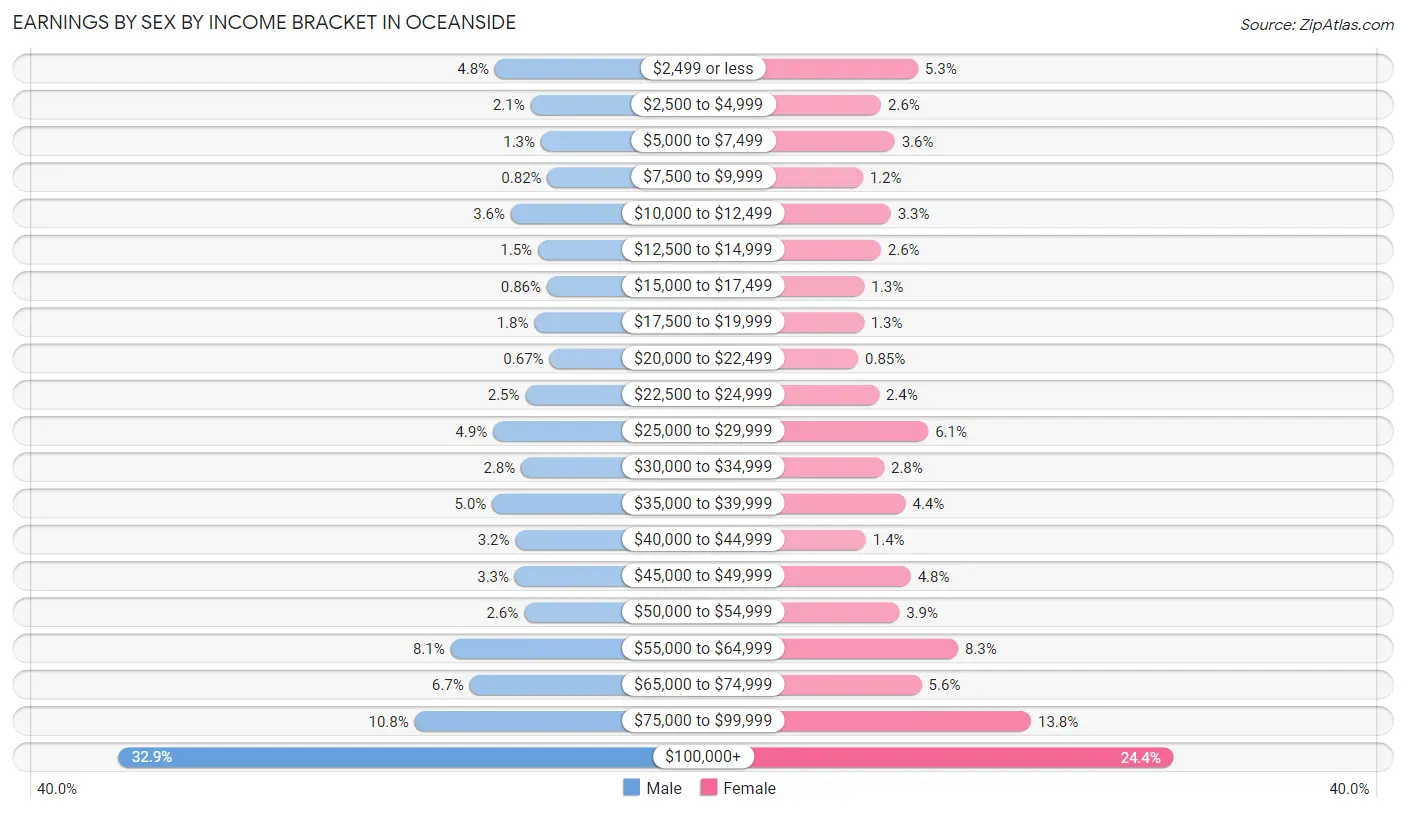
Earnings by Sex by Income Bracket in Oceanside
The most common earnings brackets in Oceanside are $100,000+ for men (3,037 | 32.9%) and $100,000+ for women (2,070 | 24.4%).
| Income | Male | Female |
| $2,499 or less | 438 (4.8%) | 452 (5.3%) |
| $2,500 to $4,999 | 193 (2.1%) | 218 (2.6%) |
| $5,000 to $7,499 | 121 (1.3%) | 304 (3.6%) |
| $7,500 to $9,999 | 76 (0.8%) | 101 (1.2%) |
| $10,000 to $12,499 | 328 (3.6%) | 279 (3.3%) |
| $12,500 to $14,999 | 141 (1.5%) | 216 (2.5%) |
| $15,000 to $17,499 | 79 (0.9%) | 112 (1.3%) |
| $17,500 to $19,999 | 166 (1.8%) | 108 (1.3%) |
| $20,000 to $22,499 | 62 (0.7%) | 72 (0.9%) |
| $22,500 to $24,999 | 228 (2.5%) | 204 (2.4%) |
| $25,000 to $29,999 | 452 (4.9%) | 517 (6.1%) |
| $30,000 to $34,999 | 257 (2.8%) | 236 (2.8%) |
| $35,000 to $39,999 | 457 (5.0%) | 373 (4.4%) |
| $40,000 to $44,999 | 297 (3.2%) | 121 (1.4%) |
| $45,000 to $49,999 | 301 (3.3%) | 406 (4.8%) |
| $50,000 to $54,999 | 237 (2.6%) | 333 (3.9%) |
| $55,000 to $64,999 | 745 (8.1%) | 706 (8.3%) |
| $65,000 to $74,999 | 614 (6.7%) | 475 (5.6%) |
| $75,000 to $99,999 | 994 (10.8%) | 1,170 (13.8%) |
| $100,000+ | 3,037 (32.9%) | 2,070 (24.4%) |
| Total | 9,223 (100.0%) | 8,473 (100.0%) |
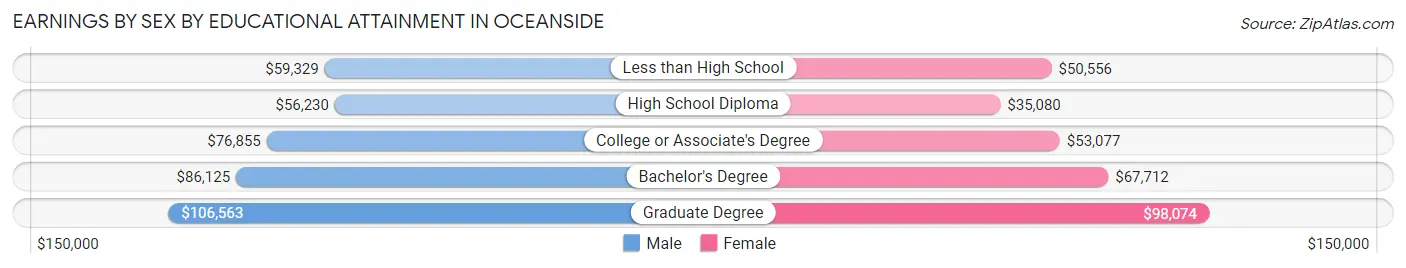
Earnings by Sex by Educational Attainment in Oceanside
Average earnings in Oceanside are $75,585 for men and $63,948 for women, a difference of 15.4%. Men with an educational attainment of graduate degree enjoy the highest average annual earnings of $106,563, while those with high school diploma education earn the least with $56,230. Women with an educational attainment of graduate degree earn the most with the average annual earnings of $98,074, while those with high school diploma education have the smallest earnings of $35,080.
| Educational Attainment | Male Income | Female Income |
| Less than High School | $59,329 | $50,556 |
| High School Diploma | $56,230 | $35,080 |
| College or Associate's Degree | $76,855 | $53,077 |
| Bachelor's Degree | $86,125 | $67,712 |
| Graduate Degree | $106,563 | $98,074 |
| Total | $75,585 | $63,948 |
Family Income in Oceanside
Family Income Brackets in Oceanside
According to the Oceanside family income data, there are 3,019 families falling into the $200,000+ income range, which is the most common income bracket and makes up 35.3% of all families.
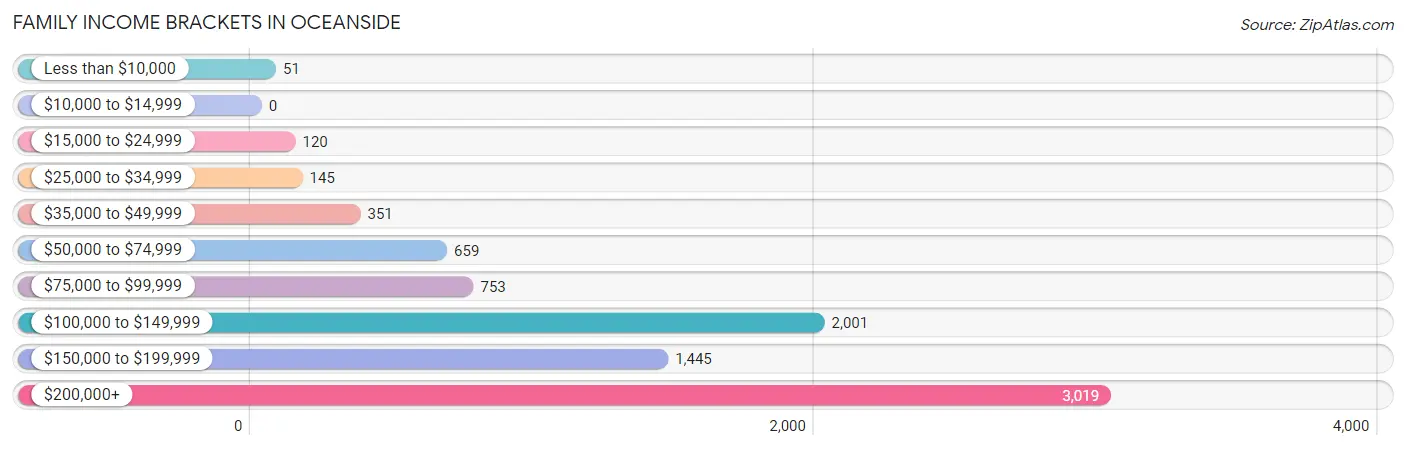
| Income Bracket | # Families | % Families |
| Less than $10,000 | 51 | 0.6% |
| $10,000 to $14,999 | 0 | 0.0% |
| $15,000 to $24,999 | 120 | 1.4% |
| $25,000 to $34,999 | 145 | 1.7% |
| $35,000 to $49,999 | 351 | 4.1% |
| $50,000 to $74,999 | 659 | 7.7% |
| $75,000 to $99,999 | 753 | 8.8% |
| $100,000 to $149,999 | 2,001 | 23.4% |
| $150,000 to $199,999 | 1,445 | 16.9% |
| $200,000+ | 3,019 | 35.3% |
Family Income by Famaliy Size in Oceanside
7+ person families (133 | 1.6%) account for the highest median family income in Oceanside with $250,001 per family, while 2-person families (3,360 | 39.3%) have the highest median income of $64,721 per family member.
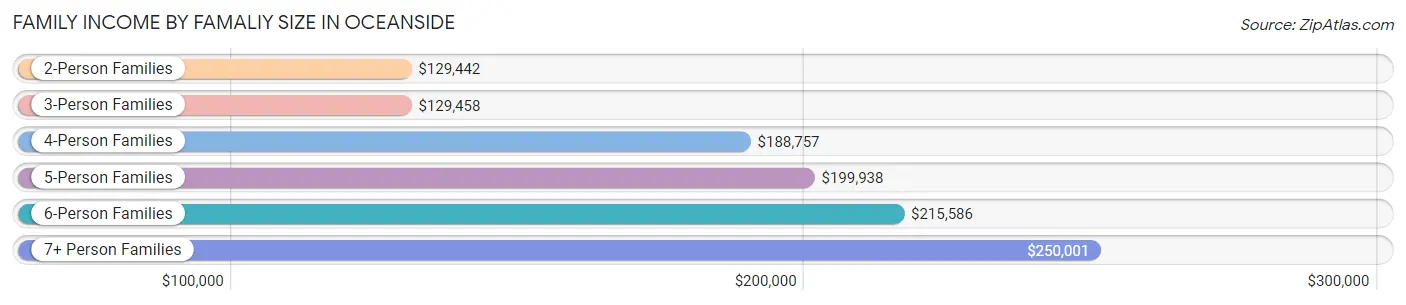
| Income Bracket | # Families | Median Income |
| 2-Person Families | 3,360 (39.3%) | $129,442 |
| 3-Person Families | 1,982 (23.2%) | $129,458 |
| 4-Person Families | 2,230 (26.1%) | $188,757 |
| 5-Person Families | 619 (7.2%) | $199,938 |
| 6-Person Families | 229 (2.7%) | $215,586 |
| 7+ Person Families | 133 (1.6%) | $250,001 |
| Total | 8,553 (100.0%) | $152,119 |
Family Income by Number of Earners in Oceanside
The median family income in Oceanside is $152,119, with families comprising 3+ earners (1,816) having the highest median family income of $213,000, while families with no earners (857) have the lowest median family income of $76,950, accounting for 21.2% and 10.0% of families, respectively.
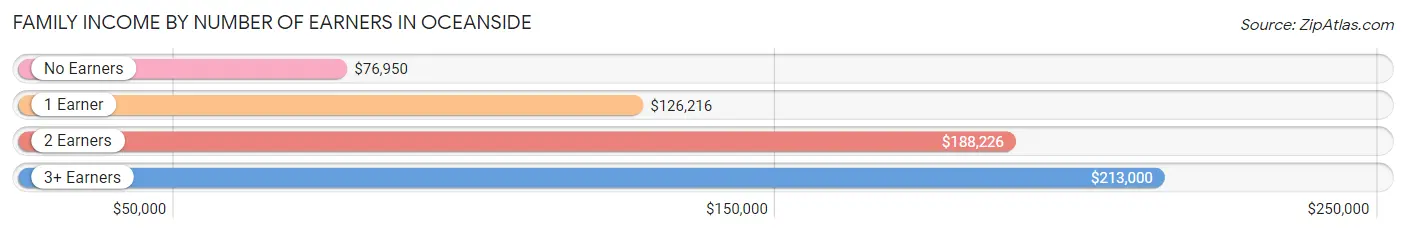
| Number of Earners | # Families | Median Income |
| No Earners | 857 (10.0%) | $76,950 |
| 1 Earner | 2,350 (27.5%) | $126,216 |
| 2 Earners | 3,530 (41.3%) | $188,226 |
| 3+ Earners | 1,816 (21.2%) | $213,000 |
| Total | 8,553 (100.0%) | $152,119 |
Household Income in Oceanside
Household Income Brackets in Oceanside
With 3,254 households falling in the category, the $200,000+ income range is the most frequent in Oceanside, accounting for 30.1% of all households. In contrast, only 76 households (0.7%) fall into the $10,000 to $14,999 income bracket, making it the least populous group.
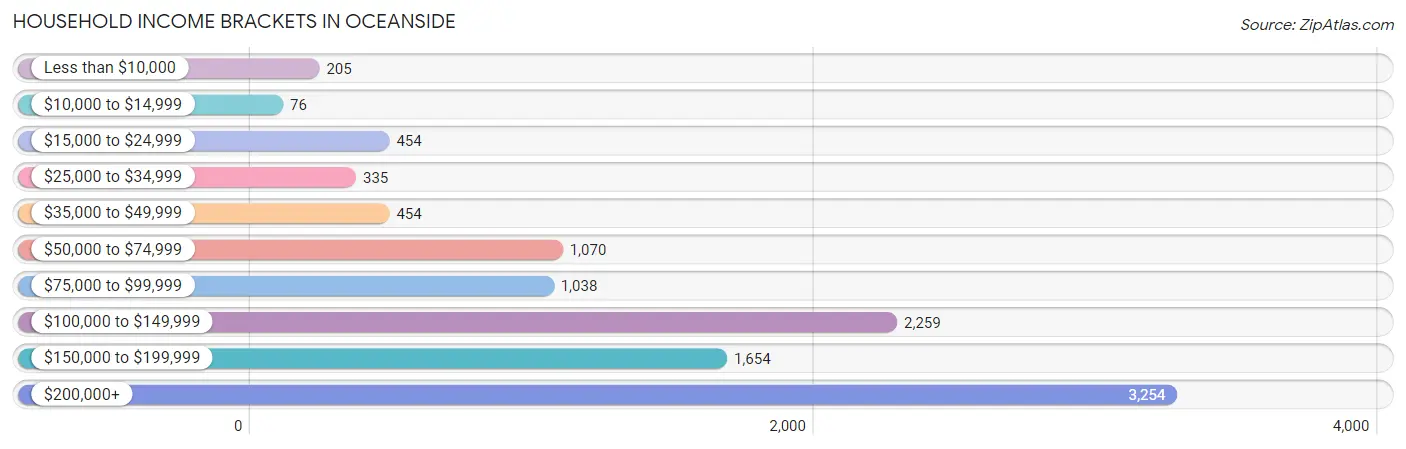
| Income Bracket | # Households | % Households |
| Less than $10,000 | 205 | 1.9% |
| $10,000 to $14,999 | 76 | 0.7% |
| $15,000 to $24,999 | 454 | 4.2% |
| $25,000 to $34,999 | 335 | 3.1% |
| $35,000 to $49,999 | 454 | 4.2% |
| $50,000 to $74,999 | 1,070 | 9.9% |
| $75,000 to $99,999 | 1,038 | 9.6% |
| $100,000 to $149,999 | 2,259 | 20.9% |
| $150,000 to $199,999 | 1,654 | 15.3% |
| $200,000+ | 3,254 | 30.1% |
Household Income by Householder Age in Oceanside
The median household income in Oceanside is $136,997, with the highest median household income of $187,672 found in the 25 to 44 years age bracket for the primary householder. A total of 2,132 households (19.7%) fall into this category. Meanwhile, the 65+ years age bracket for the primary householder has the lowest median household income of $100,179, with 3,954 households (36.6%) in this group.
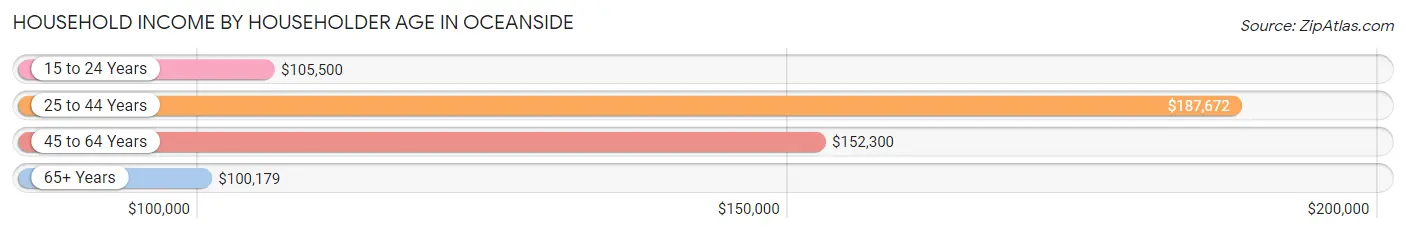
| Income Bracket | # Households | Median Income |
| 15 to 24 Years | 56 (0.5%) | $105,500 |
| 25 to 44 Years | 2,132 (19.7%) | $187,672 |
| 45 to 64 Years | 4,669 (43.2%) | $152,300 |
| 65+ Years | 3,954 (36.6%) | $100,179 |
| Total | 10,811 (100.0%) | $136,997 |
Poverty in Oceanside
Income Below Poverty by Sex and Age in Oceanside
With 2.9% poverty level for males and 3.5% for females among the residents of Oceanside, 15 year old males and 75 year old and over females are the most vulnerable to poverty, with 31 males (17.5%) and 118 females (7.9%) in their respective age groups living below the poverty level.
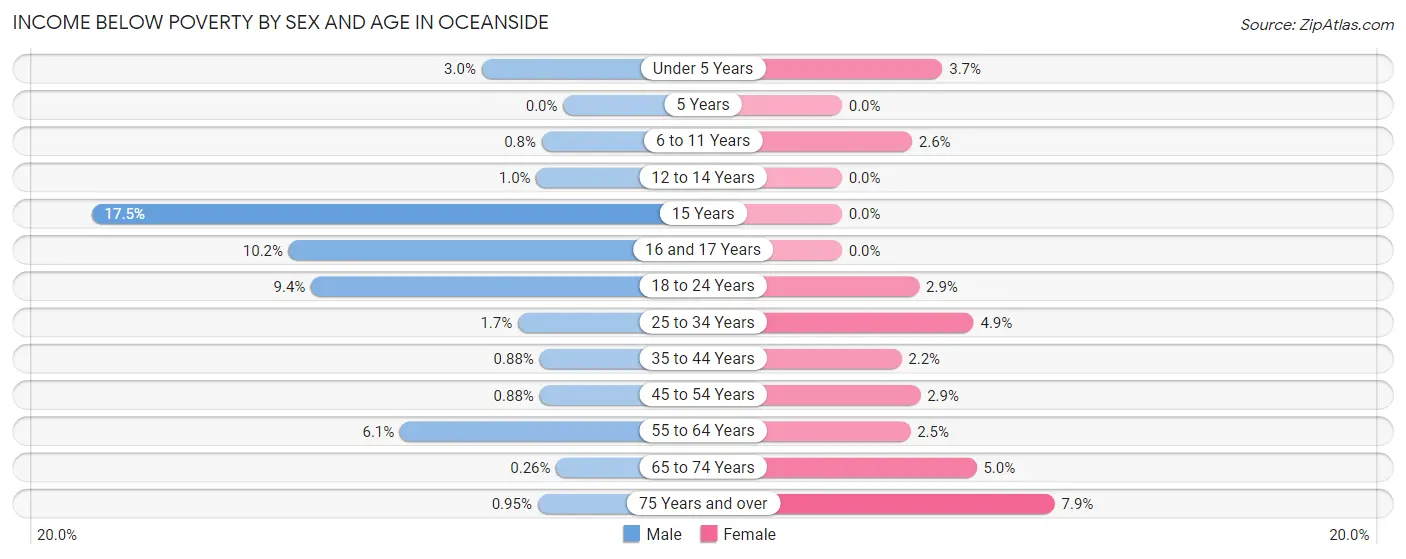
| Age Bracket | Male | Female |
| Under 5 Years | 19 (3.0%) | 24 (3.7%) |
| 5 Years | 0 (0.0%) | 0 (0.0%) |
| 6 to 11 Years | 9 (0.8%) | 25 (2.6%) |
| 12 to 14 Years | 9 (1.0%) | 0 (0.0%) |
| 15 Years | 31 (17.5%) | 0 (0.0%) |
| 16 and 17 Years | 63 (10.2%) | 0 (0.0%) |
| 18 to 24 Years | 122 (9.4%) | 28 (2.9%) |
| 25 to 34 Years | 31 (1.7%) | 67 (4.9%) |
| 35 to 44 Years | 15 (0.9%) | 40 (2.2%) |
| 45 to 54 Years | 21 (0.9%) | 69 (2.9%) |
| 55 to 64 Years | 128 (6.1%) | 60 (2.5%) |
| 65 to 74 Years | 5 (0.3%) | 99 (5.0%) |
| 75 Years and over | 12 (0.9%) | 118 (7.9%) |
| Total | 465 (2.9%) | 530 (3.5%) |
Income Above Poverty by Sex and Age in Oceanside
According to the poverty statistics in Oceanside, males aged 5 years and females aged 5 years are the age groups that are most secure financially, with 100.0% of males and 100.0% of females in these age groups living above the poverty line.
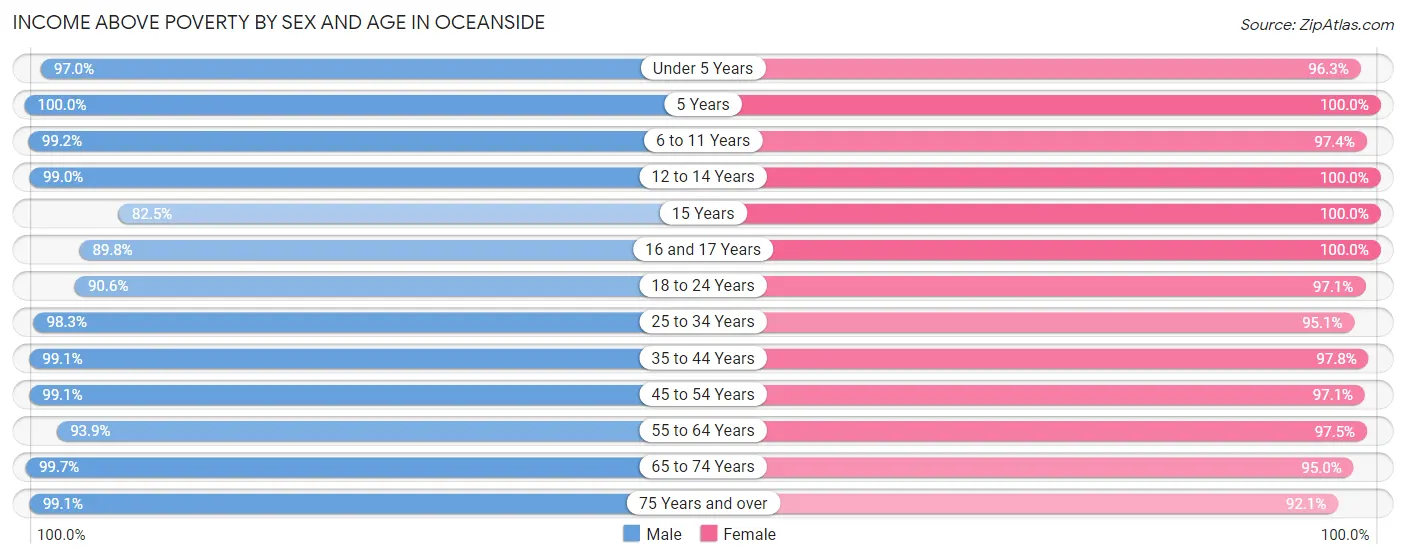
| Age Bracket | Male | Female |
| Under 5 Years | 609 (97.0%) | 620 (96.3%) |
| 5 Years | 117 (100.0%) | 233 (100.0%) |
| 6 to 11 Years | 1,110 (99.2%) | 935 (97.4%) |
| 12 to 14 Years | 891 (99.0%) | 437 (100.0%) |
| 15 Years | 146 (82.5%) | 72 (100.0%) |
| 16 and 17 Years | 555 (89.8%) | 350 (100.0%) |
| 18 to 24 Years | 1,182 (90.6%) | 946 (97.1%) |
| 25 to 34 Years | 1,816 (98.3%) | 1,304 (95.1%) |
| 35 to 44 Years | 1,694 (99.1%) | 1,766 (97.8%) |
| 45 to 54 Years | 2,373 (99.1%) | 2,303 (97.1%) |
| 55 to 64 Years | 1,984 (93.9%) | 2,301 (97.5%) |
| 65 to 74 Years | 1,936 (99.7%) | 1,880 (95.0%) |
| 75 Years and over | 1,255 (99.1%) | 1,376 (92.1%) |
| Total | 15,668 (97.1%) | 14,523 (96.5%) |
Income Below Poverty Among Married-Couple Families in Oceanside
The poverty statistics for married-couple families in Oceanside show that 1.5% or 105 of the total 7,245 families live below the poverty line. Families with 3 or 4 children have the highest poverty rate of 2.7%, comprising of 11 families. On the other hand, families with 5 or more children have the lowest poverty rate of 0.0%, which includes 0 families.
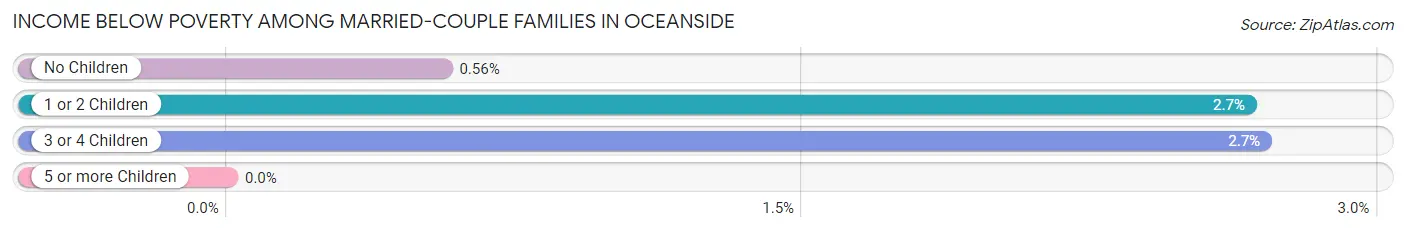
| Children | Above Poverty | Below Poverty |
| No Children | 4,098 (99.4%) | 23 (0.6%) |
| 1 or 2 Children | 2,601 (97.3%) | 71 (2.7%) |
| 3 or 4 Children | 397 (97.3%) | 11 (2.7%) |
| 5 or more Children | 44 (100.0%) | 0 (0.0%) |
| Total | 7,140 (98.6%) | 105 (1.5%) |
Income Below Poverty Among Single-Parent Households in Oceanside
According to the poverty data in Oceanside, 2.3% or 9 single-father households and 2.5% or 23 single-mother households are living below the poverty line. Among single-father households, those with no children have the highest poverty rate, with 9 households (4.4%) experiencing poverty. Likewise, among single-mother households, those with 1 or 2 children have the highest poverty rate, with 23 households (11.5%) falling below the poverty line.
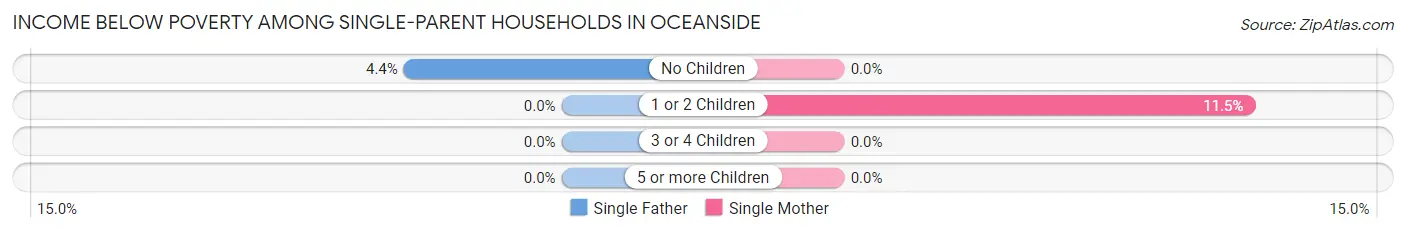
| Children | Single Father | Single Mother |
| No Children | 9 (4.4%) | 0 (0.0%) |
| 1 or 2 Children | 0 (0.0%) | 23 (11.5%) |
| 3 or 4 Children | 0 (0.0%) | 0 (0.0%) |
| 5 or more Children | 0 (0.0%) | 0 (0.0%) |
| Total | 9 (2.3%) | 23 (2.5%) |
Income Below Poverty Among Married-Couple vs Single-Parent Households in Oceanside
The poverty data for Oceanside shows that 105 of the married-couple family households (1.5%) and 32 of the single-parent households (2.5%) are living below the poverty level. Within the married-couple family households, those with 3 or 4 children have the highest poverty rate, with 11 households (2.7%) falling below the poverty line. Among the single-parent households, those with 1 or 2 children have the highest poverty rate, with 23 household (5.9%) living below poverty.
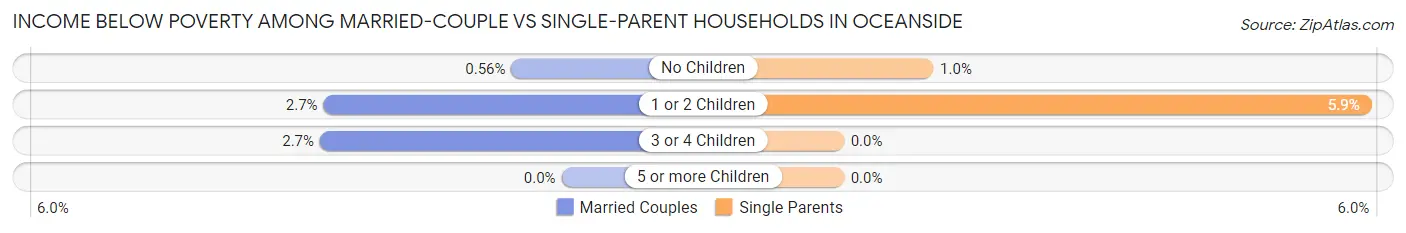
| Children | Married-Couple Families | Single-Parent Households |
| No Children | 23 (0.6%) | 9 (1.0%) |
| 1 or 2 Children | 71 (2.7%) | 23 (5.9%) |
| 3 or 4 Children | 11 (2.7%) | 0 (0.0%) |
| 5 or more Children | 0 (0.0%) | 0 (0.0%) |
| Total | 105 (1.5%) | 32 (2.5%) |
Race in Oceanside
The most populous races in Oceanside are White / Caucasian (26,462 | 84.0%), Hispanic or Latino (4,932 | 15.7%), and Two or more Races (2,327 | 7.4%).
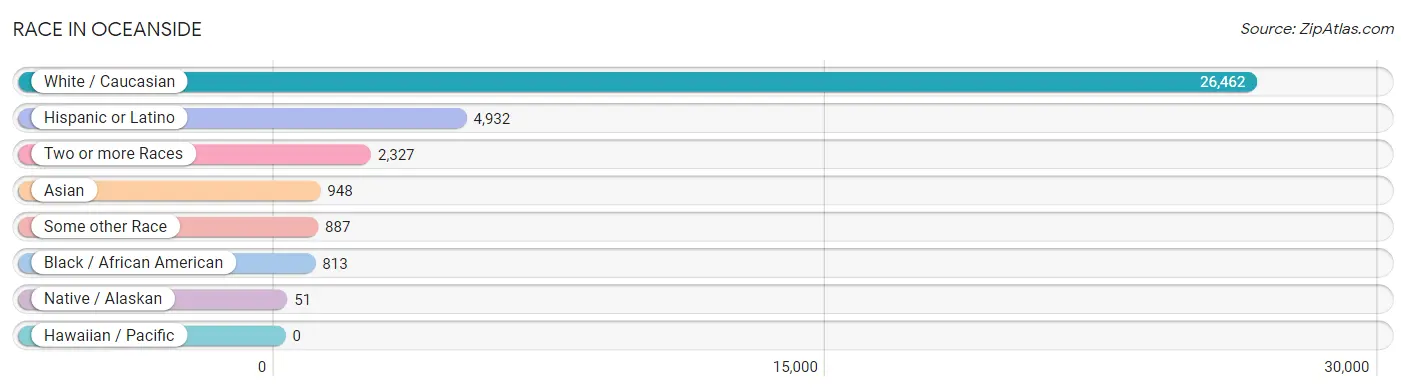
| Race | # Population | % Population |
| Asian | 948 | 3.0% |
| Black / African American | 813 | 2.6% |
| Hawaiian / Pacific | 0 | 0.0% |
| Hispanic or Latino | 4,932 | 15.7% |
| Native / Alaskan | 51 | 0.2% |
| White / Caucasian | 26,462 | 84.0% |
| Two or more Races | 2,327 | 7.4% |
| Some other Race | 887 | 2.8% |
| Total | 31,488 | 100.0% |
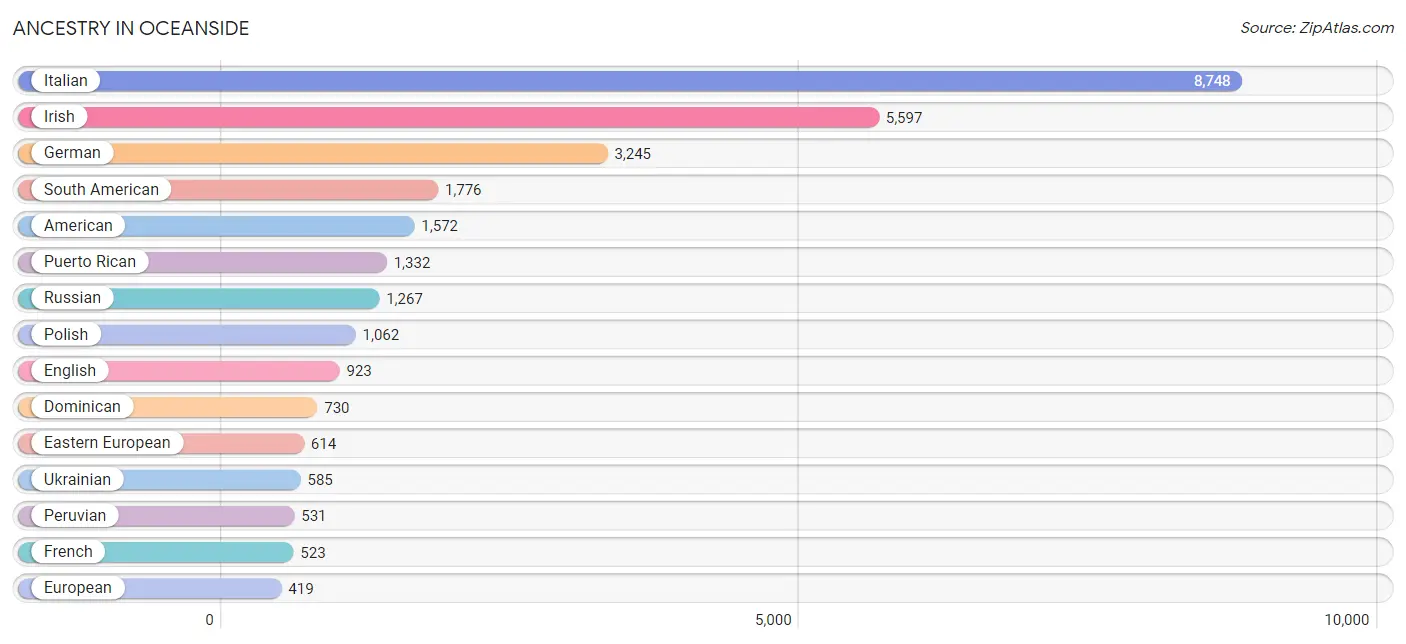
Ancestry in Oceanside
The most populous ancestries reported in Oceanside are Italian (8,748 | 27.8%), Irish (5,597 | 17.8%), German (3,245 | 10.3%), South American (1,776 | 5.6%), and American (1,572 | 5.0%), together accounting for 66.5% of all Oceanside residents.
| Ancestry | # Population | % Population |
| African | 149 | 0.5% |
| Albanian | 135 | 0.4% |
| American | 1,572 | 5.0% |
| Arab | 191 | 0.6% |
| Argentinean | 113 | 0.4% |
| Armenian | 52 | 0.2% |
| Australian | 10 | 0.0% |
| Austrian | 184 | 0.6% |
| Belgian | 13 | 0.0% |
| Bermudan | 10 | 0.0% |
| Blackfeet | 17 | 0.1% |
| Bolivian | 116 | 0.4% |
| British | 48 | 0.2% |
| British West Indian | 28 | 0.1% |
| Burmese | 56 | 0.2% |
| Canadian | 19 | 0.1% |
| Central American | 175 | 0.6% |
| Central American Indian | 15 | 0.1% |
| Cherokee | 11 | 0.0% |
| Chilean | 366 | 1.2% |
| Colombian | 413 | 1.3% |
| Croatian | 76 | 0.2% |
| Cuban | 260 | 0.8% |
| Cypriot | 60 | 0.2% |
| Czech | 43 | 0.1% |
| Danish | 6 | 0.0% |
| Dominican | 730 | 2.3% |
| Dutch | 90 | 0.3% |
| Eastern European | 614 | 1.9% |
| Ecuadorian | 234 | 0.7% |
| English | 923 | 2.9% |
| European | 419 | 1.3% |
| French | 523 | 1.7% |
| French Canadian | 27 | 0.1% |
| German | 3,245 | 10.3% |
| Greek | 302 | 1.0% |
| Guatemalan | 34 | 0.1% |
| Haitian | 62 | 0.2% |
| Hungarian | 109 | 0.4% |
| Indian (Asian) | 403 | 1.3% |
| Irish | 5,597 | 17.8% |
| Iroquois | 65 | 0.2% |
| Israeli | 80 | 0.3% |
| Italian | 8,748 | 27.8% |
| Jamaican | 186 | 0.6% |
| Jordanian | 22 | 0.1% |
| Korean | 330 | 1.1% |
| Lebanese | 43 | 0.1% |
| Lithuanian | 49 | 0.2% |
| Maltese | 13 | 0.0% |
| Mexican | 94 | 0.3% |
| Mexican American Indian | 62 | 0.2% |
| Moroccan | 36 | 0.1% |
| Nicaraguan | 10 | 0.0% |
| Nigerian | 5 | 0.0% |
| Norwegian | 273 | 0.9% |
| Panamanian | 37 | 0.1% |
| Peruvian | 531 | 1.7% |
| Polish | 1,062 | 3.4% |
| Portuguese | 62 | 0.2% |
| Puerto Rican | 1,332 | 4.2% |
| Romanian | 165 | 0.5% |
| Russian | 1,267 | 4.0% |
| Salvadoran | 94 | 0.3% |
| Scandinavian | 8 | 0.0% |
| Scotch-Irish | 194 | 0.6% |
| Scottish | 171 | 0.5% |
| Slavic | 42 | 0.1% |
| Slovak | 49 | 0.2% |
| Slovene | 11 | 0.0% |
| South American | 1,776 | 5.6% |
| South American Indian | 20 | 0.1% |
| Spaniard | 157 | 0.5% |
| Spanish | 369 | 1.2% |
| Subsaharan African | 154 | 0.5% |
| Swedish | 85 | 0.3% |
| Swiss | 63 | 0.2% |
| Syrian | 90 | 0.3% |
| Thai | 199 | 0.6% |
| Trinidadian and Tobagonian | 8 | 0.0% |
| Turkish | 186 | 0.6% |
| Ukrainian | 585 | 1.9% |
| Venezuelan | 3 | 0.0% |
| Vietnamese | 20 | 0.1% |
| Welsh | 29 | 0.1% |
| West Indian | 105 | 0.3% | View All 86 Rows |
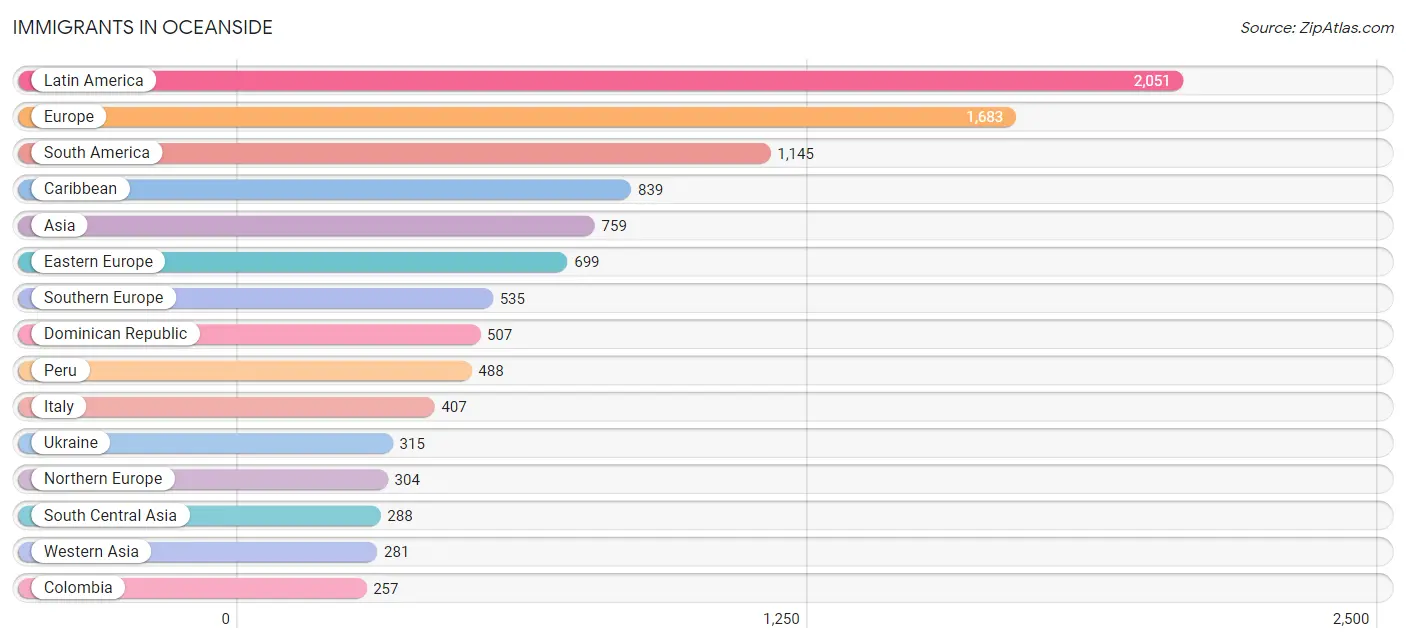
Immigrants in Oceanside
The most numerous immigrant groups reported in Oceanside came from Latin America (2,051 | 6.5%), Europe (1,683 | 5.3%), South America (1,145 | 3.6%), Caribbean (839 | 2.7%), and Asia (759 | 2.4%), together accounting for 20.6% of all Oceanside residents.
| Immigration Origin | # Population | % Population |
| Africa | 41 | 0.1% |
| Albania | 61 | 0.2% |
| Argentina | 113 | 0.4% |
| Asia | 759 | 2.4% |
| Australia | 10 | 0.0% |
| Austria | 15 | 0.1% |
| Bangladesh | 9 | 0.0% |
| Barbados | 4 | 0.0% |
| Belarus | 23 | 0.1% |
| Belgium | 13 | 0.0% |
| Bolivia | 60 | 0.2% |
| Bulgaria | 5 | 0.0% |
| Canada | 54 | 0.2% |
| Caribbean | 839 | 2.7% |
| Central America | 67 | 0.2% |
| Chile | 131 | 0.4% |
| China | 44 | 0.1% |
| Colombia | 257 | 0.8% |
| Cuba | 49 | 0.2% |
| Czechoslovakia | 31 | 0.1% |
| Dominican Republic | 507 | 1.6% |
| Eastern Asia | 44 | 0.1% |
| Eastern Europe | 699 | 2.2% |
| Ecuador | 35 | 0.1% |
| El Salvador | 44 | 0.1% |
| England | 19 | 0.1% |
| Europe | 1,683 | 5.3% |
| Germany | 117 | 0.4% |
| Greece | 86 | 0.3% |
| Guyana | 47 | 0.2% |
| Haiti | 58 | 0.2% |
| Hungary | 22 | 0.1% |
| India | 122 | 0.4% |
| Iran | 20 | 0.1% |
| Ireland | 238 | 0.8% |
| Israel | 92 | 0.3% |
| Italy | 407 | 1.3% |
| Jamaica | 210 | 0.7% |
| Jordan | 22 | 0.1% |
| Latin America | 2,051 | 6.5% |
| Latvia | 9 | 0.0% |
| Lebanon | 43 | 0.1% |
| Morocco | 36 | 0.1% |
| Nicaragua | 10 | 0.0% |
| Nigeria | 5 | 0.0% |
| Northern Africa | 36 | 0.1% |
| Northern Europe | 304 | 1.0% |
| Oceania | 10 | 0.0% |
| Pakistan | 98 | 0.3% |
| Panama | 13 | 0.0% |
| Peru | 488 | 1.5% |
| Philippines | 146 | 0.5% |
| Poland | 98 | 0.3% |
| Romania | 32 | 0.1% |
| Russia | 59 | 0.2% |
| Scotland | 23 | 0.1% |
| South America | 1,145 | 3.6% |
| South Central Asia | 288 | 0.9% |
| South Eastern Asia | 146 | 0.5% |
| Southern Europe | 535 | 1.7% |
| Spain | 34 | 0.1% |
| Trinidad and Tobago | 11 | 0.0% |
| Turkey | 72 | 0.2% |
| Ukraine | 315 | 1.0% |
| Uzbekistan | 29 | 0.1% |
| Venezuela | 3 | 0.0% |
| Western Africa | 5 | 0.0% |
| Western Asia | 281 | 0.9% |
| Western Europe | 145 | 0.5% | View All 69 Rows |
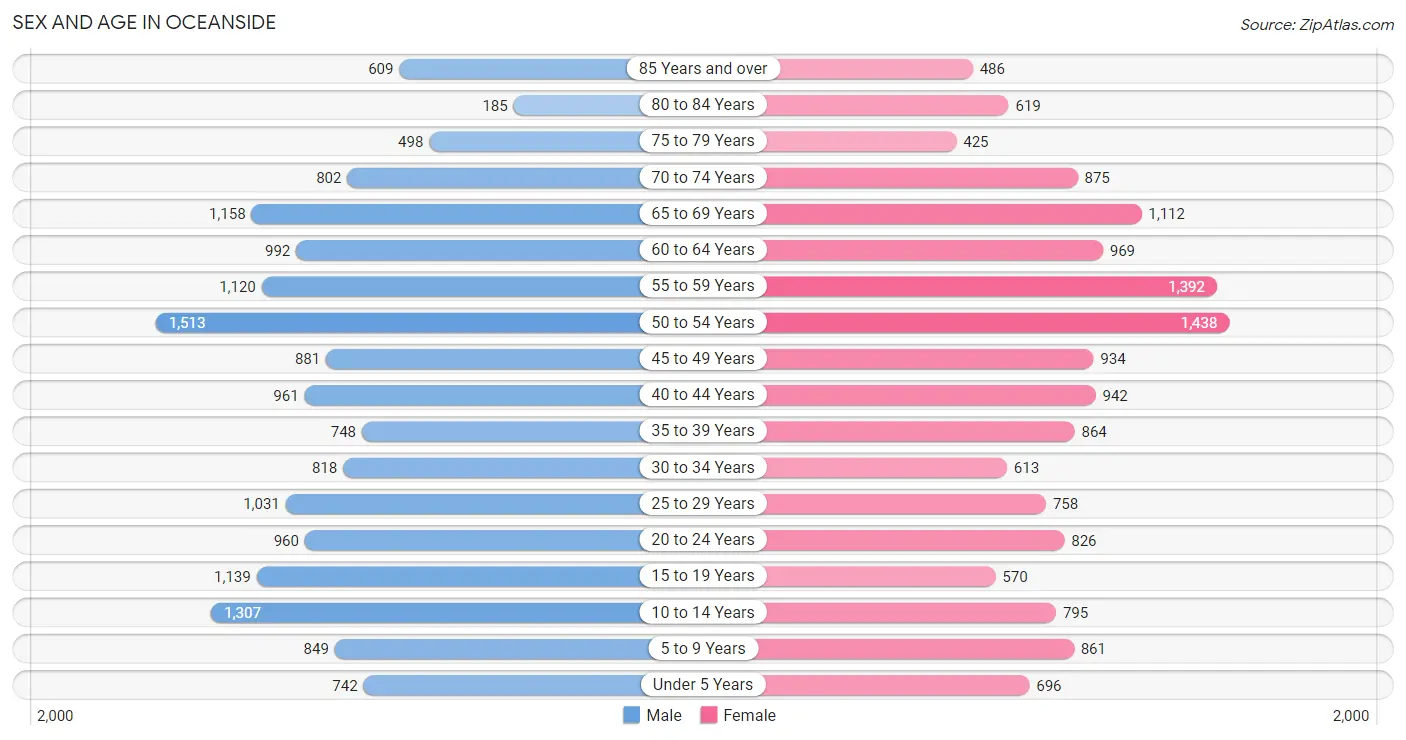
Sex and Age in Oceanside
Sex and Age in Oceanside
The most populous age groups in Oceanside are 50 to 54 Years (1,513 | 9.3%) for men and 50 to 54 Years (1,438 | 9.5%) for women.
| Age Bracket | Male | Female |
| Under 5 Years | 742 (4.5%) | 696 (4.6%) |
| 5 to 9 Years | 849 (5.2%) | 861 (5.7%) |
| 10 to 14 Years | 1,307 (8.0%) | 795 (5.2%) |
| 15 to 19 Years | 1,139 (7.0%) | 570 (3.8%) |
| 20 to 24 Years | 960 (5.9%) | 826 (5.4%) |
| 25 to 29 Years | 1,031 (6.3%) | 758 (5.0%) |
| 30 to 34 Years | 818 (5.0%) | 613 (4.0%) |
| 35 to 39 Years | 748 (4.6%) | 864 (5.7%) |
| 40 to 44 Years | 961 (5.9%) | 942 (6.2%) |
| 45 to 49 Years | 881 (5.4%) | 934 (6.1%) |
| 50 to 54 Years | 1,513 (9.3%) | 1,438 (9.5%) |
| 55 to 59 Years | 1,120 (6.9%) | 1,392 (9.2%) |
| 60 to 64 Years | 992 (6.1%) | 969 (6.4%) |
| 65 to 69 Years | 1,158 (7.1%) | 1,112 (7.3%) |
| 70 to 74 Years | 802 (4.9%) | 875 (5.8%) |
| 75 to 79 Years | 498 (3.0%) | 425 (2.8%) |
| 80 to 84 Years | 185 (1.1%) | 619 (4.1%) |
| 85 Years and over | 609 (3.7%) | 486 (3.2%) |
| Total | 16,313 (100.0%) | 15,175 (100.0%) |
Families and Households in Oceanside
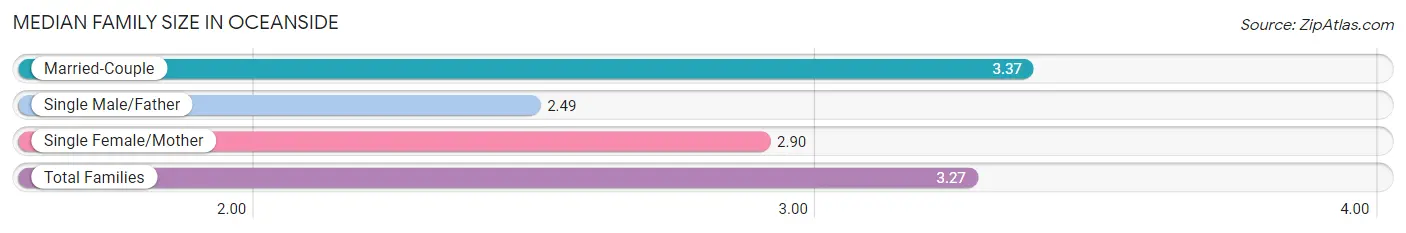
Median Family Size in Oceanside
The median family size in Oceanside is 3.27 persons per family, with married-couple families (7,245 | 84.7%) accounting for the largest median family size of 3.37 persons per family. On the other hand, single male/father families (394 | 4.6%) represent the smallest median family size with 2.49 persons per family.
| Family Type | # Families | Family Size |
| Married-Couple | 7,245 (84.7%) | 3.37 |
| Single Male/Father | 394 (4.6%) | 2.49 |
| Single Female/Mother | 914 (10.7%) | 2.90 |
| Total Families | 8,553 (100.0%) | 3.27 |
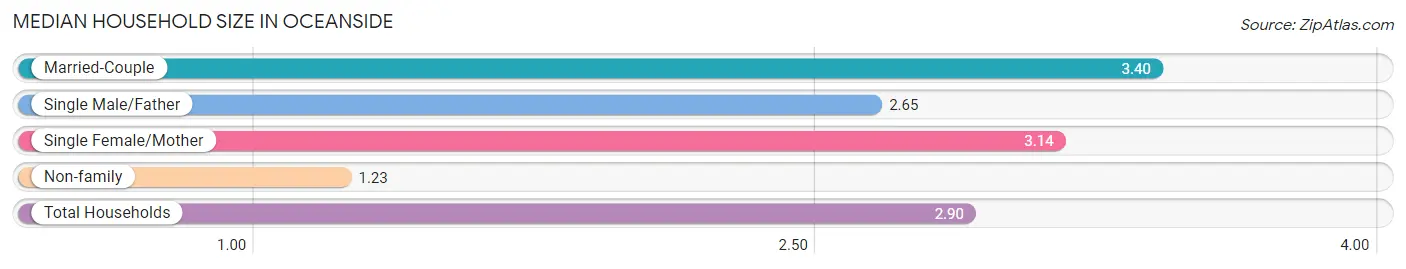
Median Household Size in Oceanside
The median household size in Oceanside is 2.90 persons per household, with married-couple households (7,245 | 67.0%) accounting for the largest median household size of 3.4 persons per household. non-family households (2,258 | 20.9%) represent the smallest median household size with 1.23 persons per household.
| Household Type | # Households | Household Size |
| Married-Couple | 7,245 (67.0%) | 3.40 |
| Single Male/Father | 394 (3.6%) | 2.65 |
| Single Female/Mother | 914 (8.5%) | 3.14 |
| Non-family | 2,258 (20.9%) | 1.23 |
| Total Households | 10,811 (100.0%) | 2.90 |
Household Size by Marriage Status in Oceanside
Out of a total of 10,811 households in Oceanside, 8,553 (79.1%) are family households, while 2,258 (20.9%) are nonfamily households. The most numerous type of family households are 2-person households, comprising 3,167, and the most common type of nonfamily households are 1-person households, comprising 1,960.
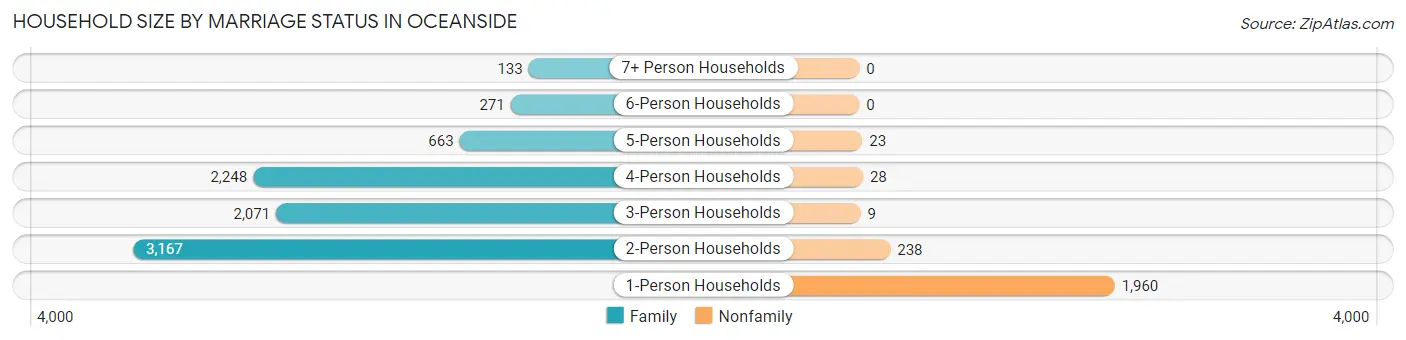
| Household Size | Family Households | Nonfamily Households |
| 1-Person Households | - | 1,960 (18.1%) |
| 2-Person Households | 3,167 (29.3%) | 238 (2.2%) |
| 3-Person Households | 2,071 (19.2%) | 9 (0.1%) |
| 4-Person Households | 2,248 (20.8%) | 28 (0.3%) |
| 5-Person Households | 663 (6.1%) | 23 (0.2%) |
| 6-Person Households | 271 (2.5%) | 0 (0.0%) |
| 7+ Person Households | 133 (1.2%) | 0 (0.0%) |
| Total | 8,553 (79.1%) | 2,258 (20.9%) |
Female Fertility in Oceanside
Fertility by Age in Oceanside
Average fertility rate in Oceanside is 50.0 births per 1,000 women. Women in the age bracket of 20 to 34 years have the highest fertility rate with 86.0 births per 1,000 women. Women in the age bracket of 20 to 34 years acount for 64.3% of all women with births.
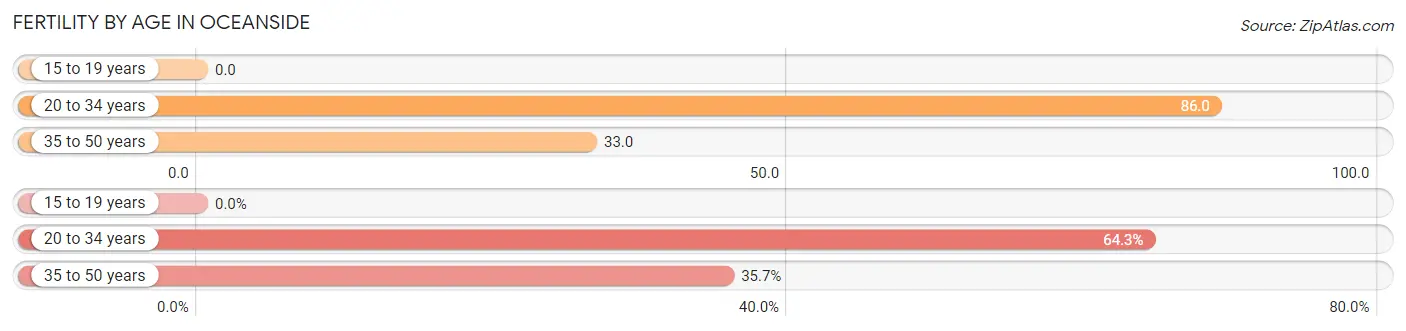
| Age Bracket | Women with Births | Births / 1,000 Women |
| 15 to 19 years | 0 (0.0%) | 0.0 |
| 20 to 34 years | 189 (64.3%) | 86.0 |
| 35 to 50 years | 105 (35.7%) | 33.0 |
| Total | 294 (100.0%) | 50.0 |
Fertility by Age by Marriage Status in Oceanside
87.8% of women with births (294) in Oceanside are married. The highest percentage of unmarried women with births falls into 20 to 34 years age bracket with 19.1% of them unmarried at the time of birth, while the lowest percentage of unmarried women with births belong to 35 to 50 years age bracket with 0.0% of them unmarried.
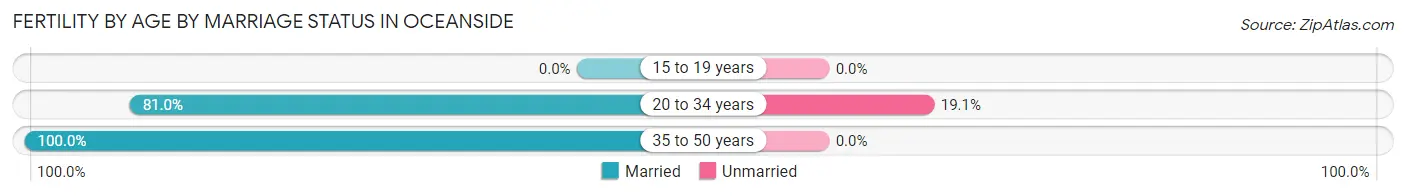
| Age Bracket | Married | Unmarried |
| 15 to 19 years | 0 (0.0%) | 0 (0.0%) |
| 20 to 34 years | 153 (80.9%) | 36 (19.1%) |
| 35 to 50 years | 105 (100.0%) | 0 (0.0%) |
| Total | 258 (87.8%) | 36 (12.2%) |
Fertility by Education in Oceanside
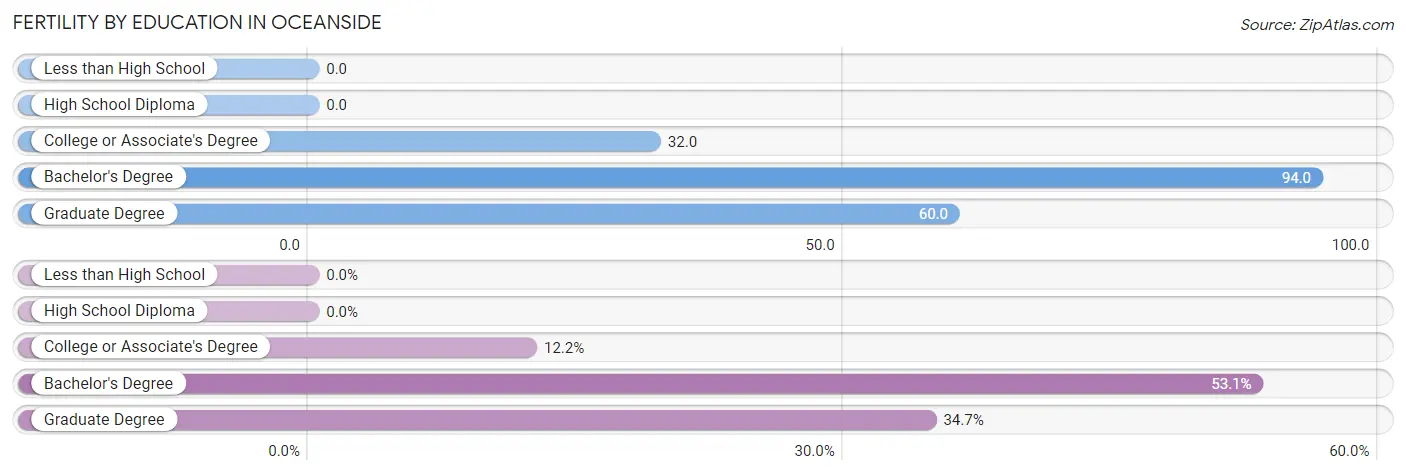
| Educational Attainment | Women with Births | Births / 1,000 Women |
| Less than High School | 0 (0.0%) | 0.0 |
| High School Diploma | 0 (0.0%) | 0.0 |
| College or Associate's Degree | 36 (12.2%) | 32.0 |
| Bachelor's Degree | 156 (53.1%) | 94.0 |
| Graduate Degree | 102 (34.7%) | 60.0 |
| Total | 294 (100.0%) | 50.0 |
Fertility by Education by Marriage Status in Oceanside
12.2% of women with births in Oceanside are unmarried. Women with the educational attainment of graduate degree are most likely to be married with 100.0% of them married at childbirth, while women with the educational attainment of college or associate's degree are least likely to be married with 61.1% of them unmarried at childbirth.
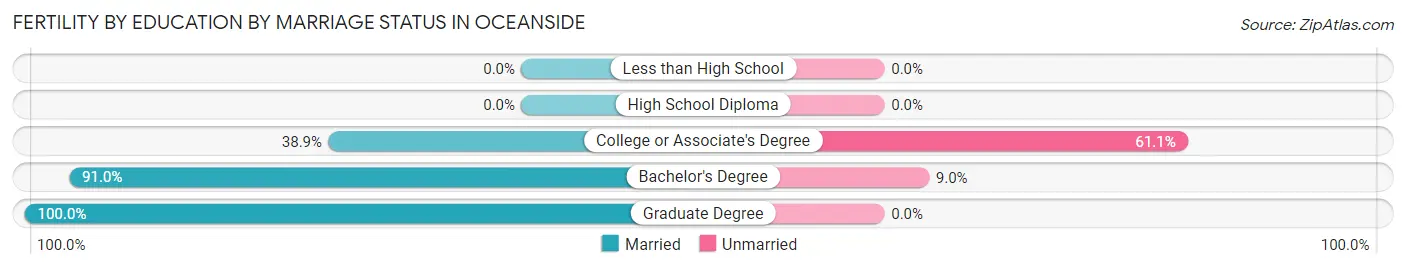
| Educational Attainment | Married | Unmarried |
| Less than High School | 0 (0.0%) | 0 (0.0%) |
| High School Diploma | 0 (0.0%) | 0 (0.0%) |
| College or Associate's Degree | 14 (38.9%) | 22 (61.1%) |
| Bachelor's Degree | 142 (91.0%) | 14 (9.0%) |
| Graduate Degree | 102 (100.0%) | 0 (0.0%) |
| Total | 258 (87.8%) | 36 (12.2%) |
Employment Characteristics in Oceanside
Employment by Class of Employer in Oceanside
Among the 16,151 employed individuals in Oceanside, private company employees (9,172 | 56.8%), local government employees (2,582 | 16.0%), and not-for-profit organizations (1,826 | 11.3%) make up the most common classes of employment.
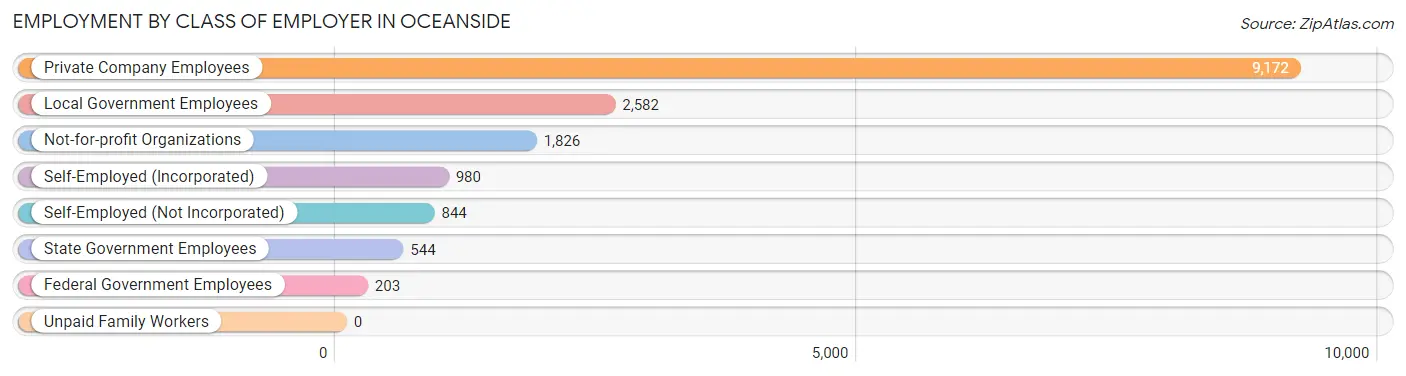
| Employer Class | # Employees | % Employees |
| Private Company Employees | 9,172 | 56.8% |
| Self-Employed (Incorporated) | 980 | 6.1% |
| Self-Employed (Not Incorporated) | 844 | 5.2% |
| Not-for-profit Organizations | 1,826 | 11.3% |
| Local Government Employees | 2,582 | 16.0% |
| State Government Employees | 544 | 3.4% |
| Federal Government Employees | 203 | 1.3% |
| Unpaid Family Workers | 0 | 0.0% |
| Total | 16,151 | 100.0% |
Employment Status by Age in Oceanside
According to the labor force statistics for Oceanside, out of the total population over 16 years of age (25,989), 67.1% or 17,439 individuals are in the labor force, with 5.9% or 1,029 of them unemployed. The age group with the highest labor force participation rate is 45 to 54 years, with 91.5% or 4,361 individuals in the labor force. Within the labor force, the 16 to 19 years age range has the highest percentage of unemployed individuals, with 21.1% or 135 of them being unemployed.
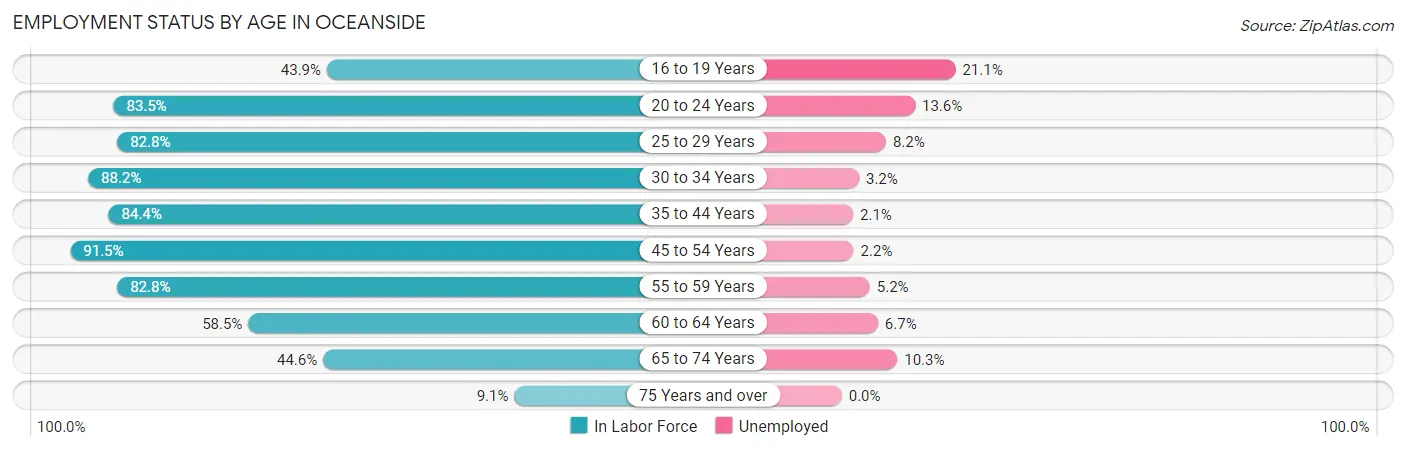
| Age Bracket | In Labor Force | Unemployed |
| 16 to 19 Years | 641 (43.9%) | 135 (21.1%) |
| 20 to 24 Years | 1,491 (83.5%) | 203 (13.6%) |
| 25 to 29 Years | 1,481 (82.8%) | 121 (8.2%) |
| 30 to 34 Years | 1,262 (88.2%) | 40 (3.2%) |
| 35 to 44 Years | 2,967 (84.4%) | 62 (2.1%) |
| 45 to 54 Years | 4,361 (91.5%) | 96 (2.2%) |
| 55 to 59 Years | 2,080 (82.8%) | 108 (5.2%) |
| 60 to 64 Years | 1,147 (58.5%) | 77 (6.7%) |
| 65 to 74 Years | 1,760 (44.6%) | 181 (10.3%) |
| 75 Years and over | 257 (9.1%) | 0 (0.0%) |
| Total | 17,439 (67.1%) | 1,029 (5.9%) |
Employment Status by Educational Attainment in Oceanside
According to labor force statistics for Oceanside, 83.3% of individuals (13,306) out of the total population between 25 and 64 years of age (15,974) are in the labor force, with 3.8% or 506 of them being unemployed. The group with the highest labor force participation rate are those with the educational attainment of bachelor's degree or higher, with 89.0% or 7,396 individuals in the labor force. Within the labor force, individuals with high school diploma education have the highest percentage of unemployment, with 7.3% or 180 of them being unemployed.
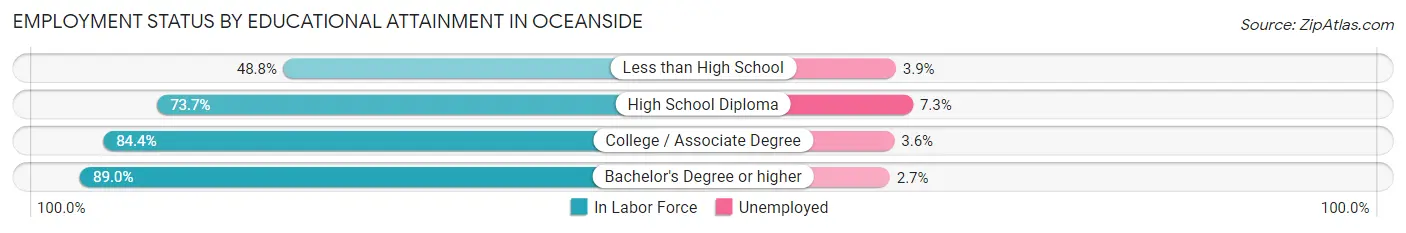
| Educational Attainment | In Labor Force | Unemployed |
| Less than High School | 281 (48.8%) | 22 (3.9%) |
| High School Diploma | 2,472 (73.7%) | 245 (7.3%) |
| College / Associate Degree | 3,151 (84.4%) | 134 (3.6%) |
| Bachelor's Degree or higher | 7,396 (89.0%) | 224 (2.7%) |
| Total | 13,306 (83.3%) | 607 (3.8%) |
Employment Occupations by Sex in Oceanside
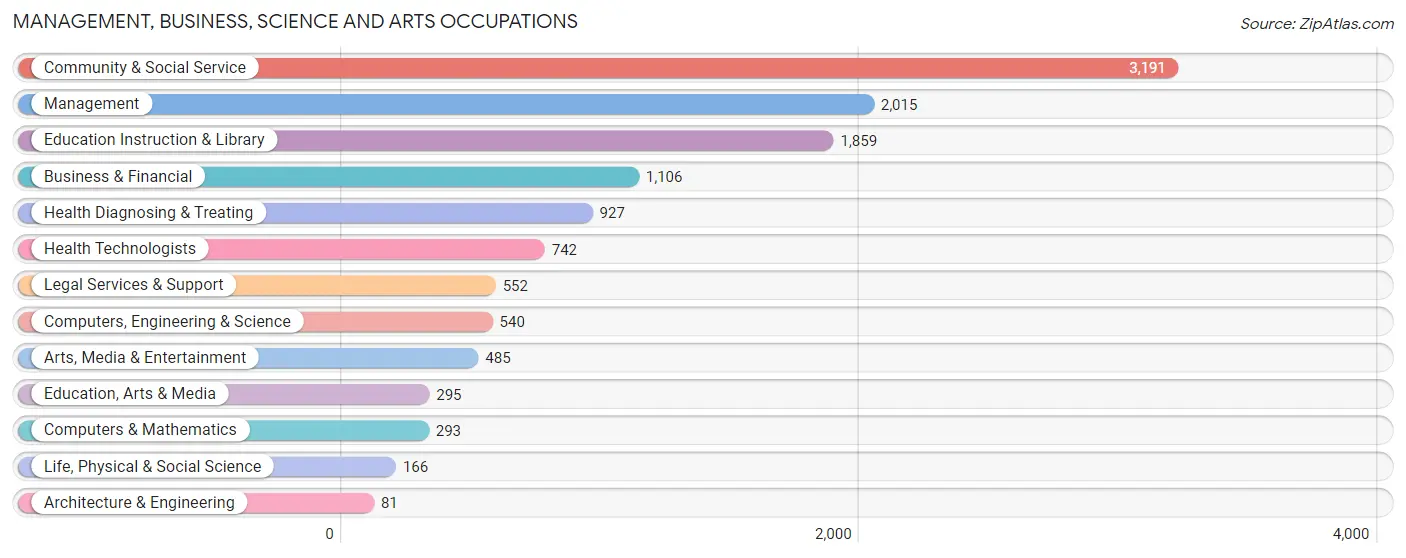
Management, Business, Science and Arts Occupations
The most common Management, Business, Science and Arts occupations in Oceanside are Community & Social Service (3,191 | 19.4%), Management (2,015 | 12.3%), Education Instruction & Library (1,859 | 11.3%), Business & Financial (1,106 | 6.7%), and Health Diagnosing & Treating (927 | 5.7%).
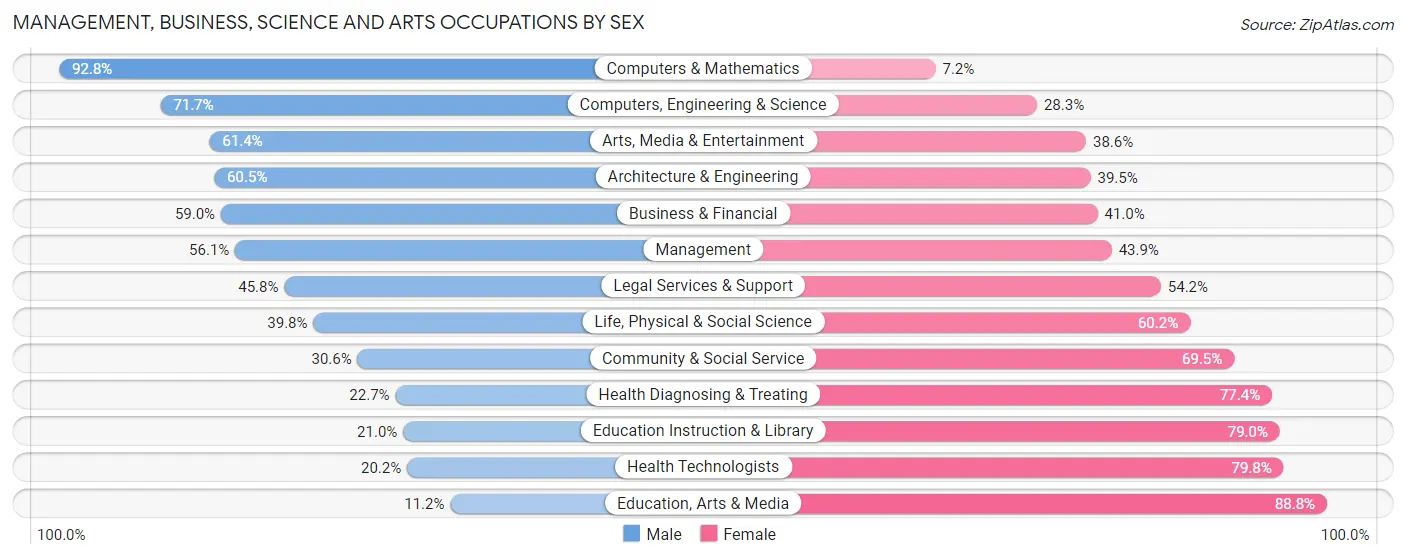
Management, Business, Science and Arts Occupations by Sex
Within the Management, Business, Science and Arts occupations in Oceanside, the most male-oriented occupations are Computers & Mathematics (92.8%), Computers, Engineering & Science (71.7%), and Arts, Media & Entertainment (61.4%), while the most female-oriented occupations are Education, Arts & Media (88.8%), Health Technologists (79.8%), and Education Instruction & Library (79.0%).
| Occupation | Male | Female |
| Management | 1,130 (56.1%) | 885 (43.9%) |
| Business & Financial | 653 (59.0%) | 453 (41.0%) |
| Computers, Engineering & Science | 387 (71.7%) | 153 (28.3%) |
| Computers & Mathematics | 272 (92.8%) | 21 (7.2%) |
| Architecture & Engineering | 49 (60.5%) | 32 (39.5%) |
| Life, Physical & Social Science | 66 (39.8%) | 100 (60.2%) |
| Community & Social Service | 975 (30.5%) | 2,216 (69.5%) |
| Education, Arts & Media | 33 (11.2%) | 262 (88.8%) |
| Legal Services & Support | 253 (45.8%) | 299 (54.2%) |
| Education Instruction & Library | 391 (21.0%) | 1,468 (79.0%) |
| Arts, Media & Entertainment | 298 (61.4%) | 187 (38.6%) |
| Health Diagnosing & Treating | 210 (22.7%) | 717 (77.3%) |
| Health Technologists | 150 (20.2%) | 592 (79.8%) |
| Total (Category) | 3,355 (43.1%) | 4,424 (56.9%) |
| Total (Overall) | 8,520 (51.9%) | 7,899 (48.1%) |
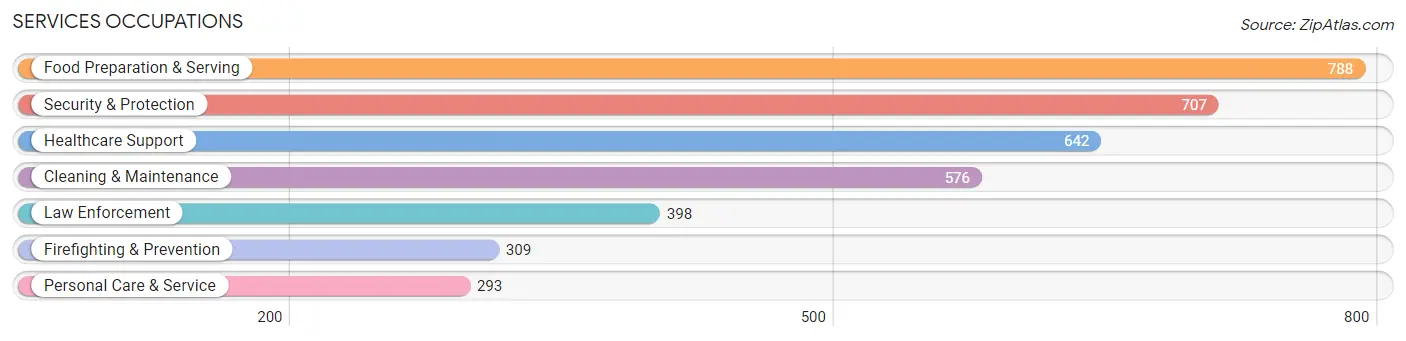
Services Occupations
The most common Services occupations in Oceanside are Food Preparation & Serving (788 | 4.8%), Security & Protection (707 | 4.3%), Healthcare Support (642 | 3.9%), Cleaning & Maintenance (576 | 3.5%), and Law Enforcement (398 | 2.4%).
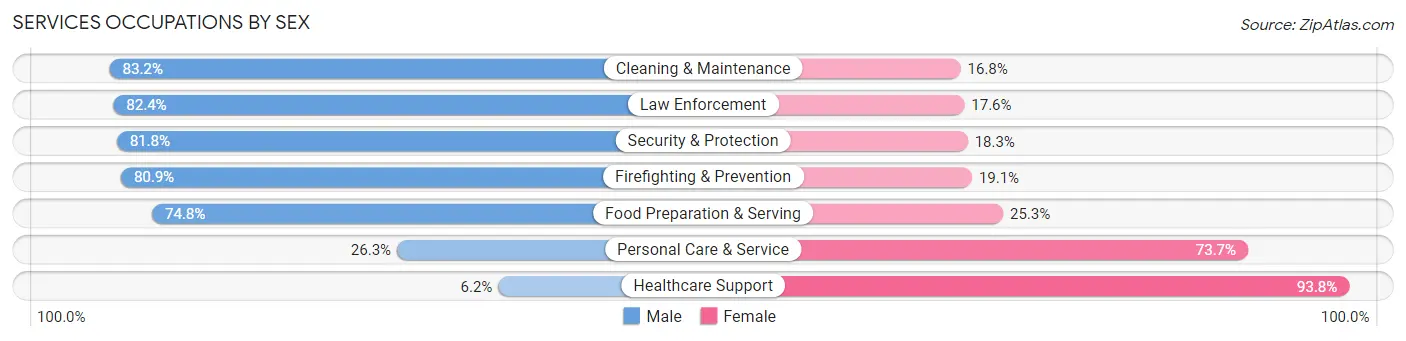
Services Occupations by Sex
Within the Services occupations in Oceanside, the most male-oriented occupations are Cleaning & Maintenance (83.2%), Law Enforcement (82.4%), and Security & Protection (81.8%), while the most female-oriented occupations are Healthcare Support (93.8%), Personal Care & Service (73.7%), and Food Preparation & Serving (25.3%).
| Occupation | Male | Female |
| Healthcare Support | 40 (6.2%) | 602 (93.8%) |
| Security & Protection | 578 (81.8%) | 129 (18.2%) |
| Firefighting & Prevention | 250 (80.9%) | 59 (19.1%) |
| Law Enforcement | 328 (82.4%) | 70 (17.6%) |
| Food Preparation & Serving | 589 (74.8%) | 199 (25.3%) |
| Cleaning & Maintenance | 479 (83.2%) | 97 (16.8%) |
| Personal Care & Service | 77 (26.3%) | 216 (73.7%) |
| Total (Category) | 1,763 (58.7%) | 1,243 (41.3%) |
| Total (Overall) | 8,520 (51.9%) | 7,899 (48.1%) |
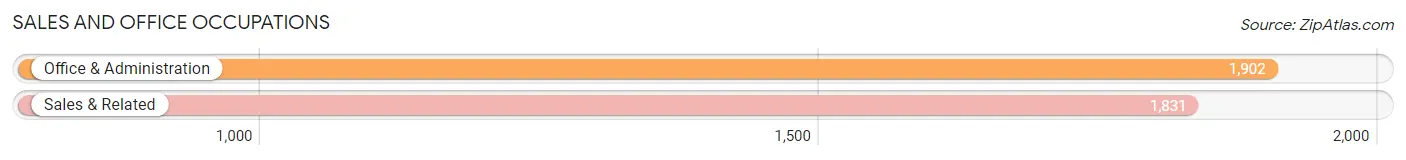
Sales and Office Occupations
The most common Sales and Office occupations in Oceanside are Office & Administration (1,902 | 11.6%), and Sales & Related (1,831 | 11.2%).
Sales and Office Occupations by Sex
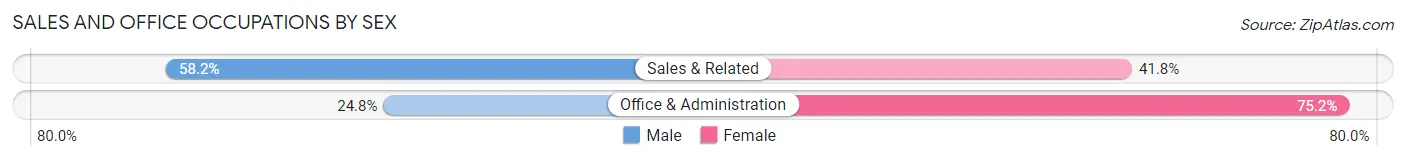
| Occupation | Male | Female |
| Sales & Related | 1,066 (58.2%) | 765 (41.8%) |
| Office & Administration | 472 (24.8%) | 1,430 (75.2%) |
| Total (Category) | 1,538 (41.2%) | 2,195 (58.8%) |
| Total (Overall) | 8,520 (51.9%) | 7,899 (48.1%) |
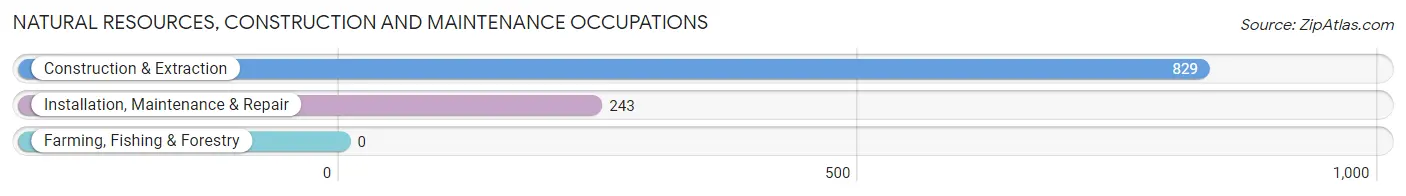
Natural Resources, Construction and Maintenance Occupations
The most common Natural Resources, Construction and Maintenance occupations in Oceanside are Construction & Extraction (829 | 5.1%), and Installation, Maintenance & Repair (243 | 1.5%).
Natural Resources, Construction and Maintenance Occupations by Sex
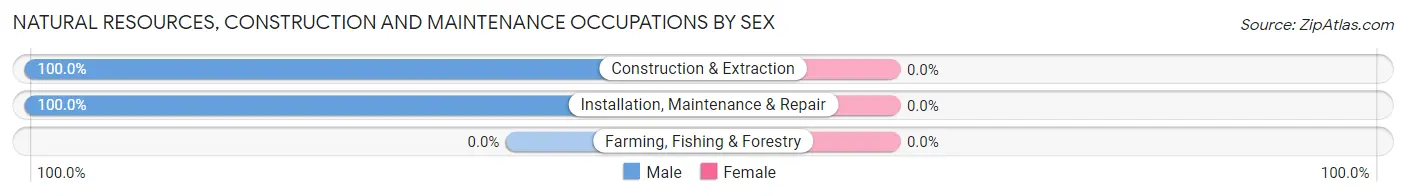
| Occupation | Male | Female |
| Farming, Fishing & Forestry | 0 (0.0%) | 0 (0.0%) |
| Construction & Extraction | 829 (100.0%) | 0 (0.0%) |
| Installation, Maintenance & Repair | 243 (100.0%) | 0 (0.0%) |
| Total (Category) | 1,072 (100.0%) | 0 (0.0%) |
| Total (Overall) | 8,520 (51.9%) | 7,899 (48.1%) |
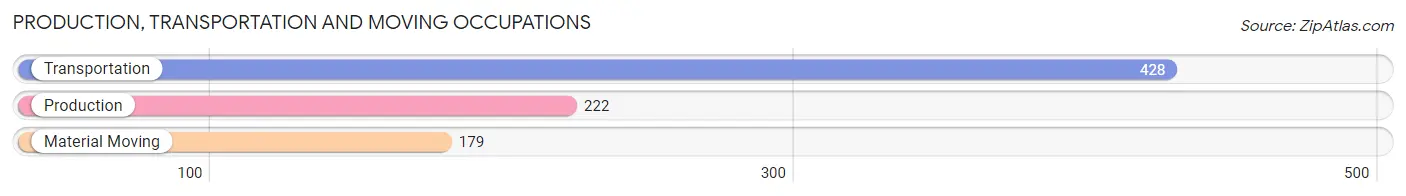
Production, Transportation and Moving Occupations
The most common Production, Transportation and Moving occupations in Oceanside are Transportation (428 | 2.6%), Production (222 | 1.3%), and Material Moving (179 | 1.1%).
Production, Transportation and Moving Occupations by Sex
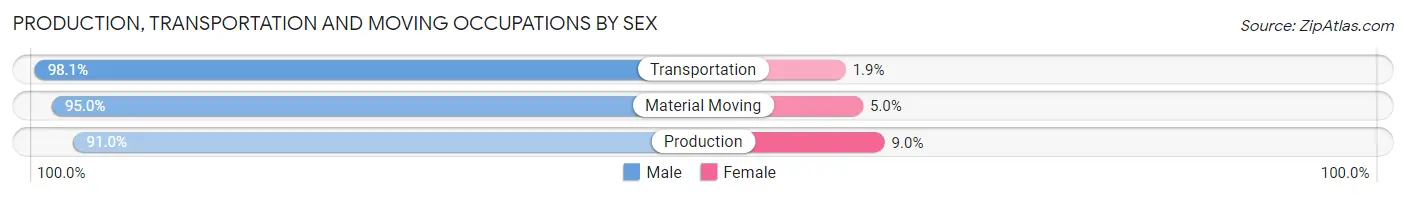
| Occupation | Male | Female |
| Production | 202 (91.0%) | 20 (9.0%) |
| Transportation | 420 (98.1%) | 8 (1.9%) |
| Material Moving | 170 (95.0%) | 9 (5.0%) |
| Total (Category) | 792 (95.5%) | 37 (4.5%) |
| Total (Overall) | 8,520 (51.9%) | 7,899 (48.1%) |
Employment Industries by Sex in Oceanside
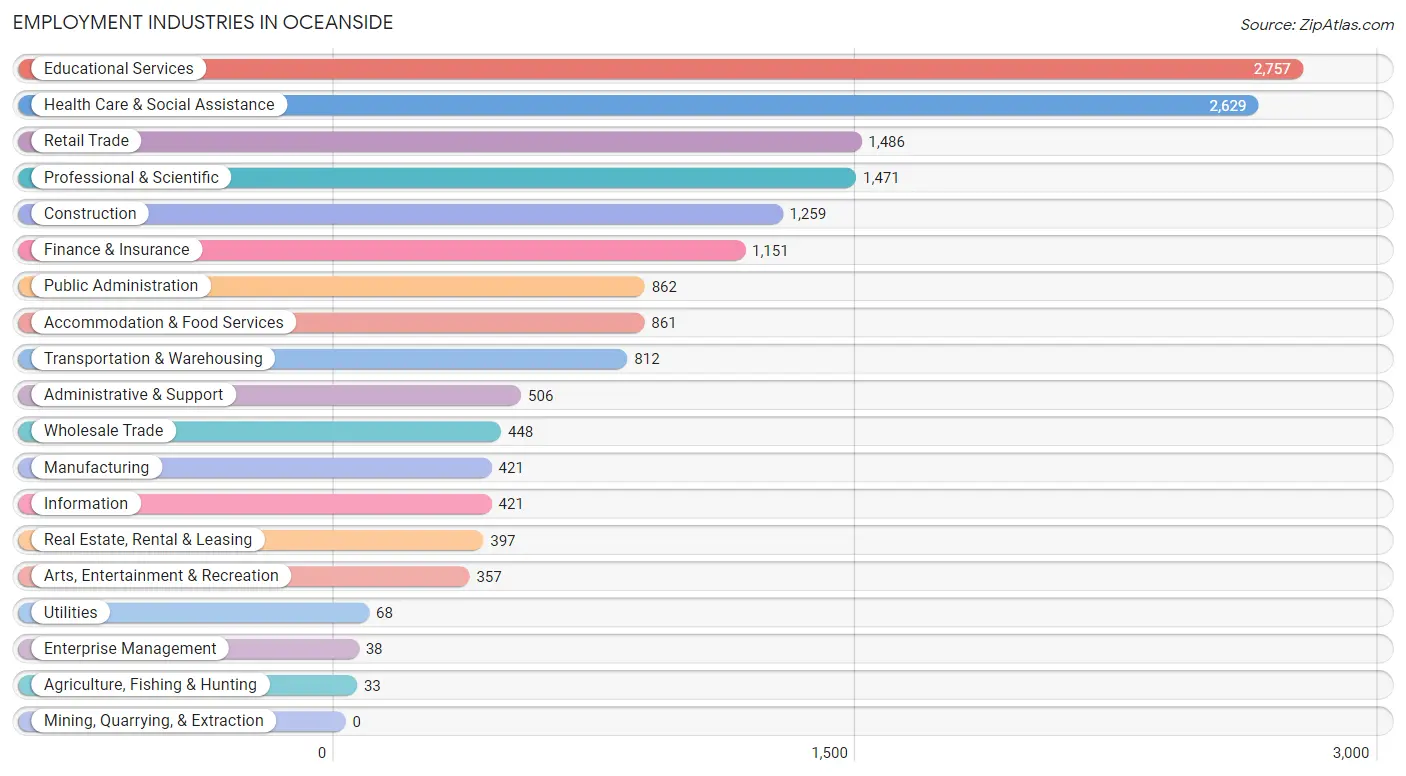
Employment Industries in Oceanside
The major employment industries in Oceanside include Educational Services (2,757 | 16.8%), Health Care & Social Assistance (2,629 | 16.0%), Retail Trade (1,486 | 9.0%), Professional & Scientific (1,471 | 9.0%), and Construction (1,259 | 7.7%).
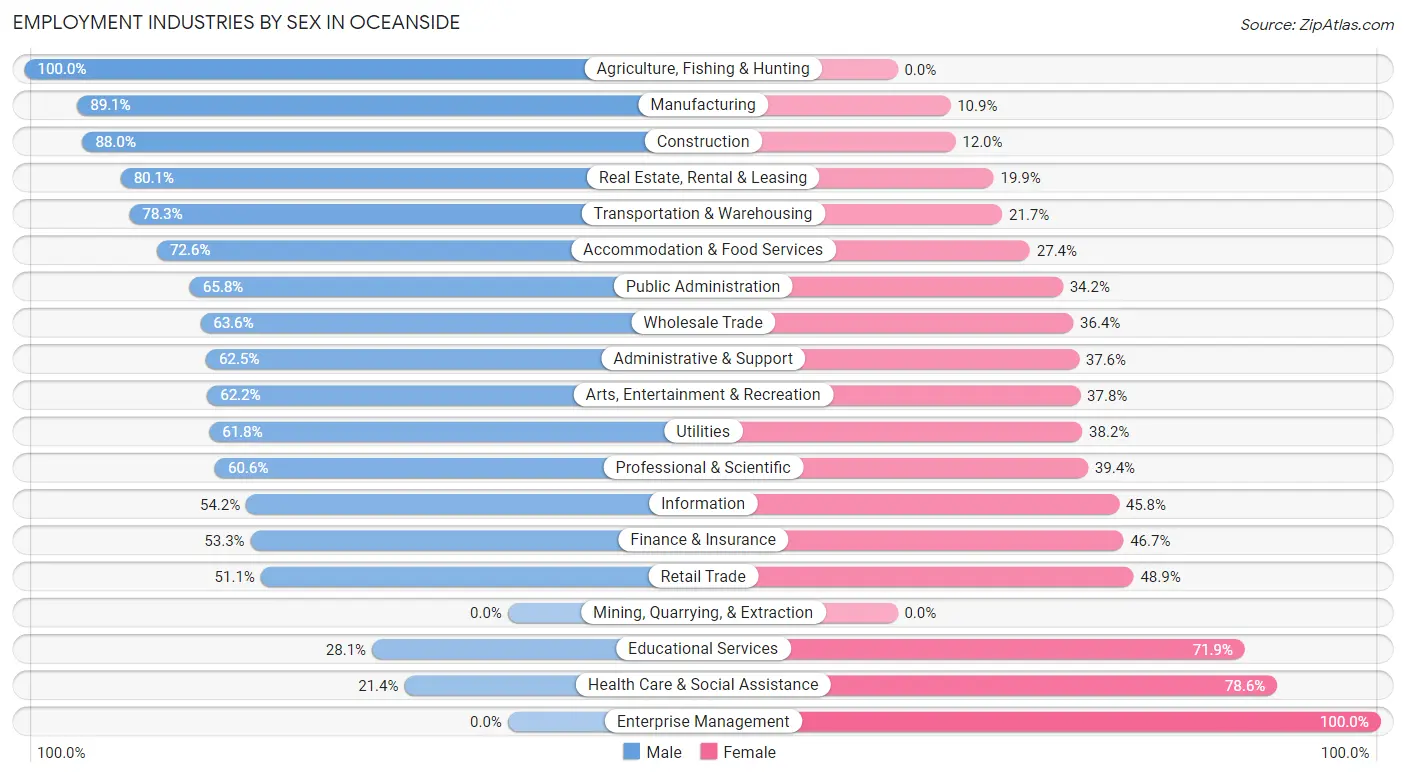
Employment Industries by Sex in Oceanside
The Oceanside industries that see more men than women are Agriculture, Fishing & Hunting (100.0%), Manufacturing (89.1%), and Construction (88.0%), whereas the industries that tend to have a higher number of women are Enterprise Management (100.0%), Health Care & Social Assistance (78.6%), and Educational Services (71.9%).
| Industry | Male | Female |
| Agriculture, Fishing & Hunting | 33 (100.0%) | 0 (0.0%) |
| Mining, Quarrying, & Extraction | 0 (0.0%) | 0 (0.0%) |
| Construction | 1,108 (88.0%) | 151 (12.0%) |
| Manufacturing | 375 (89.1%) | 46 (10.9%) |
| Wholesale Trade | 285 (63.6%) | 163 (36.4%) |
| Retail Trade | 760 (51.1%) | 726 (48.9%) |
| Transportation & Warehousing | 636 (78.3%) | 176 (21.7%) |
| Utilities | 42 (61.8%) | 26 (38.2%) |
| Information | 228 (54.2%) | 193 (45.8%) |
| Finance & Insurance | 613 (53.3%) | 538 (46.7%) |
| Real Estate, Rental & Leasing | 318 (80.1%) | 79 (19.9%) |
| Professional & Scientific | 891 (60.6%) | 580 (39.4%) |
| Enterprise Management | 0 (0.0%) | 38 (100.0%) |
| Administrative & Support | 316 (62.5%) | 190 (37.6%) |
| Educational Services | 775 (28.1%) | 1,982 (71.9%) |
| Health Care & Social Assistance | 563 (21.4%) | 2,066 (78.6%) |
| Arts, Entertainment & Recreation | 222 (62.2%) | 135 (37.8%) |
| Accommodation & Food Services | 625 (72.6%) | 236 (27.4%) |
| Public Administration | 567 (65.8%) | 295 (34.2%) |
| Total | 8,520 (51.9%) | 7,899 (48.1%) |
Education in Oceanside
School Enrollment in Oceanside
The most common levels of schooling among the 7,018 students in Oceanside are high school (1,909 | 27.2%), middle school (1,533 | 21.8%), and elementary school (1,329 | 18.9%).
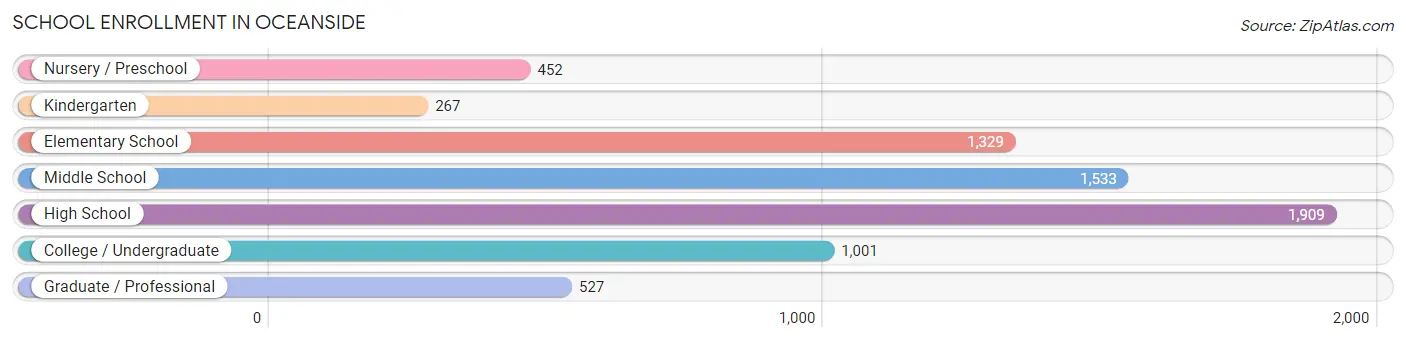
| School Level | # Students | % Students |
| Nursery / Preschool | 452 | 6.4% |
| Kindergarten | 267 | 3.8% |
| Elementary School | 1,329 | 18.9% |
| Middle School | 1,533 | 21.8% |
| High School | 1,909 | 27.2% |
| College / Undergraduate | 1,001 | 14.3% |
| Graduate / Professional | 527 | 7.5% |
| Total | 7,018 | 100.0% |
School Enrollment by Age by Funding Source in Oceanside
Out of a total of 7,018 students who are enrolled in schools in Oceanside, 1,319 (18.8%) attend a private institution, while the remaining 5,699 (81.2%) are enrolled in public schools. The age group of 25 to 34 year olds has the highest likelihood of being enrolled in private schools, with 232 (74.6% in the age bracket) enrolled. Conversely, the age group of 15 to 17 year olds has the lowest likelihood of being enrolled in a private school, with 1,187 (97.5% in the age bracket) attending a public institution.
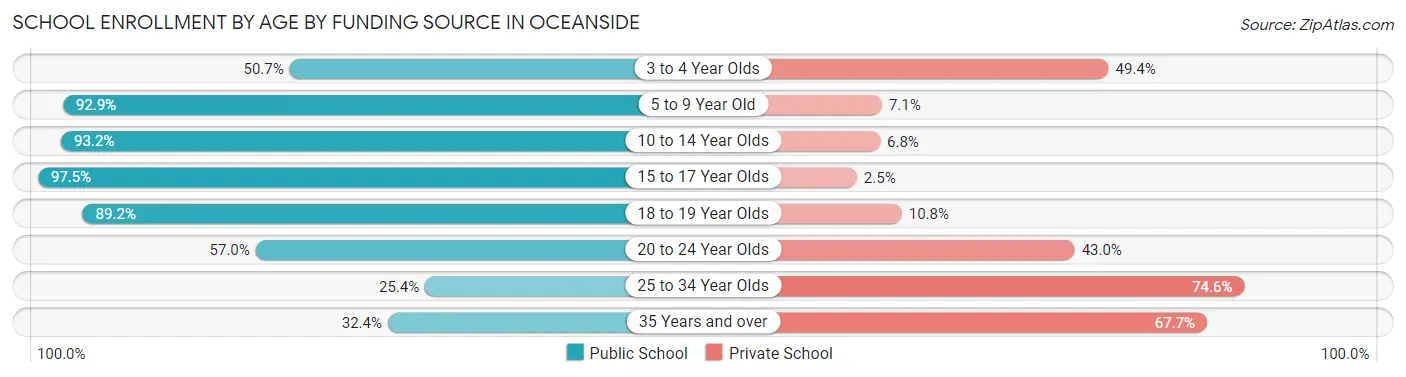
| Age Bracket | Public School | Private School |
| 3 to 4 Year Olds | 195 (50.6%) | 190 (49.3%) |
| 5 to 9 Year Old | 1,495 (92.9%) | 115 (7.1%) |
| 10 to 14 Year Olds | 1,907 (93.2%) | 139 (6.8%) |
| 15 to 17 Year Olds | 1,187 (97.5%) | 30 (2.5%) |
| 18 to 19 Year Olds | 346 (89.2%) | 42 (10.8%) |
| 20 to 24 Year Olds | 335 (57.0%) | 253 (43.0%) |
| 25 to 34 Year Olds | 79 (25.4%) | 232 (74.6%) |
| 35 Years and over | 153 (32.4%) | 320 (67.6%) |
| Total | 5,699 (81.2%) | 1,319 (18.8%) |
Educational Attainment by Field of Study in Oceanside
Business (2,535 | 22.1%), education (1,862 | 16.2%), social sciences (975 | 8.5%), psychology (886 | 7.7%), and science & technology (800 | 7.0%) are the most common fields of study among 11,472 individuals in Oceanside who have obtained a bachelor's degree or higher.
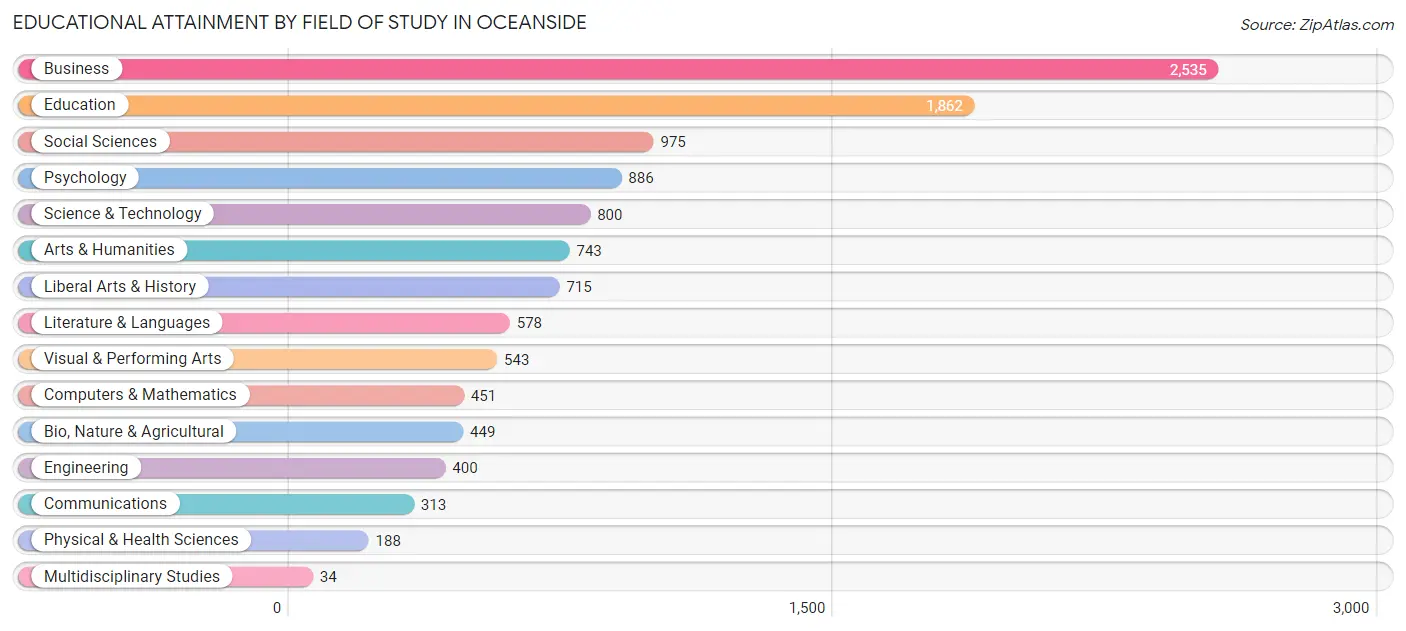
| Field of Study | # Graduates | % Graduates |
| Computers & Mathematics | 451 | 3.9% |
| Bio, Nature & Agricultural | 449 | 3.9% |
| Physical & Health Sciences | 188 | 1.6% |
| Psychology | 886 | 7.7% |
| Social Sciences | 975 | 8.5% |
| Engineering | 400 | 3.5% |
| Multidisciplinary Studies | 34 | 0.3% |
| Science & Technology | 800 | 7.0% |
| Business | 2,535 | 22.1% |
| Education | 1,862 | 16.2% |
| Literature & Languages | 578 | 5.0% |
| Liberal Arts & History | 715 | 6.2% |
| Visual & Performing Arts | 543 | 4.7% |
| Communications | 313 | 2.7% |
| Arts & Humanities | 743 | 6.5% |
| Total | 11,472 | 100.0% |
Transportation & Commute in Oceanside
Vehicle Availability by Sex in Oceanside
The most prevalent vehicle ownership categories in Oceanside are males with 2 vehicles (4,090, accounting for 49.2%) and females with 2 vehicles (3,899, making up 52.3%).
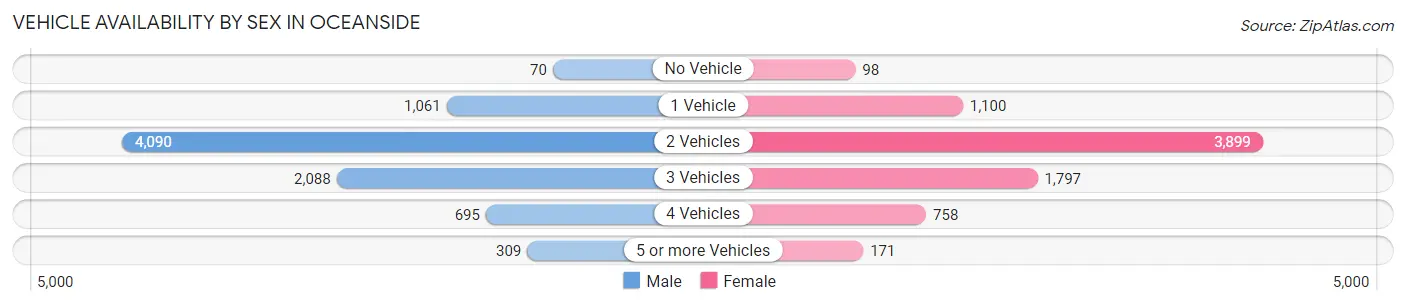
| Vehicles Available | Male | Female |
| No Vehicle | 70 (0.8%) | 98 (1.3%) |
| 1 Vehicle | 1,061 (12.8%) | 1,100 (14.1%) |
| 2 Vehicles | 4,090 (49.2%) | 3,899 (49.8%) |
| 3 Vehicles | 2,088 (25.1%) | 1,797 (23.0%) |
| 4 Vehicles | 695 (8.4%) | 758 (9.7%) |
| 5 or more Vehicles | 309 (3.7%) | 171 (2.2%) |
| Total | 8,313 (100.0%) | 7,823 (100.0%) |
Commute Time in Oceanside
The most frequently occuring commute durations in Oceanside are 60 to 89 minutes (2,207 commuters, 15.7%), 30 to 34 minutes (1,881 commuters, 13.4%), and 45 to 59 minutes (1,810 commuters, 12.9%).
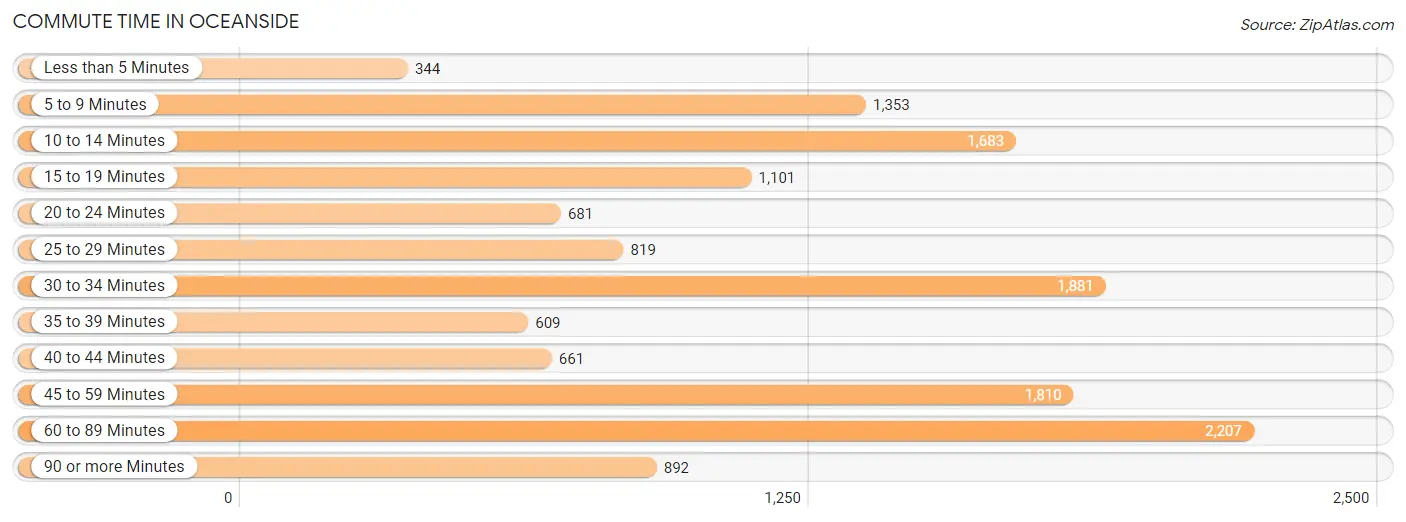
| Commute Time | # Commuters | % Commuters |
| Less than 5 Minutes | 344 | 2.5% |
| 5 to 9 Minutes | 1,353 | 9.6% |
| 10 to 14 Minutes | 1,683 | 12.0% |
| 15 to 19 Minutes | 1,101 | 7.8% |
| 20 to 24 Minutes | 681 | 4.9% |
| 25 to 29 Minutes | 819 | 5.8% |
| 30 to 34 Minutes | 1,881 | 13.4% |
| 35 to 39 Minutes | 609 | 4.3% |
| 40 to 44 Minutes | 661 | 4.7% |
| 45 to 59 Minutes | 1,810 | 12.9% |
| 60 to 89 Minutes | 2,207 | 15.7% |
| 90 or more Minutes | 892 | 6.4% |
Commute Time by Sex in Oceanside
The most common commute times in Oceanside are 60 to 89 minutes (1,223 commuters, 17.2%) for males and 30 to 34 minutes (990 commuters, 14.3%) for females.
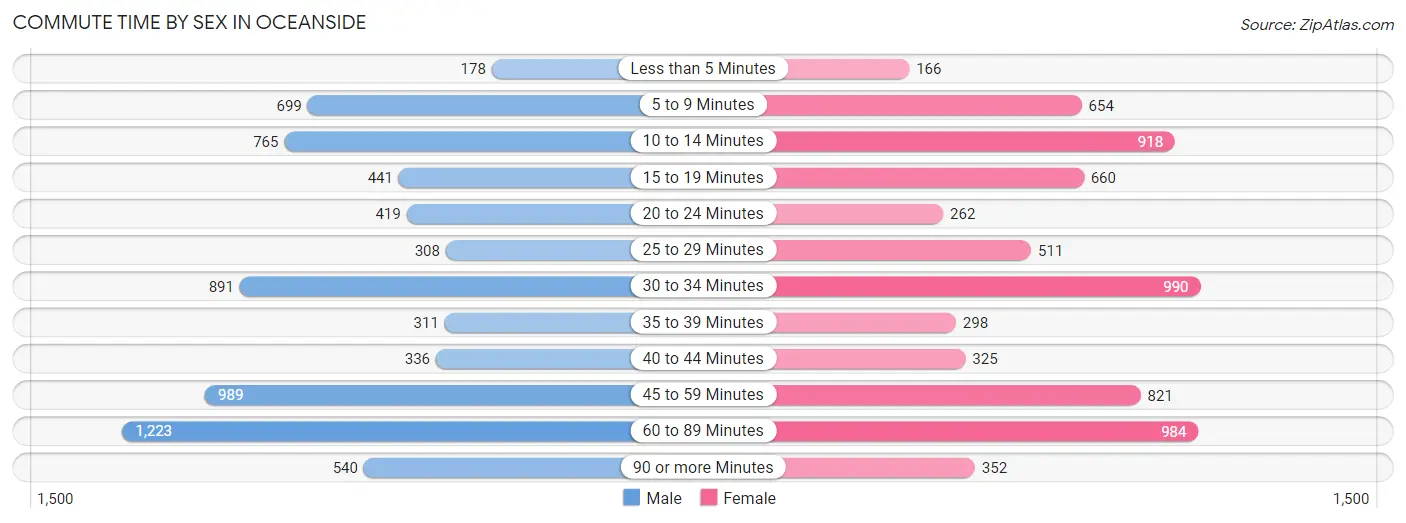
| Commute Time | Male | Female |
| Less than 5 Minutes | 178 (2.5%) | 166 (2.4%) |
| 5 to 9 Minutes | 699 (9.9%) | 654 (9.4%) |
| 10 to 14 Minutes | 765 (10.8%) | 918 (13.2%) |
| 15 to 19 Minutes | 441 (6.2%) | 660 (9.5%) |
| 20 to 24 Minutes | 419 (5.9%) | 262 (3.8%) |
| 25 to 29 Minutes | 308 (4.3%) | 511 (7.4%) |
| 30 to 34 Minutes | 891 (12.6%) | 990 (14.3%) |
| 35 to 39 Minutes | 311 (4.4%) | 298 (4.3%) |
| 40 to 44 Minutes | 336 (4.7%) | 325 (4.7%) |
| 45 to 59 Minutes | 989 (13.9%) | 821 (11.8%) |
| 60 to 89 Minutes | 1,223 (17.2%) | 984 (14.2%) |
| 90 or more Minutes | 540 (7.6%) | 352 (5.1%) |
Time of Departure to Work by Sex in Oceanside
The most frequent times of departure to work in Oceanside are 8:00 AM to 8:29 AM (837, 11.8%) for males and 8:00 AM to 8:29 AM (1,324, 19.1%) for females.
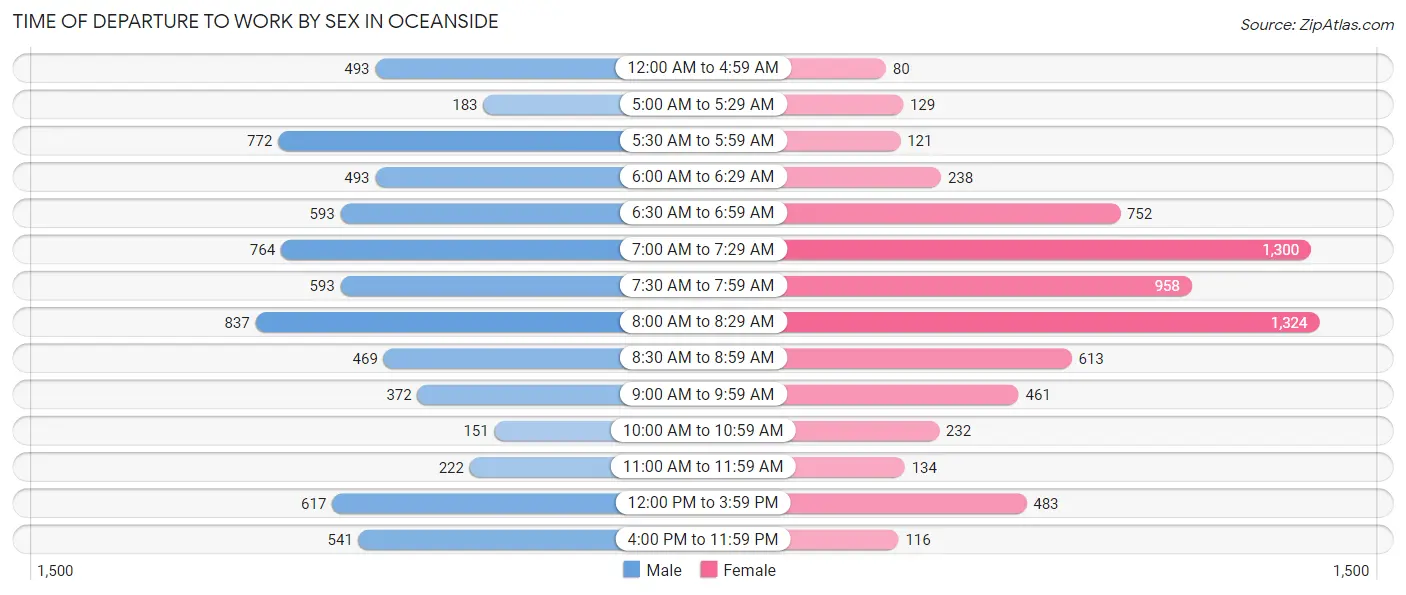
| Time of Departure | Male | Female |
| 12:00 AM to 4:59 AM | 493 (6.9%) | 80 (1.1%) |
| 5:00 AM to 5:29 AM | 183 (2.6%) | 129 (1.9%) |
| 5:30 AM to 5:59 AM | 772 (10.9%) | 121 (1.7%) |
| 6:00 AM to 6:29 AM | 493 (6.9%) | 238 (3.4%) |
| 6:30 AM to 6:59 AM | 593 (8.4%) | 752 (10.8%) |
| 7:00 AM to 7:29 AM | 764 (10.8%) | 1,300 (18.7%) |
| 7:30 AM to 7:59 AM | 593 (8.4%) | 958 (13.8%) |
| 8:00 AM to 8:29 AM | 837 (11.8%) | 1,324 (19.1%) |
| 8:30 AM to 8:59 AM | 469 (6.6%) | 613 (8.8%) |
| 9:00 AM to 9:59 AM | 372 (5.2%) | 461 (6.6%) |
| 10:00 AM to 10:59 AM | 151 (2.1%) | 232 (3.3%) |
| 11:00 AM to 11:59 AM | 222 (3.1%) | 134 (1.9%) |
| 12:00 PM to 3:59 PM | 617 (8.7%) | 483 (7.0%) |
| 4:00 PM to 11:59 PM | 541 (7.6%) | 116 (1.7%) |
| Total | 7,100 (100.0%) | 6,941 (100.0%) |
Housing Occupancy in Oceanside
Occupancy by Ownership in Oceanside
Of the total 10,811 dwellings in Oceanside, owner-occupied units account for 9,934 (91.9%), while renter-occupied units make up 877 (8.1%).
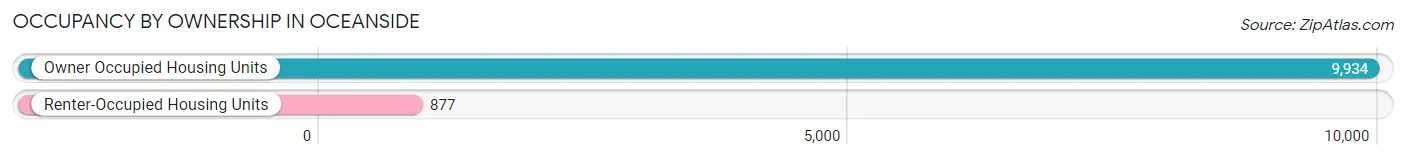
| Occupancy | # Housing Units | % Housing Units |
| Owner Occupied Housing Units | 9,934 | 91.9% |
| Renter-Occupied Housing Units | 877 | 8.1% |
| Total Occupied Housing Units | 10,811 | 100.0% |
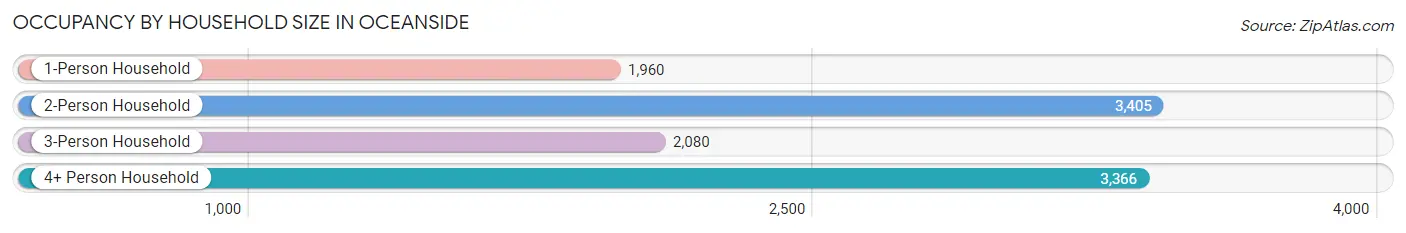
Occupancy by Household Size in Oceanside
| Household Size | # Housing Units | % Housing Units |
| 1-Person Household | 1,960 | 18.1% |
| 2-Person Household | 3,405 | 31.5% |
| 3-Person Household | 2,080 | 19.2% |
| 4+ Person Household | 3,366 | 31.1% |
| Total Housing Units | 10,811 | 100.0% |
Occupancy by Ownership by Household Size in Oceanside
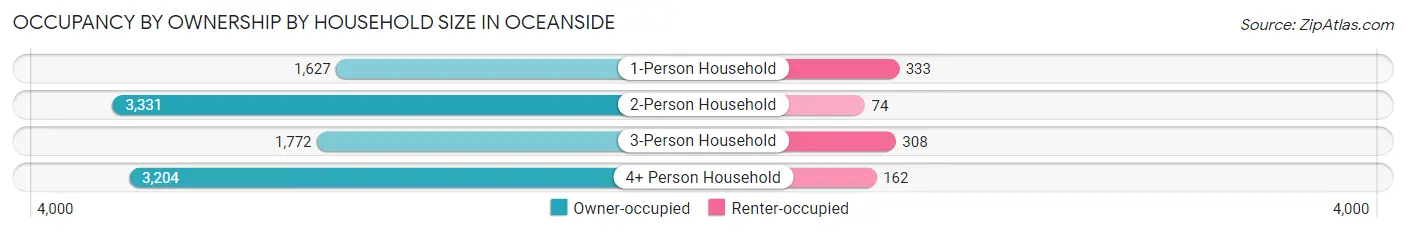
| Household Size | Owner-occupied | Renter-occupied |
| 1-Person Household | 1,627 (83.0%) | 333 (17.0%) |
| 2-Person Household | 3,331 (97.8%) | 74 (2.2%) |
| 3-Person Household | 1,772 (85.2%) | 308 (14.8%) |
| 4+ Person Household | 3,204 (95.2%) | 162 (4.8%) |
| Total Housing Units | 9,934 (91.9%) | 877 (8.1%) |
Occupancy by Educational Attainment in Oceanside
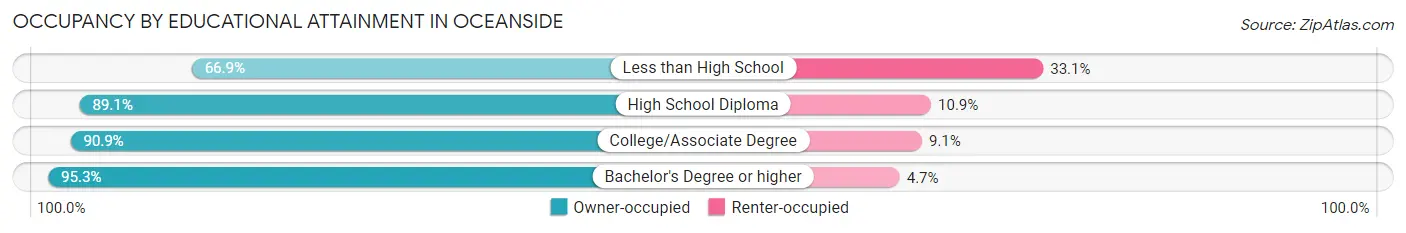
| Household Size | Owner-occupied | Renter-occupied |
| Less than High School | 236 (66.9%) | 117 (33.1%) |
| High School Diploma | 2,398 (89.1%) | 293 (10.9%) |
| College/Associate Degree | 2,127 (90.9%) | 213 (9.1%) |
| Bachelor's Degree or higher | 5,173 (95.3%) | 254 (4.7%) |
Occupancy by Age of Householder in Oceanside
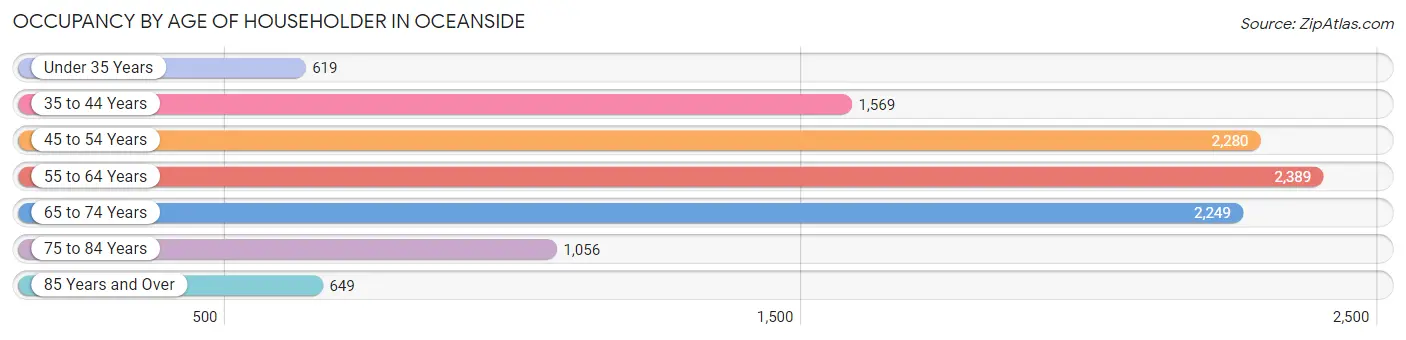
| Age Bracket | # Households | % Households |
| Under 35 Years | 619 | 5.7% |
| 35 to 44 Years | 1,569 | 14.5% |
| 45 to 54 Years | 2,280 | 21.1% |
| 55 to 64 Years | 2,389 | 22.1% |
| 65 to 74 Years | 2,249 | 20.8% |
| 75 to 84 Years | 1,056 | 9.8% |
| 85 Years and Over | 649 | 6.0% |
| Total | 10,811 | 100.0% |
Housing Finances in Oceanside
Median Income by Occupancy in Oceanside
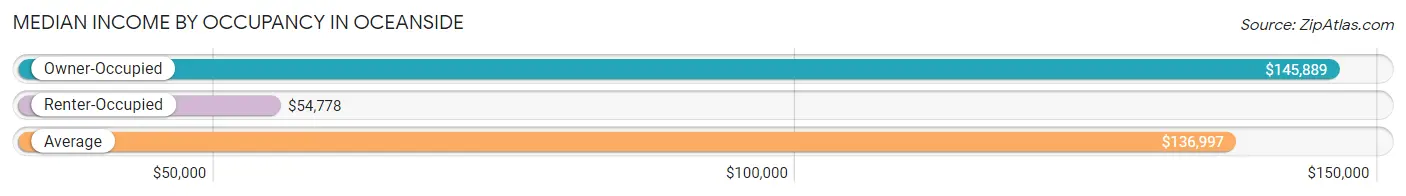
| Occupancy Type | # Households | Median Income |
| Owner-Occupied | 9,934 (91.9%) | $145,889 |
| Renter-Occupied | 877 (8.1%) | $54,778 |
| Average | 10,811 (100.0%) | $136,997 |
Occupancy by Householder Income Bracket in Oceanside
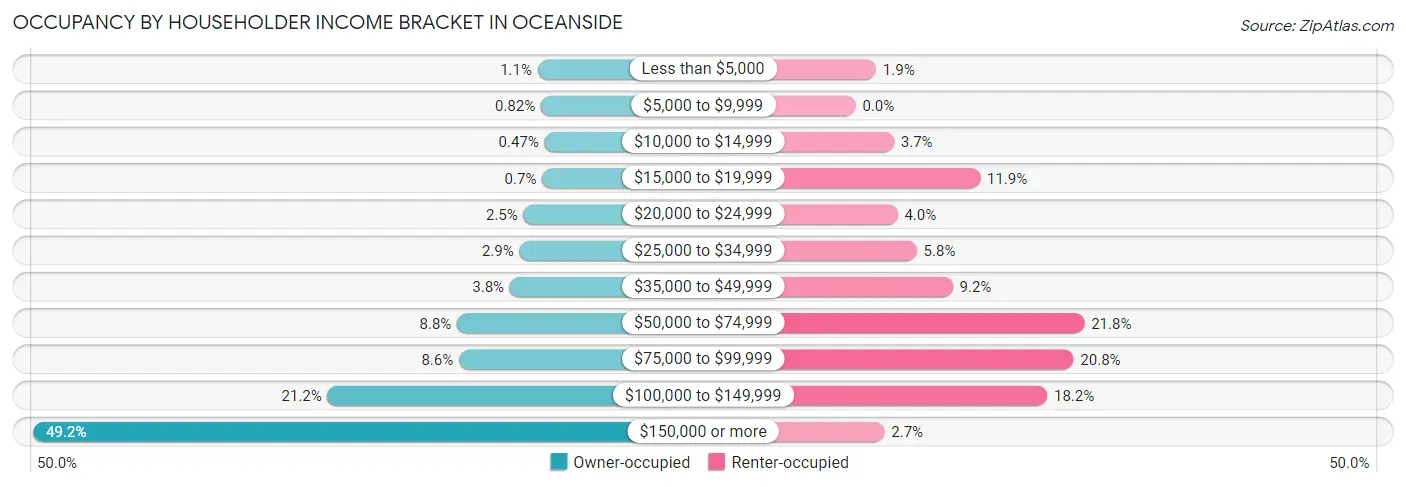
| Income Bracket | Owner-occupied | Renter-occupied |
| Less than $5,000 | 111 (1.1%) | 17 (1.9%) |
| $5,000 to $9,999 | 81 (0.8%) | 0 (0.0%) |
| $10,000 to $14,999 | 47 (0.5%) | 32 (3.6%) |
| $15,000 to $19,999 | 70 (0.7%) | 104 (11.9%) |
| $20,000 to $24,999 | 246 (2.5%) | 35 (4.0%) |
| $25,000 to $34,999 | 284 (2.9%) | 51 (5.8%) |
| $35,000 to $49,999 | 376 (3.8%) | 81 (9.2%) |
| $50,000 to $74,999 | 874 (8.8%) | 191 (21.8%) |
| $75,000 to $99,999 | 856 (8.6%) | 182 (20.7%) |
| $100,000 to $149,999 | 2,101 (21.1%) | 160 (18.2%) |
| $150,000 or more | 4,888 (49.2%) | 24 (2.7%) |
| Total | 9,934 (100.0%) | 877 (100.0%) |
Monthly Housing Cost Tiers in Oceanside
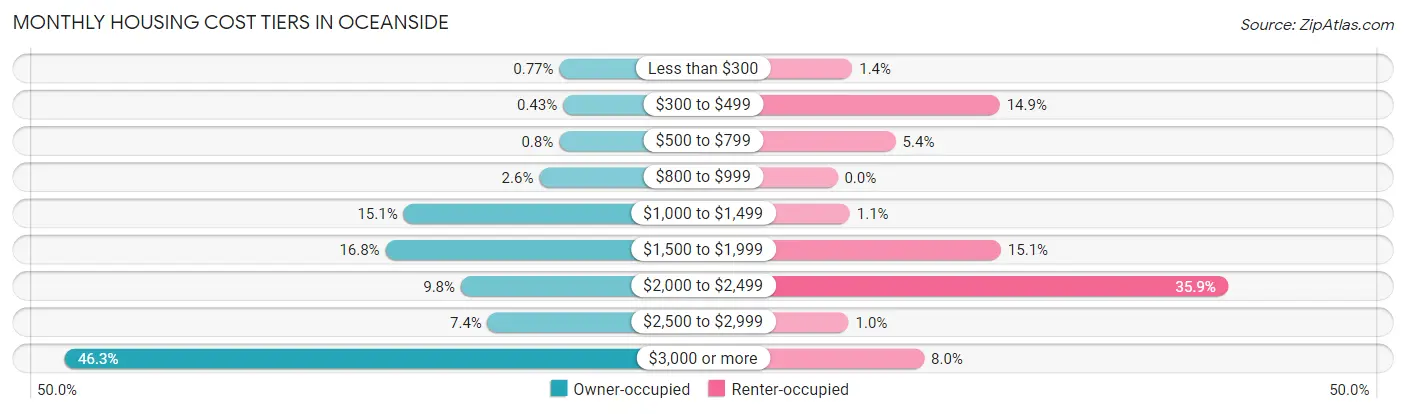
| Monthly Cost | Owner-occupied | Renter-occupied |
| Less than $300 | 76 (0.8%) | 12 (1.4%) |
| $300 to $499 | 43 (0.4%) | 131 (14.9%) |
| $500 to $799 | 79 (0.8%) | 47 (5.4%) |
| $800 to $999 | 260 (2.6%) | 0 (0.0%) |
| $1,000 to $1,499 | 1,502 (15.1%) | 10 (1.1%) |
| $1,500 to $1,999 | 1,667 (16.8%) | 132 (15.0%) |
| $2,000 to $2,499 | 978 (9.8%) | 315 (35.9%) |
| $2,500 to $2,999 | 732 (7.4%) | 9 (1.0%) |
| $3,000 or more | 4,597 (46.3%) | 70 (8.0%) |
| Total | 9,934 (100.0%) | 877 (100.0%) |
Physical Housing Characteristics in Oceanside
Housing Structures in Oceanside
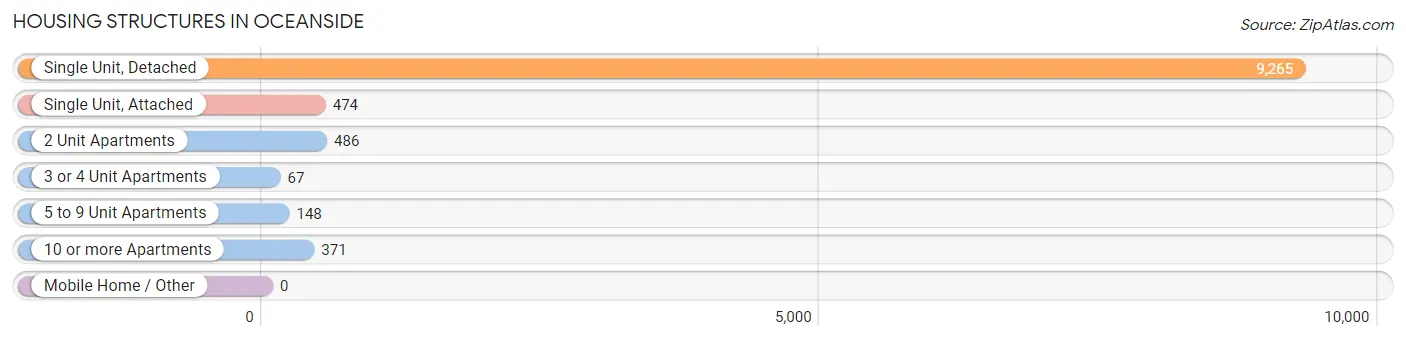
| Structure Type | # Housing Units | % Housing Units |
| Single Unit, Detached | 9,265 | 85.7% |
| Single Unit, Attached | 474 | 4.4% |
| 2 Unit Apartments | 486 | 4.5% |
| 3 or 4 Unit Apartments | 67 | 0.6% |
| 5 to 9 Unit Apartments | 148 | 1.4% |
| 10 or more Apartments | 371 | 3.4% |
| Mobile Home / Other | 0 | 0.0% |
| Total | 10,811 | 100.0% |
Housing Structures by Occupancy in Oceanside
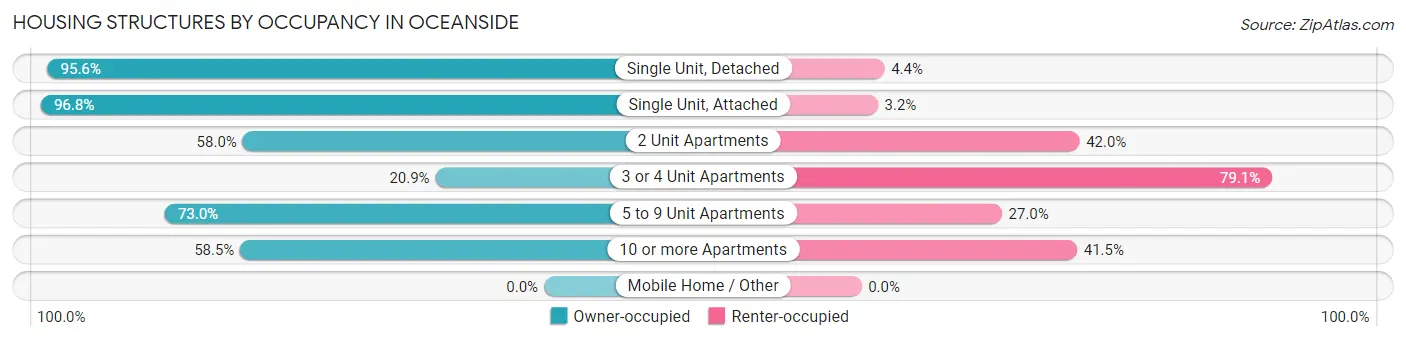
| Structure Type | Owner-occupied | Renter-occupied |
| Single Unit, Detached | 8,854 (95.6%) | 411 (4.4%) |
| Single Unit, Attached | 459 (96.8%) | 15 (3.2%) |
| 2 Unit Apartments | 282 (58.0%) | 204 (42.0%) |
| 3 or 4 Unit Apartments | 14 (20.9%) | 53 (79.1%) |
| 5 to 9 Unit Apartments | 108 (73.0%) | 40 (27.0%) |
| 10 or more Apartments | 217 (58.5%) | 154 (41.5%) |
| Mobile Home / Other | 0 (0.0%) | 0 (0.0%) |
| Total | 9,934 (91.9%) | 877 (8.1%) |
Housing Structures by Number of Rooms in Oceanside
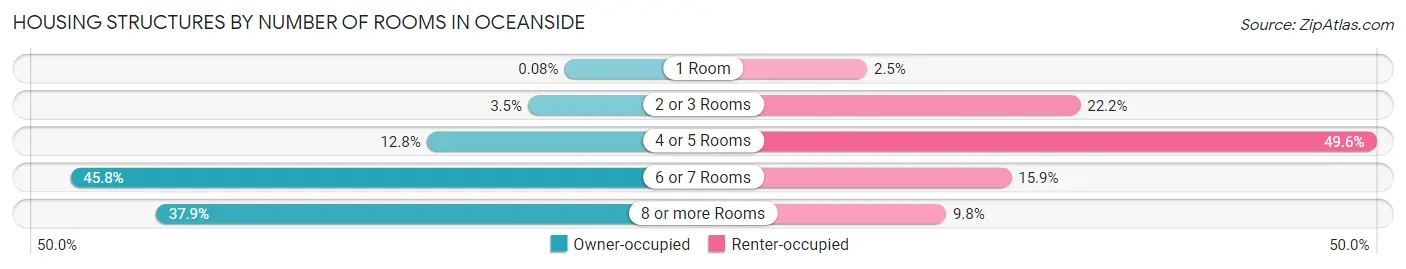
| Number of Rooms | Owner-occupied | Renter-occupied |
| 1 Room | 8 (0.1%) | 22 (2.5%) |
| 2 or 3 Rooms | 344 (3.5%) | 195 (22.2%) |
| 4 or 5 Rooms | 1,275 (12.8%) | 435 (49.6%) |
| 6 or 7 Rooms | 4,546 (45.8%) | 139 (15.9%) |
| 8 or more Rooms | 3,761 (37.9%) | 86 (9.8%) |
| Total | 9,934 (100.0%) | 877 (100.0%) |
Housing Structure by Heating Type in Oceanside
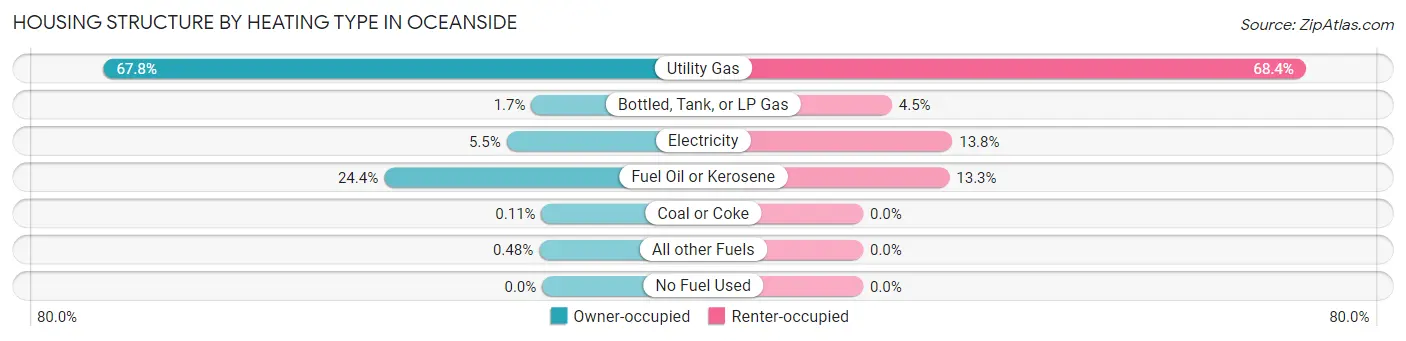
| Heating Type | Owner-occupied | Renter-occupied |
| Utility Gas | 6,735 (67.8%) | 600 (68.4%) |
| Bottled, Tank, or LP Gas | 166 (1.7%) | 39 (4.4%) |
| Electricity | 546 (5.5%) | 121 (13.8%) |
| Fuel Oil or Kerosene | 2,428 (24.4%) | 117 (13.3%) |
| Coal or Coke | 11 (0.1%) | 0 (0.0%) |
| All other Fuels | 48 (0.5%) | 0 (0.0%) |
| No Fuel Used | 0 (0.0%) | 0 (0.0%) |
| Total | 9,934 (100.0%) | 877 (100.0%) |
Household Vehicle Usage in Oceanside
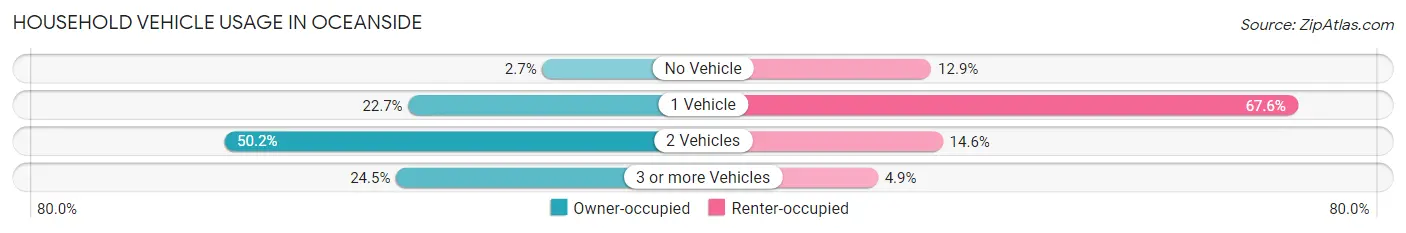
| Vehicles per Household | Owner-occupied | Renter-occupied |
| No Vehicle | 263 (2.6%) | 113 (12.9%) |
| 1 Vehicle | 2,252 (22.7%) | 593 (67.6%) |
| 2 Vehicles | 4,986 (50.2%) | 128 (14.6%) |
| 3 or more Vehicles | 2,433 (24.5%) | 43 (4.9%) |
| Total | 9,934 (100.0%) | 877 (100.0%) |
Real Estate & Mortgages in Oceanside
Real Estate and Mortgage Overview in Oceanside
| Characteristic | Without Mortgage | With Mortgage |
| Housing Units | 3,775 | 6,159 |
| Median Property Value | $584,000 | $620,900 |
| Median Household Income | $104,313 | $3,644 |
| Monthly Housing Costs | $1,501 | $4,561 |
| Real Estate Taxes | $10,001 | $116 |
Property Value by Mortgage Status in Oceanside
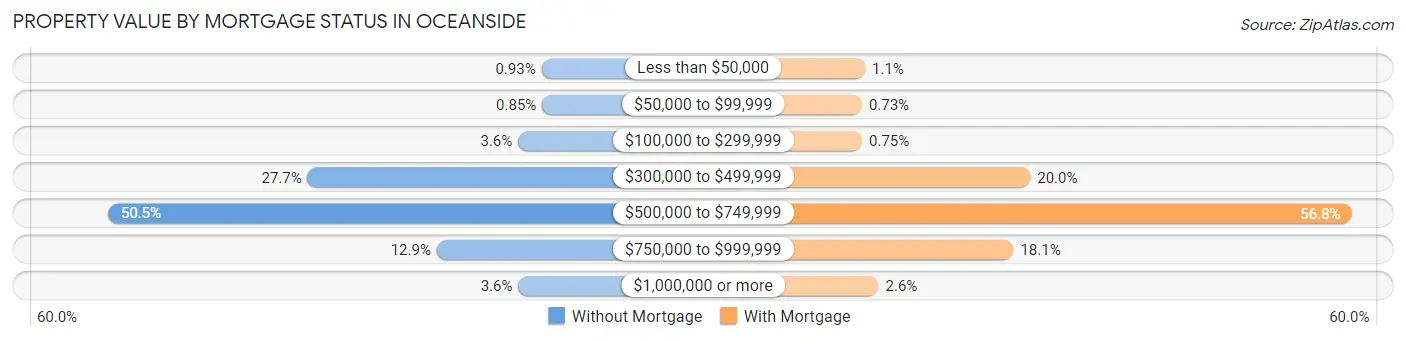
| Property Value | Without Mortgage | With Mortgage |
| Less than $50,000 | 35 (0.9%) | 67 (1.1%) |
| $50,000 to $99,999 | 32 (0.9%) | 45 (0.7%) |
| $100,000 to $299,999 | 136 (3.6%) | 46 (0.7%) |
| $300,000 to $499,999 | 1,044 (27.7%) | 1,230 (20.0%) |
| $500,000 to $749,999 | 1,906 (50.5%) | 3,497 (56.8%) |
| $750,000 to $999,999 | 487 (12.9%) | 1,112 (18.0%) |
| $1,000,000 or more | 135 (3.6%) | 162 (2.6%) |
| Total | 3,775 (100.0%) | 6,159 (100.0%) |
Household Income by Mortgage Status in Oceanside
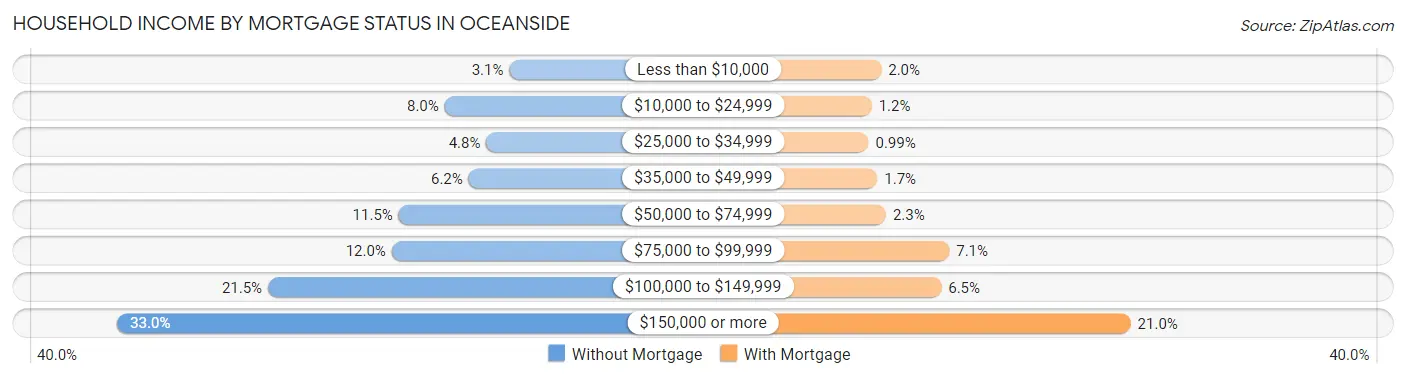
| Household Income | Without Mortgage | With Mortgage |
| Less than $10,000 | 116 (3.1%) | 121 (2.0%) |
| $10,000 to $24,999 | 302 (8.0%) | 76 (1.2%) |
| $25,000 to $34,999 | 182 (4.8%) | 61 (1.0%) |
| $35,000 to $49,999 | 233 (6.2%) | 102 (1.7%) |
| $50,000 to $74,999 | 434 (11.5%) | 143 (2.3%) |
| $75,000 to $99,999 | 454 (12.0%) | 440 (7.1%) |
| $100,000 to $149,999 | 810 (21.5%) | 402 (6.5%) |
| $150,000 or more | 1,244 (33.0%) | 1,291 (21.0%) |
| Total | 3,775 (100.0%) | 6,159 (100.0%) |
Property Value to Household Income Ratio in Oceanside
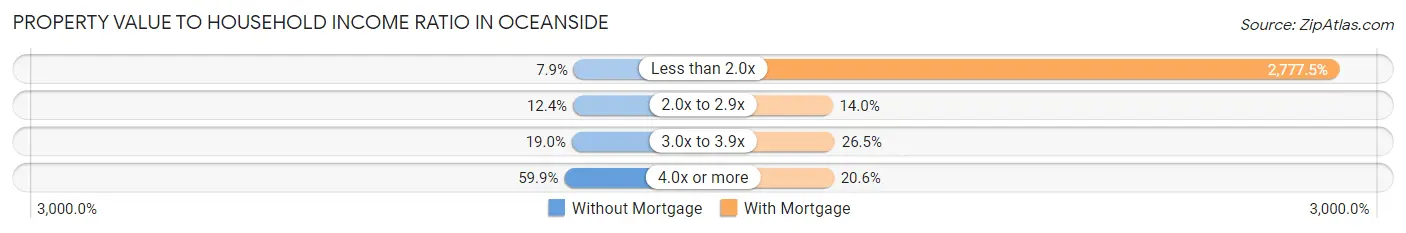
| Value-to-Income Ratio | Without Mortgage | With Mortgage |
| Less than 2.0x | 297 (7.9%) | 171,068 (2,777.5%) |
| 2.0x to 2.9x | 469 (12.4%) | 860 (14.0%) |
| 3.0x to 3.9x | 717 (19.0%) | 1,631 (26.5%) |
| 4.0x or more | 2,261 (59.9%) | 1,266 (20.6%) |
| Total | 3,775 (100.0%) | 6,159 (100.0%) |
Real Estate Taxes by Mortgage Status in Oceanside
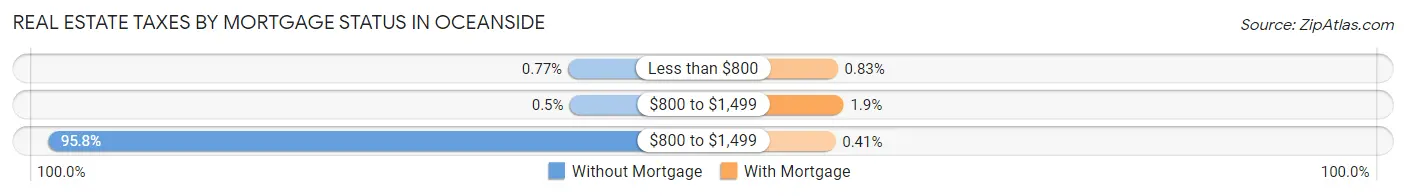
| Property Taxes | Without Mortgage | With Mortgage |
| Less than $800 | 29 (0.8%) | 51 (0.8%) |
| $800 to $1,499 | 19 (0.5%) | 117 (1.9%) |
| $800 to $1,499 | 3,615 (95.8%) | 25 (0.4%) |
| Total | 3,775 (100.0%) | 6,159 (100.0%) |
Health & Disability in Oceanside
Health Insurance Coverage by Age in Oceanside
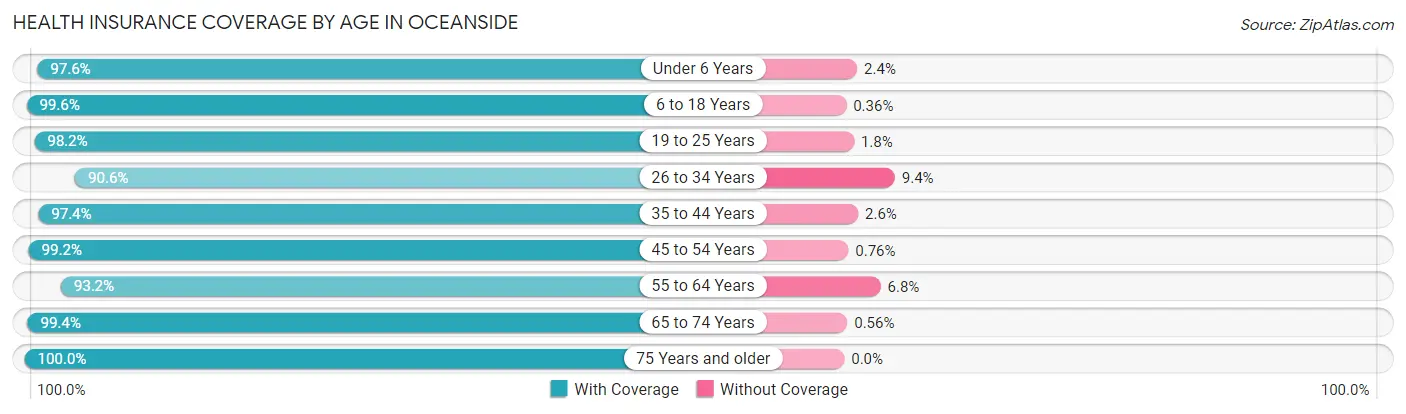
| Age Bracket | With Coverage | Without Coverage |
| Under 6 Years | 1,745 (97.6%) | 43 (2.4%) |
| 6 to 18 Years | 4,940 (99.6%) | 18 (0.4%) |
| 19 to 25 Years | 2,228 (98.2%) | 41 (1.8%) |
| 26 to 34 Years | 2,670 (90.6%) | 278 (9.4%) |
| 35 to 44 Years | 3,417 (97.4%) | 90 (2.6%) |
| 45 to 54 Years | 4,730 (99.2%) | 36 (0.8%) |
| 55 to 64 Years | 4,170 (93.2%) | 303 (6.8%) |
| 65 to 74 Years | 3,898 (99.4%) | 22 (0.6%) |
| 75 Years and older | 2,761 (100.0%) | 0 (0.0%) |
| Total | 30,559 (97.4%) | 831 (2.6%) |
Health Insurance Coverage by Citizenship Status in Oceanside
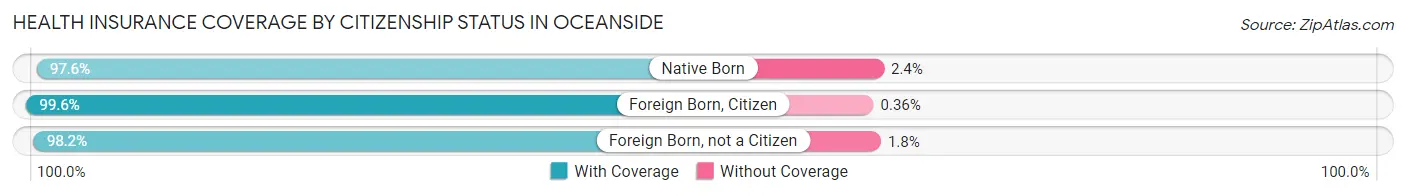
| Citizenship Status | With Coverage | Without Coverage |
| Native Born | 1,745 (97.6%) | 43 (2.4%) |
| Foreign Born, Citizen | 4,940 (99.6%) | 18 (0.4%) |
| Foreign Born, not a Citizen | 2,228 (98.2%) | 41 (1.8%) |
Health Insurance Coverage by Household Income in Oceanside
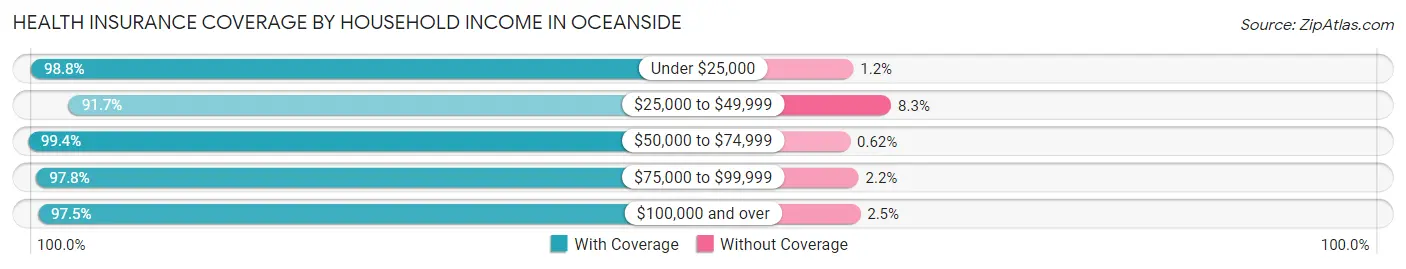
| Household Income | With Coverage | Without Coverage |
| Under $25,000 | 965 (98.8%) | 12 (1.2%) |
| $25,000 to $49,999 | 1,633 (91.7%) | 148 (8.3%) |
| $50,000 to $74,999 | 2,421 (99.4%) | 15 (0.6%) |
| $75,000 to $99,999 | 2,563 (97.8%) | 58 (2.2%) |
| $100,000 and over | 22,912 (97.5%) | 594 (2.5%) |
Public vs Private Health Insurance Coverage by Age in Oceanside
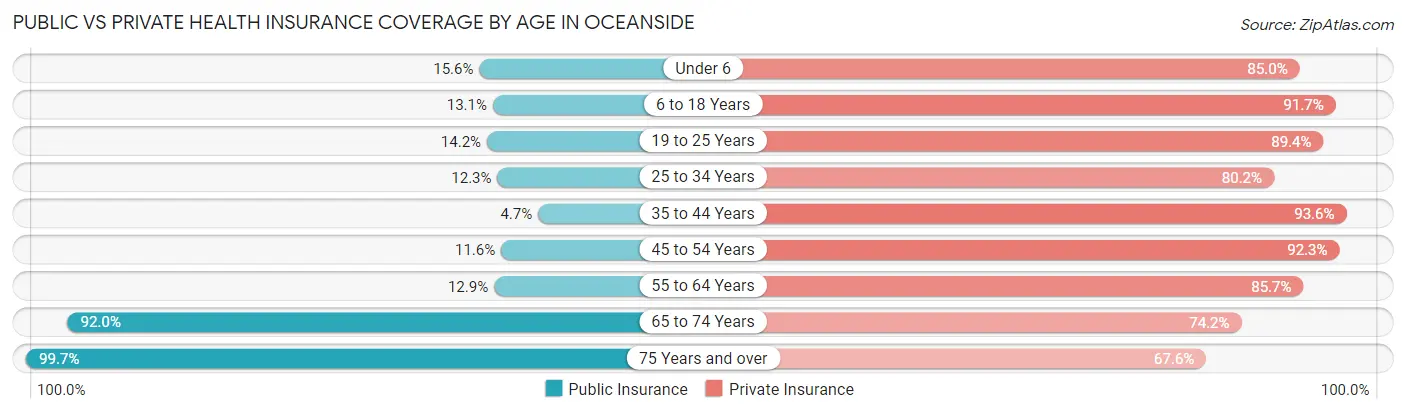
| Age Bracket | Public Insurance | Private Insurance |
| Under 6 | 279 (15.6%) | 1,519 (85.0%) |
| 6 to 18 Years | 649 (13.1%) | 4,544 (91.6%) |
| 19 to 25 Years | 322 (14.2%) | 2,028 (89.4%) |
| 25 to 34 Years | 361 (12.2%) | 2,364 (80.2%) |
| 35 to 44 Years | 165 (4.7%) | 3,284 (93.6%) |
| 45 to 54 Years | 551 (11.6%) | 4,401 (92.3%) |
| 55 to 64 Years | 576 (12.9%) | 3,831 (85.7%) |
| 65 to 74 Years | 3,607 (92.0%) | 2,907 (74.2%) |
| 75 Years and over | 2,753 (99.7%) | 1,867 (67.6%) |
| Total | 9,263 (29.5%) | 26,745 (85.2%) |
Disability Status by Sex by Age in Oceanside
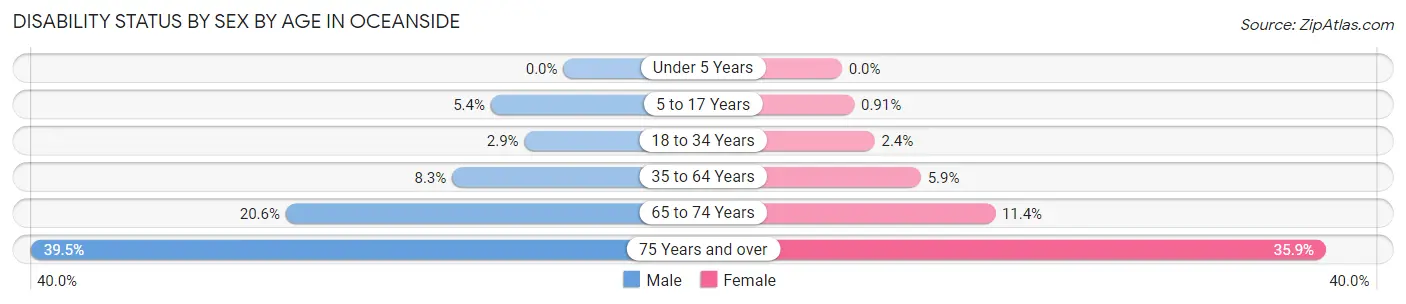
| Age Bracket | Male | Female |
| Under 5 Years | 0 (0.0%) | 0 (0.0%) |
| 5 to 17 Years | 159 (5.4%) | 19 (0.9%) |
| 18 to 34 Years | 91 (2.9%) | 57 (2.4%) |
| 35 to 64 Years | 513 (8.3%) | 383 (5.9%) |
| 65 to 74 Years | 400 (20.6%) | 225 (11.4%) |
| 75 Years and over | 501 (39.5%) | 537 (35.9%) |
Disability Class by Sex by Age in Oceanside
Disability Class: Hearing Difficulty
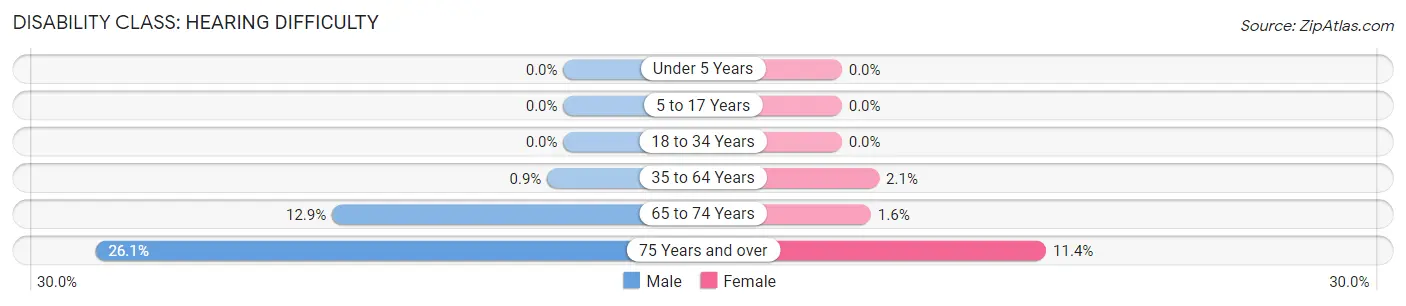
| Age Bracket | Male | Female |
| Under 5 Years | 0 (0.0%) | 0 (0.0%) |
| 5 to 17 Years | 0 (0.0%) | 0 (0.0%) |
| 18 to 34 Years | 0 (0.0%) | 0 (0.0%) |
| 35 to 64 Years | 56 (0.9%) | 136 (2.1%) |
| 65 to 74 Years | 250 (12.9%) | 32 (1.6%) |
| 75 Years and over | 330 (26.1%) | 170 (11.4%) |
Disability Class: Vision Difficulty
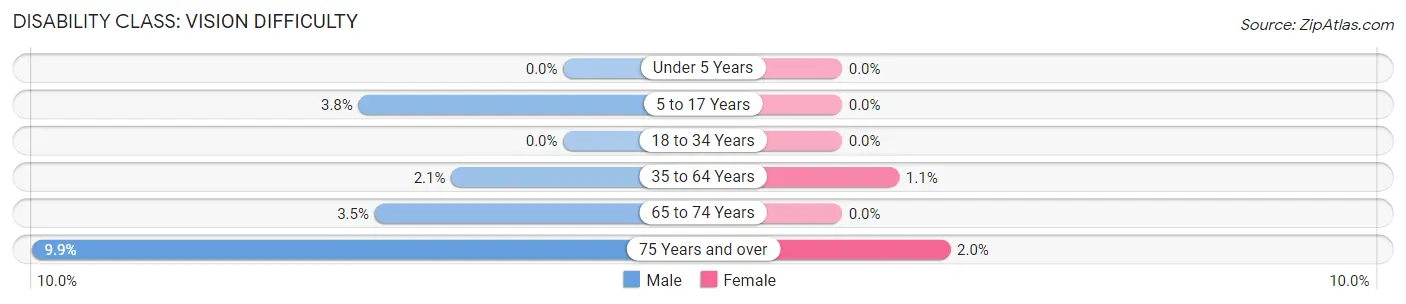
| Age Bracket | Male | Female |
| Under 5 Years | 0 (0.0%) | 0 (0.0%) |
| 5 to 17 Years | 112 (3.8%) | 0 (0.0%) |
| 18 to 34 Years | 0 (0.0%) | 0 (0.0%) |
| 35 to 64 Years | 129 (2.1%) | 69 (1.1%) |
| 65 to 74 Years | 68 (3.5%) | 0 (0.0%) |
| 75 Years and over | 125 (9.9%) | 30 (2.0%) |
Disability Class: Cognitive Difficulty
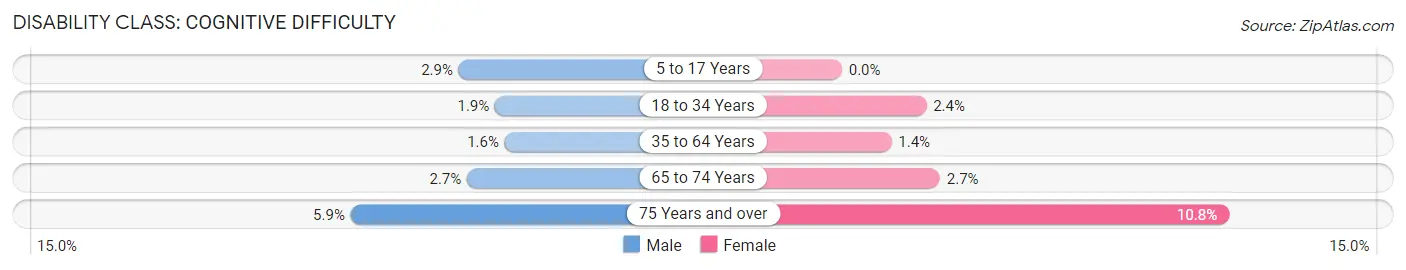
| Age Bracket | Male | Female |
| 5 to 17 Years | 86 (2.9%) | 0 (0.0%) |
| 18 to 34 Years | 60 (1.9%) | 55 (2.4%) |
| 35 to 64 Years | 101 (1.6%) | 90 (1.4%) |
| 65 to 74 Years | 52 (2.7%) | 54 (2.7%) |
| 75 Years and over | 75 (5.9%) | 161 (10.8%) |
Disability Class: Ambulatory Difficulty
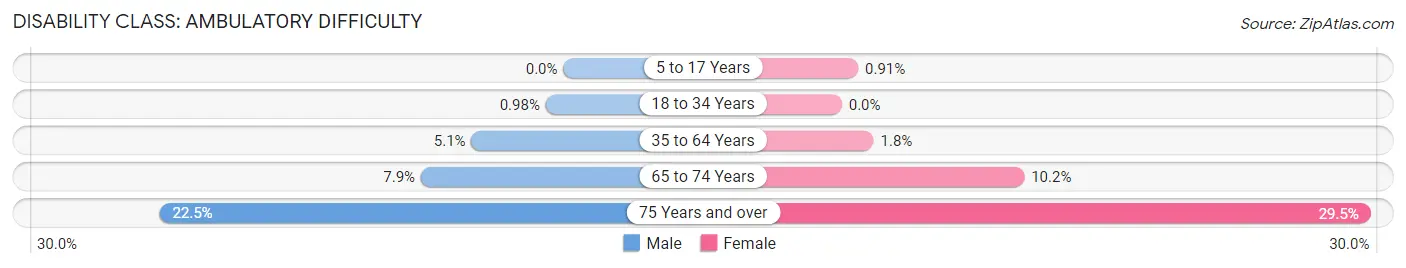
| Age Bracket | Male | Female |
| 5 to 17 Years | 0 (0.0%) | 19 (0.9%) |
| 18 to 34 Years | 31 (1.0%) | 0 (0.0%) |
| 35 to 64 Years | 318 (5.1%) | 116 (1.8%) |
| 65 to 74 Years | 154 (7.9%) | 201 (10.2%) |
| 75 Years and over | 285 (22.5%) | 440 (29.4%) |
Disability Class: Self-Care Difficulty
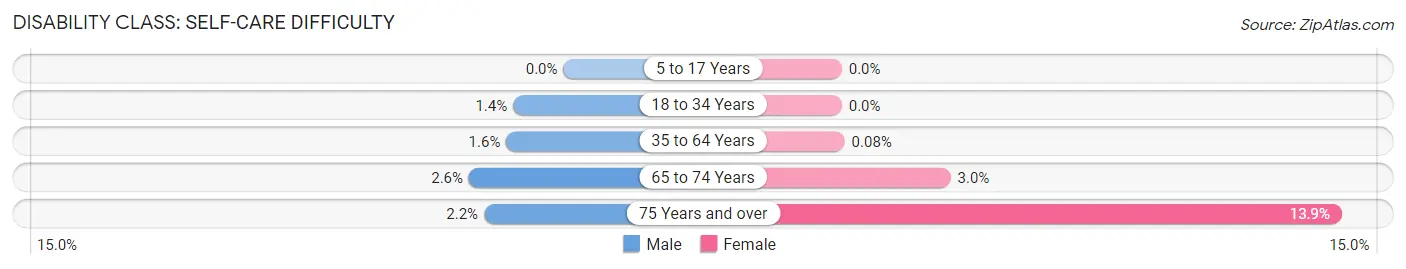
| Age Bracket | Male | Female |
| 5 to 17 Years | 0 (0.0%) | 0 (0.0%) |
| 18 to 34 Years | 44 (1.4%) | 0 (0.0%) |
| 35 to 64 Years | 99 (1.6%) | 5 (0.1%) |
| 65 to 74 Years | 51 (2.6%) | 60 (3.0%) |
| 75 Years and over | 28 (2.2%) | 208 (13.9%) |
Technology Access in Oceanside
Computing Device Access in Oceanside
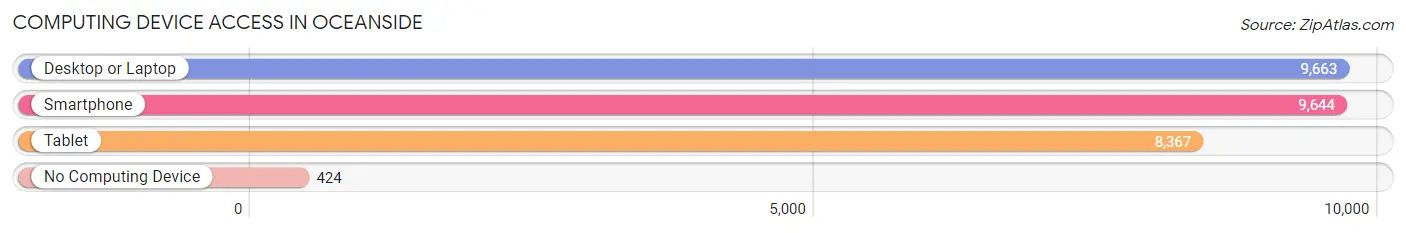
| Device Type | # Households | % Households |
| Desktop or Laptop | 9,663 | 89.4% |
| Smartphone | 9,644 | 89.2% |
| Tablet | 8,367 | 77.4% |
| No Computing Device | 424 | 3.9% |
| Total | 10,811 | 100.0% |
Internet Access in Oceanside
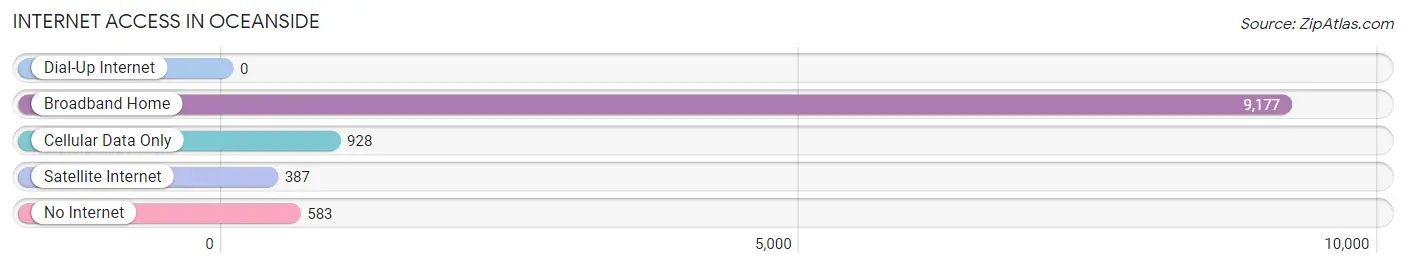
| Internet Type | # Households | % Households |
| Dial-Up Internet | 0 | 0.0% |
| Broadband Home | 9,177 | 84.9% |
| Cellular Data Only | 928 | 8.6% |
| Satellite Internet | 387 | 3.6% |
| No Internet | 583 | 5.4% |
| Total | 10,811 | 100.0% |
Oceanside Summary
Oceanside is a hamlet located in the Town of Hempstead in Nassau County, New York. It is located on the South Shore of Long Island, approximately 30 miles east of Manhattan. Oceanside is bordered by Rockville Centre to the west, Baldwin to the east, East Rockaway to the south, and Island Park to the north. The hamlet has a population of approximately 32,109 people, according to the 2010 census.
History
The area that is now Oceanside was originally inhabited by the Rockaway Indians, a sub-tribe of the Lenape people. The area was first settled by Europeans in the mid-17th century, when Dutch and English settlers began to move into the area. The hamlet was originally known as South Bay, and was part of the Town of Hempstead. In 1837, the hamlet was renamed Oceanside, after the nearby ocean.
In the late 19th century, Oceanside began to develop as a resort town, with many hotels and summer homes being built along the beach. The hamlet was also home to a number of amusement parks, including the Oceanside Park, which opened in 1895 and closed in the 1950s.
In the early 20th century, Oceanside began to develop as a residential community, with many single-family homes being built. The hamlet was also home to a number of factories, including the Oceanside Glass Company, which opened in 1915 and closed in the 1970s.
Geography
Oceanside is located on the South Shore of Long Island, approximately 30 miles east of Manhattan. The hamlet is bordered by Rockville Centre to the west, Baldwin to the east, East Rockaway to the south, and Island Park to the north. The hamlet has a total area of 4.2 square miles, of which 4.1 square miles is land and 0.1 square miles is water.
The hamlet is located on the Atlantic Ocean, and is home to several beaches, including Oceanside Beach, which is located on the western end of the hamlet. The hamlet is also home to several parks, including Oceanside Park, which is located on the eastern end of the hamlet.
Economy
The economy of Oceanside is largely based on tourism and retail. The hamlet is home to several hotels and resorts, as well as a number of restaurants, bars, and shops. The hamlet is also home to a number of manufacturing companies, including the Oceanside Glass Company, which opened in 1915 and closed in the 1970s.
Demographics
According to the 2010 census, the population of Oceanside was 32,109. The population is largely white (83.3%), with smaller percentages of African Americans (7.2%), Asians (4.3%), and Hispanics (3.7%). The median household income is $87,845, and the median home value is $521,400.
Conclusion
Oceanside is a hamlet located in the Town of Hempstead in Nassau County, New York. It is located on the South Shore of Long Island, approximately 30 miles east of Manhattan. The hamlet has a population of approximately 32,109 people, according to the 2010 census. The economy of Oceanside is largely based on tourism and retail, and the population is largely white. Oceanside is home to several beaches, parks, hotels, and restaurants, as well as a number of manufacturing companies.
Common Questions
What is Per Capita Income in Oceanside?
Per Capita income in Oceanside is $58,400.
What is the Median Family Income in Oceanside?
Median Family Income in Oceanside is $152,119.
What is the Median Household income in Oceanside?
Median Household Income in Oceanside is $136,997.
What is Income or Wage Gap in Oceanside?
Income or Wage Gap in Oceanside is 13.1%.
Women in Oceanside earn 86.9 cents for every dollar earned by a man.
What is Inequality or Gini Index in Oceanside?
Inequality or Gini Index in Oceanside is 0.40.
What is the Total Population of Oceanside?
Total Population of Oceanside is 31,488.
What is the Total Male Population of Oceanside?
Total Male Population of Oceanside is 16,313.
What is the Total Female Population of Oceanside?
Total Female Population of Oceanside is 15,175.
What is the Ratio of Males per 100 Females in Oceanside?
There are 107.50 Males per 100 Females in Oceanside.
What is the Ratio of Females per 100 Males in Oceanside?
There are 93.02 Females per 100 Males in Oceanside.
What is the Median Population Age in Oceanside?
Median Population Age in Oceanside is 45.8 Years.
What is the Average Family Size in Oceanside
Average Family Size in Oceanside is 3.3 People.
What is the Average Household Size in Oceanside
Average Household Size in Oceanside is 2.9 People.
How Large is the Labor Force in Oceanside?
There are 17,439 People in the Labor Forcein in Oceanside.
What is the Percentage of People in the Labor Force in Oceanside?
67.1% of People are in the Labor Force in Oceanside.
What is the Unemployment Rate in Oceanside?
Unemployment Rate in Oceanside is 5.9%.