South Farmingdale, NY Map & Demographics
South Farmingdale Map
South Farmingdale Overview
$63,286
PER CAPITA INCOME
$175,573
AVG FAMILY INCOME
$166,680
AVG HOUSEHOLD INCOME
12.5%
WAGE / INCOME GAP [ % ]
87.5¢/ $1
WAGE / INCOME GAP [ $ ]
0.36
INEQUALITY / GINI INDEX
15,028
TOTAL POPULATION
7,098
MALE POPULATION
7,930
FEMALE POPULATION
89.51
MALES / 100 FEMALES
111.72
FEMALES / 100 MALES
43.0
MEDIAN AGE
3.4
AVG FAMILY SIZE
3.2
AVG HOUSEHOLD SIZE
8,441
LABOR FORCE [ PEOPLE ]
66.5%
PERCENT IN LABOR FORCE
5.9%
UNEMPLOYMENT RATE
Income in South Farmingdale
Income Overview in South Farmingdale
Per Capita Income in South Farmingdale is $63,286, while median incomes of families and households are $175,573 and $166,680 respectively.
| Characteristic | Number | Measure |
| Per Capita Income | 15,028 | $63,286 |
| Median Family Income | 3,905 | $175,573 |
| Mean Family Income | 3,905 | $195,916 |
| Median Household Income | 4,742 | $166,680 |
| Mean Household Income | 4,742 | $181,808 |
| Income Deficit | 3,905 | $0 |
| Wage / Income Gap (%) | 15,028 | 12.50% |
| Wage / Income Gap ($) | 15,028 | 87.50¢ per $1 |
| Gini / Inequality Index | 15,028 | 0.36 |
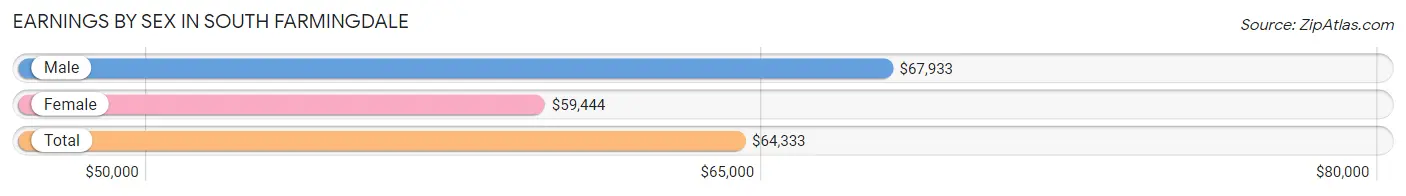
Earnings by Sex in South Farmingdale
Average Earnings in South Farmingdale are $64,333, $67,933 for men and $59,444 for women, a difference of 12.5%.
| Sex | Number | Average Earnings |
| Male | 4,496 (50.7%) | $67,933 |
| Female | 4,372 (49.3%) | $59,444 |
| Total | 8,868 (100.0%) | $64,333 |
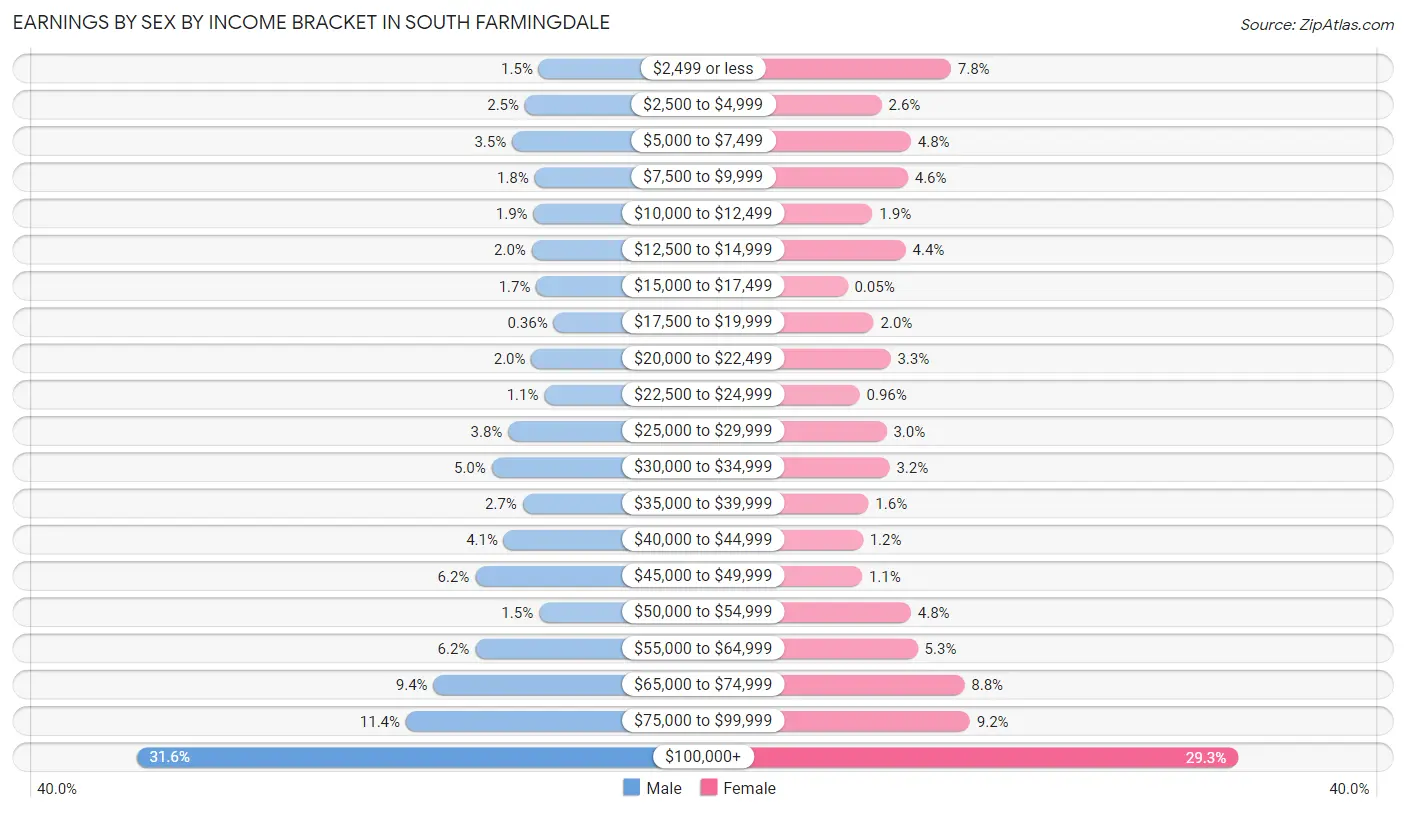
Earnings by Sex by Income Bracket in South Farmingdale
The most common earnings brackets in South Farmingdale are $100,000+ for men (1,421 | 31.6%) and $100,000+ for women (1,282 | 29.3%).
| Income | Male | Female |
| $2,499 or less | 66 (1.5%) | 341 (7.8%) |
| $2,500 to $4,999 | 113 (2.5%) | 114 (2.6%) |
| $5,000 to $7,499 | 156 (3.5%) | 210 (4.8%) |
| $7,500 to $9,999 | 80 (1.8%) | 200 (4.6%) |
| $10,000 to $12,499 | 84 (1.9%) | 84 (1.9%) |
| $12,500 to $14,999 | 90 (2.0%) | 193 (4.4%) |
| $15,000 to $17,499 | 74 (1.7%) | 2 (0.1%) |
| $17,500 to $19,999 | 16 (0.4%) | 88 (2.0%) |
| $20,000 to $22,499 | 91 (2.0%) | 143 (3.3%) |
| $22,500 to $24,999 | 47 (1.1%) | 42 (1.0%) |
| $25,000 to $29,999 | 169 (3.8%) | 130 (3.0%) |
| $30,000 to $34,999 | 225 (5.0%) | 140 (3.2%) |
| $35,000 to $39,999 | 120 (2.7%) | 71 (1.6%) |
| $40,000 to $44,999 | 184 (4.1%) | 52 (1.2%) |
| $45,000 to $49,999 | 280 (6.2%) | 50 (1.1%) |
| $50,000 to $54,999 | 65 (1.5%) | 210 (4.8%) |
| $55,000 to $64,999 | 280 (6.2%) | 232 (5.3%) |
| $65,000 to $74,999 | 421 (9.4%) | 385 (8.8%) |
| $75,000 to $99,999 | 514 (11.4%) | 403 (9.2%) |
| $100,000+ | 1,421 (31.6%) | 1,282 (29.3%) |
| Total | 4,496 (100.0%) | 4,372 (100.0%) |
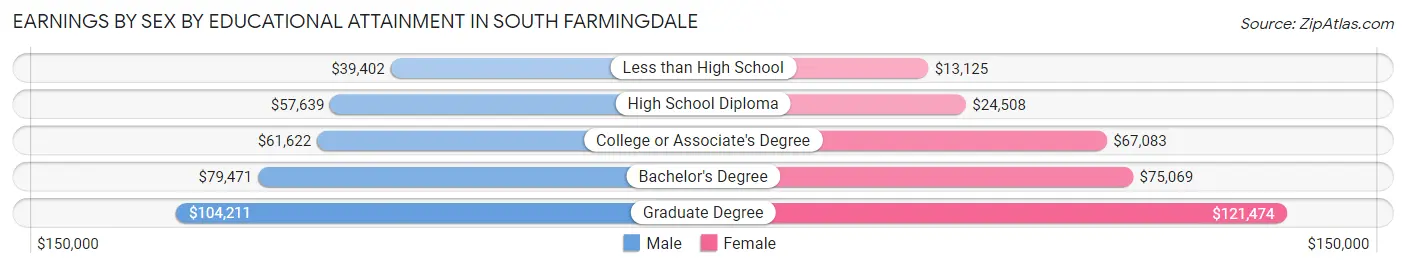
Earnings by Sex by Educational Attainment in South Farmingdale
Average earnings in South Farmingdale are $75,352 for men and $72,091 for women, a difference of 4.3%. Men with an educational attainment of graduate degree enjoy the highest average annual earnings of $104,211, while those with less than high school education earn the least with $39,402. Women with an educational attainment of graduate degree earn the most with the average annual earnings of $121,474, while those with less than high school education have the smallest earnings of $13,125.
| Educational Attainment | Male Income | Female Income |
| Less than High School | $39,402 | $13,125 |
| High School Diploma | $57,639 | $24,508 |
| College or Associate's Degree | $61,622 | $67,083 |
| Bachelor's Degree | $79,471 | $75,069 |
| Graduate Degree | $104,211 | $121,474 |
| Total | $75,352 | $72,091 |
Family Income in South Farmingdale
Family Income Brackets in South Farmingdale
According to the South Farmingdale family income data, there are 1,515 families falling into the $200,000+ income range, which is the most common income bracket and makes up 38.8% of all families. Conversely, the less than $10,000 income bracket is the least frequent group with only 27 families (0.7%) belonging to this category.
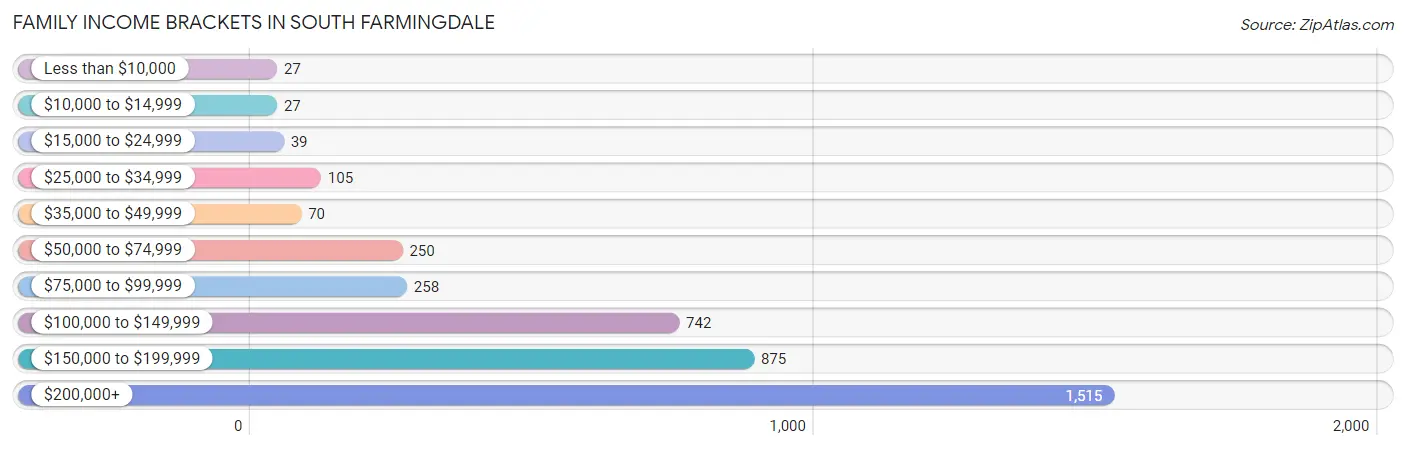
| Income Bracket | # Families | % Families |
| Less than $10,000 | 27 | 0.7% |
| $10,000 to $14,999 | 27 | 0.7% |
| $15,000 to $24,999 | 39 | 1.0% |
| $25,000 to $34,999 | 105 | 2.7% |
| $35,000 to $49,999 | 70 | 1.8% |
| $50,000 to $74,999 | 250 | 6.4% |
| $75,000 to $99,999 | 258 | 6.6% |
| $100,000 to $149,999 | 742 | 19.0% |
| $150,000 to $199,999 | 875 | 22.4% |
| $200,000+ | 1,515 | 38.8% |
Family Income by Famaliy Size in South Farmingdale
5-person families (363 | 9.3%) account for the highest median family income in South Farmingdale with $230,956 per family, while 2-person families (1,328 | 34.0%) have the highest median income of $68,074 per family member.
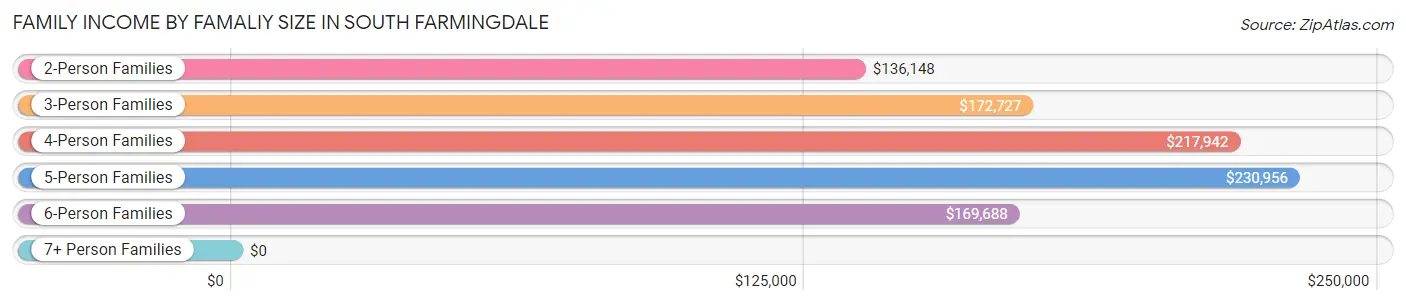
| Income Bracket | # Families | Median Income |
| 2-Person Families | 1,328 (34.0%) | $136,148 |
| 3-Person Families | 854 (21.9%) | $172,727 |
| 4-Person Families | 1,193 (30.5%) | $217,942 |
| 5-Person Families | 363 (9.3%) | $230,956 |
| 6-Person Families | 149 (3.8%) | $169,688 |
| 7+ Person Families | 18 (0.5%) | $0 |
| Total | 3,905 (100.0%) | $175,573 |
Family Income by Number of Earners in South Farmingdale
The median family income in South Farmingdale is $175,573, with families comprising 3+ earners (894) having the highest median family income of $231,891, while families with no earners (452) have the lowest median family income of $74,808, accounting for 22.9% and 11.6% of families, respectively.
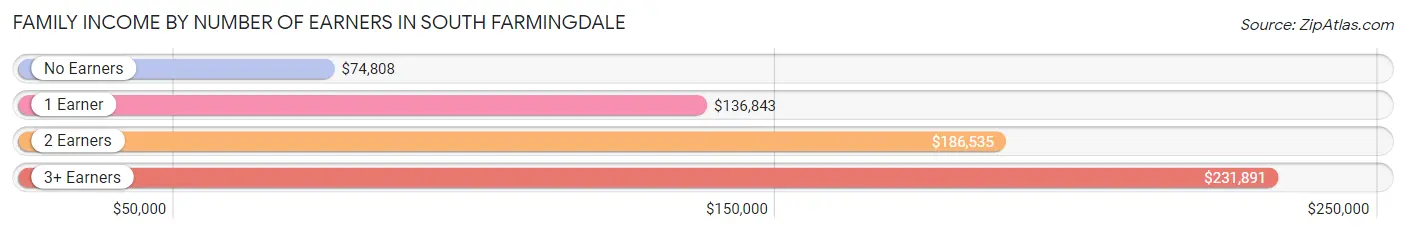
| Number of Earners | # Families | Median Income |
| No Earners | 452 (11.6%) | $74,808 |
| 1 Earner | 887 (22.7%) | $136,843 |
| 2 Earners | 1,672 (42.8%) | $186,535 |
| 3+ Earners | 894 (22.9%) | $231,891 |
| Total | 3,905 (100.0%) | $175,573 |
Household Income in South Farmingdale
Household Income Brackets in South Farmingdale
With 1,674 households falling in the category, the $200,000+ income range is the most frequent in South Farmingdale, accounting for 35.3% of all households. In contrast, only 52 households (1.1%) fall into the $10,000 to $14,999 income bracket, making it the least populous group.
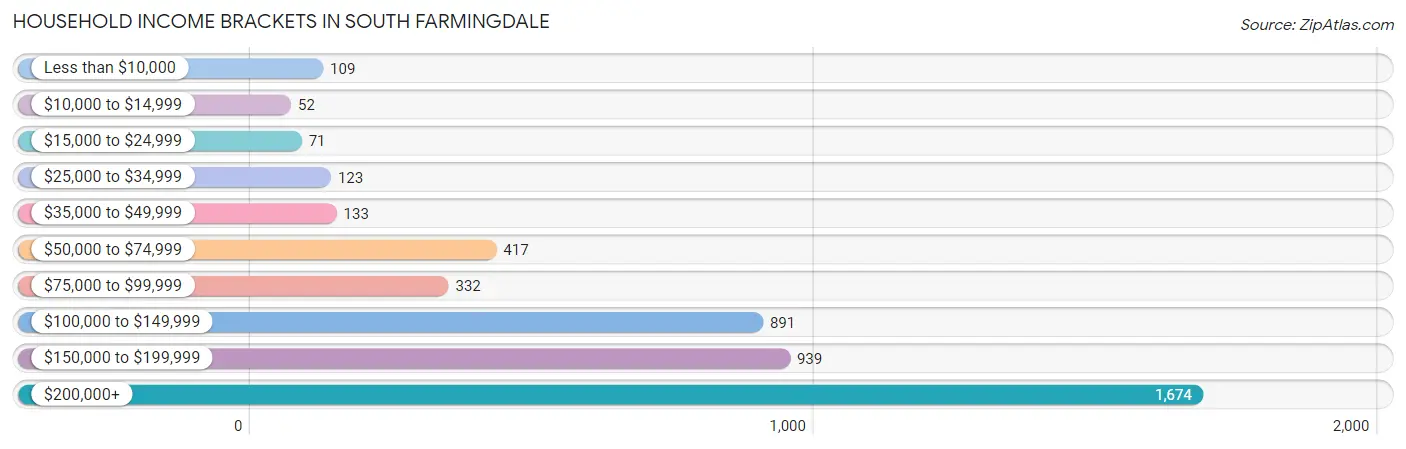
| Income Bracket | # Households | % Households |
| Less than $10,000 | 109 | 2.3% |
| $10,000 to $14,999 | 52 | 1.1% |
| $15,000 to $24,999 | 71 | 1.5% |
| $25,000 to $34,999 | 123 | 2.6% |
| $35,000 to $49,999 | 133 | 2.8% |
| $50,000 to $74,999 | 417 | 8.8% |
| $75,000 to $99,999 | 332 | 7.0% |
| $100,000 to $149,999 | 891 | 18.8% |
| $150,000 to $199,999 | 939 | 19.8% |
| $200,000+ | 1,674 | 35.3% |
Household Income by Householder Age in South Farmingdale
The median household income in South Farmingdale is $166,680, with the highest median household income of $182,281 found in the 45 to 64 years age bracket for the primary householder. A total of 2,259 households (47.6%) fall into this category.
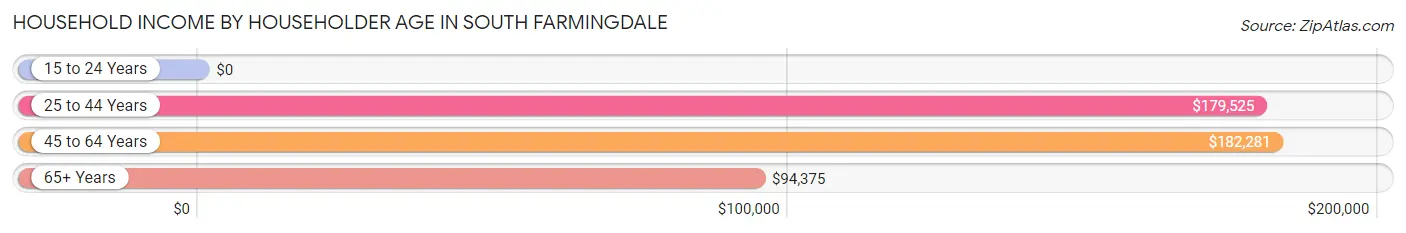
| Income Bracket | # Households | Median Income |
| 15 to 24 Years | 0 (0.0%) | $0 |
| 25 to 44 Years | 1,103 (23.3%) | $179,525 |
| 45 to 64 Years | 2,259 (47.6%) | $182,281 |
| 65+ Years | 1,380 (29.1%) | $94,375 |
| Total | 4,742 (100.0%) | $166,680 |
Poverty in South Farmingdale
Income Below Poverty by Sex and Age in South Farmingdale
With 3.0% poverty level for males and 4.3% for females among the residents of South Farmingdale, 12 to 14 year old males and 75 year old and over females are the most vulnerable to poverty, with 15 males (11.0%) and 74 females (11.2%) in their respective age groups living below the poverty level.
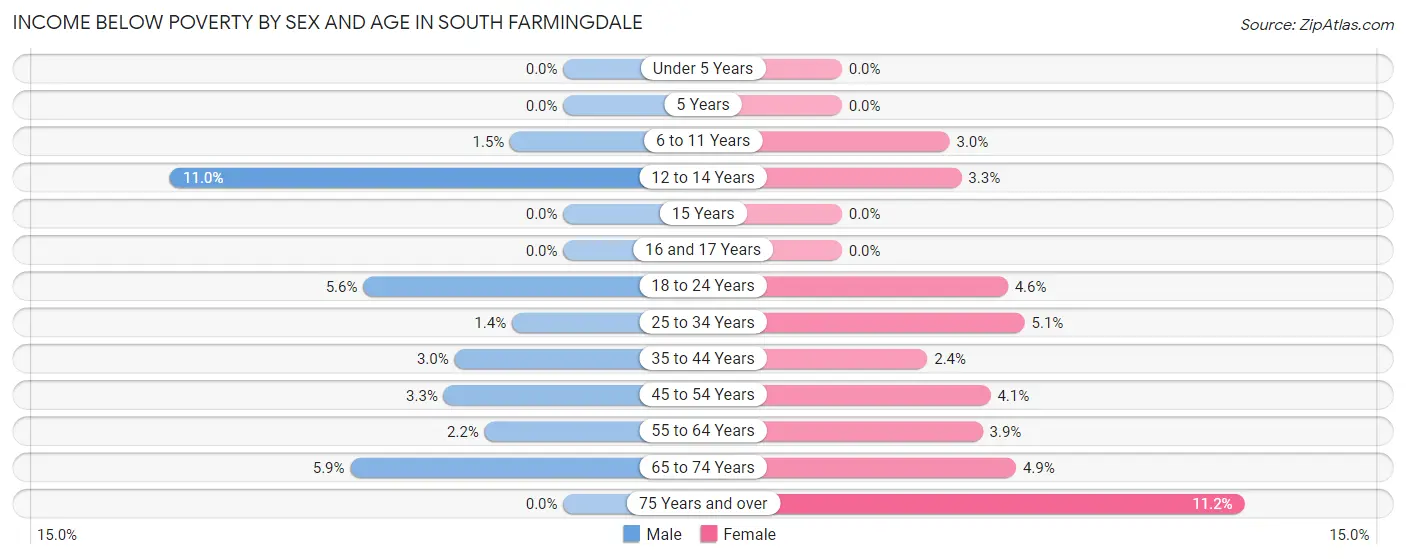
| Age Bracket | Male | Female |
| Under 5 Years | 0 (0.0%) | 0 (0.0%) |
| 5 Years | 0 (0.0%) | 0 (0.0%) |
| 6 to 11 Years | 6 (1.5%) | 13 (3.0%) |
| 12 to 14 Years | 15 (11.0%) | 8 (3.3%) |
| 15 Years | 0 (0.0%) | 0 (0.0%) |
| 16 and 17 Years | 0 (0.0%) | 0 (0.0%) |
| 18 to 24 Years | 40 (5.6%) | 43 (4.6%) |
| 25 to 34 Years | 17 (1.4%) | 49 (5.1%) |
| 35 to 44 Years | 22 (3.0%) | 15 (2.4%) |
| 45 to 54 Years | 29 (3.3%) | 43 (4.1%) |
| 55 to 64 Years | 27 (2.2%) | 60 (3.9%) |
| 65 to 74 Years | 56 (5.9%) | 33 (4.9%) |
| 75 Years and over | 0 (0.0%) | 74 (11.2%) |
| Total | 212 (3.0%) | 338 (4.3%) |
Income Above Poverty by Sex and Age in South Farmingdale
According to the poverty statistics in South Farmingdale, males aged under 5 years and females aged under 5 years are the age groups that are most secure financially, with 100.0% of males and 100.0% of females in these age groups living above the poverty line.
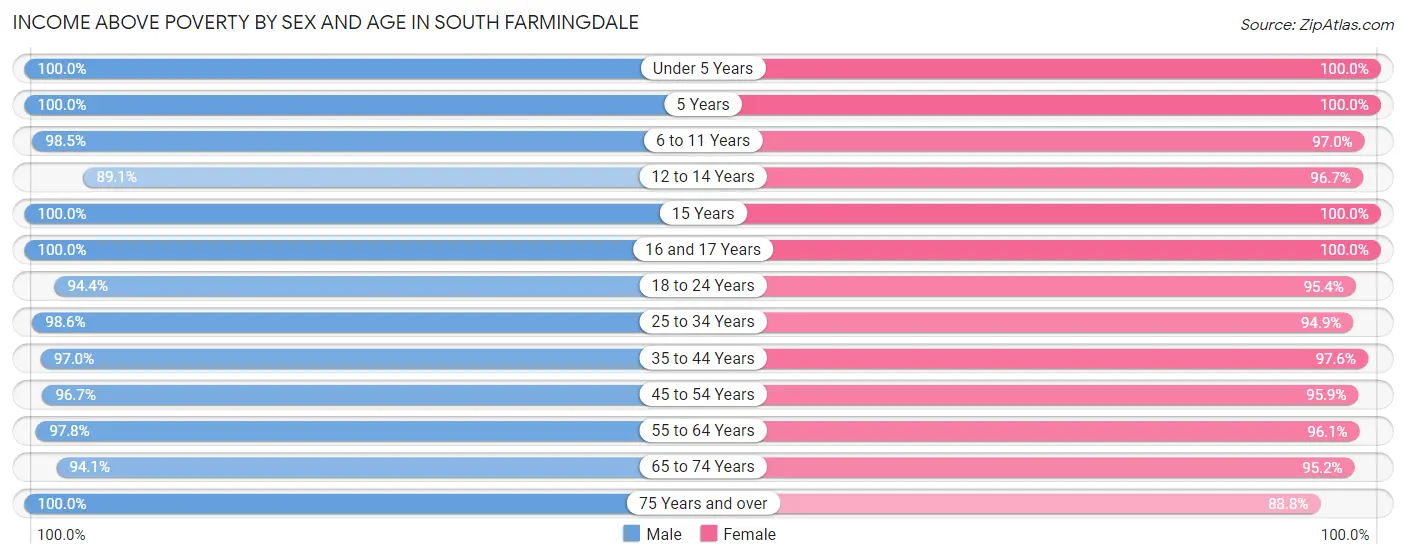
| Age Bracket | Male | Female |
| Under 5 Years | 279 (100.0%) | 399 (100.0%) |
| 5 Years | 76 (100.0%) | 40 (100.0%) |
| 6 to 11 Years | 399 (98.5%) | 421 (97.0%) |
| 12 to 14 Years | 122 (89.0%) | 232 (96.7%) |
| 15 Years | 118 (100.0%) | 200 (100.0%) |
| 16 and 17 Years | 123 (100.0%) | 178 (100.0%) |
| 18 to 24 Years | 678 (94.4%) | 888 (95.4%) |
| 25 to 34 Years | 1,173 (98.6%) | 914 (94.9%) |
| 35 to 44 Years | 703 (97.0%) | 615 (97.6%) |
| 45 to 54 Years | 843 (96.7%) | 996 (95.9%) |
| 55 to 64 Years | 1,205 (97.8%) | 1,469 (96.1%) |
| 65 to 74 Years | 889 (94.1%) | 647 (95.2%) |
| 75 Years and over | 278 (100.0%) | 586 (88.8%) |
| Total | 6,886 (97.0%) | 7,585 (95.7%) |
Income Below Poverty Among Married-Couple Families in South Farmingdale
The poverty statistics for married-couple families in South Farmingdale show that 2.1% or 71 of the total 3,354 families live below the poverty line. Families with no children have the highest poverty rate of 2.5%, comprising of 54 families. On the other hand, families with 3 or 4 children have the lowest poverty rate of 0.0%, which includes 0 families.
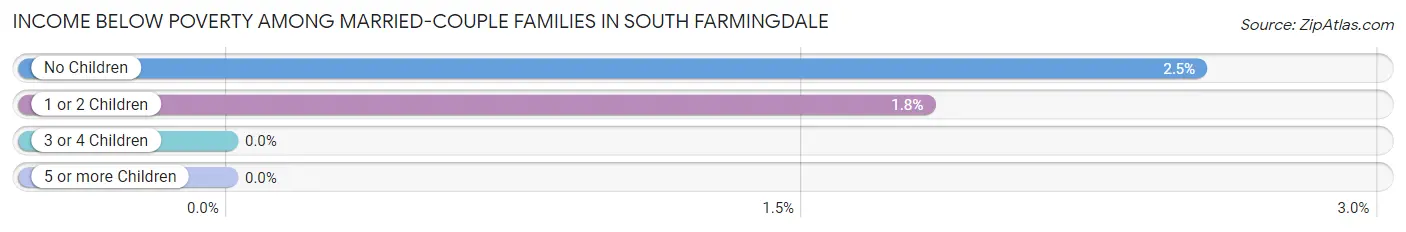
| Children | Above Poverty | Below Poverty |
| No Children | 2,082 (97.5%) | 54 (2.5%) |
| 1 or 2 Children | 917 (98.2%) | 17 (1.8%) |
| 3 or 4 Children | 284 (100.0%) | 0 (0.0%) |
| 5 or more Children | 0 (0.0%) | 0 (0.0%) |
| Total | 3,283 (97.9%) | 71 (2.1%) |
Income Below Poverty Among Single-Parent Households in South Farmingdale
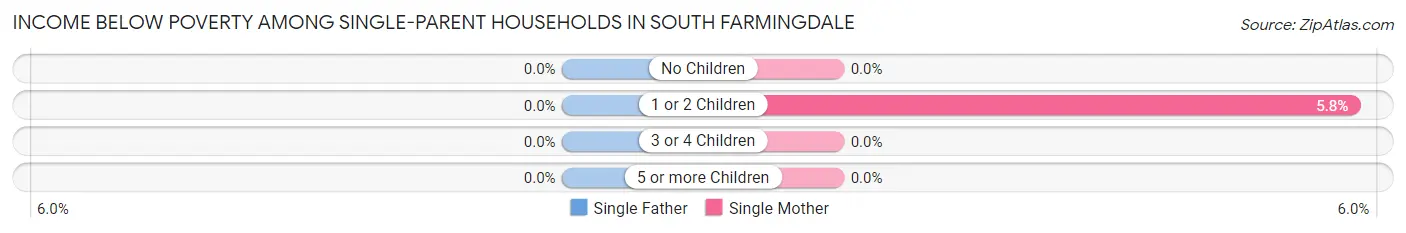
| Children | Single Father | Single Mother |
| No Children | 0 (0.0%) | 0 (0.0%) |
| 1 or 2 Children | 0 (0.0%) | 12 (5.8%) |
| 3 or 4 Children | 0 (0.0%) | 0 (0.0%) |
| 5 or more Children | 0 (0.0%) | 0 (0.0%) |
| Total | 0 (0.0%) | 12 (3.0%) |
Income Below Poverty Among Married-Couple vs Single-Parent Households in South Farmingdale
The poverty data for South Farmingdale shows that 71 of the married-couple family households (2.1%) and 12 of the single-parent households (2.2%) are living below the poverty level. Within the married-couple family households, those with no children have the highest poverty rate, with 54 households (2.5%) falling below the poverty line. Among the single-parent households, those with 1 or 2 children have the highest poverty rate, with 12 household (4.3%) living below poverty.
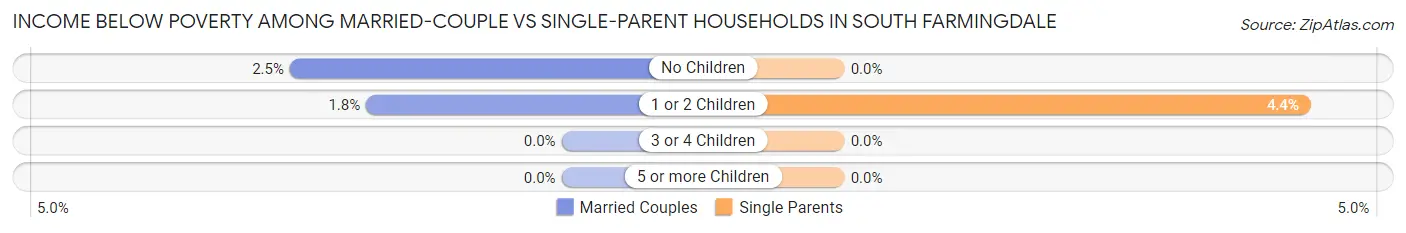
| Children | Married-Couple Families | Single-Parent Households |
| No Children | 54 (2.5%) | 0 (0.0%) |
| 1 or 2 Children | 17 (1.8%) | 12 (4.3%) |
| 3 or 4 Children | 0 (0.0%) | 0 (0.0%) |
| 5 or more Children | 0 (0.0%) | 0 (0.0%) |
| Total | 71 (2.1%) | 12 (2.2%) |
Race in South Farmingdale
The most populous races in South Farmingdale are White / Caucasian (12,143 | 80.8%), Hispanic or Latino (2,039 | 13.6%), and Two or more Races (1,271 | 8.5%).
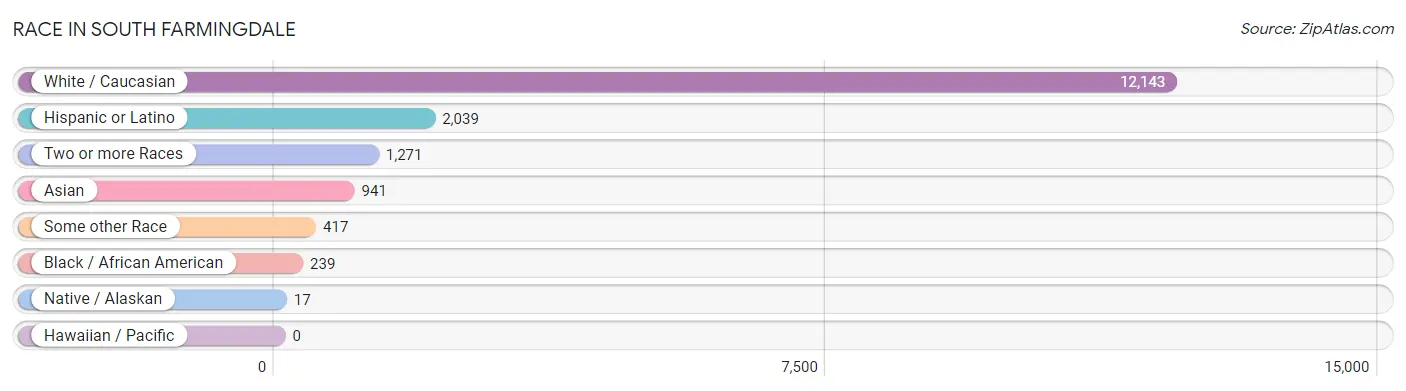
| Race | # Population | % Population |
| Asian | 941 | 6.3% |
| Black / African American | 239 | 1.6% |
| Hawaiian / Pacific | 0 | 0.0% |
| Hispanic or Latino | 2,039 | 13.6% |
| Native / Alaskan | 17 | 0.1% |
| White / Caucasian | 12,143 | 80.8% |
| Two or more Races | 1,271 | 8.5% |
| Some other Race | 417 | 2.8% |
| Total | 15,028 | 100.0% |
Ancestry in South Farmingdale
The most populous ancestries reported in South Farmingdale are Italian (4,898 | 32.6%), Irish (3,378 | 22.5%), German (2,190 | 14.6%), South American (867 | 5.8%), and Puerto Rican (825 | 5.5%), together accounting for 80.9% of all South Farmingdale residents.
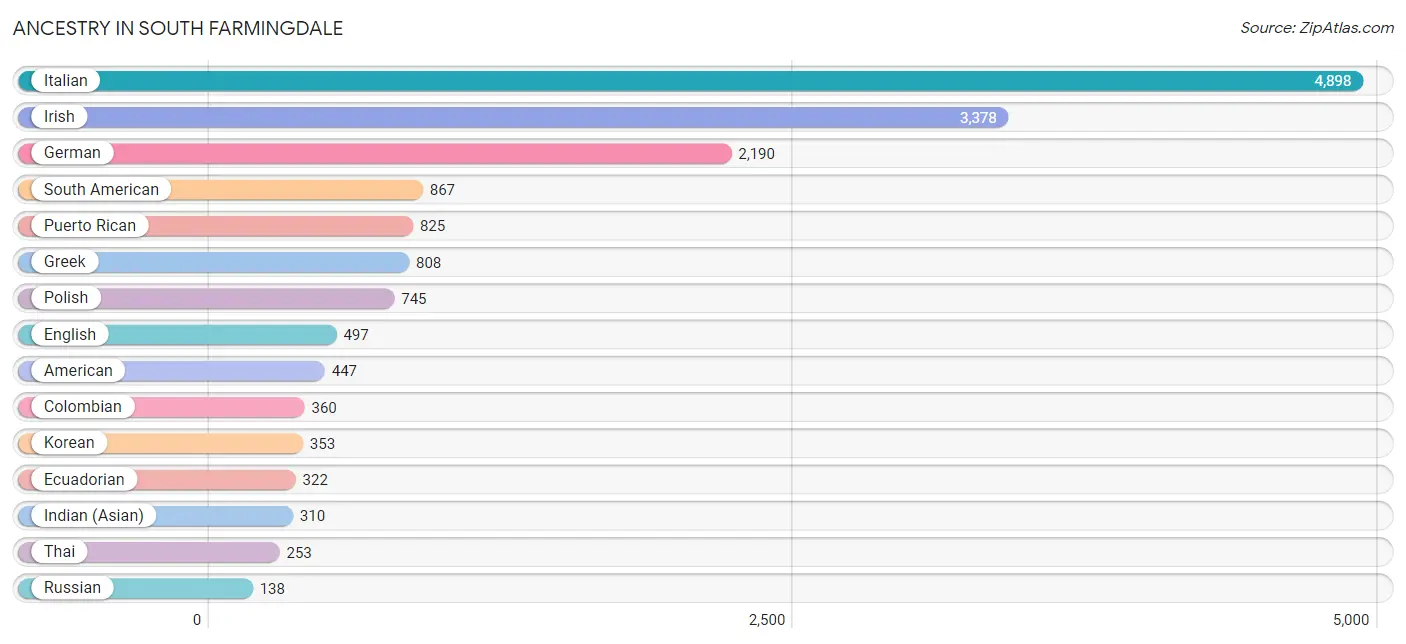
| Ancestry | # Population | % Population |
| African | 17 | 0.1% |
| Albanian | 7 | 0.1% |
| American | 447 | 3.0% |
| Arab | 110 | 0.7% |
| Argentinean | 123 | 0.8% |
| Armenian | 24 | 0.2% |
| Austrian | 9 | 0.1% |
| British | 69 | 0.5% |
| Burmese | 34 | 0.2% |
| Canadian | 6 | 0.0% |
| Central American | 32 | 0.2% |
| Central American Indian | 17 | 0.1% |
| Chilean | 16 | 0.1% |
| Colombian | 360 | 2.4% |
| Croatian | 28 | 0.2% |
| Cuban | 57 | 0.4% |
| Cypriot | 8 | 0.1% |
| Czech | 72 | 0.5% |
| Czechoslovakian | 10 | 0.1% |
| Dominican | 91 | 0.6% |
| Dutch | 34 | 0.2% |
| Eastern European | 9 | 0.1% |
| Ecuadorian | 322 | 2.1% |
| Egyptian | 33 | 0.2% |
| English | 497 | 3.3% |
| Ethiopian | 4 | 0.0% |
| European | 118 | 0.8% |
| Filipino | 42 | 0.3% |
| Finnish | 9 | 0.1% |
| French | 43 | 0.3% |
| French Canadian | 27 | 0.2% |
| German | 2,190 | 14.6% |
| Greek | 808 | 5.4% |
| Guyanese | 6 | 0.0% |
| Haitian | 15 | 0.1% |
| Hungarian | 75 | 0.5% |
| Indian (Asian) | 310 | 2.1% |
| Iranian | 8 | 0.1% |
| Irish | 3,378 | 22.5% |
| Italian | 4,898 | 32.6% |
| Jamaican | 92 | 0.6% |
| Korean | 353 | 2.4% |
| Lithuanian | 4 | 0.0% |
| Maltese | 21 | 0.1% |
| Northern European | 12 | 0.1% |
| Norwegian | 66 | 0.4% |
| Peruvian | 24 | 0.2% |
| Polish | 745 | 5.0% |
| Portuguese | 45 | 0.3% |
| Puerto Rican | 825 | 5.5% |
| Romanian | 36 | 0.2% |
| Russian | 138 | 0.9% |
| Salvadoran | 32 | 0.2% |
| Scotch-Irish | 22 | 0.2% |
| Scottish | 127 | 0.9% |
| Slavic | 15 | 0.1% |
| Slovak | 10 | 0.1% |
| South American | 867 | 5.8% |
| Spaniard | 129 | 0.9% |
| Subsaharan African | 21 | 0.1% |
| Swedish | 61 | 0.4% |
| Syrian | 6 | 0.0% |
| Thai | 253 | 1.7% |
| Trinidadian and Tobagonian | 26 | 0.2% |
| Turkish | 32 | 0.2% |
| Ukrainian | 59 | 0.4% |
| Venezuelan | 22 | 0.2% |
| Vietnamese | 29 | 0.2% |
| West Indian | 57 | 0.4% | View All 69 Rows |
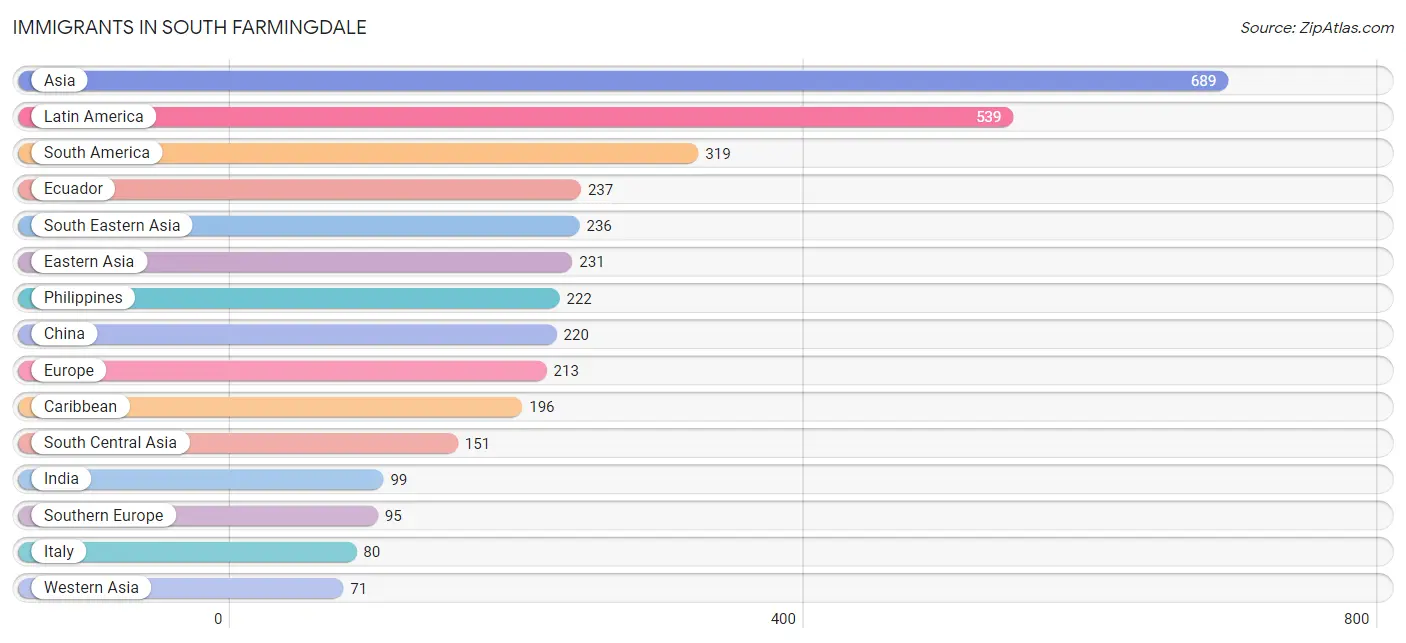
Immigrants in South Farmingdale
The most numerous immigrant groups reported in South Farmingdale came from Asia (689 | 4.6%), Latin America (539 | 3.6%), South America (319 | 2.1%), Ecuador (237 | 1.6%), and South Eastern Asia (236 | 1.6%), together accounting for 13.4% of all South Farmingdale residents.
| Immigration Origin | # Population | % Population |
| Africa | 43 | 0.3% |
| Argentina | 15 | 0.1% |
| Asia | 689 | 4.6% |
| Bangladesh | 20 | 0.1% |
| Barbados | 12 | 0.1% |
| Caribbean | 196 | 1.3% |
| Central America | 24 | 0.2% |
| Chile | 4 | 0.0% |
| China | 220 | 1.5% |
| Colombia | 45 | 0.3% |
| Cuba | 17 | 0.1% |
| Dominican Republic | 53 | 0.4% |
| Eastern Africa | 4 | 0.0% |
| Eastern Asia | 231 | 1.5% |
| Eastern Europe | 38 | 0.3% |
| Ecuador | 237 | 1.6% |
| Egypt | 23 | 0.2% |
| El Salvador | 24 | 0.2% |
| England | 6 | 0.0% |
| Ethiopia | 4 | 0.0% |
| Europe | 213 | 1.4% |
| Germany | 34 | 0.2% |
| Guyana | 18 | 0.1% |
| Haiti | 15 | 0.1% |
| Hong Kong | 49 | 0.3% |
| India | 99 | 0.7% |
| Ireland | 40 | 0.3% |
| Italy | 80 | 0.5% |
| Jamaica | 69 | 0.5% |
| Jordan | 35 | 0.2% |
| Korea | 11 | 0.1% |
| Latin America | 539 | 3.6% |
| Middle Africa | 16 | 0.1% |
| Northern Africa | 23 | 0.2% |
| Northern Europe | 46 | 0.3% |
| Pakistan | 32 | 0.2% |
| Philippines | 222 | 1.5% |
| Poland | 8 | 0.1% |
| Portugal | 15 | 0.1% |
| Romania | 30 | 0.2% |
| South America | 319 | 2.1% |
| South Central Asia | 151 | 1.0% |
| South Eastern Asia | 236 | 1.6% |
| Southern Europe | 95 | 0.6% |
| Taiwan | 3 | 0.0% |
| Trinidad and Tobago | 30 | 0.2% |
| Vietnam | 14 | 0.1% |
| Western Asia | 71 | 0.5% |
| Western Europe | 34 | 0.2% | View All 49 Rows |
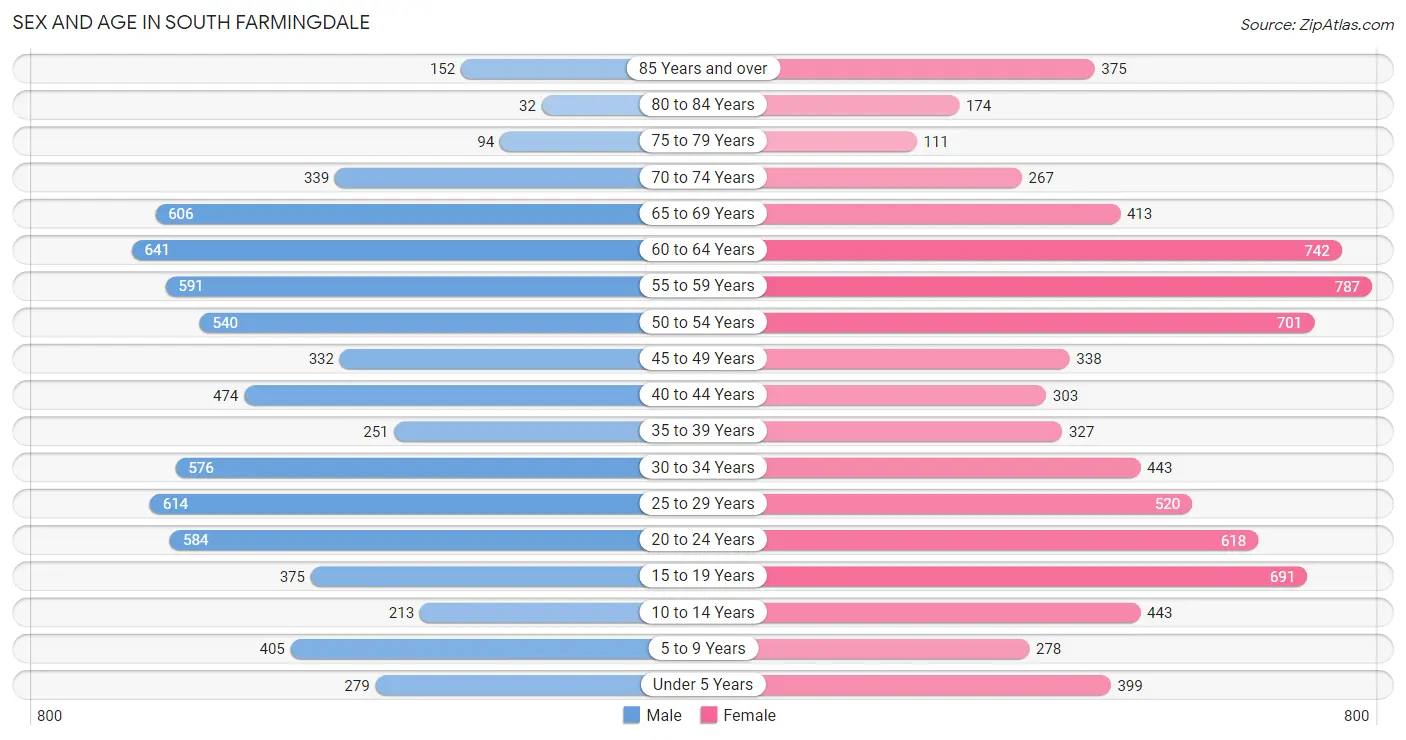
Sex and Age in South Farmingdale
Sex and Age in South Farmingdale
The most populous age groups in South Farmingdale are 60 to 64 Years (641 | 9.0%) for men and 55 to 59 Years (787 | 9.9%) for women.
| Age Bracket | Male | Female |
| Under 5 Years | 279 (3.9%) | 399 (5.0%) |
| 5 to 9 Years | 405 (5.7%) | 278 (3.5%) |
| 10 to 14 Years | 213 (3.0%) | 443 (5.6%) |
| 15 to 19 Years | 375 (5.3%) | 691 (8.7%) |
| 20 to 24 Years | 584 (8.2%) | 618 (7.8%) |
| 25 to 29 Years | 614 (8.6%) | 520 (6.6%) |
| 30 to 34 Years | 576 (8.1%) | 443 (5.6%) |
| 35 to 39 Years | 251 (3.5%) | 327 (4.1%) |
| 40 to 44 Years | 474 (6.7%) | 303 (3.8%) |
| 45 to 49 Years | 332 (4.7%) | 338 (4.3%) |
| 50 to 54 Years | 540 (7.6%) | 701 (8.8%) |
| 55 to 59 Years | 591 (8.3%) | 787 (9.9%) |
| 60 to 64 Years | 641 (9.0%) | 742 (9.4%) |
| 65 to 69 Years | 606 (8.5%) | 413 (5.2%) |
| 70 to 74 Years | 339 (4.8%) | 267 (3.4%) |
| 75 to 79 Years | 94 (1.3%) | 111 (1.4%) |
| 80 to 84 Years | 32 (0.4%) | 174 (2.2%) |
| 85 Years and over | 152 (2.1%) | 375 (4.7%) |
| Total | 7,098 (100.0%) | 7,930 (100.0%) |
Families and Households in South Farmingdale
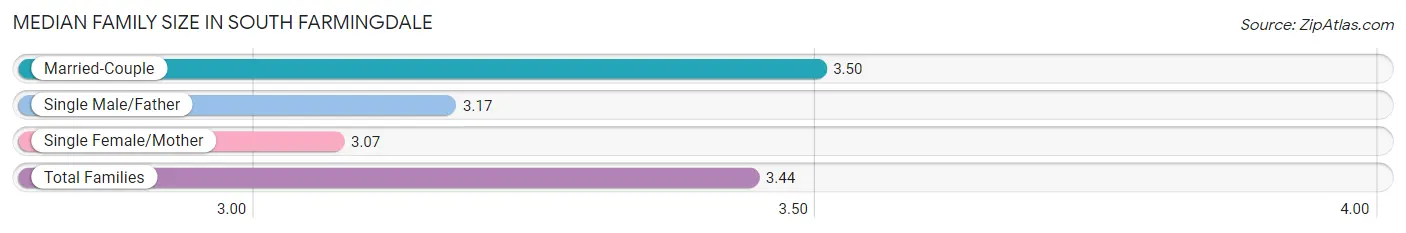
Median Family Size in South Farmingdale
The median family size in South Farmingdale is 3.44 persons per family, with married-couple families (3,354 | 85.9%) accounting for the largest median family size of 3.5 persons per family. On the other hand, single female/mother families (396 | 10.1%) represent the smallest median family size with 3.07 persons per family.
| Family Type | # Families | Family Size |
| Married-Couple | 3,354 (85.9%) | 3.50 |
| Single Male/Father | 155 (4.0%) | 3.17 |
| Single Female/Mother | 396 (10.1%) | 3.07 |
| Total Families | 3,905 (100.0%) | 3.44 |
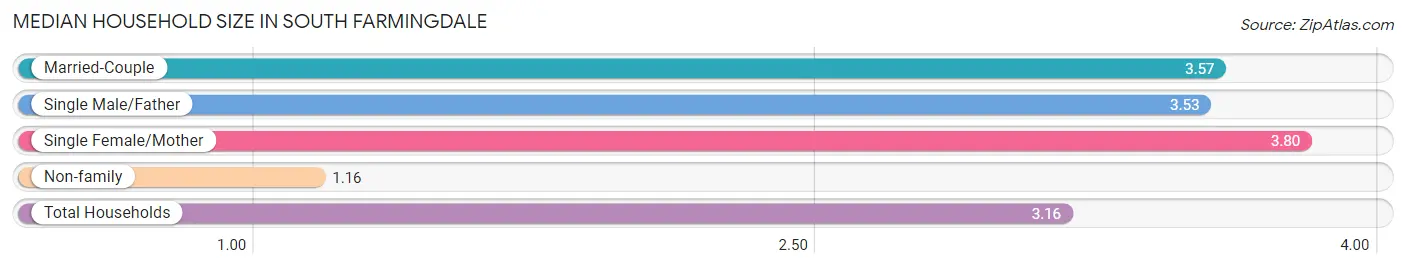
Median Household Size in South Farmingdale
The median household size in South Farmingdale is 3.16 persons per household, with single female/mother households (396 | 8.4%) accounting for the largest median household size of 3.8 persons per household. non-family households (837 | 17.6%) represent the smallest median household size with 1.16 persons per household.
| Household Type | # Households | Household Size |
| Married-Couple | 3,354 (70.7%) | 3.57 |
| Single Male/Father | 155 (3.3%) | 3.53 |
| Single Female/Mother | 396 (8.4%) | 3.80 |
| Non-family | 837 (17.6%) | 1.16 |
| Total Households | 4,742 (100.0%) | 3.16 |
Household Size by Marriage Status in South Farmingdale
Out of a total of 4,742 households in South Farmingdale, 3,905 (82.4%) are family households, while 837 (17.6%) are nonfamily households. The most numerous type of family households are 2-person households, comprising 1,237, and the most common type of nonfamily households are 1-person households, comprising 735.
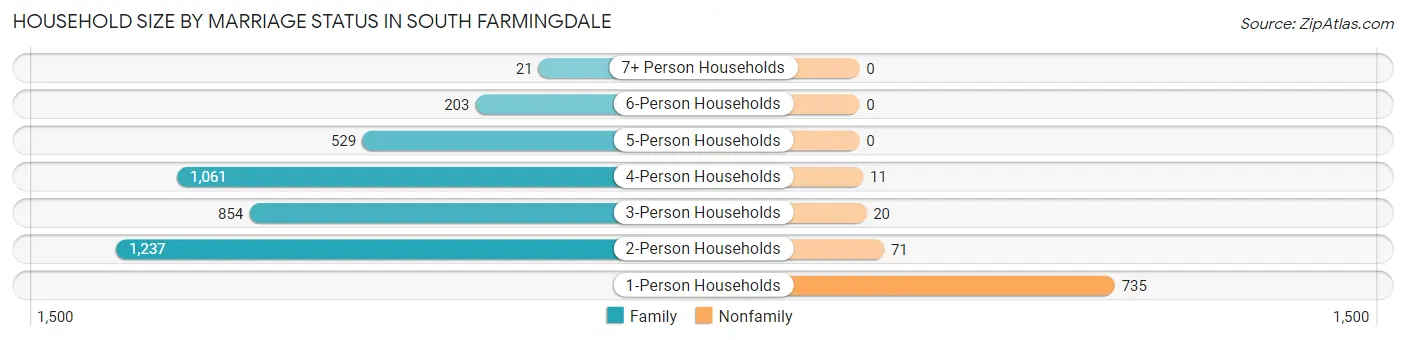
| Household Size | Family Households | Nonfamily Households |
| 1-Person Households | - | 735 (15.5%) |
| 2-Person Households | 1,237 (26.1%) | 71 (1.5%) |
| 3-Person Households | 854 (18.0%) | 20 (0.4%) |
| 4-Person Households | 1,061 (22.4%) | 11 (0.2%) |
| 5-Person Households | 529 (11.2%) | 0 (0.0%) |
| 6-Person Households | 203 (4.3%) | 0 (0.0%) |
| 7+ Person Households | 21 (0.4%) | 0 (0.0%) |
| Total | 3,905 (82.4%) | 837 (17.6%) |
Female Fertility in South Farmingdale
Fertility by Age in South Farmingdale
Average fertility rate in South Farmingdale is 41.0 births per 1,000 women. Women in the age bracket of 20 to 34 years have the highest fertility rate with 77.0 births per 1,000 women. Women in the age bracket of 20 to 34 years acount for 88.4% of all women with births.
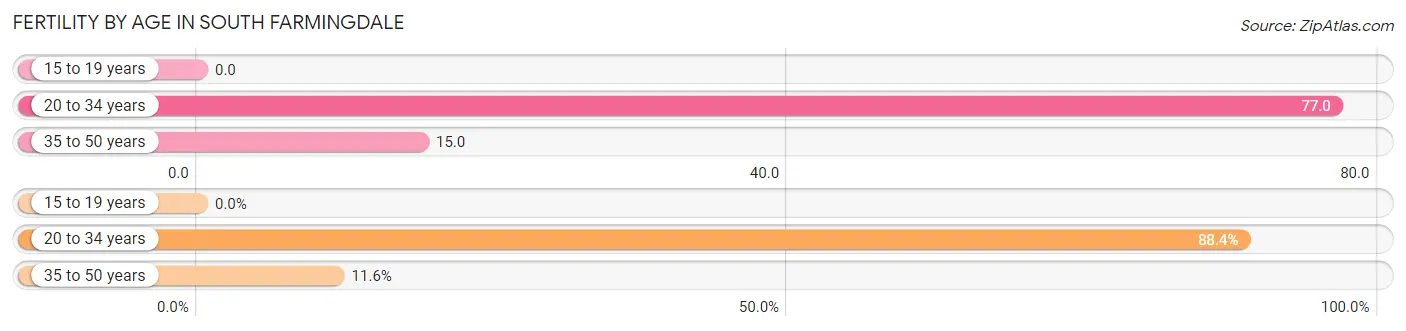
| Age Bracket | Women with Births | Births / 1,000 Women |
| 15 to 19 years | 0 (0.0%) | 0.0 |
| 20 to 34 years | 122 (88.4%) | 77.0 |
| 35 to 50 years | 16 (11.6%) | 15.0 |
| Total | 138 (100.0%) | 41.0 |
Fertility by Age by Marriage Status in South Farmingdale
97.8% of women with births (138) in South Farmingdale are married. The highest percentage of unmarried women with births falls into 35 to 50 years age bracket with 18.8% of them unmarried at the time of birth, while the lowest percentage of unmarried women with births belong to 20 to 34 years age bracket with 0.0% of them unmarried.
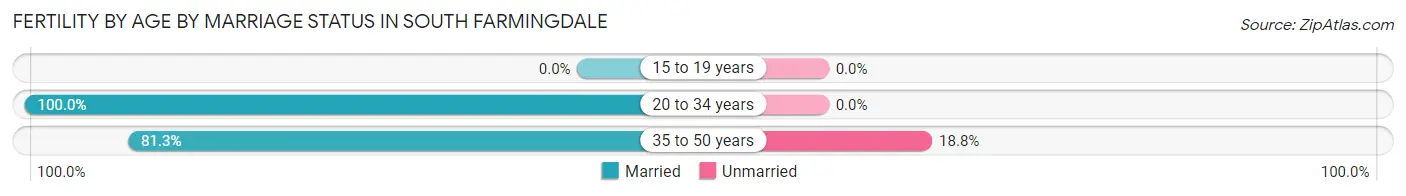
| Age Bracket | Married | Unmarried |
| 15 to 19 years | 0 (0.0%) | 0 (0.0%) |
| 20 to 34 years | 122 (100.0%) | 0 (0.0%) |
| 35 to 50 years | 13 (81.2%) | 3 (18.8%) |
| Total | 135 (97.8%) | 3 (2.2%) |
Fertility by Education in South Farmingdale
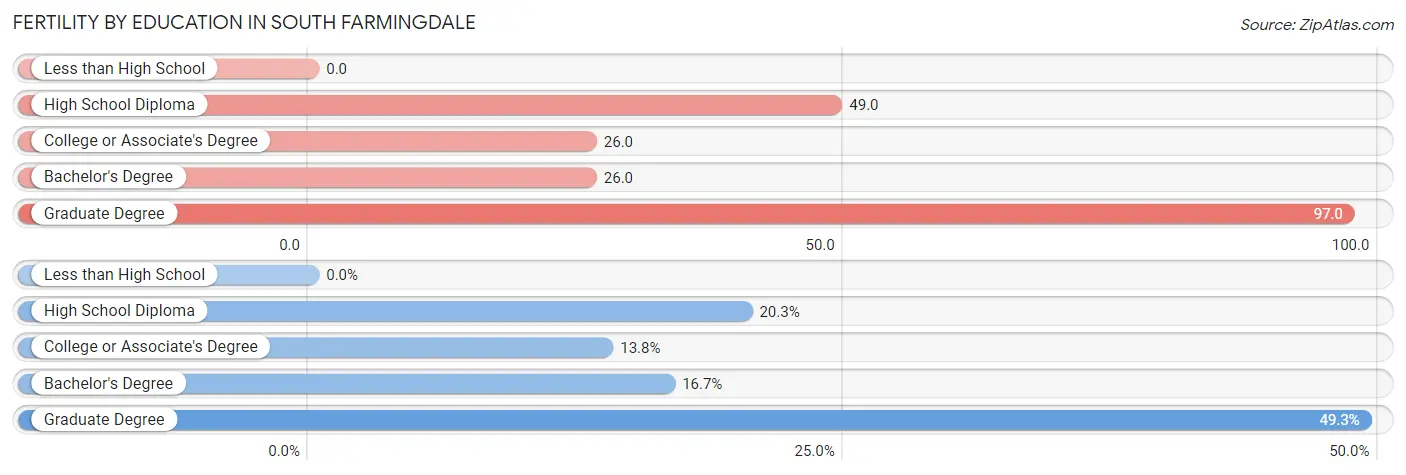
| Educational Attainment | Women with Births | Births / 1,000 Women |
| Less than High School | 0 (0.0%) | 0.0 |
| High School Diploma | 28 (20.3%) | 49.0 |
| College or Associate's Degree | 19 (13.8%) | 26.0 |
| Bachelor's Degree | 23 (16.7%) | 26.0 |
| Graduate Degree | 68 (49.3%) | 97.0 |
| Total | 138 (100.0%) | 41.0 |
Fertility by Education by Marriage Status in South Farmingdale
2.2% of women with births in South Farmingdale are unmarried. Women with the educational attainment of high school diploma are most likely to be married with 100.0% of them married at childbirth, while women with the educational attainment of graduate degree are least likely to be married with 4.4% of them unmarried at childbirth.
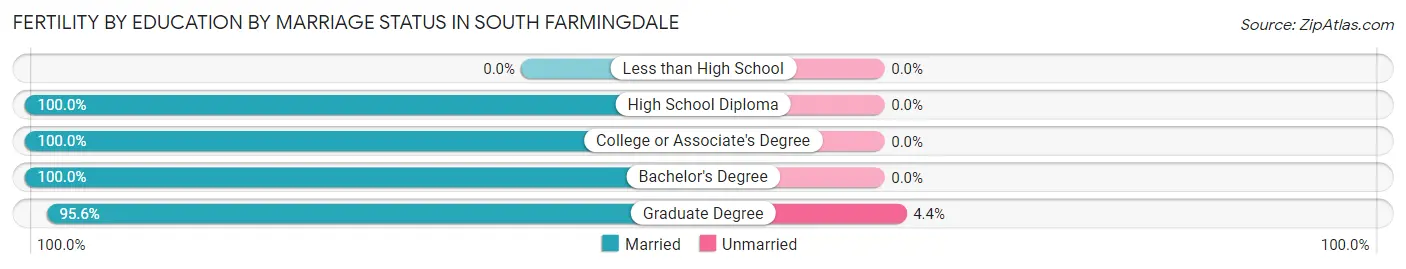
| Educational Attainment | Married | Unmarried |
| Less than High School | 0 (0.0%) | 0 (0.0%) |
| High School Diploma | 28 (100.0%) | 0 (0.0%) |
| College or Associate's Degree | 19 (100.0%) | 0 (0.0%) |
| Bachelor's Degree | 23 (100.0%) | 0 (0.0%) |
| Graduate Degree | 65 (95.6%) | 3 (4.4%) |
| Total | 135 (97.8%) | 3 (2.2%) |
Employment Characteristics in South Farmingdale
Employment by Class of Employer in South Farmingdale
Among the 7,807 employed individuals in South Farmingdale, private company employees (4,848 | 62.1%), local government employees (1,112 | 14.2%), and not-for-profit organizations (531 | 6.8%) make up the most common classes of employment.
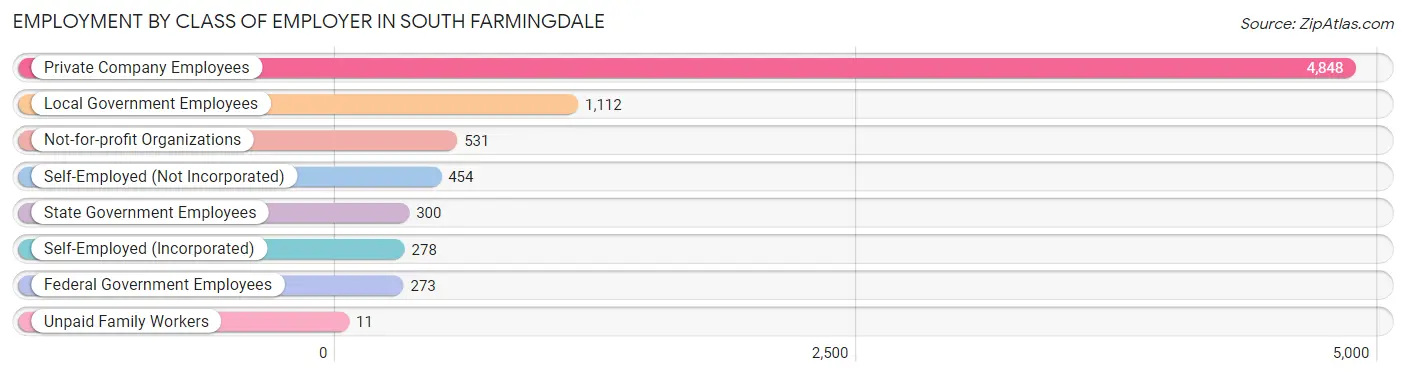
| Employer Class | # Employees | % Employees |
| Private Company Employees | 4,848 | 62.1% |
| Self-Employed (Incorporated) | 278 | 3.6% |
| Self-Employed (Not Incorporated) | 454 | 5.8% |
| Not-for-profit Organizations | 531 | 6.8% |
| Local Government Employees | 1,112 | 14.2% |
| State Government Employees | 300 | 3.8% |
| Federal Government Employees | 273 | 3.5% |
| Unpaid Family Workers | 11 | 0.1% |
| Total | 7,807 | 100.0% |
Employment Status by Age in South Farmingdale
According to the labor force statistics for South Farmingdale, out of the total population over 16 years of age (12,693), 66.5% or 8,441 individuals are in the labor force, with 5.9% or 498 of them unemployed. The age group with the highest labor force participation rate is 30 to 34 years, with 91.5% or 932 individuals in the labor force. Within the labor force, the 25 to 29 years age range has the highest percentage of unemployed individuals, with 20.0% or 192 of them being unemployed.
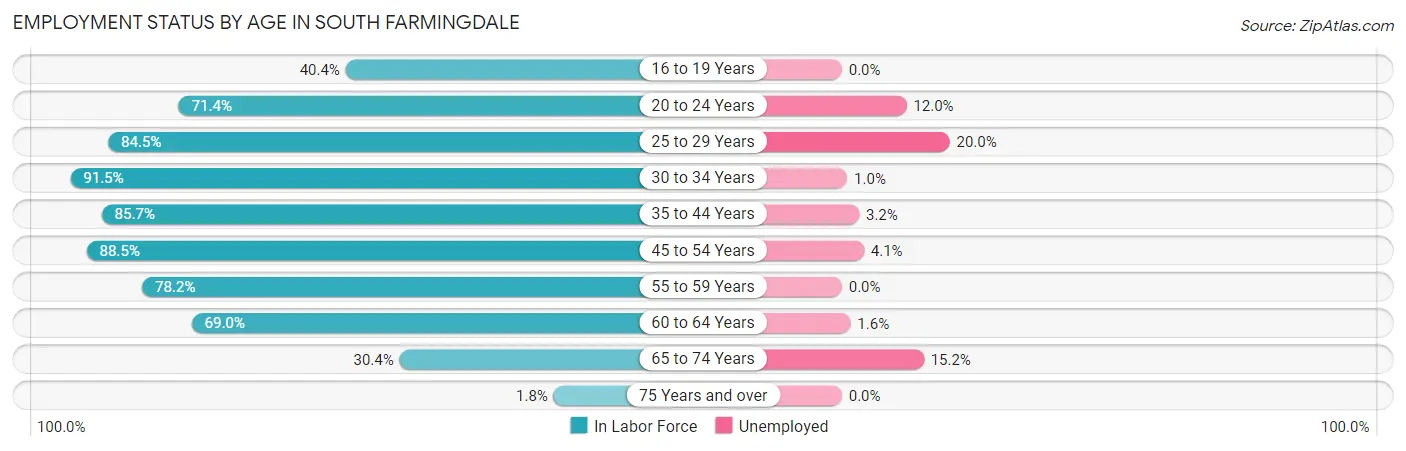
| Age Bracket | In Labor Force | Unemployed |
| 16 to 19 Years | 302 (40.4%) | 0 (0.0%) |
| 20 to 24 Years | 858 (71.4%) | 103 (12.0%) |
| 25 to 29 Years | 958 (84.5%) | 192 (20.0%) |
| 30 to 34 Years | 932 (91.5%) | 9 (1.0%) |
| 35 to 44 Years | 1,161 (85.7%) | 37 (3.2%) |
| 45 to 54 Years | 1,691 (88.5%) | 69 (4.1%) |
| 55 to 59 Years | 1,078 (78.2%) | 0 (0.0%) |
| 60 to 64 Years | 954 (69.0%) | 15 (1.6%) |
| 65 to 74 Years | 494 (30.4%) | 75 (15.2%) |
| 75 Years and over | 17 (1.8%) | 0 (0.0%) |
| Total | 8,441 (66.5%) | 498 (5.9%) |
Employment Status by Educational Attainment in South Farmingdale
According to labor force statistics for South Farmingdale, 82.8% of individuals (6,773) out of the total population between 25 and 64 years of age (8,180) are in the labor force, with 4.8% or 325 of them being unemployed. The group with the highest labor force participation rate are those with the educational attainment of bachelor's degree or higher, with 87.2% or 3,379 individuals in the labor force. Within the labor force, individuals with college / associate degree education have the highest percentage of unemployment, with 9.5% or 199 of them being unemployed.
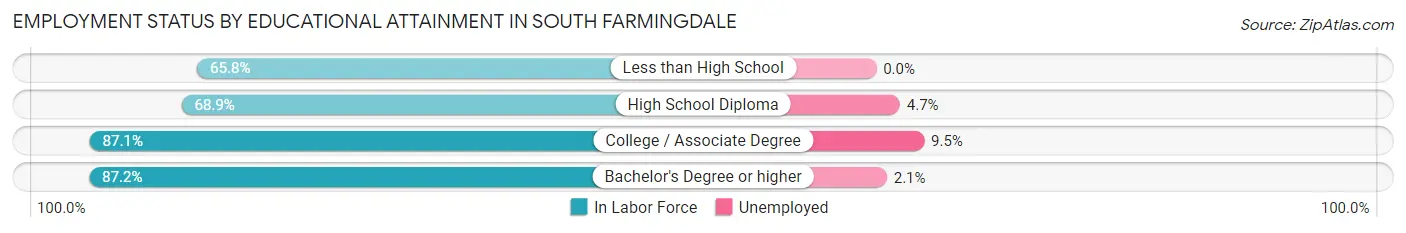
| Educational Attainment | In Labor Force | Unemployed |
| Less than High School | 225 (65.8%) | 0 (0.0%) |
| High School Diploma | 1,071 (68.9%) | 73 (4.7%) |
| College / Associate Degree | 2,098 (87.1%) | 229 (9.5%) |
| Bachelor's Degree or higher | 3,379 (87.2%) | 81 (2.1%) |
| Total | 6,773 (82.8%) | 393 (4.8%) |
Employment Occupations by Sex in South Farmingdale
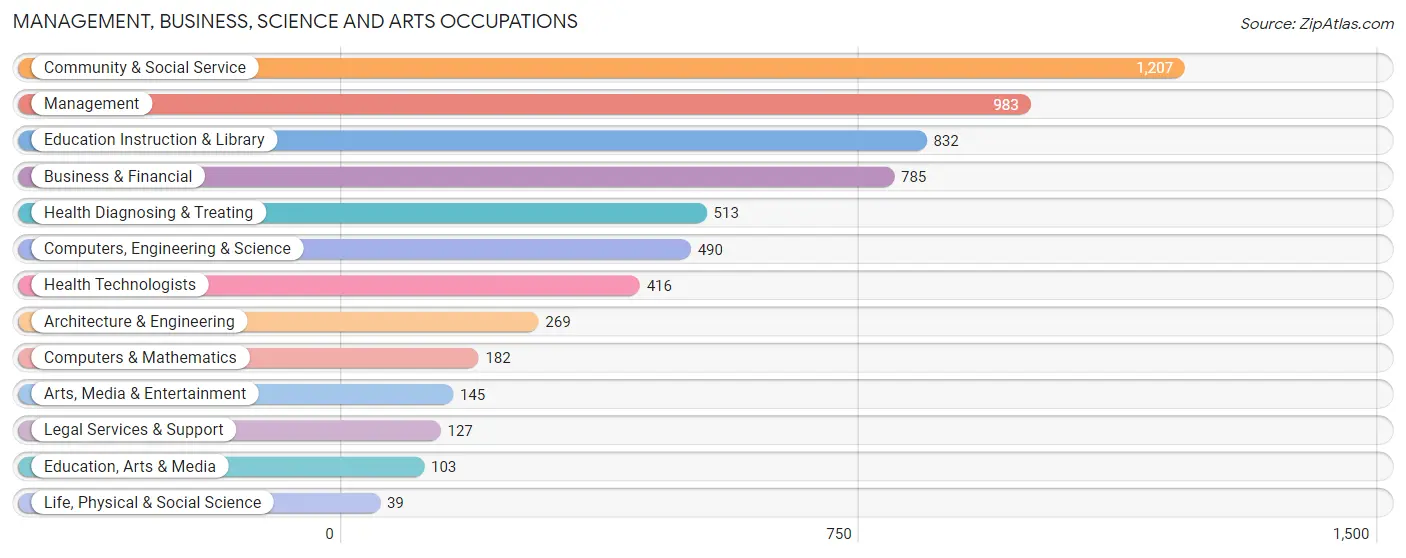
Management, Business, Science and Arts Occupations
The most common Management, Business, Science and Arts occupations in South Farmingdale are Community & Social Service (1,207 | 15.3%), Management (983 | 12.4%), Education Instruction & Library (832 | 10.5%), Business & Financial (785 | 9.9%), and Health Diagnosing & Treating (513 | 6.5%).
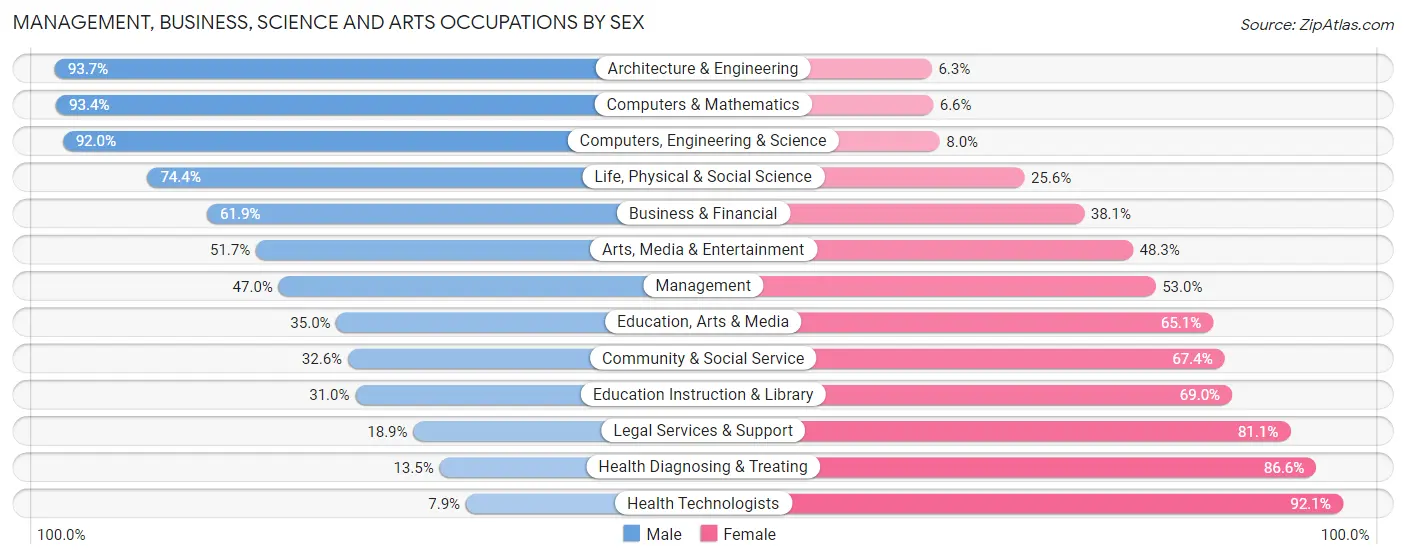
Management, Business, Science and Arts Occupations by Sex
Within the Management, Business, Science and Arts occupations in South Farmingdale, the most male-oriented occupations are Architecture & Engineering (93.7%), Computers & Mathematics (93.4%), and Computers, Engineering & Science (92.0%), while the most female-oriented occupations are Health Technologists (92.1%), Health Diagnosing & Treating (86.6%), and Legal Services & Support (81.1%).
| Occupation | Male | Female |
| Management | 462 (47.0%) | 521 (53.0%) |
| Business & Financial | 486 (61.9%) | 299 (38.1%) |
| Computers, Engineering & Science | 451 (92.0%) | 39 (8.0%) |
| Computers & Mathematics | 170 (93.4%) | 12 (6.6%) |
| Architecture & Engineering | 252 (93.7%) | 17 (6.3%) |
| Life, Physical & Social Science | 29 (74.4%) | 10 (25.6%) |
| Community & Social Service | 393 (32.6%) | 814 (67.4%) |
| Education, Arts & Media | 36 (34.9%) | 67 (65.0%) |
| Legal Services & Support | 24 (18.9%) | 103 (81.1%) |
| Education Instruction & Library | 258 (31.0%) | 574 (69.0%) |
| Arts, Media & Entertainment | 75 (51.7%) | 70 (48.3%) |
| Health Diagnosing & Treating | 69 (13.5%) | 444 (86.6%) |
| Health Technologists | 33 (7.9%) | 383 (92.1%) |
| Total (Category) | 1,861 (46.8%) | 2,117 (53.2%) |
| Total (Overall) | 4,141 (52.4%) | 3,755 (47.6%) |
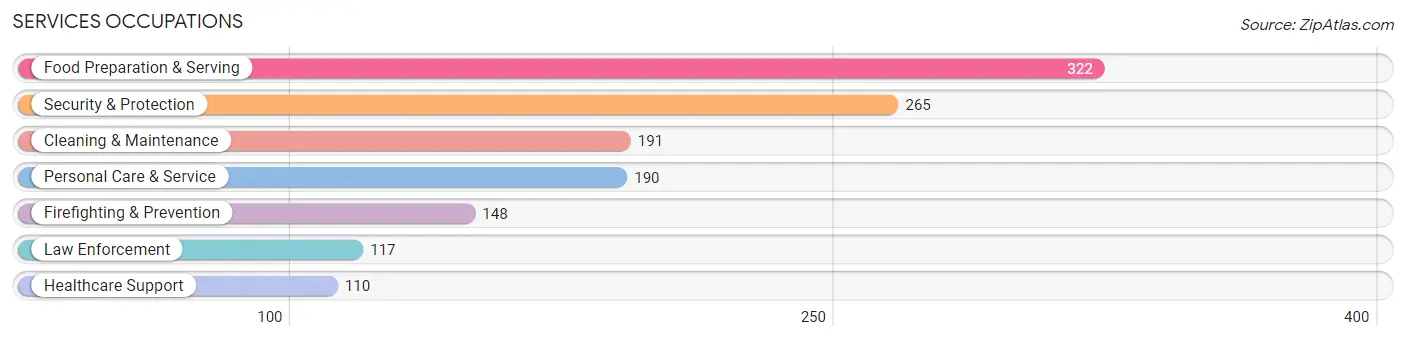
Services Occupations
The most common Services occupations in South Farmingdale are Food Preparation & Serving (322 | 4.1%), Security & Protection (265 | 3.4%), Cleaning & Maintenance (191 | 2.4%), Personal Care & Service (190 | 2.4%), and Firefighting & Prevention (148 | 1.9%).
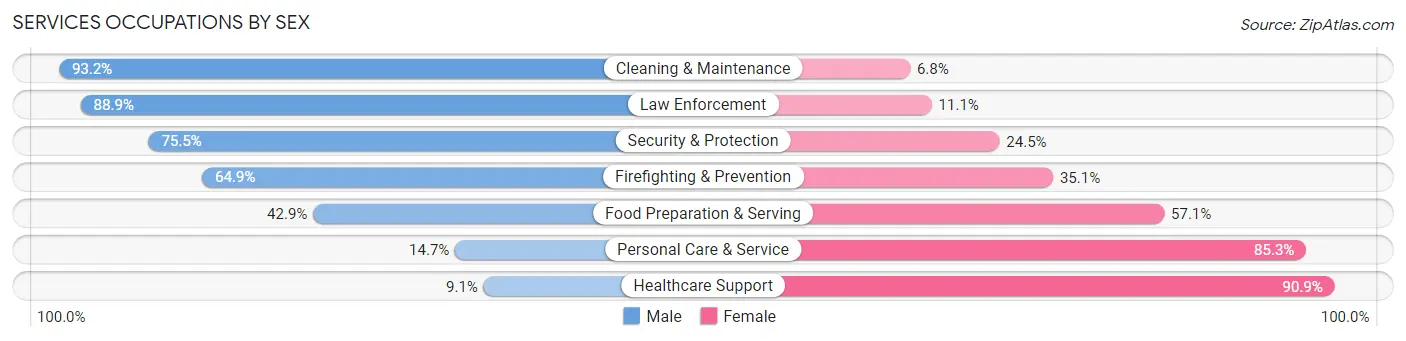
Services Occupations by Sex
Within the Services occupations in South Farmingdale, the most male-oriented occupations are Cleaning & Maintenance (93.2%), Law Enforcement (88.9%), and Security & Protection (75.5%), while the most female-oriented occupations are Healthcare Support (90.9%), Personal Care & Service (85.3%), and Food Preparation & Serving (57.1%).
| Occupation | Male | Female |
| Healthcare Support | 10 (9.1%) | 100 (90.9%) |
| Security & Protection | 200 (75.5%) | 65 (24.5%) |
| Firefighting & Prevention | 96 (64.9%) | 52 (35.1%) |
| Law Enforcement | 104 (88.9%) | 13 (11.1%) |
| Food Preparation & Serving | 138 (42.9%) | 184 (57.1%) |
| Cleaning & Maintenance | 178 (93.2%) | 13 (6.8%) |
| Personal Care & Service | 28 (14.7%) | 162 (85.3%) |
| Total (Category) | 554 (51.4%) | 524 (48.6%) |
| Total (Overall) | 4,141 (52.4%) | 3,755 (47.6%) |
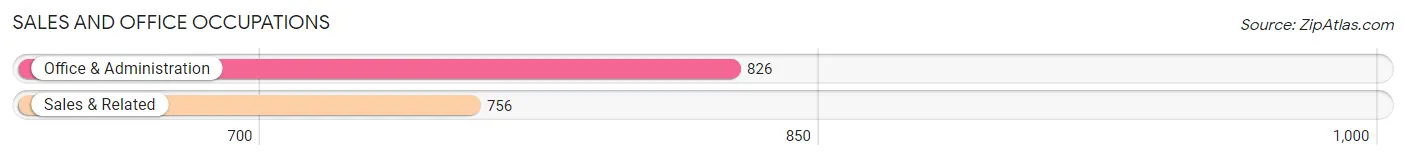
Sales and Office Occupations
The most common Sales and Office occupations in South Farmingdale are Office & Administration (826 | 10.5%), and Sales & Related (756 | 9.6%).
Sales and Office Occupations by Sex
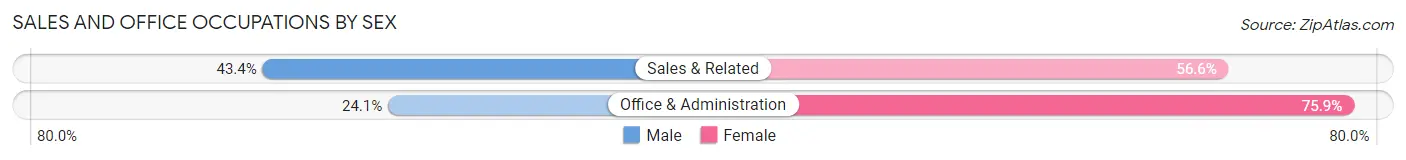
| Occupation | Male | Female |
| Sales & Related | 328 (43.4%) | 428 (56.6%) |
| Office & Administration | 199 (24.1%) | 627 (75.9%) |
| Total (Category) | 527 (33.3%) | 1,055 (66.7%) |
| Total (Overall) | 4,141 (52.4%) | 3,755 (47.6%) |
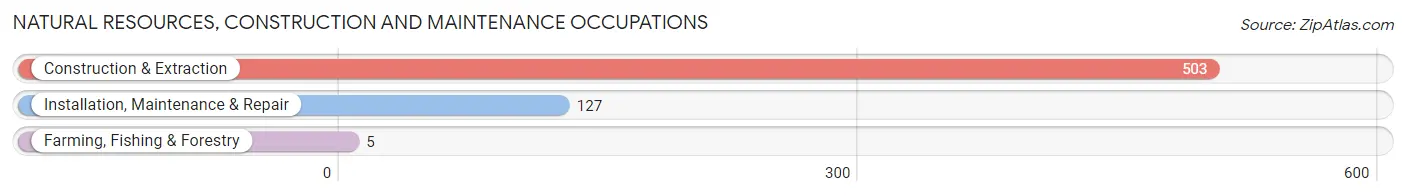
Natural Resources, Construction and Maintenance Occupations
The most common Natural Resources, Construction and Maintenance occupations in South Farmingdale are Construction & Extraction (503 | 6.4%), Installation, Maintenance & Repair (127 | 1.6%), and Farming, Fishing & Forestry (5 | 0.1%).
Natural Resources, Construction and Maintenance Occupations by Sex
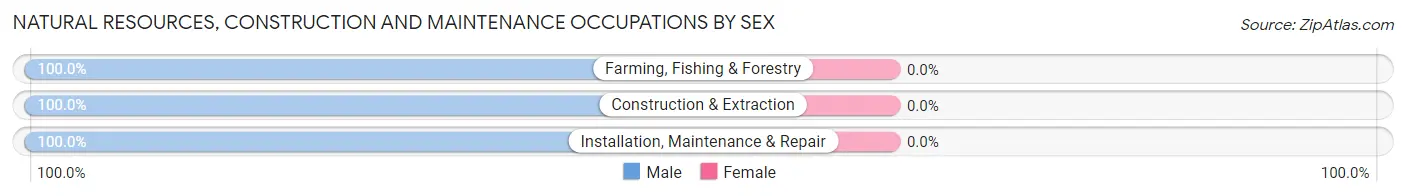
| Occupation | Male | Female |
| Farming, Fishing & Forestry | 5 (100.0%) | 0 (0.0%) |
| Construction & Extraction | 503 (100.0%) | 0 (0.0%) |
| Installation, Maintenance & Repair | 127 (100.0%) | 0 (0.0%) |
| Total (Category) | 635 (100.0%) | 0 (0.0%) |
| Total (Overall) | 4,141 (52.4%) | 3,755 (47.6%) |
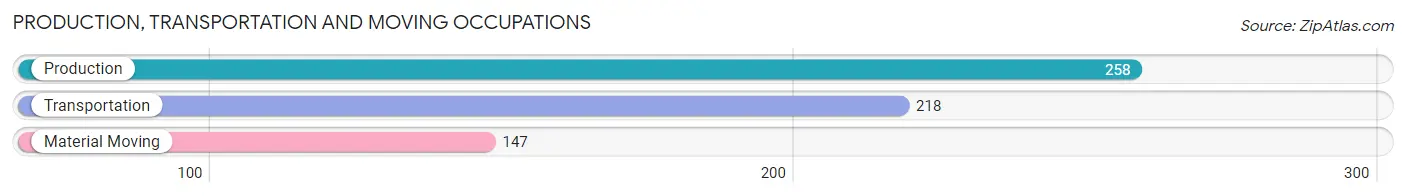
Production, Transportation and Moving Occupations
The most common Production, Transportation and Moving occupations in South Farmingdale are Production (258 | 3.3%), Transportation (218 | 2.8%), and Material Moving (147 | 1.9%).
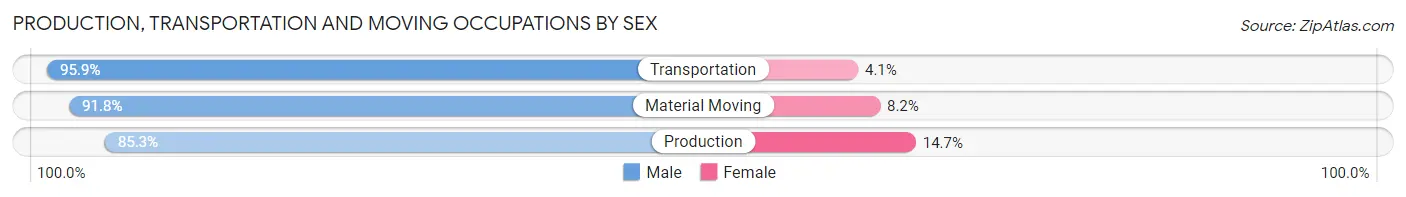
Production, Transportation and Moving Occupations by Sex
| Occupation | Male | Female |
| Production | 220 (85.3%) | 38 (14.7%) |
| Transportation | 209 (95.9%) | 9 (4.1%) |
| Material Moving | 135 (91.8%) | 12 (8.2%) |
| Total (Category) | 564 (90.5%) | 59 (9.5%) |
| Total (Overall) | 4,141 (52.4%) | 3,755 (47.6%) |
Employment Industries by Sex in South Farmingdale
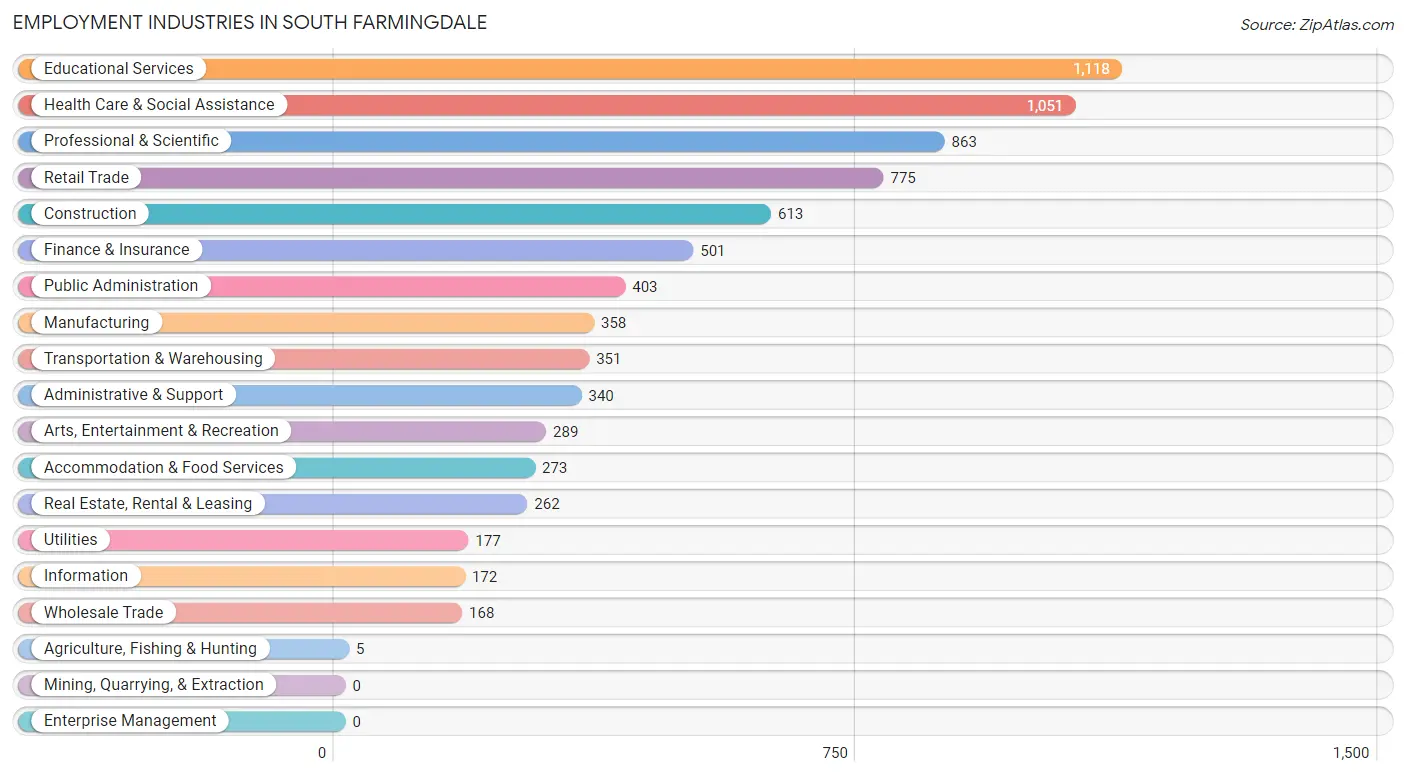
Employment Industries in South Farmingdale
The major employment industries in South Farmingdale include Educational Services (1,118 | 14.2%), Health Care & Social Assistance (1,051 | 13.3%), Professional & Scientific (863 | 10.9%), Retail Trade (775 | 9.8%), and Construction (613 | 7.8%).
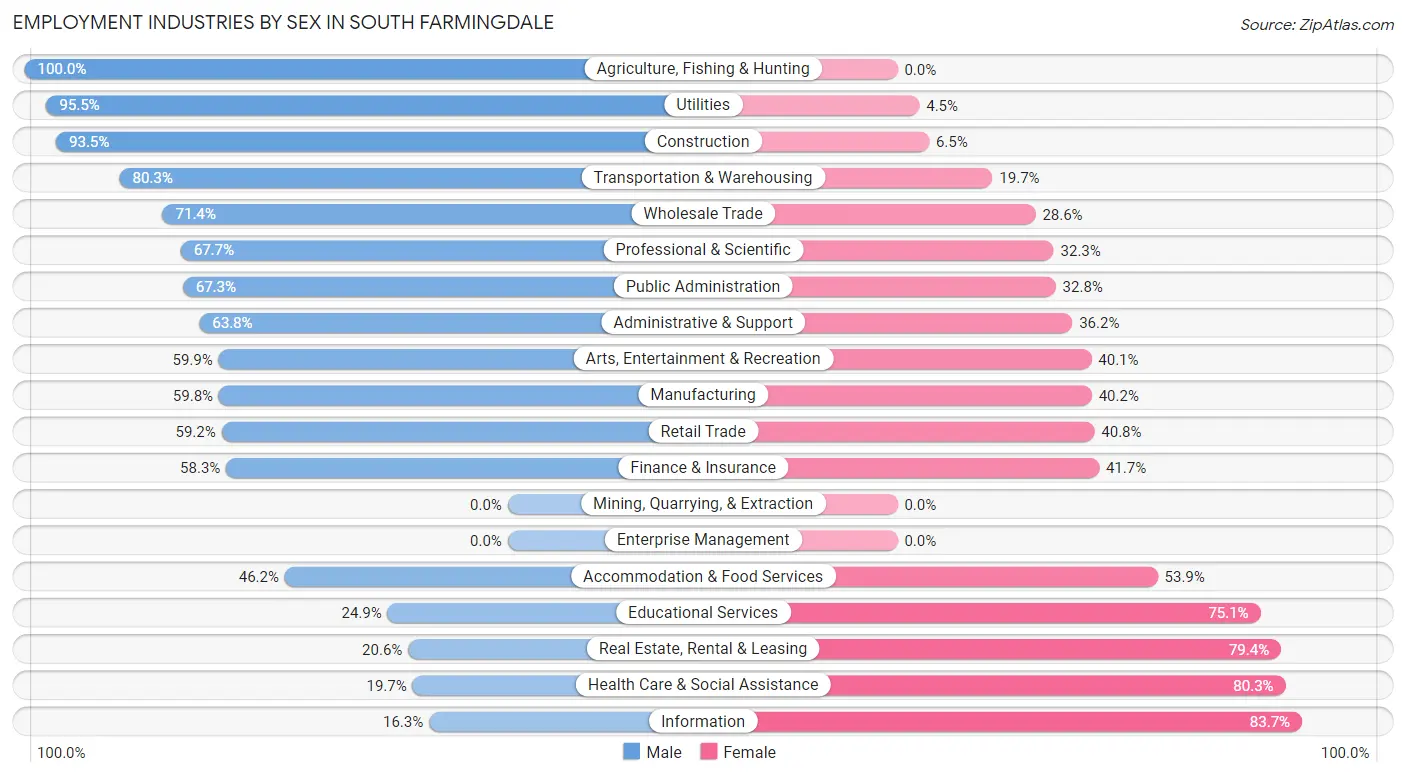
Employment Industries by Sex in South Farmingdale
The South Farmingdale industries that see more men than women are Agriculture, Fishing & Hunting (100.0%), Utilities (95.5%), and Construction (93.5%), whereas the industries that tend to have a higher number of women are Information (83.7%), Health Care & Social Assistance (80.3%), and Real Estate, Rental & Leasing (79.4%).
| Industry | Male | Female |
| Agriculture, Fishing & Hunting | 5 (100.0%) | 0 (0.0%) |
| Mining, Quarrying, & Extraction | 0 (0.0%) | 0 (0.0%) |
| Construction | 573 (93.5%) | 40 (6.5%) |
| Manufacturing | 214 (59.8%) | 144 (40.2%) |
| Wholesale Trade | 120 (71.4%) | 48 (28.6%) |
| Retail Trade | 459 (59.2%) | 316 (40.8%) |
| Transportation & Warehousing | 282 (80.3%) | 69 (19.7%) |
| Utilities | 169 (95.5%) | 8 (4.5%) |
| Information | 28 (16.3%) | 144 (83.7%) |
| Finance & Insurance | 292 (58.3%) | 209 (41.7%) |
| Real Estate, Rental & Leasing | 54 (20.6%) | 208 (79.4%) |
| Professional & Scientific | 584 (67.7%) | 279 (32.3%) |
| Enterprise Management | 0 (0.0%) | 0 (0.0%) |
| Administrative & Support | 217 (63.8%) | 123 (36.2%) |
| Educational Services | 278 (24.9%) | 840 (75.1%) |
| Health Care & Social Assistance | 207 (19.7%) | 844 (80.3%) |
| Arts, Entertainment & Recreation | 173 (59.9%) | 116 (40.1%) |
| Accommodation & Food Services | 126 (46.2%) | 147 (53.8%) |
| Public Administration | 271 (67.2%) | 132 (32.8%) |
| Total | 4,141 (52.4%) | 3,755 (47.6%) |
Education in South Farmingdale
School Enrollment in South Farmingdale
The most common levels of schooling among the 3,435 students in South Farmingdale are college / undergraduate (1,016 | 29.6%), high school (898 | 26.1%), and middle school (539 | 15.7%).
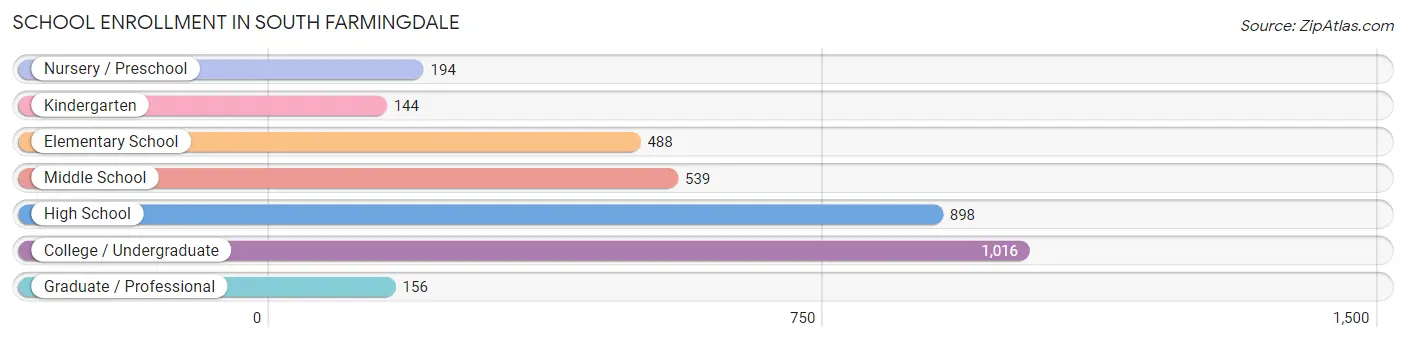
| School Level | # Students | % Students |
| Nursery / Preschool | 194 | 5.7% |
| Kindergarten | 144 | 4.2% |
| Elementary School | 488 | 14.2% |
| Middle School | 539 | 15.7% |
| High School | 898 | 26.1% |
| College / Undergraduate | 1,016 | 29.6% |
| Graduate / Professional | 156 | 4.5% |
| Total | 3,435 | 100.0% |
School Enrollment by Age by Funding Source in South Farmingdale
Out of a total of 3,435 students who are enrolled in schools in South Farmingdale, 646 (18.8%) attend a private institution, while the remaining 2,789 (81.2%) are enrolled in public schools. The age group of 25 to 34 year olds has the highest likelihood of being enrolled in private schools, with 106 (67.9% in the age bracket) enrolled. Conversely, the age group of 15 to 17 year olds has the lowest likelihood of being enrolled in a private school, with 613 (99.0% in the age bracket) attending a public institution.
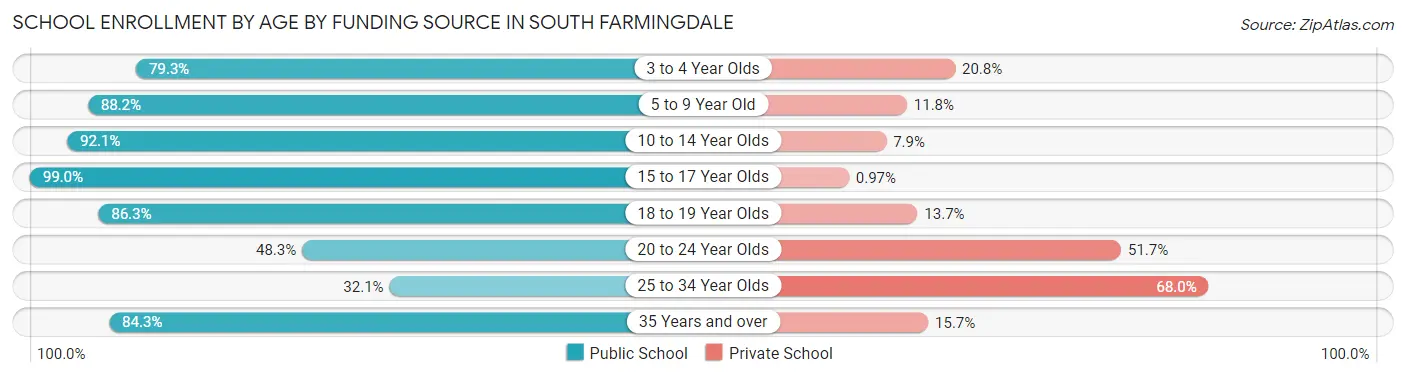
| Age Bracket | Public School | Private School |
| 3 to 4 Year Olds | 126 (79.2%) | 33 (20.7%) |
| 5 to 9 Year Old | 577 (88.2%) | 77 (11.8%) |
| 10 to 14 Year Olds | 604 (92.1%) | 52 (7.9%) |
| 15 to 17 Year Olds | 613 (99.0%) | 6 (1.0%) |
| 18 to 19 Year Olds | 333 (86.3%) | 53 (13.7%) |
| 20 to 24 Year Olds | 260 (48.3%) | 278 (51.7%) |
| 25 to 34 Year Olds | 50 (32.1%) | 106 (67.9%) |
| 35 Years and over | 225 (84.3%) | 42 (15.7%) |
| Total | 2,789 (81.2%) | 646 (18.8%) |
Educational Attainment by Field of Study in South Farmingdale
Business (1,398 | 29.7%), education (852 | 18.1%), science & technology (471 | 10.0%), social sciences (280 | 5.9%), and arts & humanities (263 | 5.6%) are the most common fields of study among 4,712 individuals in South Farmingdale who have obtained a bachelor's degree or higher.
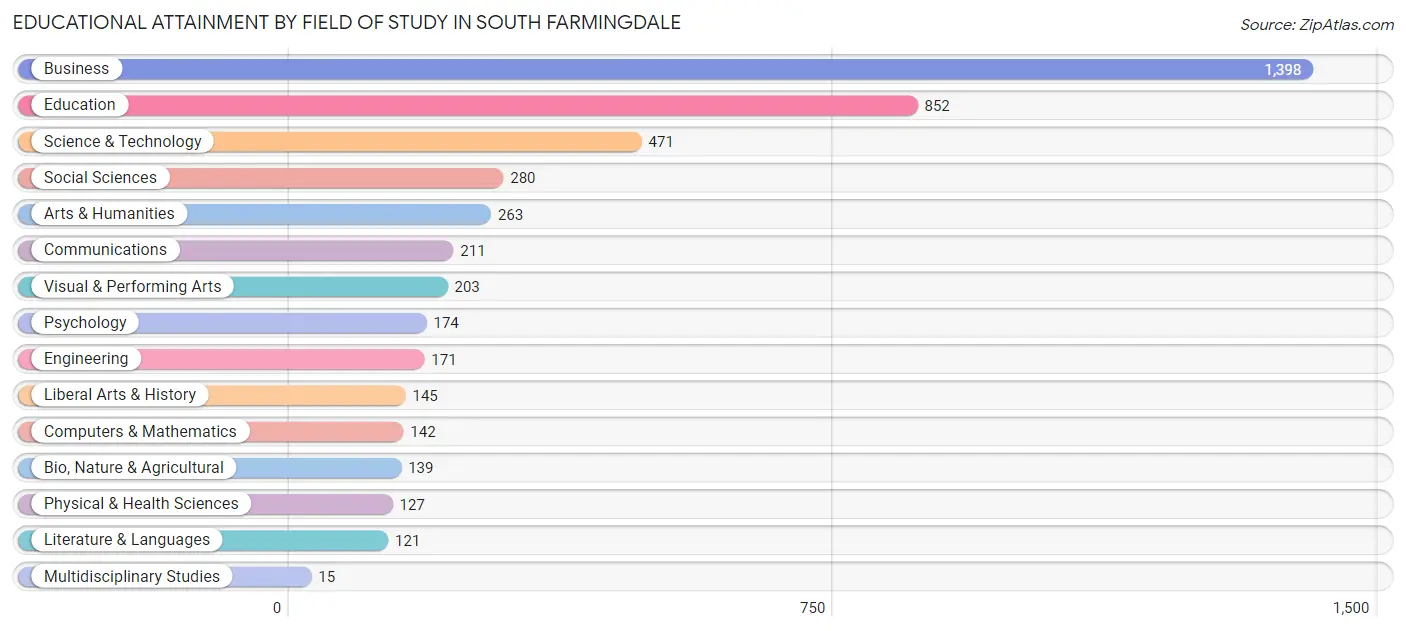
| Field of Study | # Graduates | % Graduates |
| Computers & Mathematics | 142 | 3.0% |
| Bio, Nature & Agricultural | 139 | 2.9% |
| Physical & Health Sciences | 127 | 2.7% |
| Psychology | 174 | 3.7% |
| Social Sciences | 280 | 5.9% |
| Engineering | 171 | 3.6% |
| Multidisciplinary Studies | 15 | 0.3% |
| Science & Technology | 471 | 10.0% |
| Business | 1,398 | 29.7% |
| Education | 852 | 18.1% |
| Literature & Languages | 121 | 2.6% |
| Liberal Arts & History | 145 | 3.1% |
| Visual & Performing Arts | 203 | 4.3% |
| Communications | 211 | 4.5% |
| Arts & Humanities | 263 | 5.6% |
| Total | 4,712 | 100.0% |
Transportation & Commute in South Farmingdale
Vehicle Availability by Sex in South Farmingdale
The most prevalent vehicle ownership categories in South Farmingdale are males with 3 vehicles (1,436, accounting for 35.0%) and females with 3 vehicles (1,176, making up 38.9%).
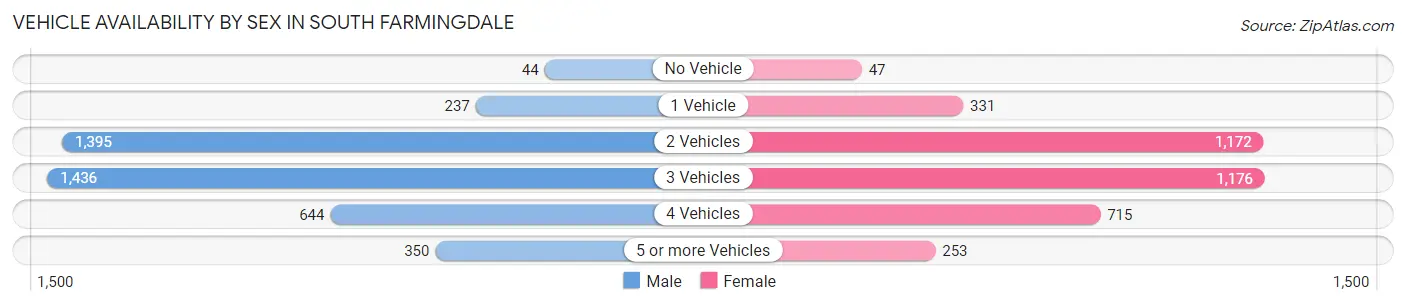
| Vehicles Available | Male | Female |
| No Vehicle | 44 (1.1%) | 47 (1.3%) |
| 1 Vehicle | 237 (5.8%) | 331 (9.0%) |
| 2 Vehicles | 1,395 (34.0%) | 1,172 (31.7%) |
| 3 Vehicles | 1,436 (35.0%) | 1,176 (31.8%) |
| 4 Vehicles | 644 (15.7%) | 715 (19.4%) |
| 5 or more Vehicles | 350 (8.5%) | 253 (6.9%) |
| Total | 4,106 (100.0%) | 3,694 (100.0%) |
Commute Time in South Farmingdale
The most frequently occuring commute durations in South Farmingdale are 15 to 19 minutes (1,120 commuters, 16.0%), 20 to 24 minutes (912 commuters, 13.0%), and 60 to 89 minutes (847 commuters, 12.1%).
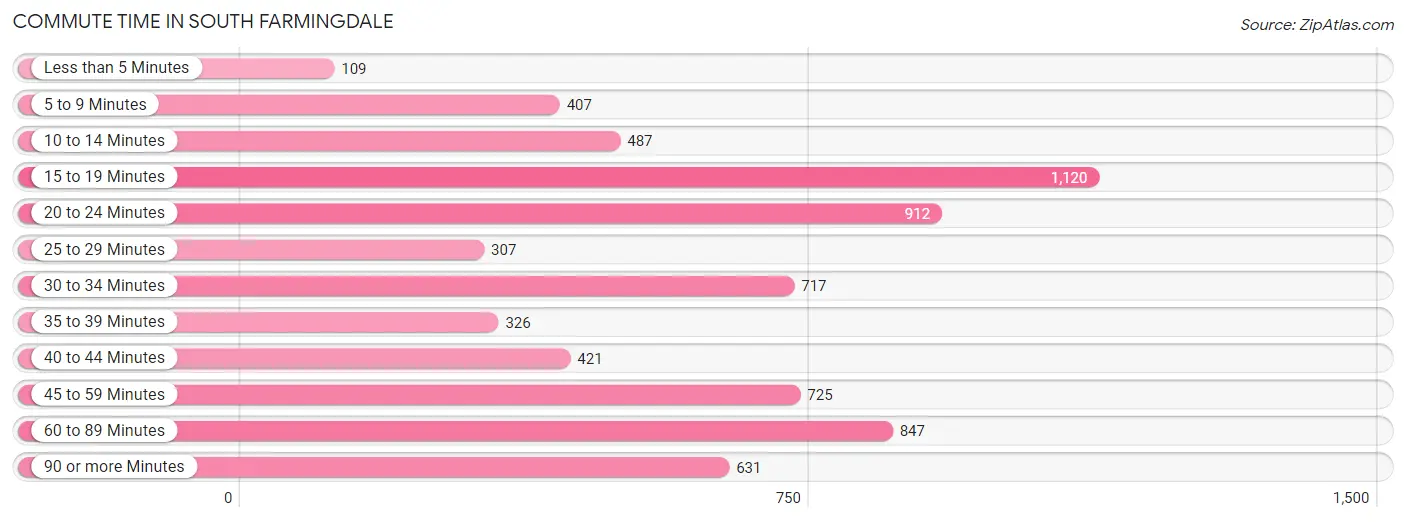
| Commute Time | # Commuters | % Commuters |
| Less than 5 Minutes | 109 | 1.6% |
| 5 to 9 Minutes | 407 | 5.8% |
| 10 to 14 Minutes | 487 | 7.0% |
| 15 to 19 Minutes | 1,120 | 16.0% |
| 20 to 24 Minutes | 912 | 13.0% |
| 25 to 29 Minutes | 307 | 4.4% |
| 30 to 34 Minutes | 717 | 10.2% |
| 35 to 39 Minutes | 326 | 4.6% |
| 40 to 44 Minutes | 421 | 6.0% |
| 45 to 59 Minutes | 725 | 10.3% |
| 60 to 89 Minutes | 847 | 12.1% |
| 90 or more Minutes | 631 | 9.0% |
Commute Time by Sex in South Farmingdale
The most common commute times in South Farmingdale are 60 to 89 minutes (522 commuters, 14.1%) for males and 15 to 19 minutes (623 commuters, 18.9%) for females.
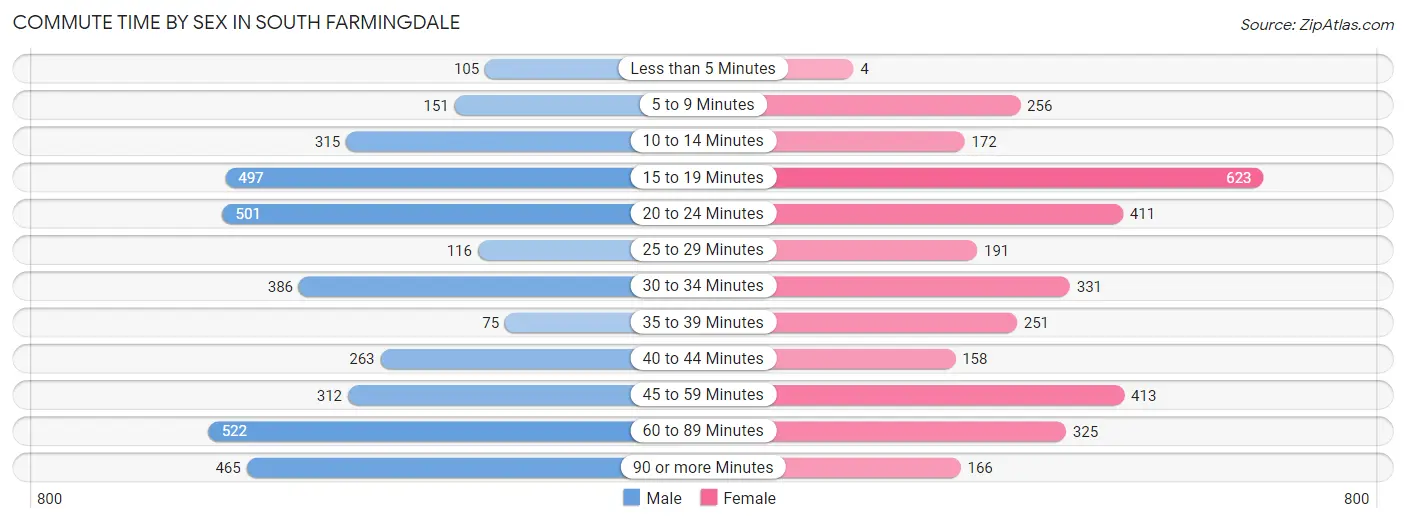
| Commute Time | Male | Female |
| Less than 5 Minutes | 105 (2.8%) | 4 (0.1%) |
| 5 to 9 Minutes | 151 (4.1%) | 256 (7.8%) |
| 10 to 14 Minutes | 315 (8.5%) | 172 (5.2%) |
| 15 to 19 Minutes | 497 (13.4%) | 623 (18.9%) |
| 20 to 24 Minutes | 501 (13.5%) | 411 (12.4%) |
| 25 to 29 Minutes | 116 (3.1%) | 191 (5.8%) |
| 30 to 34 Minutes | 386 (10.4%) | 331 (10.0%) |
| 35 to 39 Minutes | 75 (2.0%) | 251 (7.6%) |
| 40 to 44 Minutes | 263 (7.1%) | 158 (4.8%) |
| 45 to 59 Minutes | 312 (8.4%) | 413 (12.5%) |
| 60 to 89 Minutes | 522 (14.1%) | 325 (9.9%) |
| 90 or more Minutes | 465 (12.5%) | 166 (5.0%) |
Time of Departure to Work by Sex in South Farmingdale
The most frequent times of departure to work in South Farmingdale are 8:00 AM to 8:29 AM (563, 15.2%) for males and 7:00 AM to 7:29 AM (458, 13.9%) for females.
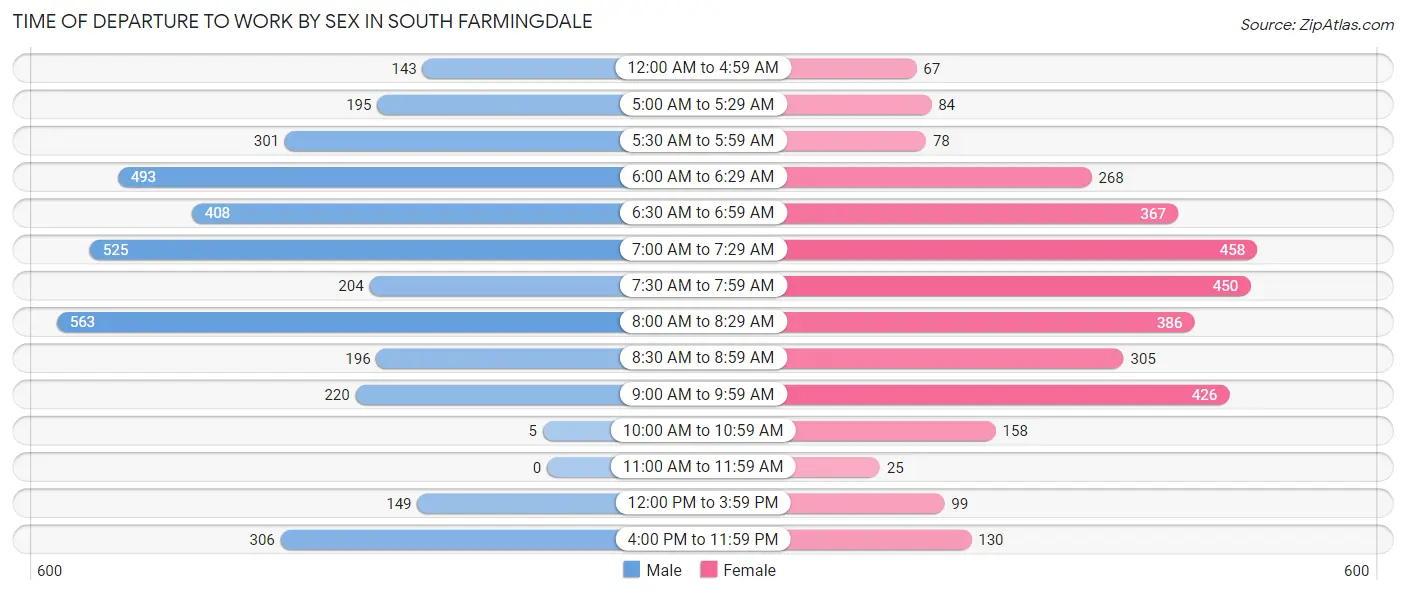
| Time of Departure | Male | Female |
| 12:00 AM to 4:59 AM | 143 (3.9%) | 67 (2.0%) |
| 5:00 AM to 5:29 AM | 195 (5.3%) | 84 (2.5%) |
| 5:30 AM to 5:59 AM | 301 (8.1%) | 78 (2.4%) |
| 6:00 AM to 6:29 AM | 493 (13.3%) | 268 (8.1%) |
| 6:30 AM to 6:59 AM | 408 (11.0%) | 367 (11.1%) |
| 7:00 AM to 7:29 AM | 525 (14.2%) | 458 (13.9%) |
| 7:30 AM to 7:59 AM | 204 (5.5%) | 450 (13.6%) |
| 8:00 AM to 8:29 AM | 563 (15.2%) | 386 (11.7%) |
| 8:30 AM to 8:59 AM | 196 (5.3%) | 305 (9.2%) |
| 9:00 AM to 9:59 AM | 220 (5.9%) | 426 (12.9%) |
| 10:00 AM to 10:59 AM | 5 (0.1%) | 158 (4.8%) |
| 11:00 AM to 11:59 AM | 0 (0.0%) | 25 (0.8%) |
| 12:00 PM to 3:59 PM | 149 (4.0%) | 99 (3.0%) |
| 4:00 PM to 11:59 PM | 306 (8.3%) | 130 (3.9%) |
| Total | 3,708 (100.0%) | 3,301 (100.0%) |
Housing Occupancy in South Farmingdale
Occupancy by Ownership in South Farmingdale
Of the total 4,742 dwellings in South Farmingdale, owner-occupied units account for 4,476 (94.4%), while renter-occupied units make up 266 (5.6%).
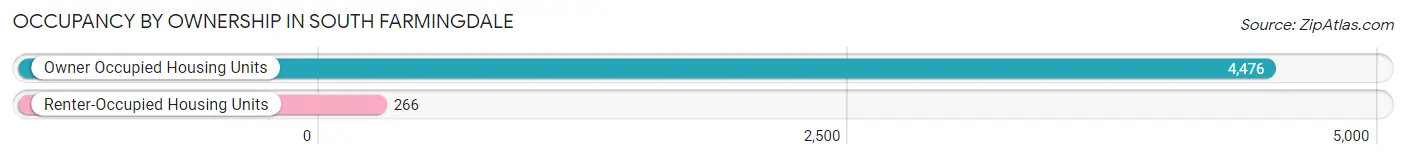
| Occupancy | # Housing Units | % Housing Units |
| Owner Occupied Housing Units | 4,476 | 94.4% |
| Renter-Occupied Housing Units | 266 | 5.6% |
| Total Occupied Housing Units | 4,742 | 100.0% |
Occupancy by Household Size in South Farmingdale
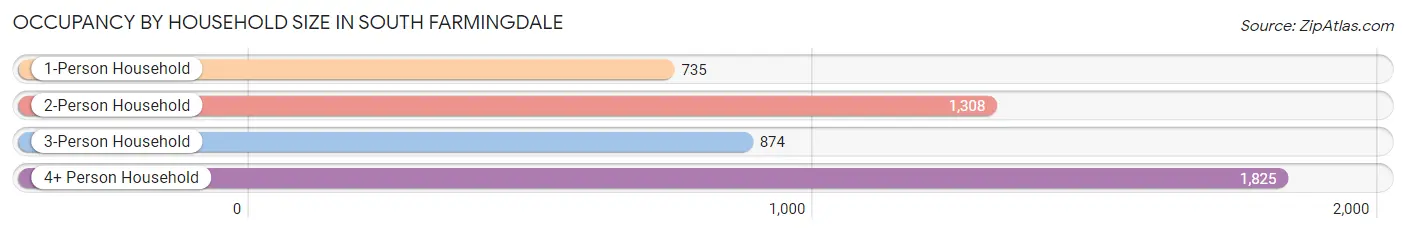
| Household Size | # Housing Units | % Housing Units |
| 1-Person Household | 735 | 15.5% |
| 2-Person Household | 1,308 | 27.6% |
| 3-Person Household | 874 | 18.4% |
| 4+ Person Household | 1,825 | 38.5% |
| Total Housing Units | 4,742 | 100.0% |
Occupancy by Ownership by Household Size in South Farmingdale
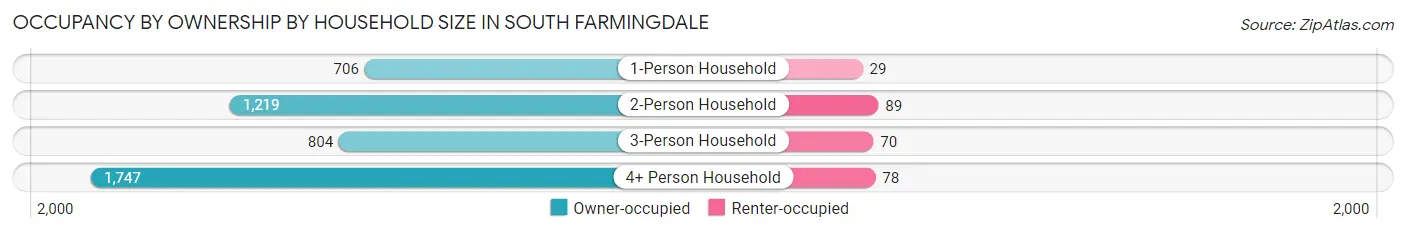
| Household Size | Owner-occupied | Renter-occupied |
| 1-Person Household | 706 (96.1%) | 29 (4.0%) |
| 2-Person Household | 1,219 (93.2%) | 89 (6.8%) |
| 3-Person Household | 804 (92.0%) | 70 (8.0%) |
| 4+ Person Household | 1,747 (95.7%) | 78 (4.3%) |
| Total Housing Units | 4,476 (94.4%) | 266 (5.6%) |
Occupancy by Educational Attainment in South Farmingdale
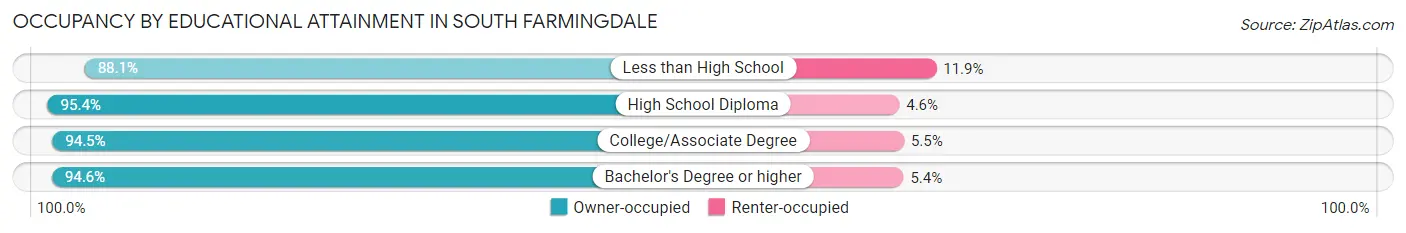
| Household Size | Owner-occupied | Renter-occupied |
| Less than High School | 229 (88.1%) | 31 (11.9%) |
| High School Diploma | 1,021 (95.4%) | 49 (4.6%) |
| College/Associate Degree | 1,268 (94.5%) | 74 (5.5%) |
| Bachelor's Degree or higher | 1,958 (94.6%) | 112 (5.4%) |
Occupancy by Age of Householder in South Farmingdale
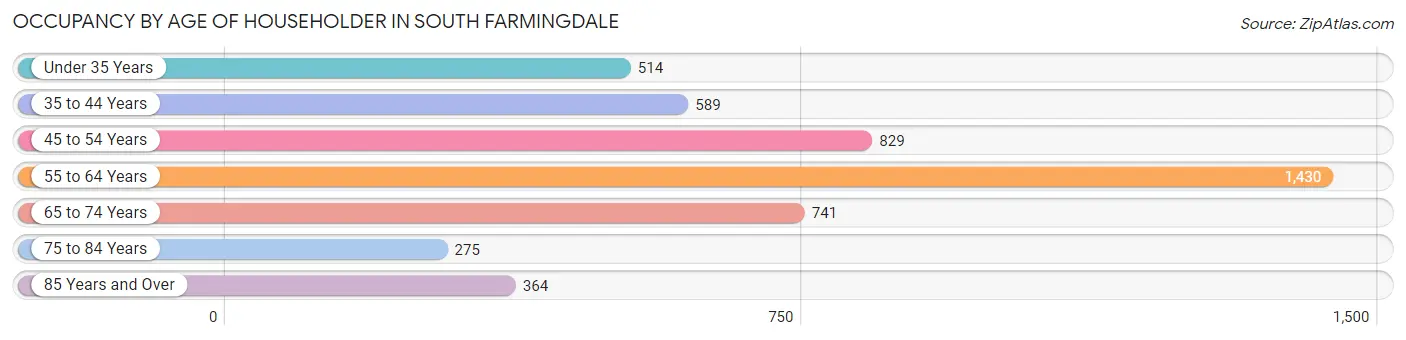
| Age Bracket | # Households | % Households |
| Under 35 Years | 514 | 10.8% |
| 35 to 44 Years | 589 | 12.4% |
| 45 to 54 Years | 829 | 17.5% |
| 55 to 64 Years | 1,430 | 30.2% |
| 65 to 74 Years | 741 | 15.6% |
| 75 to 84 Years | 275 | 5.8% |
| 85 Years and Over | 364 | 7.7% |
| Total | 4,742 | 100.0% |
Housing Finances in South Farmingdale
Median Income by Occupancy in South Farmingdale
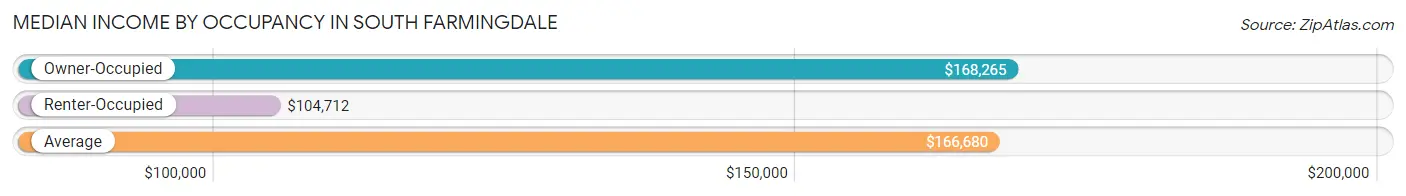
| Occupancy Type | # Households | Median Income |
| Owner-Occupied | 4,476 (94.4%) | $168,265 |
| Renter-Occupied | 266 (5.6%) | $104,712 |
| Average | 4,742 (100.0%) | $166,680 |
Occupancy by Householder Income Bracket in South Farmingdale
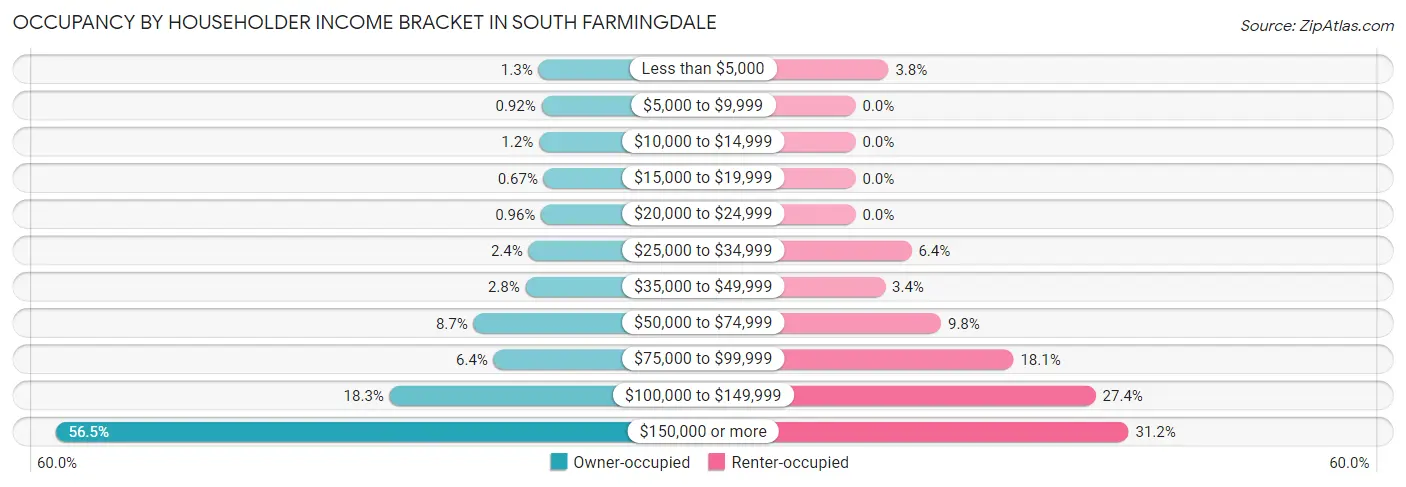
| Income Bracket | Owner-occupied | Renter-occupied |
| Less than $5,000 | 57 (1.3%) | 10 (3.8%) |
| $5,000 to $9,999 | 41 (0.9%) | 0 (0.0%) |
| $10,000 to $14,999 | 54 (1.2%) | 0 (0.0%) |
| $15,000 to $19,999 | 30 (0.7%) | 0 (0.0%) |
| $20,000 to $24,999 | 43 (1.0%) | 0 (0.0%) |
| $25,000 to $34,999 | 108 (2.4%) | 17 (6.4%) |
| $35,000 to $49,999 | 123 (2.8%) | 9 (3.4%) |
| $50,000 to $74,999 | 389 (8.7%) | 26 (9.8%) |
| $75,000 to $99,999 | 286 (6.4%) | 48 (18.0%) |
| $100,000 to $149,999 | 818 (18.3%) | 73 (27.4%) |
| $150,000 or more | 2,527 (56.5%) | 83 (31.2%) |
| Total | 4,476 (100.0%) | 266 (100.0%) |
Monthly Housing Cost Tiers in South Farmingdale
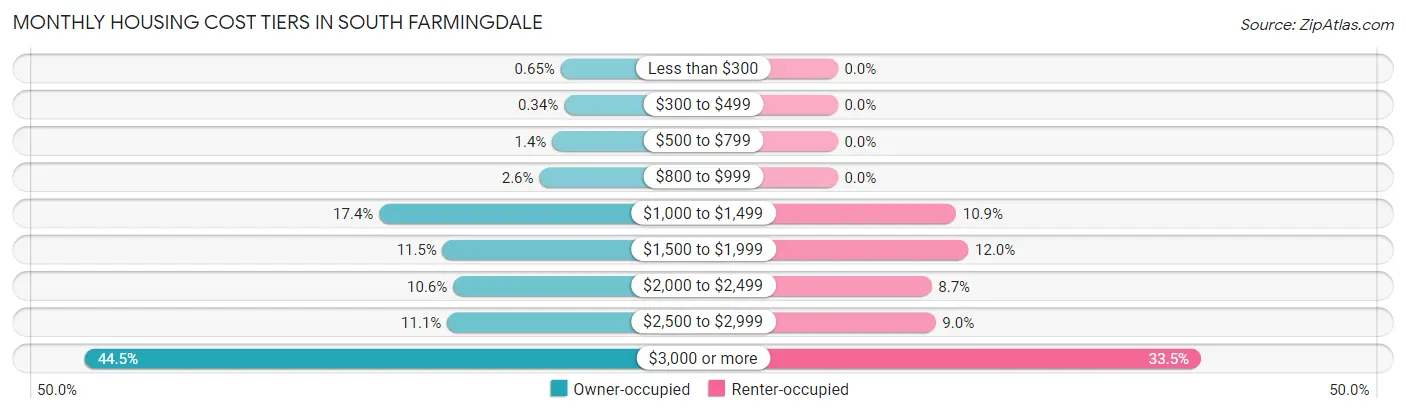
| Monthly Cost | Owner-occupied | Renter-occupied |
| Less than $300 | 29 (0.6%) | 0 (0.0%) |
| $300 to $499 | 15 (0.3%) | 0 (0.0%) |
| $500 to $799 | 64 (1.4%) | 0 (0.0%) |
| $800 to $999 | 117 (2.6%) | 0 (0.0%) |
| $1,000 to $1,499 | 777 (17.4%) | 29 (10.9%) |
| $1,500 to $1,999 | 515 (11.5%) | 32 (12.0%) |
| $2,000 to $2,499 | 472 (10.5%) | 23 (8.6%) |
| $2,500 to $2,999 | 497 (11.1%) | 24 (9.0%) |
| $3,000 or more | 1,990 (44.5%) | 89 (33.5%) |
| Total | 4,476 (100.0%) | 266 (100.0%) |
Physical Housing Characteristics in South Farmingdale
Housing Structures in South Farmingdale
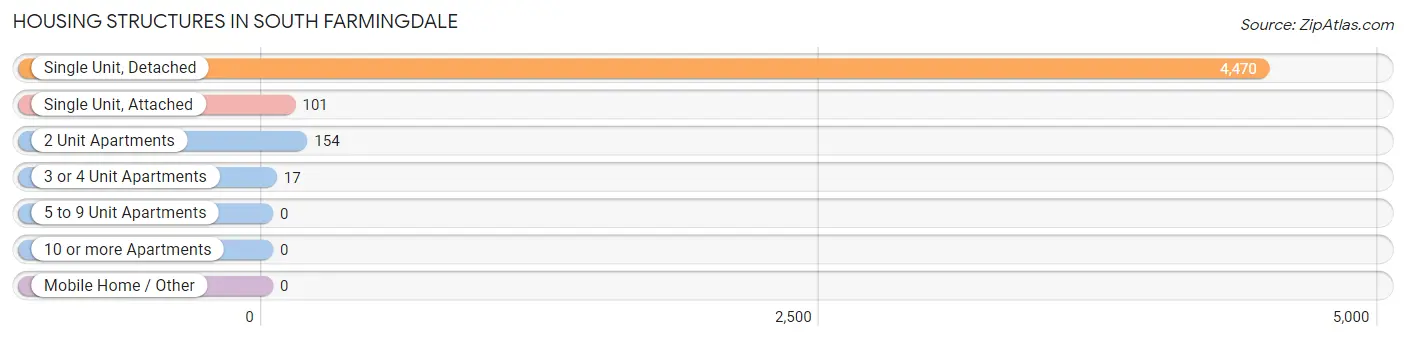
| Structure Type | # Housing Units | % Housing Units |
| Single Unit, Detached | 4,470 | 94.3% |
| Single Unit, Attached | 101 | 2.1% |
| 2 Unit Apartments | 154 | 3.3% |
| 3 or 4 Unit Apartments | 17 | 0.4% |
| 5 to 9 Unit Apartments | 0 | 0.0% |
| 10 or more Apartments | 0 | 0.0% |
| Mobile Home / Other | 0 | 0.0% |
| Total | 4,742 | 100.0% |
Housing Structures by Occupancy in South Farmingdale
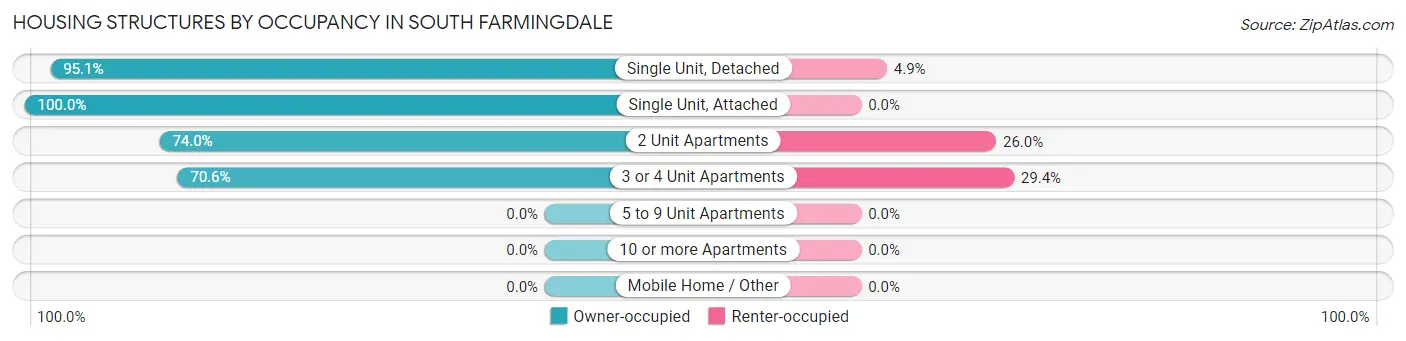
| Structure Type | Owner-occupied | Renter-occupied |
| Single Unit, Detached | 4,249 (95.1%) | 221 (4.9%) |
| Single Unit, Attached | 101 (100.0%) | 0 (0.0%) |
| 2 Unit Apartments | 114 (74.0%) | 40 (26.0%) |
| 3 or 4 Unit Apartments | 12 (70.6%) | 5 (29.4%) |
| 5 to 9 Unit Apartments | 0 (0.0%) | 0 (0.0%) |
| 10 or more Apartments | 0 (0.0%) | 0 (0.0%) |
| Mobile Home / Other | 0 (0.0%) | 0 (0.0%) |
| Total | 4,476 (94.4%) | 266 (5.6%) |
Housing Structures by Number of Rooms in South Farmingdale
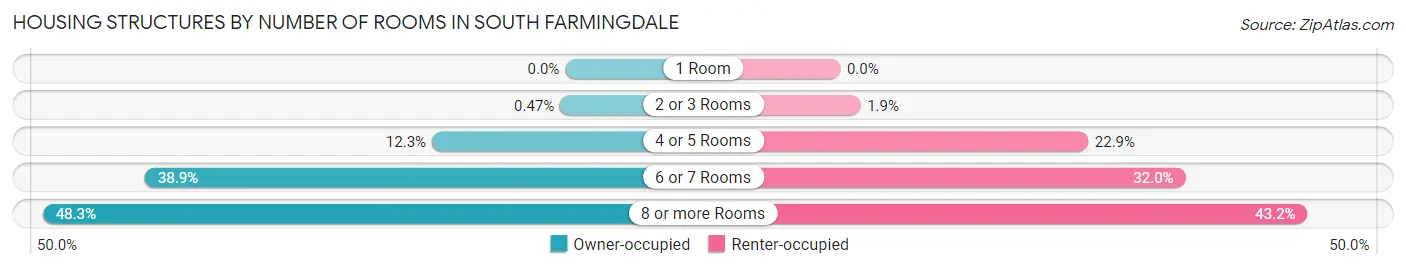
| Number of Rooms | Owner-occupied | Renter-occupied |
| 1 Room | 0 (0.0%) | 0 (0.0%) |
| 2 or 3 Rooms | 21 (0.5%) | 5 (1.9%) |
| 4 or 5 Rooms | 552 (12.3%) | 61 (22.9%) |
| 6 or 7 Rooms | 1,740 (38.9%) | 85 (32.0%) |
| 8 or more Rooms | 2,163 (48.3%) | 115 (43.2%) |
| Total | 4,476 (100.0%) | 266 (100.0%) |
Housing Structure by Heating Type in South Farmingdale
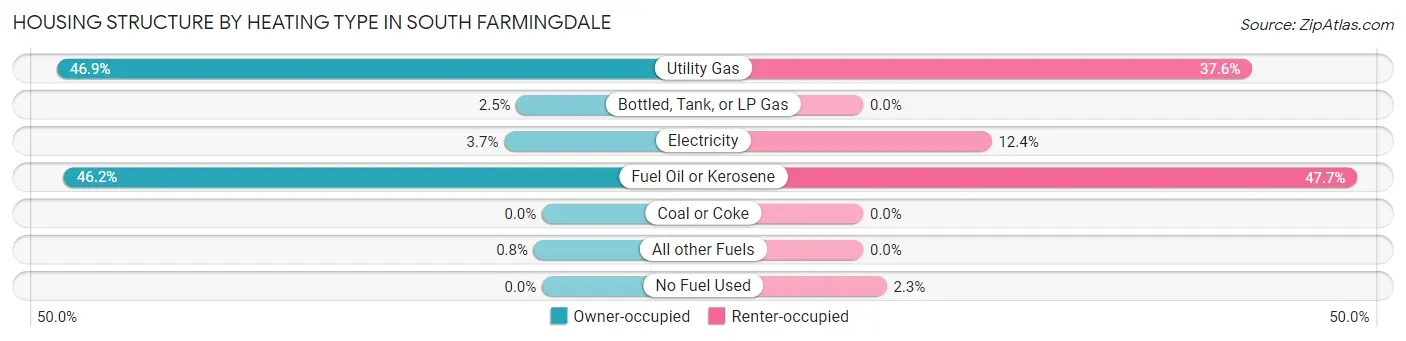
| Heating Type | Owner-occupied | Renter-occupied |
| Utility Gas | 2,097 (46.9%) | 100 (37.6%) |
| Bottled, Tank, or LP Gas | 111 (2.5%) | 0 (0.0%) |
| Electricity | 164 (3.7%) | 33 (12.4%) |
| Fuel Oil or Kerosene | 2,068 (46.2%) | 127 (47.7%) |
| Coal or Coke | 0 (0.0%) | 0 (0.0%) |
| All other Fuels | 36 (0.8%) | 0 (0.0%) |
| No Fuel Used | 0 (0.0%) | 6 (2.3%) |
| Total | 4,476 (100.0%) | 266 (100.0%) |
Household Vehicle Usage in South Farmingdale
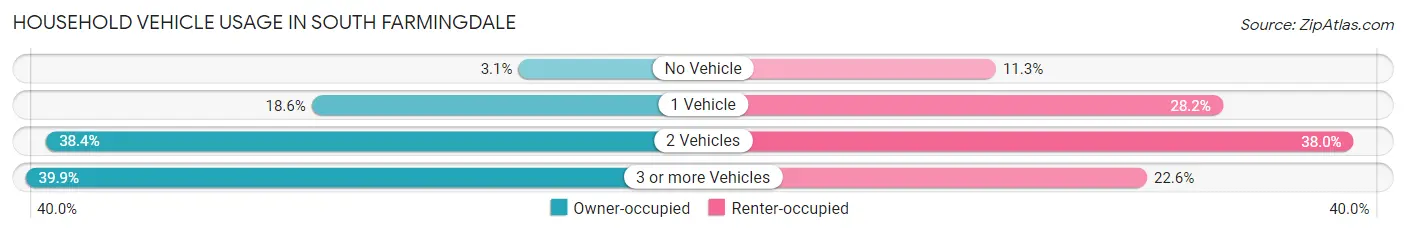
| Vehicles per Household | Owner-occupied | Renter-occupied |
| No Vehicle | 140 (3.1%) | 30 (11.3%) |
| 1 Vehicle | 831 (18.6%) | 75 (28.2%) |
| 2 Vehicles | 1,718 (38.4%) | 101 (38.0%) |
| 3 or more Vehicles | 1,787 (39.9%) | 60 (22.6%) |
| Total | 4,476 (100.0%) | 266 (100.0%) |
Real Estate & Mortgages in South Farmingdale
Real Estate and Mortgage Overview in South Farmingdale
| Characteristic | Without Mortgage | With Mortgage |
| Housing Units | 1,547 | 2,929 |
| Median Property Value | $492,800 | $574,100 |
| Median Household Income | $116,719 | $1,998 |
| Monthly Housing Costs | $1,418 | $1,984 |
| Real Estate Taxes | $10,001 | $16 |
Property Value by Mortgage Status in South Farmingdale
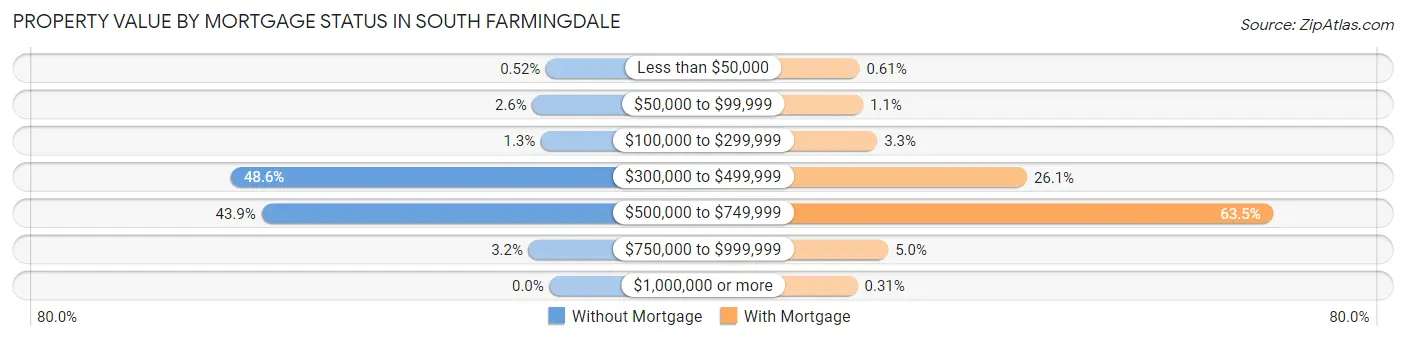
| Property Value | Without Mortgage | With Mortgage |
| Less than $50,000 | 8 (0.5%) | 18 (0.6%) |
| $50,000 to $99,999 | 40 (2.6%) | 33 (1.1%) |
| $100,000 to $299,999 | 20 (1.3%) | 97 (3.3%) |
| $300,000 to $499,999 | 751 (48.5%) | 765 (26.1%) |
| $500,000 to $749,999 | 679 (43.9%) | 1,861 (63.5%) |
| $750,000 to $999,999 | 49 (3.2%) | 146 (5.0%) |
| $1,000,000 or more | 0 (0.0%) | 9 (0.3%) |
| Total | 1,547 (100.0%) | 2,929 (100.0%) |
Household Income by Mortgage Status in South Farmingdale
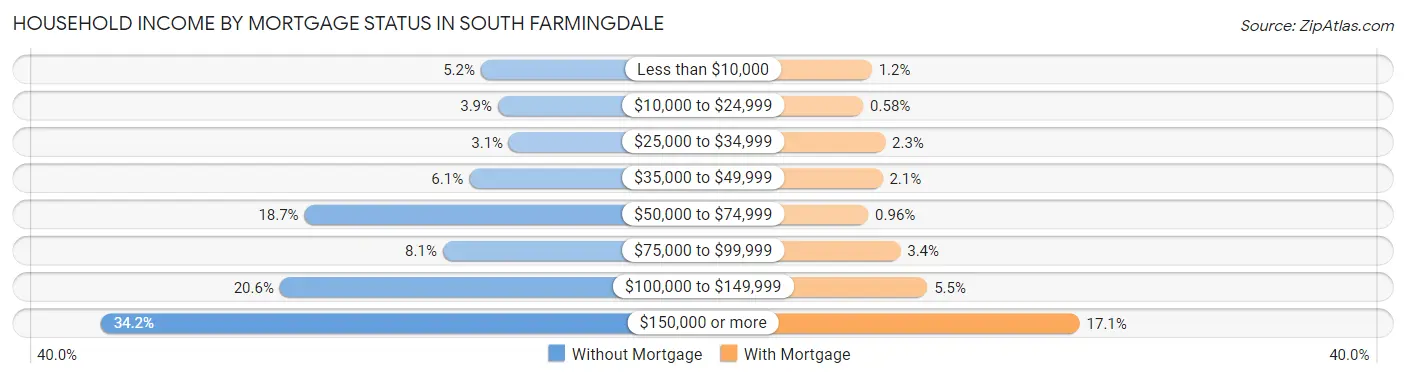
| Household Income | Without Mortgage | With Mortgage |
| Less than $10,000 | 81 (5.2%) | 36 (1.2%) |
| $10,000 to $24,999 | 61 (3.9%) | 17 (0.6%) |
| $25,000 to $34,999 | 48 (3.1%) | 66 (2.2%) |
| $35,000 to $49,999 | 95 (6.1%) | 60 (2.1%) |
| $50,000 to $74,999 | 289 (18.7%) | 28 (1.0%) |
| $75,000 to $99,999 | 126 (8.1%) | 100 (3.4%) |
| $100,000 to $149,999 | 318 (20.6%) | 160 (5.5%) |
| $150,000 or more | 529 (34.2%) | 500 (17.1%) |
| Total | 1,547 (100.0%) | 2,929 (100.0%) |
Property Value to Household Income Ratio in South Farmingdale
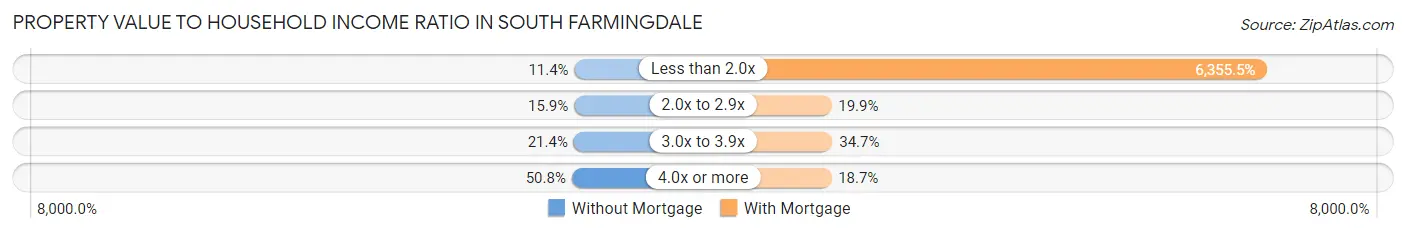
| Value-to-Income Ratio | Without Mortgage | With Mortgage |
| Less than 2.0x | 176 (11.4%) | 186,152 (6,355.5%) |
| 2.0x to 2.9x | 246 (15.9%) | 584 (19.9%) |
| 3.0x to 3.9x | 331 (21.4%) | 1,017 (34.7%) |
| 4.0x or more | 786 (50.8%) | 547 (18.7%) |
| Total | 1,547 (100.0%) | 2,929 (100.0%) |
Real Estate Taxes by Mortgage Status in South Farmingdale
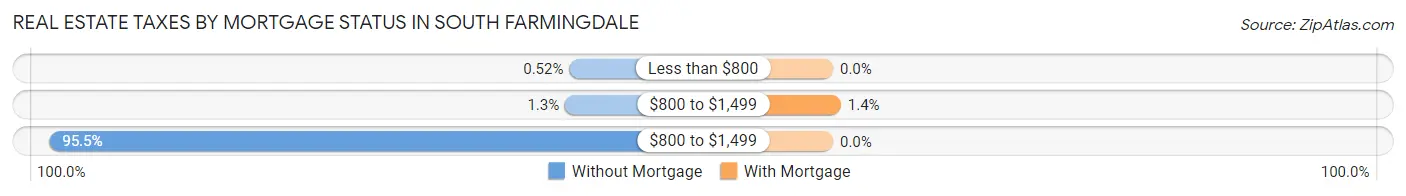
| Property Taxes | Without Mortgage | With Mortgage |
| Less than $800 | 8 (0.5%) | 0 (0.0%) |
| $800 to $1,499 | 20 (1.3%) | 42 (1.4%) |
| $800 to $1,499 | 1,477 (95.5%) | 0 (0.0%) |
| Total | 1,547 (100.0%) | 2,929 (100.0%) |
Health & Disability in South Farmingdale
Health Insurance Coverage by Age in South Farmingdale
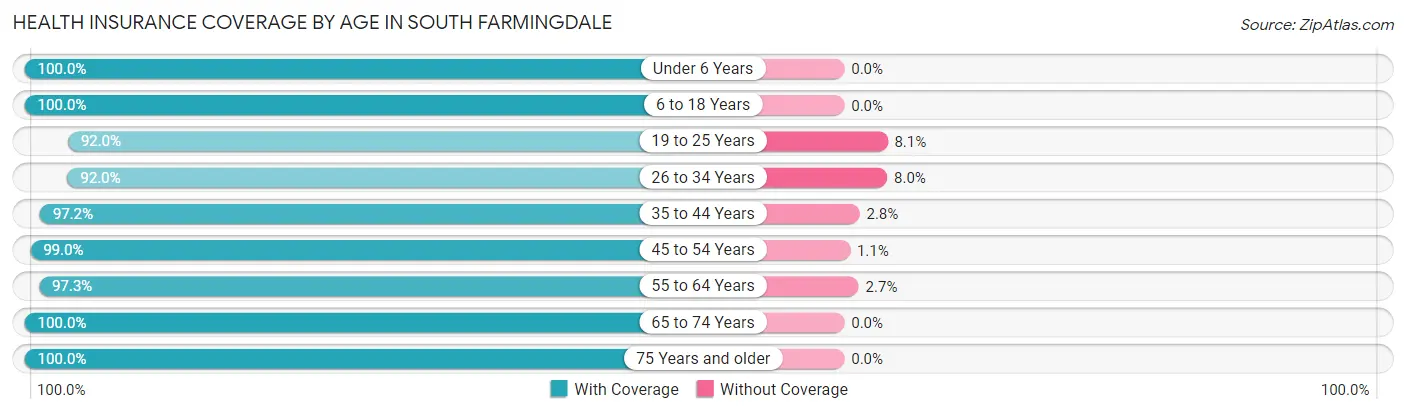
| Age Bracket | With Coverage | Without Coverage |
| Under 6 Years | 794 (100.0%) | 0 (0.0%) |
| 6 to 18 Years | 2,161 (100.0%) | 0 (0.0%) |
| 19 to 25 Years | 1,394 (91.9%) | 122 (8.1%) |
| 26 to 34 Years | 1,810 (92.0%) | 157 (8.0%) |
| 35 to 44 Years | 1,267 (97.2%) | 37 (2.8%) |
| 45 to 54 Years | 1,891 (99.0%) | 20 (1.1%) |
| 55 to 64 Years | 2,687 (97.3%) | 74 (2.7%) |
| 65 to 74 Years | 1,625 (100.0%) | 0 (0.0%) |
| 75 Years and older | 938 (100.0%) | 0 (0.0%) |
| Total | 14,567 (97.3%) | 410 (2.7%) |
Health Insurance Coverage by Citizenship Status in South Farmingdale
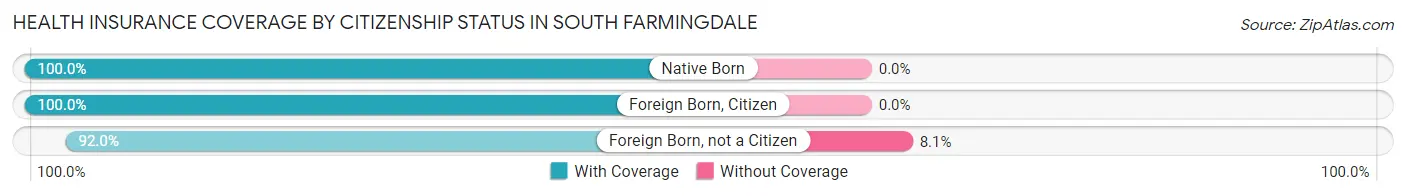
| Citizenship Status | With Coverage | Without Coverage |
| Native Born | 794 (100.0%) | 0 (0.0%) |
| Foreign Born, Citizen | 2,161 (100.0%) | 0 (0.0%) |
| Foreign Born, not a Citizen | 1,394 (91.9%) | 122 (8.1%) |
Health Insurance Coverage by Household Income in South Farmingdale
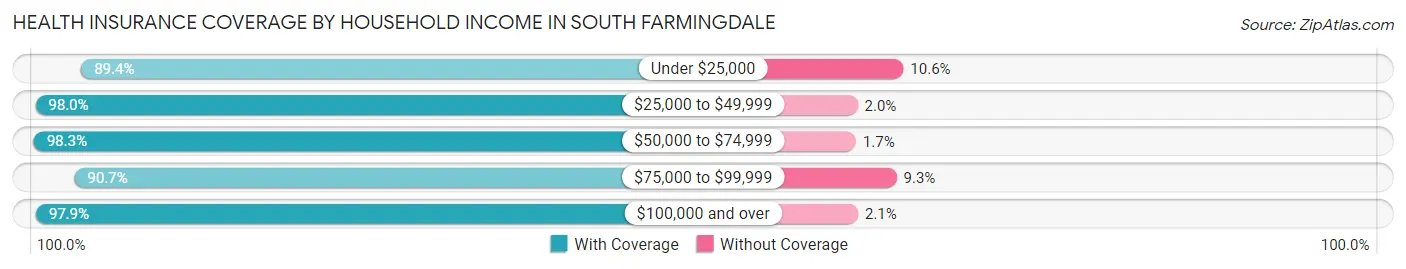
| Household Income | With Coverage | Without Coverage |
| Under $25,000 | 379 (89.4%) | 45 (10.6%) |
| $25,000 to $49,999 | 484 (98.0%) | 10 (2.0%) |
| $50,000 to $74,999 | 629 (98.3%) | 11 (1.7%) |
| $75,000 to $99,999 | 777 (90.7%) | 80 (9.3%) |
| $100,000 and over | 12,254 (97.9%) | 264 (2.1%) |
Public vs Private Health Insurance Coverage by Age in South Farmingdale
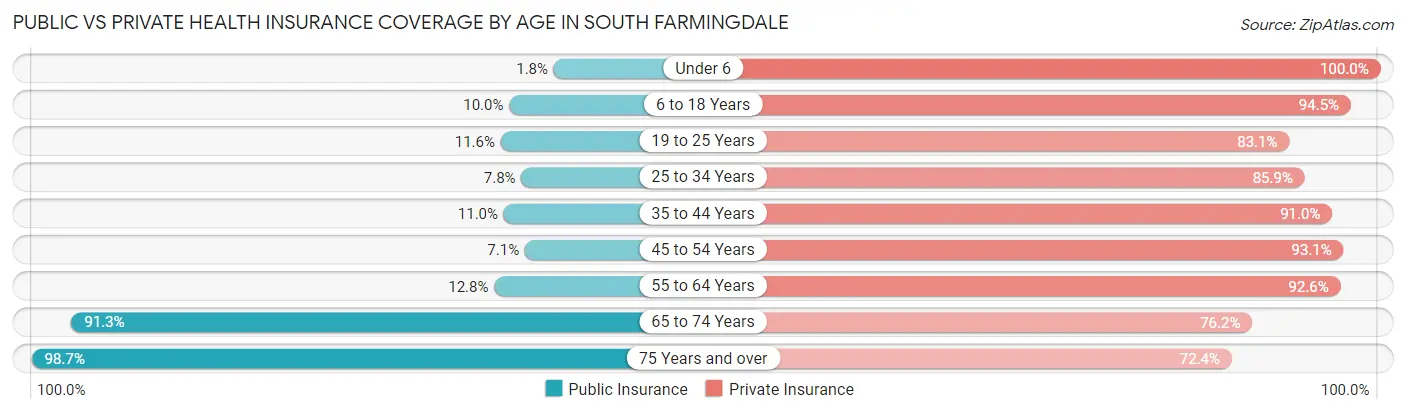
| Age Bracket | Public Insurance | Private Insurance |
| Under 6 | 14 (1.8%) | 794 (100.0%) |
| 6 to 18 Years | 217 (10.0%) | 2,042 (94.5%) |
| 19 to 25 Years | 176 (11.6%) | 1,259 (83.1%) |
| 25 to 34 Years | 153 (7.8%) | 1,690 (85.9%) |
| 35 to 44 Years | 144 (11.0%) | 1,187 (91.0%) |
| 45 to 54 Years | 136 (7.1%) | 1,780 (93.1%) |
| 55 to 64 Years | 354 (12.8%) | 2,556 (92.6%) |
| 65 to 74 Years | 1,484 (91.3%) | 1,238 (76.2%) |
| 75 Years and over | 926 (98.7%) | 679 (72.4%) |
| Total | 3,604 (24.1%) | 13,225 (88.3%) |
Disability Status by Sex by Age in South Farmingdale
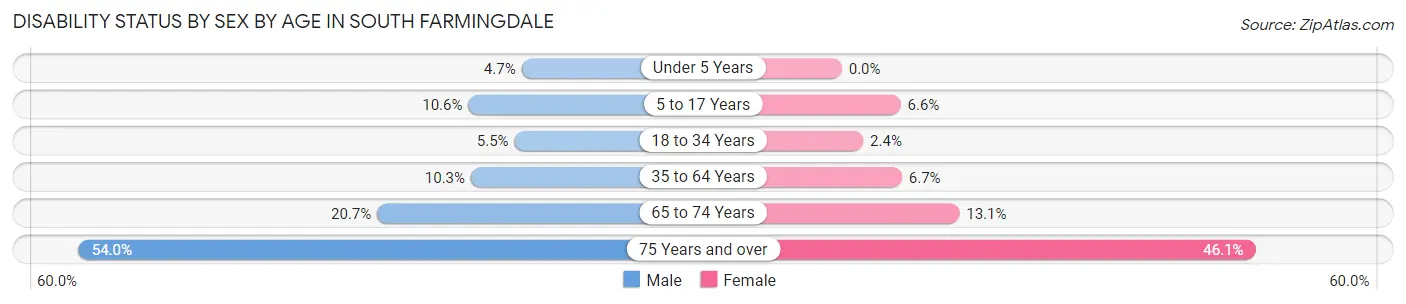
| Age Bracket | Male | Female |
| Under 5 Years | 13 (4.7%) | 0 (0.0%) |
| 5 to 17 Years | 91 (10.6%) | 72 (6.6%) |
| 18 to 34 Years | 104 (5.4%) | 45 (2.4%) |
| 35 to 64 Years | 286 (10.3%) | 214 (6.7%) |
| 65 to 74 Years | 196 (20.7%) | 89 (13.1%) |
| 75 Years and over | 150 (54.0%) | 304 (46.1%) |
Disability Class by Sex by Age in South Farmingdale
Disability Class: Hearing Difficulty
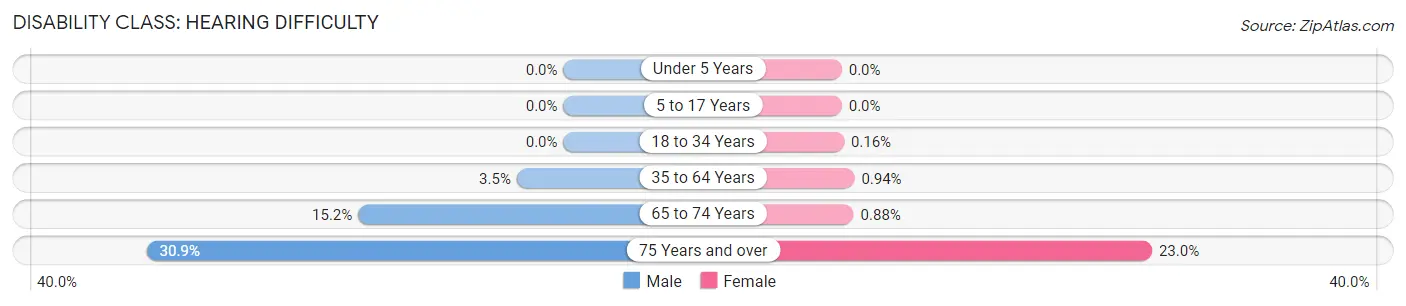
| Age Bracket | Male | Female |
| Under 5 Years | 0 (0.0%) | 0 (0.0%) |
| 5 to 17 Years | 0 (0.0%) | 0 (0.0%) |
| 18 to 34 Years | 0 (0.0%) | 3 (0.2%) |
| 35 to 64 Years | 96 (3.5%) | 30 (0.9%) |
| 65 to 74 Years | 144 (15.2%) | 6 (0.9%) |
| 75 Years and over | 86 (30.9%) | 152 (23.0%) |
Disability Class: Vision Difficulty
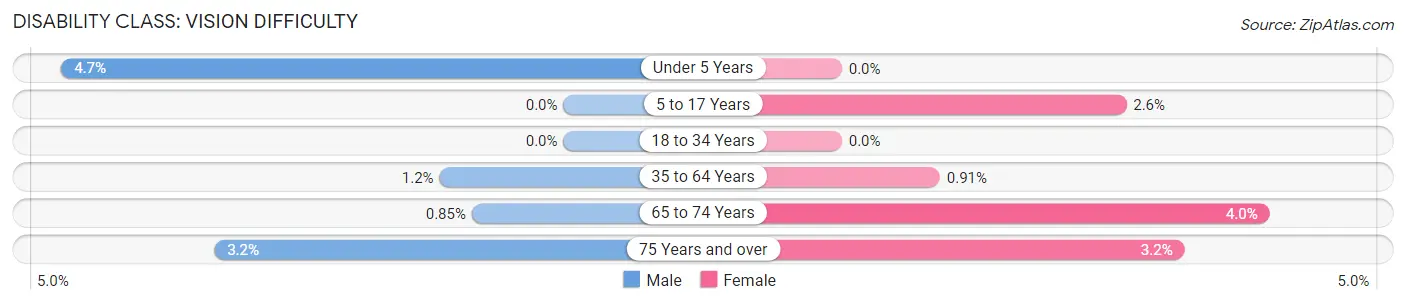
| Age Bracket | Male | Female |
| Under 5 Years | 13 (4.7%) | 0 (0.0%) |
| 5 to 17 Years | 0 (0.0%) | 29 (2.6%) |
| 18 to 34 Years | 0 (0.0%) | 0 (0.0%) |
| 35 to 64 Years | 32 (1.1%) | 29 (0.9%) |
| 65 to 74 Years | 8 (0.9%) | 27 (4.0%) |
| 75 Years and over | 9 (3.2%) | 21 (3.2%) |
Disability Class: Cognitive Difficulty
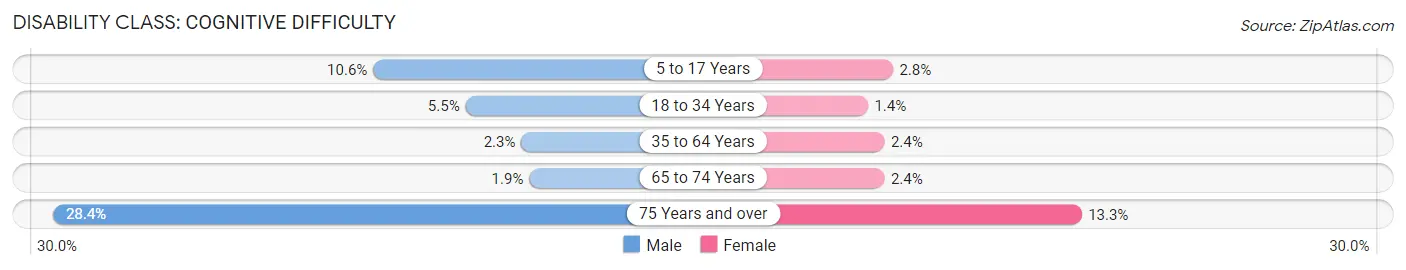
| Age Bracket | Male | Female |
| 5 to 17 Years | 91 (10.6%) | 31 (2.8%) |
| 18 to 34 Years | 104 (5.4%) | 27 (1.4%) |
| 35 to 64 Years | 65 (2.3%) | 75 (2.4%) |
| 65 to 74 Years | 18 (1.9%) | 16 (2.4%) |
| 75 Years and over | 79 (28.4%) | 88 (13.3%) |
Disability Class: Ambulatory Difficulty
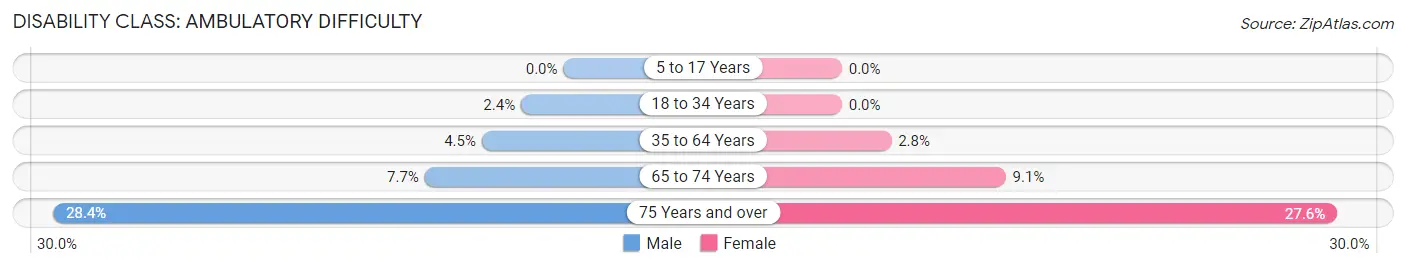
| Age Bracket | Male | Female |
| 5 to 17 Years | 0 (0.0%) | 0 (0.0%) |
| 18 to 34 Years | 45 (2.4%) | 0 (0.0%) |
| 35 to 64 Years | 126 (4.5%) | 88 (2.8%) |
| 65 to 74 Years | 73 (7.7%) | 62 (9.1%) |
| 75 Years and over | 79 (28.4%) | 182 (27.6%) |
Disability Class: Self-Care Difficulty
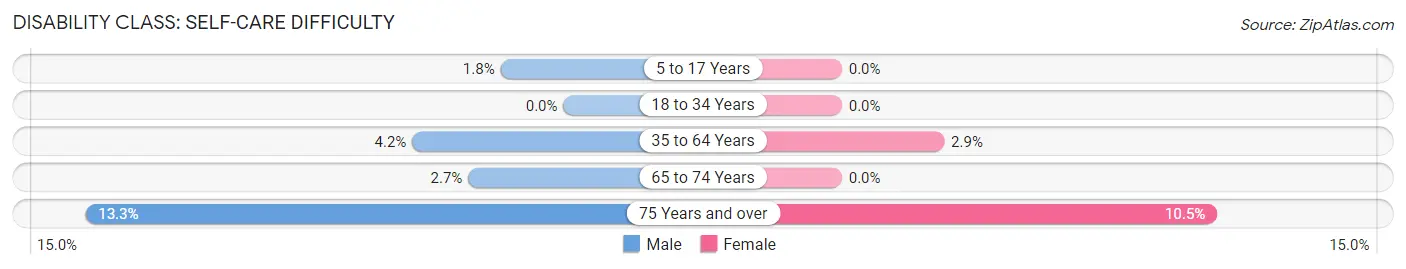
| Age Bracket | Male | Female |
| 5 to 17 Years | 15 (1.8%) | 0 (0.0%) |
| 18 to 34 Years | 0 (0.0%) | 0 (0.0%) |
| 35 to 64 Years | 117 (4.2%) | 91 (2.9%) |
| 65 to 74 Years | 25 (2.6%) | 0 (0.0%) |
| 75 Years and over | 37 (13.3%) | 69 (10.4%) |
Technology Access in South Farmingdale
Computing Device Access in South Farmingdale
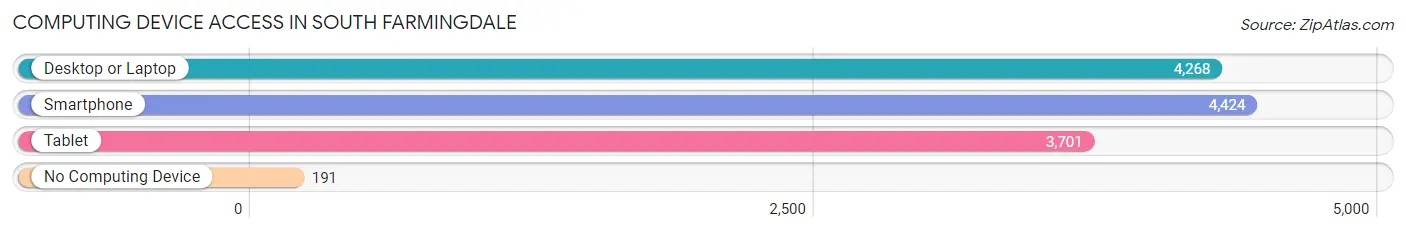
| Device Type | # Households | % Households |
| Desktop or Laptop | 4,268 | 90.0% |
| Smartphone | 4,424 | 93.3% |
| Tablet | 3,701 | 78.0% |
| No Computing Device | 191 | 4.0% |
| Total | 4,742 | 100.0% |
Internet Access in South Farmingdale
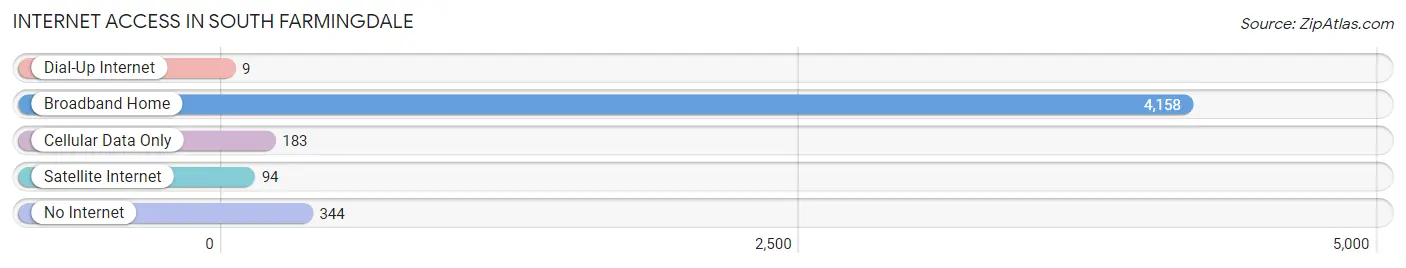
| Internet Type | # Households | % Households |
| Dial-Up Internet | 9 | 0.2% |
| Broadband Home | 4,158 | 87.7% |
| Cellular Data Only | 183 | 3.9% |
| Satellite Internet | 94 | 2.0% |
| No Internet | 344 | 7.2% |
| Total | 4,742 | 100.0% |
South Farmingdale Summary
Farmingdale is a hamlet located in the Town of Oyster Bay in Nassau County, New York. It is located on Long Island, approximately 25 miles east of Manhattan. The hamlet is part of the larger Farmingdale community, which includes the hamlets of South Farmingdale and North Farmingdale.
History
The area that is now South Farmingdale was originally inhabited by the Matinecock Native American tribe. The first European settlers arrived in the area in the late 1600s. The area was known as “Farmingdale” by the early 1700s, and the name was derived from the abundance of farms in the area.
In 1837, the Long Island Rail Road was extended to Farmingdale, which helped to spur the growth of the area. The hamlet was officially incorporated in 1875.
Geography
South Farmingdale is located in the Town of Oyster Bay in Nassau County, New York. It is located on Long Island, approximately 25 miles east of Manhattan. The hamlet is bordered by North Massapequa to the east, North Amityville to the south, and North Babylon to the west.
The hamlet has a total area of 1.3 square miles, all of which is land. The hamlet is located on the South Shore of Long Island, and is part of the larger Farmingdale community.
Economy
South Farmingdale is primarily a residential community, but it does have a few businesses. The hamlet is home to several small businesses, including restaurants, retail stores, and professional services. The hamlet is also home to several industrial and manufacturing businesses.
Demographics
As of the 2010 census, South Farmingdale had a population of 8,867. The population was spread out, with 24.3% under the age of 18, 8.2% from 18 to 24, 28.2% from 25 to 44, 24.3% from 45 to 64, and 14.0% who were 65 years of age or older. The median age was 38.2 years.
The median income for a household in South Farmingdale was $76,945, and the median income for a family was $87,945. The per capita income for the hamlet was $31,945. About 4.2% of families and 5.7% of the population were below the poverty line, including 6.3% of those under age 18 and 4.2% of those age 65 or over.
Common Questions
What is Per Capita Income in South Farmingdale?
Per Capita income in South Farmingdale is $63,286.
What is the Median Family Income in South Farmingdale?
Median Family Income in South Farmingdale is $175,573.
What is the Median Household income in South Farmingdale?
Median Household Income in South Farmingdale is $166,680.
What is Income or Wage Gap in South Farmingdale?
Income or Wage Gap in South Farmingdale is 12.5%.
Women in South Farmingdale earn 87.5 cents for every dollar earned by a man.
What is Inequality or Gini Index in South Farmingdale?
Inequality or Gini Index in South Farmingdale is 0.36.
What is the Total Population of South Farmingdale?
Total Population of South Farmingdale is 15,028.
What is the Total Male Population of South Farmingdale?
Total Male Population of South Farmingdale is 7,098.
What is the Total Female Population of South Farmingdale?
Total Female Population of South Farmingdale is 7,930.
What is the Ratio of Males per 100 Females in South Farmingdale?
There are 89.51 Males per 100 Females in South Farmingdale.
What is the Ratio of Females per 100 Males in South Farmingdale?
There are 111.72 Females per 100 Males in South Farmingdale.
What is the Median Population Age in South Farmingdale?
Median Population Age in South Farmingdale is 43.0 Years.
What is the Average Family Size in South Farmingdale
Average Family Size in South Farmingdale is 3.4 People.
What is the Average Household Size in South Farmingdale
Average Household Size in South Farmingdale is 3.2 People.
How Large is the Labor Force in South Farmingdale?
There are 8,441 People in the Labor Forcein in South Farmingdale.
What is the Percentage of People in the Labor Force in South Farmingdale?
66.5% of People are in the Labor Force in South Farmingdale.
What is the Unemployment Rate in South Farmingdale?
Unemployment Rate in South Farmingdale is 5.9%.