North Wantagh, NY Map & Demographics
North Wantagh Map
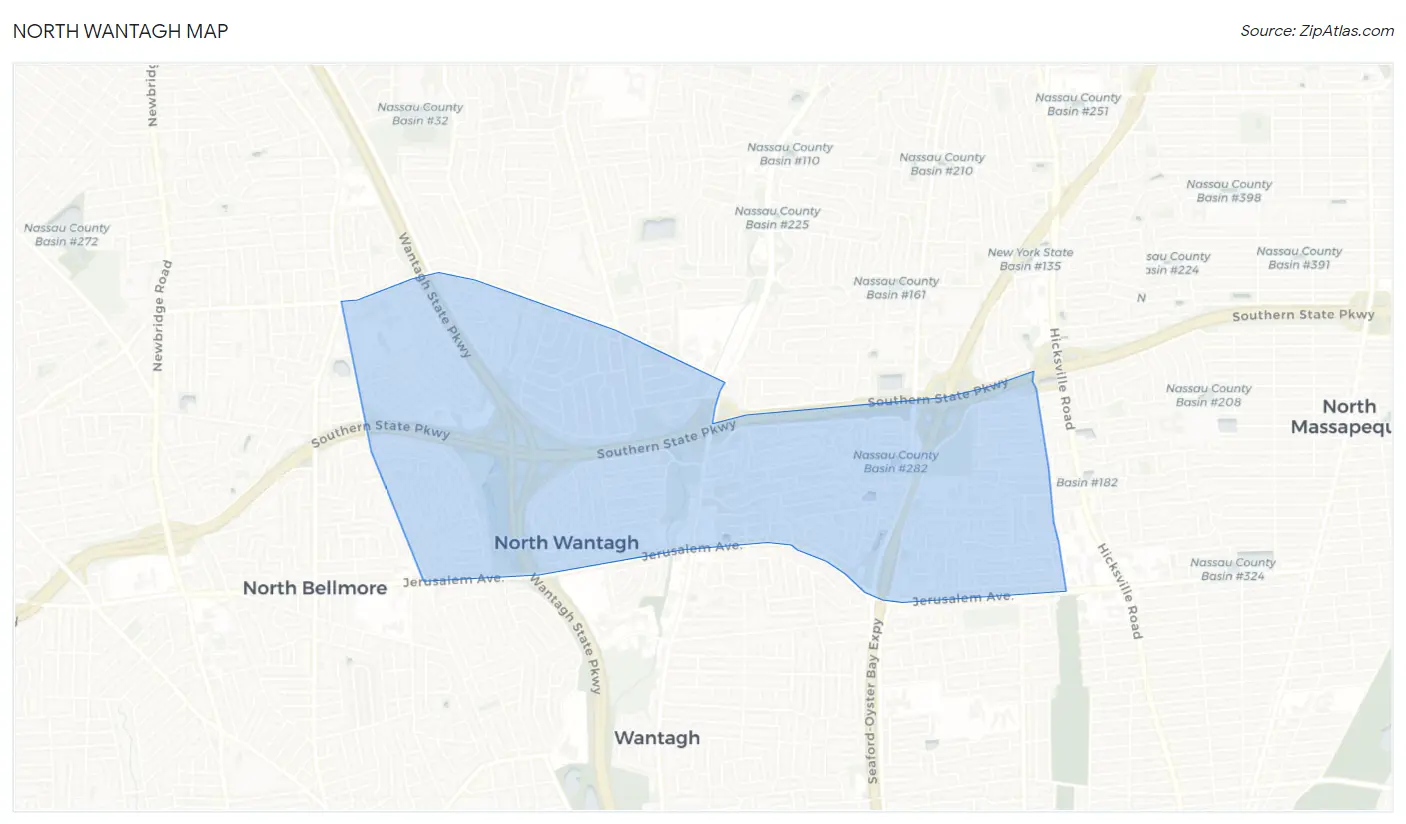
North Wantagh Overview
$61,293
PER CAPITA INCOME
$179,628
AVG FAMILY INCOME
$159,028
AVG HOUSEHOLD INCOME
32.9%
WAGE / INCOME GAP [ % ]
67.1¢/ $1
WAGE / INCOME GAP [ $ ]
$6,734
FAMILY INCOME DEFICIT
0.37
INEQUALITY / GINI INDEX
11,444
TOTAL POPULATION
5,573
MALE POPULATION
5,871
FEMALE POPULATION
94.92
MALES / 100 FEMALES
105.35
FEMALES / 100 MALES
44.0
MEDIAN AGE
3.1
AVG FAMILY SIZE
2.8
AVG HOUSEHOLD SIZE
5,970
LABOR FORCE [ PEOPLE ]
65.2%
PERCENT IN LABOR FORCE
2.7%
UNEMPLOYMENT RATE
Income in North Wantagh
Income Overview in North Wantagh
Per Capita Income in North Wantagh is $61,293, while median incomes of families and households are $179,628 and $159,028 respectively.
| Characteristic | Number | Measure |
| Per Capita Income | 11,444 | $61,293 |
| Median Family Income | 3,307 | $179,628 |
| Mean Family Income | 3,307 | $185,291 |
| Median Household Income | 4,158 | $159,028 |
| Mean Household Income | 4,158 | $168,343 |
| Income Deficit | 3,307 | $6,734 |
| Wage / Income Gap (%) | 11,444 | 32.91% |
| Wage / Income Gap ($) | 11,444 | 67.09¢ per $1 |
| Gini / Inequality Index | 11,444 | 0.37 |
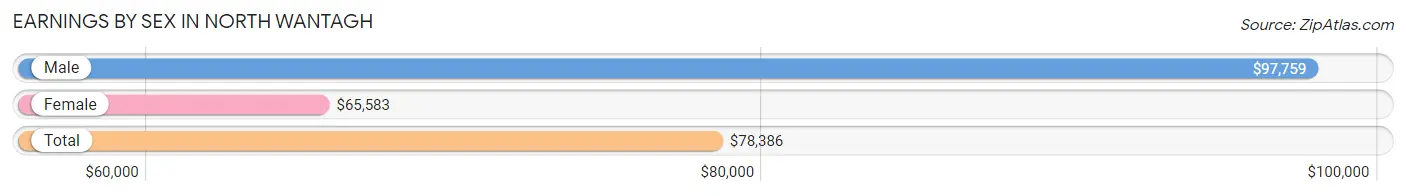
Earnings by Sex in North Wantagh
Average Earnings in North Wantagh are $78,386, $97,759 for men and $65,583 for women, a difference of 32.9%.
| Sex | Number | Average Earnings |
| Male | 3,118 (50.9%) | $97,759 |
| Female | 3,002 (49.0%) | $65,583 |
| Total | 6,120 (100.0%) | $78,386 |
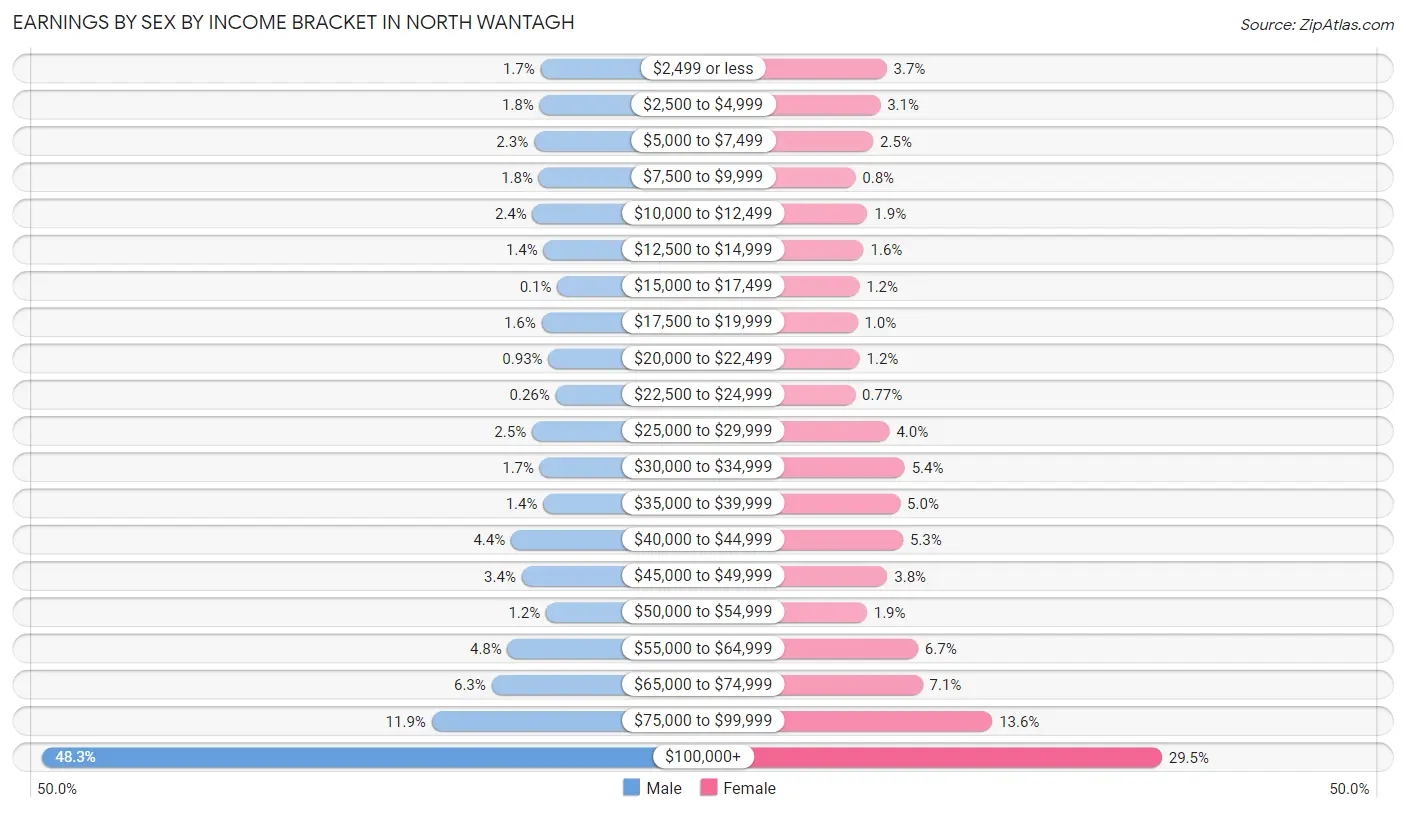
Earnings by Sex by Income Bracket in North Wantagh
The most common earnings brackets in North Wantagh are $100,000+ for men (1,507 | 48.3%) and $100,000+ for women (886 | 29.5%).
| Income | Male | Female |
| $2,499 or less | 52 (1.7%) | 112 (3.7%) |
| $2,500 to $4,999 | 55 (1.8%) | 94 (3.1%) |
| $5,000 to $7,499 | 71 (2.3%) | 74 (2.5%) |
| $7,500 to $9,999 | 57 (1.8%) | 24 (0.8%) |
| $10,000 to $12,499 | 75 (2.4%) | 58 (1.9%) |
| $12,500 to $14,999 | 43 (1.4%) | 47 (1.6%) |
| $15,000 to $17,499 | 3 (0.1%) | 35 (1.2%) |
| $17,500 to $19,999 | 49 (1.6%) | 30 (1.0%) |
| $20,000 to $22,499 | 29 (0.9%) | 36 (1.2%) |
| $22,500 to $24,999 | 8 (0.3%) | 23 (0.8%) |
| $25,000 to $29,999 | 77 (2.5%) | 120 (4.0%) |
| $30,000 to $34,999 | 54 (1.7%) | 163 (5.4%) |
| $35,000 to $39,999 | 44 (1.4%) | 150 (5.0%) |
| $40,000 to $44,999 | 138 (4.4%) | 158 (5.3%) |
| $45,000 to $49,999 | 107 (3.4%) | 114 (3.8%) |
| $50,000 to $54,999 | 36 (1.1%) | 56 (1.9%) |
| $55,000 to $64,999 | 148 (4.8%) | 200 (6.7%) |
| $65,000 to $74,999 | 195 (6.2%) | 213 (7.1%) |
| $75,000 to $99,999 | 370 (11.9%) | 409 (13.6%) |
| $100,000+ | 1,507 (48.3%) | 886 (29.5%) |
| Total | 3,118 (100.0%) | 3,002 (100.0%) |
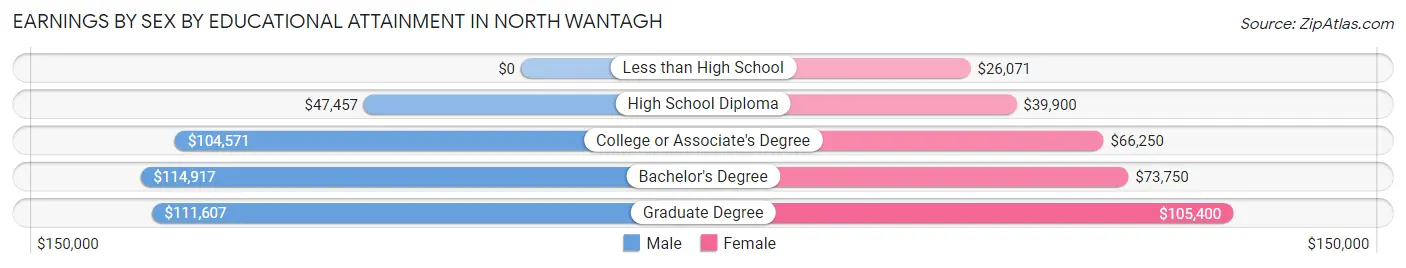
Earnings by Sex by Educational Attainment in North Wantagh
Average earnings in North Wantagh are $104,676 for men and $73,432 for women, a difference of 29.8%. Men with an educational attainment of bachelor's degree enjoy the highest average annual earnings of $114,917, while those with high school diploma education earn the least with $47,457. Women with an educational attainment of graduate degree earn the most with the average annual earnings of $105,400, while those with less than high school education have the smallest earnings of $26,071.
| Educational Attainment | Male Income | Female Income |
| Less than High School | - | - |
| High School Diploma | $47,457 | $39,900 |
| College or Associate's Degree | $104,571 | $66,250 |
| Bachelor's Degree | $114,917 | $73,750 |
| Graduate Degree | $111,607 | $105,400 |
| Total | $104,676 | $73,432 |
Family Income in North Wantagh
Family Income Brackets in North Wantagh
According to the North Wantagh family income data, there are 1,300 families falling into the $200,000+ income range, which is the most common income bracket and makes up 39.3% of all families. Conversely, the $10,000 to $14,999 income bracket is the least frequent group with only 10 families (0.3%) belonging to this category.
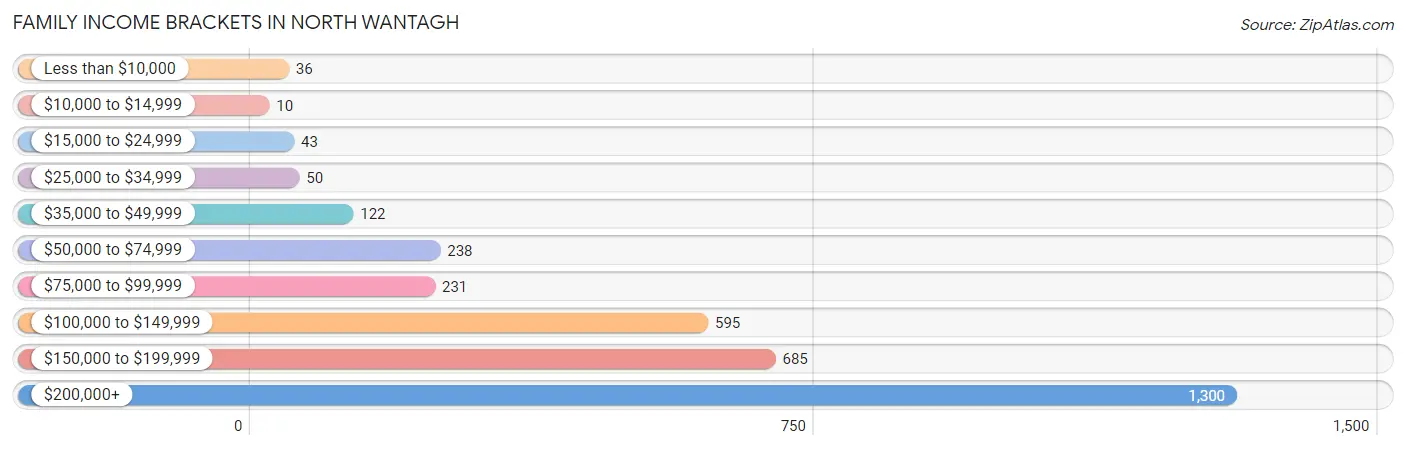
| Income Bracket | # Families | % Families |
| Less than $10,000 | 36 | 1.1% |
| $10,000 to $14,999 | 10 | 0.3% |
| $15,000 to $24,999 | 43 | 1.3% |
| $25,000 to $34,999 | 50 | 1.5% |
| $35,000 to $49,999 | 122 | 3.7% |
| $50,000 to $74,999 | 238 | 7.2% |
| $75,000 to $99,999 | 231 | 7.0% |
| $100,000 to $149,999 | 595 | 18.0% |
| $150,000 to $199,999 | 685 | 20.7% |
| $200,000+ | 1,300 | 39.3% |
Family Income by Famaliy Size in North Wantagh
7+ person families (15 | 0.4%) account for the highest median family income in North Wantagh with $228,958 per family, while 3-person families (655 | 19.8%) have the highest median income of $63,224 per family member.
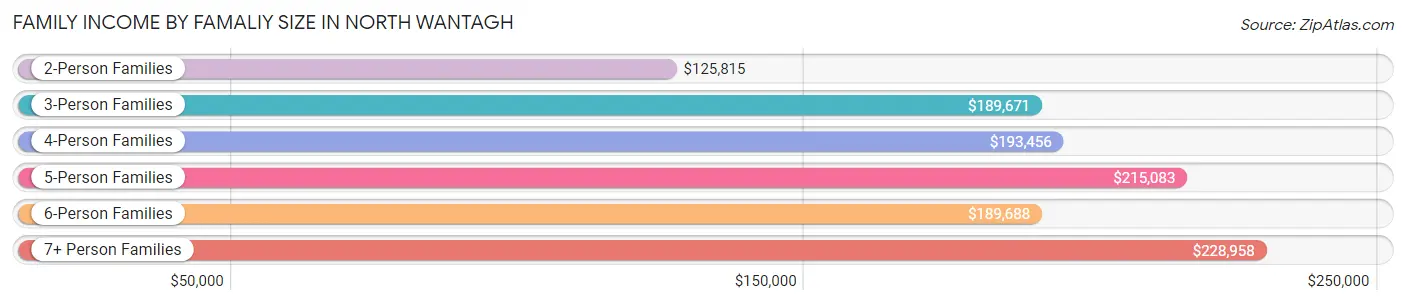
| Income Bracket | # Families | Median Income |
| 2-Person Families | 1,309 (39.6%) | $125,815 |
| 3-Person Families | 655 (19.8%) | $189,671 |
| 4-Person Families | 1,047 (31.7%) | $193,456 |
| 5-Person Families | 219 (6.6%) | $215,083 |
| 6-Person Families | 62 (1.9%) | $189,688 |
| 7+ Person Families | 15 (0.4%) | $228,958 |
| Total | 3,307 (100.0%) | $179,628 |
Family Income by Number of Earners in North Wantagh
The median family income in North Wantagh is $179,628, with families comprising 3+ earners (369) having the highest median family income of $228,472, while families with no earners (467) have the lowest median family income of $58,203, accounting for 11.2% and 14.1% of families, respectively.
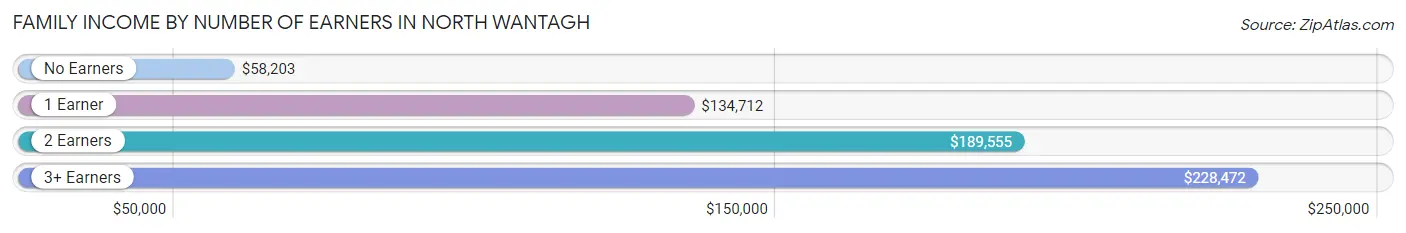
| Number of Earners | # Families | Median Income |
| No Earners | 467 (14.1%) | $58,203 |
| 1 Earner | 779 (23.6%) | $134,712 |
| 2 Earners | 1,692 (51.2%) | $189,555 |
| 3+ Earners | 369 (11.2%) | $228,472 |
| Total | 3,307 (100.0%) | $179,628 |
Household Income in North Wantagh
Household Income Brackets in North Wantagh
With 1,426 households falling in the category, the $200,000+ income range is the most frequent in North Wantagh, accounting for 34.3% of all households. In contrast, only 67 households (1.6%) fall into the less than $10,000 income bracket, making it the least populous group.
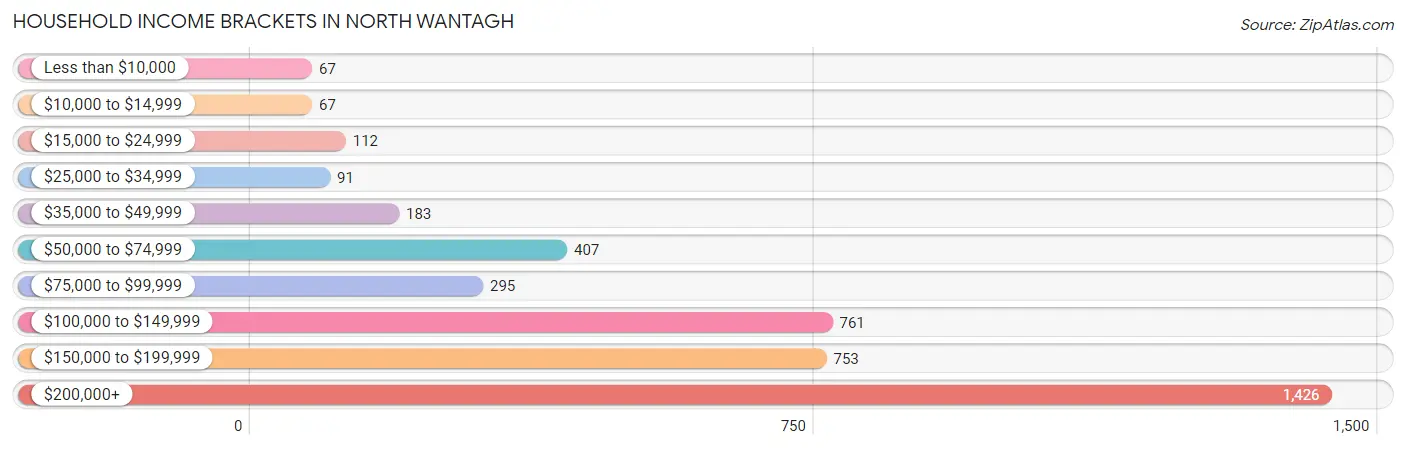
| Income Bracket | # Households | % Households |
| Less than $10,000 | 67 | 1.6% |
| $10,000 to $14,999 | 67 | 1.6% |
| $15,000 to $24,999 | 112 | 2.7% |
| $25,000 to $34,999 | 91 | 2.2% |
| $35,000 to $49,999 | 183 | 4.4% |
| $50,000 to $74,999 | 407 | 9.8% |
| $75,000 to $99,999 | 295 | 7.1% |
| $100,000 to $149,999 | 761 | 18.3% |
| $150,000 to $199,999 | 753 | 18.1% |
| $200,000+ | 1,426 | 34.3% |
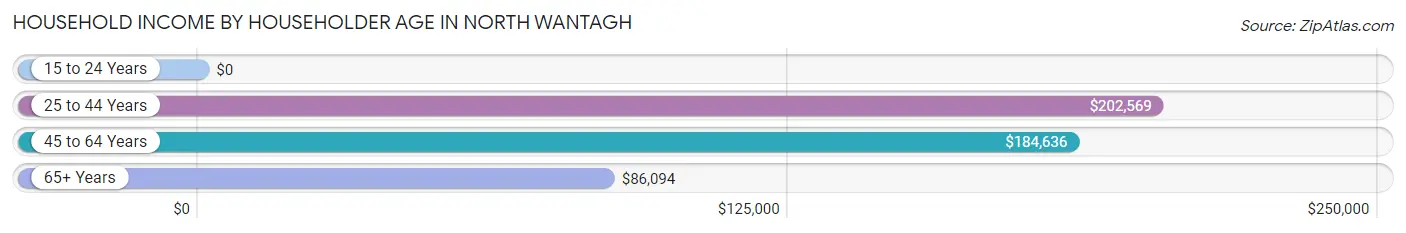
Household Income by Householder Age in North Wantagh
The median household income in North Wantagh is $159,028, with the highest median household income of $202,569 found in the 25 to 44 years age bracket for the primary householder. A total of 1,031 households (24.8%) fall into this category.
| Income Bracket | # Households | Median Income |
| 15 to 24 Years | 0 (0.0%) | $0 |
| 25 to 44 Years | 1,031 (24.8%) | $202,569 |
| 45 to 64 Years | 1,645 (39.6%) | $184,636 |
| 65+ Years | 1,482 (35.6%) | $86,094 |
| Total | 4,158 (100.0%) | $159,028 |
Poverty in North Wantagh
Income Below Poverty by Sex and Age in North Wantagh
With 2.4% poverty level for males and 2.8% for females among the residents of North Wantagh, 75 year old and over males and 75 year old and over females are the most vulnerable to poverty, with 47 males (11.4%) and 75 females (11.1%) in their respective age groups living below the poverty level.
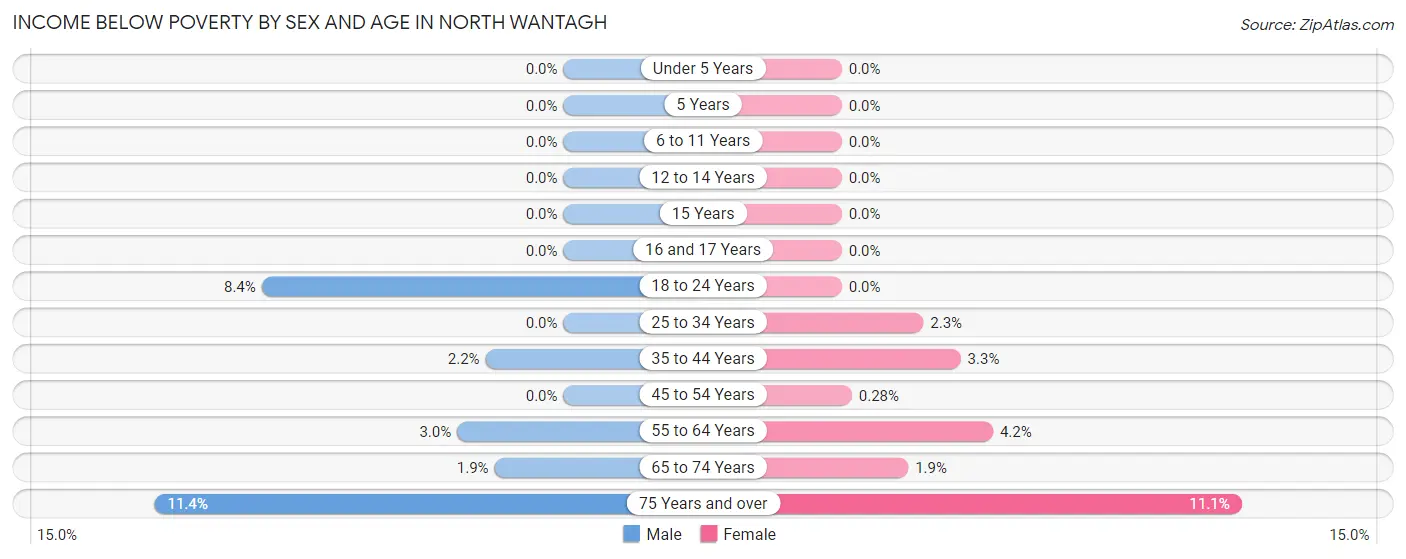
| Age Bracket | Male | Female |
| Under 5 Years | 0 (0.0%) | 0 (0.0%) |
| 5 Years | 0 (0.0%) | 0 (0.0%) |
| 6 to 11 Years | 0 (0.0%) | 0 (0.0%) |
| 12 to 14 Years | 0 (0.0%) | 0 (0.0%) |
| 15 Years | 0 (0.0%) | 0 (0.0%) |
| 16 and 17 Years | 0 (0.0%) | 0 (0.0%) |
| 18 to 24 Years | 32 (8.4%) | 0 (0.0%) |
| 25 to 34 Years | 0 (0.0%) | 11 (2.3%) |
| 35 to 44 Years | 19 (2.2%) | 26 (3.3%) |
| 45 to 54 Years | 0 (0.0%) | 2 (0.3%) |
| 55 to 64 Years | 26 (3.0%) | 35 (4.2%) |
| 65 to 74 Years | 12 (1.9%) | 12 (1.8%) |
| 75 Years and over | 47 (11.4%) | 75 (11.1%) |
| Total | 136 (2.4%) | 161 (2.8%) |
Income Above Poverty by Sex and Age in North Wantagh
According to the poverty statistics in North Wantagh, males aged under 5 years and females aged under 5 years are the age groups that are most secure financially, with 100.0% of males and 100.0% of females in these age groups living above the poverty line.
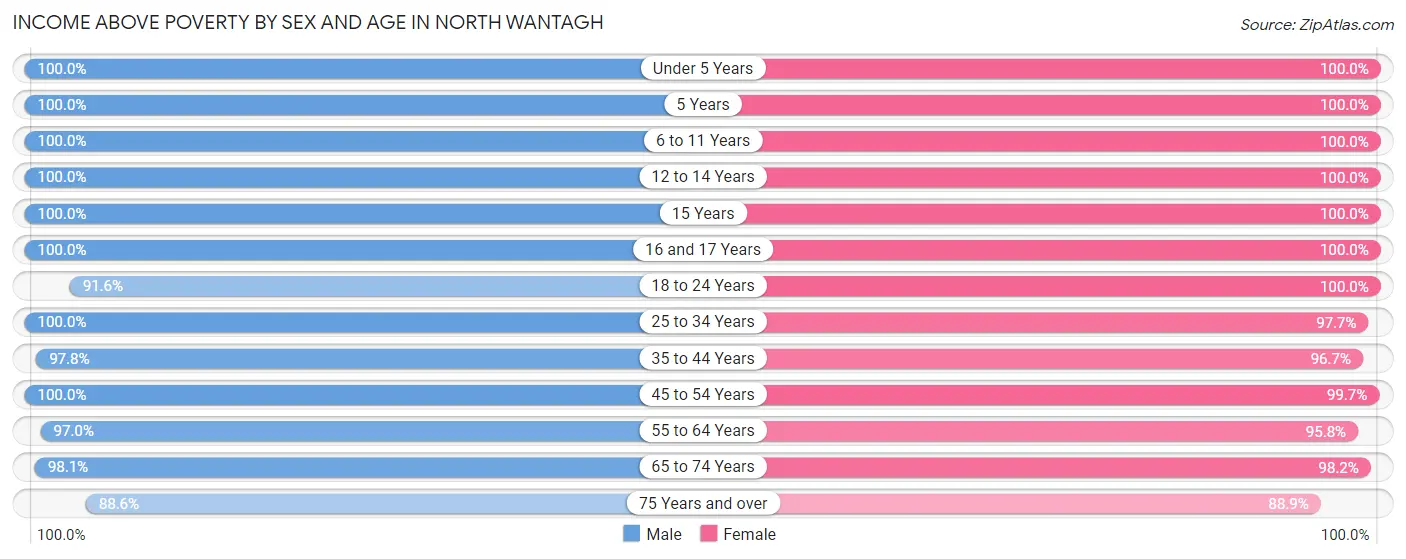
| Age Bracket | Male | Female |
| Under 5 Years | 306 (100.0%) | 450 (100.0%) |
| 5 Years | 51 (100.0%) | 63 (100.0%) |
| 6 to 11 Years | 434 (100.0%) | 489 (100.0%) |
| 12 to 14 Years | 221 (100.0%) | 169 (100.0%) |
| 15 Years | 63 (100.0%) | 21 (100.0%) |
| 16 and 17 Years | 127 (100.0%) | 110 (100.0%) |
| 18 to 24 Years | 349 (91.6%) | 421 (100.0%) |
| 25 to 34 Years | 415 (100.0%) | 473 (97.7%) |
| 35 to 44 Years | 857 (97.8%) | 759 (96.7%) |
| 45 to 54 Years | 783 (100.0%) | 702 (99.7%) |
| 55 to 64 Years | 853 (97.0%) | 797 (95.8%) |
| 65 to 74 Years | 612 (98.1%) | 636 (98.2%) |
| 75 Years and over | 366 (88.6%) | 599 (88.9%) |
| Total | 5,437 (97.6%) | 5,689 (97.3%) |
Income Below Poverty Among Married-Couple Families in North Wantagh
The poverty statistics for married-couple families in North Wantagh show that 2.3% or 65 of the total 2,787 families live below the poverty line. Families with no children have the highest poverty rate of 4.4%, comprising of 65 families. On the other hand, families with 1 or 2 children have the lowest poverty rate of 0.0%, which includes 0 families.
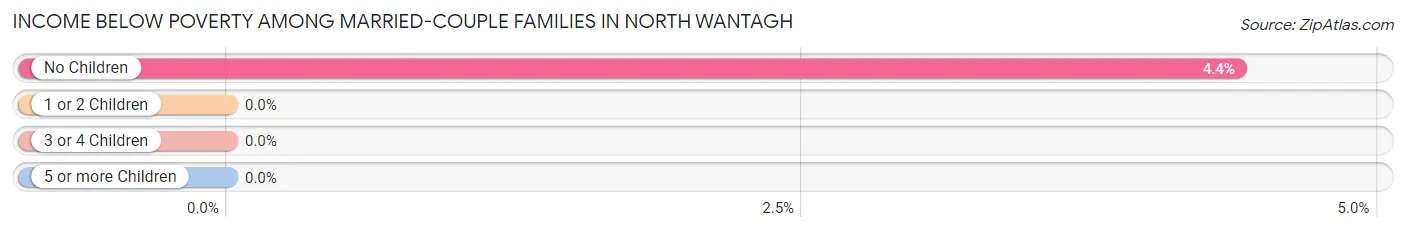
| Children | Above Poverty | Below Poverty |
| No Children | 1,414 (95.6%) | 65 (4.4%) |
| 1 or 2 Children | 1,130 (100.0%) | 0 (0.0%) |
| 3 or 4 Children | 178 (100.0%) | 0 (0.0%) |
| 5 or more Children | 0 (0.0%) | 0 (0.0%) |
| Total | 2,722 (97.7%) | 65 (2.3%) |
Income Below Poverty Among Single-Parent Households in North Wantagh
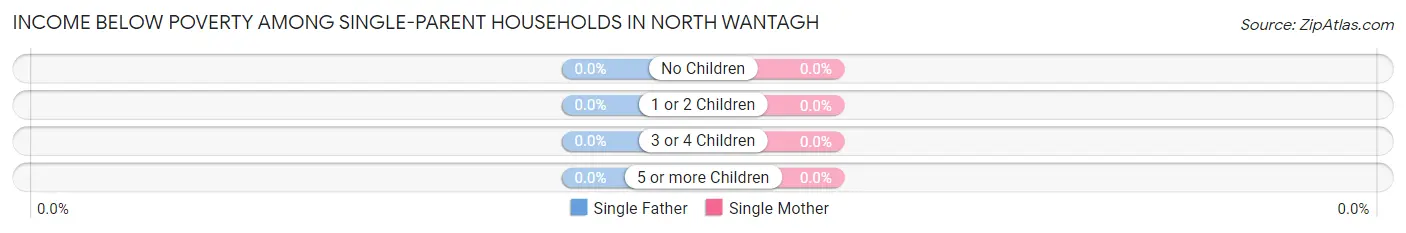
| Children | Single Father | Single Mother |
| No Children | 0 (0.0%) | 0 (0.0%) |
| 1 or 2 Children | 0 (0.0%) | 0 (0.0%) |
| 3 or 4 Children | 0 (0.0%) | 0 (0.0%) |
| 5 or more Children | 0 (0.0%) | 0 (0.0%) |
| Total | 0 (0.0%) | 0 (0.0%) |
Income Below Poverty Among Married-Couple vs Single-Parent Households in North Wantagh
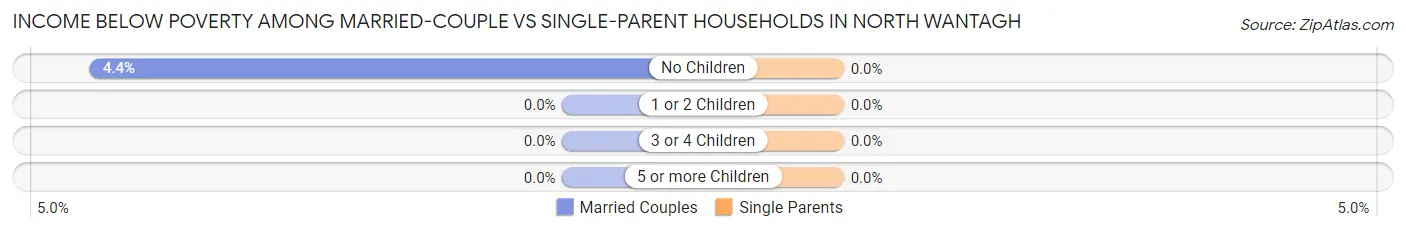
| Children | Married-Couple Families | Single-Parent Households |
| No Children | 65 (4.4%) | 0 (0.0%) |
| 1 or 2 Children | 0 (0.0%) | 0 (0.0%) |
| 3 or 4 Children | 0 (0.0%) | 0 (0.0%) |
| 5 or more Children | 0 (0.0%) | 0 (0.0%) |
| Total | 65 (2.3%) | 0 (0.0%) |
Race in North Wantagh
The most populous races in North Wantagh are White / Caucasian (9,651 | 84.3%), Hispanic or Latino (1,724 | 15.1%), and Two or more Races (901 | 7.9%).
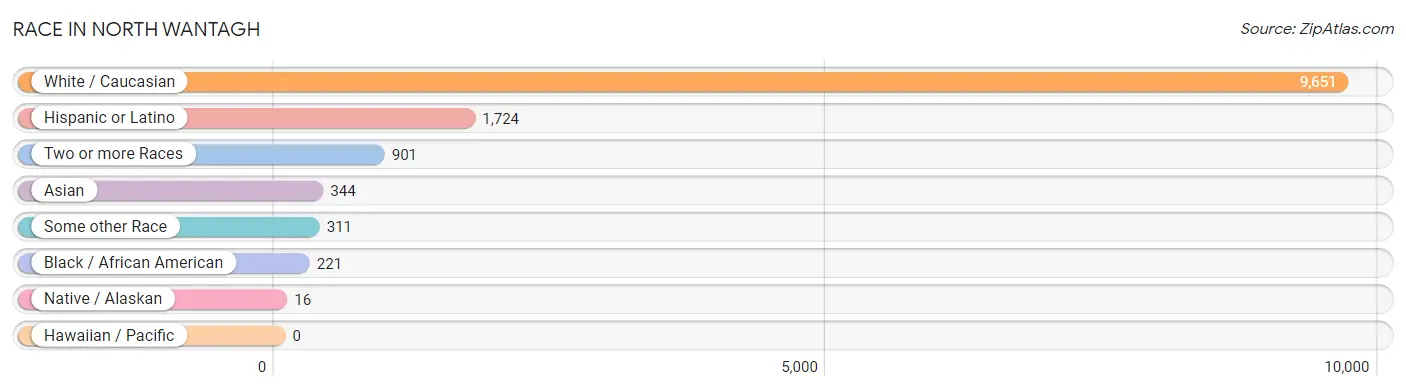
| Race | # Population | % Population |
| Asian | 344 | 3.0% |
| Black / African American | 221 | 1.9% |
| Hawaiian / Pacific | 0 | 0.0% |
| Hispanic or Latino | 1,724 | 15.1% |
| Native / Alaskan | 16 | 0.1% |
| White / Caucasian | 9,651 | 84.3% |
| Two or more Races | 901 | 7.9% |
| Some other Race | 311 | 2.7% |
| Total | 11,444 | 100.0% |
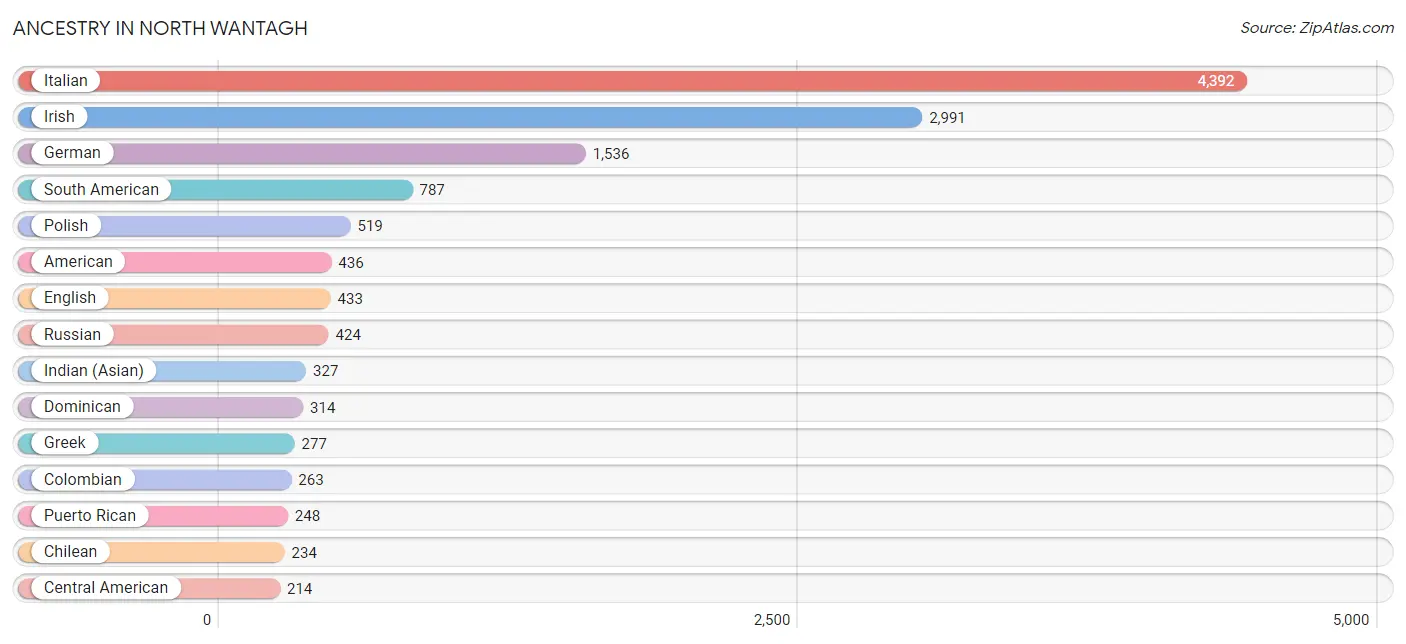
Ancestry in North Wantagh
The most populous ancestries reported in North Wantagh are Italian (4,392 | 38.4%), Irish (2,991 | 26.1%), German (1,536 | 13.4%), South American (787 | 6.9%), and Polish (519 | 4.5%), together accounting for 89.4% of all North Wantagh residents.
| Ancestry | # Population | % Population |
| Albanian | 30 | 0.3% |
| American | 436 | 3.8% |
| Arab | 6 | 0.1% |
| Argentinean | 108 | 0.9% |
| Armenian | 8 | 0.1% |
| Austrian | 97 | 0.9% |
| Barbadian | 62 | 0.5% |
| Belgian | 6 | 0.1% |
| British | 57 | 0.5% |
| Burmese | 9 | 0.1% |
| Central American | 214 | 1.9% |
| Central American Indian | 16 | 0.1% |
| Chilean | 234 | 2.0% |
| Colombian | 263 | 2.3% |
| Cuban | 62 | 0.5% |
| Czech | 72 | 0.6% |
| Czechoslovakian | 7 | 0.1% |
| Danish | 6 | 0.1% |
| Dominican | 314 | 2.7% |
| Dutch | 24 | 0.2% |
| Eastern European | 117 | 1.0% |
| Ecuadorian | 117 | 1.0% |
| English | 433 | 3.8% |
| European | 39 | 0.3% |
| Filipino | 11 | 0.1% |
| Finnish | 27 | 0.2% |
| French | 50 | 0.4% |
| German | 1,536 | 13.4% |
| Greek | 277 | 2.4% |
| Guatemalan | 16 | 0.1% |
| Guyanese | 12 | 0.1% |
| Haitian | 142 | 1.2% |
| Hungarian | 76 | 0.7% |
| Indian (Asian) | 327 | 2.9% |
| Irish | 2,991 | 26.1% |
| Israeli | 15 | 0.1% |
| Italian | 4,392 | 38.4% |
| Korean | 42 | 0.4% |
| Lebanese | 6 | 0.1% |
| Lithuanian | 41 | 0.4% |
| Malaysian | 137 | 1.2% |
| Mexican | 32 | 0.3% |
| Norwegian | 153 | 1.3% |
| Panamanian | 104 | 0.9% |
| Peruvian | 34 | 0.3% |
| Polish | 519 | 4.5% |
| Portuguese | 41 | 0.4% |
| Puerto Rican | 248 | 2.2% |
| Romanian | 75 | 0.7% |
| Russian | 424 | 3.7% |
| Salvadoran | 94 | 0.8% |
| Scandinavian | 12 | 0.1% |
| Scotch-Irish | 6 | 0.1% |
| Scottish | 38 | 0.3% |
| Slovak | 23 | 0.2% |
| South American | 787 | 6.9% |
| Spaniard | 47 | 0.4% |
| Spanish | 20 | 0.2% |
| Swedish | 70 | 0.6% |
| Swiss | 8 | 0.1% |
| Trinidadian and Tobagonian | 44 | 0.4% |
| Turkish | 46 | 0.4% |
| Ukrainian | 11 | 0.1% |
| Welsh | 45 | 0.4% | View All 64 Rows |
Immigrants in North Wantagh
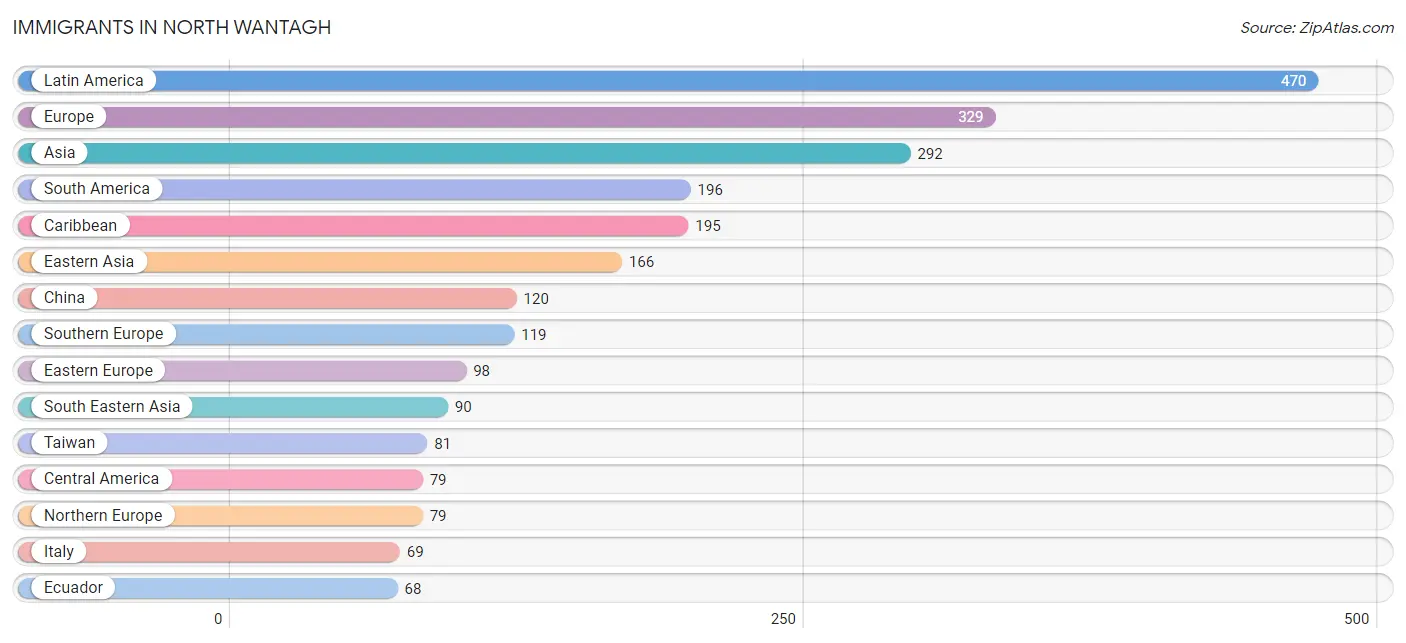
The most numerous immigrant groups reported in North Wantagh came from Latin America (470 | 4.1%), Europe (329 | 2.9%), Asia (292 | 2.5%), South America (196 | 1.7%), and Caribbean (195 | 1.7%), together accounting for 12.9% of all North Wantagh residents.
| Immigration Origin | # Population | % Population |
| Albania | 15 | 0.1% |
| Argentina | 35 | 0.3% |
| Asia | 292 | 2.5% |
| Barbados | 16 | 0.1% |
| Belgium | 6 | 0.1% |
| Bulgaria | 6 | 0.1% |
| Caribbean | 195 | 1.7% |
| Central America | 79 | 0.7% |
| China | 120 | 1.1% |
| Colombia | 28 | 0.2% |
| Cuba | 23 | 0.2% |
| Czechoslovakia | 6 | 0.1% |
| Dominican Republic | 57 | 0.5% |
| Eastern Asia | 166 | 1.5% |
| Eastern Europe | 98 | 0.9% |
| Ecuador | 68 | 0.6% |
| El Salvador | 63 | 0.5% |
| England | 34 | 0.3% |
| Europe | 329 | 2.9% |
| France | 27 | 0.2% |
| Greece | 37 | 0.3% |
| Guatemala | 16 | 0.1% |
| Guyana | 23 | 0.2% |
| Haiti | 48 | 0.4% |
| Hong Kong | 13 | 0.1% |
| India | 18 | 0.2% |
| Ireland | 18 | 0.2% |
| Israel | 6 | 0.1% |
| Italy | 69 | 0.6% |
| Jamaica | 7 | 0.1% |
| Japan | 37 | 0.3% |
| Korea | 9 | 0.1% |
| Latin America | 470 | 4.1% |
| Northern Europe | 79 | 0.7% |
| Pakistan | 12 | 0.1% |
| Peru | 42 | 0.4% |
| Philippines | 59 | 0.5% |
| Poland | 54 | 0.5% |
| Portugal | 13 | 0.1% |
| Russia | 7 | 0.1% |
| South America | 196 | 1.7% |
| South Central Asia | 30 | 0.3% |
| South Eastern Asia | 90 | 0.8% |
| Southern Europe | 119 | 1.0% |
| Taiwan | 81 | 0.7% |
| Thailand | 31 | 0.3% |
| Trinidad and Tobago | 44 | 0.4% |
| Ukraine | 10 | 0.1% |
| Western Asia | 6 | 0.1% |
| Western Europe | 33 | 0.3% | View All 50 Rows |
Sex and Age in North Wantagh
Sex and Age in North Wantagh
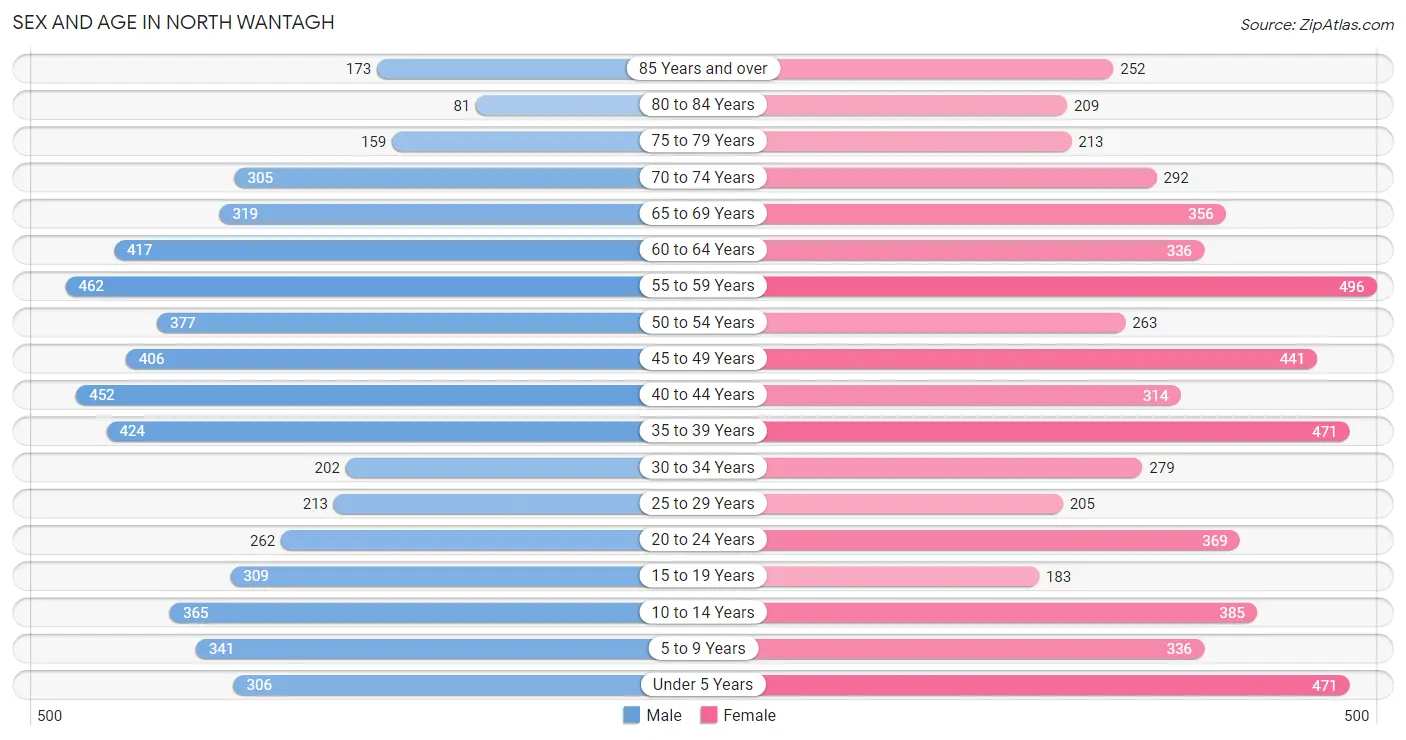
The most populous age groups in North Wantagh are 55 to 59 Years (462 | 8.3%) for men and 55 to 59 Years (496 | 8.5%) for women.
| Age Bracket | Male | Female |
| Under 5 Years | 306 (5.5%) | 471 (8.0%) |
| 5 to 9 Years | 341 (6.1%) | 336 (5.7%) |
| 10 to 14 Years | 365 (6.6%) | 385 (6.6%) |
| 15 to 19 Years | 309 (5.5%) | 183 (3.1%) |
| 20 to 24 Years | 262 (4.7%) | 369 (6.3%) |
| 25 to 29 Years | 213 (3.8%) | 205 (3.5%) |
| 30 to 34 Years | 202 (3.6%) | 279 (4.8%) |
| 35 to 39 Years | 424 (7.6%) | 471 (8.0%) |
| 40 to 44 Years | 452 (8.1%) | 314 (5.3%) |
| 45 to 49 Years | 406 (7.3%) | 441 (7.5%) |
| 50 to 54 Years | 377 (6.8%) | 263 (4.5%) |
| 55 to 59 Years | 462 (8.3%) | 496 (8.5%) |
| 60 to 64 Years | 417 (7.5%) | 336 (5.7%) |
| 65 to 69 Years | 319 (5.7%) | 356 (6.1%) |
| 70 to 74 Years | 305 (5.5%) | 292 (5.0%) |
| 75 to 79 Years | 159 (2.9%) | 213 (3.6%) |
| 80 to 84 Years | 81 (1.5%) | 209 (3.6%) |
| 85 Years and over | 173 (3.1%) | 252 (4.3%) |
| Total | 5,573 (100.0%) | 5,871 (100.0%) |
Families and Households in North Wantagh
Median Family Size in North Wantagh
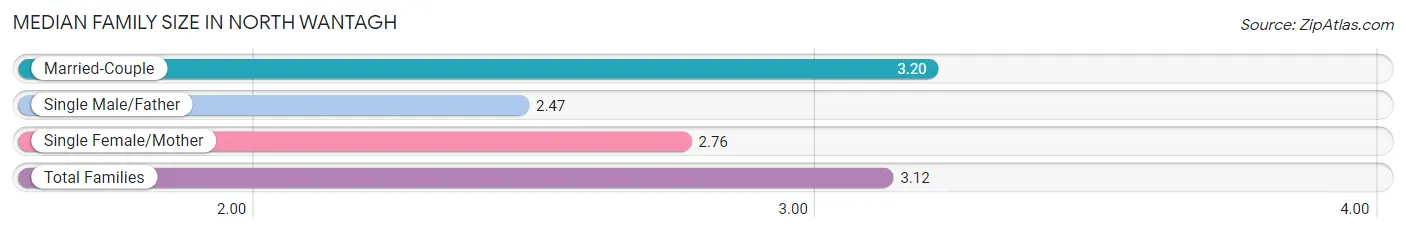
The median family size in North Wantagh is 3.12 persons per family, with married-couple families (2,787 | 84.3%) accounting for the largest median family size of 3.2 persons per family. On the other hand, single male/father families (122 | 3.7%) represent the smallest median family size with 2.47 persons per family.
| Family Type | # Families | Family Size |
| Married-Couple | 2,787 (84.3%) | 3.20 |
| Single Male/Father | 122 (3.7%) | 2.47 |
| Single Female/Mother | 398 (12.0%) | 2.76 |
| Total Families | 3,307 (100.0%) | 3.12 |
Median Household Size in North Wantagh
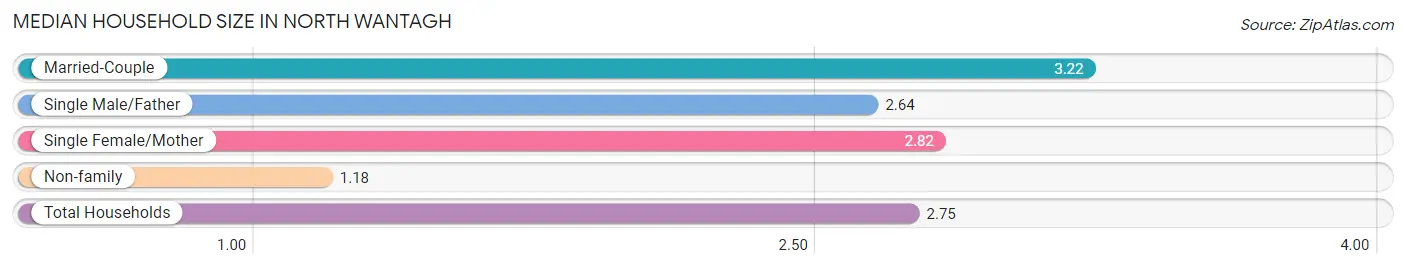
The median household size in North Wantagh is 2.75 persons per household, with married-couple households (2,787 | 67.0%) accounting for the largest median household size of 3.22 persons per household. non-family households (851 | 20.5%) represent the smallest median household size with 1.18 persons per household.
| Household Type | # Households | Household Size |
| Married-Couple | 2,787 (67.0%) | 3.22 |
| Single Male/Father | 122 (2.9%) | 2.64 |
| Single Female/Mother | 398 (9.6%) | 2.82 |
| Non-family | 851 (20.5%) | 1.18 |
| Total Households | 4,158 (100.0%) | 2.75 |
Household Size by Marriage Status in North Wantagh
Out of a total of 4,158 households in North Wantagh, 3,307 (79.5%) are family households, while 851 (20.5%) are nonfamily households. The most numerous type of family households are 2-person households, comprising 1,268, and the most common type of nonfamily households are 1-person households, comprising 740.
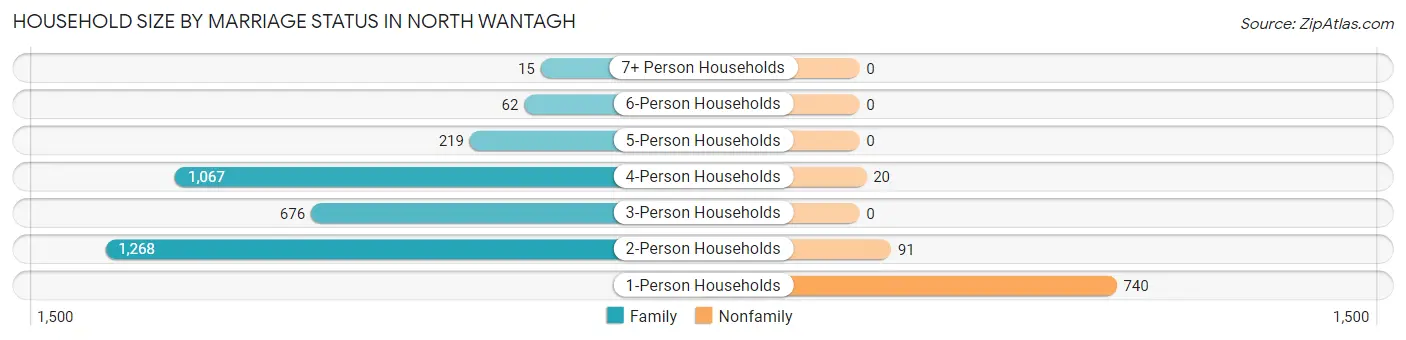
| Household Size | Family Households | Nonfamily Households |
| 1-Person Households | - | 740 (17.8%) |
| 2-Person Households | 1,268 (30.5%) | 91 (2.2%) |
| 3-Person Households | 676 (16.3%) | 0 (0.0%) |
| 4-Person Households | 1,067 (25.7%) | 20 (0.5%) |
| 5-Person Households | 219 (5.3%) | 0 (0.0%) |
| 6-Person Households | 62 (1.5%) | 0 (0.0%) |
| 7+ Person Households | 15 (0.4%) | 0 (0.0%) |
| Total | 3,307 (79.5%) | 851 (20.5%) |
Female Fertility in North Wantagh
Fertility by Age in North Wantagh
Average fertility rate in North Wantagh is 68.0 births per 1,000 women. Women in the age bracket of 35 to 50 years have the highest fertility rate with 88.0 births per 1,000 women. Women in the age bracket of 35 to 50 years acount for 72.2% of all women with births.
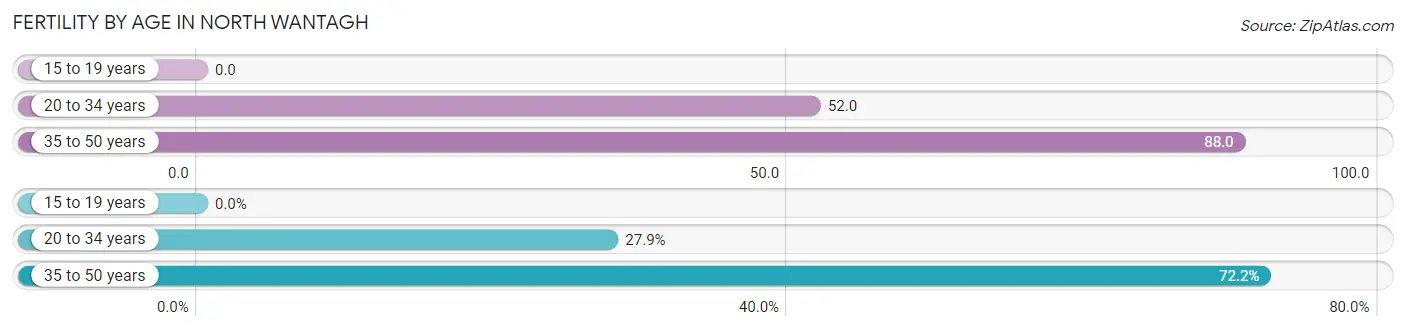
| Age Bracket | Women with Births | Births / 1,000 Women |
| 15 to 19 years | 0 (0.0%) | 0.0 |
| 20 to 34 years | 44 (27.9%) | 52.0 |
| 35 to 50 years | 114 (72.2%) | 88.0 |
| Total | 158 (100.0%) | 68.0 |
Fertility by Age by Marriage Status in North Wantagh
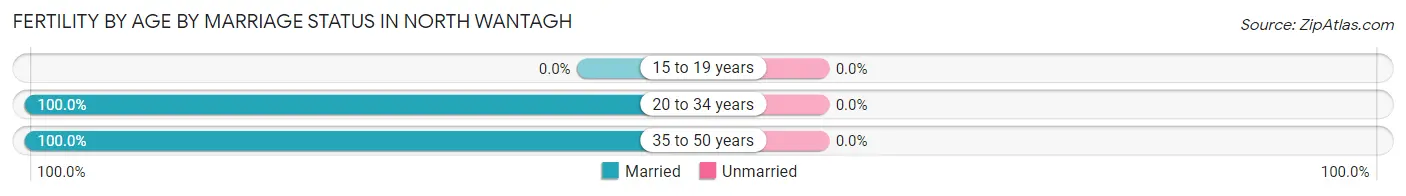
| Age Bracket | Married | Unmarried |
| 15 to 19 years | 0 (0.0%) | 0 (0.0%) |
| 20 to 34 years | 44 (100.0%) | 0 (0.0%) |
| 35 to 50 years | 114 (100.0%) | 0 (0.0%) |
| Total | 158 (100.0%) | 0 (0.0%) |
Fertility by Education in North Wantagh
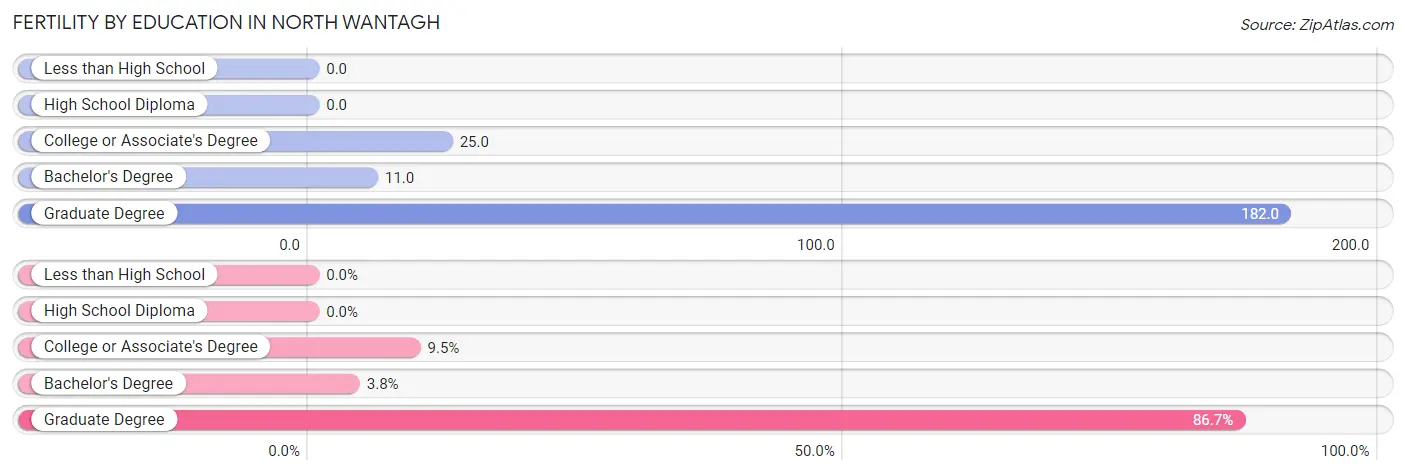
| Educational Attainment | Women with Births | Births / 1,000 Women |
| Less than High School | 0 (0.0%) | 0.0 |
| High School Diploma | 0 (0.0%) | 0.0 |
| College or Associate's Degree | 15 (9.5%) | 25.0 |
| Bachelor's Degree | 6 (3.8%) | 11.0 |
| Graduate Degree | 137 (86.7%) | 182.0 |
| Total | 158 (100.0%) | 68.0 |
Fertility by Education by Marriage Status in North Wantagh
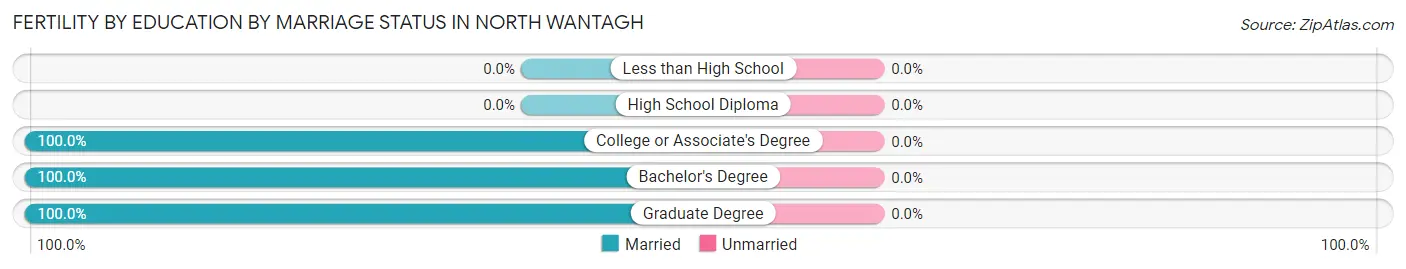
| Educational Attainment | Married | Unmarried |
| Less than High School | 0 (0.0%) | 0 (0.0%) |
| High School Diploma | 0 (0.0%) | 0 (0.0%) |
| College or Associate's Degree | 15 (100.0%) | 0 (0.0%) |
| Bachelor's Degree | 6 (100.0%) | 0 (0.0%) |
| Graduate Degree | 137 (100.0%) | 0 (0.0%) |
| Total | 158 (100.0%) | 0 (0.0%) |
Employment Characteristics in North Wantagh
Employment by Class of Employer in North Wantagh
Among the 5,736 employed individuals in North Wantagh, private company employees (3,179 | 55.4%), local government employees (1,305 | 22.8%), and not-for-profit organizations (587 | 10.2%) make up the most common classes of employment.
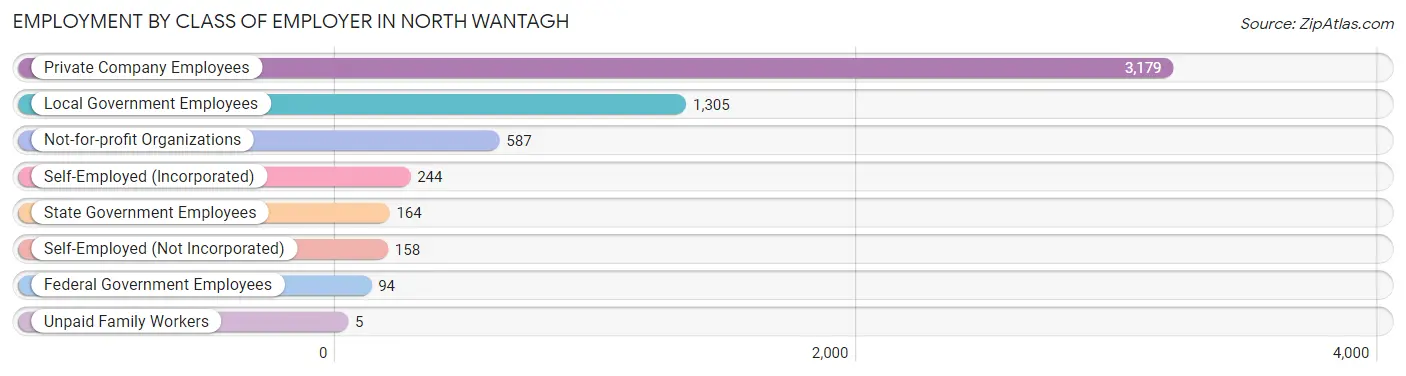
| Employer Class | # Employees | % Employees |
| Private Company Employees | 3,179 | 55.4% |
| Self-Employed (Incorporated) | 244 | 4.3% |
| Self-Employed (Not Incorporated) | 158 | 2.8% |
| Not-for-profit Organizations | 587 | 10.2% |
| Local Government Employees | 1,305 | 22.8% |
| State Government Employees | 164 | 2.9% |
| Federal Government Employees | 94 | 1.6% |
| Unpaid Family Workers | 5 | 0.1% |
| Total | 5,736 | 100.0% |
Employment Status by Age in North Wantagh
According to the labor force statistics for North Wantagh, out of the total population over 16 years of age (9,156), 65.2% or 5,970 individuals are in the labor force, with 2.7% or 161 of them unemployed. The age group with the highest labor force participation rate is 35 to 44 years, with 93.6% or 1,555 individuals in the labor force. Within the labor force, the 16 to 19 years age range has the highest percentage of unemployed individuals, with 27.1% or 32 of them being unemployed.
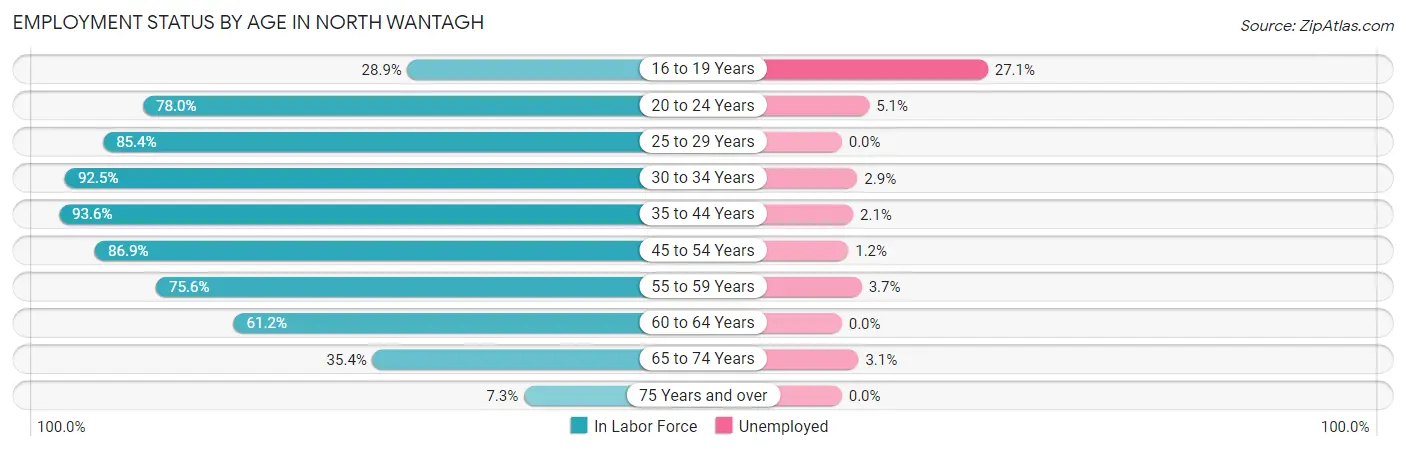
| Age Bracket | In Labor Force | Unemployed |
| 16 to 19 Years | 118 (28.9%) | 32 (27.1%) |
| 20 to 24 Years | 492 (78.0%) | 25 (5.1%) |
| 25 to 29 Years | 357 (85.4%) | 0 (0.0%) |
| 30 to 34 Years | 445 (92.5%) | 13 (2.9%) |
| 35 to 44 Years | 1,555 (93.6%) | 33 (2.1%) |
| 45 to 54 Years | 1,292 (86.9%) | 16 (1.2%) |
| 55 to 59 Years | 724 (75.6%) | 27 (3.7%) |
| 60 to 64 Years | 461 (61.2%) | 0 (0.0%) |
| 65 to 74 Years | 450 (35.4%) | 14 (3.1%) |
| 75 Years and over | 79 (7.3%) | 0 (0.0%) |
| Total | 5,970 (65.2%) | 161 (2.7%) |
Employment Status by Educational Attainment in North Wantagh
According to labor force statistics for North Wantagh, 83.9% of individuals (4,831) out of the total population between 25 and 64 years of age (5,758) are in the labor force, with 1.8% or 87 of them being unemployed. The group with the highest labor force participation rate are those with the educational attainment of bachelor's degree or higher, with 91.6% or 2,732 individuals in the labor force. Within the labor force, individuals with high school diploma education have the highest percentage of unemployment, with 2.5% or 16 of them being unemployed.
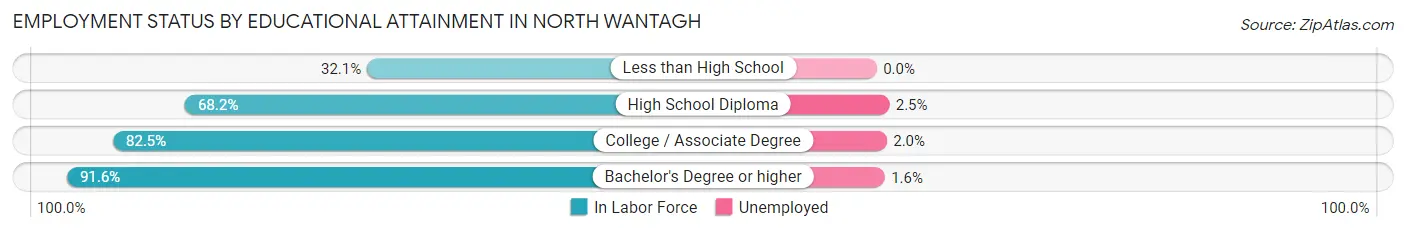
| Educational Attainment | In Labor Force | Unemployed |
| Less than High School | 34 (32.1%) | 0 (0.0%) |
| High School Diploma | 648 (68.2%) | 24 (2.5%) |
| College / Associate Degree | 1,419 (82.5%) | 34 (2.0%) |
| Bachelor's Degree or higher | 2,732 (91.6%) | 48 (1.6%) |
| Total | 4,831 (83.9%) | 104 (1.8%) |
Employment Occupations by Sex in North Wantagh
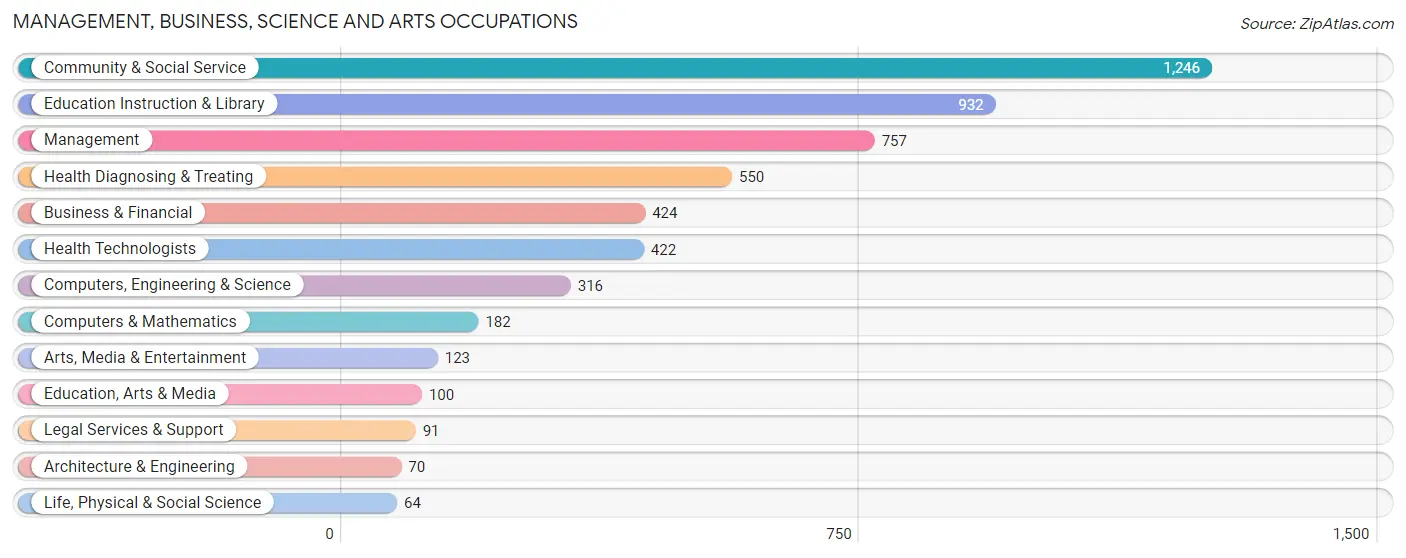
Management, Business, Science and Arts Occupations
The most common Management, Business, Science and Arts occupations in North Wantagh are Community & Social Service (1,246 | 21.4%), Education Instruction & Library (932 | 16.0%), Management (757 | 13.0%), Health Diagnosing & Treating (550 | 9.5%), and Business & Financial (424 | 7.3%).
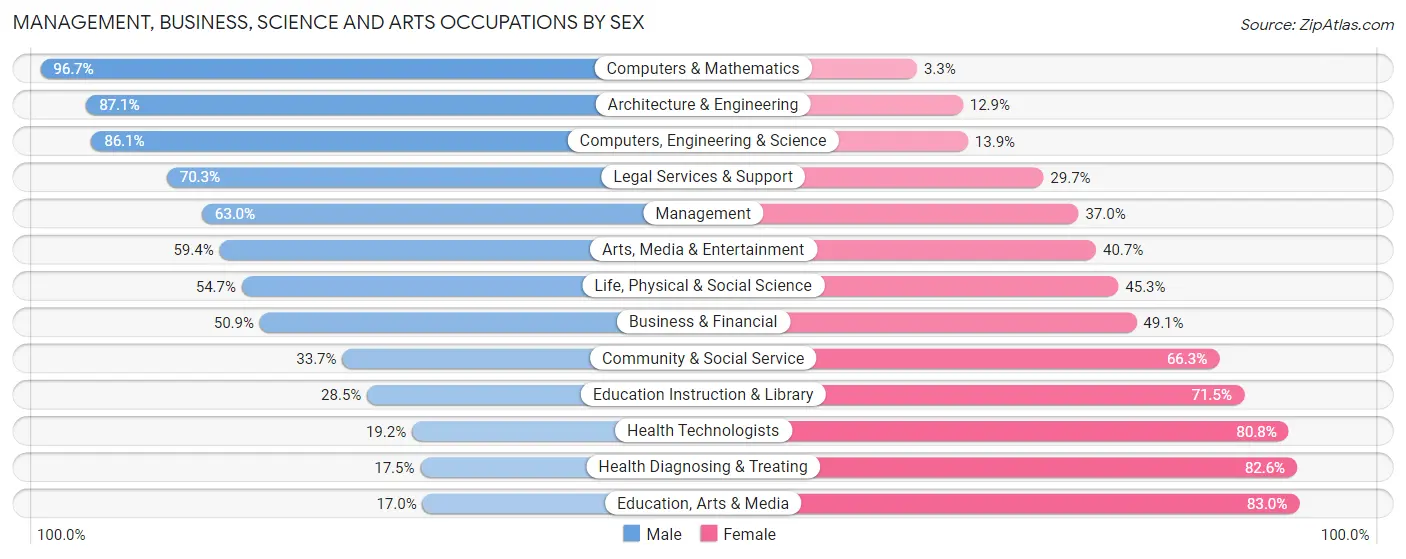
Management, Business, Science and Arts Occupations by Sex
Within the Management, Business, Science and Arts occupations in North Wantagh, the most male-oriented occupations are Computers & Mathematics (96.7%), Architecture & Engineering (87.1%), and Computers, Engineering & Science (86.1%), while the most female-oriented occupations are Education, Arts & Media (83.0%), Health Diagnosing & Treating (82.6%), and Health Technologists (80.8%).
| Occupation | Male | Female |
| Management | 477 (63.0%) | 280 (37.0%) |
| Business & Financial | 216 (50.9%) | 208 (49.1%) |
| Computers, Engineering & Science | 272 (86.1%) | 44 (13.9%) |
| Computers & Mathematics | 176 (96.7%) | 6 (3.3%) |
| Architecture & Engineering | 61 (87.1%) | 9 (12.9%) |
| Life, Physical & Social Science | 35 (54.7%) | 29 (45.3%) |
| Community & Social Service | 420 (33.7%) | 826 (66.3%) |
| Education, Arts & Media | 17 (17.0%) | 83 (83.0%) |
| Legal Services & Support | 64 (70.3%) | 27 (29.7%) |
| Education Instruction & Library | 266 (28.5%) | 666 (71.5%) |
| Arts, Media & Entertainment | 73 (59.4%) | 50 (40.6%) |
| Health Diagnosing & Treating | 96 (17.4%) | 454 (82.6%) |
| Health Technologists | 81 (19.2%) | 341 (80.8%) |
| Total (Category) | 1,481 (45.0%) | 1,812 (55.0%) |
| Total (Overall) | 2,965 (51.0%) | 2,848 (49.0%) |
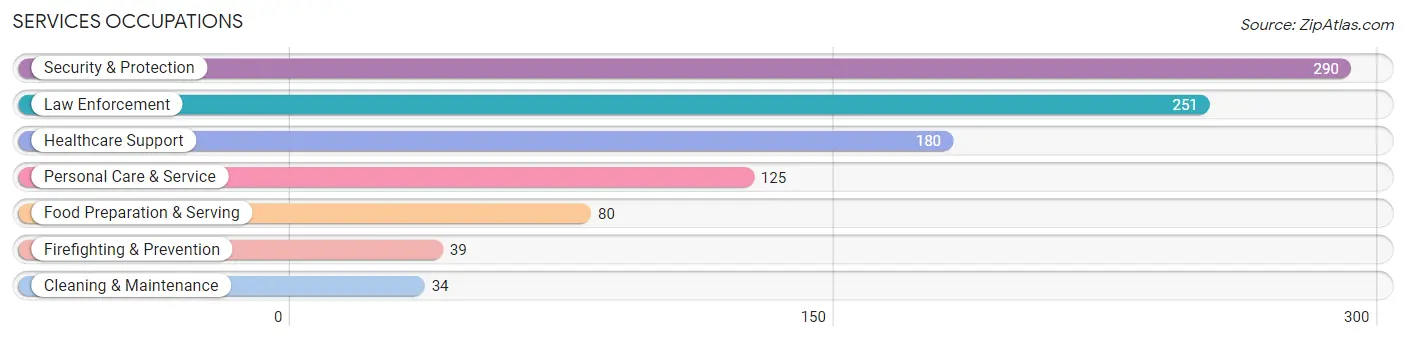
Services Occupations
The most common Services occupations in North Wantagh are Security & Protection (290 | 5.0%), Law Enforcement (251 | 4.3%), Healthcare Support (180 | 3.1%), Personal Care & Service (125 | 2.1%), and Food Preparation & Serving (80 | 1.4%).
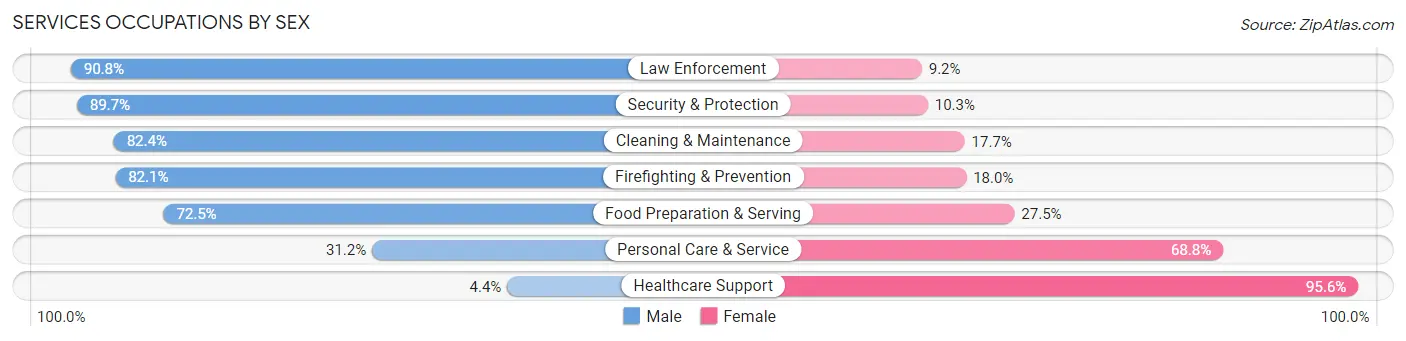
Services Occupations by Sex
Within the Services occupations in North Wantagh, the most male-oriented occupations are Law Enforcement (90.8%), Security & Protection (89.7%), and Cleaning & Maintenance (82.4%), while the most female-oriented occupations are Healthcare Support (95.6%), Personal Care & Service (68.8%), and Food Preparation & Serving (27.5%).
| Occupation | Male | Female |
| Healthcare Support | 8 (4.4%) | 172 (95.6%) |
| Security & Protection | 260 (89.7%) | 30 (10.3%) |
| Firefighting & Prevention | 32 (82.1%) | 7 (17.9%) |
| Law Enforcement | 228 (90.8%) | 23 (9.2%) |
| Food Preparation & Serving | 58 (72.5%) | 22 (27.5%) |
| Cleaning & Maintenance | 28 (82.4%) | 6 (17.6%) |
| Personal Care & Service | 39 (31.2%) | 86 (68.8%) |
| Total (Category) | 393 (55.4%) | 316 (44.6%) |
| Total (Overall) | 2,965 (51.0%) | 2,848 (49.0%) |
Sales and Office Occupations
The most common Sales and Office occupations in North Wantagh are Office & Administration (626 | 10.8%), and Sales & Related (517 | 8.9%).
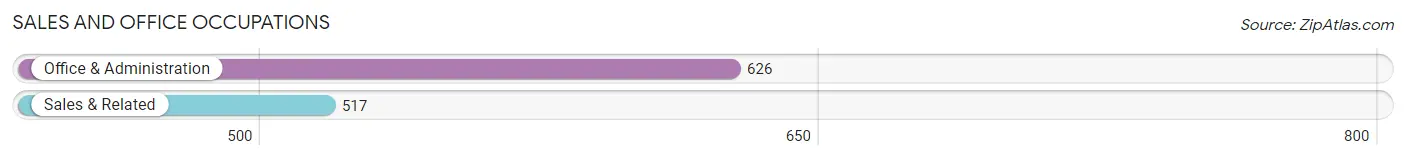
Sales and Office Occupations by Sex
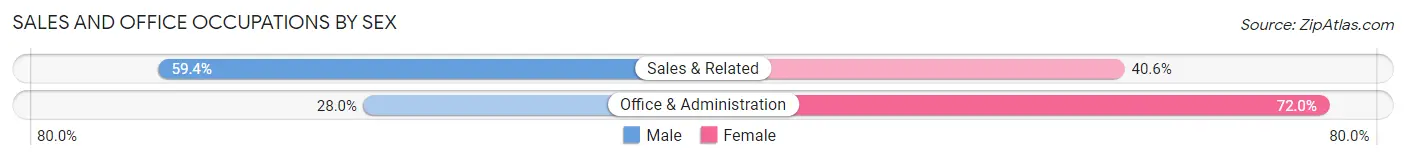
| Occupation | Male | Female |
| Sales & Related | 307 (59.4%) | 210 (40.6%) |
| Office & Administration | 175 (28.0%) | 451 (72.0%) |
| Total (Category) | 482 (42.2%) | 661 (57.8%) |
| Total (Overall) | 2,965 (51.0%) | 2,848 (49.0%) |
Natural Resources, Construction and Maintenance Occupations
The most common Natural Resources, Construction and Maintenance occupations in North Wantagh are Construction & Extraction (205 | 3.5%), and Installation, Maintenance & Repair (154 | 2.6%).
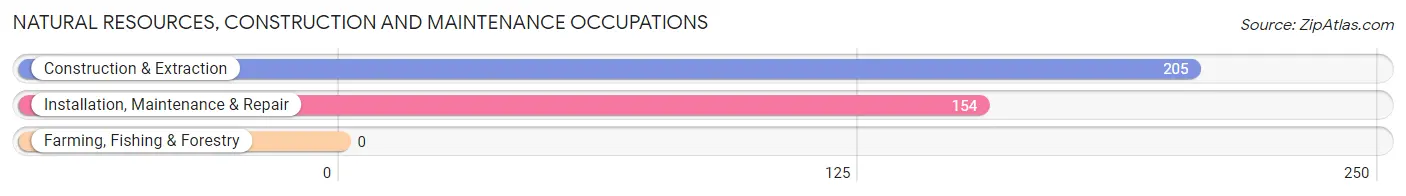
Natural Resources, Construction and Maintenance Occupations by Sex
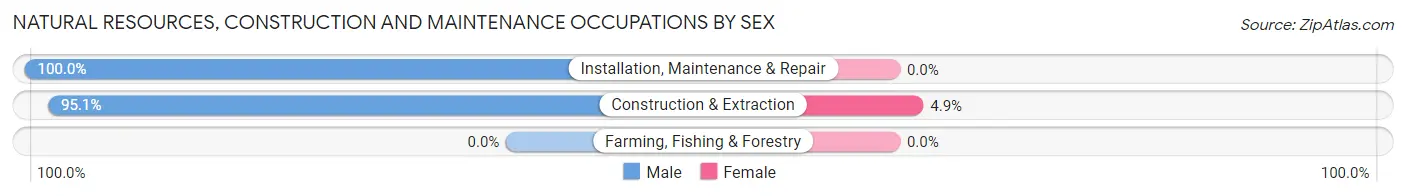
| Occupation | Male | Female |
| Farming, Fishing & Forestry | 0 (0.0%) | 0 (0.0%) |
| Construction & Extraction | 195 (95.1%) | 10 (4.9%) |
| Installation, Maintenance & Repair | 154 (100.0%) | 0 (0.0%) |
| Total (Category) | 349 (97.2%) | 10 (2.8%) |
| Total (Overall) | 2,965 (51.0%) | 2,848 (49.0%) |
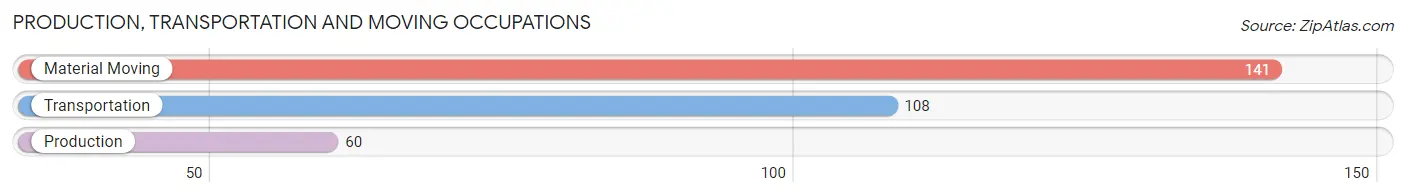
Production, Transportation and Moving Occupations
The most common Production, Transportation and Moving occupations in North Wantagh are Material Moving (141 | 2.4%), Transportation (108 | 1.9%), and Production (60 | 1.0%).
Production, Transportation and Moving Occupations by Sex
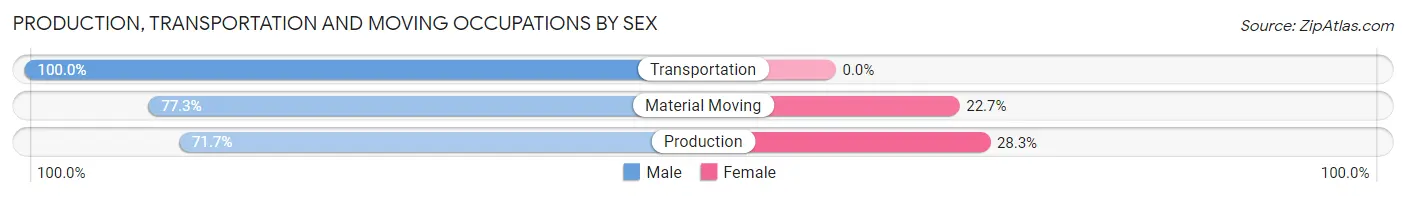
| Occupation | Male | Female |
| Production | 43 (71.7%) | 17 (28.3%) |
| Transportation | 108 (100.0%) | 0 (0.0%) |
| Material Moving | 109 (77.3%) | 32 (22.7%) |
| Total (Category) | 260 (84.1%) | 49 (15.9%) |
| Total (Overall) | 2,965 (51.0%) | 2,848 (49.0%) |
Employment Industries by Sex in North Wantagh
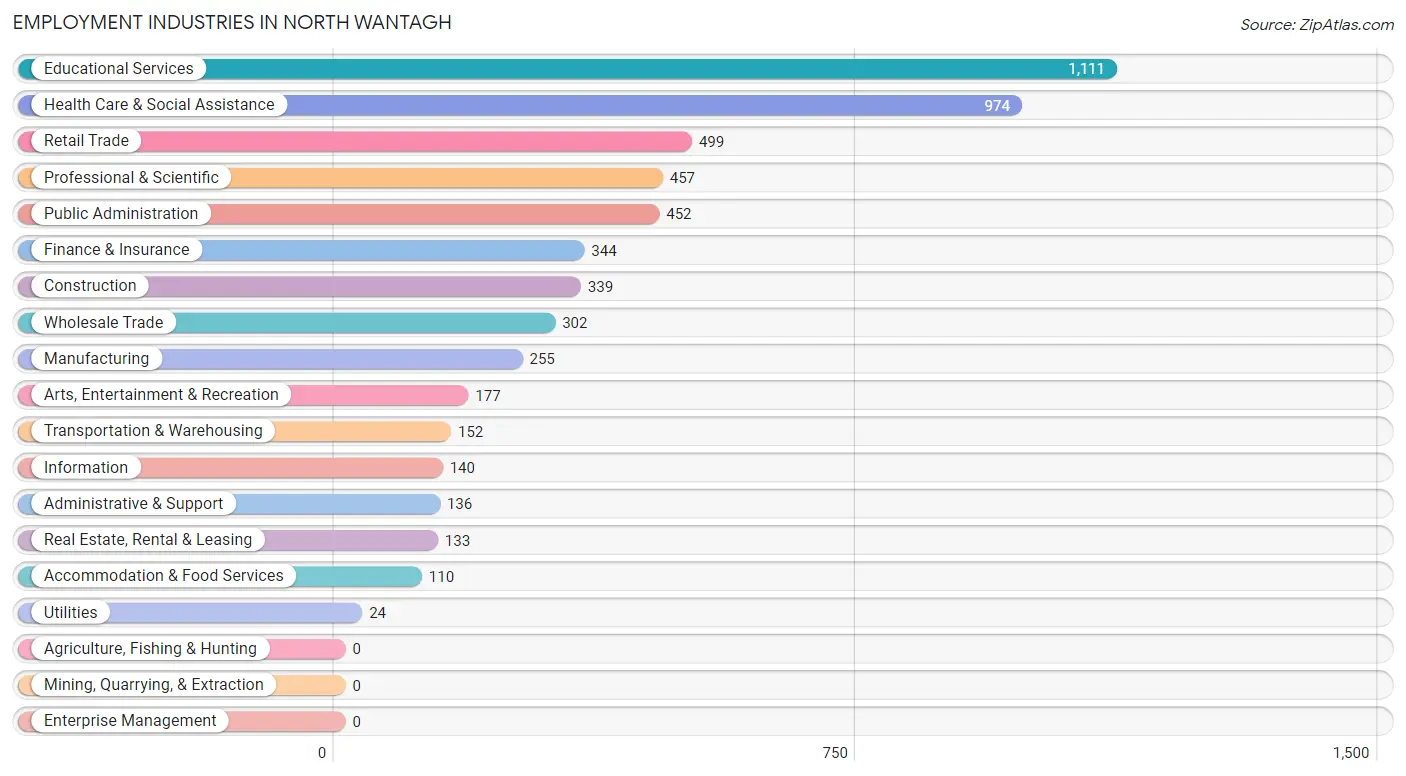
Employment Industries in North Wantagh
The major employment industries in North Wantagh include Educational Services (1,111 | 19.1%), Health Care & Social Assistance (974 | 16.8%), Retail Trade (499 | 8.6%), Professional & Scientific (457 | 7.9%), and Public Administration (452 | 7.8%).
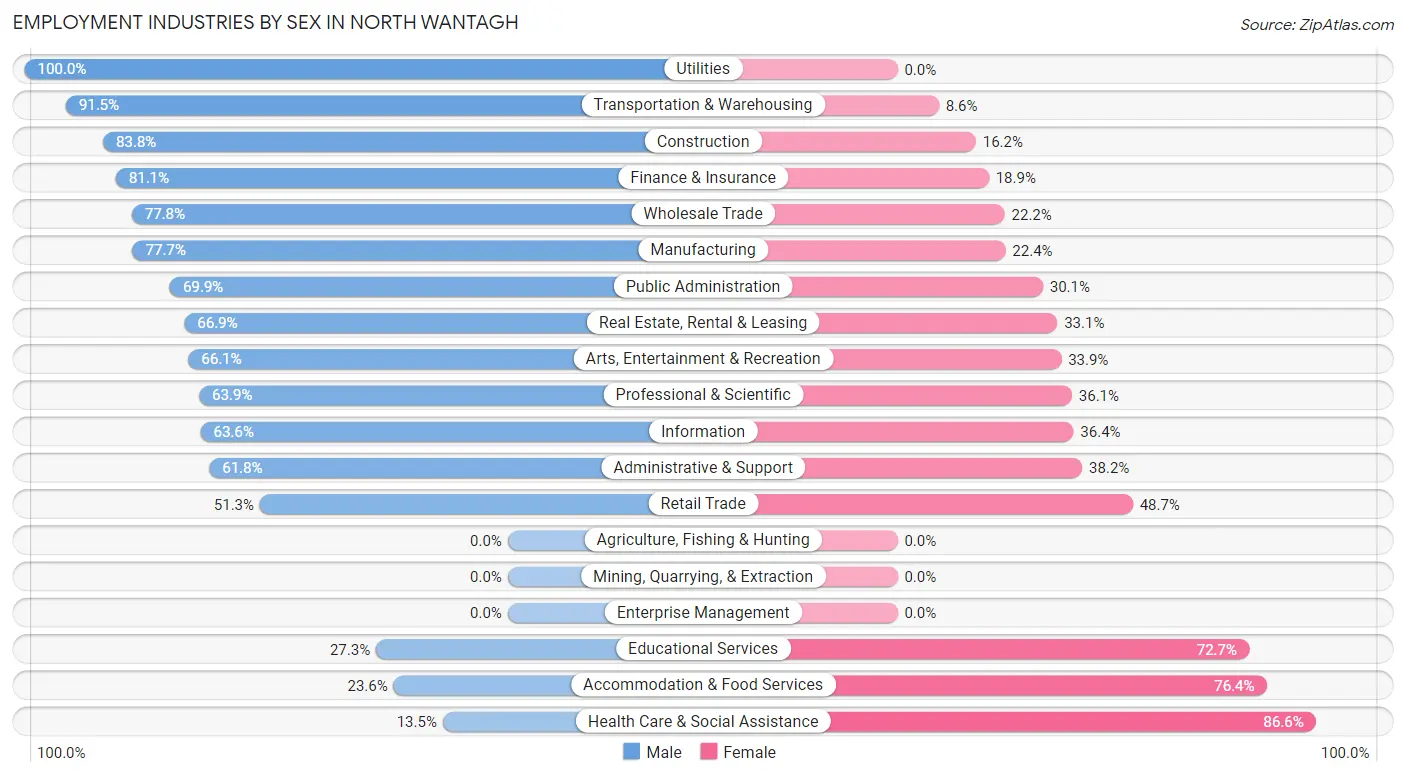
Employment Industries by Sex in North Wantagh
The North Wantagh industries that see more men than women are Utilities (100.0%), Transportation & Warehousing (91.4%), and Construction (83.8%), whereas the industries that tend to have a higher number of women are Health Care & Social Assistance (86.6%), Accommodation & Food Services (76.4%), and Educational Services (72.7%).
| Industry | Male | Female |
| Agriculture, Fishing & Hunting | 0 (0.0%) | 0 (0.0%) |
| Mining, Quarrying, & Extraction | 0 (0.0%) | 0 (0.0%) |
| Construction | 284 (83.8%) | 55 (16.2%) |
| Manufacturing | 198 (77.6%) | 57 (22.4%) |
| Wholesale Trade | 235 (77.8%) | 67 (22.2%) |
| Retail Trade | 256 (51.3%) | 243 (48.7%) |
| Transportation & Warehousing | 139 (91.4%) | 13 (8.6%) |
| Utilities | 24 (100.0%) | 0 (0.0%) |
| Information | 89 (63.6%) | 51 (36.4%) |
| Finance & Insurance | 279 (81.1%) | 65 (18.9%) |
| Real Estate, Rental & Leasing | 89 (66.9%) | 44 (33.1%) |
| Professional & Scientific | 292 (63.9%) | 165 (36.1%) |
| Enterprise Management | 0 (0.0%) | 0 (0.0%) |
| Administrative & Support | 84 (61.8%) | 52 (38.2%) |
| Educational Services | 303 (27.3%) | 808 (72.7%) |
| Health Care & Social Assistance | 131 (13.5%) | 843 (86.6%) |
| Arts, Entertainment & Recreation | 117 (66.1%) | 60 (33.9%) |
| Accommodation & Food Services | 26 (23.6%) | 84 (76.4%) |
| Public Administration | 316 (69.9%) | 136 (30.1%) |
| Total | 2,965 (51.0%) | 2,848 (49.0%) |
Education in North Wantagh
School Enrollment in North Wantagh
The most common levels of schooling among the 2,578 students in North Wantagh are elementary school (573 | 22.2%), high school (540 | 20.9%), and middle school (497 | 19.3%).
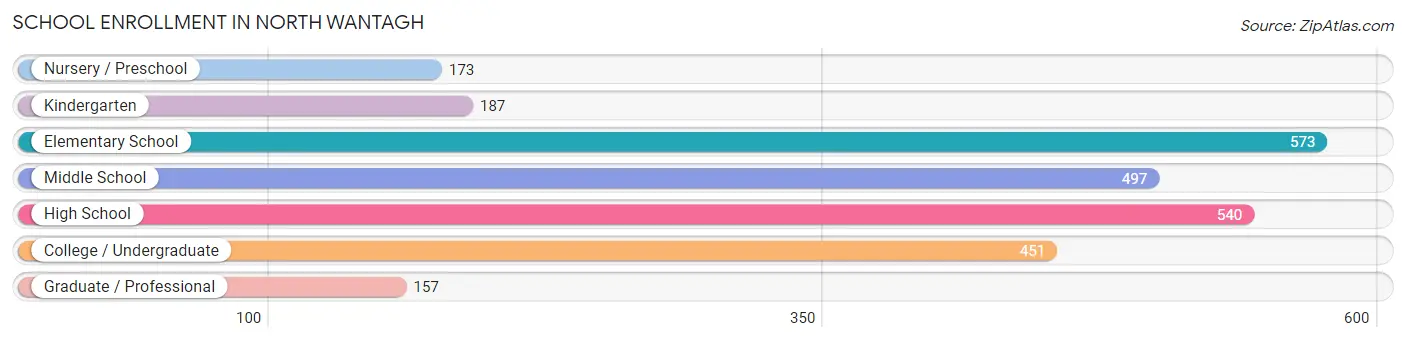
| School Level | # Students | % Students |
| Nursery / Preschool | 173 | 6.7% |
| Kindergarten | 187 | 7.2% |
| Elementary School | 573 | 22.2% |
| Middle School | 497 | 19.3% |
| High School | 540 | 20.9% |
| College / Undergraduate | 451 | 17.5% |
| Graduate / Professional | 157 | 6.1% |
| Total | 2,578 | 100.0% |
School Enrollment by Age by Funding Source in North Wantagh
Out of a total of 2,578 students who are enrolled in schools in North Wantagh, 291 (11.3%) attend a private institution, while the remaining 2,287 (88.7%) are enrolled in public schools. The age group of 25 to 34 year olds has the highest likelihood of being enrolled in private schools, with 38 (46.9% in the age bracket) enrolled. Conversely, the age group of 18 to 19 year olds has the lowest likelihood of being enrolled in a private school, with 154 (100.0% in the age bracket) attending a public institution.
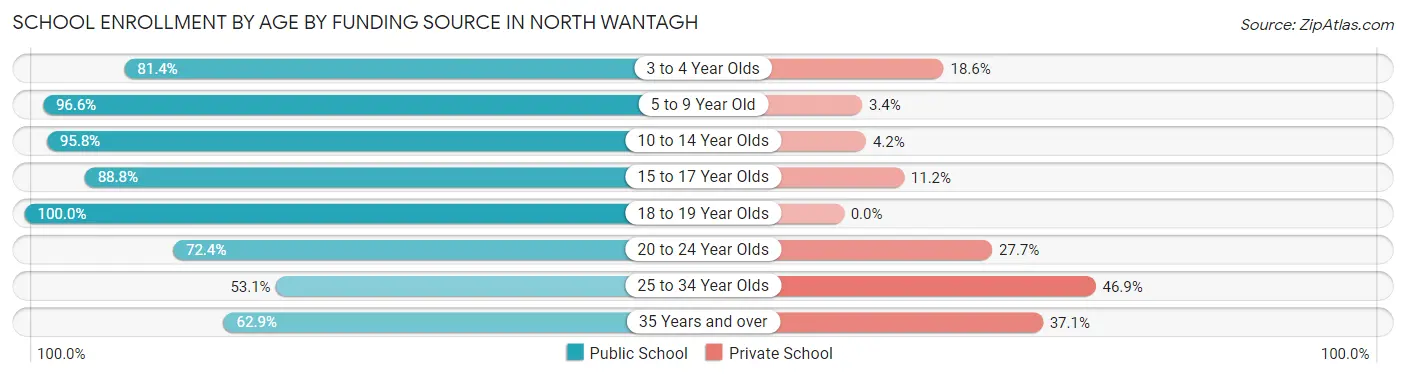
| Age Bracket | Public School | Private School |
| 3 to 4 Year Olds | 105 (81.4%) | 24 (18.6%) |
| 5 to 9 Year Old | 649 (96.6%) | 23 (3.4%) |
| 10 to 14 Year Olds | 714 (95.8%) | 31 (4.2%) |
| 15 to 17 Year Olds | 285 (88.8%) | 36 (11.2%) |
| 18 to 19 Year Olds | 154 (100.0%) | 0 (0.0%) |
| 20 to 24 Year Olds | 280 (72.4%) | 107 (27.7%) |
| 25 to 34 Year Olds | 43 (53.1%) | 38 (46.9%) |
| 35 Years and over | 56 (62.9%) | 33 (37.1%) |
| Total | 2,287 (88.7%) | 291 (11.3%) |
Educational Attainment by Field of Study in North Wantagh
Business (876 | 22.3%), education (767 | 19.5%), science & technology (495 | 12.6%), social sciences (374 | 9.5%), and arts & humanities (271 | 6.9%) are the most common fields of study among 3,933 individuals in North Wantagh who have obtained a bachelor's degree or higher.
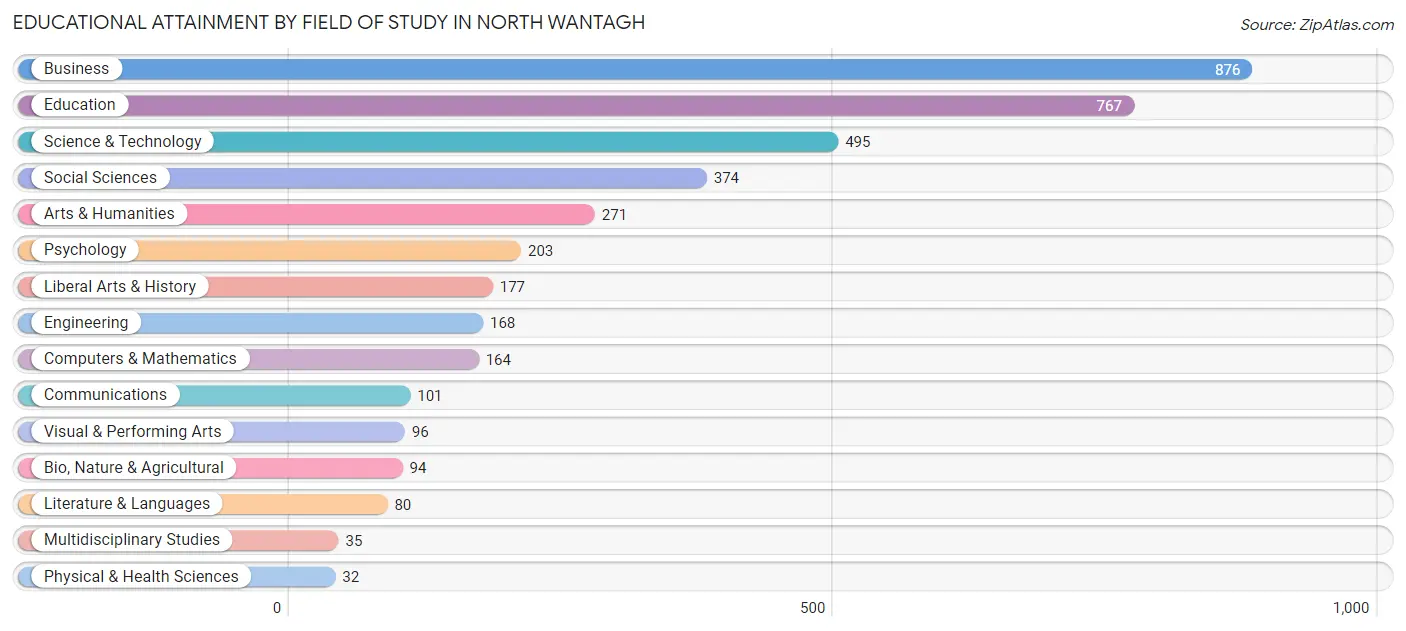
| Field of Study | # Graduates | % Graduates |
| Computers & Mathematics | 164 | 4.2% |
| Bio, Nature & Agricultural | 94 | 2.4% |
| Physical & Health Sciences | 32 | 0.8% |
| Psychology | 203 | 5.2% |
| Social Sciences | 374 | 9.5% |
| Engineering | 168 | 4.3% |
| Multidisciplinary Studies | 35 | 0.9% |
| Science & Technology | 495 | 12.6% |
| Business | 876 | 22.3% |
| Education | 767 | 19.5% |
| Literature & Languages | 80 | 2.0% |
| Liberal Arts & History | 177 | 4.5% |
| Visual & Performing Arts | 96 | 2.4% |
| Communications | 101 | 2.6% |
| Arts & Humanities | 271 | 6.9% |
| Total | 3,933 | 100.0% |
Transportation & Commute in North Wantagh
Vehicle Availability by Sex in North Wantagh
The most prevalent vehicle ownership categories in North Wantagh are males with 2 vehicles (1,291, accounting for 44.2%) and females with 2 vehicles (1,096, making up 45.9%).
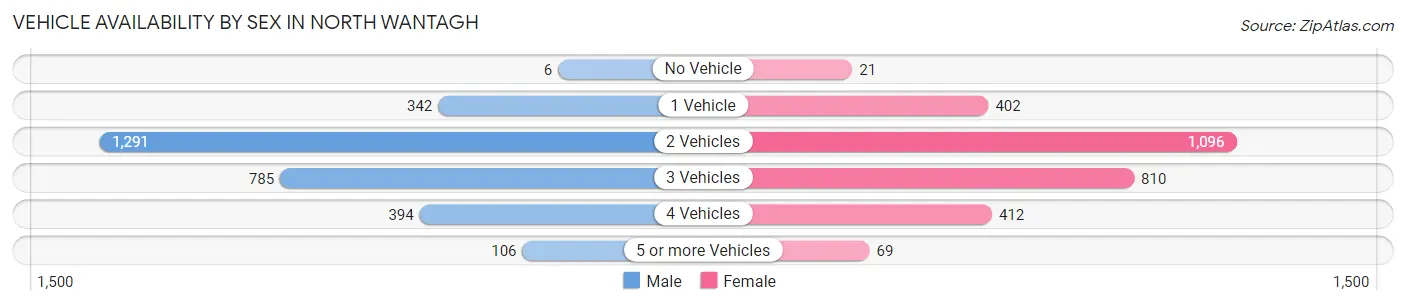
| Vehicles Available | Male | Female |
| No Vehicle | 6 (0.2%) | 21 (0.7%) |
| 1 Vehicle | 342 (11.7%) | 402 (14.3%) |
| 2 Vehicles | 1,291 (44.2%) | 1,096 (39.0%) |
| 3 Vehicles | 785 (26.9%) | 810 (28.8%) |
| 4 Vehicles | 394 (13.5%) | 412 (14.7%) |
| 5 or more Vehicles | 106 (3.6%) | 69 (2.5%) |
| Total | 2,924 (100.0%) | 2,810 (100.0%) |
Commute Time in North Wantagh
The most frequently occuring commute durations in North Wantagh are 30 to 34 minutes (808 commuters, 15.2%), 60 to 89 minutes (768 commuters, 14.4%), and 15 to 19 minutes (660 commuters, 12.4%).
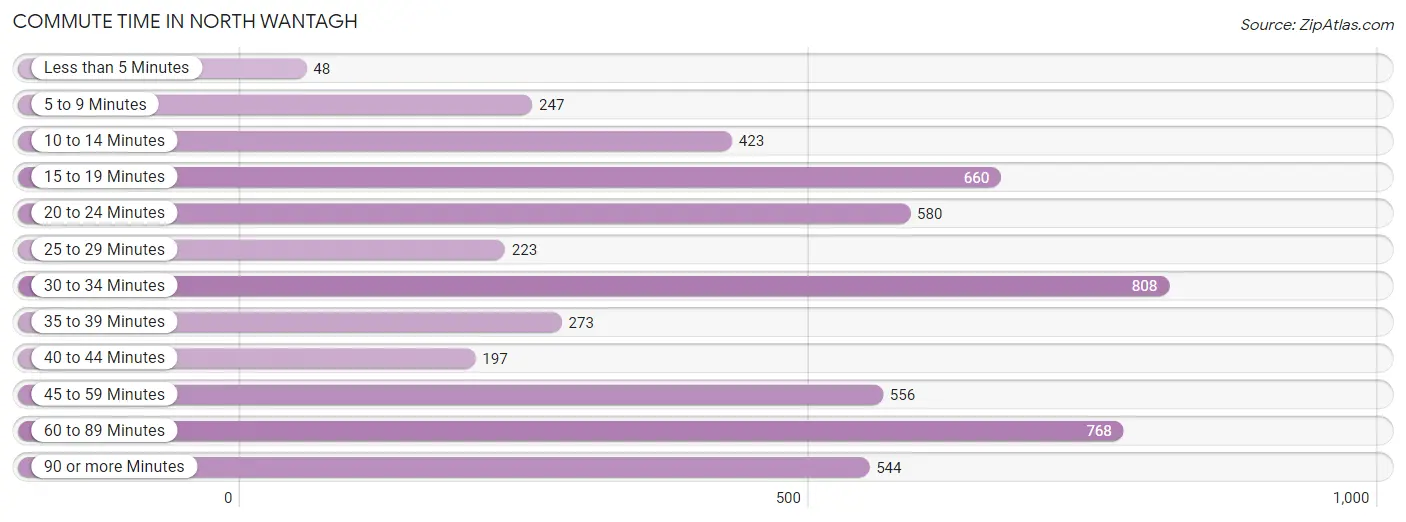
| Commute Time | # Commuters | % Commuters |
| Less than 5 Minutes | 48 | 0.9% |
| 5 to 9 Minutes | 247 | 4.6% |
| 10 to 14 Minutes | 423 | 7.9% |
| 15 to 19 Minutes | 660 | 12.4% |
| 20 to 24 Minutes | 580 | 10.9% |
| 25 to 29 Minutes | 223 | 4.2% |
| 30 to 34 Minutes | 808 | 15.2% |
| 35 to 39 Minutes | 273 | 5.1% |
| 40 to 44 Minutes | 197 | 3.7% |
| 45 to 59 Minutes | 556 | 10.4% |
| 60 to 89 Minutes | 768 | 14.4% |
| 90 or more Minutes | 544 | 10.2% |
Commute Time by Sex in North Wantagh
The most common commute times in North Wantagh are 60 to 89 minutes (501 commuters, 18.4%) for males and 30 to 34 minutes (456 commuters, 17.5%) for females.
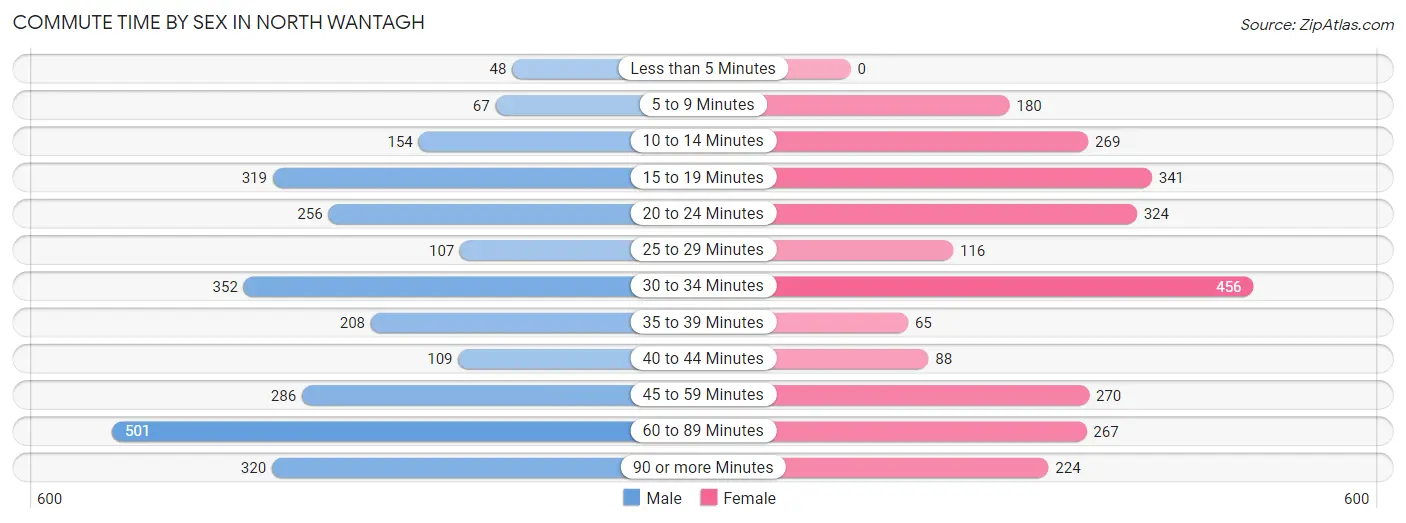
| Commute Time | Male | Female |
| Less than 5 Minutes | 48 (1.8%) | 0 (0.0%) |
| 5 to 9 Minutes | 67 (2.5%) | 180 (6.9%) |
| 10 to 14 Minutes | 154 (5.7%) | 269 (10.3%) |
| 15 to 19 Minutes | 319 (11.7%) | 341 (13.1%) |
| 20 to 24 Minutes | 256 (9.4%) | 324 (12.5%) |
| 25 to 29 Minutes | 107 (3.9%) | 116 (4.5%) |
| 30 to 34 Minutes | 352 (12.9%) | 456 (17.5%) |
| 35 to 39 Minutes | 208 (7.6%) | 65 (2.5%) |
| 40 to 44 Minutes | 109 (4.0%) | 88 (3.4%) |
| 45 to 59 Minutes | 286 (10.5%) | 270 (10.4%) |
| 60 to 89 Minutes | 501 (18.4%) | 267 (10.3%) |
| 90 or more Minutes | 320 (11.7%) | 224 (8.6%) |
Time of Departure to Work by Sex in North Wantagh
The most frequent times of departure to work in North Wantagh are 8:00 AM to 8:29 AM (481, 17.6%) for males and 7:00 AM to 7:29 AM (612, 23.5%) for females.
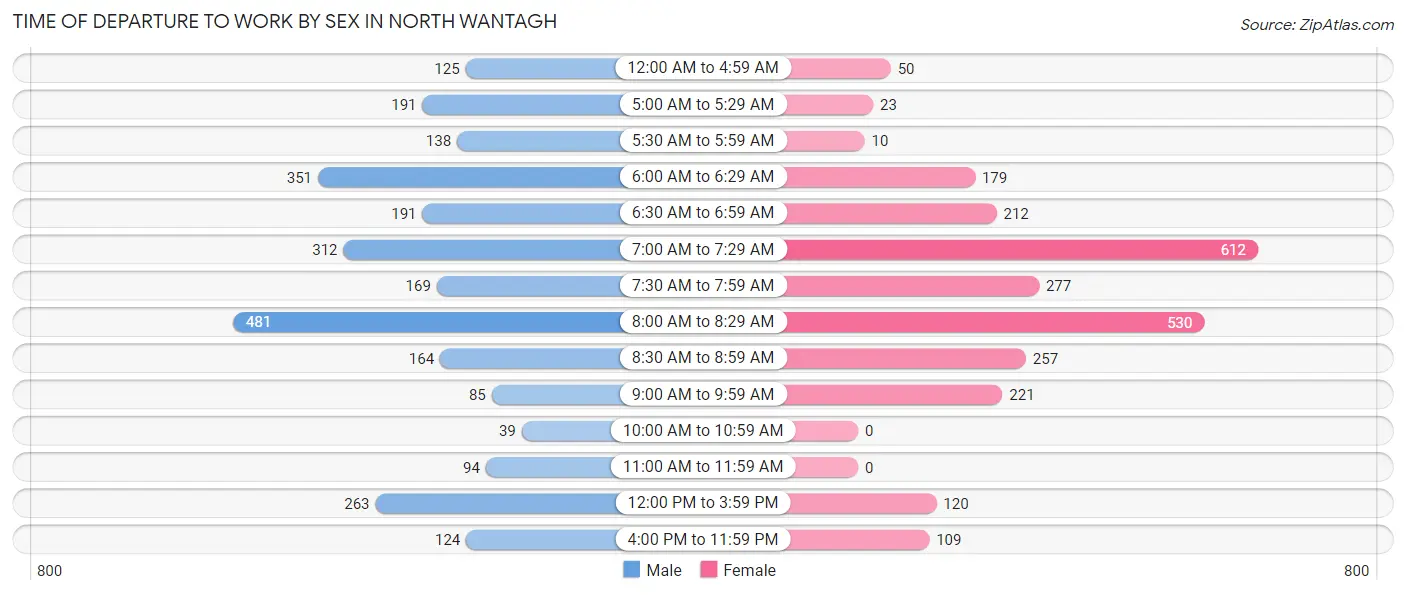
| Time of Departure | Male | Female |
| 12:00 AM to 4:59 AM | 125 (4.6%) | 50 (1.9%) |
| 5:00 AM to 5:29 AM | 191 (7.0%) | 23 (0.9%) |
| 5:30 AM to 5:59 AM | 138 (5.1%) | 10 (0.4%) |
| 6:00 AM to 6:29 AM | 351 (12.9%) | 179 (6.9%) |
| 6:30 AM to 6:59 AM | 191 (7.0%) | 212 (8.2%) |
| 7:00 AM to 7:29 AM | 312 (11.4%) | 612 (23.5%) |
| 7:30 AM to 7:59 AM | 169 (6.2%) | 277 (10.6%) |
| 8:00 AM to 8:29 AM | 481 (17.6%) | 530 (20.4%) |
| 8:30 AM to 8:59 AM | 164 (6.0%) | 257 (9.9%) |
| 9:00 AM to 9:59 AM | 85 (3.1%) | 221 (8.5%) |
| 10:00 AM to 10:59 AM | 39 (1.4%) | 0 (0.0%) |
| 11:00 AM to 11:59 AM | 94 (3.5%) | 0 (0.0%) |
| 12:00 PM to 3:59 PM | 263 (9.6%) | 120 (4.6%) |
| 4:00 PM to 11:59 PM | 124 (4.5%) | 109 (4.2%) |
| Total | 2,727 (100.0%) | 2,600 (100.0%) |
Housing Occupancy in North Wantagh
Occupancy by Ownership in North Wantagh
Of the total 4,158 dwellings in North Wantagh, owner-occupied units account for 3,962 (95.3%), while renter-occupied units make up 196 (4.7%).
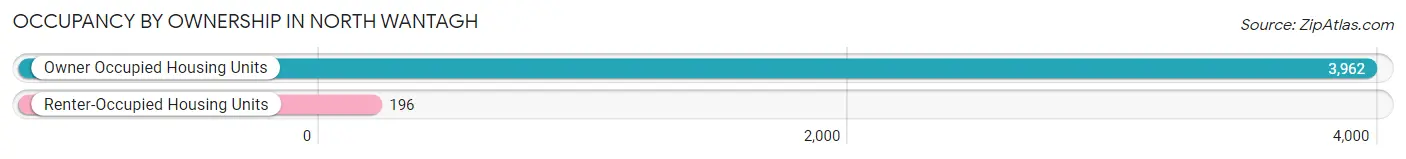
| Occupancy | # Housing Units | % Housing Units |
| Owner Occupied Housing Units | 3,962 | 95.3% |
| Renter-Occupied Housing Units | 196 | 4.7% |
| Total Occupied Housing Units | 4,158 | 100.0% |
Occupancy by Household Size in North Wantagh
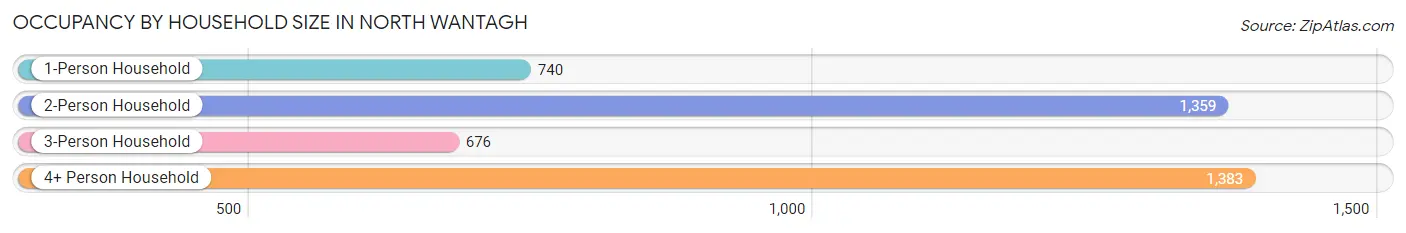
| Household Size | # Housing Units | % Housing Units |
| 1-Person Household | 740 | 17.8% |
| 2-Person Household | 1,359 | 32.7% |
| 3-Person Household | 676 | 16.3% |
| 4+ Person Household | 1,383 | 33.3% |
| Total Housing Units | 4,158 | 100.0% |
Occupancy by Ownership by Household Size in North Wantagh
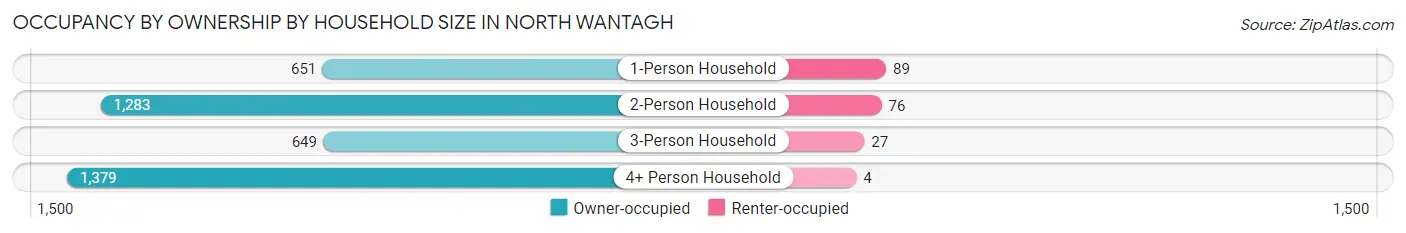
| Household Size | Owner-occupied | Renter-occupied |
| 1-Person Household | 651 (88.0%) | 89 (12.0%) |
| 2-Person Household | 1,283 (94.4%) | 76 (5.6%) |
| 3-Person Household | 649 (96.0%) | 27 (4.0%) |
| 4+ Person Household | 1,379 (99.7%) | 4 (0.3%) |
| Total Housing Units | 3,962 (95.3%) | 196 (4.7%) |
Occupancy by Educational Attainment in North Wantagh
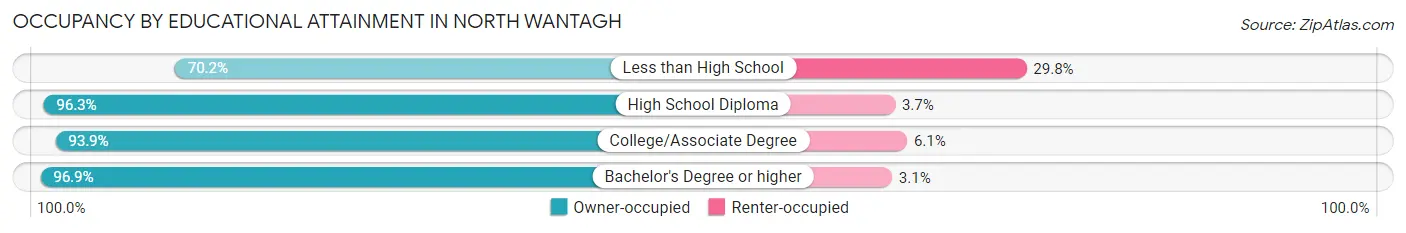
| Household Size | Owner-occupied | Renter-occupied |
| Less than High School | 66 (70.2%) | 28 (29.8%) |
| High School Diploma | 877 (96.3%) | 34 (3.7%) |
| College/Associate Degree | 1,122 (93.9%) | 73 (6.1%) |
| Bachelor's Degree or higher | 1,897 (96.9%) | 61 (3.1%) |
Occupancy by Age of Householder in North Wantagh
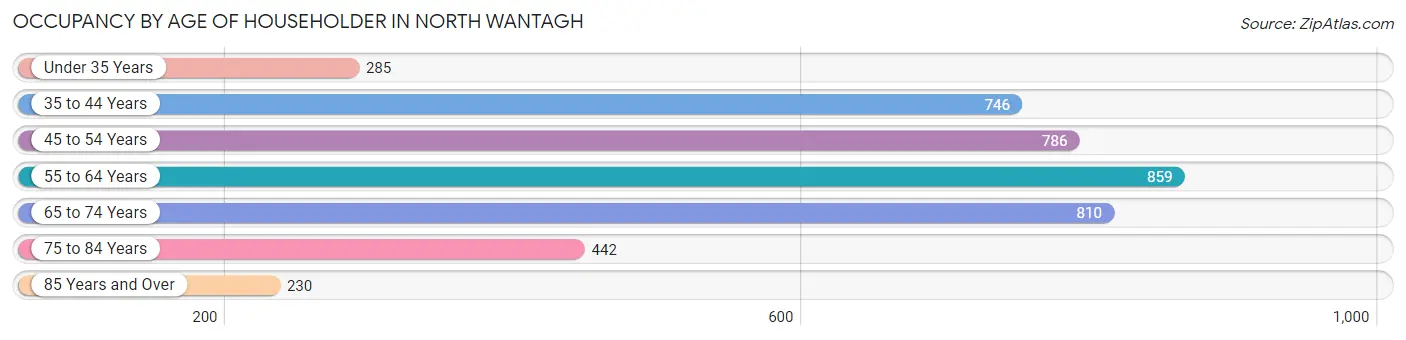
| Age Bracket | # Households | % Households |
| Under 35 Years | 285 | 6.9% |
| 35 to 44 Years | 746 | 17.9% |
| 45 to 54 Years | 786 | 18.9% |
| 55 to 64 Years | 859 | 20.7% |
| 65 to 74 Years | 810 | 19.5% |
| 75 to 84 Years | 442 | 10.6% |
| 85 Years and Over | 230 | 5.5% |
| Total | 4,158 | 100.0% |
Housing Finances in North Wantagh
Median Income by Occupancy in North Wantagh
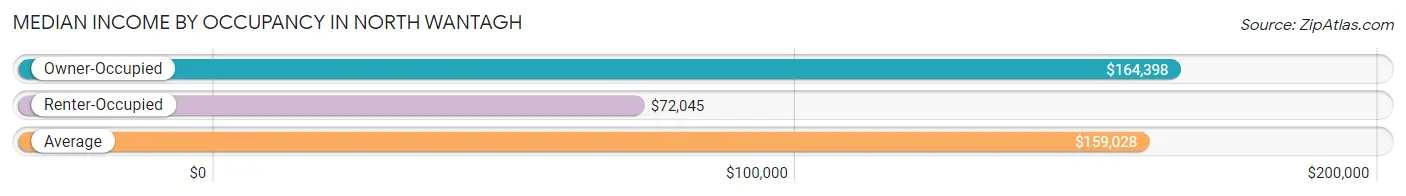
| Occupancy Type | # Households | Median Income |
| Owner-Occupied | 3,962 (95.3%) | $164,398 |
| Renter-Occupied | 196 (4.7%) | $72,045 |
| Average | 4,158 (100.0%) | $159,028 |
Occupancy by Householder Income Bracket in North Wantagh
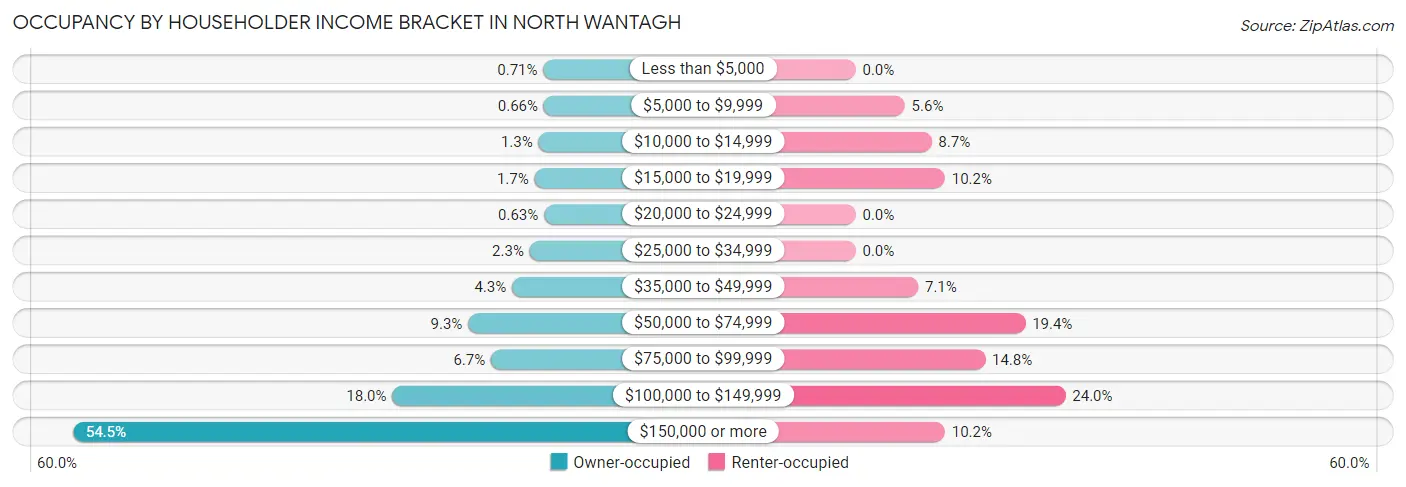
| Income Bracket | Owner-occupied | Renter-occupied |
| Less than $5,000 | 28 (0.7%) | 0 (0.0%) |
| $5,000 to $9,999 | 26 (0.7%) | 11 (5.6%) |
| $10,000 to $14,999 | 50 (1.3%) | 17 (8.7%) |
| $15,000 to $19,999 | 68 (1.7%) | 20 (10.2%) |
| $20,000 to $24,999 | 25 (0.6%) | 0 (0.0%) |
| $25,000 to $34,999 | 90 (2.3%) | 0 (0.0%) |
| $35,000 to $49,999 | 170 (4.3%) | 14 (7.1%) |
| $50,000 to $74,999 | 369 (9.3%) | 38 (19.4%) |
| $75,000 to $99,999 | 265 (6.7%) | 29 (14.8%) |
| $100,000 to $149,999 | 712 (18.0%) | 47 (24.0%) |
| $150,000 or more | 2,159 (54.5%) | 20 (10.2%) |
| Total | 3,962 (100.0%) | 196 (100.0%) |
Monthly Housing Cost Tiers in North Wantagh
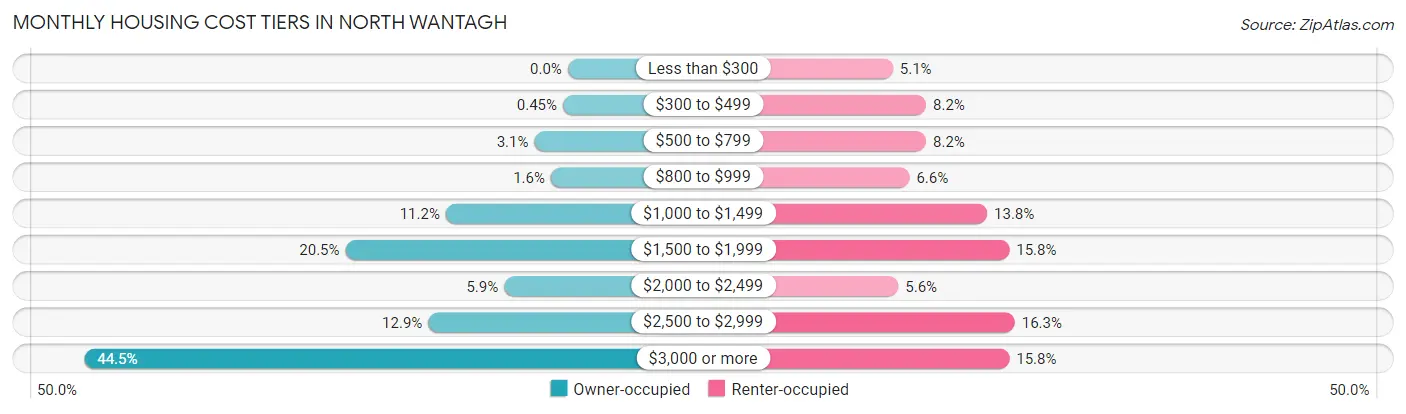
| Monthly Cost | Owner-occupied | Renter-occupied |
| Less than $300 | 0 (0.0%) | 10 (5.1%) |
| $300 to $499 | 18 (0.4%) | 16 (8.2%) |
| $500 to $799 | 122 (3.1%) | 16 (8.2%) |
| $800 to $999 | 62 (1.6%) | 13 (6.6%) |
| $1,000 to $1,499 | 445 (11.2%) | 27 (13.8%) |
| $1,500 to $1,999 | 811 (20.5%) | 31 (15.8%) |
| $2,000 to $2,499 | 232 (5.9%) | 11 (5.6%) |
| $2,500 to $2,999 | 509 (12.9%) | 32 (16.3%) |
| $3,000 or more | 1,763 (44.5%) | 31 (15.8%) |
| Total | 3,962 (100.0%) | 196 (100.0%) |
Physical Housing Characteristics in North Wantagh
Housing Structures in North Wantagh
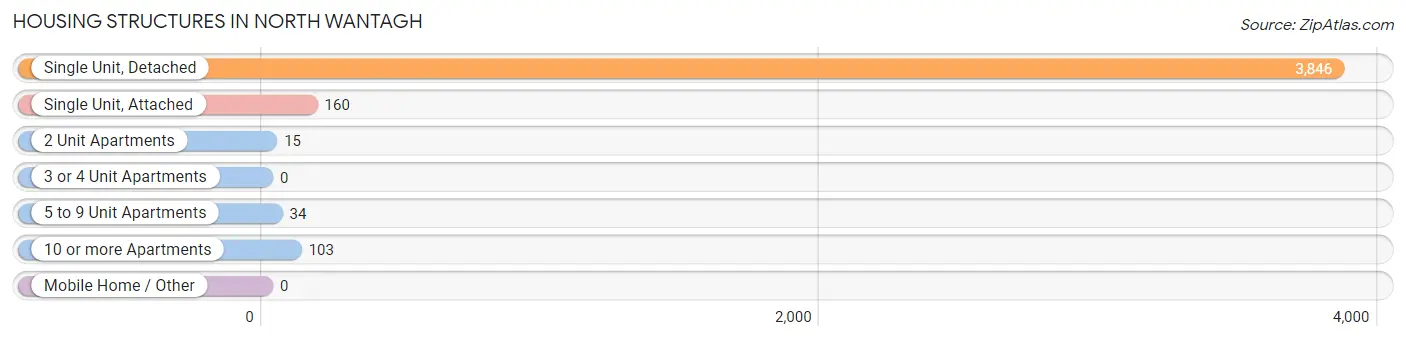
| Structure Type | # Housing Units | % Housing Units |
| Single Unit, Detached | 3,846 | 92.5% |
| Single Unit, Attached | 160 | 3.8% |
| 2 Unit Apartments | 15 | 0.4% |
| 3 or 4 Unit Apartments | 0 | 0.0% |
| 5 to 9 Unit Apartments | 34 | 0.8% |
| 10 or more Apartments | 103 | 2.5% |
| Mobile Home / Other | 0 | 0.0% |
| Total | 4,158 | 100.0% |
Housing Structures by Occupancy in North Wantagh
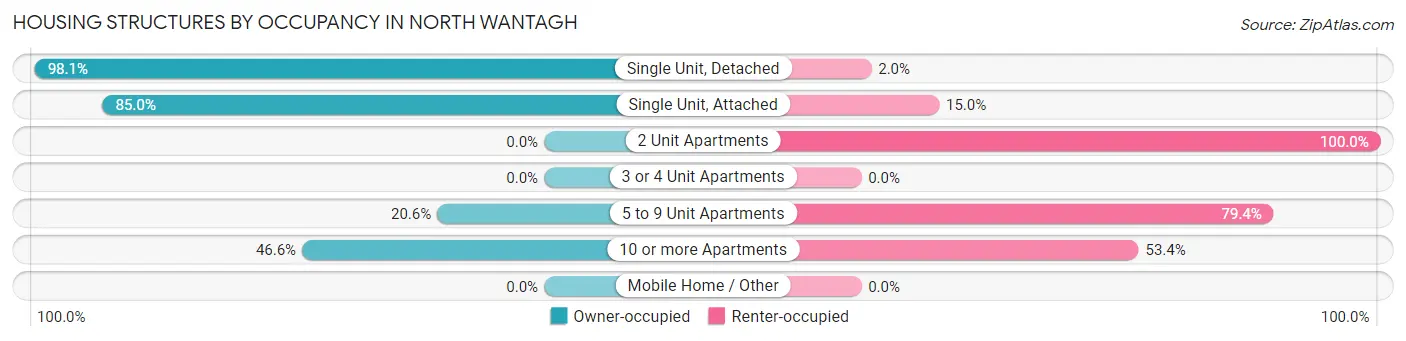
| Structure Type | Owner-occupied | Renter-occupied |
| Single Unit, Detached | 3,771 (98.1%) | 75 (1.9%) |
| Single Unit, Attached | 136 (85.0%) | 24 (15.0%) |
| 2 Unit Apartments | 0 (0.0%) | 15 (100.0%) |
| 3 or 4 Unit Apartments | 0 (0.0%) | 0 (0.0%) |
| 5 to 9 Unit Apartments | 7 (20.6%) | 27 (79.4%) |
| 10 or more Apartments | 48 (46.6%) | 55 (53.4%) |
| Mobile Home / Other | 0 (0.0%) | 0 (0.0%) |
| Total | 3,962 (95.3%) | 196 (4.7%) |
Housing Structures by Number of Rooms in North Wantagh
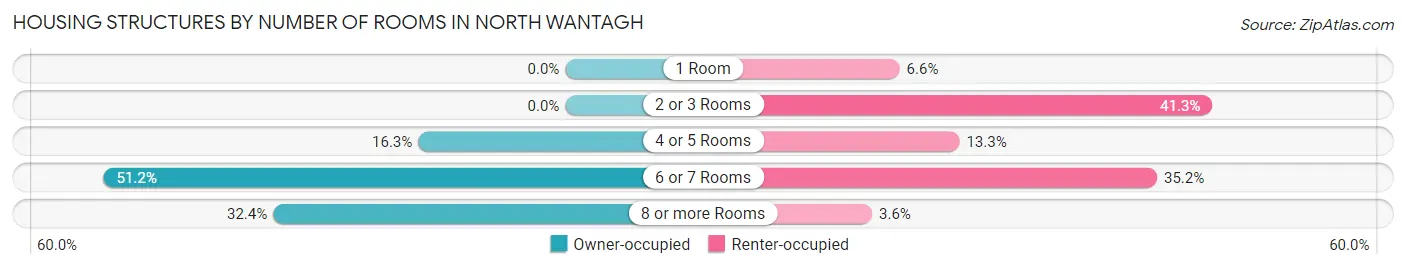
| Number of Rooms | Owner-occupied | Renter-occupied |
| 1 Room | 0 (0.0%) | 13 (6.6%) |
| 2 or 3 Rooms | 0 (0.0%) | 81 (41.3%) |
| 4 or 5 Rooms | 647 (16.3%) | 26 (13.3%) |
| 6 or 7 Rooms | 2,030 (51.2%) | 69 (35.2%) |
| 8 or more Rooms | 1,285 (32.4%) | 7 (3.6%) |
| Total | 3,962 (100.0%) | 196 (100.0%) |
Housing Structure by Heating Type in North Wantagh
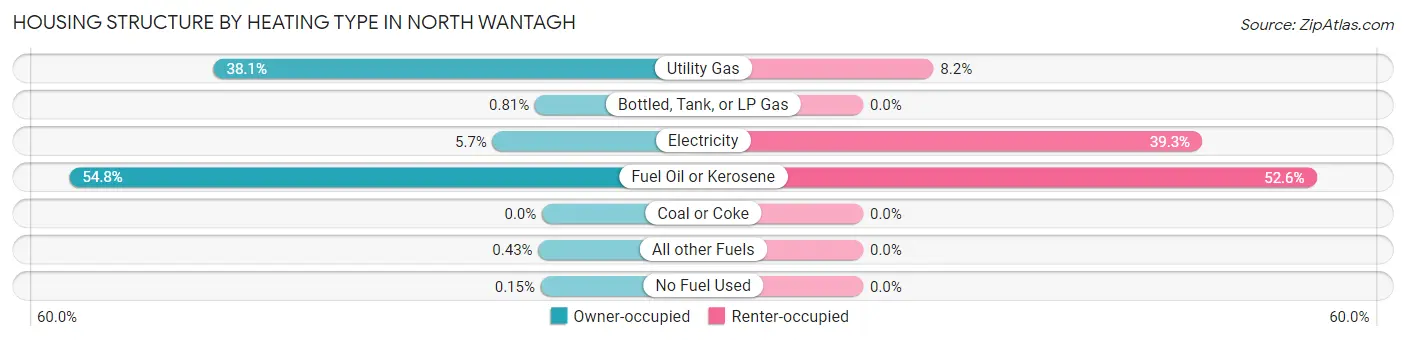
| Heating Type | Owner-occupied | Renter-occupied |
| Utility Gas | 1,509 (38.1%) | 16 (8.2%) |
| Bottled, Tank, or LP Gas | 32 (0.8%) | 0 (0.0%) |
| Electricity | 227 (5.7%) | 77 (39.3%) |
| Fuel Oil or Kerosene | 2,171 (54.8%) | 103 (52.5%) |
| Coal or Coke | 0 (0.0%) | 0 (0.0%) |
| All other Fuels | 17 (0.4%) | 0 (0.0%) |
| No Fuel Used | 6 (0.2%) | 0 (0.0%) |
| Total | 3,962 (100.0%) | 196 (100.0%) |
Household Vehicle Usage in North Wantagh
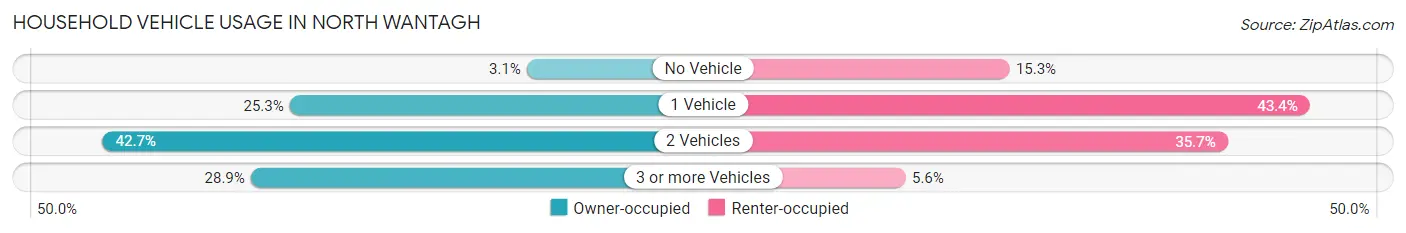
| Vehicles per Household | Owner-occupied | Renter-occupied |
| No Vehicle | 124 (3.1%) | 30 (15.3%) |
| 1 Vehicle | 1,001 (25.3%) | 85 (43.4%) |
| 2 Vehicles | 1,692 (42.7%) | 70 (35.7%) |
| 3 or more Vehicles | 1,145 (28.9%) | 11 (5.6%) |
| Total | 3,962 (100.0%) | 196 (100.0%) |
Real Estate & Mortgages in North Wantagh
Real Estate and Mortgage Overview in North Wantagh
| Characteristic | Without Mortgage | With Mortgage |
| Housing Units | 1,421 | 2,541 |
| Median Property Value | $509,900 | $607,800 |
| Median Household Income | $90,815 | $1,823 |
| Monthly Housing Costs | $1,501 | $1,763 |
| Real Estate Taxes | $10,001 | $28 |
Property Value by Mortgage Status in North Wantagh
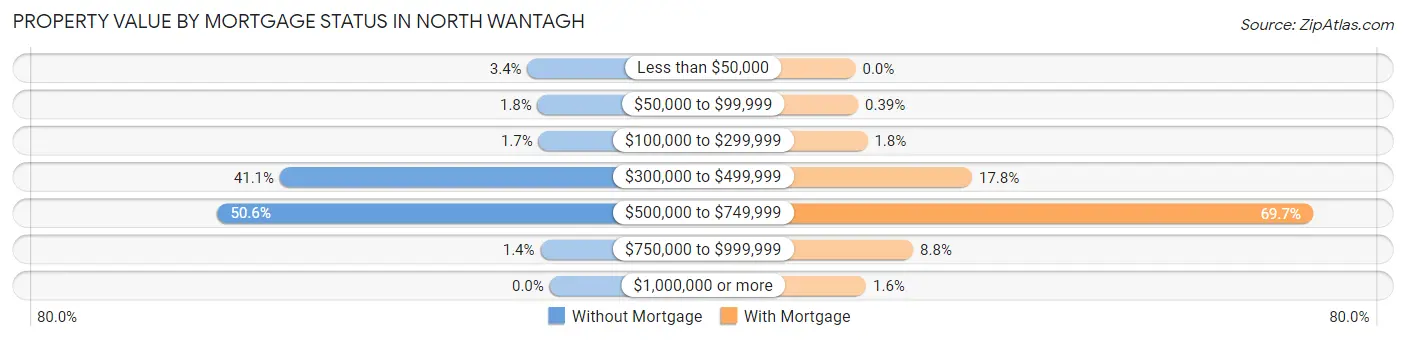
| Property Value | Without Mortgage | With Mortgage |
| Less than $50,000 | 48 (3.4%) | 0 (0.0%) |
| $50,000 to $99,999 | 26 (1.8%) | 10 (0.4%) |
| $100,000 to $299,999 | 24 (1.7%) | 46 (1.8%) |
| $300,000 to $499,999 | 584 (41.1%) | 451 (17.7%) |
| $500,000 to $749,999 | 719 (50.6%) | 1,770 (69.7%) |
| $750,000 to $999,999 | 20 (1.4%) | 223 (8.8%) |
| $1,000,000 or more | 0 (0.0%) | 41 (1.6%) |
| Total | 1,421 (100.0%) | 2,541 (100.0%) |
Household Income by Mortgage Status in North Wantagh
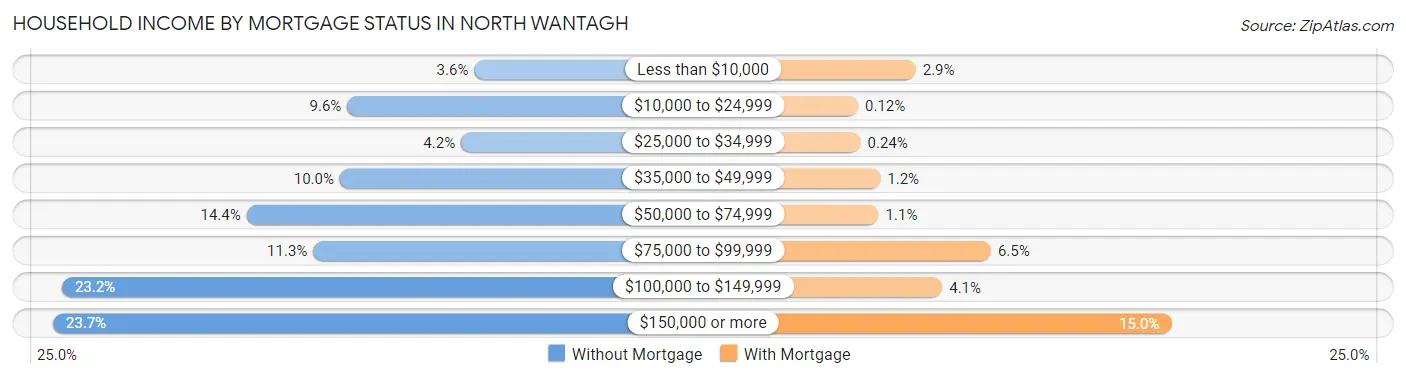
| Household Income | Without Mortgage | With Mortgage |
| Less than $10,000 | 51 (3.6%) | 73 (2.9%) |
| $10,000 to $24,999 | 137 (9.6%) | 3 (0.1%) |
| $25,000 to $34,999 | 60 (4.2%) | 6 (0.2%) |
| $35,000 to $49,999 | 142 (10.0%) | 30 (1.2%) |
| $50,000 to $74,999 | 205 (14.4%) | 28 (1.1%) |
| $75,000 to $99,999 | 160 (11.3%) | 164 (6.5%) |
| $100,000 to $149,999 | 330 (23.2%) | 105 (4.1%) |
| $150,000 or more | 336 (23.6%) | 382 (15.0%) |
| Total | 1,421 (100.0%) | 2,541 (100.0%) |
Property Value to Household Income Ratio in North Wantagh
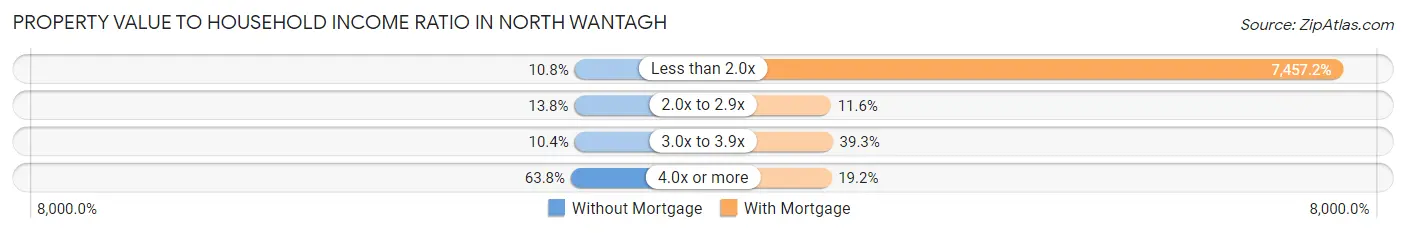
| Value-to-Income Ratio | Without Mortgage | With Mortgage |
| Less than 2.0x | 153 (10.8%) | 189,487 (7,457.2%) |
| 2.0x to 2.9x | 196 (13.8%) | 295 (11.6%) |
| 3.0x to 3.9x | 148 (10.4%) | 999 (39.3%) |
| 4.0x or more | 907 (63.8%) | 489 (19.2%) |
| Total | 1,421 (100.0%) | 2,541 (100.0%) |
Real Estate Taxes by Mortgage Status in North Wantagh
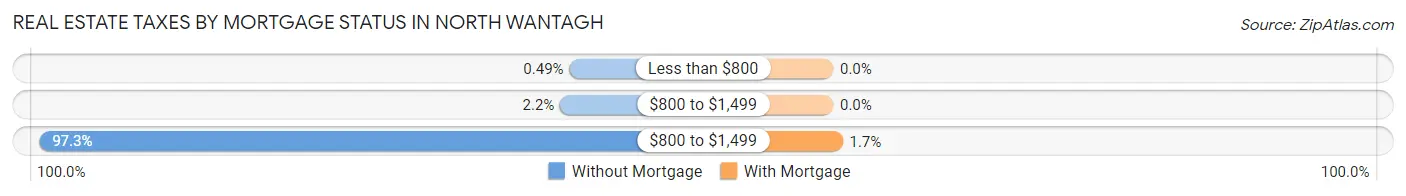
| Property Taxes | Without Mortgage | With Mortgage |
| Less than $800 | 7 (0.5%) | 0 (0.0%) |
| $800 to $1,499 | 31 (2.2%) | 0 (0.0%) |
| $800 to $1,499 | 1,383 (97.3%) | 44 (1.7%) |
| Total | 1,421 (100.0%) | 2,541 (100.0%) |
Health & Disability in North Wantagh
Health Insurance Coverage by Age in North Wantagh
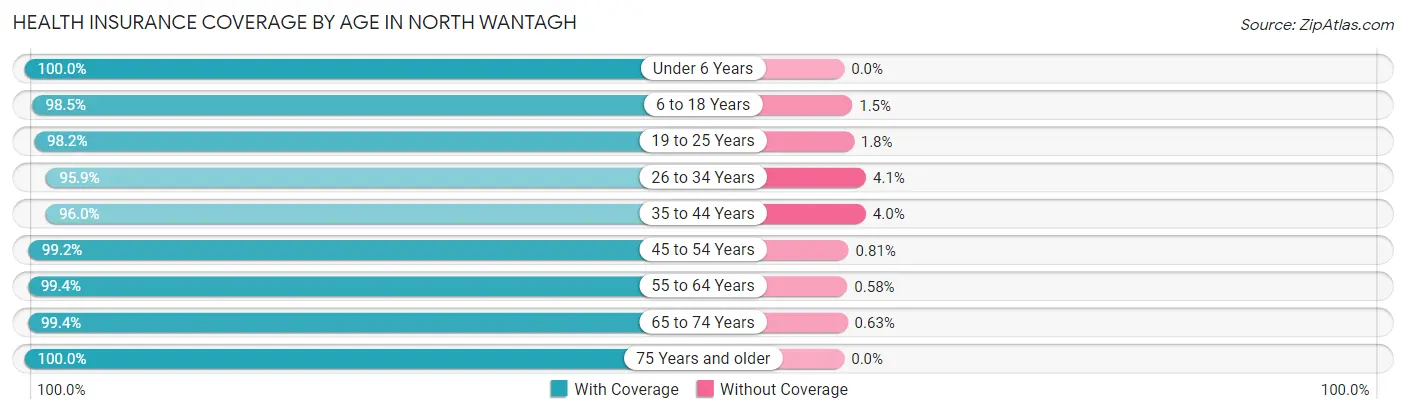
| Age Bracket | With Coverage | Without Coverage |
| Under 6 Years | 891 (100.0%) | 0 (0.0%) |
| 6 to 18 Years | 1,657 (98.5%) | 25 (1.5%) |
| 19 to 25 Years | 776 (98.2%) | 14 (1.8%) |
| 26 to 34 Years | 828 (95.9%) | 35 (4.1%) |
| 35 to 44 Years | 1,594 (96.0%) | 67 (4.0%) |
| 45 to 54 Years | 1,475 (99.2%) | 12 (0.8%) |
| 55 to 64 Years | 1,701 (99.4%) | 10 (0.6%) |
| 65 to 74 Years | 1,264 (99.4%) | 8 (0.6%) |
| 75 Years and older | 1,087 (100.0%) | 0 (0.0%) |
| Total | 11,273 (98.5%) | 171 (1.5%) |
Health Insurance Coverage by Citizenship Status in North Wantagh
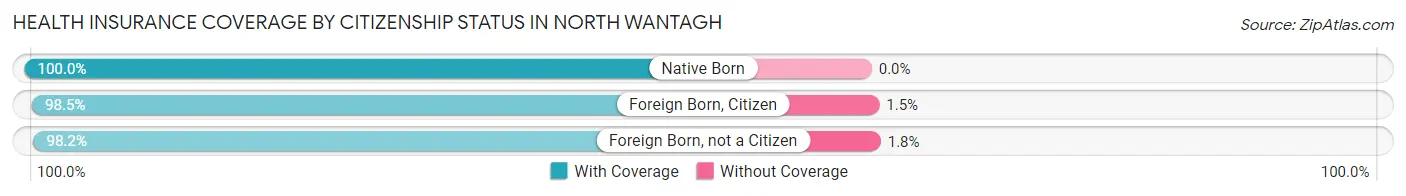
| Citizenship Status | With Coverage | Without Coverage |
| Native Born | 891 (100.0%) | 0 (0.0%) |
| Foreign Born, Citizen | 1,657 (98.5%) | 25 (1.5%) |
| Foreign Born, not a Citizen | 776 (98.2%) | 14 (1.8%) |
Health Insurance Coverage by Household Income in North Wantagh
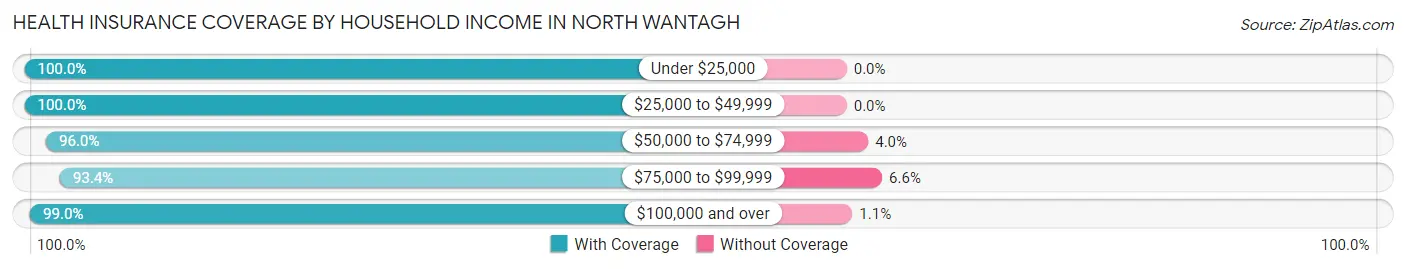
| Household Income | With Coverage | Without Coverage |
| Under $25,000 | 367 (100.0%) | 0 (0.0%) |
| $25,000 to $49,999 | 477 (100.0%) | 0 (0.0%) |
| $50,000 to $74,999 | 762 (96.0%) | 32 (4.0%) |
| $75,000 to $99,999 | 607 (93.4%) | 43 (6.6%) |
| $100,000 and over | 9,030 (99.0%) | 96 (1.1%) |
Public vs Private Health Insurance Coverage by Age in North Wantagh
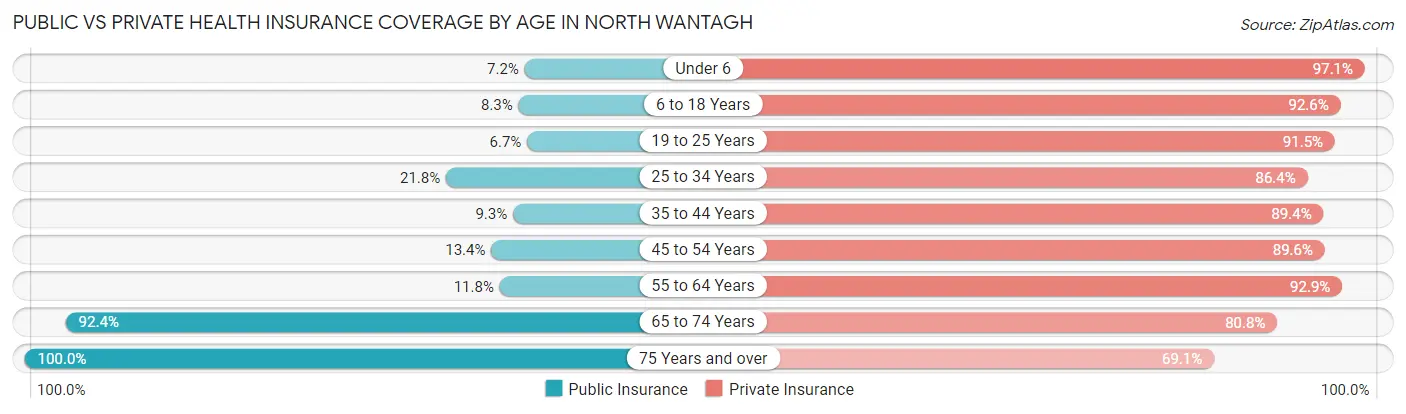
| Age Bracket | Public Insurance | Private Insurance |
| Under 6 | 64 (7.2%) | 865 (97.1%) |
| 6 to 18 Years | 140 (8.3%) | 1,557 (92.6%) |
| 19 to 25 Years | 53 (6.7%) | 723 (91.5%) |
| 25 to 34 Years | 188 (21.8%) | 746 (86.4%) |
| 35 to 44 Years | 155 (9.3%) | 1,485 (89.4%) |
| 45 to 54 Years | 199 (13.4%) | 1,333 (89.6%) |
| 55 to 64 Years | 202 (11.8%) | 1,589 (92.9%) |
| 65 to 74 Years | 1,175 (92.4%) | 1,028 (80.8%) |
| 75 Years and over | 1,087 (100.0%) | 751 (69.1%) |
| Total | 3,263 (28.5%) | 10,077 (88.0%) |
Disability Status by Sex by Age in North Wantagh
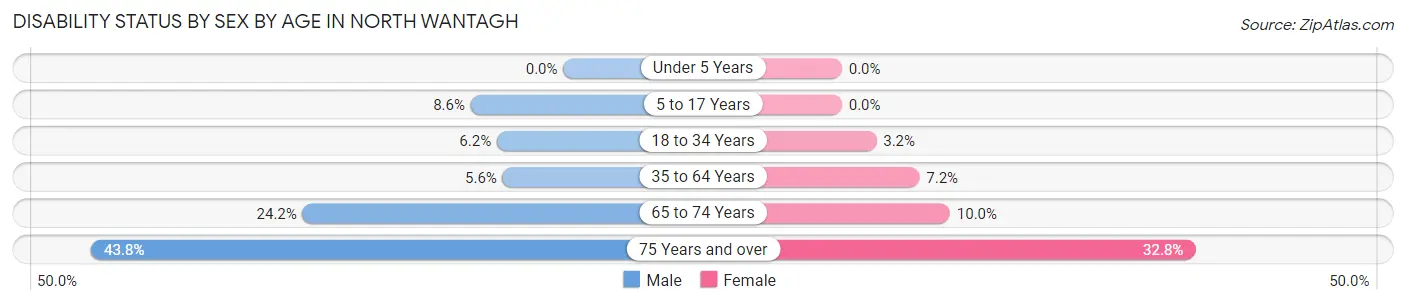
| Age Bracket | Male | Female |
| Under 5 Years | 0 (0.0%) | 0 (0.0%) |
| 5 to 17 Years | 77 (8.6%) | 0 (0.0%) |
| 18 to 34 Years | 49 (6.2%) | 29 (3.2%) |
| 35 to 64 Years | 143 (5.6%) | 167 (7.2%) |
| 65 to 74 Years | 151 (24.2%) | 65 (10.0%) |
| 75 Years and over | 181 (43.8%) | 221 (32.8%) |
Disability Class by Sex by Age in North Wantagh
Disability Class: Hearing Difficulty
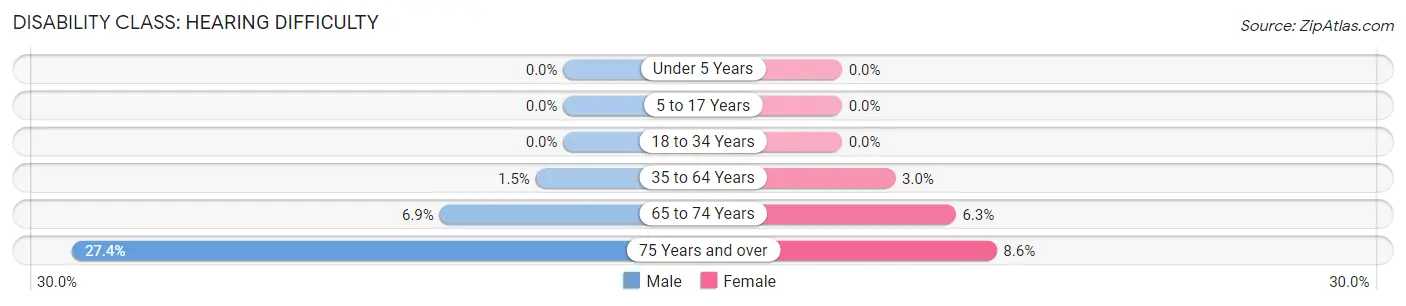
| Age Bracket | Male | Female |
| Under 5 Years | 0 (0.0%) | 0 (0.0%) |
| 5 to 17 Years | 0 (0.0%) | 0 (0.0%) |
| 18 to 34 Years | 0 (0.0%) | 0 (0.0%) |
| 35 to 64 Years | 39 (1.5%) | 69 (3.0%) |
| 65 to 74 Years | 43 (6.9%) | 41 (6.3%) |
| 75 Years and over | 113 (27.4%) | 58 (8.6%) |
Disability Class: Vision Difficulty
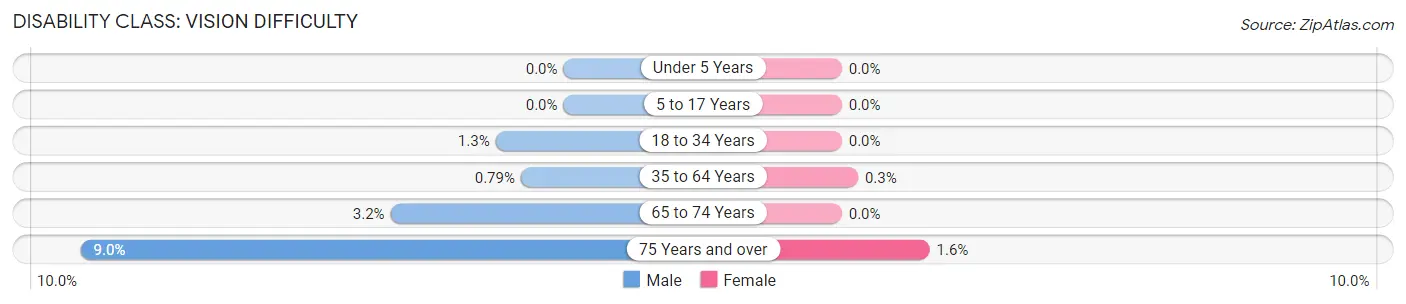
| Age Bracket | Male | Female |
| Under 5 Years | 0 (0.0%) | 0 (0.0%) |
| 5 to 17 Years | 0 (0.0%) | 0 (0.0%) |
| 18 to 34 Years | 10 (1.3%) | 0 (0.0%) |
| 35 to 64 Years | 20 (0.8%) | 7 (0.3%) |
| 65 to 74 Years | 20 (3.2%) | 0 (0.0%) |
| 75 Years and over | 37 (9.0%) | 11 (1.6%) |
Disability Class: Cognitive Difficulty
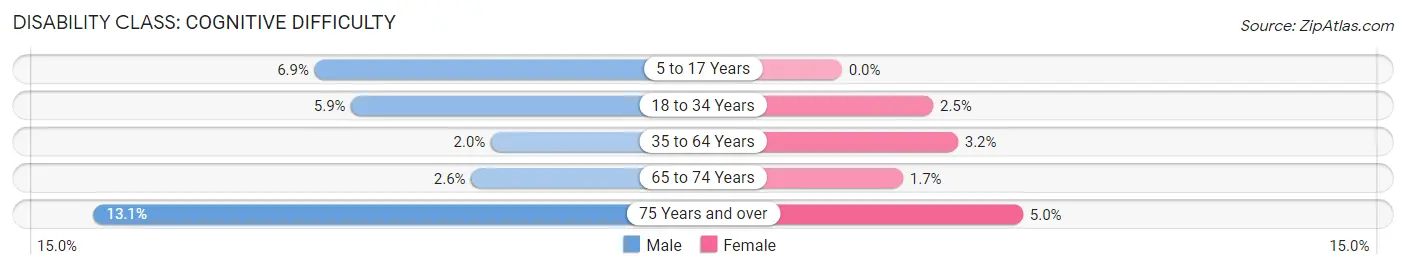
| Age Bracket | Male | Female |
| 5 to 17 Years | 62 (6.9%) | 0 (0.0%) |
| 18 to 34 Years | 47 (5.9%) | 23 (2.5%) |
| 35 to 64 Years | 51 (2.0%) | 75 (3.2%) |
| 65 to 74 Years | 16 (2.6%) | 11 (1.7%) |
| 75 Years and over | 54 (13.1%) | 34 (5.0%) |
Disability Class: Ambulatory Difficulty
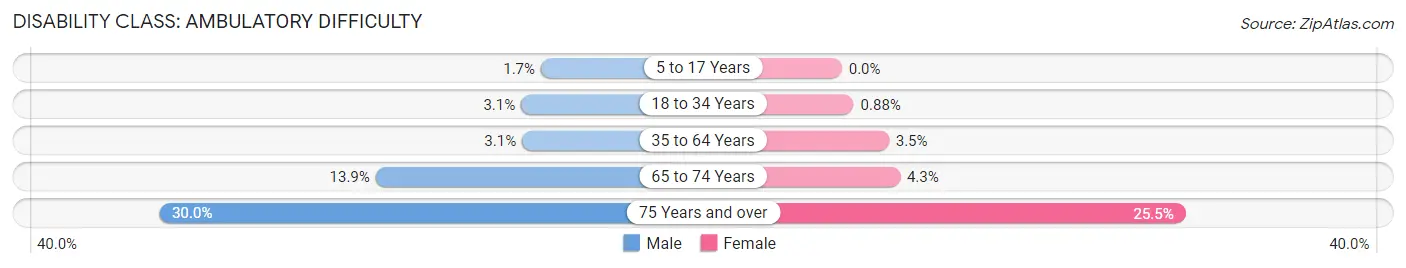
| Age Bracket | Male | Female |
| 5 to 17 Years | 15 (1.7%) | 0 (0.0%) |
| 18 to 34 Years | 25 (3.1%) | 8 (0.9%) |
| 35 to 64 Years | 78 (3.1%) | 81 (3.5%) |
| 65 to 74 Years | 87 (13.9%) | 28 (4.3%) |
| 75 Years and over | 124 (30.0%) | 172 (25.5%) |
Disability Class: Self-Care Difficulty
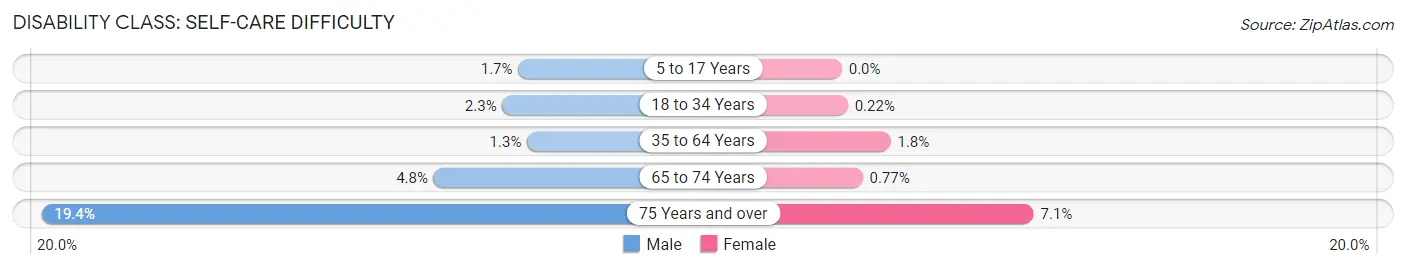
| Age Bracket | Male | Female |
| 5 to 17 Years | 15 (1.7%) | 0 (0.0%) |
| 18 to 34 Years | 18 (2.3%) | 2 (0.2%) |
| 35 to 64 Years | 34 (1.3%) | 42 (1.8%) |
| 65 to 74 Years | 30 (4.8%) | 5 (0.8%) |
| 75 Years and over | 80 (19.4%) | 48 (7.1%) |
Technology Access in North Wantagh
Computing Device Access in North Wantagh
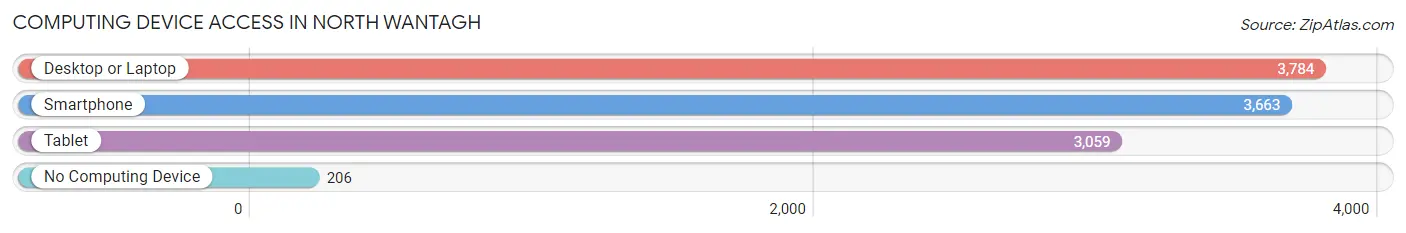
| Device Type | # Households | % Households |
| Desktop or Laptop | 3,784 | 91.0% |
| Smartphone | 3,663 | 88.1% |
| Tablet | 3,059 | 73.6% |
| No Computing Device | 206 | 5.0% |
| Total | 4,158 | 100.0% |
Internet Access in North Wantagh
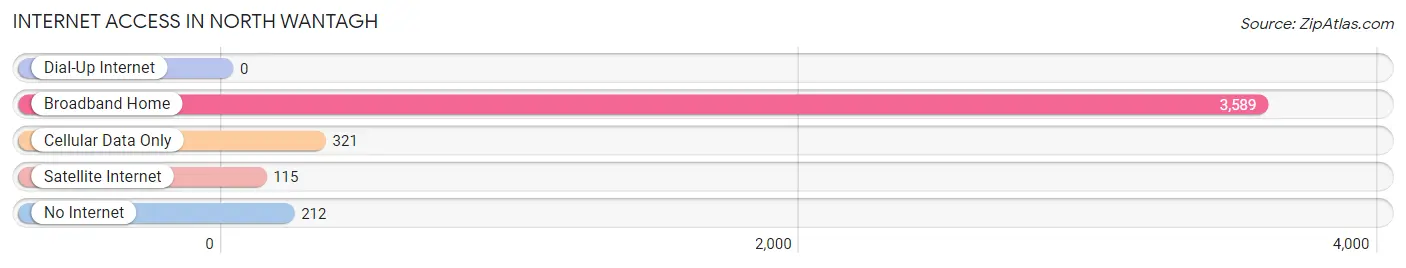
| Internet Type | # Households | % Households |
| Dial-Up Internet | 0 | 0.0% |
| Broadband Home | 3,589 | 86.3% |
| Cellular Data Only | 321 | 7.7% |
| Satellite Internet | 115 | 2.8% |
| No Internet | 212 | 5.1% |
| Total | 4,158 | 100.0% |
North Wantagh Summary
Wantagh is a hamlet and census-designated place (CDP) located in the Town of Hempstead in Nassau County, New York, United States. It is located on the South Shore of Long Island, about 27 miles (43 km) east of Manhattan. The population of Wantagh was 18,871 at the 2010 census.
History
Wantagh was originally known as Jerusalem, and was part of the Town of Hempstead. The first settlers of the area were the Meroke Indians, who lived in the area for thousands of years before the arrival of the Europeans. The first European settlers of the area were the Dutch, who arrived in the mid-17th century. The area was then known as Jerusalem, and was part of the Town of Hempstead.
In 1788, the area was renamed Wantagh, after the Native American chief of the Meroke tribe. The name is derived from the Algonquin word for "stream of water".
In the 19th century, Wantagh became a popular summer resort for wealthy New Yorkers. The area was home to several large estates, and was known as the "Gold Coast" of Long Island.
Geography
Wantagh is located at 40°39′N 73°31′W (40.65, -73.52). According to the United States Census Bureau, the CDP has a total area of 5.2 square miles (13.4 km2), of which 5.1 square miles (13.2 km2) is land and 0.1 square miles (0.2 km2) (1.45%) is water.
Economy
Wantagh is a primarily residential community, with a few small businesses located in the area. The main industries in the area are retail, health care, and education. The largest employers in the area are the Wantagh School District, the North Shore-LIJ Health System, and the Wantagh Public Library.
Demographics
As of the census of 2000, there were 18,871 people, 6,521 households, and 5,039 families residing in the CDP. The population density was 3,711.3 per square mile (1,430.2/km2). There were 6,711 housing units at an average density of 1,316.7/sq mi (507.7/km2). The racial makeup of the CDP was 94.9% White, 0.7% African American, 0.1% Native American, 2.2% Asian, 0.0% Pacific Islander, 0.9% from other races, and 1.2% from two or more races. Hispanic or Latino of any race were 3.9% of the population.
There were 6,521 households, out of which 37.2% had children under the age of 18 living with them, 68.2% were married couples living together, 8.2% had a female householder with no husband present, and 20.3% were non-families. 16.3% of all households were made up of individuals, and 8.2% had someone living alone who was 65 years of age or older. The average household size was 2.88 and the average family size was 3.23.
In the CDP, the population was spread out, with 25.2% under the age of 18, 6.2% from 18 to 24, 29.2% from 25 to 44, 24.2% from 45 to 64, and 15.2% who were 65 years of age or older. The median age was 39 years. For every 100 females, there were 93.3 males. For every 100 females age 18 and over, there were 89.7 males.
The median income for a household in the CDP was $76,843, and the median income for a family was $86,945. Males had a median income of $51,945 versus $37,813 for females. The per capita income for the CDP was $30,845. About 1.9% of families and 2.7% of the population were below the poverty line, including 2.7% of those under age 18 and 3.2% of those age 65 or over.
Common Questions
What is Per Capita Income in North Wantagh?
Per Capita income in North Wantagh is $61,293.
What is the Median Family Income in North Wantagh?
Median Family Income in North Wantagh is $179,628.
What is the Median Household income in North Wantagh?
Median Household Income in North Wantagh is $159,028.
What is Income or Wage Gap in North Wantagh?
Income or Wage Gap in North Wantagh is 32.9%.
Women in North Wantagh earn 67.1 cents for every dollar earned by a man.
What is Family Income Deficit in North Wantagh?
Family Income Deficit in North Wantagh is $6,734.
Families that are below poverty line in North Wantagh earn $6,734 less on average than the poverty threshold level.
What is Inequality or Gini Index in North Wantagh?
Inequality or Gini Index in North Wantagh is 0.37.
What is the Total Population of North Wantagh?
Total Population of North Wantagh is 11,444.
What is the Total Male Population of North Wantagh?
Total Male Population of North Wantagh is 5,573.
What is the Total Female Population of North Wantagh?
Total Female Population of North Wantagh is 5,871.
What is the Ratio of Males per 100 Females in North Wantagh?
There are 94.92 Males per 100 Females in North Wantagh.
What is the Ratio of Females per 100 Males in North Wantagh?
There are 105.35 Females per 100 Males in North Wantagh.
What is the Median Population Age in North Wantagh?
Median Population Age in North Wantagh is 44.0 Years.
What is the Average Family Size in North Wantagh
Average Family Size in North Wantagh is 3.1 People.
What is the Average Household Size in North Wantagh
Average Household Size in North Wantagh is 2.8 People.
How Large is the Labor Force in North Wantagh?
There are 5,970 People in the Labor Forcein in North Wantagh.
What is the Percentage of People in the Labor Force in North Wantagh?
65.2% of People are in the Labor Force in North Wantagh.
What is the Unemployment Rate in North Wantagh?
Unemployment Rate in North Wantagh is 2.7%.