Florida, NY Map & Demographics
Florida Map
Florida Overview
$39,683
PER CAPITA INCOME
$118,000
AVG FAMILY INCOME
$112,188
AVG HOUSEHOLD INCOME
38.9%
WAGE / INCOME GAP [ % ]
61.1¢/ $1
WAGE / INCOME GAP [ $ ]
0.36
INEQUALITY / GINI INDEX
2,937
TOTAL POPULATION
1,532
MALE POPULATION
1,405
FEMALE POPULATION
109.04
MALES / 100 FEMALES
91.71
FEMALES / 100 MALES
35.3
MEDIAN AGE
3.7
AVG FAMILY SIZE
3.1
AVG HOUSEHOLD SIZE
1,615
LABOR FORCE [ PEOPLE ]
67.0%
PERCENT IN LABOR FORCE
3.1%
UNEMPLOYMENT RATE
Florida Zip Codes
Florida Area Codes
Income in Florida
Income Overview in Florida
Per Capita Income in Florida is $39,683, while median incomes of families and households are $118,000 and $112,188 respectively.
| Characteristic | Number | Measure |
| Per Capita Income | 2,937 | $39,683 |
| Median Family Income | 696 | $118,000 |
| Mean Family Income | 696 | $126,463 |
| Median Household Income | 943 | $112,188 |
| Mean Household Income | 943 | $119,281 |
| Income Deficit | 696 | $0 |
| Wage / Income Gap (%) | 2,937 | 38.89% |
| Wage / Income Gap ($) | 2,937 | 61.11¢ per $1 |
| Gini / Inequality Index | 2,937 | 0.36 |
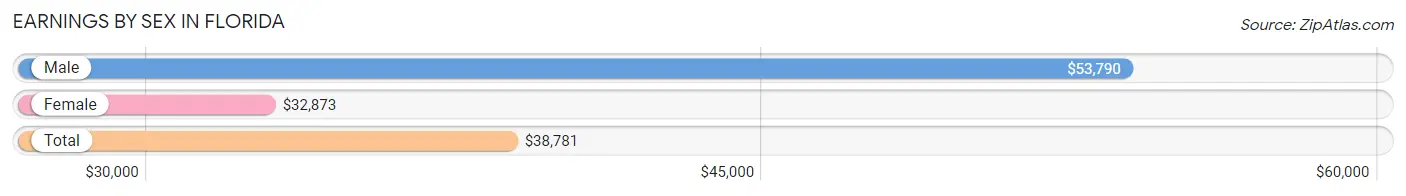
Earnings by Sex in Florida
Average Earnings in Florida are $38,781, $53,790 for men and $32,873 for women, a difference of 38.9%.
| Sex | Number | Average Earnings |
| Male | 914 (52.8%) | $53,790 |
| Female | 817 (47.2%) | $32,873 |
| Total | 1,731 (100.0%) | $38,781 |
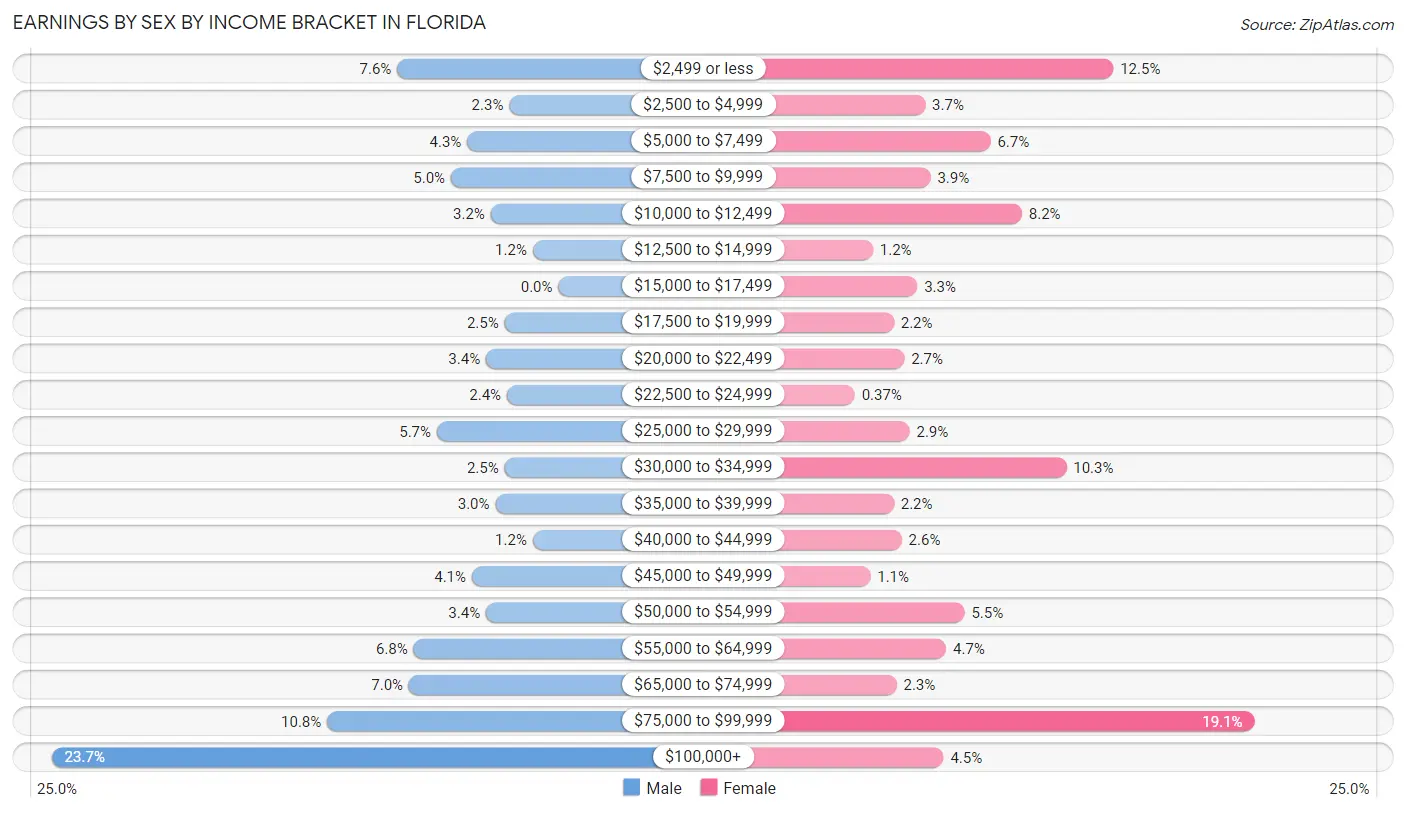
Earnings by Sex by Income Bracket in Florida
The most common earnings brackets in Florida are $100,000+ for men (217 | 23.7%) and $75,000 to $99,999 for women (156 | 19.1%).
| Income | Male | Female |
| $2,499 or less | 69 (7.5%) | 102 (12.5%) |
| $2,500 to $4,999 | 21 (2.3%) | 30 (3.7%) |
| $5,000 to $7,499 | 39 (4.3%) | 55 (6.7%) |
| $7,500 to $9,999 | 46 (5.0%) | 32 (3.9%) |
| $10,000 to $12,499 | 29 (3.2%) | 67 (8.2%) |
| $12,500 to $14,999 | 11 (1.2%) | 10 (1.2%) |
| $15,000 to $17,499 | 0 (0.0%) | 27 (3.3%) |
| $17,500 to $19,999 | 23 (2.5%) | 18 (2.2%) |
| $20,000 to $22,499 | 31 (3.4%) | 22 (2.7%) |
| $22,500 to $24,999 | 22 (2.4%) | 3 (0.4%) |
| $25,000 to $29,999 | 52 (5.7%) | 24 (2.9%) |
| $30,000 to $34,999 | 23 (2.5%) | 84 (10.3%) |
| $35,000 to $39,999 | 27 (2.9%) | 18 (2.2%) |
| $40,000 to $44,999 | 11 (1.2%) | 21 (2.6%) |
| $45,000 to $49,999 | 37 (4.1%) | 9 (1.1%) |
| $50,000 to $54,999 | 31 (3.4%) | 45 (5.5%) |
| $55,000 to $64,999 | 62 (6.8%) | 38 (4.6%) |
| $65,000 to $74,999 | 64 (7.0%) | 19 (2.3%) |
| $75,000 to $99,999 | 99 (10.8%) | 156 (19.1%) |
| $100,000+ | 217 (23.7%) | 37 (4.5%) |
| Total | 914 (100.0%) | 817 (100.0%) |
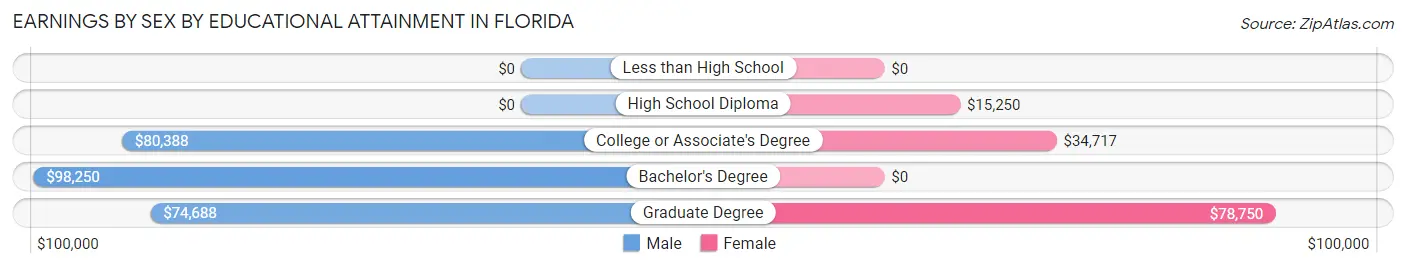
Earnings by Sex by Educational Attainment in Florida
Average earnings in Florida are $66,083 for men and $34,756 for women, a difference of 47.4%. Men with an educational attainment of bachelor's degree enjoy the highest average annual earnings of $98,250, while those with graduate degree education earn the least with $74,688. Women with an educational attainment of graduate degree earn the most with the average annual earnings of $78,750, while those with high school diploma education have the smallest earnings of $15,250.
| Educational Attainment | Male Income | Female Income |
| Less than High School | - | - |
| High School Diploma | - | - |
| College or Associate's Degree | $80,388 | $34,717 |
| Bachelor's Degree | $98,250 | $0 |
| Graduate Degree | $74,688 | $78,750 |
| Total | $66,083 | $34,756 |
Family Income in Florida
Family Income Brackets in Florida
According to the Florida family income data, there are 246 families falling into the $100,000 to $149,999 income range, which is the most common income bracket and makes up 35.3% of all families. Conversely, the $25,000 to $34,999 income bracket is the least frequent group with only 2 families (0.3%) belonging to this category.
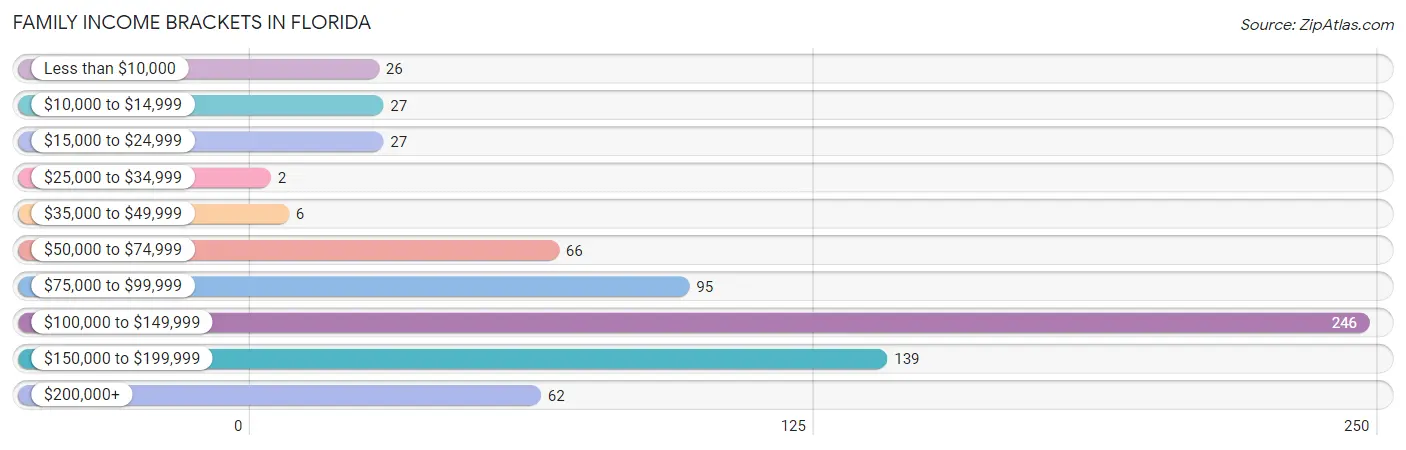
| Income Bracket | # Families | % Families |
| Less than $10,000 | 26 | 3.7% |
| $10,000 to $14,999 | 27 | 3.9% |
| $15,000 to $24,999 | 27 | 3.9% |
| $25,000 to $34,999 | 2 | 0.3% |
| $35,000 to $49,999 | 6 | 0.9% |
| $50,000 to $74,999 | 66 | 9.5% |
| $75,000 to $99,999 | 95 | 13.6% |
| $100,000 to $149,999 | 246 | 35.3% |
| $150,000 to $199,999 | 139 | 20.0% |
| $200,000+ | 62 | 8.9% |
Family Income by Famaliy Size in Florida
5-person families (81 | 11.6%) account for the highest median family income in Florida with $131,065 per family, while 2-person families (246 | 35.3%) have the highest median income of $55,625 per family member.
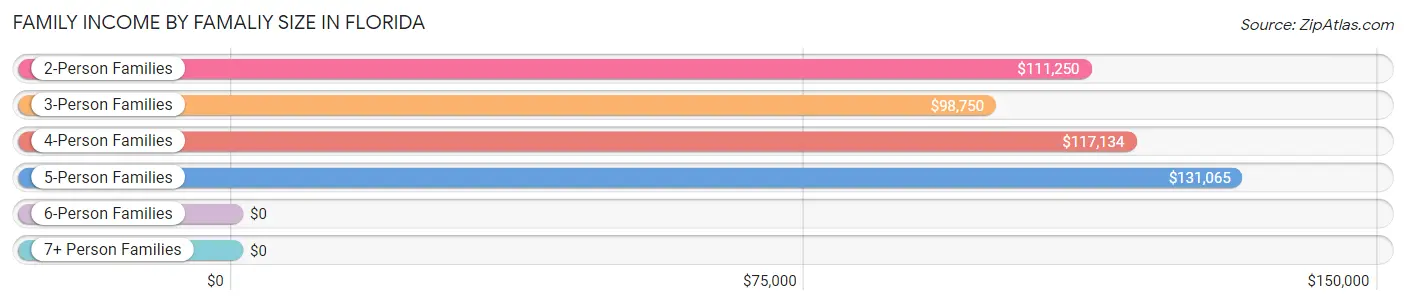
| Income Bracket | # Families | Median Income |
| 2-Person Families | 246 (35.3%) | $111,250 |
| 3-Person Families | 108 (15.5%) | $98,750 |
| 4-Person Families | 212 (30.5%) | $117,134 |
| 5-Person Families | 81 (11.6%) | $131,065 |
| 6-Person Families | 39 (5.6%) | $0 |
| 7+ Person Families | 10 (1.4%) | $0 |
| Total | 696 (100.0%) | $118,000 |
Family Income by Number of Earners in Florida
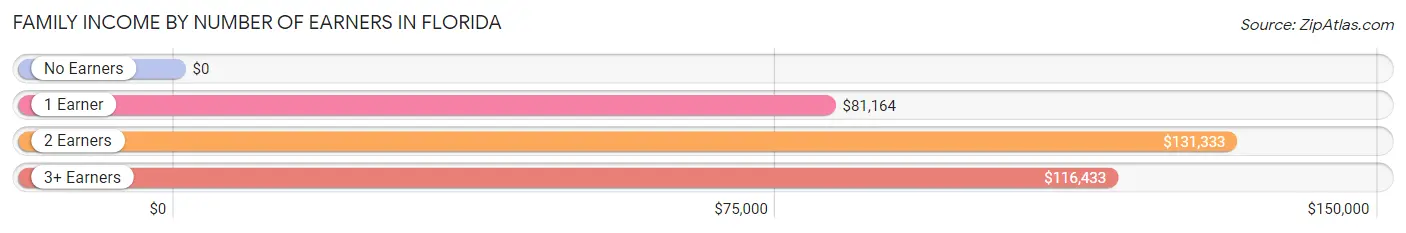
| Number of Earners | # Families | Median Income |
| No Earners | 48 (6.9%) | $0 |
| 1 Earner | 175 (25.1%) | $81,164 |
| 2 Earners | 310 (44.5%) | $131,333 |
| 3+ Earners | 163 (23.4%) | $116,433 |
| Total | 696 (100.0%) | $118,000 |
Household Income in Florida
Household Income Brackets in Florida
With 284 households falling in the category, the $100,000 to $149,999 income range is the most frequent in Florida, accounting for 30.1% of all households. In contrast, only 12 households (1.3%) fall into the $25,000 to $34,999 income bracket, making it the least populous group.
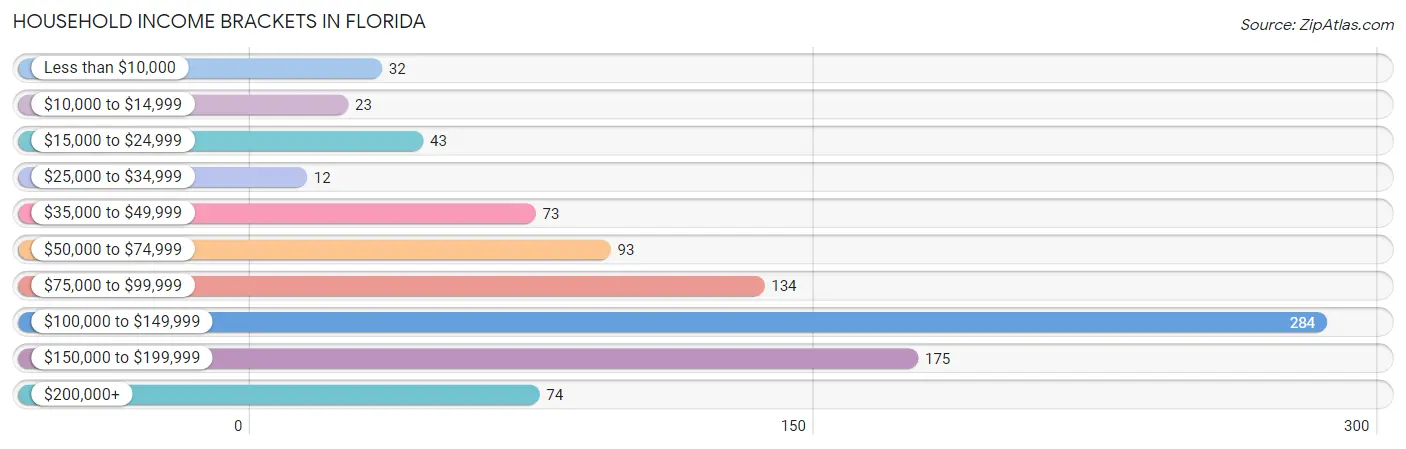
| Income Bracket | # Households | % Households |
| Less than $10,000 | 32 | 3.4% |
| $10,000 to $14,999 | 23 | 2.4% |
| $15,000 to $24,999 | 43 | 4.6% |
| $25,000 to $34,999 | 12 | 1.3% |
| $35,000 to $49,999 | 73 | 7.7% |
| $50,000 to $74,999 | 93 | 9.9% |
| $75,000 to $99,999 | 134 | 14.2% |
| $100,000 to $149,999 | 284 | 30.1% |
| $150,000 to $199,999 | 175 | 18.6% |
| $200,000+ | 74 | 7.8% |
Household Income by Householder Age in Florida
The median household income in Florida is $112,188, with the highest median household income of $131,283 found in the 45 to 64 years age bracket for the primary householder. A total of 401 households (42.5%) fall into this category. Meanwhile, the 15 to 24 years age bracket for the primary householder has the lowest median household income of $0, with 48 households (5.1%) in this group.
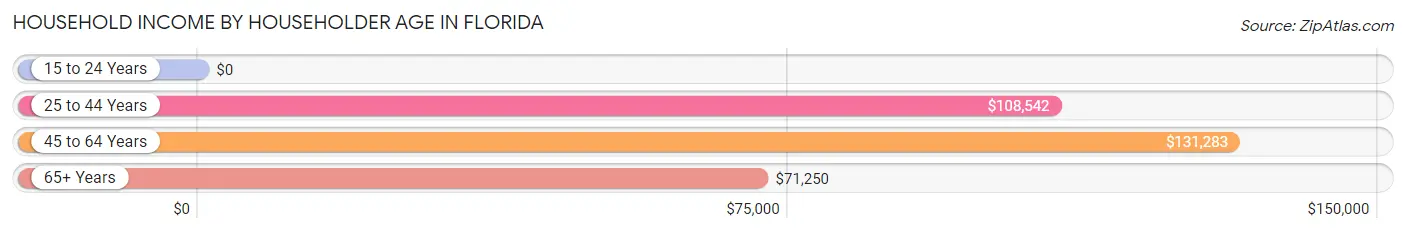
| Income Bracket | # Households | Median Income |
| 15 to 24 Years | 48 (5.1%) | $0 |
| 25 to 44 Years | 238 (25.2%) | $108,542 |
| 45 to 64 Years | 401 (42.5%) | $131,283 |
| 65+ Years | 256 (27.2%) | $71,250 |
| Total | 943 (100.0%) | $112,188 |
Poverty in Florida
Income Below Poverty by Sex and Age in Florida
With 6.5% poverty level for males and 12.4% for females among the residents of Florida, 5 year old males and 18 to 24 year old females are the most vulnerable to poverty, with 7 males (31.8%) and 40 females (30.1%) in their respective age groups living below the poverty level.
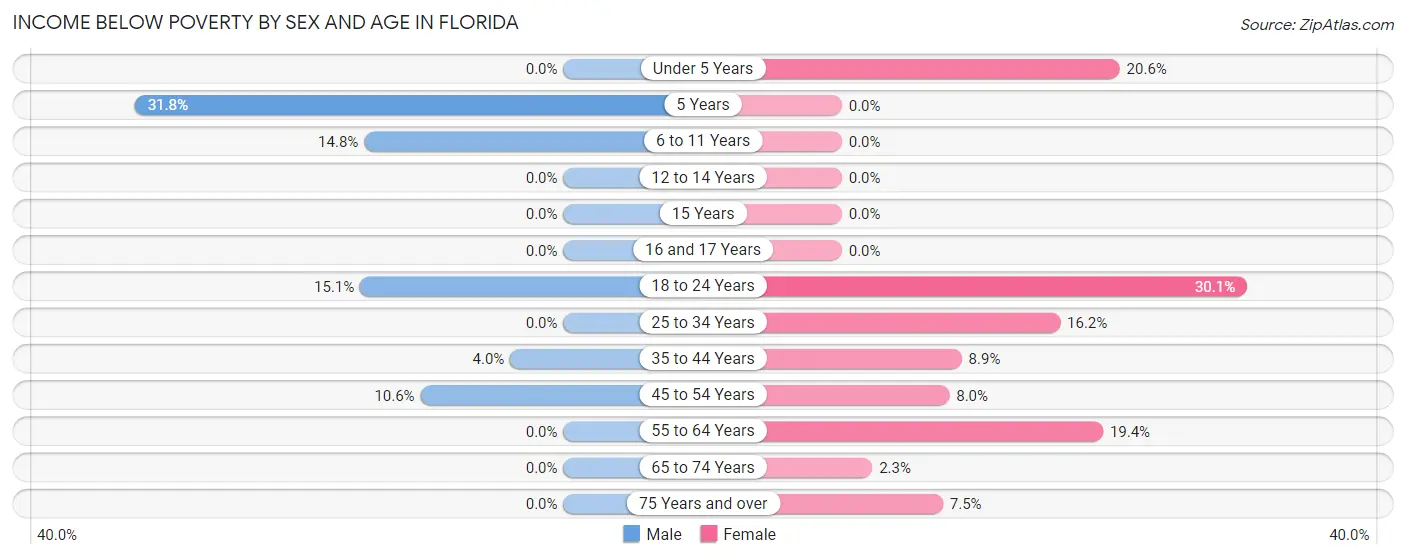
| Age Bracket | Male | Female |
| Under 5 Years | 0 (0.0%) | 26 (20.6%) |
| 5 Years | 7 (31.8%) | 0 (0.0%) |
| 6 to 11 Years | 25 (14.8%) | 0 (0.0%) |
| 12 to 14 Years | 0 (0.0%) | 0 (0.0%) |
| 15 Years | 0 (0.0%) | 0 (0.0%) |
| 16 and 17 Years | 0 (0.0%) | 0 (0.0%) |
| 18 to 24 Years | 32 (15.1%) | 40 (30.1%) |
| 25 to 34 Years | 0 (0.0%) | 47 (16.2%) |
| 35 to 44 Years | 7 (4.0%) | 13 (8.9%) |
| 45 to 54 Years | 28 (10.6%) | 19 (8.0%) |
| 55 to 64 Years | 0 (0.0%) | 19 (19.4%) |
| 65 to 74 Years | 0 (0.0%) | 4 (2.3%) |
| 75 Years and over | 0 (0.0%) | 6 (7.5%) |
| Total | 99 (6.5%) | 174 (12.4%) |
Income Above Poverty by Sex and Age in Florida
According to the poverty statistics in Florida, males aged under 5 years and females aged 5 years are the age groups that are most secure financially, with 100.0% of males and 100.0% of females in these age groups living above the poverty line.
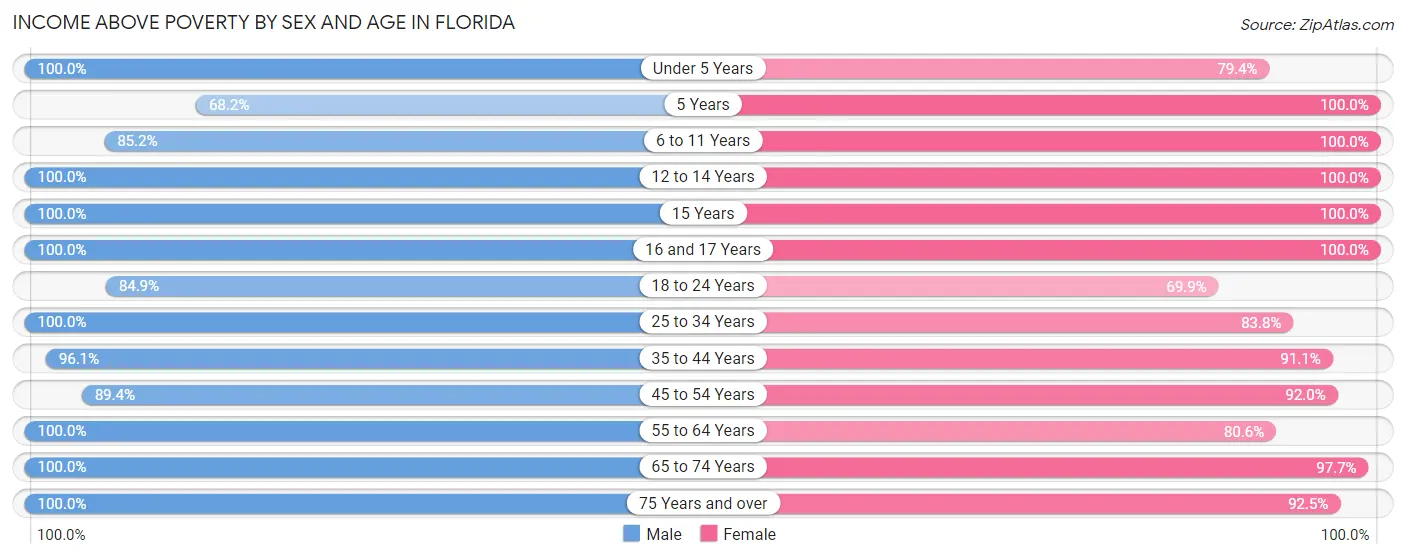
| Age Bracket | Male | Female |
| Under 5 Years | 96 (100.0%) | 100 (79.4%) |
| 5 Years | 15 (68.2%) | 22 (100.0%) |
| 6 to 11 Years | 144 (85.2%) | 26 (100.0%) |
| 12 to 14 Years | 14 (100.0%) | 34 (100.0%) |
| 15 Years | 5 (100.0%) | 8 (100.0%) |
| 16 and 17 Years | 94 (100.0%) | 27 (100.0%) |
| 18 to 24 Years | 180 (84.9%) | 93 (69.9%) |
| 25 to 34 Years | 153 (100.0%) | 243 (83.8%) |
| 35 to 44 Years | 170 (96.1%) | 133 (91.1%) |
| 45 to 54 Years | 236 (89.4%) | 219 (92.0%) |
| 55 to 64 Years | 126 (100.0%) | 79 (80.6%) |
| 65 to 74 Years | 136 (100.0%) | 173 (97.7%) |
| 75 Years and over | 59 (100.0%) | 74 (92.5%) |
| Total | 1,428 (93.5%) | 1,231 (87.6%) |
Income Below Poverty Among Married-Couple Families in Florida
The poverty statistics for married-couple families in Florida show that 3.3% or 19 of the total 585 families live below the poverty line. Families with no children have the highest poverty rate of 6.2%, comprising of 19 families. On the other hand, families with 1 or 2 children have the lowest poverty rate of 0.0%, which includes 0 families.
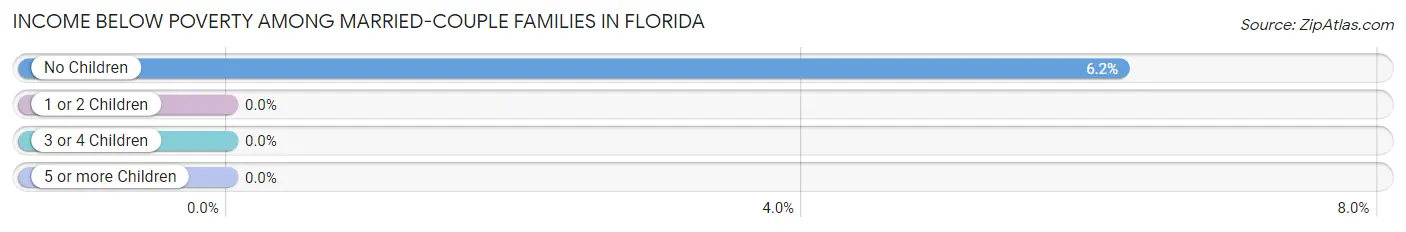
| Children | Above Poverty | Below Poverty |
| No Children | 287 (93.8%) | 19 (6.2%) |
| 1 or 2 Children | 201 (100.0%) | 0 (0.0%) |
| 3 or 4 Children | 78 (100.0%) | 0 (0.0%) |
| 5 or more Children | 0 (0.0%) | 0 (0.0%) |
| Total | 566 (96.8%) | 19 (3.3%) |
Income Below Poverty Among Single-Parent Households in Florida
According to the poverty data in Florida, 45.5% or 15 single-father households and 24.4% or 19 single-mother households are living below the poverty line. Among single-father households, those with 1 or 2 children have the highest poverty rate, with 7 households (53.8%) experiencing poverty. Likewise, among single-mother households, those with 1 or 2 children have the highest poverty rate, with 19 households (59.4%) falling below the poverty line.
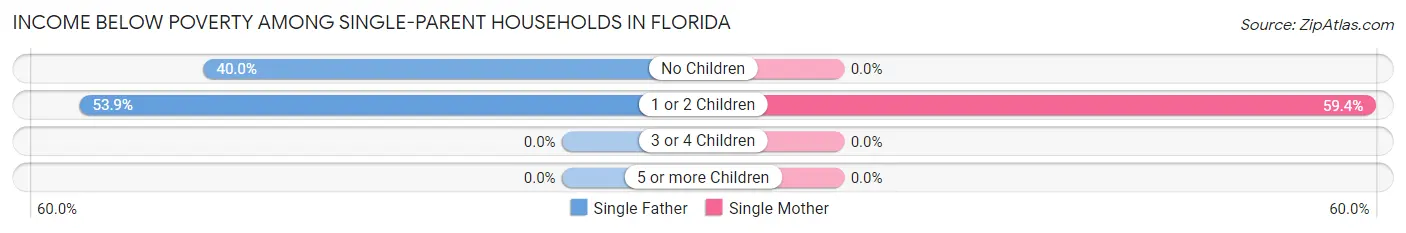
| Children | Single Father | Single Mother |
| No Children | 8 (40.0%) | 0 (0.0%) |
| 1 or 2 Children | 7 (53.8%) | 19 (59.4%) |
| 3 or 4 Children | 0 (0.0%) | 0 (0.0%) |
| 5 or more Children | 0 (0.0%) | 0 (0.0%) |
| Total | 15 (45.5%) | 19 (24.4%) |
Income Below Poverty Among Married-Couple vs Single-Parent Households in Florida
The poverty data for Florida shows that 19 of the married-couple family households (3.3%) and 34 of the single-parent households (30.6%) are living below the poverty level. Within the married-couple family households, those with no children have the highest poverty rate, with 19 households (6.2%) falling below the poverty line. Among the single-parent households, those with 1 or 2 children have the highest poverty rate, with 26 household (57.8%) living below poverty.
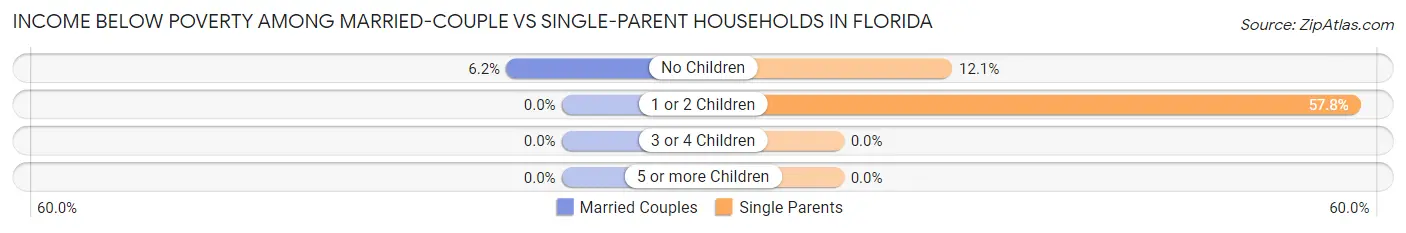
| Children | Married-Couple Families | Single-Parent Households |
| No Children | 19 (6.2%) | 8 (12.1%) |
| 1 or 2 Children | 0 (0.0%) | 26 (57.8%) |
| 3 or 4 Children | 0 (0.0%) | 0 (0.0%) |
| 5 or more Children | 0 (0.0%) | 0 (0.0%) |
| Total | 19 (3.3%) | 34 (30.6%) |
Race in Florida
The most populous races in Florida are White / Caucasian (2,075 | 70.7%), Hispanic or Latino (650 | 22.1%), and Two or more Races (277 | 9.4%).
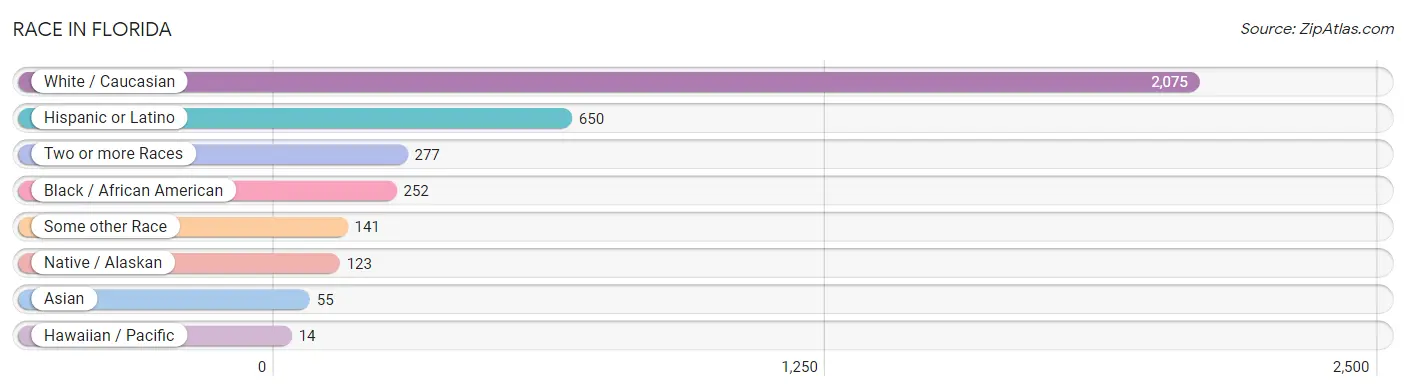
| Race | # Population | % Population |
| Asian | 55 | 1.9% |
| Black / African American | 252 | 8.6% |
| Hawaiian / Pacific | 14 | 0.5% |
| Hispanic or Latino | 650 | 22.1% |
| Native / Alaskan | 123 | 4.2% |
| White / Caucasian | 2,075 | 70.7% |
| Two or more Races | 277 | 9.4% |
| Some other Race | 141 | 4.8% |
| Total | 2,937 | 100.0% |
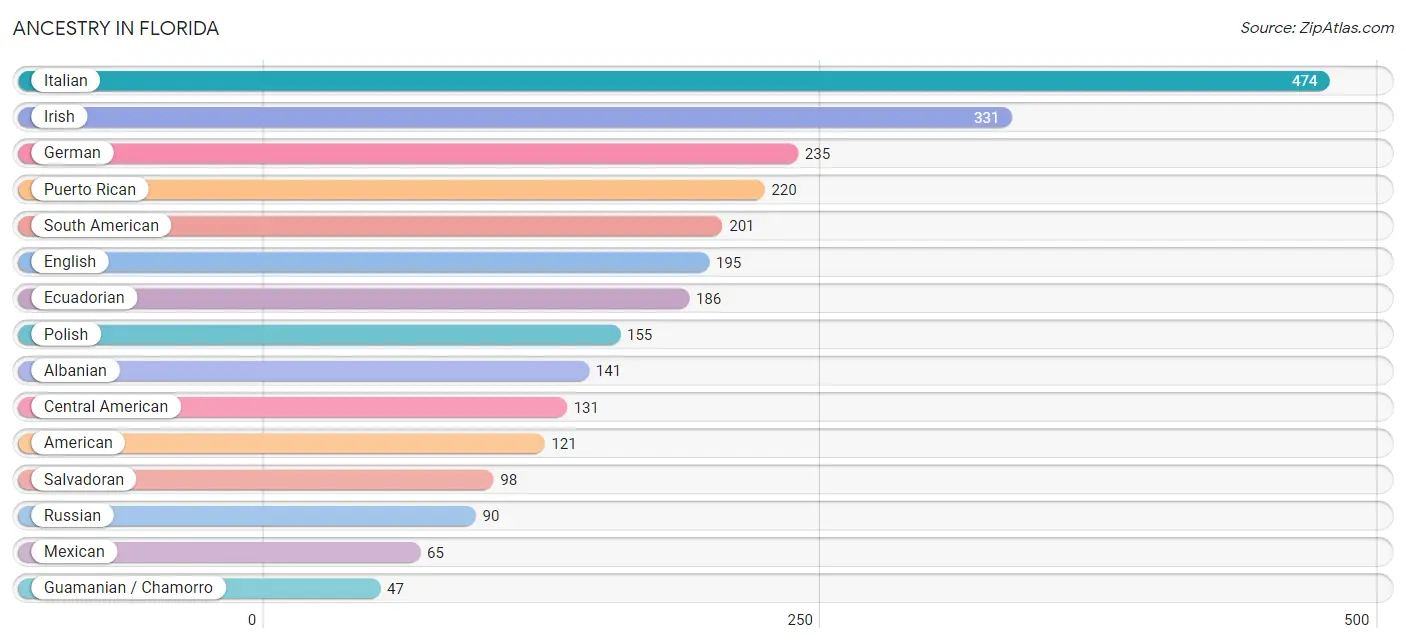
Ancestry in Florida
The most populous ancestries reported in Florida are Italian (474 | 16.1%), Irish (331 | 11.3%), German (235 | 8.0%), Puerto Rican (220 | 7.5%), and South American (201 | 6.8%), together accounting for 49.7% of all Florida residents.
| Ancestry | # Population | % Population |
| African | 15 | 0.5% |
| Albanian | 141 | 4.8% |
| American | 121 | 4.1% |
| Arab | 10 | 0.3% |
| Argentinean | 4 | 0.1% |
| Austrian | 29 | 1.0% |
| British | 5 | 0.2% |
| British West Indian | 45 | 1.5% |
| Burmese | 22 | 0.7% |
| Central American | 131 | 4.5% |
| Central American Indian | 6 | 0.2% |
| Cherokee | 37 | 1.3% |
| Chilean | 11 | 0.4% |
| Creek | 3 | 0.1% |
| Croatian | 10 | 0.3% |
| Czech | 24 | 0.8% |
| Danish | 6 | 0.2% |
| Dominican | 19 | 0.6% |
| Dutch | 46 | 1.6% |
| Ecuadorian | 186 | 6.3% |
| Egyptian | 10 | 0.3% |
| English | 195 | 6.6% |
| European | 3 | 0.1% |
| French | 4 | 0.1% |
| French Canadian | 18 | 0.6% |
| German | 235 | 8.0% |
| Greek | 13 | 0.4% |
| Guamanian / Chamorro | 47 | 1.6% |
| Guatemalan | 29 | 1.0% |
| Hungarian | 3 | 0.1% |
| Indian (Asian) | 10 | 0.3% |
| Irish | 331 | 11.3% |
| Italian | 474 | 16.1% |
| Lithuanian | 13 | 0.4% |
| Maltese | 26 | 0.9% |
| Mexican | 65 | 2.2% |
| Panamanian | 4 | 0.1% |
| Polish | 155 | 5.3% |
| Puerto Rican | 220 | 7.5% |
| Russian | 90 | 3.1% |
| Salvadoran | 98 | 3.3% |
| Scandinavian | 3 | 0.1% |
| Scotch-Irish | 14 | 0.5% |
| Scottish | 36 | 1.2% |
| South American | 201 | 6.8% |
| Spaniard | 14 | 0.5% |
| Subsaharan African | 15 | 0.5% |
| Swedish | 5 | 0.2% |
| Thai | 35 | 1.2% |
| Ukrainian | 9 | 0.3% |
| West Indian | 27 | 0.9% | View All 51 Rows |
Immigrants in Florida
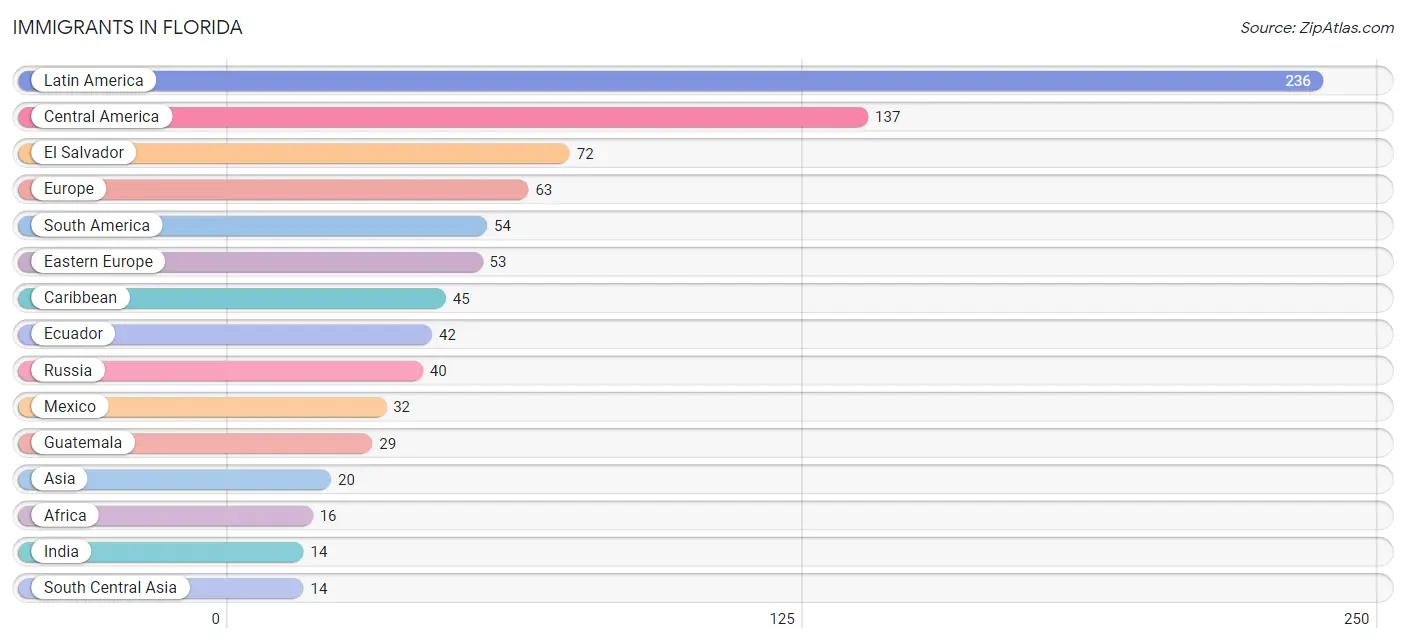
The most numerous immigrant groups reported in Florida came from Latin America (236 | 8.0%), Central America (137 | 4.7%), El Salvador (72 | 2.5%), Europe (63 | 2.1%), and South America (54 | 1.8%), together accounting for 19.1% of all Florida residents.
| Immigration Origin | # Population | % Population |
| Africa | 16 | 0.5% |
| Argentina | 4 | 0.1% |
| Asia | 20 | 0.7% |
| Caribbean | 45 | 1.5% |
| Central America | 137 | 4.7% |
| China | 6 | 0.2% |
| Congo | 13 | 0.4% |
| Eastern Asia | 6 | 0.2% |
| Eastern Europe | 53 | 1.8% |
| Ecuador | 42 | 1.4% |
| Egypt | 3 | 0.1% |
| El Salvador | 72 | 2.5% |
| Europe | 63 | 2.1% |
| Guatemala | 29 | 1.0% |
| Guyana | 8 | 0.3% |
| Hong Kong | 3 | 0.1% |
| India | 14 | 0.5% |
| Latin America | 236 | 8.0% |
| Mexico | 32 | 1.1% |
| Middle Africa | 13 | 0.4% |
| Northern Africa | 3 | 0.1% |
| Panama | 4 | 0.1% |
| Poland | 13 | 0.4% |
| Russia | 40 | 1.4% |
| South America | 54 | 1.8% |
| South Central Asia | 14 | 0.5% |
| Southern Europe | 10 | 0.3% | View All 27 Rows |
Sex and Age in Florida
Sex and Age in Florida
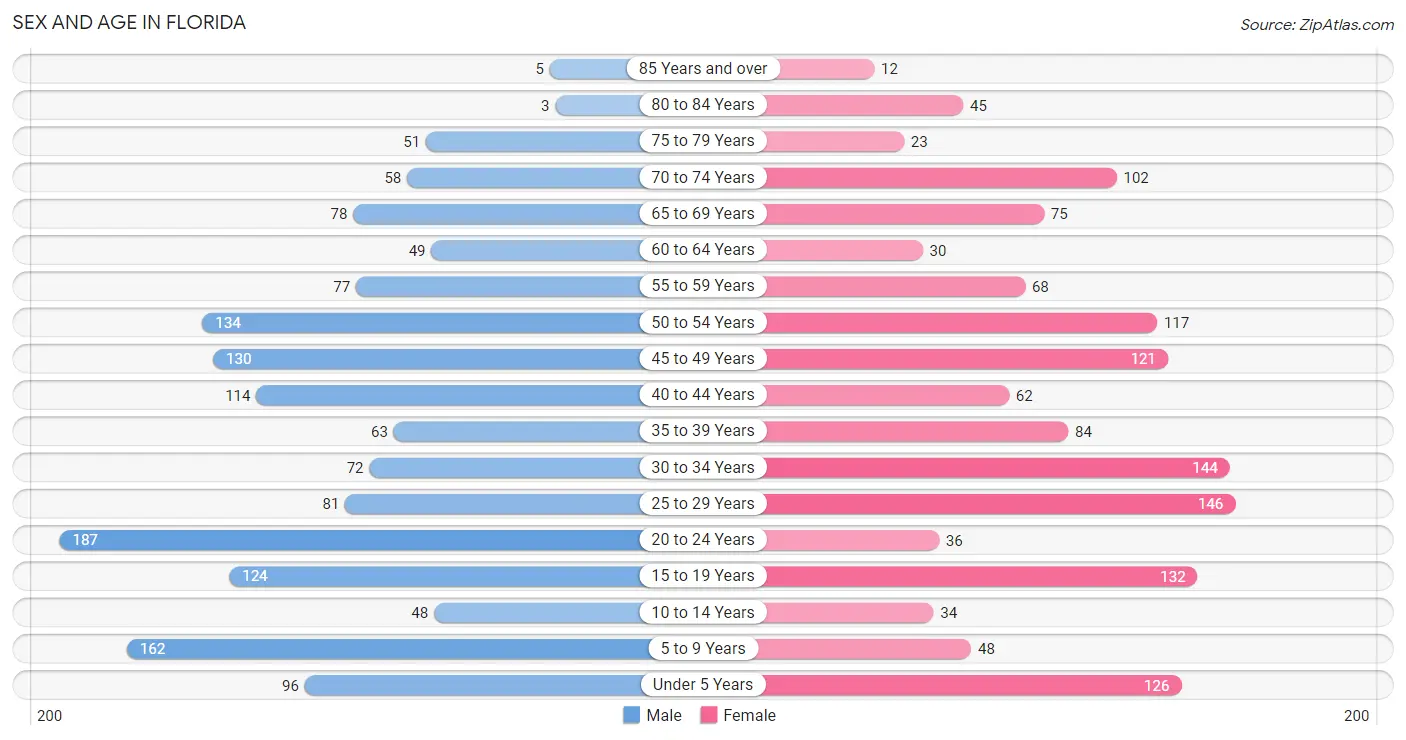
The most populous age groups in Florida are 20 to 24 Years (187 | 12.2%) for men and 25 to 29 Years (146 | 10.4%) for women.
| Age Bracket | Male | Female |
| Under 5 Years | 96 (6.3%) | 126 (9.0%) |
| 5 to 9 Years | 162 (10.6%) | 48 (3.4%) |
| 10 to 14 Years | 48 (3.1%) | 34 (2.4%) |
| 15 to 19 Years | 124 (8.1%) | 132 (9.4%) |
| 20 to 24 Years | 187 (12.2%) | 36 (2.6%) |
| 25 to 29 Years | 81 (5.3%) | 146 (10.4%) |
| 30 to 34 Years | 72 (4.7%) | 144 (10.2%) |
| 35 to 39 Years | 63 (4.1%) | 84 (6.0%) |
| 40 to 44 Years | 114 (7.4%) | 62 (4.4%) |
| 45 to 49 Years | 130 (8.5%) | 121 (8.6%) |
| 50 to 54 Years | 134 (8.7%) | 117 (8.3%) |
| 55 to 59 Years | 77 (5.0%) | 68 (4.8%) |
| 60 to 64 Years | 49 (3.2%) | 30 (2.1%) |
| 65 to 69 Years | 78 (5.1%) | 75 (5.3%) |
| 70 to 74 Years | 58 (3.8%) | 102 (7.3%) |
| 75 to 79 Years | 51 (3.3%) | 23 (1.6%) |
| 80 to 84 Years | 3 (0.2%) | 45 (3.2%) |
| 85 Years and over | 5 (0.3%) | 12 (0.9%) |
| Total | 1,532 (100.0%) | 1,405 (100.0%) |
Families and Households in Florida
Median Family Size in Florida
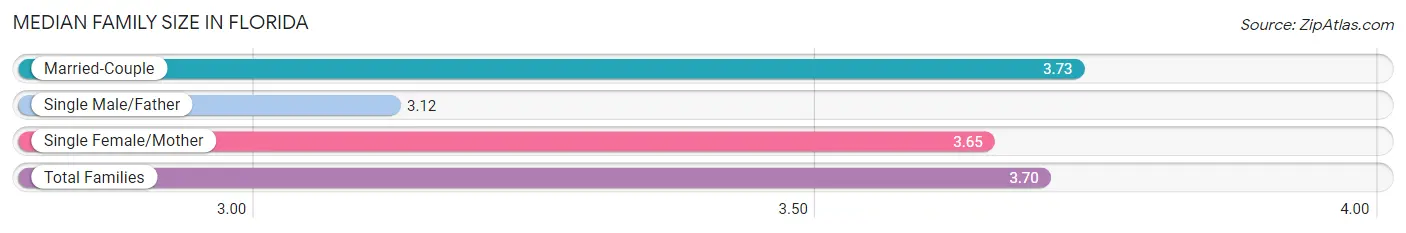
The median family size in Florida is 3.70 persons per family, with married-couple families (585 | 84.1%) accounting for the largest median family size of 3.73 persons per family. On the other hand, single male/father families (33 | 4.7%) represent the smallest median family size with 3.12 persons per family.
| Family Type | # Families | Family Size |
| Married-Couple | 585 (84.1%) | 3.73 |
| Single Male/Father | 33 (4.7%) | 3.12 |
| Single Female/Mother | 78 (11.2%) | 3.65 |
| Total Families | 696 (100.0%) | 3.70 |
Median Household Size in Florida
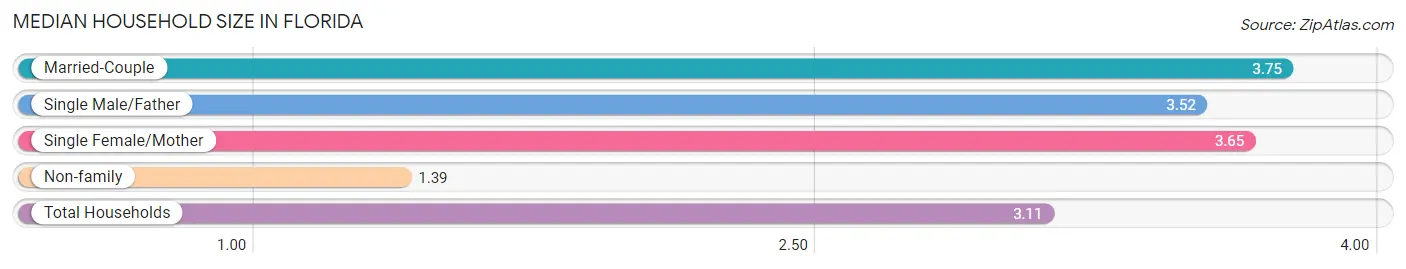
The median household size in Florida is 3.11 persons per household, with married-couple households (585 | 62.0%) accounting for the largest median household size of 3.75 persons per household. non-family households (247 | 26.2%) represent the smallest median household size with 1.39 persons per household.
| Household Type | # Households | Household Size |
| Married-Couple | 585 (62.0%) | 3.75 |
| Single Male/Father | 33 (3.5%) | 3.52 |
| Single Female/Mother | 78 (8.3%) | 3.65 |
| Non-family | 247 (26.2%) | 1.39 |
| Total Households | 943 (100.0%) | 3.11 |
Household Size by Marriage Status in Florida
Out of a total of 943 households in Florida, 696 (73.8%) are family households, while 247 (26.2%) are nonfamily households. The most numerous type of family households are 2-person households, comprising 238, and the most common type of nonfamily households are 1-person households, comprising 150.
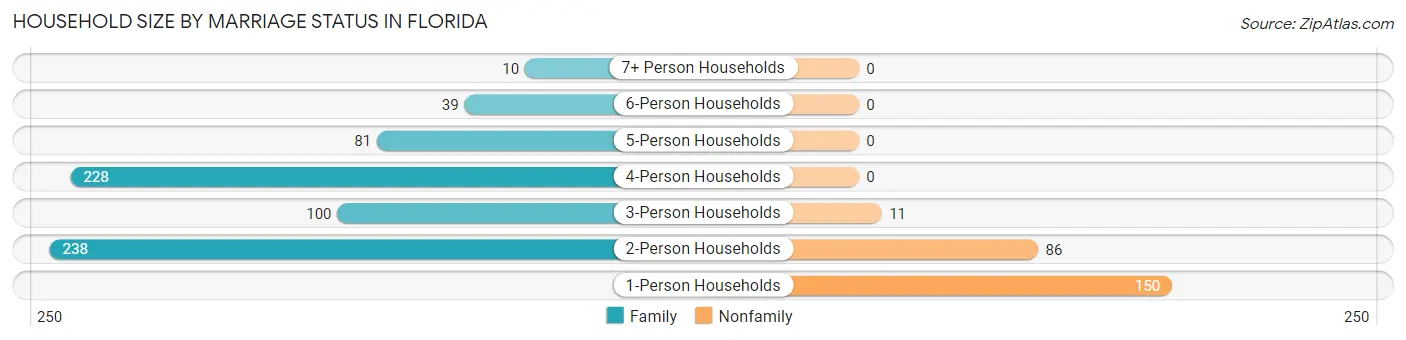
| Household Size | Family Households | Nonfamily Households |
| 1-Person Households | - | 150 (15.9%) |
| 2-Person Households | 238 (25.2%) | 86 (9.1%) |
| 3-Person Households | 100 (10.6%) | 11 (1.2%) |
| 4-Person Households | 228 (24.2%) | 0 (0.0%) |
| 5-Person Households | 81 (8.6%) | 0 (0.0%) |
| 6-Person Households | 39 (4.1%) | 0 (0.0%) |
| 7+ Person Households | 10 (1.1%) | 0 (0.0%) |
| Total | 696 (73.8%) | 247 (26.2%) |
Female Fertility in Florida
Fertility by Age in Florida
Average fertility rate in Florida is 71.0 births per 1,000 women. Women in the age bracket of 20 to 34 years have the highest fertility rate with 163.0 births per 1,000 women. Women in the age bracket of 20 to 34 years acount for 100.0% of all women with births.
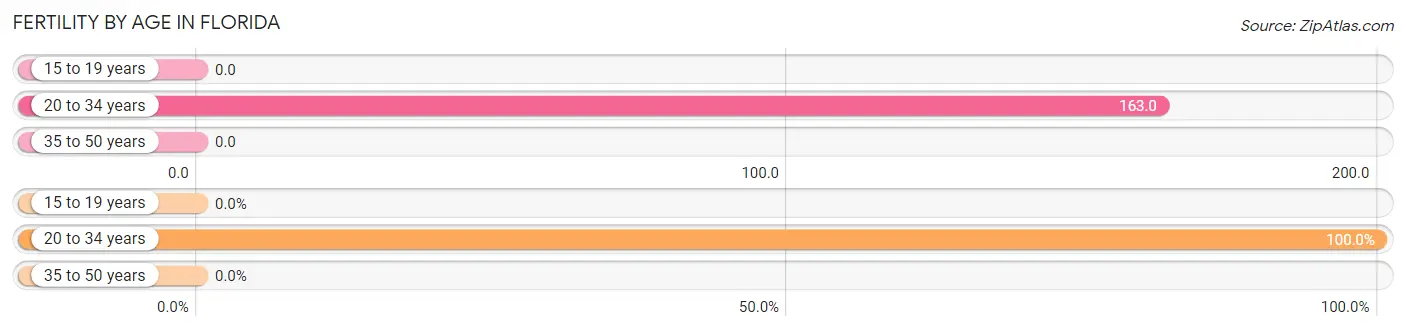
| Age Bracket | Women with Births | Births / 1,000 Women |
| 15 to 19 years | 0 (0.0%) | 0.0 |
| 20 to 34 years | 53 (100.0%) | 163.0 |
| 35 to 50 years | 0 (0.0%) | 0.0 |
| Total | 53 (100.0%) | 71.0 |
Fertility by Age by Marriage Status in Florida
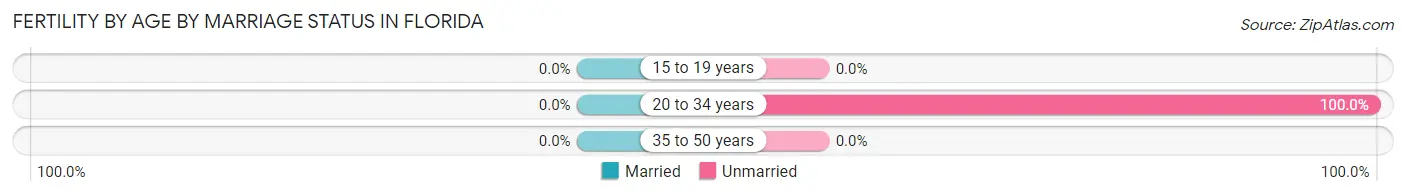
| Age Bracket | Married | Unmarried |
| 15 to 19 years | 0 (0.0%) | 0 (0.0%) |
| 20 to 34 years | 0 (0.0%) | 53 (100.0%) |
| 35 to 50 years | 0 (0.0%) | 0 (0.0%) |
| Total | 0 (0.0%) | 53 (100.0%) |
Fertility by Education in Florida
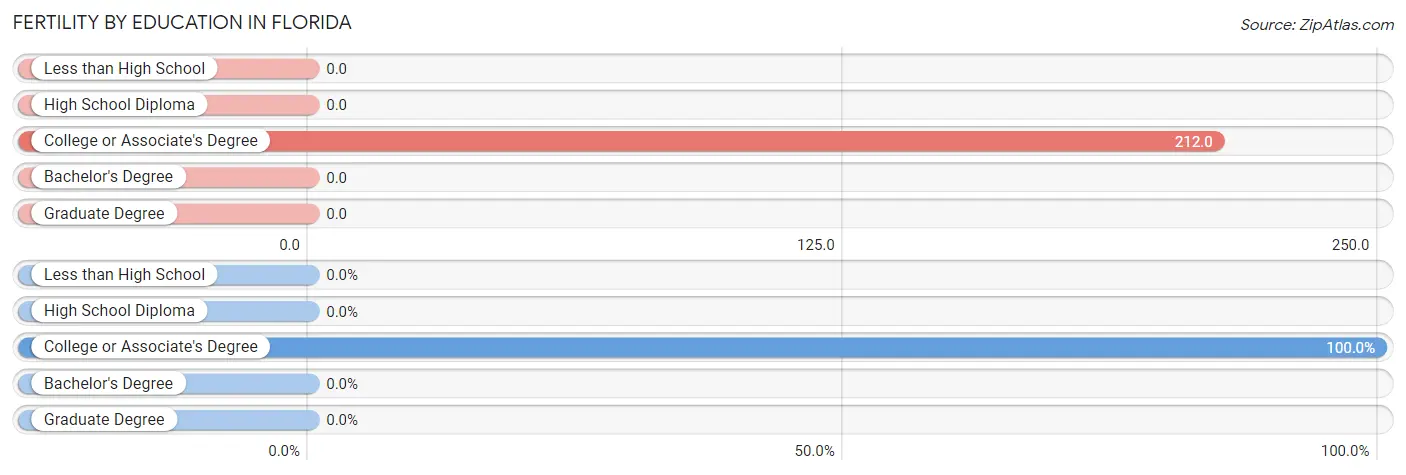
| Educational Attainment | Women with Births | Births / 1,000 Women |
| Less than High School | 0 (0.0%) | 0.0 |
| High School Diploma | 0 (0.0%) | 0.0 |
| College or Associate's Degree | 53 (100.0%) | 212.0 |
| Bachelor's Degree | 0 (0.0%) | 0.0 |
| Graduate Degree | 0 (0.0%) | 0.0 |
| Total | 53 (100.0%) | 71.0 |
Fertility by Education by Marriage Status in Florida
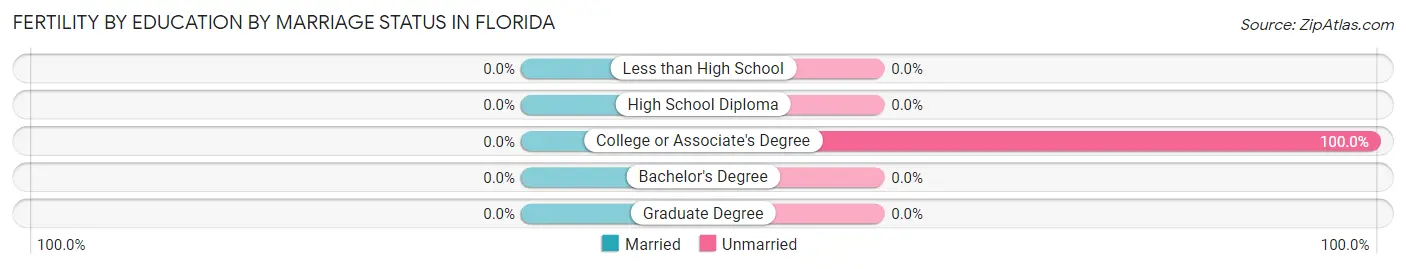
| Educational Attainment | Married | Unmarried |
| Less than High School | 0 (0.0%) | 0 (0.0%) |
| High School Diploma | 0 (0.0%) | 0 (0.0%) |
| College or Associate's Degree | 0 (0.0%) | 53 (100.0%) |
| Bachelor's Degree | 0 (0.0%) | 0 (0.0%) |
| Graduate Degree | 0 (0.0%) | 0 (0.0%) |
| Total | 0 (0.0%) | 53 (100.0%) |
Employment Characteristics in Florida
Employment by Class of Employer in Florida
Among the 1,559 employed individuals in Florida, private company employees (896 | 57.5%), local government employees (270 | 17.3%), and self-employed (not incorporated) (102 | 6.5%) make up the most common classes of employment.
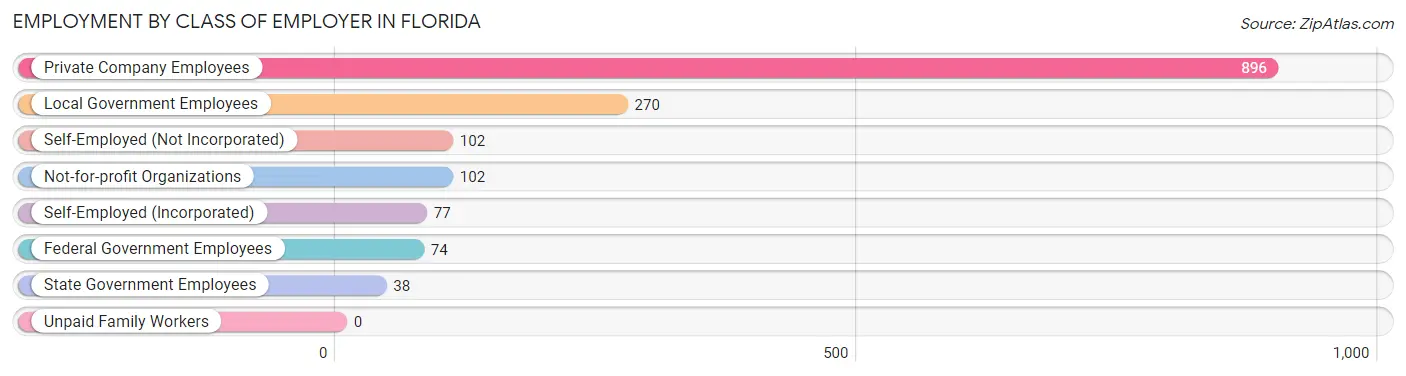
| Employer Class | # Employees | % Employees |
| Private Company Employees | 896 | 57.5% |
| Self-Employed (Incorporated) | 77 | 4.9% |
| Self-Employed (Not Incorporated) | 102 | 6.5% |
| Not-for-profit Organizations | 102 | 6.5% |
| Local Government Employees | 270 | 17.3% |
| State Government Employees | 38 | 2.4% |
| Federal Government Employees | 74 | 4.8% |
| Unpaid Family Workers | 0 | 0.0% |
| Total | 1,559 | 100.0% |
Employment Status by Age in Florida
According to the labor force statistics for Florida, out of the total population over 16 years of age (2,410), 67.0% or 1,615 individuals are in the labor force, with 3.1% or 50 of them unemployed. The age group with the highest labor force participation rate is 25 to 29 years, with 100.0% or 227 individuals in the labor force. Within the labor force, the 16 to 19 years age range has the highest percentage of unemployed individuals, with 39.3% or 24 of them being unemployed.
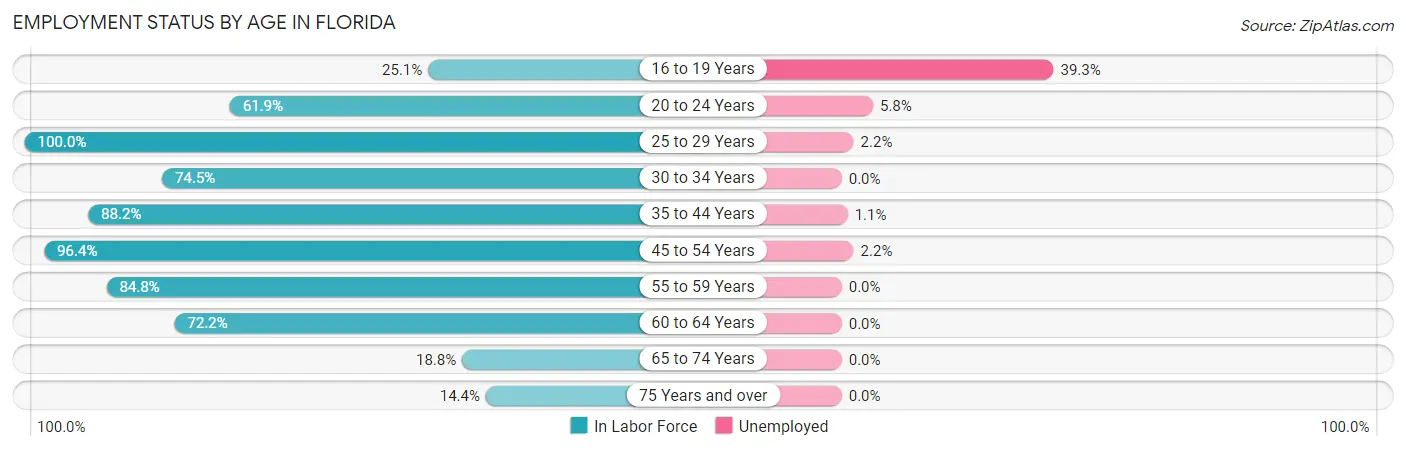
| Age Bracket | In Labor Force | Unemployed |
| 16 to 19 Years | 61 (25.1%) | 24 (39.3%) |
| 20 to 24 Years | 138 (61.9%) | 8 (5.8%) |
| 25 to 29 Years | 227 (100.0%) | 5 (2.2%) |
| 30 to 34 Years | 161 (74.5%) | 0 (0.0%) |
| 35 to 44 Years | 285 (88.2%) | 3 (1.1%) |
| 45 to 54 Years | 484 (96.4%) | 11 (2.2%) |
| 55 to 59 Years | 123 (84.8%) | 0 (0.0%) |
| 60 to 64 Years | 57 (72.2%) | 0 (0.0%) |
| 65 to 74 Years | 59 (18.8%) | 0 (0.0%) |
| 75 Years and over | 20 (14.4%) | 0 (0.0%) |
| Total | 1,615 (67.0%) | 50 (3.1%) |
Employment Status by Educational Attainment in Florida
According to labor force statistics for Florida, 89.6% of individuals (1,337) out of the total population between 25 and 64 years of age (1,492) are in the labor force, with 1.4% or 19 of them being unemployed. The group with the highest labor force participation rate are those with the educational attainment of bachelor's degree or higher, with 95.3% or 504 individuals in the labor force. Within the labor force, individuals with high school diploma education have the highest percentage of unemployment, with 5.0% or 15 of them being unemployed.
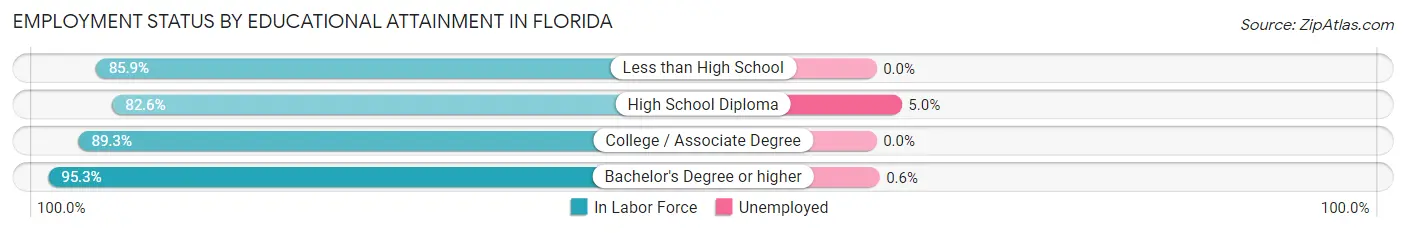
| Educational Attainment | In Labor Force | Unemployed |
| Less than High School | 61 (85.9%) | 0 (0.0%) |
| High School Diploma | 303 (82.6%) | 18 (5.0%) |
| College / Associate Degree | 469 (89.3%) | 0 (0.0%) |
| Bachelor's Degree or higher | 504 (95.3%) | 3 (0.6%) |
| Total | 1,337 (89.6%) | 21 (1.4%) |
Employment Occupations by Sex in Florida
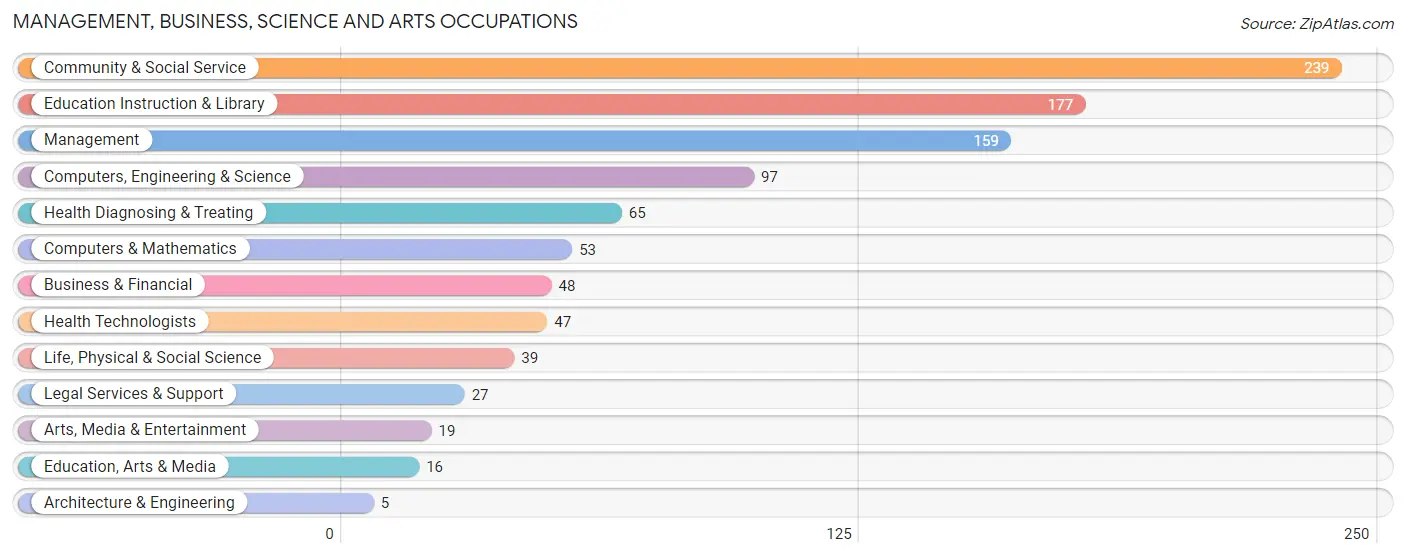
Management, Business, Science and Arts Occupations
The most common Management, Business, Science and Arts occupations in Florida are Community & Social Service (239 | 15.5%), Education Instruction & Library (177 | 11.5%), Management (159 | 10.3%), Computers, Engineering & Science (97 | 6.3%), and Health Diagnosing & Treating (65 | 4.2%).
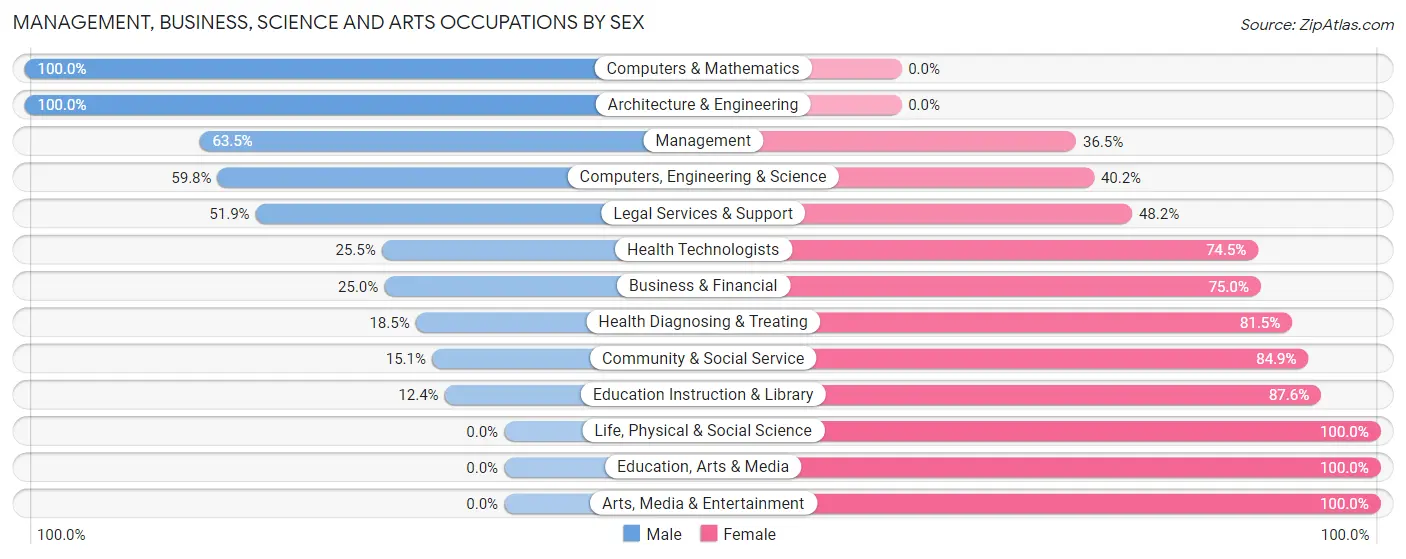
Management, Business, Science and Arts Occupations by Sex
Within the Management, Business, Science and Arts occupations in Florida, the most male-oriented occupations are Computers & Mathematics (100.0%), Architecture & Engineering (100.0%), and Management (63.5%), while the most female-oriented occupations are Life, Physical & Social Science (100.0%), Education, Arts & Media (100.0%), and Arts, Media & Entertainment (100.0%).
| Occupation | Male | Female |
| Management | 101 (63.5%) | 58 (36.5%) |
| Business & Financial | 12 (25.0%) | 36 (75.0%) |
| Computers, Engineering & Science | 58 (59.8%) | 39 (40.2%) |
| Computers & Mathematics | 53 (100.0%) | 0 (0.0%) |
| Architecture & Engineering | 5 (100.0%) | 0 (0.0%) |
| Life, Physical & Social Science | 0 (0.0%) | 39 (100.0%) |
| Community & Social Service | 36 (15.1%) | 203 (84.9%) |
| Education, Arts & Media | 0 (0.0%) | 16 (100.0%) |
| Legal Services & Support | 14 (51.8%) | 13 (48.1%) |
| Education Instruction & Library | 22 (12.4%) | 155 (87.6%) |
| Arts, Media & Entertainment | 0 (0.0%) | 19 (100.0%) |
| Health Diagnosing & Treating | 12 (18.5%) | 53 (81.5%) |
| Health Technologists | 12 (25.5%) | 35 (74.5%) |
| Total (Category) | 219 (36.0%) | 389 (64.0%) |
| Total (Overall) | 788 (51.2%) | 750 (48.8%) |
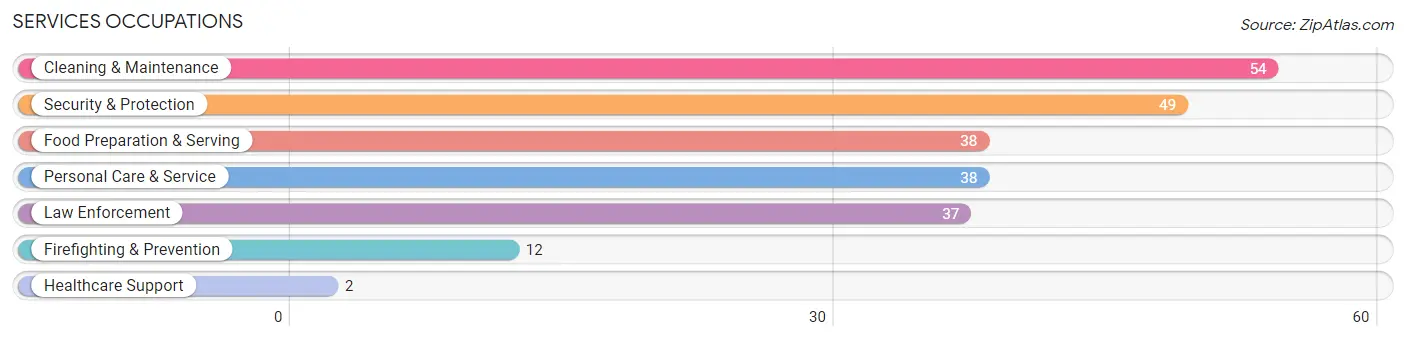
Services Occupations
The most common Services occupations in Florida are Cleaning & Maintenance (54 | 3.5%), Security & Protection (49 | 3.2%), Food Preparation & Serving (38 | 2.5%), Personal Care & Service (38 | 2.5%), and Law Enforcement (37 | 2.4%).
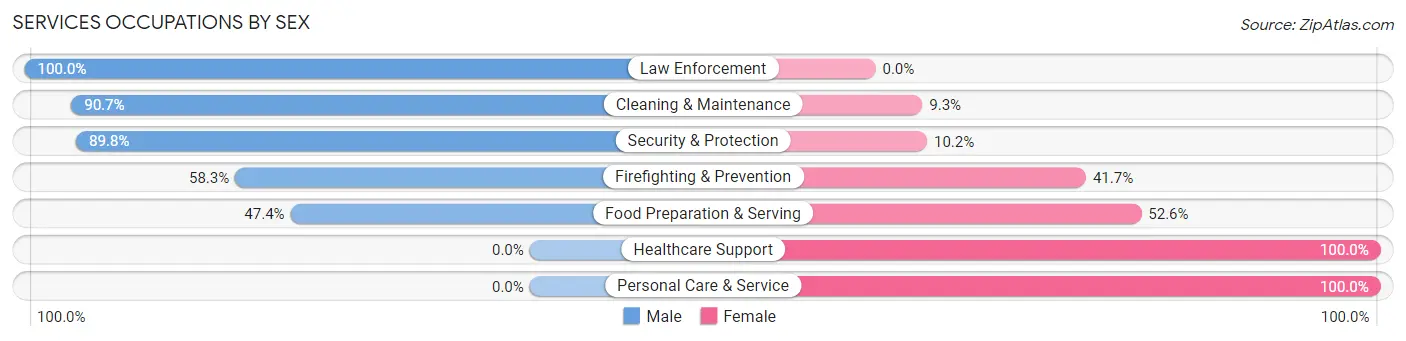
Services Occupations by Sex
Within the Services occupations in Florida, the most male-oriented occupations are Law Enforcement (100.0%), Cleaning & Maintenance (90.7%), and Security & Protection (89.8%), while the most female-oriented occupations are Healthcare Support (100.0%), Personal Care & Service (100.0%), and Food Preparation & Serving (52.6%).
| Occupation | Male | Female |
| Healthcare Support | 0 (0.0%) | 2 (100.0%) |
| Security & Protection | 44 (89.8%) | 5 (10.2%) |
| Firefighting & Prevention | 7 (58.3%) | 5 (41.7%) |
| Law Enforcement | 37 (100.0%) | 0 (0.0%) |
| Food Preparation & Serving | 18 (47.4%) | 20 (52.6%) |
| Cleaning & Maintenance | 49 (90.7%) | 5 (9.3%) |
| Personal Care & Service | 0 (0.0%) | 38 (100.0%) |
| Total (Category) | 111 (61.3%) | 70 (38.7%) |
| Total (Overall) | 788 (51.2%) | 750 (48.8%) |
Sales and Office Occupations
The most common Sales and Office occupations in Florida are Office & Administration (178 | 11.6%), and Sales & Related (159 | 10.3%).
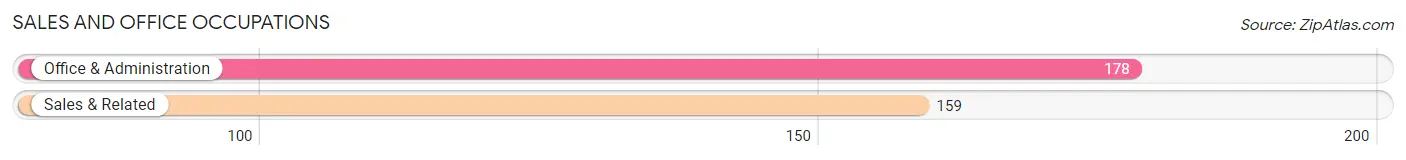
Sales and Office Occupations by Sex

| Occupation | Male | Female |
| Sales & Related | 111 (69.8%) | 48 (30.2%) |
| Office & Administration | 21 (11.8%) | 157 (88.2%) |
| Total (Category) | 132 (39.2%) | 205 (60.8%) |
| Total (Overall) | 788 (51.2%) | 750 (48.8%) |
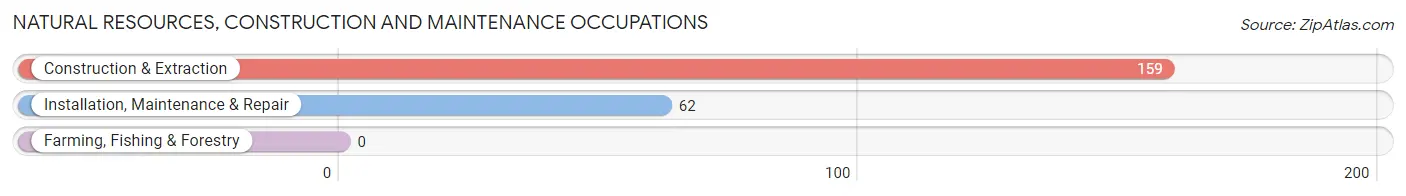
Natural Resources, Construction and Maintenance Occupations
The most common Natural Resources, Construction and Maintenance occupations in Florida are Construction & Extraction (159 | 10.3%), and Installation, Maintenance & Repair (62 | 4.0%).
Natural Resources, Construction and Maintenance Occupations by Sex
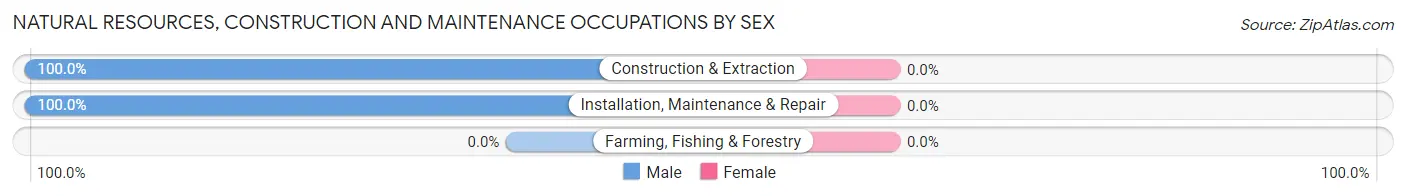
| Occupation | Male | Female |
| Farming, Fishing & Forestry | 0 (0.0%) | 0 (0.0%) |
| Construction & Extraction | 159 (100.0%) | 0 (0.0%) |
| Installation, Maintenance & Repair | 62 (100.0%) | 0 (0.0%) |
| Total (Category) | 221 (100.0%) | 0 (0.0%) |
| Total (Overall) | 788 (51.2%) | 750 (48.8%) |
Production, Transportation and Moving Occupations
The most common Production, Transportation and Moving occupations in Florida are Transportation (86 | 5.6%), Production (60 | 3.9%), and Material Moving (45 | 2.9%).
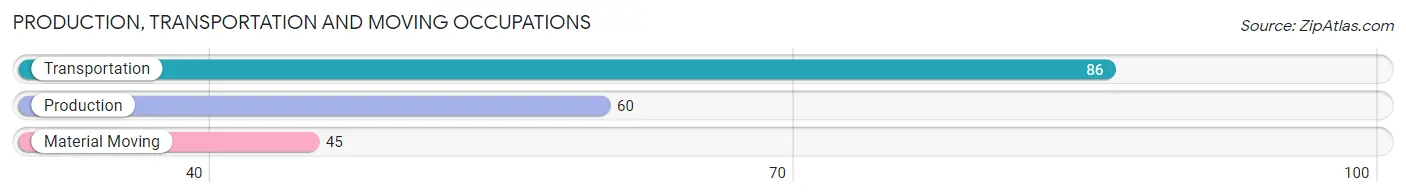
Production, Transportation and Moving Occupations by Sex
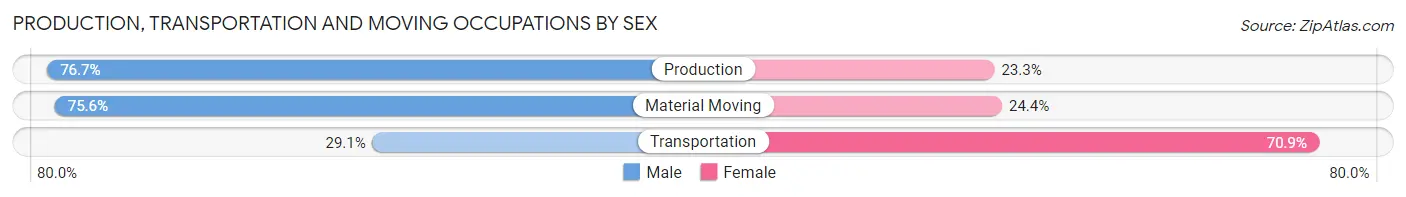
| Occupation | Male | Female |
| Production | 46 (76.7%) | 14 (23.3%) |
| Transportation | 25 (29.1%) | 61 (70.9%) |
| Material Moving | 34 (75.6%) | 11 (24.4%) |
| Total (Category) | 105 (55.0%) | 86 (45.0%) |
| Total (Overall) | 788 (51.2%) | 750 (48.8%) |
Employment Industries by Sex in Florida
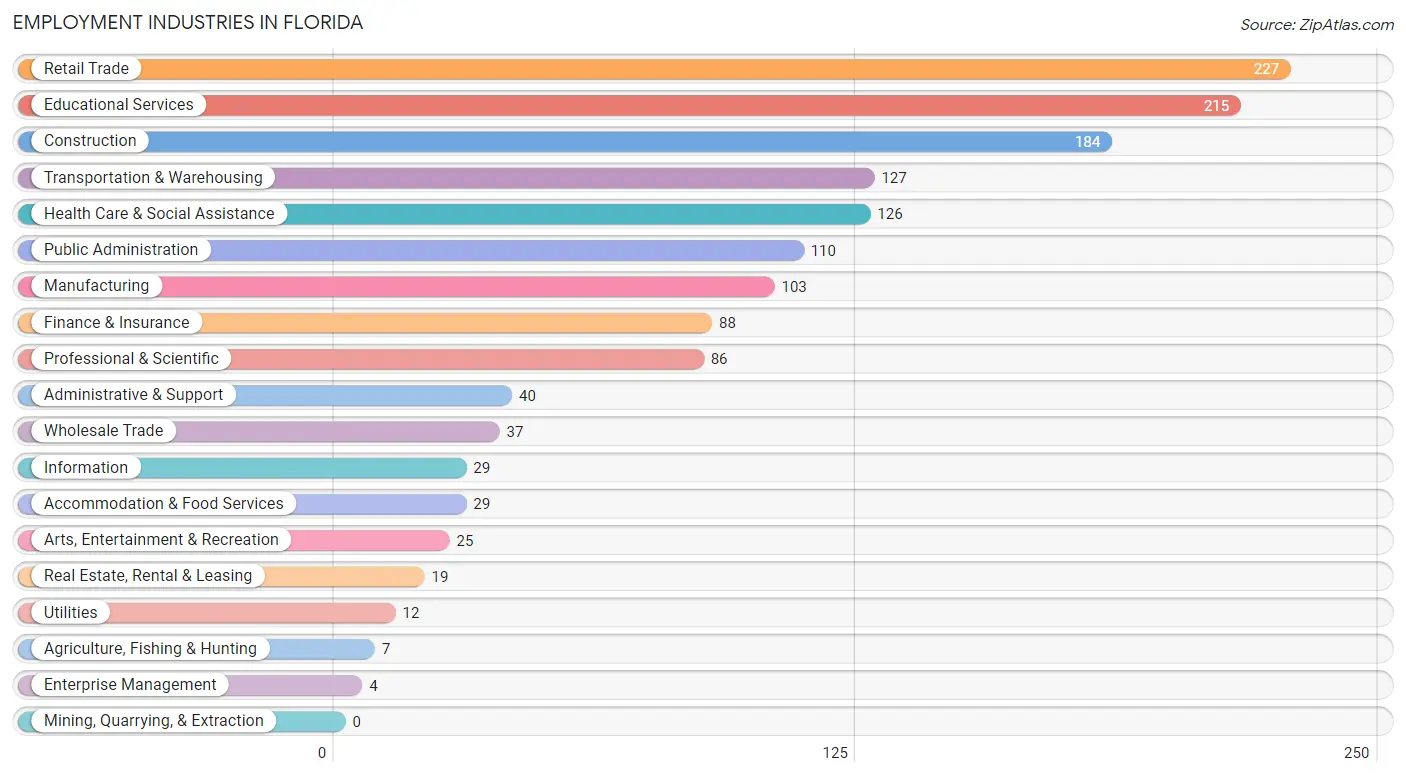
Employment Industries in Florida
The major employment industries in Florida include Retail Trade (227 | 14.8%), Educational Services (215 | 14.0%), Construction (184 | 12.0%), Transportation & Warehousing (127 | 8.3%), and Health Care & Social Assistance (126 | 8.2%).
Employment Industries by Sex in Florida
The Florida industries that see more men than women are Agriculture, Fishing & Hunting (100.0%), Utilities (100.0%), and Enterprise Management (100.0%), whereas the industries that tend to have a higher number of women are Real Estate, Rental & Leasing (100.0%), Educational Services (90.7%), and Health Care & Social Assistance (74.6%).
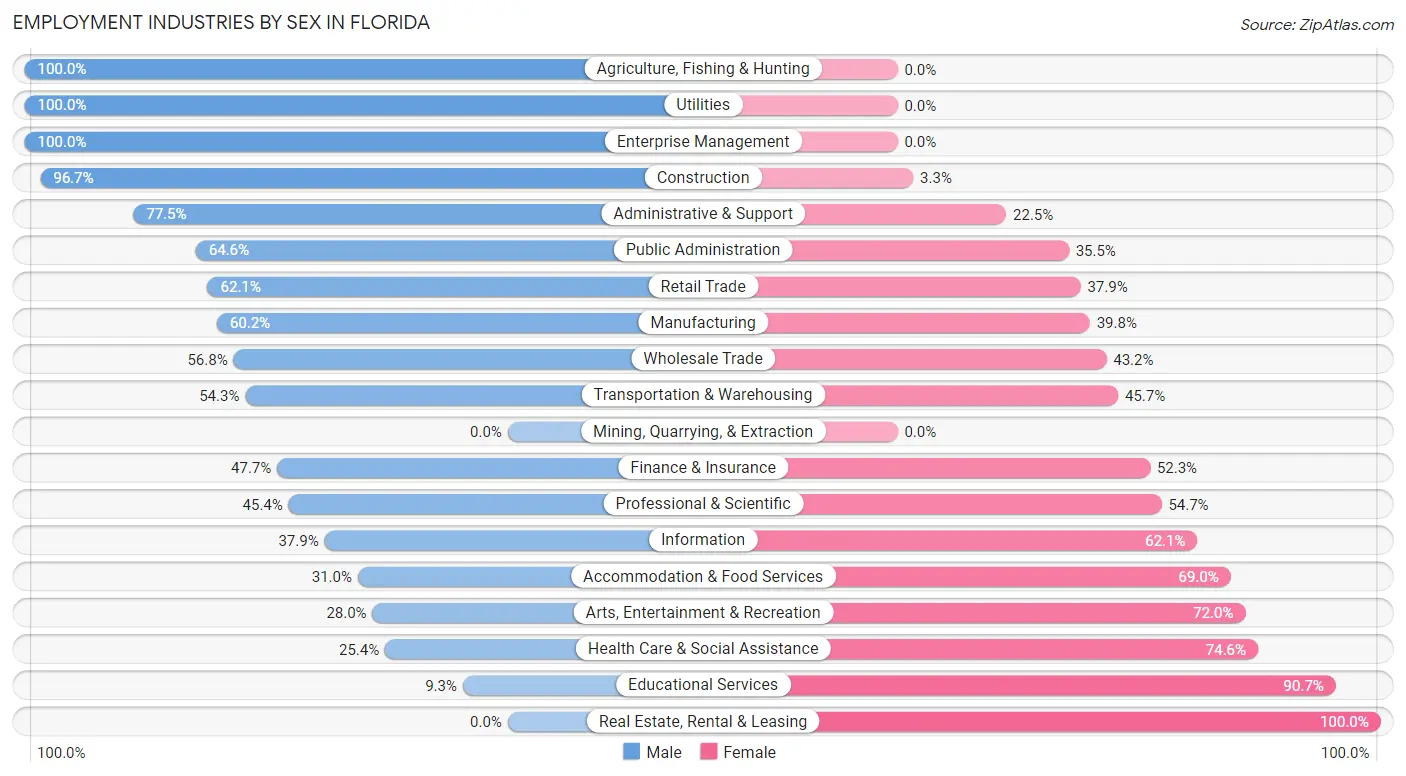
| Industry | Male | Female |
| Agriculture, Fishing & Hunting | 7 (100.0%) | 0 (0.0%) |
| Mining, Quarrying, & Extraction | 0 (0.0%) | 0 (0.0%) |
| Construction | 178 (96.7%) | 6 (3.3%) |
| Manufacturing | 62 (60.2%) | 41 (39.8%) |
| Wholesale Trade | 21 (56.8%) | 16 (43.2%) |
| Retail Trade | 141 (62.1%) | 86 (37.9%) |
| Transportation & Warehousing | 69 (54.3%) | 58 (45.7%) |
| Utilities | 12 (100.0%) | 0 (0.0%) |
| Information | 11 (37.9%) | 18 (62.1%) |
| Finance & Insurance | 42 (47.7%) | 46 (52.3%) |
| Real Estate, Rental & Leasing | 0 (0.0%) | 19 (100.0%) |
| Professional & Scientific | 39 (45.4%) | 47 (54.6%) |
| Enterprise Management | 4 (100.0%) | 0 (0.0%) |
| Administrative & Support | 31 (77.5%) | 9 (22.5%) |
| Educational Services | 20 (9.3%) | 195 (90.7%) |
| Health Care & Social Assistance | 32 (25.4%) | 94 (74.6%) |
| Arts, Entertainment & Recreation | 7 (28.0%) | 18 (72.0%) |
| Accommodation & Food Services | 9 (31.0%) | 20 (69.0%) |
| Public Administration | 71 (64.5%) | 39 (35.4%) |
| Total | 788 (51.2%) | 750 (48.8%) |
Education in Florida
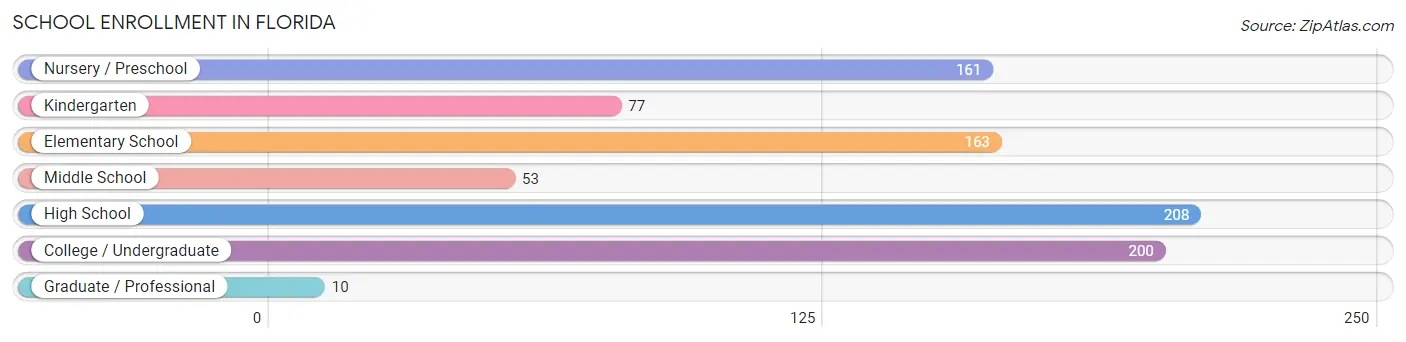
School Enrollment in Florida
The most common levels of schooling among the 872 students in Florida are high school (208 | 23.8%), college / undergraduate (200 | 22.9%), and elementary school (163 | 18.7%).
| School Level | # Students | % Students |
| Nursery / Preschool | 161 | 18.5% |
| Kindergarten | 77 | 8.8% |
| Elementary School | 163 | 18.7% |
| Middle School | 53 | 6.1% |
| High School | 208 | 23.8% |
| College / Undergraduate | 200 | 22.9% |
| Graduate / Professional | 10 | 1.1% |
| Total | 872 | 100.0% |
School Enrollment by Age by Funding Source in Florida
Out of a total of 872 students who are enrolled in schools in Florida, 223 (25.6%) attend a private institution, while the remaining 649 (74.4%) are enrolled in public schools. The age group of 3 to 4 year olds has the highest likelihood of being enrolled in private schools, with 112 (59.9% in the age bracket) enrolled. Conversely, the age group of 18 to 19 year olds has the lowest likelihood of being enrolled in a private school, with 93 (100.0% in the age bracket) attending a public institution.
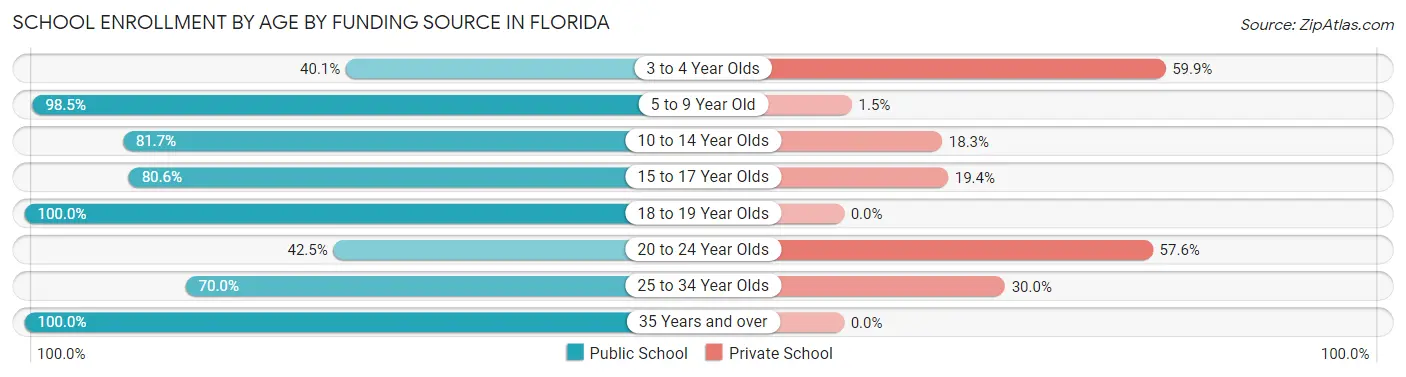
| Age Bracket | Public School | Private School |
| 3 to 4 Year Olds | 75 (40.1%) | 112 (59.9%) |
| 5 to 9 Year Old | 200 (98.5%) | 3 (1.5%) |
| 10 to 14 Year Olds | 67 (81.7%) | 15 (18.3%) |
| 15 to 17 Year Olds | 108 (80.6%) | 26 (19.4%) |
| 18 to 19 Year Olds | 93 (100.0%) | 0 (0.0%) |
| 20 to 24 Year Olds | 45 (42.4%) | 61 (57.6%) |
| 25 to 34 Year Olds | 14 (70.0%) | 6 (30.0%) |
| 35 Years and over | 47 (100.0%) | 0 (0.0%) |
| Total | 649 (74.4%) | 223 (25.6%) |
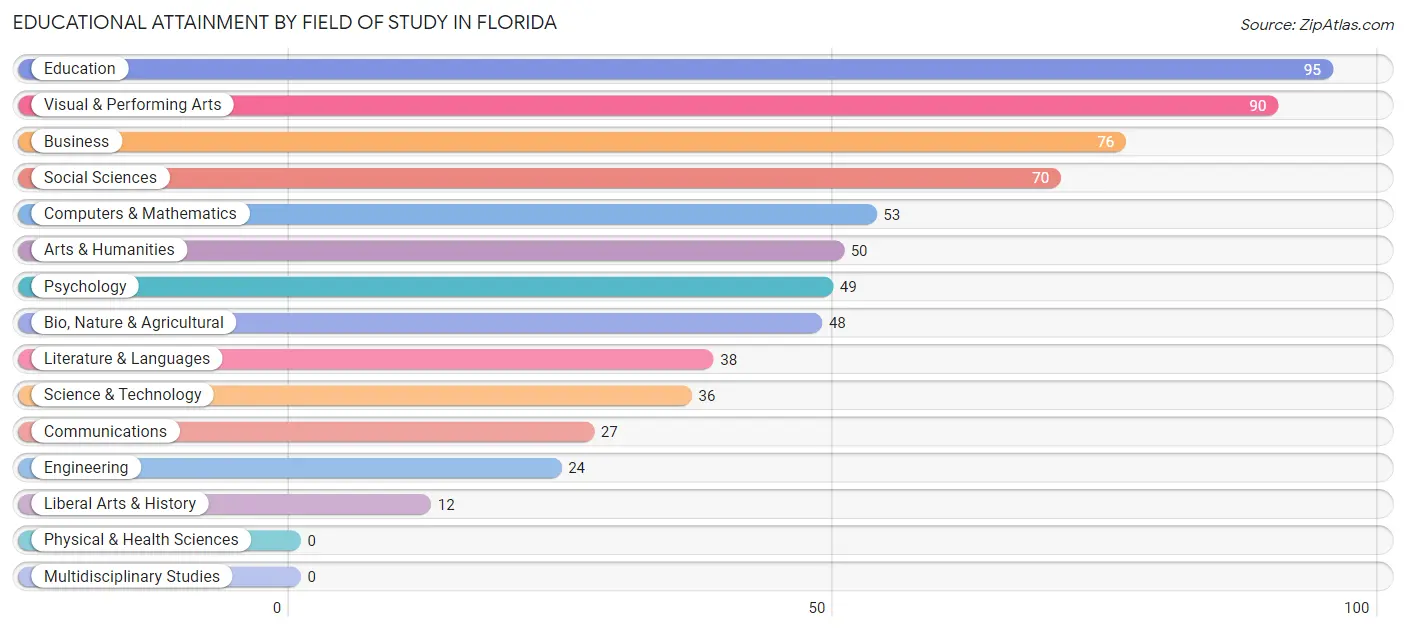
Educational Attainment by Field of Study in Florida
Education (95 | 14.2%), visual & performing arts (90 | 13.5%), business (76 | 11.4%), social sciences (70 | 10.5%), and computers & mathematics (53 | 7.9%) are the most common fields of study among 668 individuals in Florida who have obtained a bachelor's degree or higher.
| Field of Study | # Graduates | % Graduates |
| Computers & Mathematics | 53 | 7.9% |
| Bio, Nature & Agricultural | 48 | 7.2% |
| Physical & Health Sciences | 0 | 0.0% |
| Psychology | 49 | 7.3% |
| Social Sciences | 70 | 10.5% |
| Engineering | 24 | 3.6% |
| Multidisciplinary Studies | 0 | 0.0% |
| Science & Technology | 36 | 5.4% |
| Business | 76 | 11.4% |
| Education | 95 | 14.2% |
| Literature & Languages | 38 | 5.7% |
| Liberal Arts & History | 12 | 1.8% |
| Visual & Performing Arts | 90 | 13.5% |
| Communications | 27 | 4.0% |
| Arts & Humanities | 50 | 7.5% |
| Total | 668 | 100.0% |
Transportation & Commute in Florida
Vehicle Availability by Sex in Florida
The most prevalent vehicle ownership categories in Florida are males with 2 vehicles (379, accounting for 46.5%) and females with 2 vehicles (319, making up 50.9%).
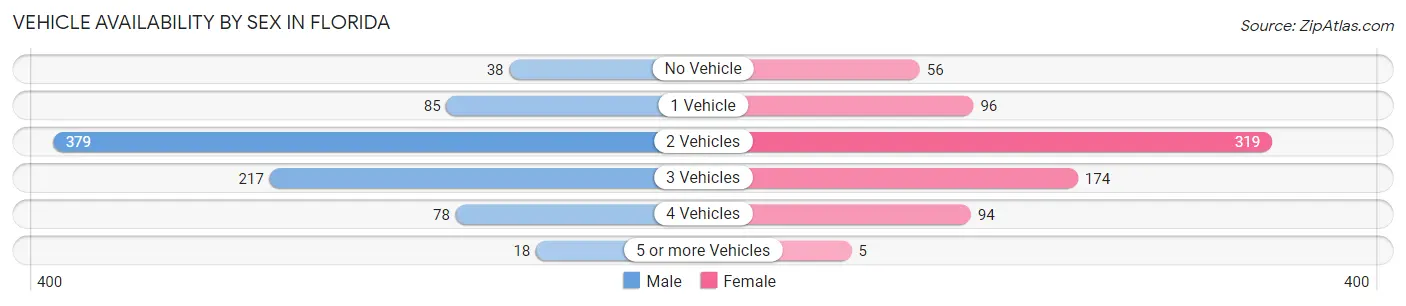
| Vehicles Available | Male | Female |
| No Vehicle | 38 (4.7%) | 56 (7.5%) |
| 1 Vehicle | 85 (10.4%) | 96 (12.9%) |
| 2 Vehicles | 379 (46.5%) | 319 (42.9%) |
| 3 Vehicles | 217 (26.6%) | 174 (23.4%) |
| 4 Vehicles | 78 (9.6%) | 94 (12.6%) |
| 5 or more Vehicles | 18 (2.2%) | 5 (0.7%) |
| Total | 815 (100.0%) | 744 (100.0%) |
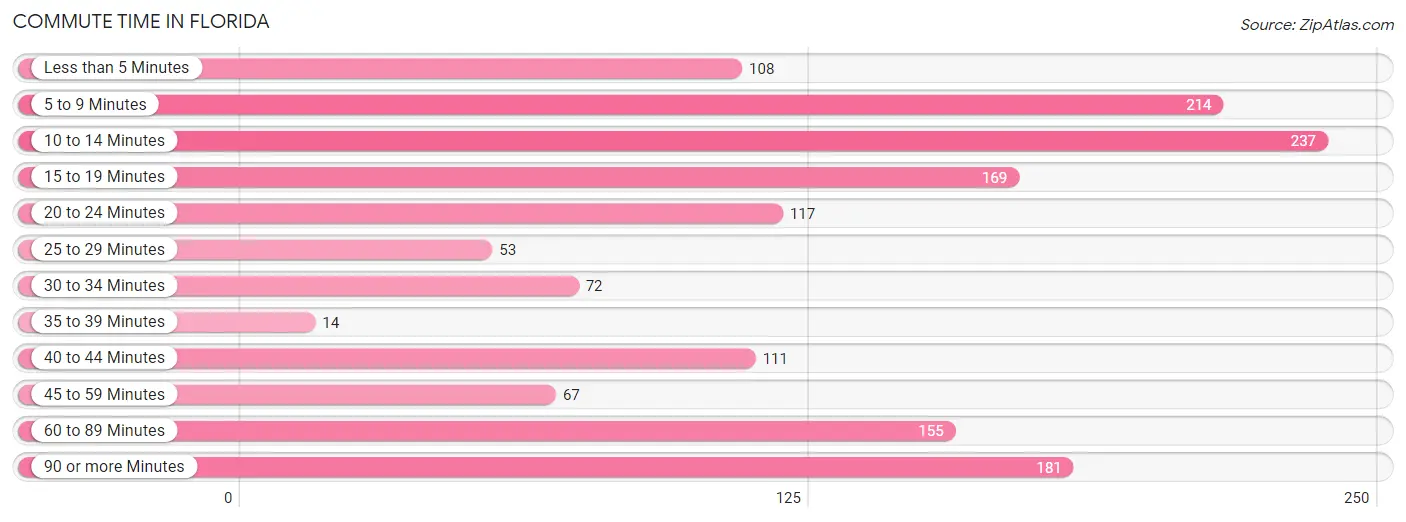
Commute Time in Florida
The most frequently occuring commute durations in Florida are 10 to 14 minutes (237 commuters, 15.8%), 5 to 9 minutes (214 commuters, 14.3%), and 90 or more minutes (181 commuters, 12.1%).
| Commute Time | # Commuters | % Commuters |
| Less than 5 Minutes | 108 | 7.2% |
| 5 to 9 Minutes | 214 | 14.3% |
| 10 to 14 Minutes | 237 | 15.8% |
| 15 to 19 Minutes | 169 | 11.3% |
| 20 to 24 Minutes | 117 | 7.8% |
| 25 to 29 Minutes | 53 | 3.5% |
| 30 to 34 Minutes | 72 | 4.8% |
| 35 to 39 Minutes | 14 | 0.9% |
| 40 to 44 Minutes | 111 | 7.4% |
| 45 to 59 Minutes | 67 | 4.5% |
| 60 to 89 Minutes | 155 | 10.3% |
| 90 or more Minutes | 181 | 12.1% |
Commute Time by Sex in Florida
The most common commute times in Florida are 10 to 14 minutes (122 commuters, 15.5%) for males and 5 to 9 minutes (154 commuters, 21.6%) for females.
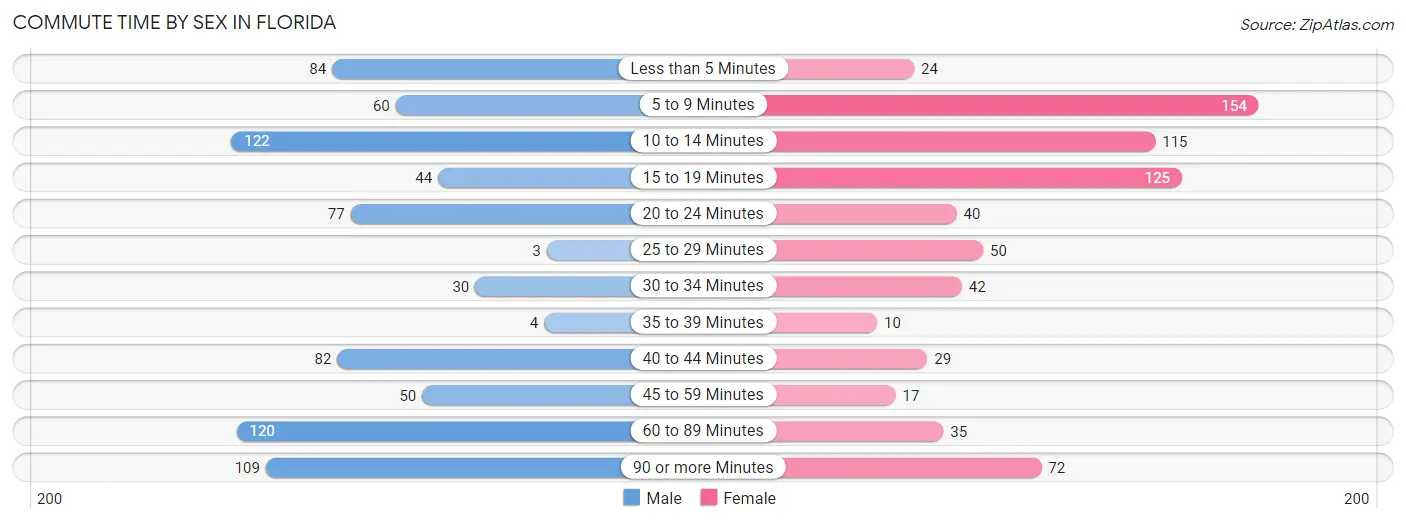
| Commute Time | Male | Female |
| Less than 5 Minutes | 84 (10.7%) | 24 (3.4%) |
| 5 to 9 Minutes | 60 (7.6%) | 154 (21.6%) |
| 10 to 14 Minutes | 122 (15.5%) | 115 (16.1%) |
| 15 to 19 Minutes | 44 (5.6%) | 125 (17.5%) |
| 20 to 24 Minutes | 77 (9.8%) | 40 (5.6%) |
| 25 to 29 Minutes | 3 (0.4%) | 50 (7.0%) |
| 30 to 34 Minutes | 30 (3.8%) | 42 (5.9%) |
| 35 to 39 Minutes | 4 (0.5%) | 10 (1.4%) |
| 40 to 44 Minutes | 82 (10.4%) | 29 (4.1%) |
| 45 to 59 Minutes | 50 (6.4%) | 17 (2.4%) |
| 60 to 89 Minutes | 120 (15.3%) | 35 (4.9%) |
| 90 or more Minutes | 109 (13.9%) | 72 (10.1%) |
Time of Departure to Work by Sex in Florida
The most frequent times of departure to work in Florida are 7:00 AM to 7:29 AM (181, 23.1%) for males and 7:00 AM to 7:29 AM (122, 17.1%) for females.
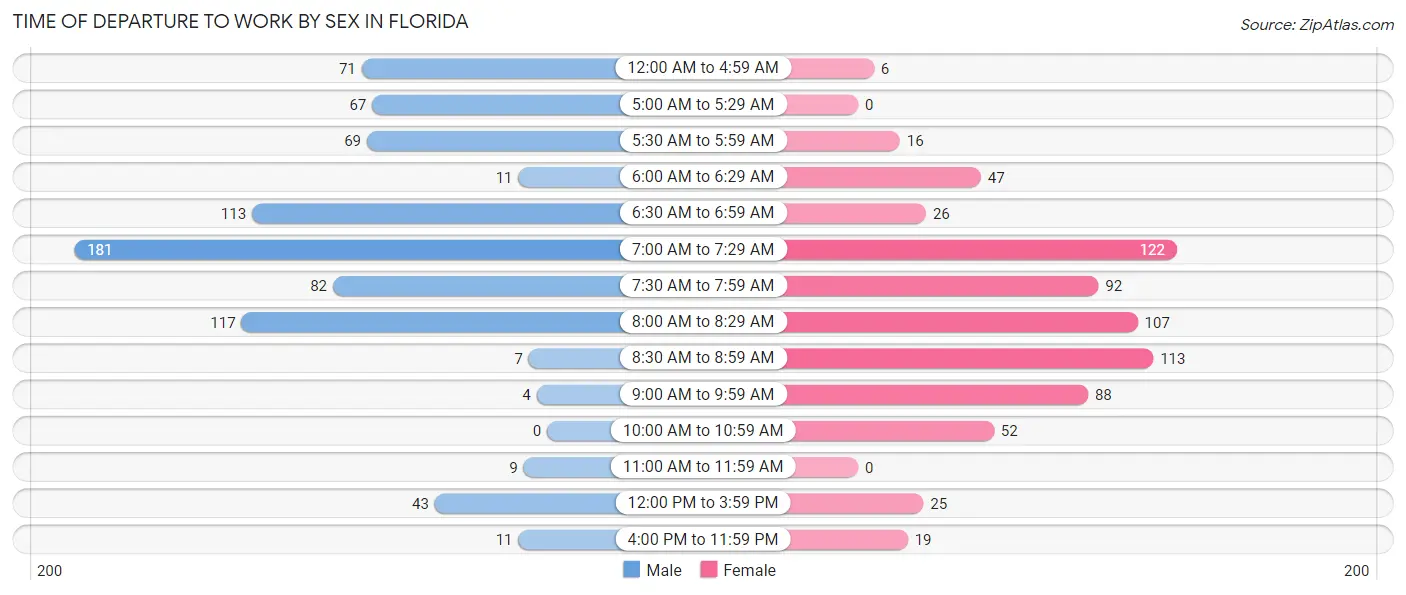
| Time of Departure | Male | Female |
| 12:00 AM to 4:59 AM | 71 (9.0%) | 6 (0.8%) |
| 5:00 AM to 5:29 AM | 67 (8.5%) | 0 (0.0%) |
| 5:30 AM to 5:59 AM | 69 (8.8%) | 16 (2.2%) |
| 6:00 AM to 6:29 AM | 11 (1.4%) | 47 (6.6%) |
| 6:30 AM to 6:59 AM | 113 (14.4%) | 26 (3.6%) |
| 7:00 AM to 7:29 AM | 181 (23.1%) | 122 (17.1%) |
| 7:30 AM to 7:59 AM | 82 (10.4%) | 92 (12.9%) |
| 8:00 AM to 8:29 AM | 117 (14.9%) | 107 (15.0%) |
| 8:30 AM to 8:59 AM | 7 (0.9%) | 113 (15.9%) |
| 9:00 AM to 9:59 AM | 4 (0.5%) | 88 (12.3%) |
| 10:00 AM to 10:59 AM | 0 (0.0%) | 52 (7.3%) |
| 11:00 AM to 11:59 AM | 9 (1.1%) | 0 (0.0%) |
| 12:00 PM to 3:59 PM | 43 (5.5%) | 25 (3.5%) |
| 4:00 PM to 11:59 PM | 11 (1.4%) | 19 (2.7%) |
| Total | 785 (100.0%) | 713 (100.0%) |
Housing Occupancy in Florida
Occupancy by Ownership in Florida
Of the total 943 dwellings in Florida, owner-occupied units account for 772 (81.9%), while renter-occupied units make up 171 (18.1%).
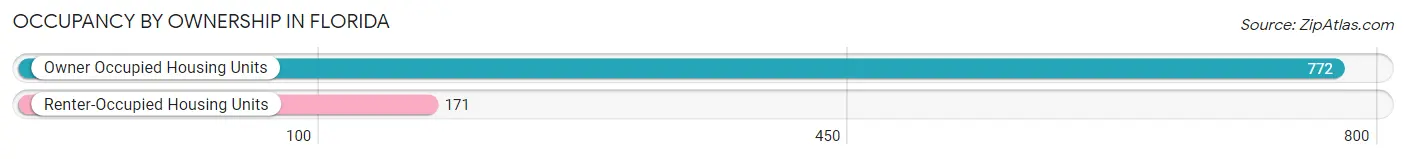
| Occupancy | # Housing Units | % Housing Units |
| Owner Occupied Housing Units | 772 | 81.9% |
| Renter-Occupied Housing Units | 171 | 18.1% |
| Total Occupied Housing Units | 943 | 100.0% |
Occupancy by Household Size in Florida
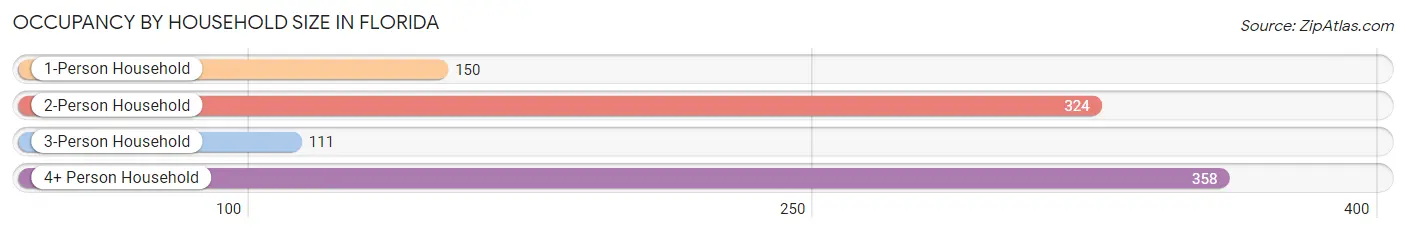
| Household Size | # Housing Units | % Housing Units |
| 1-Person Household | 150 | 15.9% |
| 2-Person Household | 324 | 34.4% |
| 3-Person Household | 111 | 11.8% |
| 4+ Person Household | 358 | 38.0% |
| Total Housing Units | 943 | 100.0% |
Occupancy by Ownership by Household Size in Florida
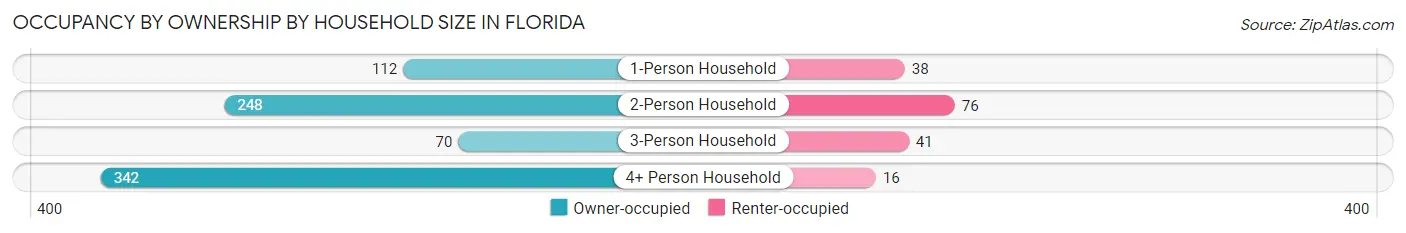
| Household Size | Owner-occupied | Renter-occupied |
| 1-Person Household | 112 (74.7%) | 38 (25.3%) |
| 2-Person Household | 248 (76.5%) | 76 (23.5%) |
| 3-Person Household | 70 (63.1%) | 41 (36.9%) |
| 4+ Person Household | 342 (95.5%) | 16 (4.5%) |
| Total Housing Units | 772 (81.9%) | 171 (18.1%) |
Occupancy by Educational Attainment in Florida
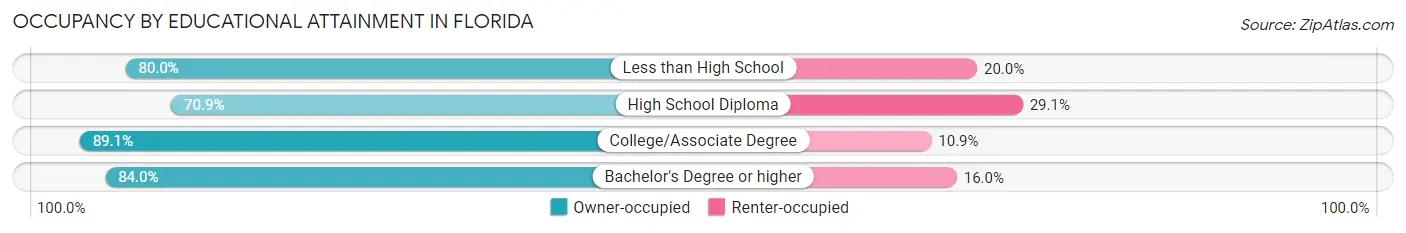
| Household Size | Owner-occupied | Renter-occupied |
| Less than High School | 44 (80.0%) | 11 (20.0%) |
| High School Diploma | 188 (70.9%) | 77 (29.1%) |
| College/Associate Degree | 293 (89.1%) | 36 (10.9%) |
| Bachelor's Degree or higher | 247 (84.0%) | 47 (16.0%) |
Occupancy by Age of Householder in Florida
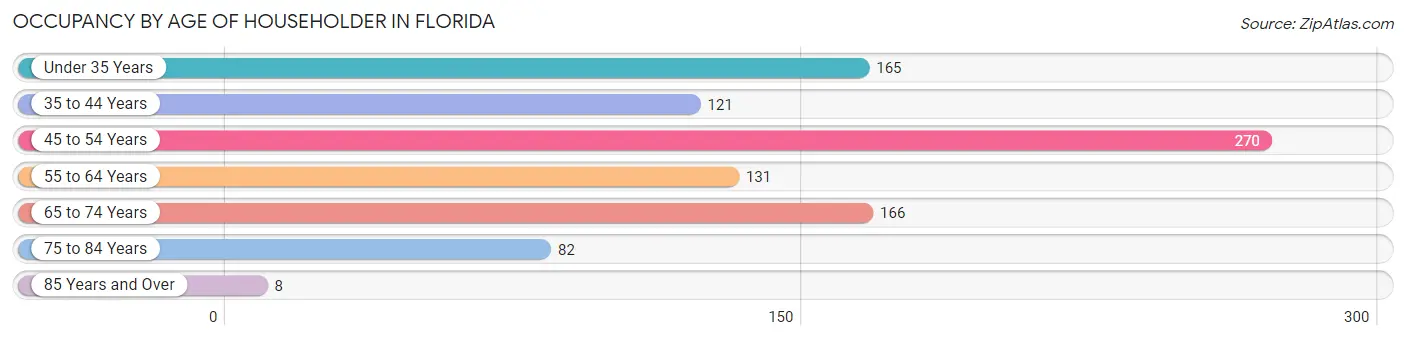
| Age Bracket | # Households | % Households |
| Under 35 Years | 165 | 17.5% |
| 35 to 44 Years | 121 | 12.8% |
| 45 to 54 Years | 270 | 28.6% |
| 55 to 64 Years | 131 | 13.9% |
| 65 to 74 Years | 166 | 17.6% |
| 75 to 84 Years | 82 | 8.7% |
| 85 Years and Over | 8 | 0.9% |
| Total | 943 | 100.0% |
Housing Finances in Florida
Median Income by Occupancy in Florida
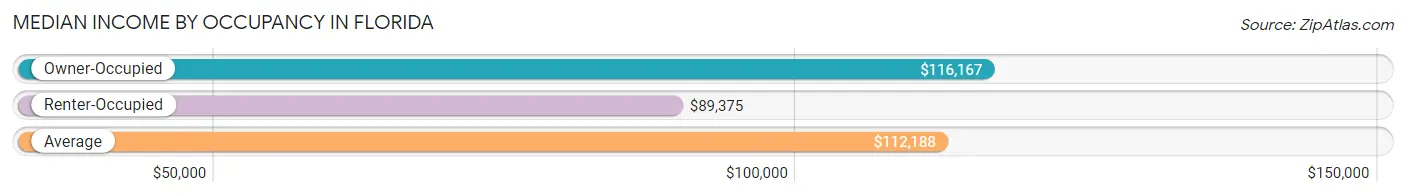
| Occupancy Type | # Households | Median Income |
| Owner-Occupied | 772 (81.9%) | $116,167 |
| Renter-Occupied | 171 (18.1%) | $89,375 |
| Average | 943 (100.0%) | $112,188 |
Occupancy by Householder Income Bracket in Florida
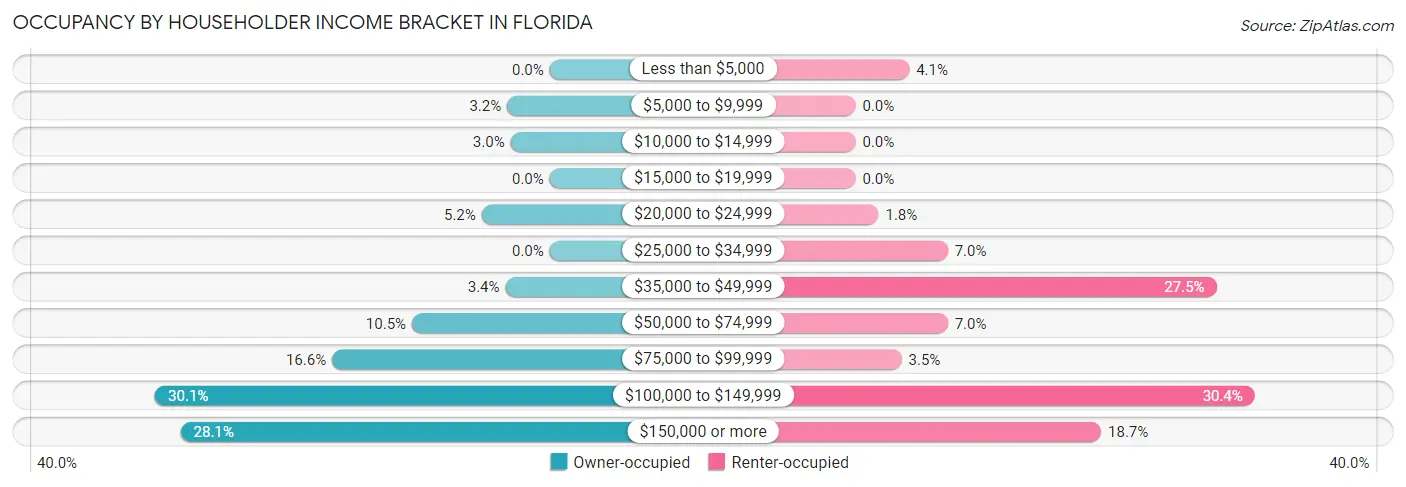
| Income Bracket | Owner-occupied | Renter-occupied |
| Less than $5,000 | 0 (0.0%) | 7 (4.1%) |
| $5,000 to $9,999 | 25 (3.2%) | 0 (0.0%) |
| $10,000 to $14,999 | 23 (3.0%) | 0 (0.0%) |
| $15,000 to $19,999 | 0 (0.0%) | 0 (0.0%) |
| $20,000 to $24,999 | 40 (5.2%) | 3 (1.8%) |
| $25,000 to $34,999 | 0 (0.0%) | 12 (7.0%) |
| $35,000 to $49,999 | 26 (3.4%) | 47 (27.5%) |
| $50,000 to $74,999 | 81 (10.5%) | 12 (7.0%) |
| $75,000 to $99,999 | 128 (16.6%) | 6 (3.5%) |
| $100,000 to $149,999 | 232 (30.0%) | 52 (30.4%) |
| $150,000 or more | 217 (28.1%) | 32 (18.7%) |
| Total | 772 (100.0%) | 171 (100.0%) |
Monthly Housing Cost Tiers in Florida
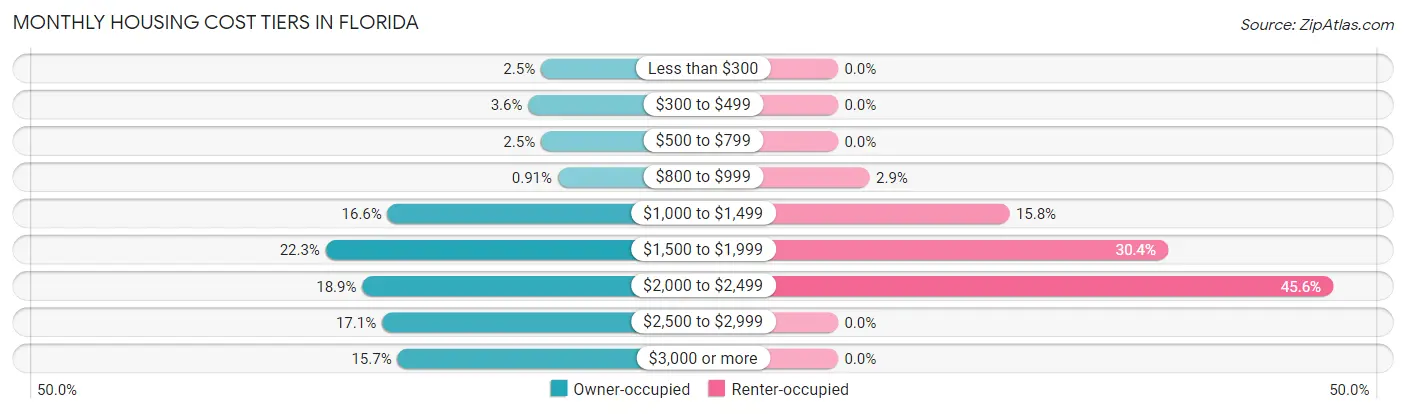
| Monthly Cost | Owner-occupied | Renter-occupied |
| Less than $300 | 19 (2.5%) | 0 (0.0%) |
| $300 to $499 | 28 (3.6%) | 0 (0.0%) |
| $500 to $799 | 19 (2.5%) | 0 (0.0%) |
| $800 to $999 | 7 (0.9%) | 5 (2.9%) |
| $1,000 to $1,499 | 128 (16.6%) | 27 (15.8%) |
| $1,500 to $1,999 | 172 (22.3%) | 52 (30.4%) |
| $2,000 to $2,499 | 146 (18.9%) | 78 (45.6%) |
| $2,500 to $2,999 | 132 (17.1%) | 0 (0.0%) |
| $3,000 or more | 121 (15.7%) | 0 (0.0%) |
| Total | 772 (100.0%) | 171 (100.0%) |
Physical Housing Characteristics in Florida
Housing Structures in Florida
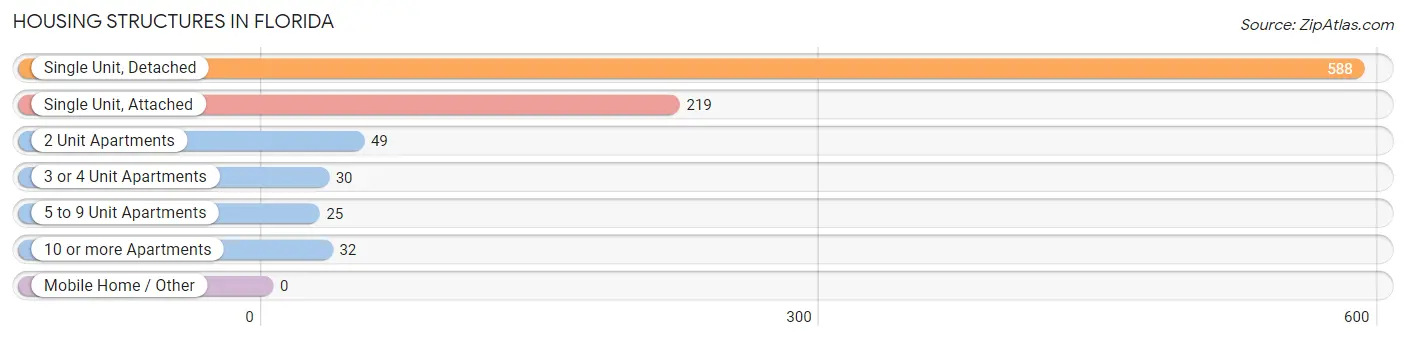
| Structure Type | # Housing Units | % Housing Units |
| Single Unit, Detached | 588 | 62.4% |
| Single Unit, Attached | 219 | 23.2% |
| 2 Unit Apartments | 49 | 5.2% |
| 3 or 4 Unit Apartments | 30 | 3.2% |
| 5 to 9 Unit Apartments | 25 | 2.6% |
| 10 or more Apartments | 32 | 3.4% |
| Mobile Home / Other | 0 | 0.0% |
| Total | 943 | 100.0% |
Housing Structures by Occupancy in Florida
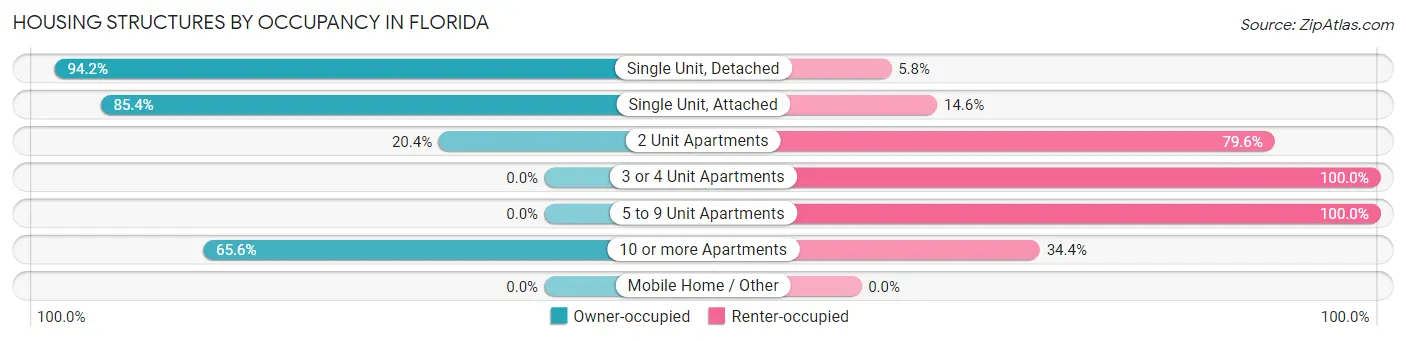
| Structure Type | Owner-occupied | Renter-occupied |
| Single Unit, Detached | 554 (94.2%) | 34 (5.8%) |
| Single Unit, Attached | 187 (85.4%) | 32 (14.6%) |
| 2 Unit Apartments | 10 (20.4%) | 39 (79.6%) |
| 3 or 4 Unit Apartments | 0 (0.0%) | 30 (100.0%) |
| 5 to 9 Unit Apartments | 0 (0.0%) | 25 (100.0%) |
| 10 or more Apartments | 21 (65.6%) | 11 (34.4%) |
| Mobile Home / Other | 0 (0.0%) | 0 (0.0%) |
| Total | 772 (81.9%) | 171 (18.1%) |
Housing Structures by Number of Rooms in Florida
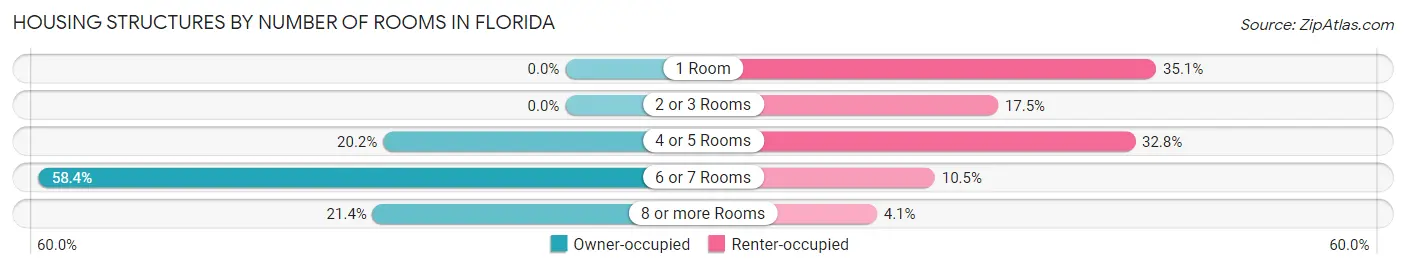
| Number of Rooms | Owner-occupied | Renter-occupied |
| 1 Room | 0 (0.0%) | 60 (35.1%) |
| 2 or 3 Rooms | 0 (0.0%) | 30 (17.5%) |
| 4 or 5 Rooms | 156 (20.2%) | 56 (32.8%) |
| 6 or 7 Rooms | 451 (58.4%) | 18 (10.5%) |
| 8 or more Rooms | 165 (21.4%) | 7 (4.1%) |
| Total | 772 (100.0%) | 171 (100.0%) |
Housing Structure by Heating Type in Florida
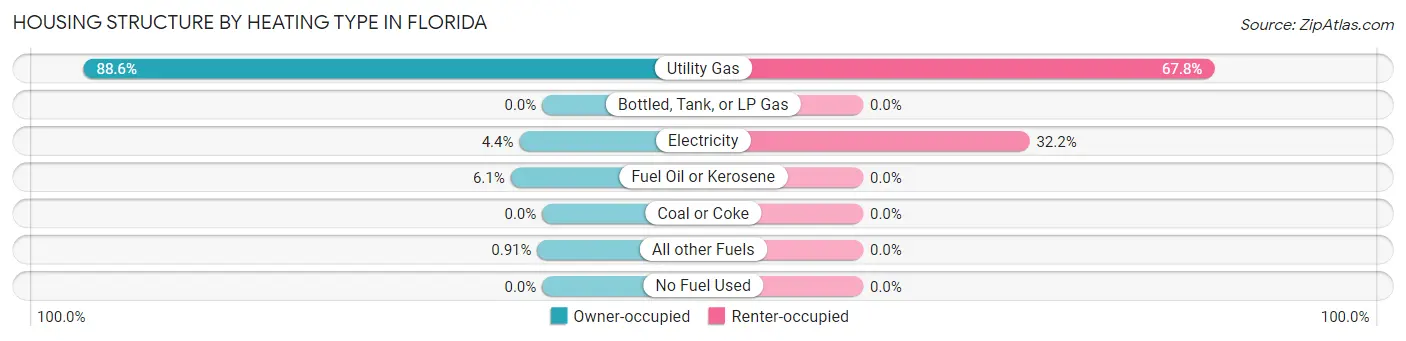
| Heating Type | Owner-occupied | Renter-occupied |
| Utility Gas | 684 (88.6%) | 116 (67.8%) |
| Bottled, Tank, or LP Gas | 0 (0.0%) | 0 (0.0%) |
| Electricity | 34 (4.4%) | 55 (32.2%) |
| Fuel Oil or Kerosene | 47 (6.1%) | 0 (0.0%) |
| Coal or Coke | 0 (0.0%) | 0 (0.0%) |
| All other Fuels | 7 (0.9%) | 0 (0.0%) |
| No Fuel Used | 0 (0.0%) | 0 (0.0%) |
| Total | 772 (100.0%) | 171 (100.0%) |
Household Vehicle Usage in Florida
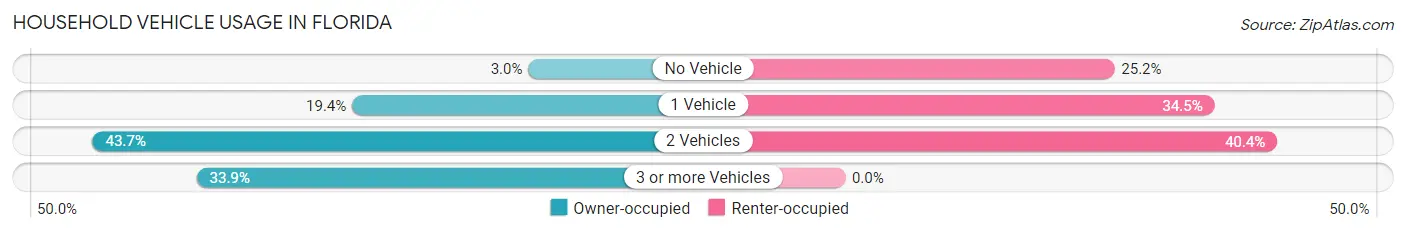
| Vehicles per Household | Owner-occupied | Renter-occupied |
| No Vehicle | 23 (3.0%) | 43 (25.2%) |
| 1 Vehicle | 150 (19.4%) | 59 (34.5%) |
| 2 Vehicles | 337 (43.6%) | 69 (40.4%) |
| 3 or more Vehicles | 262 (33.9%) | 0 (0.0%) |
| Total | 772 (100.0%) | 171 (100.0%) |
Real Estate & Mortgages in Florida
Real Estate and Mortgage Overview in Florida
| Characteristic | Without Mortgage | With Mortgage |
| Housing Units | 235 | 537 |
| Median Property Value | $341,700 | $330,800 |
| Median Household Income | $81,681 | $176 |
| Monthly Housing Costs | $1,229 | $121 |
| Real Estate Taxes | $7,844 | $0 |
Property Value by Mortgage Status in Florida
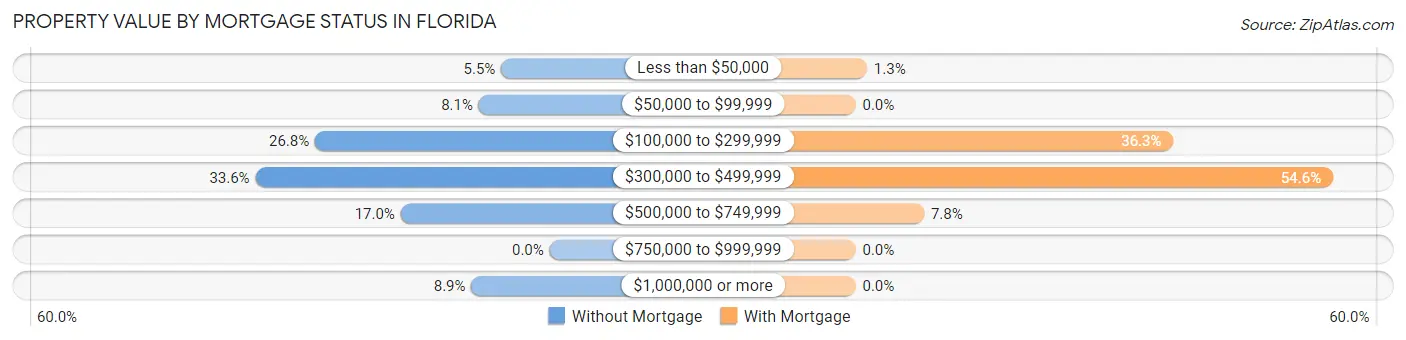
| Property Value | Without Mortgage | With Mortgage |
| Less than $50,000 | 13 (5.5%) | 7 (1.3%) |
| $50,000 to $99,999 | 19 (8.1%) | 0 (0.0%) |
| $100,000 to $299,999 | 63 (26.8%) | 195 (36.3%) |
| $300,000 to $499,999 | 79 (33.6%) | 293 (54.6%) |
| $500,000 to $749,999 | 40 (17.0%) | 42 (7.8%) |
| $750,000 to $999,999 | 0 (0.0%) | 0 (0.0%) |
| $1,000,000 or more | 21 (8.9%) | 0 (0.0%) |
| Total | 235 (100.0%) | 537 (100.0%) |
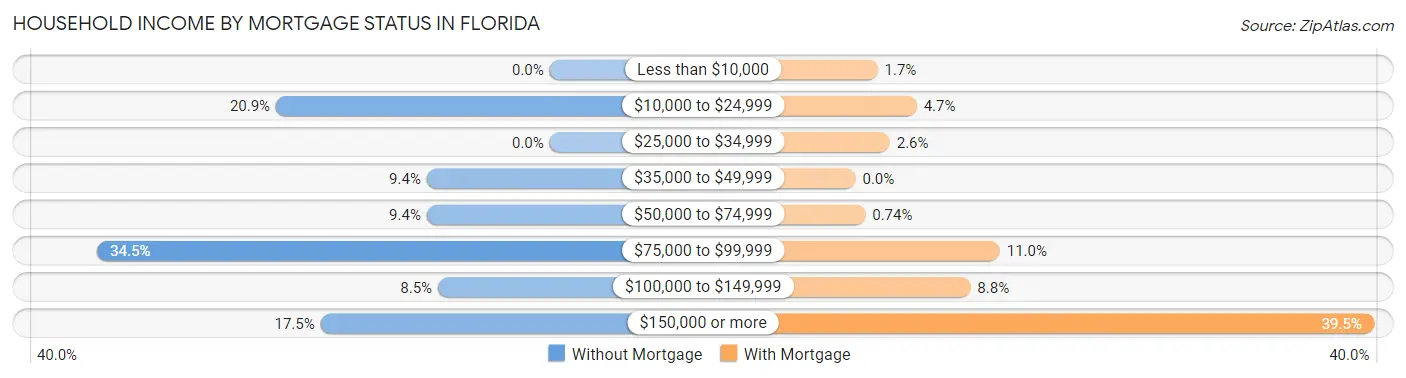
Household Income by Mortgage Status in Florida
| Household Income | Without Mortgage | With Mortgage |
| Less than $10,000 | 0 (0.0%) | 9 (1.7%) |
| $10,000 to $24,999 | 49 (20.8%) | 25 (4.7%) |
| $25,000 to $34,999 | 0 (0.0%) | 14 (2.6%) |
| $35,000 to $49,999 | 22 (9.4%) | 0 (0.0%) |
| $50,000 to $74,999 | 22 (9.4%) | 4 (0.7%) |
| $75,000 to $99,999 | 81 (34.5%) | 59 (11.0%) |
| $100,000 to $149,999 | 20 (8.5%) | 47 (8.7%) |
| $150,000 or more | 41 (17.4%) | 212 (39.5%) |
| Total | 235 (100.0%) | 537 (100.0%) |
Property Value to Household Income Ratio in Florida
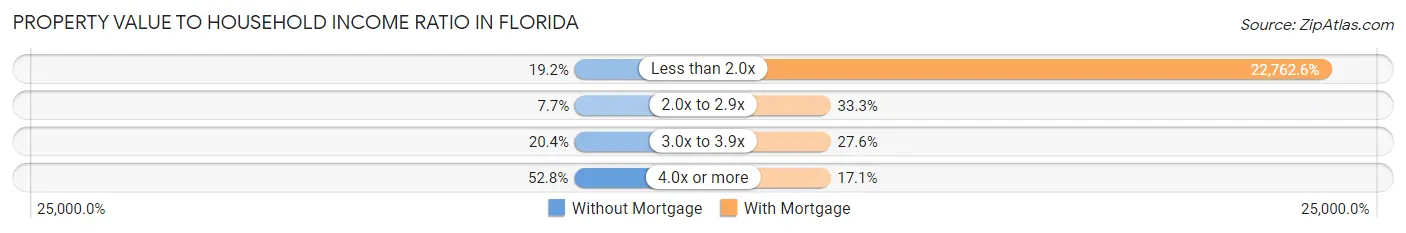
| Value-to-Income Ratio | Without Mortgage | With Mortgage |
| Less than 2.0x | 45 (19.2%) | 122,235 (22,762.6%) |
| 2.0x to 2.9x | 18 (7.7%) | 179 (33.3%) |
| 3.0x to 3.9x | 48 (20.4%) | 148 (27.6%) |
| 4.0x or more | 124 (52.8%) | 92 (17.1%) |
| Total | 235 (100.0%) | 537 (100.0%) |
Real Estate Taxes by Mortgage Status in Florida
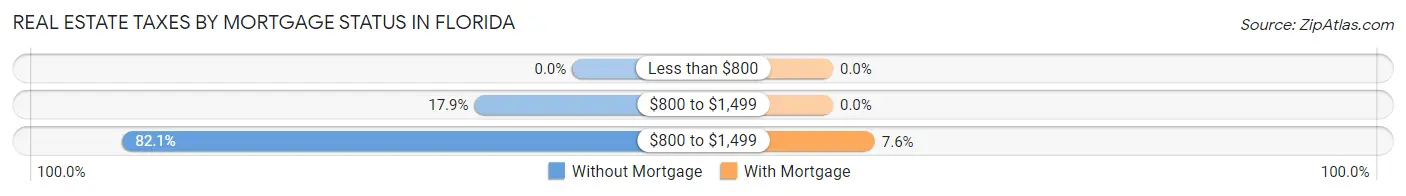
| Property Taxes | Without Mortgage | With Mortgage |
| Less than $800 | 0 (0.0%) | 0 (0.0%) |
| $800 to $1,499 | 42 (17.9%) | 0 (0.0%) |
| $800 to $1,499 | 193 (82.1%) | 41 (7.6%) |
| Total | 235 (100.0%) | 537 (100.0%) |
Health & Disability in Florida
Health Insurance Coverage by Age in Florida
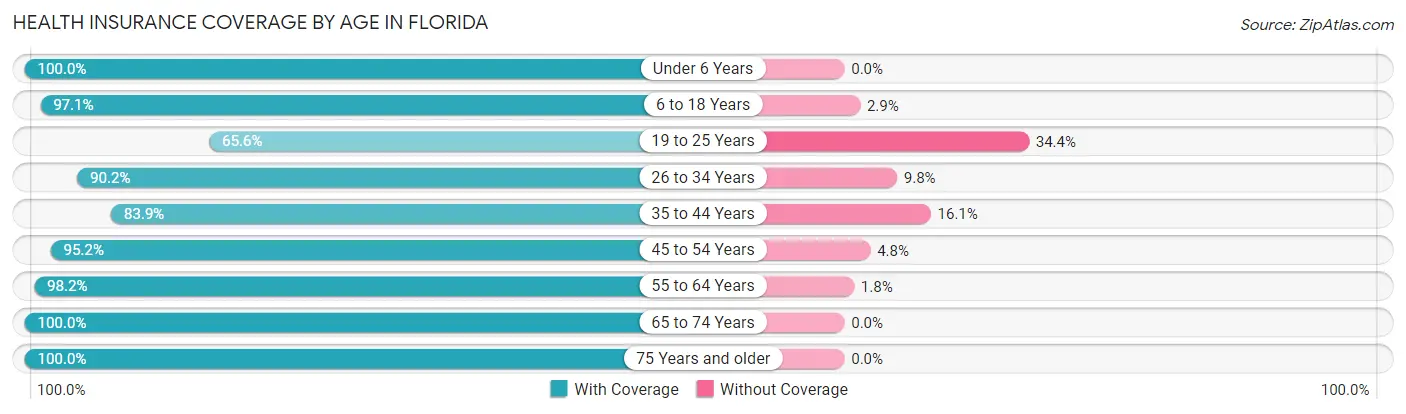
| Age Bracket | With Coverage | Without Coverage |
| Under 6 Years | 266 (100.0%) | 0 (0.0%) |
| 6 to 18 Years | 466 (97.1%) | 14 (2.9%) |
| 19 to 25 Years | 225 (65.6%) | 118 (34.4%) |
| 26 to 34 Years | 313 (90.2%) | 34 (9.8%) |
| 35 to 44 Years | 271 (83.9%) | 52 (16.1%) |
| 45 to 54 Years | 452 (95.2%) | 23 (4.8%) |
| 55 to 64 Years | 220 (98.2%) | 4 (1.8%) |
| 65 to 74 Years | 313 (100.0%) | 0 (0.0%) |
| 75 Years and older | 139 (100.0%) | 0 (0.0%) |
| Total | 2,665 (91.6%) | 245 (8.4%) |
Health Insurance Coverage by Citizenship Status in Florida
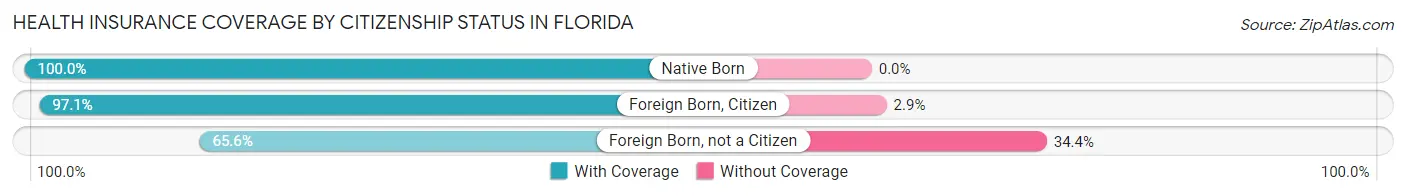
| Citizenship Status | With Coverage | Without Coverage |
| Native Born | 266 (100.0%) | 0 (0.0%) |
| Foreign Born, Citizen | 466 (97.1%) | 14 (2.9%) |
| Foreign Born, not a Citizen | 225 (65.6%) | 118 (34.4%) |
Health Insurance Coverage by Household Income in Florida
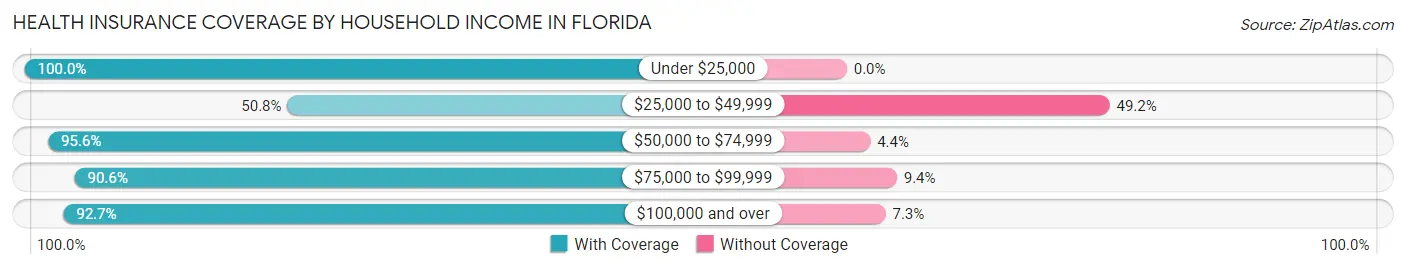
| Household Income | With Coverage | Without Coverage |
| Under $25,000 | 311 (100.0%) | 0 (0.0%) |
| $25,000 to $49,999 | 66 (50.8%) | 64 (49.2%) |
| $50,000 to $74,999 | 196 (95.6%) | 9 (4.4%) |
| $75,000 to $99,999 | 329 (90.6%) | 34 (9.4%) |
| $100,000 and over | 1,763 (92.7%) | 138 (7.3%) |
Public vs Private Health Insurance Coverage by Age in Florida
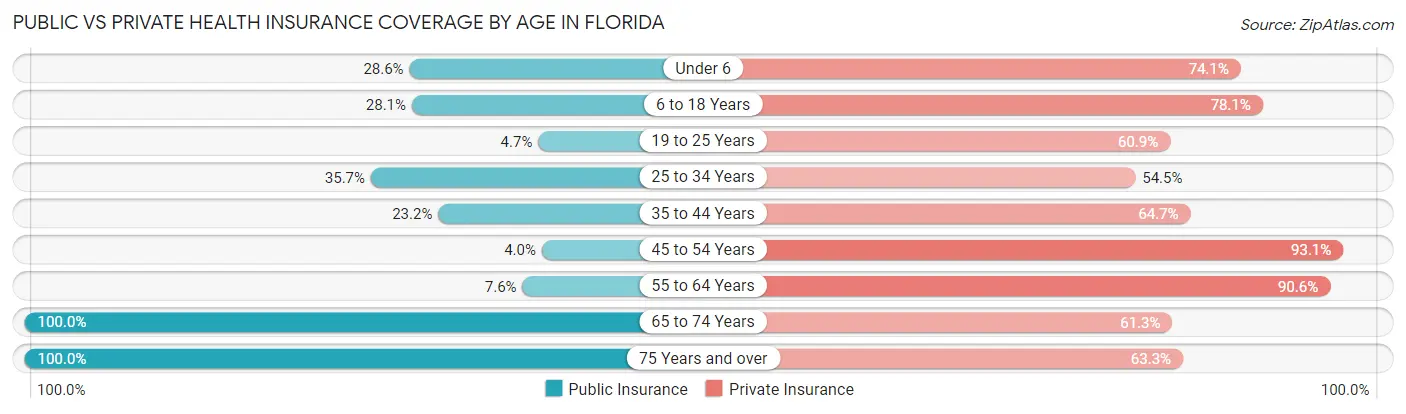
| Age Bracket | Public Insurance | Private Insurance |
| Under 6 | 76 (28.6%) | 197 (74.1%) |
| 6 to 18 Years | 135 (28.1%) | 375 (78.1%) |
| 19 to 25 Years | 16 (4.7%) | 209 (60.9%) |
| 25 to 34 Years | 124 (35.7%) | 189 (54.5%) |
| 35 to 44 Years | 75 (23.2%) | 209 (64.7%) |
| 45 to 54 Years | 19 (4.0%) | 442 (93.0%) |
| 55 to 64 Years | 17 (7.6%) | 203 (90.6%) |
| 65 to 74 Years | 313 (100.0%) | 192 (61.3%) |
| 75 Years and over | 139 (100.0%) | 88 (63.3%) |
| Total | 914 (31.4%) | 2,104 (72.3%) |
Disability Status by Sex by Age in Florida
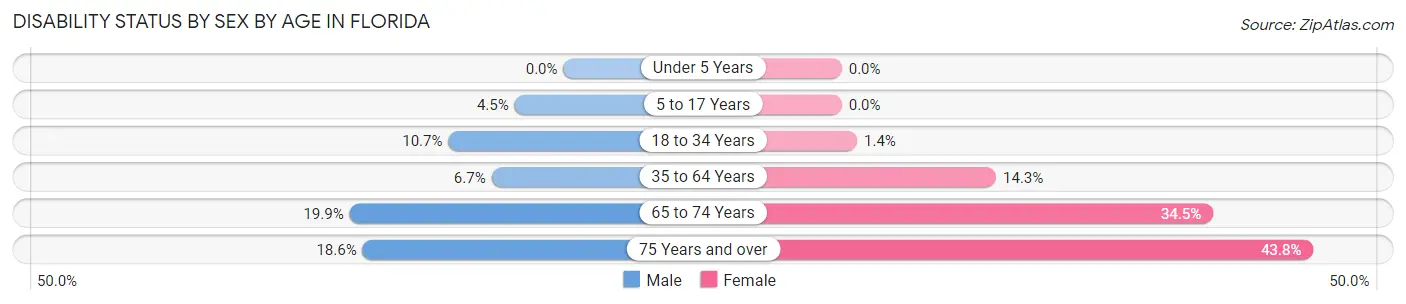
| Age Bracket | Male | Female |
| Under 5 Years | 0 (0.0%) | 0 (0.0%) |
| 5 to 17 Years | 14 (4.5%) | 0 (0.0%) |
| 18 to 34 Years | 39 (10.7%) | 6 (1.4%) |
| 35 to 64 Years | 36 (6.7%) | 69 (14.3%) |
| 65 to 74 Years | 27 (19.9%) | 61 (34.5%) |
| 75 Years and over | 11 (18.6%) | 35 (43.8%) |
Disability Class by Sex by Age in Florida
Disability Class: Hearing Difficulty
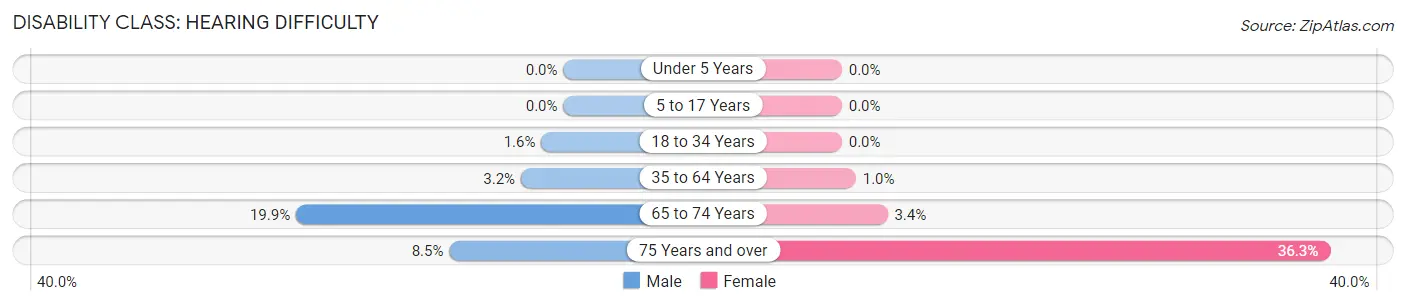
| Age Bracket | Male | Female |
| Under 5 Years | 0 (0.0%) | 0 (0.0%) |
| 5 to 17 Years | 0 (0.0%) | 0 (0.0%) |
| 18 to 34 Years | 6 (1.6%) | 0 (0.0%) |
| 35 to 64 Years | 17 (3.2%) | 5 (1.0%) |
| 65 to 74 Years | 27 (19.9%) | 6 (3.4%) |
| 75 Years and over | 5 (8.5%) | 29 (36.2%) |
Disability Class: Vision Difficulty
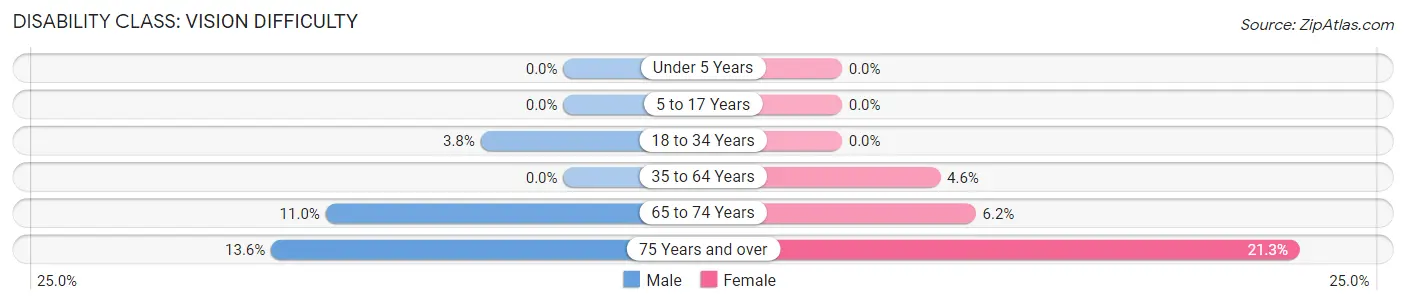
| Age Bracket | Male | Female |
| Under 5 Years | 0 (0.0%) | 0 (0.0%) |
| 5 to 17 Years | 0 (0.0%) | 0 (0.0%) |
| 18 to 34 Years | 14 (3.8%) | 0 (0.0%) |
| 35 to 64 Years | 0 (0.0%) | 22 (4.6%) |
| 65 to 74 Years | 15 (11.0%) | 11 (6.2%) |
| 75 Years and over | 8 (13.6%) | 17 (21.2%) |
Disability Class: Cognitive Difficulty
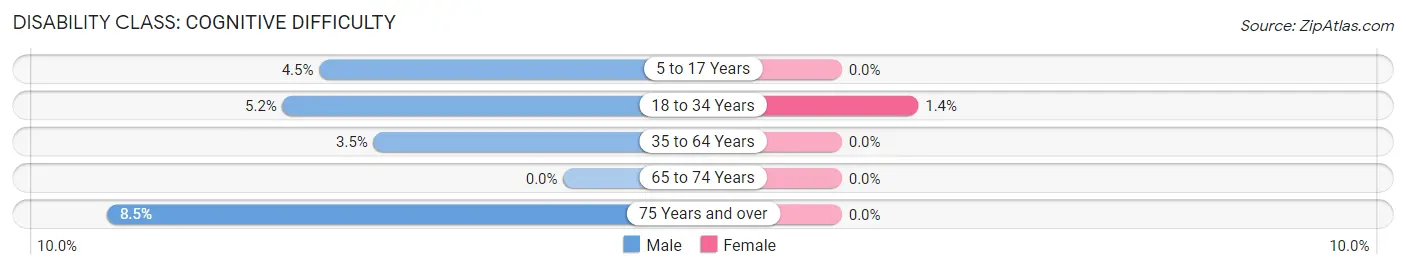
| Age Bracket | Male | Female |
| 5 to 17 Years | 14 (4.5%) | 0 (0.0%) |
| 18 to 34 Years | 19 (5.2%) | 6 (1.4%) |
| 35 to 64 Years | 19 (3.5%) | 0 (0.0%) |
| 65 to 74 Years | 0 (0.0%) | 0 (0.0%) |
| 75 Years and over | 5 (8.5%) | 0 (0.0%) |
Disability Class: Ambulatory Difficulty
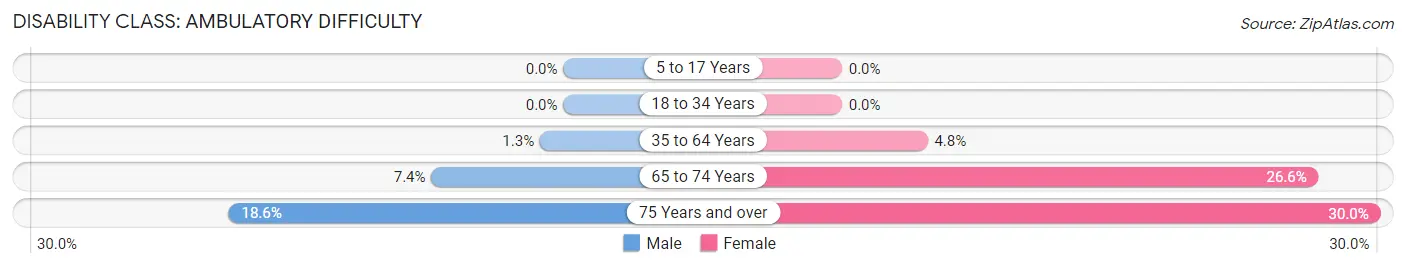
| Age Bracket | Male | Female |
| 5 to 17 Years | 0 (0.0%) | 0 (0.0%) |
| 18 to 34 Years | 0 (0.0%) | 0 (0.0%) |
| 35 to 64 Years | 7 (1.3%) | 23 (4.8%) |
| 65 to 74 Years | 10 (7.3%) | 47 (26.6%) |
| 75 Years and over | 11 (18.6%) | 24 (30.0%) |
Disability Class: Self-Care Difficulty
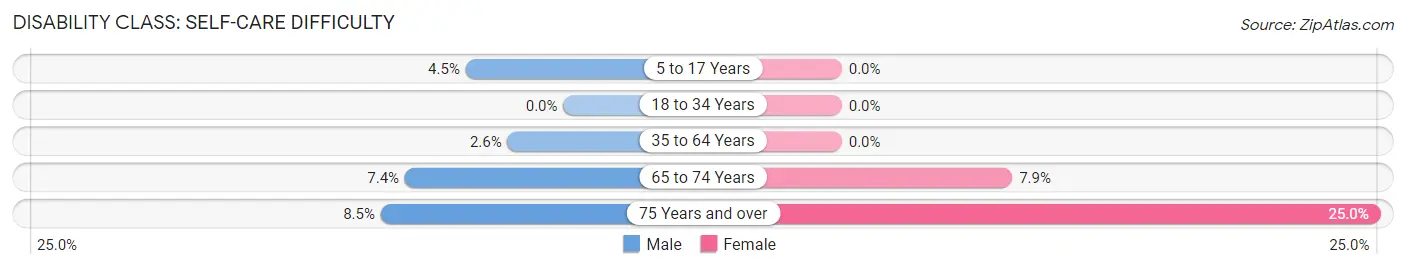
| Age Bracket | Male | Female |
| 5 to 17 Years | 14 (4.5%) | 0 (0.0%) |
| 18 to 34 Years | 0 (0.0%) | 0 (0.0%) |
| 35 to 64 Years | 14 (2.6%) | 0 (0.0%) |
| 65 to 74 Years | 10 (7.3%) | 14 (7.9%) |
| 75 Years and over | 5 (8.5%) | 20 (25.0%) |
Technology Access in Florida
Computing Device Access in Florida
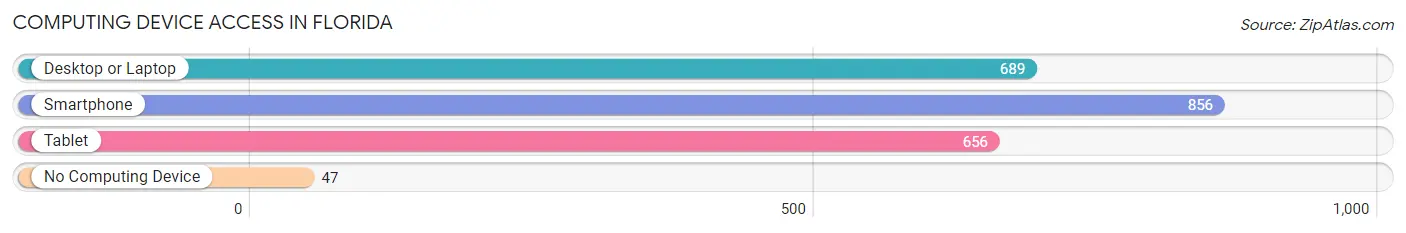
| Device Type | # Households | % Households |
| Desktop or Laptop | 689 | 73.1% |
| Smartphone | 856 | 90.8% |
| Tablet | 656 | 69.6% |
| No Computing Device | 47 | 5.0% |
| Total | 943 | 100.0% |
Internet Access in Florida
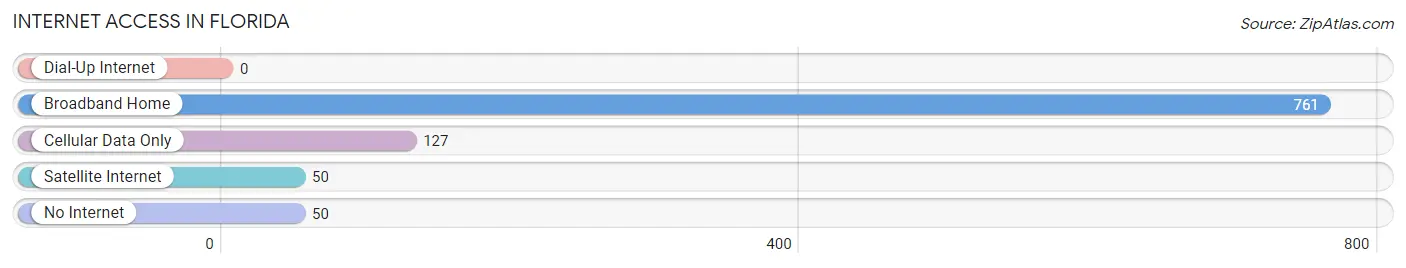
| Internet Type | # Households | % Households |
| Dial-Up Internet | 0 | 0.0% |
| Broadband Home | 761 | 80.7% |
| Cellular Data Only | 127 | 13.5% |
| Satellite Internet | 50 | 5.3% |
| No Internet | 50 | 5.3% |
| Total | 943 | 100.0% |
Florida Summary
Florida
Florida is a state located in the southeastern region of the United States. It is bordered by Alabama to the northwest, Georgia to the north, the Atlantic Ocean to the east, and the Gulf of Mexico to the south. With a population of over 21 million, Florida is the third most populous state in the United States. It is also the 22nd most extensive state in terms of land area.
History
The first known inhabitants of Florida were the Paleo-Indians, who arrived in the region around 12,000 years ago. The first Europeans to explore the area were Spanish explorers, who arrived in the early 16th century. In 1513, Spanish explorer Juan Ponce de Leon became the first European to set foot in what is now Florida. He named the region “La Florida” in honor of the Spanish Easter festival of Pascua Florida.
In the early 18th century, the British began to colonize the region. In 1763, the British gained control of Florida from the Spanish in exchange for Havana, Cuba. The British divided the region into two colonies, East Florida and West Florida. In 1821, the United States acquired Florida from the Spanish in the Adams-Onis Treaty. Florida became a U.S. territory in 1822 and was admitted to the Union as the 27th state in 1845.
Geography
Florida is the 22nd largest state in the United States, covering an area of 65,755 square miles. It is the only state in the continental United States that borders both the Atlantic Ocean and the Gulf of Mexico. The state is divided into 67 counties and is home to more than 11,000 miles of coastline.
The highest point in Florida is Britton Hill, which stands at 345 feet above sea level. The state is home to several major rivers, including the St. Johns, Suwannee, and Apalachicola. Florida also has numerous lakes, including Lake Okeechobee, the largest lake in the state.
Economy
Florida has a diverse economy that is driven by tourism, agriculture, and manufacturing. The state is a major tourist destination, with over 112 million visitors in 2019. Tourism is the largest industry in the state, accounting for over $91 billion in economic activity.
Agriculture is also an important part of the state’s economy. Florida is the second-largest producer of oranges in the United States, and is also a major producer of sugarcane, tomatoes, and other crops.
Manufacturing is also an important part of the state’s economy. Florida is home to several major companies, including Walt Disney World, Universal Studios, and SeaWorld.
Demographics
As of 2019, Florida had a population of 21.48 million, making it the third most populous state in the United States. The state is home to a diverse population, with the largest ethnic groups being White (64.5%), Hispanic or Latino (25.7%), and Black or African American (15.5%).
The largest cities in Florida are Jacksonville, Miami, Tampa, St. Petersburg, and Orlando. The state’s capital is Tallahassee.
New York
New York is a state located in the northeastern region of the United States. It is bordered by Vermont, Massachusetts, Connecticut, and New Jersey to the east, and Pennsylvania and Ontario, Canada to the west. With a population of over 19 million, New York is the fourth most populous state in the United States. It is also the 27th most extensive state in terms of land area.
History
The first known inhabitants of New York were the Algonquin and Iroquois Native American tribes. The first Europeans to explore the area were Dutch explorers, who arrived in the early 17th century. In 1626, Dutch explorer Peter Minuit became the first European to purchase land in what is now New York.
In 1664, the British gained control of New York from the Dutch in exchange for Suriname. The British divided the region into two colonies, New York and New Jersey. In 1788, New York became the 11th state to ratify the United States Constitution and was admitted to the Union.
Geography
New York is the 27th largest state in the United States, covering an area of 54,556 square miles. It is divided into 62 counties and is home to more than 7,000 miles of coastline.
The highest point in New York is Mount Marcy, which stands at 5,344 feet above sea level. The state is home to several major rivers, including the Hudson, Mohawk, and Genesee. New York also has numerous lakes, including Lake Ontario, the largest lake in the state.
Economy
New York has a diverse economy that is driven by finance, tourism, and manufacturing. The state is a major financial center, with Wall Street located in New York City. The financial industry is the largest industry in the state, accounting for over $1 trillion in economic activity.
Tourism is also an important part of the state’s economy. New York is a major tourist destination, with over 65 million visitors in 2019. Manufacturing is also an important part of the state’s economy. New York is home to several major companies, including IBM, Pfizer, and Verizon.
Demographics
As of 2019, New York had a population of 19.45 million, making it the fourth most populous state in the United States. The state is home to a diverse population, with the largest ethnic groups being White (58.5%), Hispanic or Latino (18.5%), and Black or African American (15.9%).
The largest cities in New York are New York City, Buffalo, Rochester, Yonkers, and Syracuse. The state’s capital is Albany.
Common Questions
What is Per Capita Income in Florida?
Per Capita income in Florida is $39,683.
What is the Median Family Income in Florida?
Median Family Income in Florida is $118,000.
What is the Median Household income in Florida?
Median Household Income in Florida is $112,188.
What is Income or Wage Gap in Florida?
Income or Wage Gap in Florida is 38.9%.
Women in Florida earn 61.1 cents for every dollar earned by a man.
What is Inequality or Gini Index in Florida?
Inequality or Gini Index in Florida is 0.36.
What is the Total Population of Florida?
Total Population of Florida is 2,937.
What is the Total Male Population of Florida?
Total Male Population of Florida is 1,532.
What is the Total Female Population of Florida?
Total Female Population of Florida is 1,405.
What is the Ratio of Males per 100 Females in Florida?
There are 109.04 Males per 100 Females in Florida.
What is the Ratio of Females per 100 Males in Florida?
There are 91.71 Females per 100 Males in Florida.
What is the Median Population Age in Florida?
Median Population Age in Florida is 35.3 Years.
What is the Average Family Size in Florida
Average Family Size in Florida is 3.7 People.
What is the Average Household Size in Florida
Average Household Size in Florida is 3.1 People.
How Large is the Labor Force in Florida?
There are 1,615 People in the Labor Forcein in Florida.
What is the Percentage of People in the Labor Force in Florida?
67.0% of People are in the Labor Force in Florida.
What is the Unemployment Rate in Florida?
Unemployment Rate in Florida is 3.1%.