Hicksville, NY Map & Demographics
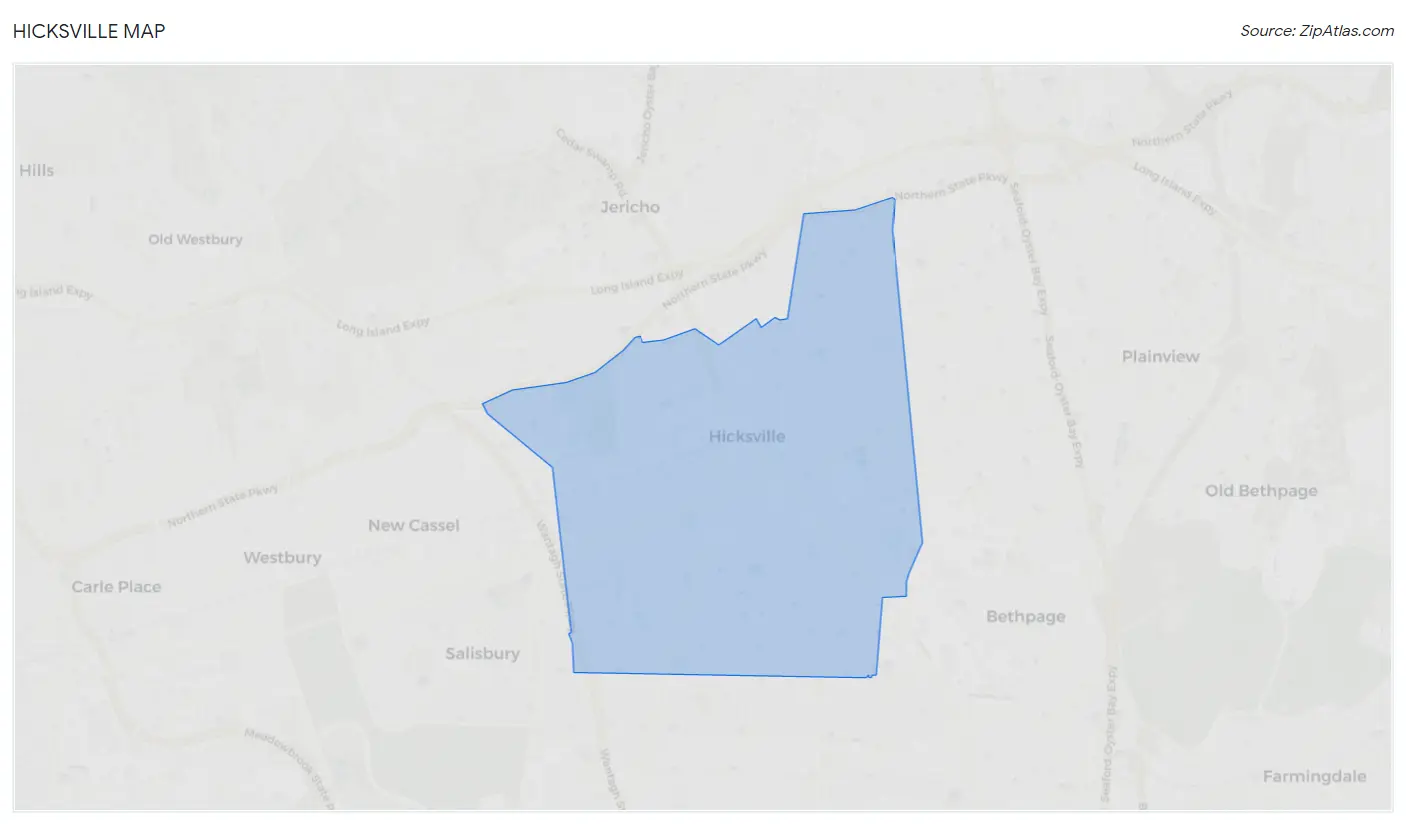
Hicksville Map
Hicksville Overview
$50,412
PER CAPITA INCOME
$150,425
AVG FAMILY INCOME
$139,809
AVG HOUSEHOLD INCOME
23.4%
WAGE / INCOME GAP [ % ]
76.6¢/ $1
WAGE / INCOME GAP [ $ ]
0.40
INEQUALITY / GINI INDEX
44,084
TOTAL POPULATION
22,819
MALE POPULATION
21,265
FEMALE POPULATION
107.31
MALES / 100 FEMALES
93.19
FEMALES / 100 MALES
41.3
MEDIAN AGE
3.6
AVG FAMILY SIZE
3.3
AVG HOUSEHOLD SIZE
24,450
LABOR FORCE [ PEOPLE ]
65.9%
PERCENT IN LABOR FORCE
3.8%
UNEMPLOYMENT RATE
Hicksville Zip Codes
Income in Hicksville
Income Overview in Hicksville
Per Capita Income in Hicksville is $50,412, while median incomes of families and households are $150,425 and $139,809 respectively.
| Characteristic | Number | Measure |
| Per Capita Income | 44,084 | $50,412 |
| Median Family Income | 10,986 | $150,425 |
| Mean Family Income | 10,986 | $175,927 |
| Median Household Income | 13,406 | $139,809 |
| Mean Household Income | 13,406 | $161,954 |
| Income Deficit | 10,986 | $0 |
| Wage / Income Gap (%) | 44,084 | 23.38% |
| Wage / Income Gap ($) | 44,084 | 76.62¢ per $1 |
| Gini / Inequality Index | 44,084 | 0.40 |
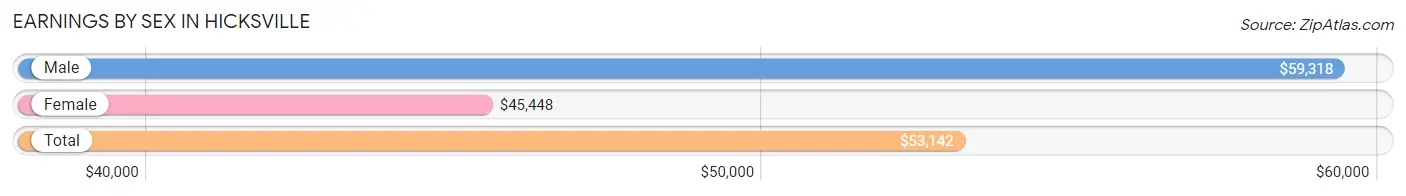
Earnings by Sex in Hicksville
Average Earnings in Hicksville are $53,142, $59,318 for men and $45,448 for women, a difference of 23.4%.
| Sex | Number | Average Earnings |
| Male | 14,317 (57.0%) | $59,318 |
| Female | 10,787 (43.0%) | $45,448 |
| Total | 25,104 (100.0%) | $53,142 |
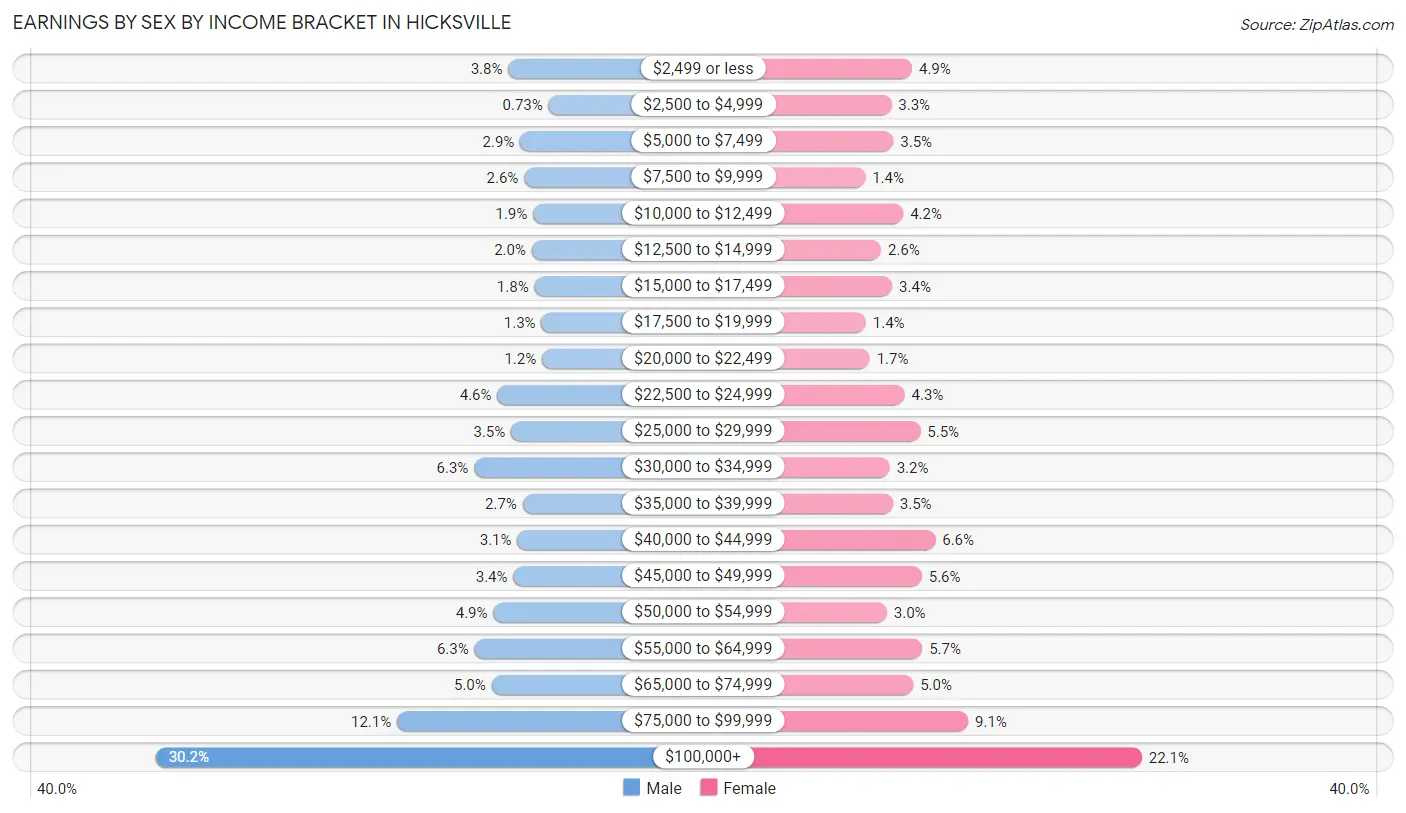
Earnings by Sex by Income Bracket in Hicksville
The most common earnings brackets in Hicksville are $100,000+ for men (4,319 | 30.2%) and $100,000+ for women (2,385 | 22.1%).
| Income | Male | Female |
| $2,499 or less | 537 (3.7%) | 527 (4.9%) |
| $2,500 to $4,999 | 105 (0.7%) | 360 (3.3%) |
| $5,000 to $7,499 | 409 (2.9%) | 377 (3.5%) |
| $7,500 to $9,999 | 367 (2.6%) | 149 (1.4%) |
| $10,000 to $12,499 | 271 (1.9%) | 456 (4.2%) |
| $12,500 to $14,999 | 285 (2.0%) | 276 (2.6%) |
| $15,000 to $17,499 | 256 (1.8%) | 367 (3.4%) |
| $17,500 to $19,999 | 182 (1.3%) | 154 (1.4%) |
| $20,000 to $22,499 | 175 (1.2%) | 185 (1.7%) |
| $22,500 to $24,999 | 654 (4.6%) | 467 (4.3%) |
| $25,000 to $29,999 | 507 (3.5%) | 594 (5.5%) |
| $30,000 to $34,999 | 904 (6.3%) | 347 (3.2%) |
| $35,000 to $39,999 | 382 (2.7%) | 372 (3.5%) |
| $40,000 to $44,999 | 439 (3.1%) | 715 (6.6%) |
| $45,000 to $49,999 | 482 (3.4%) | 606 (5.6%) |
| $50,000 to $54,999 | 697 (4.9%) | 324 (3.0%) |
| $55,000 to $64,999 | 899 (6.3%) | 609 (5.7%) |
| $65,000 to $74,999 | 716 (5.0%) | 537 (5.0%) |
| $75,000 to $99,999 | 1,731 (12.1%) | 980 (9.1%) |
| $100,000+ | 4,319 (30.2%) | 2,385 (22.1%) |
| Total | 14,317 (100.0%) | 10,787 (100.0%) |
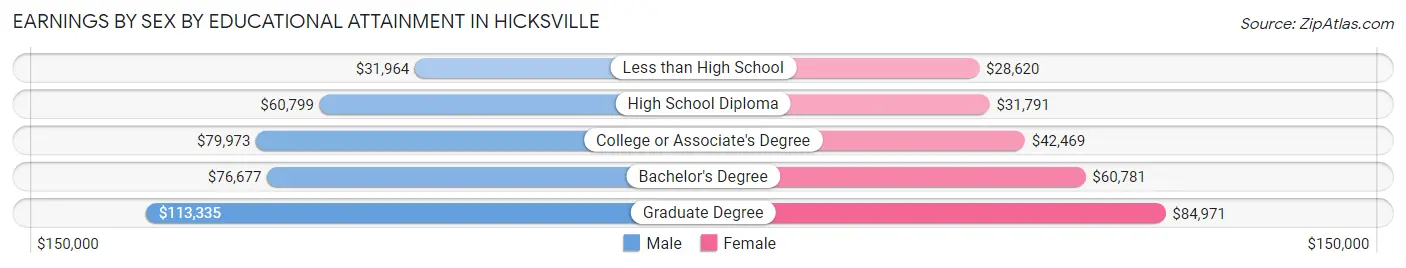
Earnings by Sex by Educational Attainment in Hicksville
Average earnings in Hicksville are $72,826 for men and $50,947 for women, a difference of 30.0%. Men with an educational attainment of graduate degree enjoy the highest average annual earnings of $113,335, while those with less than high school education earn the least with $31,964. Women with an educational attainment of graduate degree earn the most with the average annual earnings of $84,971, while those with less than high school education have the smallest earnings of $28,620.
| Educational Attainment | Male Income | Female Income |
| Less than High School | $31,964 | $28,620 |
| High School Diploma | $60,799 | $31,791 |
| College or Associate's Degree | $79,973 | $42,469 |
| Bachelor's Degree | $76,677 | $60,781 |
| Graduate Degree | $113,335 | $84,971 |
| Total | $72,826 | $50,947 |
Family Income in Hicksville
Family Income Brackets in Hicksville
According to the Hicksville family income data, there are 3,702 families falling into the $200,000+ income range, which is the most common income bracket and makes up 33.7% of all families. Conversely, the $10,000 to $14,999 income bracket is the least frequent group with only 33 families (0.3%) belonging to this category.
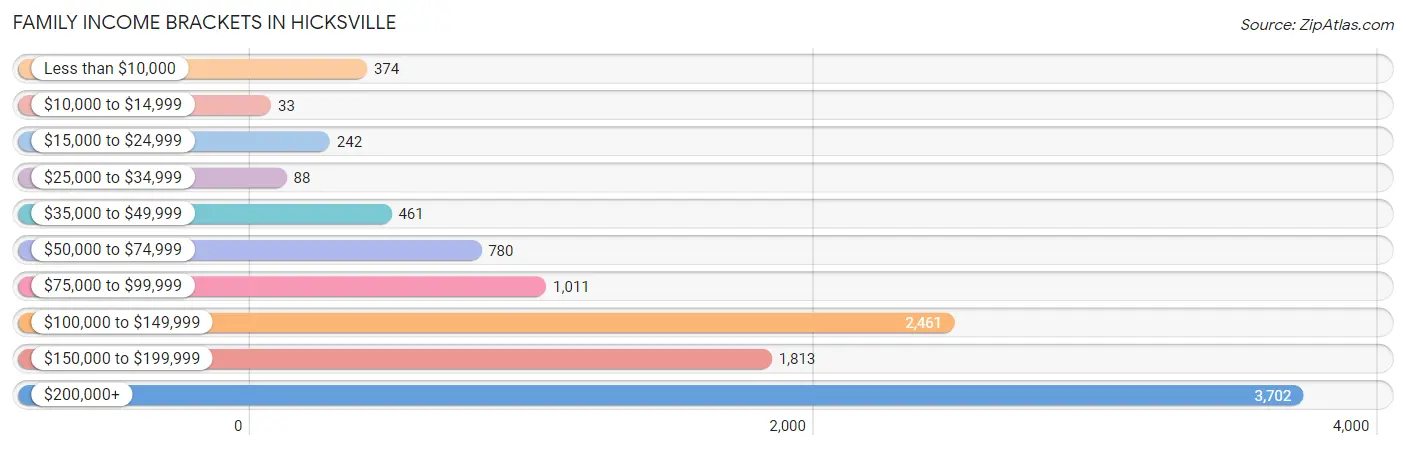
| Income Bracket | # Families | % Families |
| Less than $10,000 | 374 | 3.4% |
| $10,000 to $14,999 | 33 | 0.3% |
| $15,000 to $24,999 | 242 | 2.2% |
| $25,000 to $34,999 | 88 | 0.8% |
| $35,000 to $49,999 | 461 | 4.2% |
| $50,000 to $74,999 | 780 | 7.1% |
| $75,000 to $99,999 | 1,011 | 9.2% |
| $100,000 to $149,999 | 2,461 | 22.4% |
| $150,000 to $199,999 | 1,813 | 16.5% |
| $200,000+ | 3,702 | 33.7% |
Family Income by Famaliy Size in Hicksville
6-person families (440 | 4.0%) account for the highest median family income in Hicksville with $195,268 per family, while 2-person families (3,587 | 32.7%) have the highest median income of $56,266 per family member.
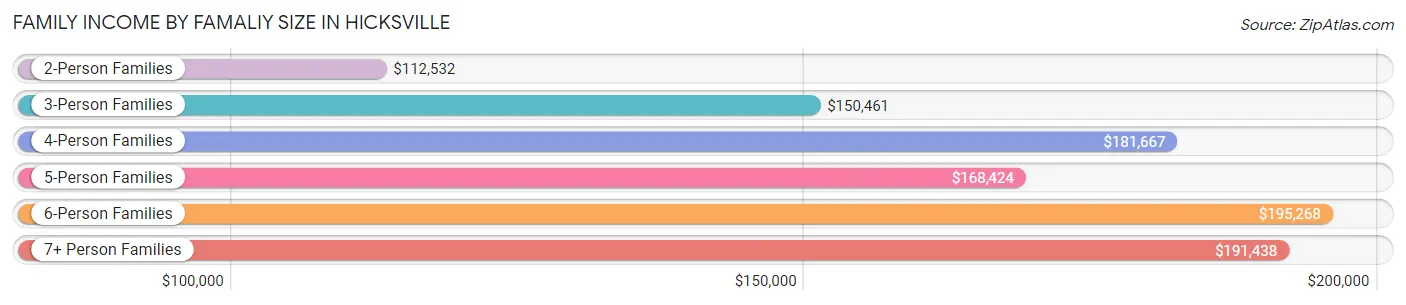
| Income Bracket | # Families | Median Income |
| 2-Person Families | 3,587 (32.7%) | $112,532 |
| 3-Person Families | 2,654 (24.2%) | $150,461 |
| 4-Person Families | 2,084 (19.0%) | $181,667 |
| 5-Person Families | 1,620 (14.7%) | $168,424 |
| 6-Person Families | 440 (4.0%) | $195,268 |
| 7+ Person Families | 601 (5.5%) | $191,438 |
| Total | 10,986 (100.0%) | $150,425 |
Family Income by Number of Earners in Hicksville
The median family income in Hicksville is $150,425, with families comprising 3+ earners (3,134) having the highest median family income of $198,283, while families with no earners (1,213) have the lowest median family income of $85,728, accounting for 28.5% and 11.0% of families, respectively.
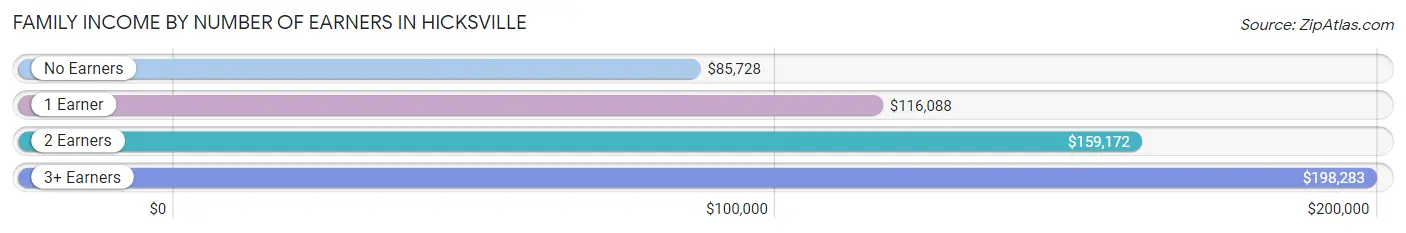
| Number of Earners | # Families | Median Income |
| No Earners | 1,213 (11.0%) | $85,728 |
| 1 Earner | 2,902 (26.4%) | $116,088 |
| 2 Earners | 3,737 (34.0%) | $159,172 |
| 3+ Earners | 3,134 (28.5%) | $198,283 |
| Total | 10,986 (100.0%) | $150,425 |
Household Income in Hicksville
Household Income Brackets in Hicksville
With 3,955 households falling in the category, the $200,000+ income range is the most frequent in Hicksville, accounting for 29.5% of all households. In contrast, only 147 households (1.1%) fall into the $10,000 to $14,999 income bracket, making it the least populous group.
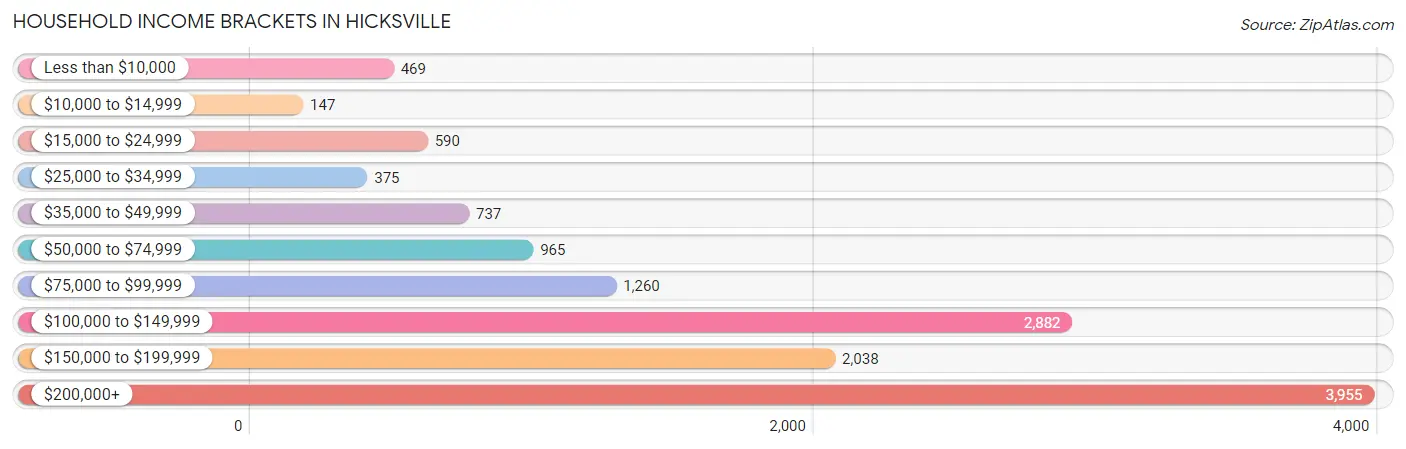
| Income Bracket | # Households | % Households |
| Less than $10,000 | 469 | 3.5% |
| $10,000 to $14,999 | 147 | 1.1% |
| $15,000 to $24,999 | 590 | 4.4% |
| $25,000 to $34,999 | 375 | 2.8% |
| $35,000 to $49,999 | 737 | 5.5% |
| $50,000 to $74,999 | 965 | 7.2% |
| $75,000 to $99,999 | 1,260 | 9.4% |
| $100,000 to $149,999 | 2,882 | 21.5% |
| $150,000 to $199,999 | 2,038 | 15.2% |
| $200,000+ | 3,955 | 29.5% |
Household Income by Householder Age in Hicksville
The median household income in Hicksville is $139,809, with the highest median household income of $157,350 found in the 25 to 44 years age bracket for the primary householder. A total of 2,913 households (21.7%) fall into this category. Meanwhile, the 65+ years age bracket for the primary householder has the lowest median household income of $95,944, with 4,094 households (30.5%) in this group.
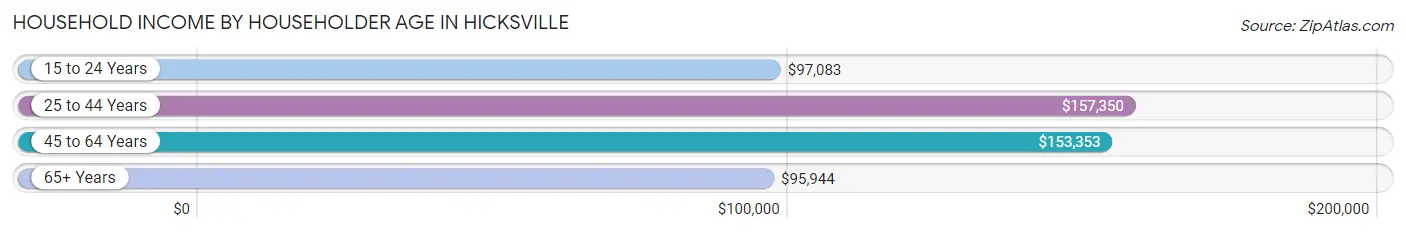
| Income Bracket | # Households | Median Income |
| 15 to 24 Years | 242 (1.8%) | $97,083 |
| 25 to 44 Years | 2,913 (21.7%) | $157,350 |
| 45 to 64 Years | 6,157 (45.9%) | $153,353 |
| 65+ Years | 4,094 (30.5%) | $95,944 |
| Total | 13,406 (100.0%) | $139,809 |
Poverty in Hicksville
Income Below Poverty by Sex and Age in Hicksville
With 4.9% poverty level for males and 4.3% for females among the residents of Hicksville, 16 and 17 year old males and 45 to 54 year old females are the most vulnerable to poverty, with 102 males (19.0%) and 221 females (8.5%) in their respective age groups living below the poverty level.
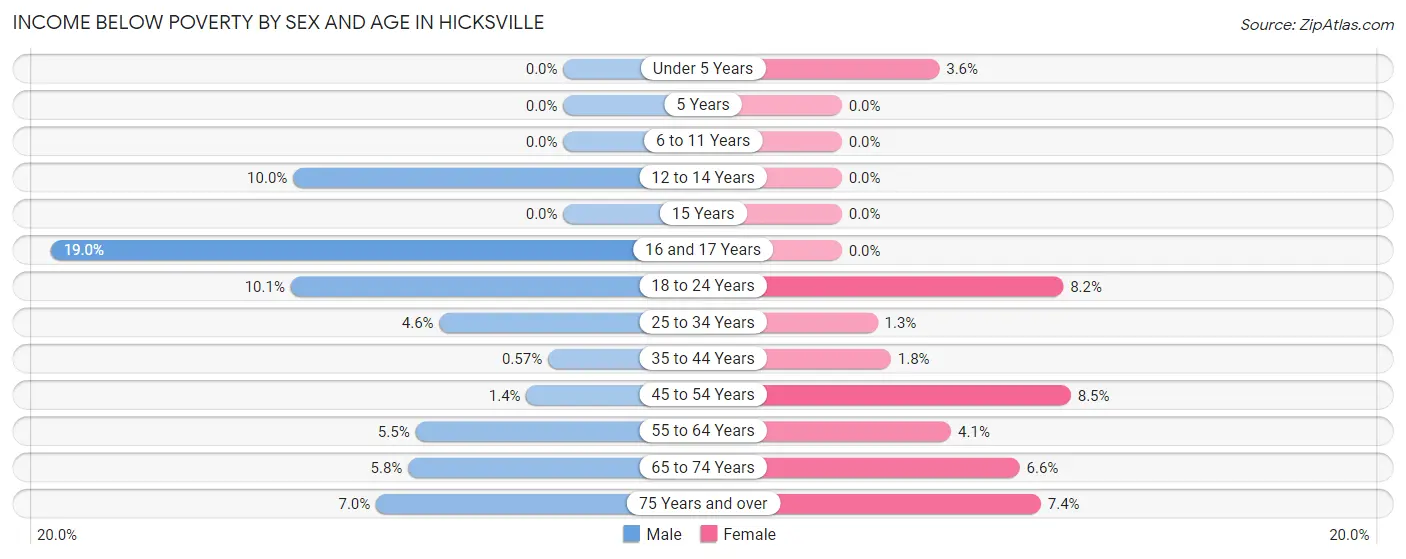
| Age Bracket | Male | Female |
| Under 5 Years | 0 (0.0%) | 30 (3.6%) |
| 5 Years | 0 (0.0%) | 0 (0.0%) |
| 6 to 11 Years | 0 (0.0%) | 0 (0.0%) |
| 12 to 14 Years | 100 (10.0%) | 0 (0.0%) |
| 15 Years | 0 (0.0%) | 0 (0.0%) |
| 16 and 17 Years | 102 (19.0%) | 0 (0.0%) |
| 18 to 24 Years | 281 (10.1%) | 154 (8.2%) |
| 25 to 34 Years | 142 (4.6%) | 35 (1.3%) |
| 35 to 44 Years | 15 (0.6%) | 47 (1.8%) |
| 45 to 54 Years | 37 (1.4%) | 221 (8.5%) |
| 55 to 64 Years | 208 (5.5%) | 143 (4.1%) |
| 65 to 74 Years | 126 (5.8%) | 136 (6.6%) |
| 75 Years and over | 110 (7.0%) | 157 (7.4%) |
| Total | 1,121 (4.9%) | 923 (4.3%) |
Income Above Poverty by Sex and Age in Hicksville
According to the poverty statistics in Hicksville, males aged under 5 years and females aged 5 years are the age groups that are most secure financially, with 100.0% of males and 100.0% of females in these age groups living above the poverty line.
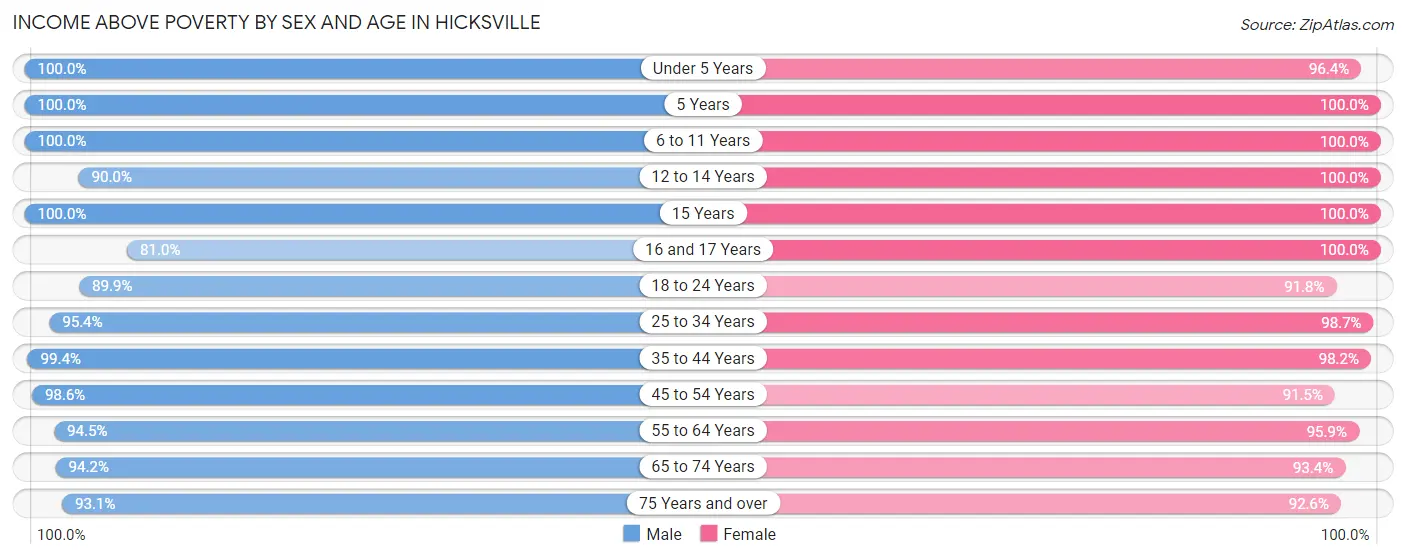
| Age Bracket | Male | Female |
| Under 5 Years | 899 (100.0%) | 799 (96.4%) |
| 5 Years | 345 (100.0%) | 448 (100.0%) |
| 6 to 11 Years | 1,137 (100.0%) | 1,416 (100.0%) |
| 12 to 14 Years | 897 (90.0%) | 618 (100.0%) |
| 15 Years | 94 (100.0%) | 129 (100.0%) |
| 16 and 17 Years | 434 (81.0%) | 428 (100.0%) |
| 18 to 24 Years | 2,495 (89.9%) | 1,719 (91.8%) |
| 25 to 34 Years | 2,944 (95.4%) | 2,589 (98.7%) |
| 35 to 44 Years | 2,606 (99.4%) | 2,537 (98.2%) |
| 45 to 54 Years | 2,673 (98.6%) | 2,379 (91.5%) |
| 55 to 64 Years | 3,579 (94.5%) | 3,377 (95.9%) |
| 65 to 74 Years | 2,063 (94.2%) | 1,926 (93.4%) |
| 75 Years and over | 1,472 (93.0%) | 1,967 (92.6%) |
| Total | 21,638 (95.1%) | 20,332 (95.7%) |
Income Below Poverty Among Married-Couple Families in Hicksville
The poverty statistics for married-couple families in Hicksville show that 4.3% or 371 of the total 8,546 families live below the poverty line. Families with no children have the highest poverty rate of 6.0%, comprising of 303 families. On the other hand, families with 3 or 4 children have the lowest poverty rate of 0.0%, which includes 0 families.
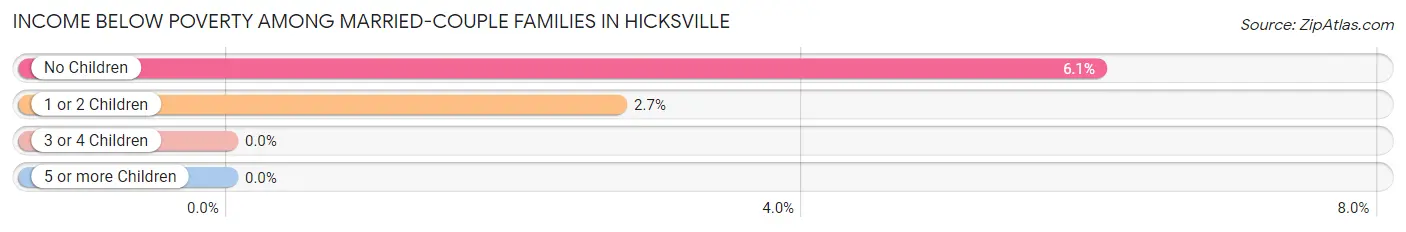
| Children | Above Poverty | Below Poverty |
| No Children | 4,704 (94.0%) | 303 (6.0%) |
| 1 or 2 Children | 2,442 (97.3%) | 68 (2.7%) |
| 3 or 4 Children | 1,015 (100.0%) | 0 (0.0%) |
| 5 or more Children | 14 (100.0%) | 0 (0.0%) |
| Total | 8,175 (95.7%) | 371 (4.3%) |
Income Below Poverty Among Single-Parent Households in Hicksville
According to the poverty data in Hicksville, 8.4% or 111 single-father households and 6.5% or 72 single-mother households are living below the poverty line. Among single-father households, those with 1 or 2 children have the highest poverty rate, with 111 households (25.9%) experiencing poverty. Likewise, among single-mother households, those with 1 or 2 children have the highest poverty rate, with 15 households (7.8%) falling below the poverty line.
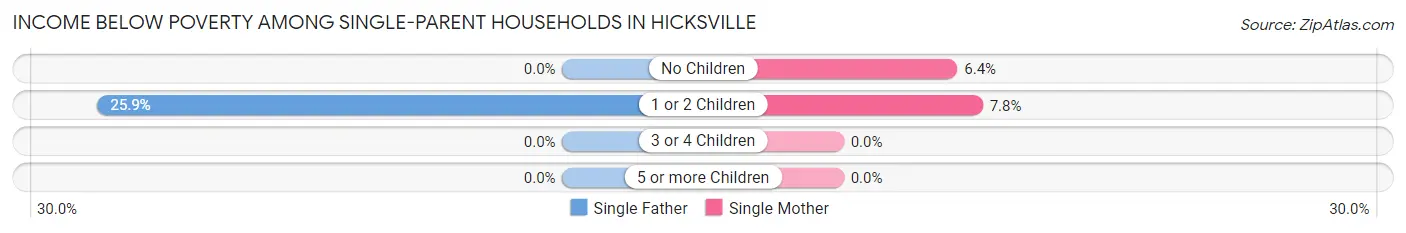
| Children | Single Father | Single Mother |
| No Children | 0 (0.0%) | 57 (6.4%) |
| 1 or 2 Children | 111 (25.9%) | 15 (7.8%) |
| 3 or 4 Children | 0 (0.0%) | 0 (0.0%) |
| 5 or more Children | 0 (0.0%) | 0 (0.0%) |
| Total | 111 (8.4%) | 72 (6.5%) |
Income Below Poverty Among Married-Couple vs Single-Parent Households in Hicksville
The poverty data for Hicksville shows that 371 of the married-couple family households (4.3%) and 183 of the single-parent households (7.5%) are living below the poverty level. Within the married-couple family households, those with no children have the highest poverty rate, with 303 households (6.0%) falling below the poverty line. Among the single-parent households, those with 1 or 2 children have the highest poverty rate, with 126 household (20.3%) living below poverty.
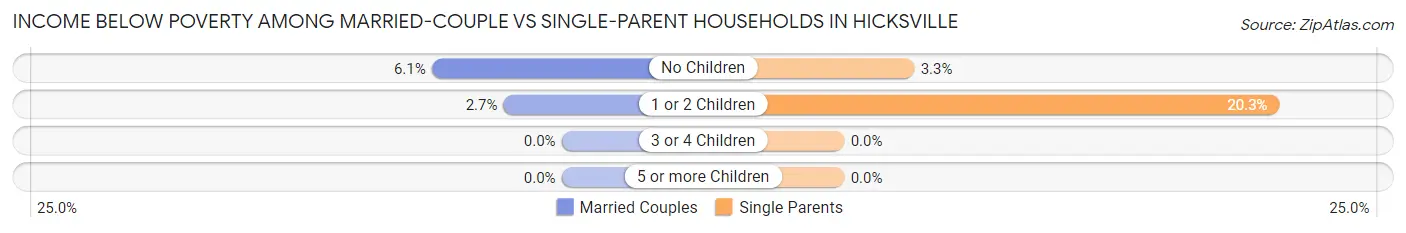
| Children | Married-Couple Families | Single-Parent Households |
| No Children | 303 (6.0%) | 57 (3.3%) |
| 1 or 2 Children | 68 (2.7%) | 126 (20.3%) |
| 3 or 4 Children | 0 (0.0%) | 0 (0.0%) |
| 5 or more Children | 0 (0.0%) | 0 (0.0%) |
| Total | 371 (4.3%) | 183 (7.5%) |
Race in Hicksville
The most populous races in Hicksville are White / Caucasian (20,733 | 47.0%), Asian (14,796 | 33.6%), and Hispanic or Latino (7,589 | 17.2%).
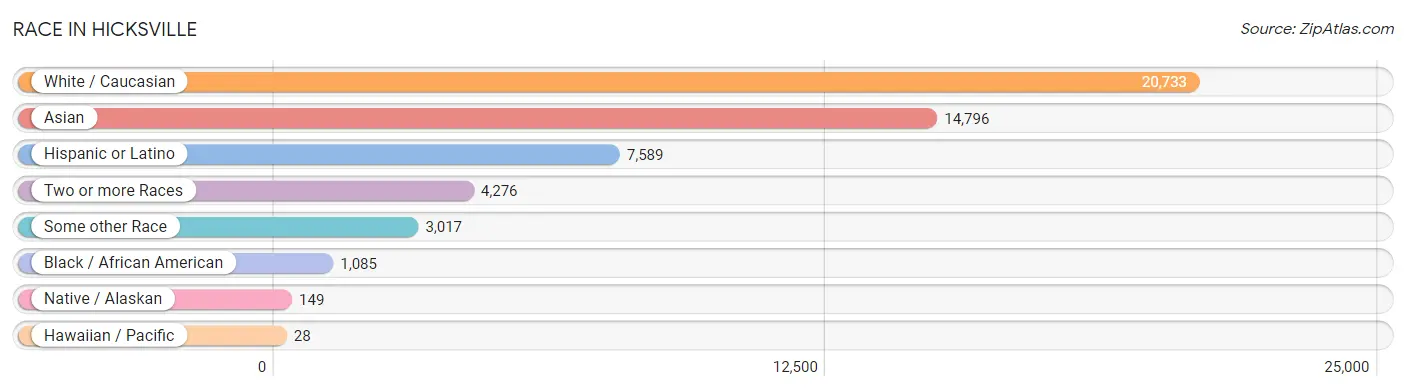
| Race | # Population | % Population |
| Asian | 14,796 | 33.6% |
| Black / African American | 1,085 | 2.5% |
| Hawaiian / Pacific | 28 | 0.1% |
| Hispanic or Latino | 7,589 | 17.2% |
| Native / Alaskan | 149 | 0.3% |
| White / Caucasian | 20,733 | 47.0% |
| Two or more Races | 4,276 | 9.7% |
| Some other Race | 3,017 | 6.8% |
| Total | 44,084 | 100.0% |
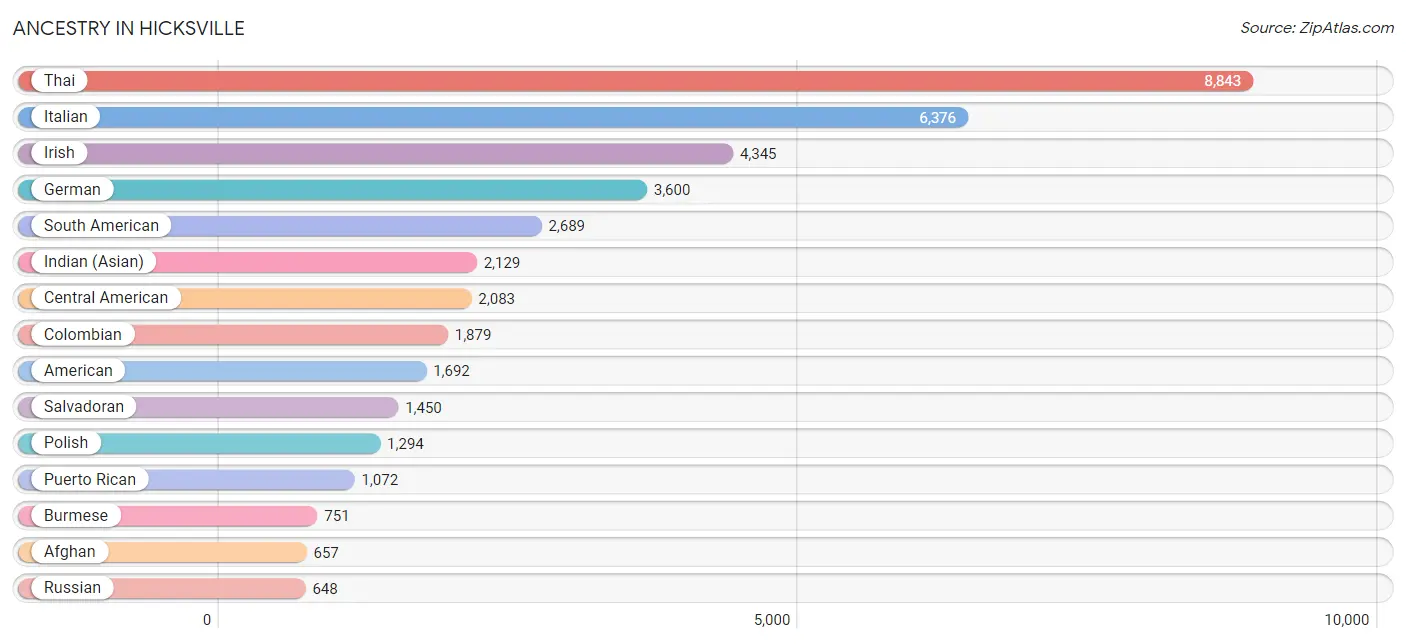
Ancestry in Hicksville
The most populous ancestries reported in Hicksville are Thai (8,843 | 20.1%), Italian (6,376 | 14.5%), Irish (4,345 | 9.9%), German (3,600 | 8.2%), and South American (2,689 | 6.1%), together accounting for 58.7% of all Hicksville residents.
| Ancestry | # Population | % Population |
| Afghan | 657 | 1.5% |
| African | 24 | 0.1% |
| Albanian | 172 | 0.4% |
| American | 1,692 | 3.8% |
| Arab | 62 | 0.1% |
| Argentinean | 56 | 0.1% |
| Armenian | 37 | 0.1% |
| Austrian | 64 | 0.2% |
| Belgian | 9 | 0.0% |
| Bhutanese | 11 | 0.0% |
| Blackfeet | 17 | 0.0% |
| Bolivian | 105 | 0.2% |
| Brazilian | 339 | 0.8% |
| British | 48 | 0.1% |
| British West Indian | 26 | 0.1% |
| Burmese | 751 | 1.7% |
| Celtic | 120 | 0.3% |
| Central American | 2,083 | 4.7% |
| Central American Indian | 70 | 0.2% |
| Chilean | 60 | 0.1% |
| Colombian | 1,879 | 4.3% |
| Costa Rican | 46 | 0.1% |
| Cuban | 200 | 0.4% |
| Czech | 140 | 0.3% |
| Czechoslovakian | 8 | 0.0% |
| Danish | 40 | 0.1% |
| Dominican | 552 | 1.3% |
| Dutch | 184 | 0.4% |
| Eastern European | 176 | 0.4% |
| Ecuadorian | 348 | 0.8% |
| Egyptian | 38 | 0.1% |
| English | 566 | 1.3% |
| European | 283 | 0.6% |
| Finnish | 12 | 0.0% |
| French | 431 | 1.0% |
| French Canadian | 136 | 0.3% |
| German | 3,600 | 8.2% |
| Greek | 611 | 1.4% |
| Guatemalan | 68 | 0.2% |
| Guyanese | 285 | 0.6% |
| Haitian | 136 | 0.3% |
| Honduran | 438 | 1.0% |
| Hungarian | 293 | 0.7% |
| Indian (Asian) | 2,129 | 4.8% |
| Iranian | 53 | 0.1% |
| Irish | 4,345 | 9.9% |
| Iroquois | 70 | 0.2% |
| Israeli | 14 | 0.0% |
| Italian | 6,376 | 14.5% |
| Jamaican | 96 | 0.2% |
| Korean | 570 | 1.3% |
| Laotian | 127 | 0.3% |
| Lebanese | 10 | 0.0% |
| Lithuanian | 54 | 0.1% |
| Mexican | 436 | 1.0% |
| Native Hawaiian | 11 | 0.0% |
| Nicaraguan | 81 | 0.2% |
| Northern European | 11 | 0.0% |
| Norwegian | 71 | 0.2% |
| Pakistani | 46 | 0.1% |
| Peruvian | 197 | 0.4% |
| Polish | 1,294 | 2.9% |
| Portuguese | 122 | 0.3% |
| Puerto Rican | 1,072 | 2.4% |
| Romanian | 131 | 0.3% |
| Russian | 648 | 1.5% |
| Salvadoran | 1,450 | 3.3% |
| Scandinavian | 85 | 0.2% |
| Scotch-Irish | 210 | 0.5% |
| Scottish | 104 | 0.2% |
| Slovak | 46 | 0.1% |
| South American | 2,689 | 6.1% |
| Spaniard | 31 | 0.1% |
| Spanish | 153 | 0.4% |
| Spanish American | 32 | 0.1% |
| Sri Lankan | 16 | 0.0% |
| Subsaharan African | 24 | 0.1% |
| Swedish | 34 | 0.1% |
| Swiss | 94 | 0.2% |
| Thai | 8,843 | 20.1% |
| Trinidadian and Tobagonian | 38 | 0.1% |
| Turkish | 22 | 0.1% |
| Ukrainian | 300 | 0.7% |
| Uruguayan | 20 | 0.1% |
| Venezuelan | 24 | 0.1% |
| Vietnamese | 583 | 1.3% |
| Welsh | 45 | 0.1% |
| West Indian | 17 | 0.0% |
| Yugoslavian | 31 | 0.1% | View All 89 Rows |
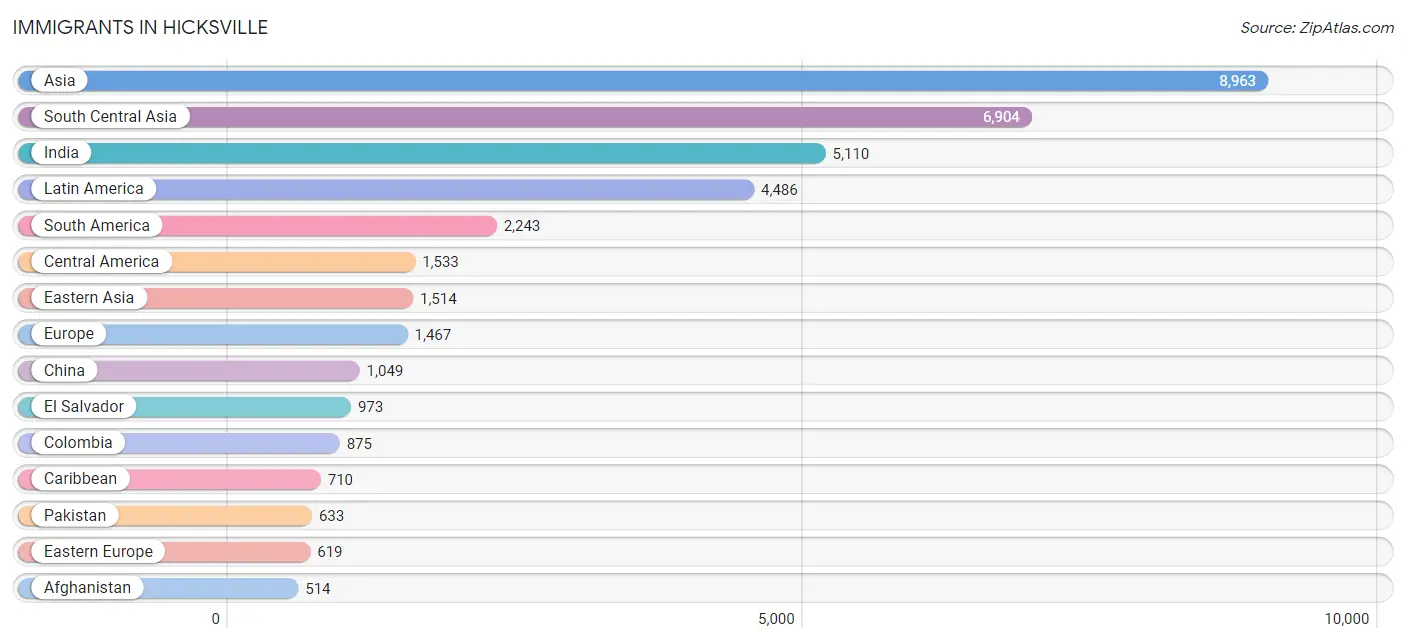
Immigrants in Hicksville
The most numerous immigrant groups reported in Hicksville came from Asia (8,963 | 20.3%), South Central Asia (6,904 | 15.7%), India (5,110 | 11.6%), Latin America (4,486 | 10.2%), and South America (2,243 | 5.1%), together accounting for 62.9% of all Hicksville residents.
| Immigration Origin | # Population | % Population |
| Afghanistan | 514 | 1.2% |
| Africa | 77 | 0.2% |
| Albania | 33 | 0.1% |
| Argentina | 130 | 0.3% |
| Asia | 8,963 | 20.3% |
| Australia | 16 | 0.0% |
| Austria | 9 | 0.0% |
| Bangladesh | 487 | 1.1% |
| Barbados | 20 | 0.1% |
| Bolivia | 105 | 0.2% |
| Brazil | 123 | 0.3% |
| Canada | 71 | 0.2% |
| Caribbean | 710 | 1.6% |
| Central America | 1,533 | 3.5% |
| Chile | 92 | 0.2% |
| China | 1,049 | 2.4% |
| Colombia | 875 | 2.0% |
| Costa Rica | 46 | 0.1% |
| Croatia | 10 | 0.0% |
| Cuba | 122 | 0.3% |
| Czechoslovakia | 4 | 0.0% |
| Dominican Republic | 202 | 0.5% |
| Eastern Africa | 28 | 0.1% |
| Eastern Asia | 1,514 | 3.4% |
| Eastern Europe | 619 | 1.4% |
| Ecuador | 494 | 1.1% |
| Egypt | 49 | 0.1% |
| El Salvador | 973 | 2.2% |
| Europe | 1,467 | 3.3% |
| France | 16 | 0.0% |
| Germany | 175 | 0.4% |
| Greece | 327 | 0.7% |
| Grenada | 37 | 0.1% |
| Guatemala | 41 | 0.1% |
| Guyana | 179 | 0.4% |
| Haiti | 228 | 0.5% |
| Honduras | 160 | 0.4% |
| Hong Kong | 272 | 0.6% |
| Hungary | 6 | 0.0% |
| India | 5,110 | 11.6% |
| Indonesia | 51 | 0.1% |
| Iran | 77 | 0.2% |
| Ireland | 77 | 0.2% |
| Israel | 33 | 0.1% |
| Italy | 98 | 0.2% |
| Jamaica | 51 | 0.1% |
| Japan | 11 | 0.0% |
| Korea | 454 | 1.0% |
| Latin America | 4,486 | 10.2% |
| Malaysia | 19 | 0.0% |
| Mexico | 313 | 0.7% |
| Nepal | 54 | 0.1% |
| North Macedonia | 96 | 0.2% |
| Northern Africa | 49 | 0.1% |
| Northern Europe | 182 | 0.4% |
| Oceania | 16 | 0.0% |
| Pakistan | 633 | 1.4% |
| Peru | 196 | 0.4% |
| Philippines | 247 | 0.6% |
| Poland | 149 | 0.3% |
| Portugal | 31 | 0.1% |
| Romania | 168 | 0.4% |
| Russia | 28 | 0.1% |
| Scotland | 105 | 0.2% |
| South America | 2,243 | 5.1% |
| South Central Asia | 6,904 | 15.7% |
| South Eastern Asia | 389 | 0.9% |
| Southern Europe | 466 | 1.1% |
| Spain | 10 | 0.0% |
| Sri Lanka | 29 | 0.1% |
| Taiwan | 34 | 0.1% |
| Trinidad and Tobago | 50 | 0.1% |
| Turkey | 57 | 0.1% |
| Ukraine | 125 | 0.3% |
| Uruguay | 25 | 0.1% |
| Venezuela | 24 | 0.1% |
| Vietnam | 26 | 0.1% |
| Western Asia | 156 | 0.4% |
| Western Europe | 200 | 0.4% | View All 79 Rows |
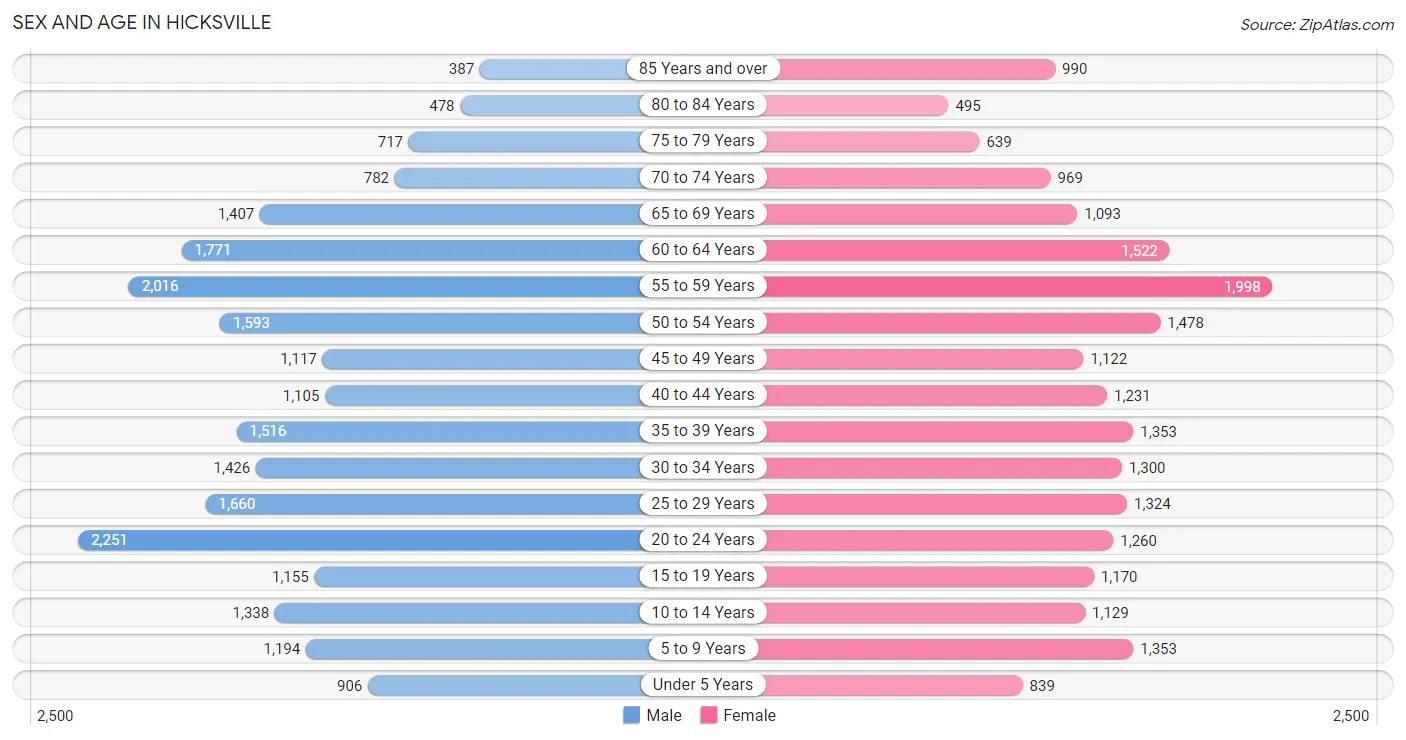
Sex and Age in Hicksville
Sex and Age in Hicksville
The most populous age groups in Hicksville are 20 to 24 Years (2,251 | 9.9%) for men and 55 to 59 Years (1,998 | 9.4%) for women.
| Age Bracket | Male | Female |
| Under 5 Years | 906 (4.0%) | 839 (4.0%) |
| 5 to 9 Years | 1,194 (5.2%) | 1,353 (6.4%) |
| 10 to 14 Years | 1,338 (5.9%) | 1,129 (5.3%) |
| 15 to 19 Years | 1,155 (5.1%) | 1,170 (5.5%) |
| 20 to 24 Years | 2,251 (9.9%) | 1,260 (5.9%) |
| 25 to 29 Years | 1,660 (7.3%) | 1,324 (6.2%) |
| 30 to 34 Years | 1,426 (6.2%) | 1,300 (6.1%) |
| 35 to 39 Years | 1,516 (6.6%) | 1,353 (6.4%) |
| 40 to 44 Years | 1,105 (4.8%) | 1,231 (5.8%) |
| 45 to 49 Years | 1,117 (4.9%) | 1,122 (5.3%) |
| 50 to 54 Years | 1,593 (7.0%) | 1,478 (7.0%) |
| 55 to 59 Years | 2,016 (8.8%) | 1,998 (9.4%) |
| 60 to 64 Years | 1,771 (7.8%) | 1,522 (7.2%) |
| 65 to 69 Years | 1,407 (6.2%) | 1,093 (5.1%) |
| 70 to 74 Years | 782 (3.4%) | 969 (4.6%) |
| 75 to 79 Years | 717 (3.1%) | 639 (3.0%) |
| 80 to 84 Years | 478 (2.1%) | 495 (2.3%) |
| 85 Years and over | 387 (1.7%) | 990 (4.7%) |
| Total | 22,819 (100.0%) | 21,265 (100.0%) |
Families and Households in Hicksville
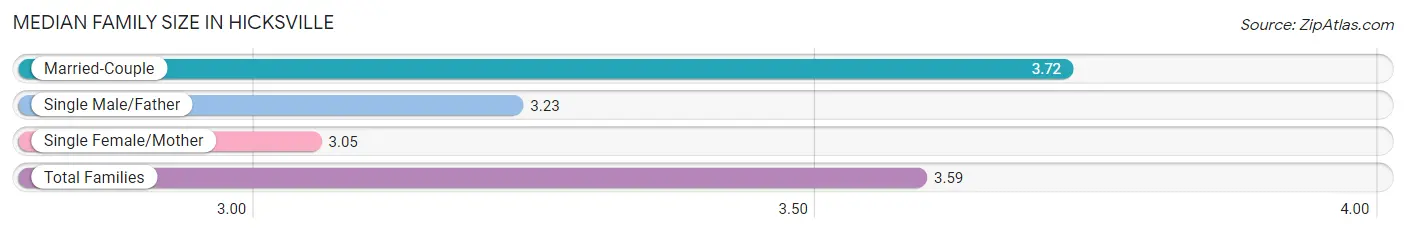
Median Family Size in Hicksville
The median family size in Hicksville is 3.59 persons per family, with married-couple families (8,546 | 77.8%) accounting for the largest median family size of 3.72 persons per family. On the other hand, single female/mother families (1,117 | 10.2%) represent the smallest median family size with 3.05 persons per family.
| Family Type | # Families | Family Size |
| Married-Couple | 8,546 (77.8%) | 3.72 |
| Single Male/Father | 1,323 (12.0%) | 3.23 |
| Single Female/Mother | 1,117 (10.2%) | 3.05 |
| Total Families | 10,986 (100.0%) | 3.59 |
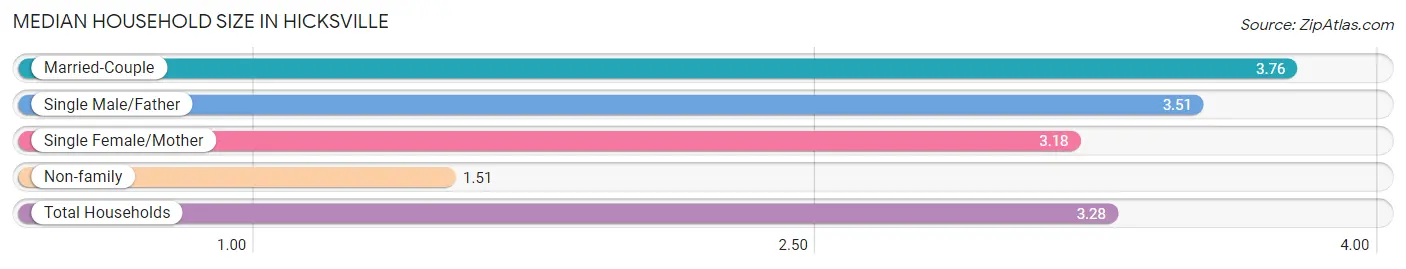
Median Household Size in Hicksville
The median household size in Hicksville is 3.28 persons per household, with married-couple households (8,546 | 63.7%) accounting for the largest median household size of 3.76 persons per household. non-family households (2,420 | 18.0%) represent the smallest median household size with 1.51 persons per household.
| Household Type | # Households | Household Size |
| Married-Couple | 8,546 (63.7%) | 3.76 |
| Single Male/Father | 1,323 (9.9%) | 3.51 |
| Single Female/Mother | 1,117 (8.3%) | 3.18 |
| Non-family | 2,420 (18.0%) | 1.51 |
| Total Households | 13,406 (100.0%) | 3.28 |
Household Size by Marriage Status in Hicksville
Out of a total of 13,406 households in Hicksville, 10,986 (82.0%) are family households, while 2,420 (18.0%) are nonfamily households. The most numerous type of family households are 2-person households, comprising 3,439, and the most common type of nonfamily households are 1-person households, comprising 1,798.
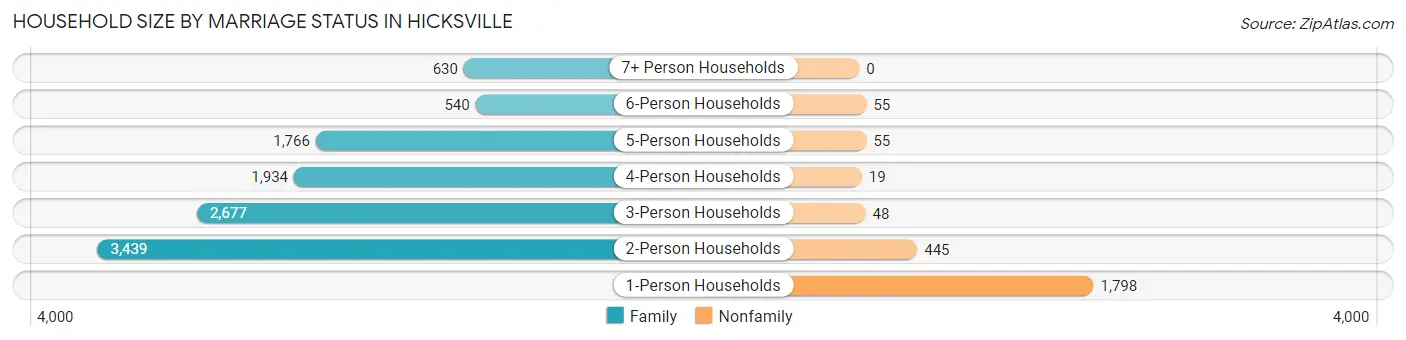
| Household Size | Family Households | Nonfamily Households |
| 1-Person Households | - | 1,798 (13.4%) |
| 2-Person Households | 3,439 (25.7%) | 445 (3.3%) |
| 3-Person Households | 2,677 (20.0%) | 48 (0.4%) |
| 4-Person Households | 1,934 (14.4%) | 19 (0.1%) |
| 5-Person Households | 1,766 (13.2%) | 55 (0.4%) |
| 6-Person Households | 540 (4.0%) | 55 (0.4%) |
| 7+ Person Households | 630 (4.7%) | 0 (0.0%) |
| Total | 10,986 (82.0%) | 2,420 (18.0%) |
Female Fertility in Hicksville
Fertility by Age in Hicksville
Average fertility rate in Hicksville is 38.0 births per 1,000 women. Women in the age bracket of 35 to 50 years have the highest fertility rate with 47.0 births per 1,000 women. Women in the age bracket of 35 to 50 years acount for 54.1% of all women with births.
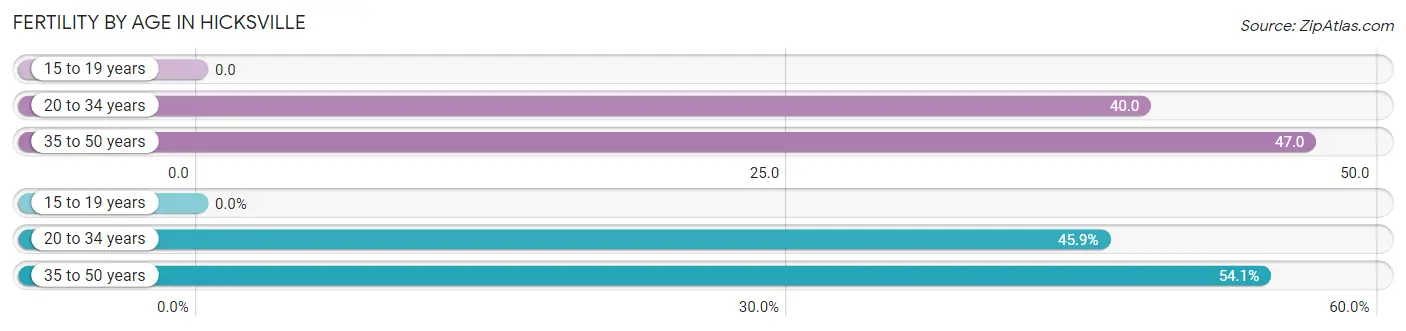
| Age Bracket | Women with Births | Births / 1,000 Women |
| 15 to 19 years | 0 (0.0%) | 0.0 |
| 20 to 34 years | 157 (45.9%) | 40.0 |
| 35 to 50 years | 185 (54.1%) | 47.0 |
| Total | 342 (100.0%) | 38.0 |
Fertility by Age by Marriage Status in Hicksville
90.1% of women with births (342) in Hicksville are married. The highest percentage of unmarried women with births falls into 20 to 34 years age bracket with 15.3% of them unmarried at the time of birth, while the lowest percentage of unmarried women with births belong to 35 to 50 years age bracket with 5.4% of them unmarried.
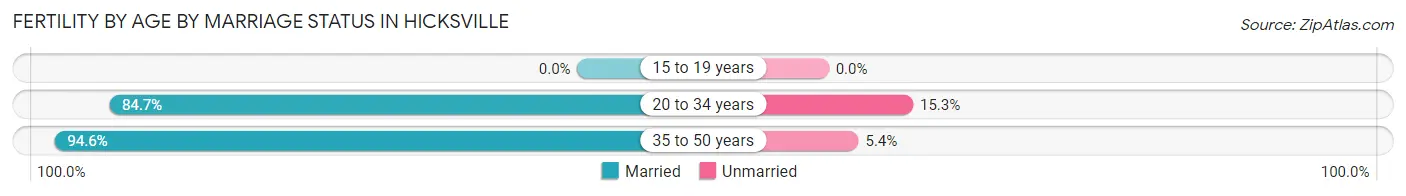
| Age Bracket | Married | Unmarried |
| 15 to 19 years | 0 (0.0%) | 0 (0.0%) |
| 20 to 34 years | 133 (84.7%) | 24 (15.3%) |
| 35 to 50 years | 175 (94.6%) | 10 (5.4%) |
| Total | 308 (90.1%) | 34 (9.9%) |
Fertility by Education in Hicksville
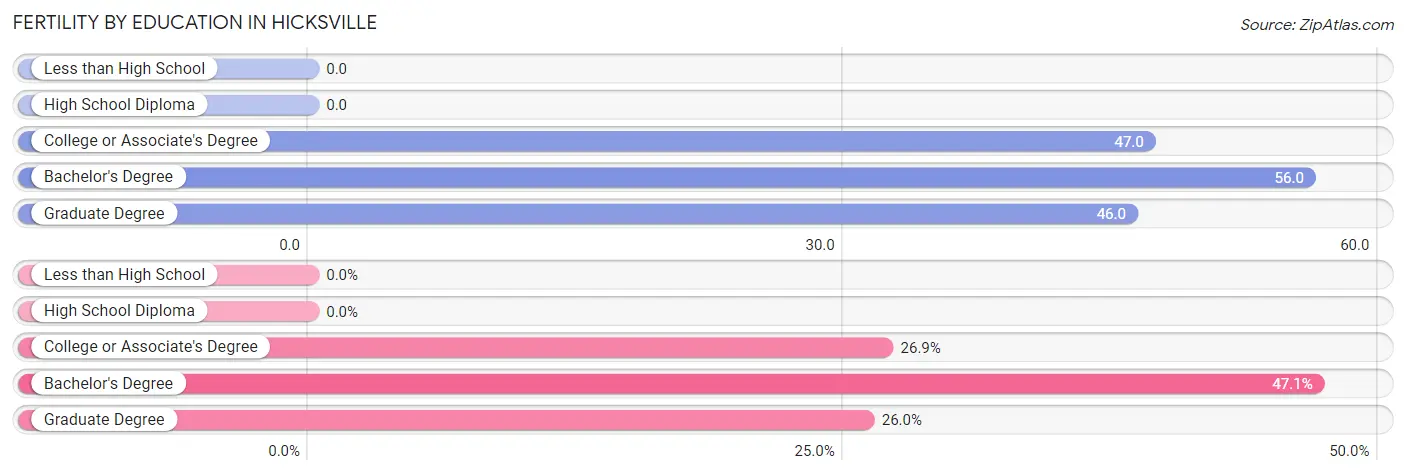
| Educational Attainment | Women with Births | Births / 1,000 Women |
| Less than High School | 0 (0.0%) | 0.0 |
| High School Diploma | 0 (0.0%) | 0.0 |
| College or Associate's Degree | 92 (26.9%) | 47.0 |
| Bachelor's Degree | 161 (47.1%) | 56.0 |
| Graduate Degree | 89 (26.0%) | 46.0 |
| Total | 342 (100.0%) | 38.0 |
Fertility by Education by Marriage Status in Hicksville
9.9% of women with births in Hicksville are unmarried. Women with the educational attainment of college or associate's degree are most likely to be married with 100.0% of them married at childbirth, while women with the educational attainment of bachelor's degree are least likely to be married with 21.1% of them unmarried at childbirth.
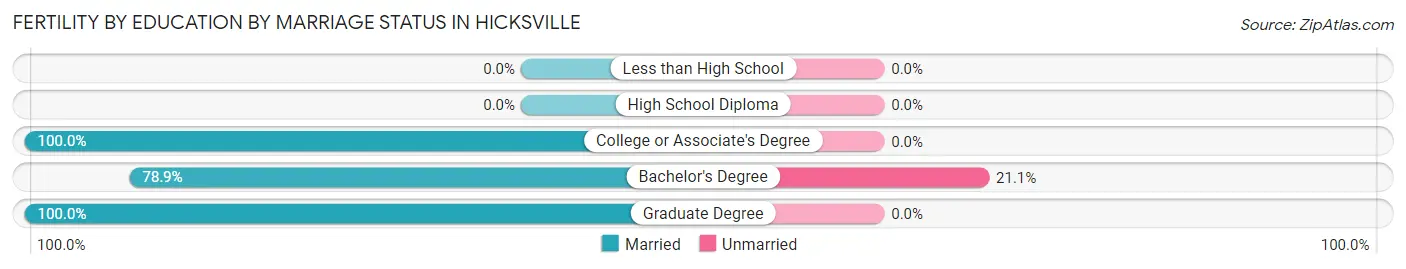
| Educational Attainment | Married | Unmarried |
| Less than High School | 0 (0.0%) | 0 (0.0%) |
| High School Diploma | 0 (0.0%) | 0 (0.0%) |
| College or Associate's Degree | 92 (100.0%) | 0 (0.0%) |
| Bachelor's Degree | 127 (78.9%) | 34 (21.1%) |
| Graduate Degree | 89 (100.0%) | 0 (0.0%) |
| Total | 308 (90.1%) | 34 (9.9%) |
Employment Characteristics in Hicksville
Employment by Class of Employer in Hicksville
Among the 23,212 employed individuals in Hicksville, private company employees (15,792 | 68.0%), not-for-profit organizations (2,154 | 9.3%), and local government employees (1,900 | 8.2%) make up the most common classes of employment.
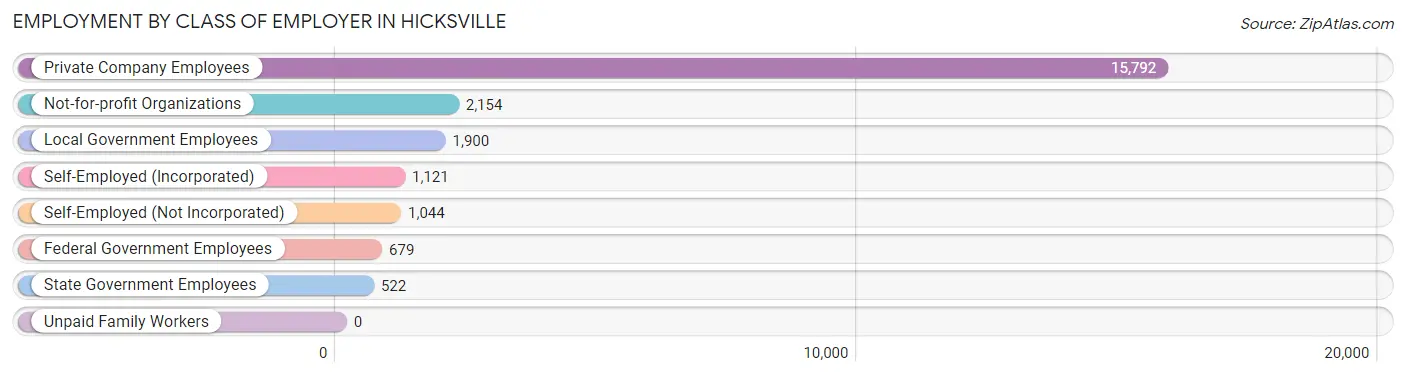
| Employer Class | # Employees | % Employees |
| Private Company Employees | 15,792 | 68.0% |
| Self-Employed (Incorporated) | 1,121 | 4.8% |
| Self-Employed (Not Incorporated) | 1,044 | 4.5% |
| Not-for-profit Organizations | 2,154 | 9.3% |
| Local Government Employees | 1,900 | 8.2% |
| State Government Employees | 522 | 2.2% |
| Federal Government Employees | 679 | 2.9% |
| Unpaid Family Workers | 0 | 0.0% |
| Total | 23,212 | 100.0% |
Employment Status by Age in Hicksville
According to the labor force statistics for Hicksville, out of the total population over 16 years of age (37,102), 65.9% or 24,450 individuals are in the labor force, with 3.8% or 929 of them unemployed. The age group with the highest labor force participation rate is 25 to 29 years, with 89.4% or 2,668 individuals in the labor force. Within the labor force, the 16 to 19 years age range has the highest percentage of unemployed individuals, with 16.2% or 135 of them being unemployed.
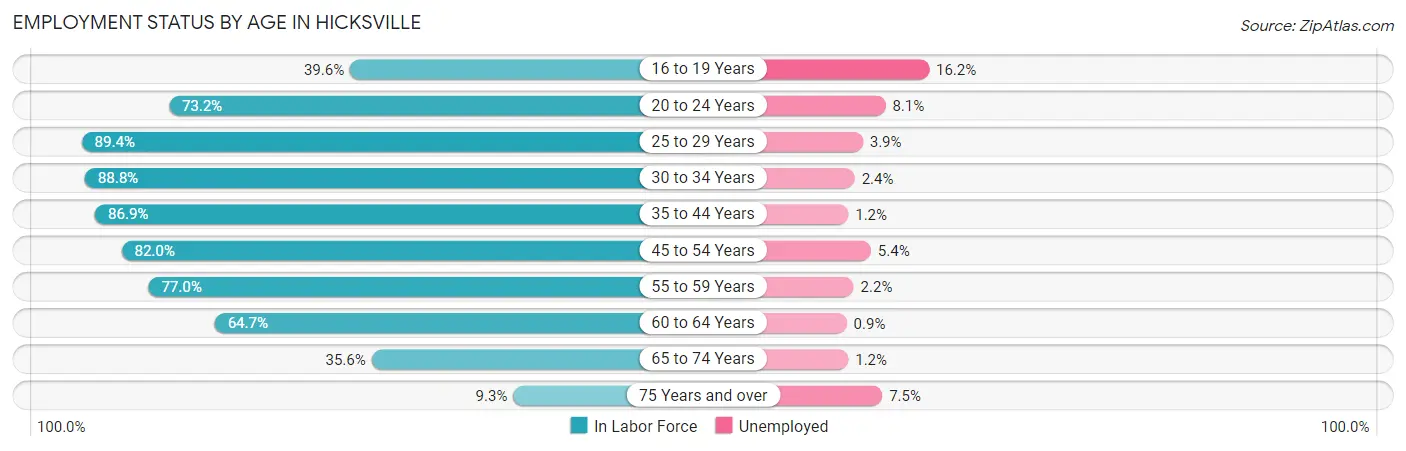
| Age Bracket | In Labor Force | Unemployed |
| 16 to 19 Years | 832 (39.6%) | 135 (16.2%) |
| 20 to 24 Years | 2,570 (73.2%) | 208 (8.1%) |
| 25 to 29 Years | 2,668 (89.4%) | 104 (3.9%) |
| 30 to 34 Years | 2,421 (88.8%) | 58 (2.4%) |
| 35 to 44 Years | 4,523 (86.9%) | 54 (1.2%) |
| 45 to 54 Years | 4,354 (82.0%) | 235 (5.4%) |
| 55 to 59 Years | 3,091 (77.0%) | 68 (2.2%) |
| 60 to 64 Years | 2,131 (64.7%) | 19 (0.9%) |
| 65 to 74 Years | 1,513 (35.6%) | 18 (1.2%) |
| 75 Years and over | 345 (9.3%) | 26 (7.5%) |
| Total | 24,450 (65.9%) | 929 (3.8%) |
Employment Status by Educational Attainment in Hicksville
According to labor force statistics for Hicksville, 81.5% of individuals (19,179) out of the total population between 25 and 64 years of age (23,532) are in the labor force, with 2.8% or 537 of them being unemployed. The group with the highest labor force participation rate are those with the educational attainment of bachelor's degree or higher, with 91.6% or 10,563 individuals in the labor force. Within the labor force, individuals with college / associate degree education have the highest percentage of unemployment, with 3.8% or 151 of them being unemployed.
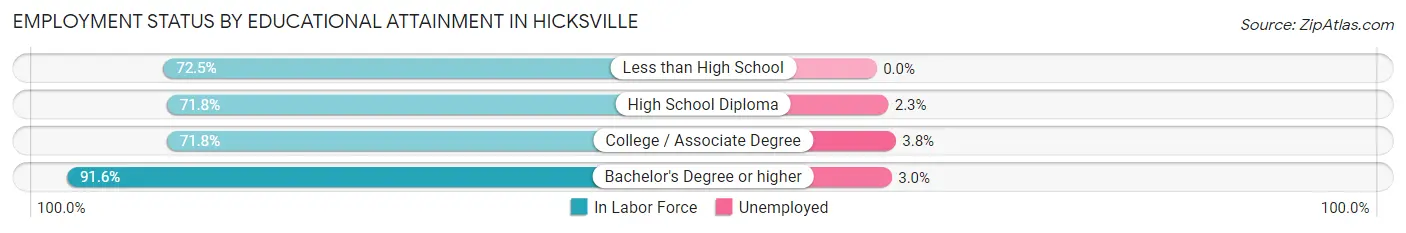
| Educational Attainment | In Labor Force | Unemployed |
| Less than High School | 1,349 (72.5%) | 0 (0.0%) |
| High School Diploma | 3,306 (71.8%) | 106 (2.3%) |
| College / Associate Degree | 3,973 (71.8%) | 210 (3.8%) |
| Bachelor's Degree or higher | 10,563 (91.6%) | 346 (3.0%) |
| Total | 19,179 (81.5%) | 659 (2.8%) |
Employment Occupations by Sex in Hicksville
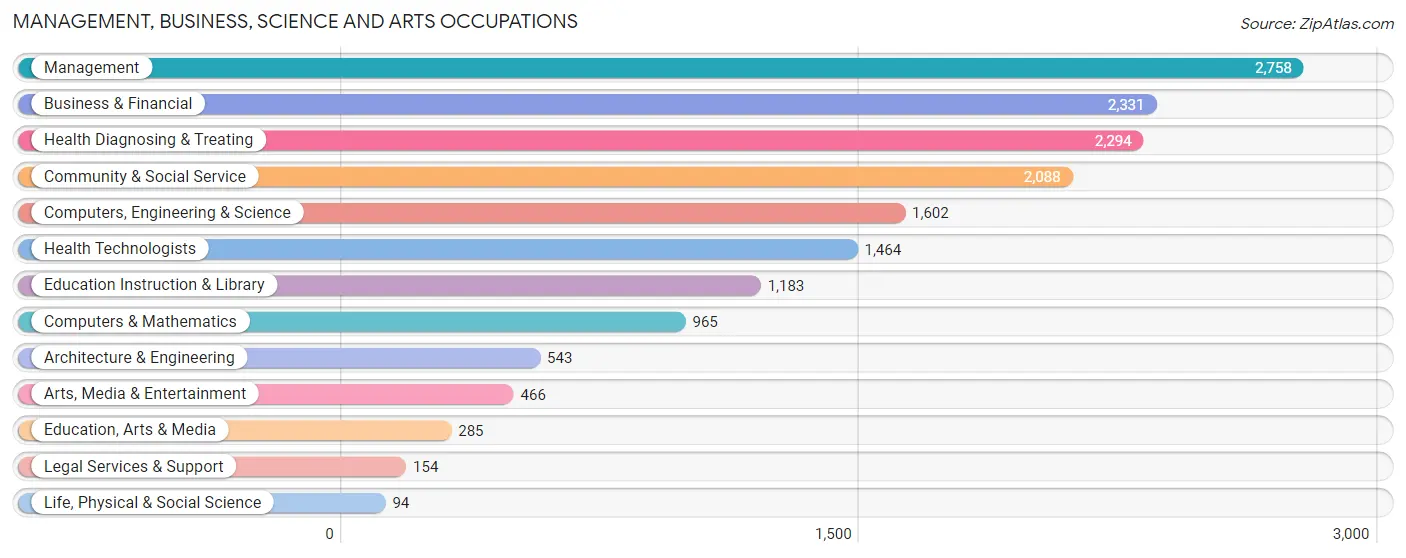
Management, Business, Science and Arts Occupations
The most common Management, Business, Science and Arts occupations in Hicksville are Management (2,758 | 11.7%), Business & Financial (2,331 | 9.9%), Health Diagnosing & Treating (2,294 | 9.8%), Community & Social Service (2,088 | 8.9%), and Computers, Engineering & Science (1,602 | 6.8%).
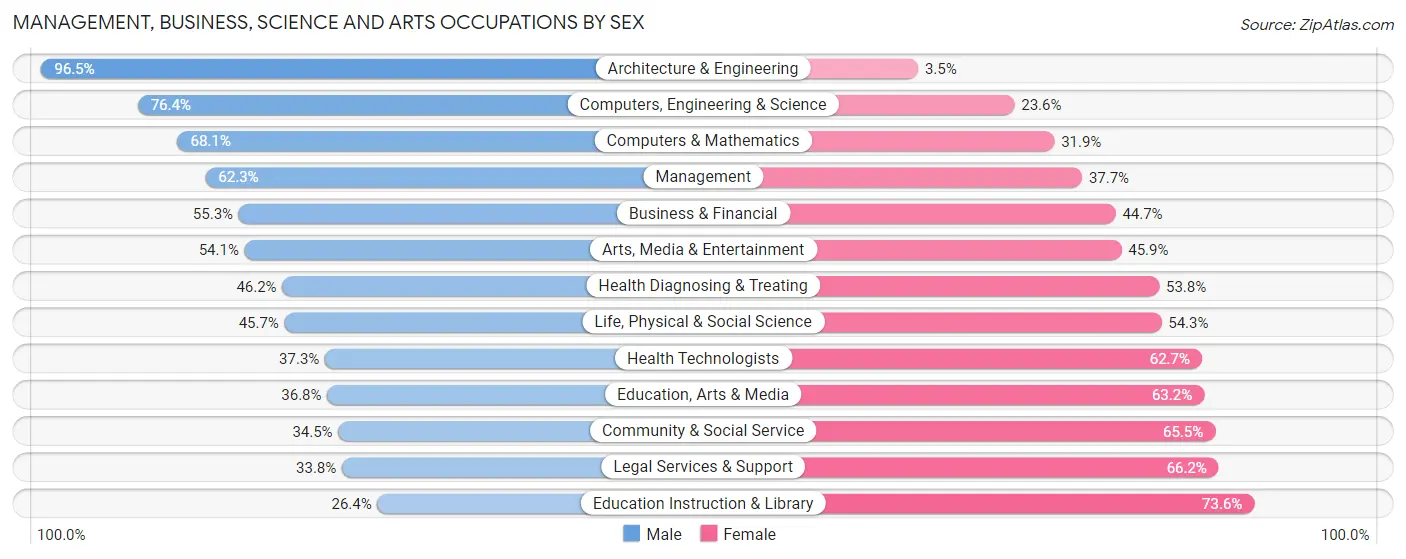
Management, Business, Science and Arts Occupations by Sex
Within the Management, Business, Science and Arts occupations in Hicksville, the most male-oriented occupations are Architecture & Engineering (96.5%), Computers, Engineering & Science (76.4%), and Computers & Mathematics (68.1%), while the most female-oriented occupations are Education Instruction & Library (73.6%), Legal Services & Support (66.2%), and Community & Social Service (65.5%).
| Occupation | Male | Female |
| Management | 1,718 (62.3%) | 1,040 (37.7%) |
| Business & Financial | 1,289 (55.3%) | 1,042 (44.7%) |
| Computers, Engineering & Science | 1,224 (76.4%) | 378 (23.6%) |
| Computers & Mathematics | 657 (68.1%) | 308 (31.9%) |
| Architecture & Engineering | 524 (96.5%) | 19 (3.5%) |
| Life, Physical & Social Science | 43 (45.7%) | 51 (54.3%) |
| Community & Social Service | 721 (34.5%) | 1,367 (65.5%) |
| Education, Arts & Media | 105 (36.8%) | 180 (63.2%) |
| Legal Services & Support | 52 (33.8%) | 102 (66.2%) |
| Education Instruction & Library | 312 (26.4%) | 871 (73.6%) |
| Arts, Media & Entertainment | 252 (54.1%) | 214 (45.9%) |
| Health Diagnosing & Treating | 1,060 (46.2%) | 1,234 (53.8%) |
| Health Technologists | 546 (37.3%) | 918 (62.7%) |
| Total (Category) | 6,012 (54.3%) | 5,061 (45.7%) |
| Total (Overall) | 13,661 (58.1%) | 9,862 (41.9%) |
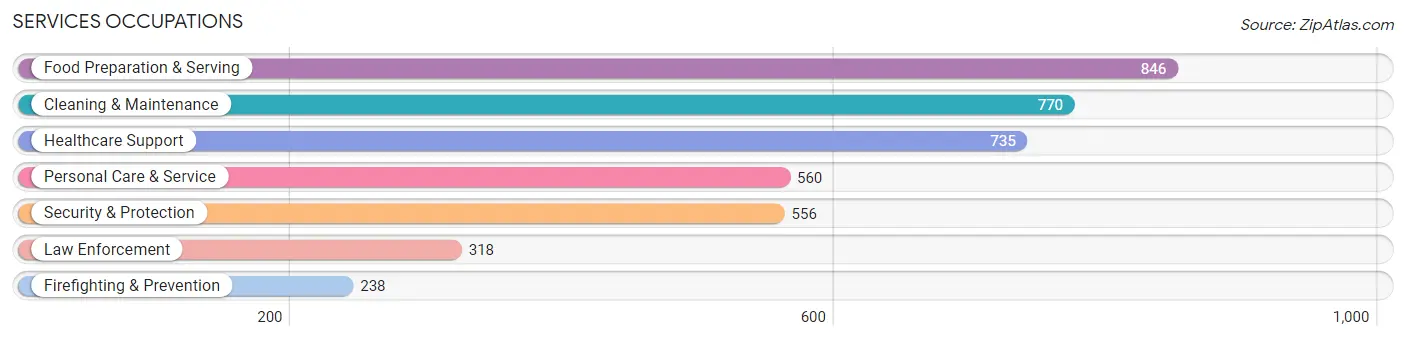
Services Occupations
The most common Services occupations in Hicksville are Food Preparation & Serving (846 | 3.6%), Cleaning & Maintenance (770 | 3.3%), Healthcare Support (735 | 3.1%), Personal Care & Service (560 | 2.4%), and Security & Protection (556 | 2.4%).
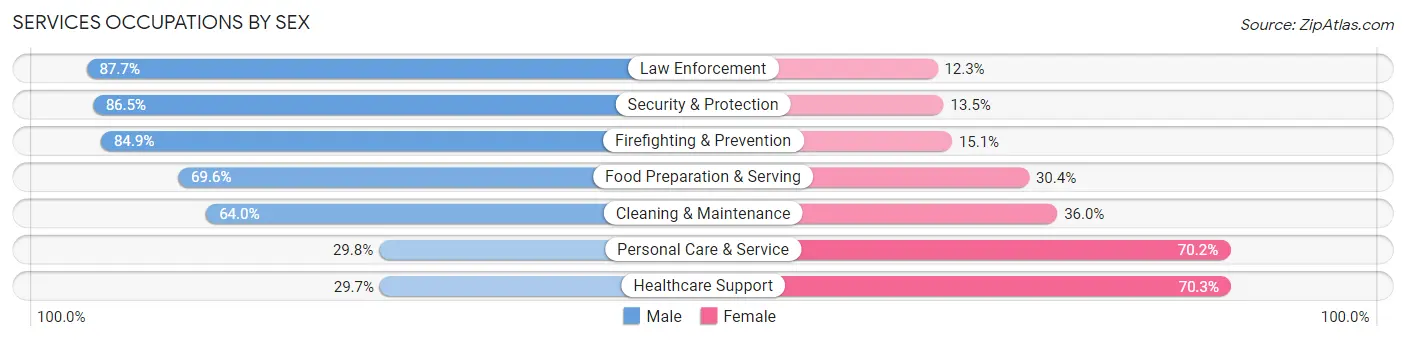
Services Occupations by Sex
Within the Services occupations in Hicksville, the most male-oriented occupations are Law Enforcement (87.7%), Security & Protection (86.5%), and Firefighting & Prevention (84.9%), while the most female-oriented occupations are Healthcare Support (70.3%), Personal Care & Service (70.2%), and Cleaning & Maintenance (36.0%).
| Occupation | Male | Female |
| Healthcare Support | 218 (29.7%) | 517 (70.3%) |
| Security & Protection | 481 (86.5%) | 75 (13.5%) |
| Firefighting & Prevention | 202 (84.9%) | 36 (15.1%) |
| Law Enforcement | 279 (87.7%) | 39 (12.3%) |
| Food Preparation & Serving | 589 (69.6%) | 257 (30.4%) |
| Cleaning & Maintenance | 493 (64.0%) | 277 (36.0%) |
| Personal Care & Service | 167 (29.8%) | 393 (70.2%) |
| Total (Category) | 1,948 (56.2%) | 1,519 (43.8%) |
| Total (Overall) | 13,661 (58.1%) | 9,862 (41.9%) |
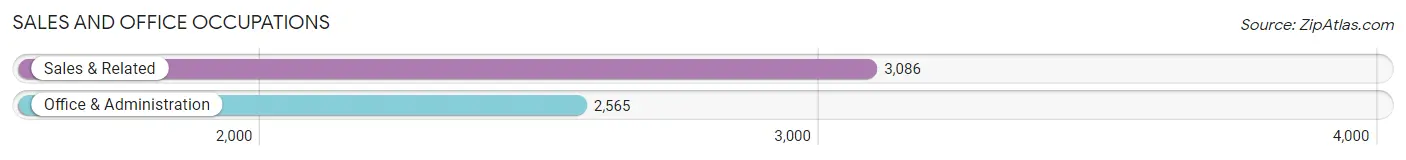
Sales and Office Occupations
The most common Sales and Office occupations in Hicksville are Sales & Related (3,086 | 13.1%), and Office & Administration (2,565 | 10.9%).
Sales and Office Occupations by Sex
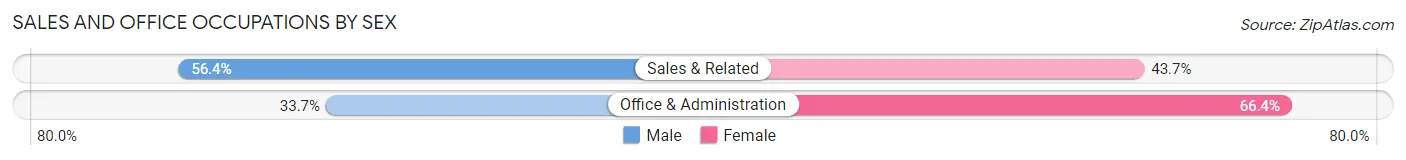
| Occupation | Male | Female |
| Sales & Related | 1,739 (56.4%) | 1,347 (43.6%) |
| Office & Administration | 863 (33.7%) | 1,702 (66.3%) |
| Total (Category) | 2,602 (46.0%) | 3,049 (54.0%) |
| Total (Overall) | 13,661 (58.1%) | 9,862 (41.9%) |
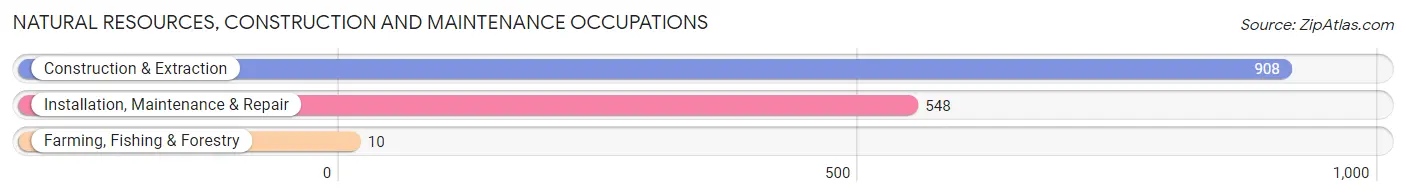
Natural Resources, Construction and Maintenance Occupations
The most common Natural Resources, Construction and Maintenance occupations in Hicksville are Construction & Extraction (908 | 3.9%), Installation, Maintenance & Repair (548 | 2.3%), and Farming, Fishing & Forestry (10 | 0.0%).
Natural Resources, Construction and Maintenance Occupations by Sex
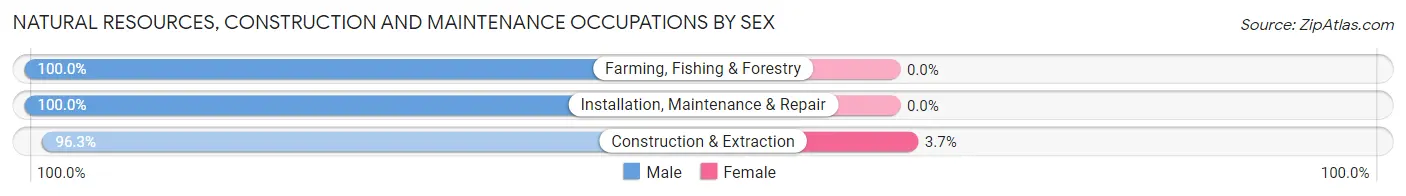
| Occupation | Male | Female |
| Farming, Fishing & Forestry | 10 (100.0%) | 0 (0.0%) |
| Construction & Extraction | 874 (96.3%) | 34 (3.7%) |
| Installation, Maintenance & Repair | 548 (100.0%) | 0 (0.0%) |
| Total (Category) | 1,432 (97.7%) | 34 (2.3%) |
| Total (Overall) | 13,661 (58.1%) | 9,862 (41.9%) |
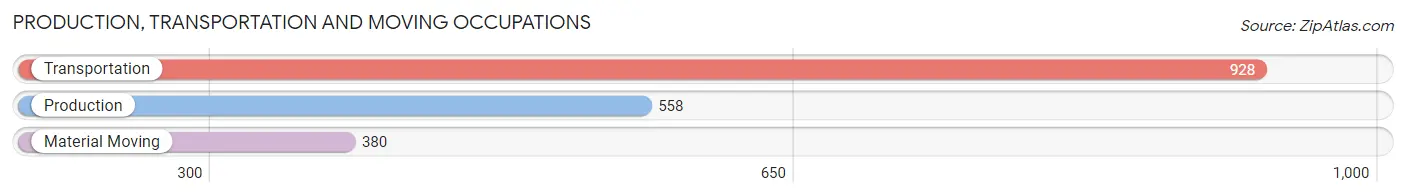
Production, Transportation and Moving Occupations
The most common Production, Transportation and Moving occupations in Hicksville are Transportation (928 | 4.0%), Production (558 | 2.4%), and Material Moving (380 | 1.6%).
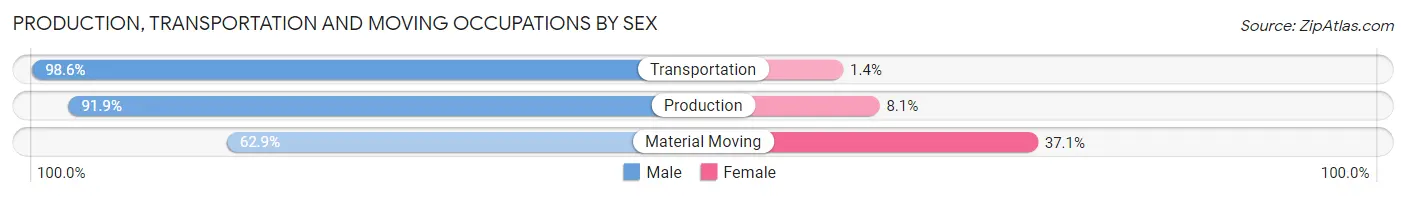
Production, Transportation and Moving Occupations by Sex
| Occupation | Male | Female |
| Production | 513 (91.9%) | 45 (8.1%) |
| Transportation | 915 (98.6%) | 13 (1.4%) |
| Material Moving | 239 (62.9%) | 141 (37.1%) |
| Total (Category) | 1,667 (89.3%) | 199 (10.7%) |
| Total (Overall) | 13,661 (58.1%) | 9,862 (41.9%) |
Employment Industries by Sex in Hicksville
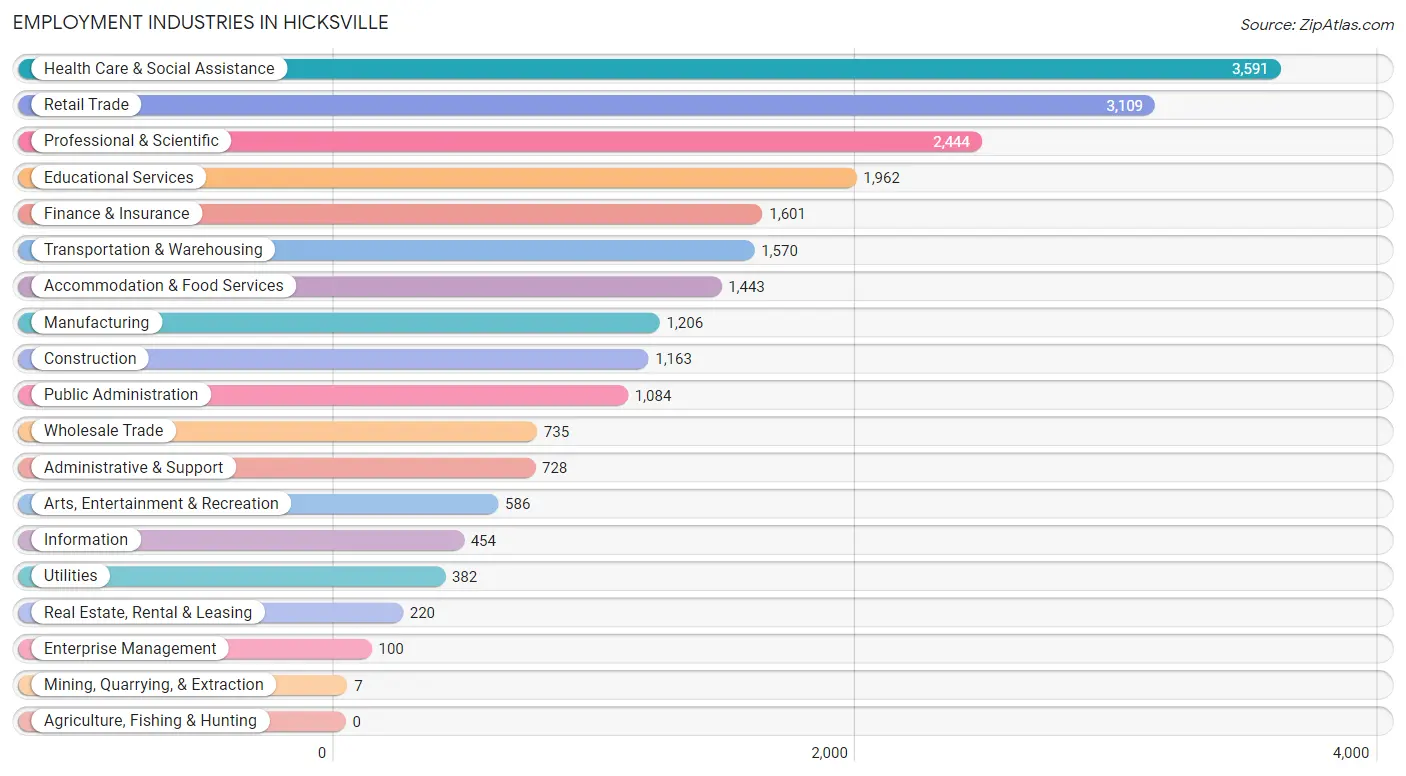
Employment Industries in Hicksville
The major employment industries in Hicksville include Health Care & Social Assistance (3,591 | 15.3%), Retail Trade (3,109 | 13.2%), Professional & Scientific (2,444 | 10.4%), Educational Services (1,962 | 8.3%), and Finance & Insurance (1,601 | 6.8%).
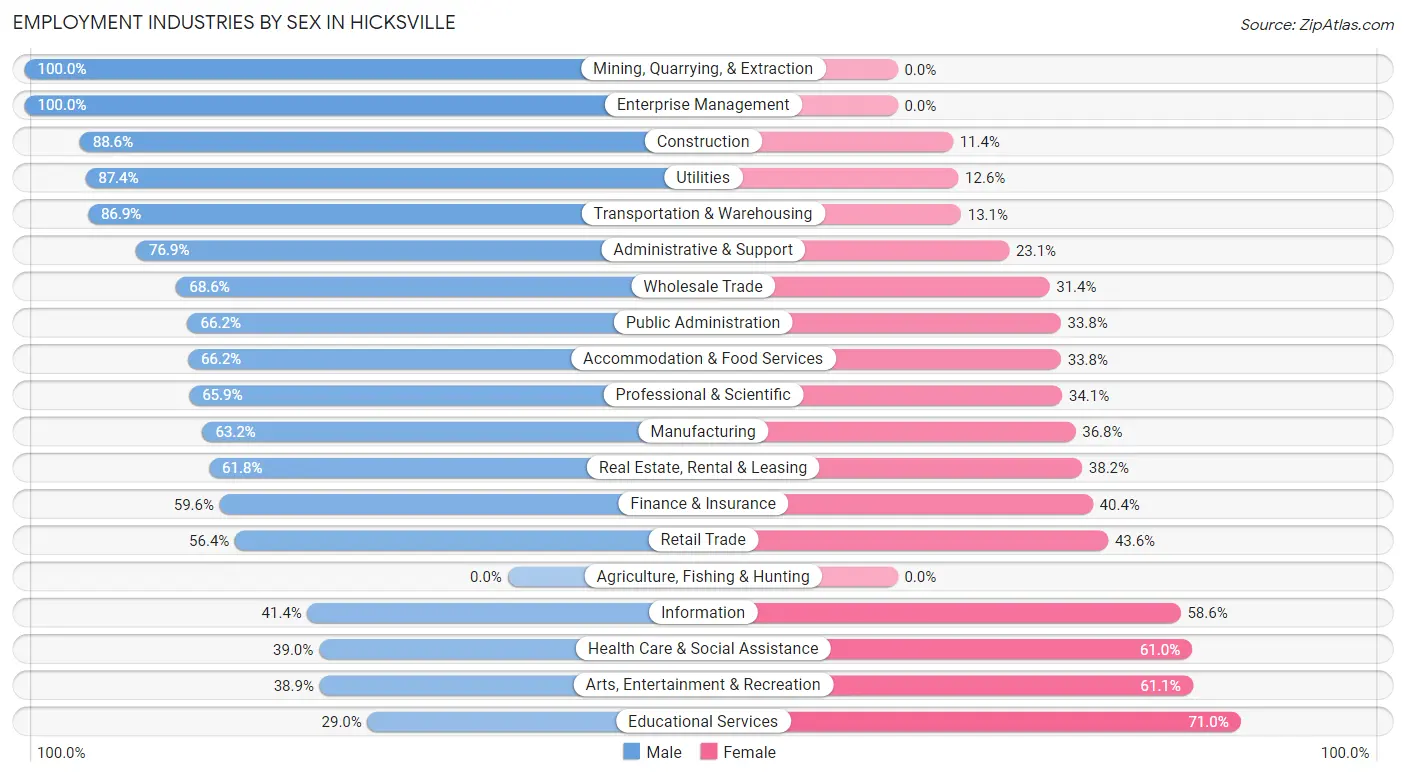
Employment Industries by Sex in Hicksville
The Hicksville industries that see more men than women are Mining, Quarrying, & Extraction (100.0%), Enterprise Management (100.0%), and Construction (88.6%), whereas the industries that tend to have a higher number of women are Educational Services (71.0%), Arts, Entertainment & Recreation (61.1%), and Health Care & Social Assistance (61.0%).
| Industry | Male | Female |
| Agriculture, Fishing & Hunting | 0 (0.0%) | 0 (0.0%) |
| Mining, Quarrying, & Extraction | 7 (100.0%) | 0 (0.0%) |
| Construction | 1,030 (88.6%) | 133 (11.4%) |
| Manufacturing | 762 (63.2%) | 444 (36.8%) |
| Wholesale Trade | 504 (68.6%) | 231 (31.4%) |
| Retail Trade | 1,754 (56.4%) | 1,355 (43.6%) |
| Transportation & Warehousing | 1,364 (86.9%) | 206 (13.1%) |
| Utilities | 334 (87.4%) | 48 (12.6%) |
| Information | 188 (41.4%) | 266 (58.6%) |
| Finance & Insurance | 954 (59.6%) | 647 (40.4%) |
| Real Estate, Rental & Leasing | 136 (61.8%) | 84 (38.2%) |
| Professional & Scientific | 1,611 (65.9%) | 833 (34.1%) |
| Enterprise Management | 100 (100.0%) | 0 (0.0%) |
| Administrative & Support | 560 (76.9%) | 168 (23.1%) |
| Educational Services | 569 (29.0%) | 1,393 (71.0%) |
| Health Care & Social Assistance | 1,402 (39.0%) | 2,189 (61.0%) |
| Arts, Entertainment & Recreation | 228 (38.9%) | 358 (61.1%) |
| Accommodation & Food Services | 955 (66.2%) | 488 (33.8%) |
| Public Administration | 718 (66.2%) | 366 (33.8%) |
| Total | 13,661 (58.1%) | 9,862 (41.9%) |
Education in Hicksville
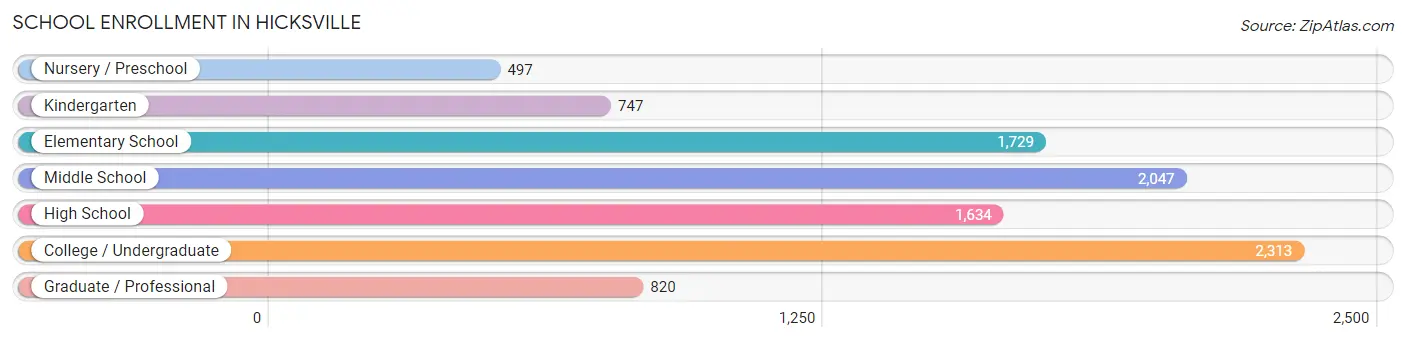
School Enrollment in Hicksville
The most common levels of schooling among the 9,787 students in Hicksville are college / undergraduate (2,313 | 23.6%), middle school (2,047 | 20.9%), and elementary school (1,729 | 17.7%).
| School Level | # Students | % Students |
| Nursery / Preschool | 497 | 5.1% |
| Kindergarten | 747 | 7.6% |
| Elementary School | 1,729 | 17.7% |
| Middle School | 2,047 | 20.9% |
| High School | 1,634 | 16.7% |
| College / Undergraduate | 2,313 | 23.6% |
| Graduate / Professional | 820 | 8.4% |
| Total | 9,787 | 100.0% |
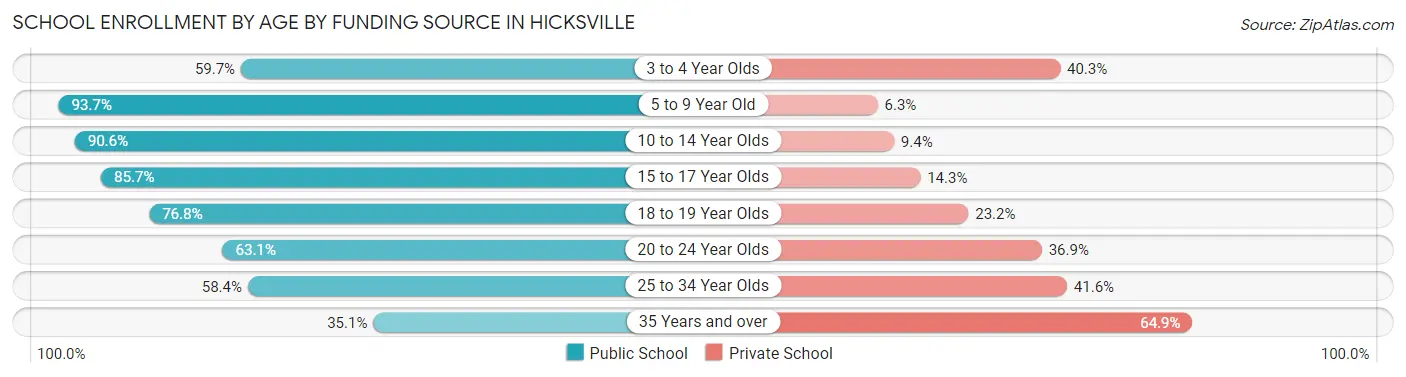
School Enrollment by Age by Funding Source in Hicksville
Out of a total of 9,787 students who are enrolled in schools in Hicksville, 1,997 (20.4%) attend a private institution, while the remaining 7,790 (79.6%) are enrolled in public schools. The age group of 35 years and over has the highest likelihood of being enrolled in private schools, with 276 (64.9% in the age bracket) enrolled. Conversely, the age group of 5 to 9 year old has the lowest likelihood of being enrolled in a private school, with 2,223 (93.7% in the age bracket) attending a public institution.
| Age Bracket | Public School | Private School |
| 3 to 4 Year Olds | 283 (59.7%) | 191 (40.3%) |
| 5 to 9 Year Old | 2,223 (93.7%) | 150 (6.3%) |
| 10 to 14 Year Olds | 2,159 (90.6%) | 223 (9.4%) |
| 15 to 17 Year Olds | 950 (85.7%) | 158 (14.3%) |
| 18 to 19 Year Olds | 754 (76.8%) | 228 (23.2%) |
| 20 to 24 Year Olds | 1,042 (63.1%) | 609 (36.9%) |
| 25 to 34 Year Olds | 229 (58.4%) | 163 (41.6%) |
| 35 Years and over | 149 (35.1%) | 276 (64.9%) |
| Total | 7,790 (79.6%) | 1,997 (20.4%) |
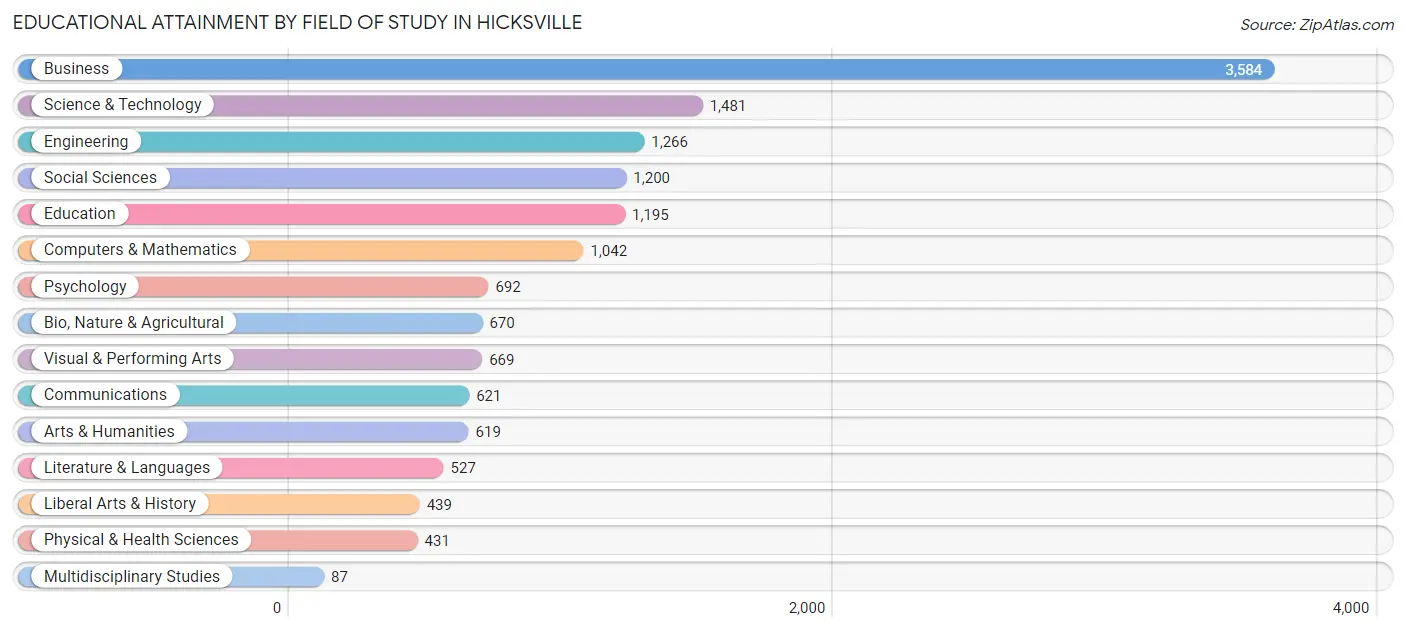
Educational Attainment by Field of Study in Hicksville
Business (3,584 | 24.7%), science & technology (1,481 | 10.2%), engineering (1,266 | 8.7%), social sciences (1,200 | 8.3%), and education (1,195 | 8.2%) are the most common fields of study among 14,523 individuals in Hicksville who have obtained a bachelor's degree or higher.
| Field of Study | # Graduates | % Graduates |
| Computers & Mathematics | 1,042 | 7.2% |
| Bio, Nature & Agricultural | 670 | 4.6% |
| Physical & Health Sciences | 431 | 3.0% |
| Psychology | 692 | 4.8% |
| Social Sciences | 1,200 | 8.3% |
| Engineering | 1,266 | 8.7% |
| Multidisciplinary Studies | 87 | 0.6% |
| Science & Technology | 1,481 | 10.2% |
| Business | 3,584 | 24.7% |
| Education | 1,195 | 8.2% |
| Literature & Languages | 527 | 3.6% |
| Liberal Arts & History | 439 | 3.0% |
| Visual & Performing Arts | 669 | 4.6% |
| Communications | 621 | 4.3% |
| Arts & Humanities | 619 | 4.3% |
| Total | 14,523 | 100.0% |
Transportation & Commute in Hicksville
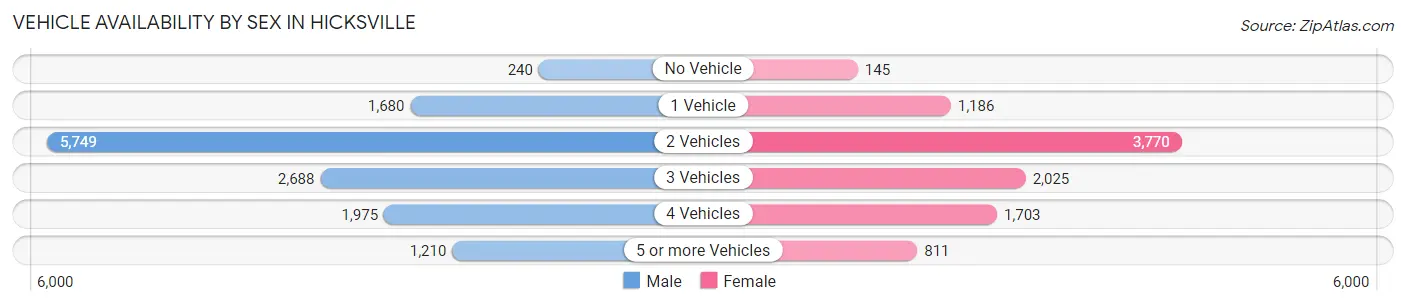
Vehicle Availability by Sex in Hicksville
The most prevalent vehicle ownership categories in Hicksville are males with 2 vehicles (5,749, accounting for 42.4%) and females with 2 vehicles (3,770, making up 59.6%).
| Vehicles Available | Male | Female |
| No Vehicle | 240 (1.8%) | 145 (1.5%) |
| 1 Vehicle | 1,680 (12.4%) | 1,186 (12.3%) |
| 2 Vehicles | 5,749 (42.4%) | 3,770 (39.1%) |
| 3 Vehicles | 2,688 (19.9%) | 2,025 (21.0%) |
| 4 Vehicles | 1,975 (14.6%) | 1,703 (17.7%) |
| 5 or more Vehicles | 1,210 (8.9%) | 811 (8.4%) |
| Total | 13,542 (100.0%) | 9,640 (100.0%) |
Commute Time in Hicksville
The most frequently occuring commute durations in Hicksville are 30 to 34 minutes (2,824 commuters, 14.1%), 20 to 24 minutes (2,813 commuters, 14.0%), and 15 to 19 minutes (2,728 commuters, 13.6%).
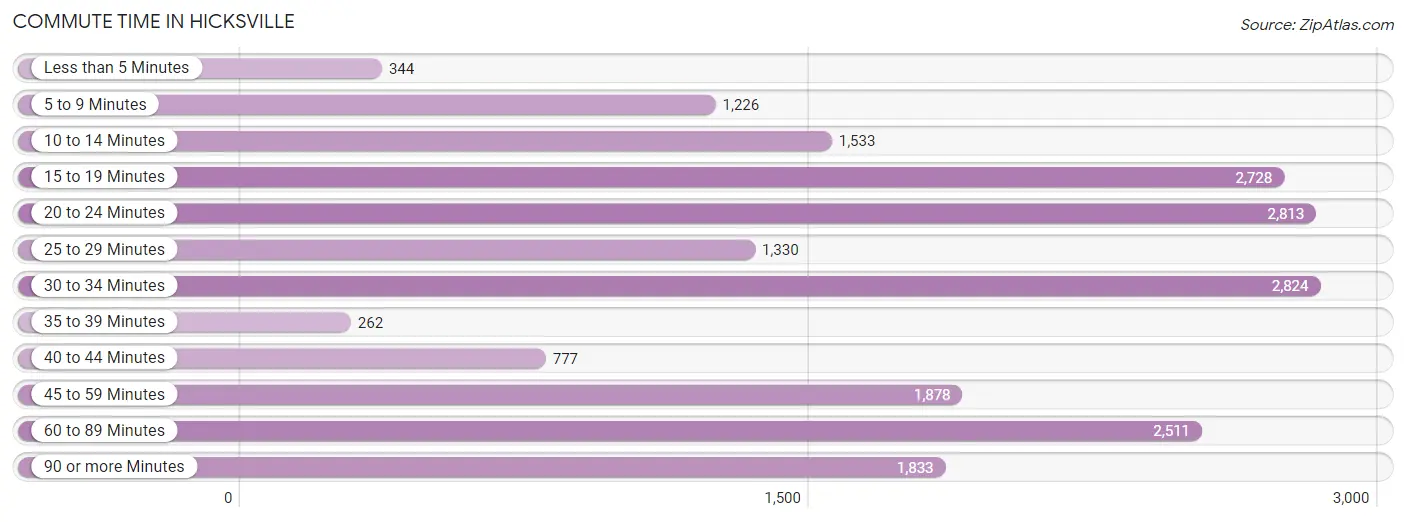
| Commute Time | # Commuters | % Commuters |
| Less than 5 Minutes | 344 | 1.7% |
| 5 to 9 Minutes | 1,226 | 6.1% |
| 10 to 14 Minutes | 1,533 | 7.6% |
| 15 to 19 Minutes | 2,728 | 13.6% |
| 20 to 24 Minutes | 2,813 | 14.0% |
| 25 to 29 Minutes | 1,330 | 6.6% |
| 30 to 34 Minutes | 2,824 | 14.1% |
| 35 to 39 Minutes | 262 | 1.3% |
| 40 to 44 Minutes | 777 | 3.9% |
| 45 to 59 Minutes | 1,878 | 9.4% |
| 60 to 89 Minutes | 2,511 | 12.5% |
| 90 or more Minutes | 1,833 | 9.1% |
Commute Time by Sex in Hicksville
The most common commute times in Hicksville are 30 to 34 minutes (1,742 commuters, 14.6%) for males and 15 to 19 minutes (1,215 commuters, 14.9%) for females.
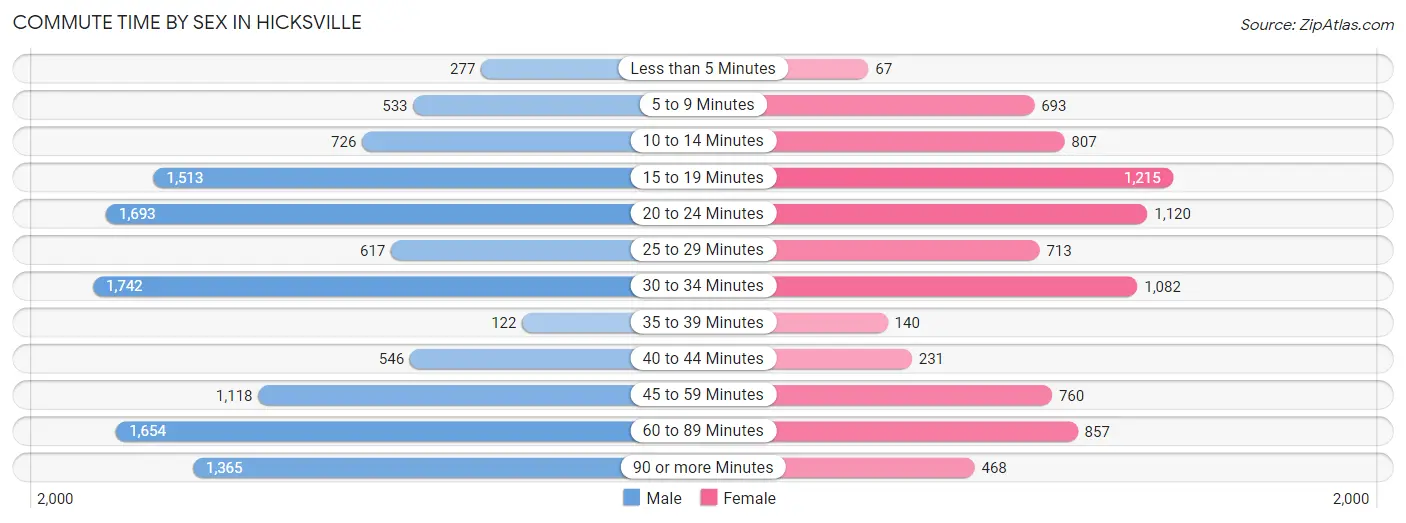
| Commute Time | Male | Female |
| Less than 5 Minutes | 277 (2.3%) | 67 (0.8%) |
| 5 to 9 Minutes | 533 (4.5%) | 693 (8.5%) |
| 10 to 14 Minutes | 726 (6.1%) | 807 (9.9%) |
| 15 to 19 Minutes | 1,513 (12.7%) | 1,215 (14.9%) |
| 20 to 24 Minutes | 1,693 (14.2%) | 1,120 (13.7%) |
| 25 to 29 Minutes | 617 (5.2%) | 713 (8.7%) |
| 30 to 34 Minutes | 1,742 (14.6%) | 1,082 (13.3%) |
| 35 to 39 Minutes | 122 (1.0%) | 140 (1.7%) |
| 40 to 44 Minutes | 546 (4.6%) | 231 (2.8%) |
| 45 to 59 Minutes | 1,118 (9.4%) | 760 (9.3%) |
| 60 to 89 Minutes | 1,654 (13.9%) | 857 (10.5%) |
| 90 or more Minutes | 1,365 (11.5%) | 468 (5.7%) |
Time of Departure to Work by Sex in Hicksville
The most frequent times of departure to work in Hicksville are 8:00 AM to 8:29 AM (1,658, 13.9%) for males and 8:30 AM to 8:59 AM (1,377, 16.9%) for females.
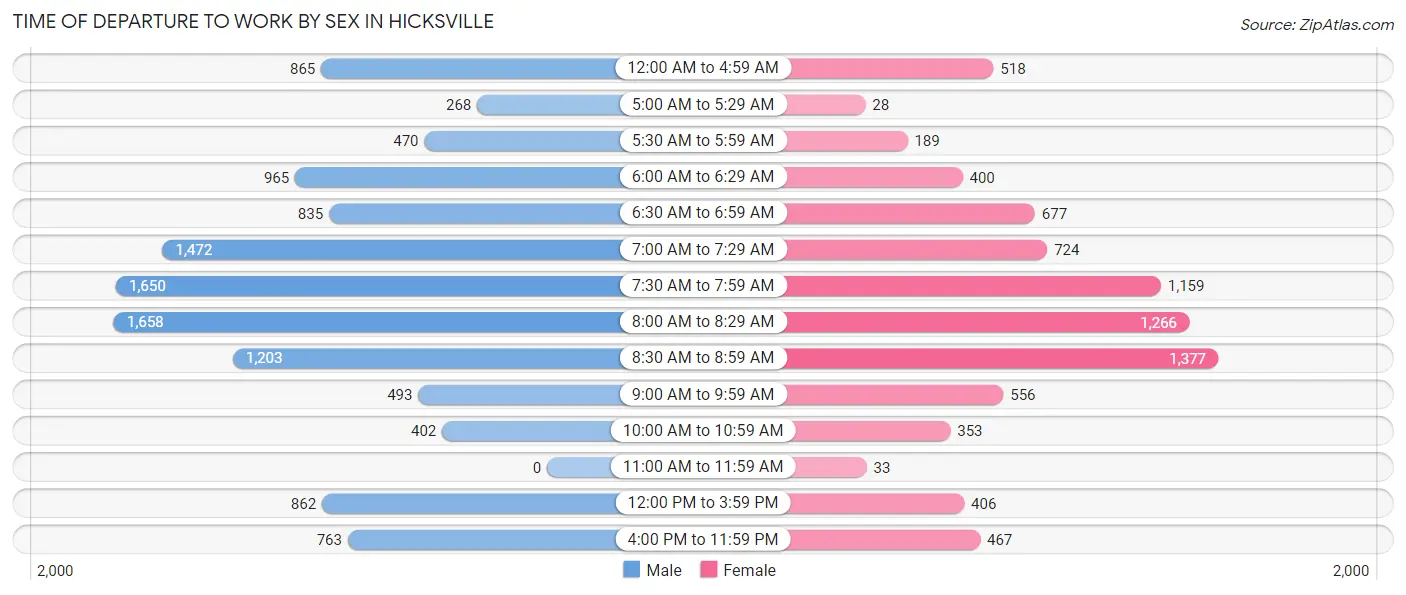
| Time of Departure | Male | Female |
| 12:00 AM to 4:59 AM | 865 (7.3%) | 518 (6.4%) |
| 5:00 AM to 5:29 AM | 268 (2.2%) | 28 (0.3%) |
| 5:30 AM to 5:59 AM | 470 (4.0%) | 189 (2.3%) |
| 6:00 AM to 6:29 AM | 965 (8.1%) | 400 (4.9%) |
| 6:30 AM to 6:59 AM | 835 (7.0%) | 677 (8.3%) |
| 7:00 AM to 7:29 AM | 1,472 (12.4%) | 724 (8.9%) |
| 7:30 AM to 7:59 AM | 1,650 (13.9%) | 1,159 (14.2%) |
| 8:00 AM to 8:29 AM | 1,658 (13.9%) | 1,266 (15.5%) |
| 8:30 AM to 8:59 AM | 1,203 (10.1%) | 1,377 (16.9%) |
| 9:00 AM to 9:59 AM | 493 (4.1%) | 556 (6.8%) |
| 10:00 AM to 10:59 AM | 402 (3.4%) | 353 (4.3%) |
| 11:00 AM to 11:59 AM | 0 (0.0%) | 33 (0.4%) |
| 12:00 PM to 3:59 PM | 862 (7.2%) | 406 (5.0%) |
| 4:00 PM to 11:59 PM | 763 (6.4%) | 467 (5.7%) |
| Total | 11,906 (100.0%) | 8,153 (100.0%) |
Housing Occupancy in Hicksville
Occupancy by Ownership in Hicksville
Of the total 13,406 dwellings in Hicksville, owner-occupied units account for 11,646 (86.9%), while renter-occupied units make up 1,760 (13.1%).
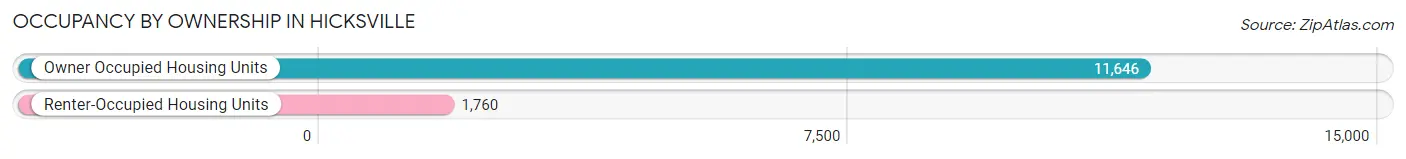
| Occupancy | # Housing Units | % Housing Units |
| Owner Occupied Housing Units | 11,646 | 86.9% |
| Renter-Occupied Housing Units | 1,760 | 13.1% |
| Total Occupied Housing Units | 13,406 | 100.0% |
Occupancy by Household Size in Hicksville
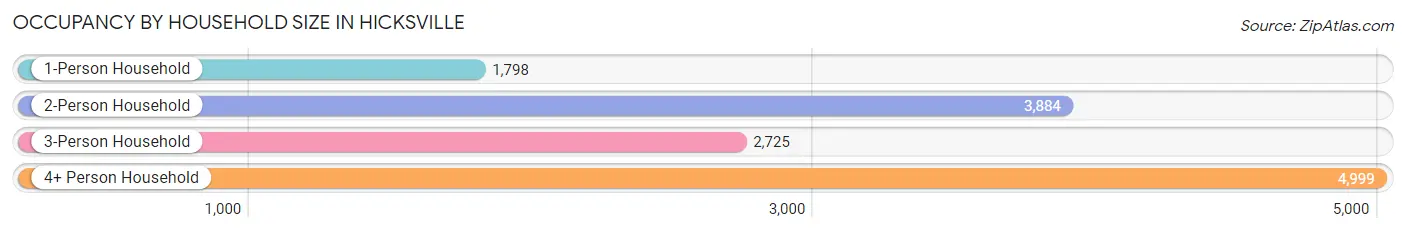
| Household Size | # Housing Units | % Housing Units |
| 1-Person Household | 1,798 | 13.4% |
| 2-Person Household | 3,884 | 29.0% |
| 3-Person Household | 2,725 | 20.3% |
| 4+ Person Household | 4,999 | 37.3% |
| Total Housing Units | 13,406 | 100.0% |
Occupancy by Ownership by Household Size in Hicksville
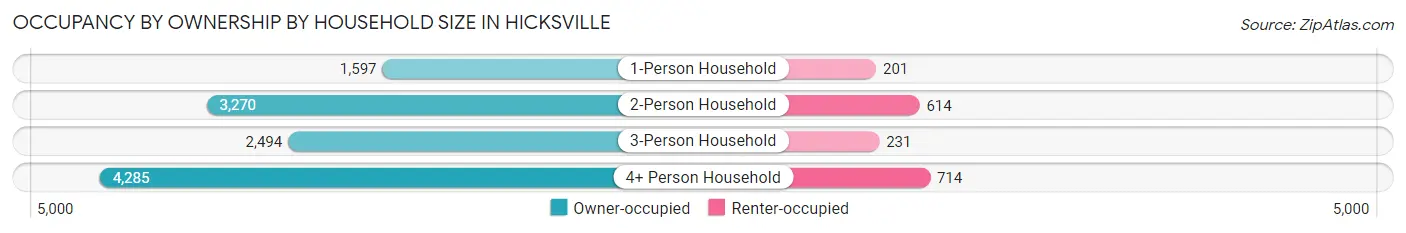
| Household Size | Owner-occupied | Renter-occupied |
| 1-Person Household | 1,597 (88.8%) | 201 (11.2%) |
| 2-Person Household | 3,270 (84.2%) | 614 (15.8%) |
| 3-Person Household | 2,494 (91.5%) | 231 (8.5%) |
| 4+ Person Household | 4,285 (85.7%) | 714 (14.3%) |
| Total Housing Units | 11,646 (86.9%) | 1,760 (13.1%) |
Occupancy by Educational Attainment in Hicksville
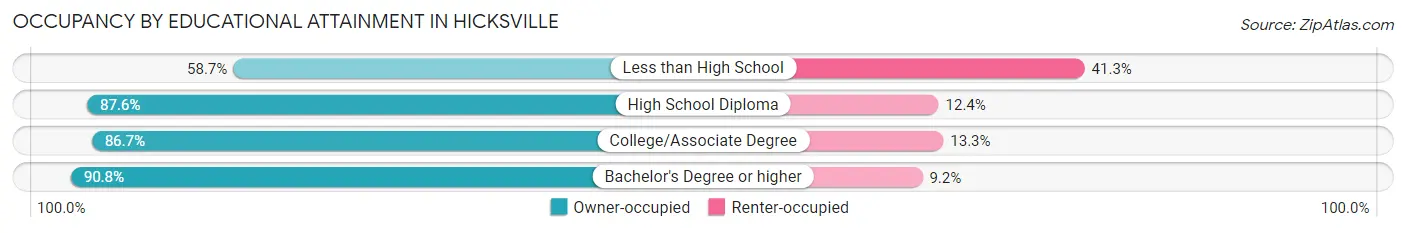
| Household Size | Owner-occupied | Renter-occupied |
| Less than High School | 518 (58.7%) | 365 (41.3%) |
| High School Diploma | 2,936 (87.6%) | 415 (12.4%) |
| College/Associate Degree | 2,903 (86.7%) | 446 (13.3%) |
| Bachelor's Degree or higher | 5,289 (90.8%) | 534 (9.2%) |
Occupancy by Age of Householder in Hicksville
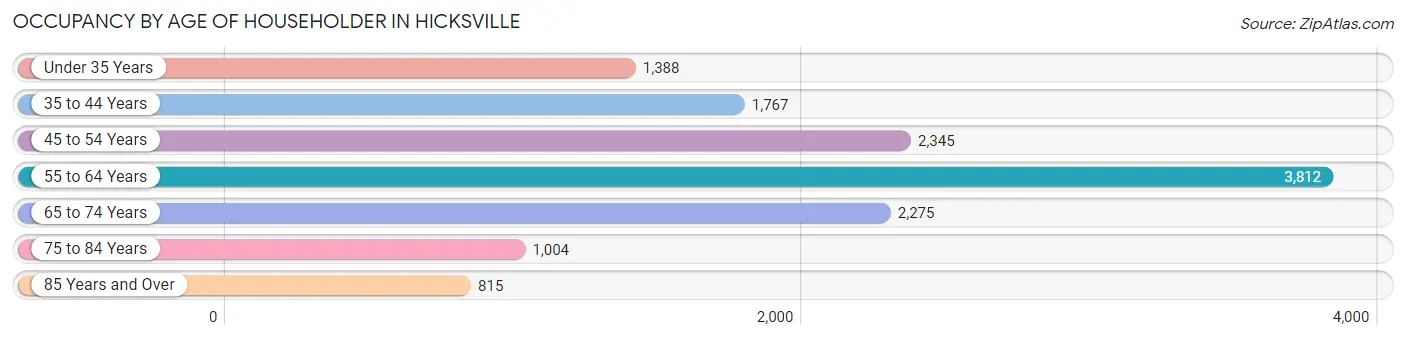
| Age Bracket | # Households | % Households |
| Under 35 Years | 1,388 | 10.3% |
| 35 to 44 Years | 1,767 | 13.2% |
| 45 to 54 Years | 2,345 | 17.5% |
| 55 to 64 Years | 3,812 | 28.4% |
| 65 to 74 Years | 2,275 | 17.0% |
| 75 to 84 Years | 1,004 | 7.5% |
| 85 Years and Over | 815 | 6.1% |
| Total | 13,406 | 100.0% |
Housing Finances in Hicksville
Median Income by Occupancy in Hicksville
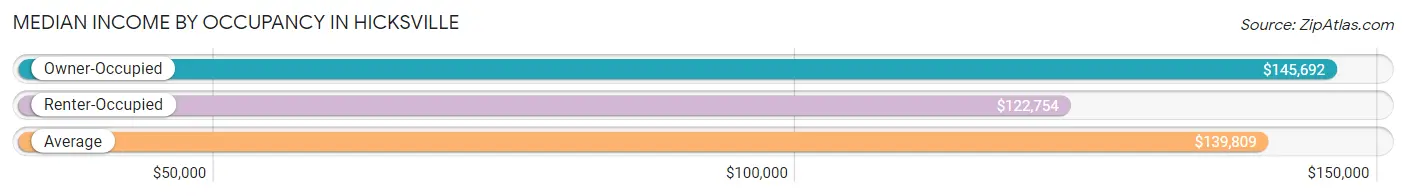
| Occupancy Type | # Households | Median Income |
| Owner-Occupied | 11,646 (86.9%) | $145,692 |
| Renter-Occupied | 1,760 (13.1%) | $122,754 |
| Average | 13,406 (100.0%) | $139,809 |
Occupancy by Householder Income Bracket in Hicksville
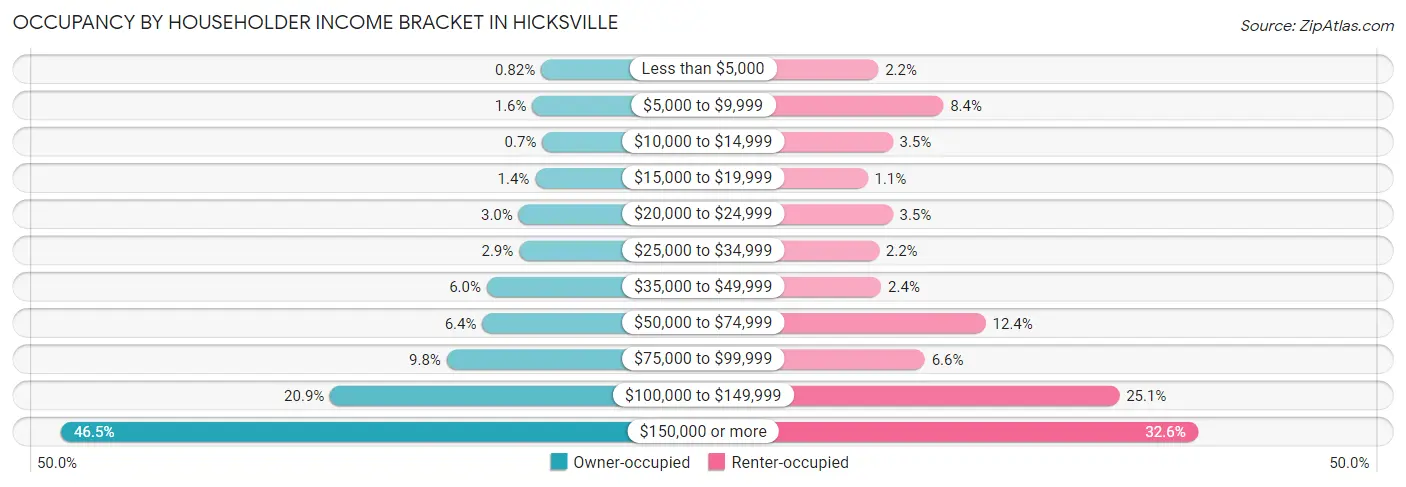
| Income Bracket | Owner-occupied | Renter-occupied |
| Less than $5,000 | 96 (0.8%) | 38 (2.2%) |
| $5,000 to $9,999 | 191 (1.6%) | 147 (8.4%) |
| $10,000 to $14,999 | 82 (0.7%) | 62 (3.5%) |
| $15,000 to $19,999 | 159 (1.4%) | 20 (1.1%) |
| $20,000 to $24,999 | 344 (2.9%) | 62 (3.5%) |
| $25,000 to $34,999 | 338 (2.9%) | 39 (2.2%) |
| $35,000 to $49,999 | 696 (6.0%) | 43 (2.4%) |
| $50,000 to $74,999 | 746 (6.4%) | 218 (12.4%) |
| $75,000 to $99,999 | 1,141 (9.8%) | 116 (6.6%) |
| $100,000 to $149,999 | 2,434 (20.9%) | 442 (25.1%) |
| $150,000 or more | 5,419 (46.5%) | 573 (32.6%) |
| Total | 11,646 (100.0%) | 1,760 (100.0%) |
Monthly Housing Cost Tiers in Hicksville
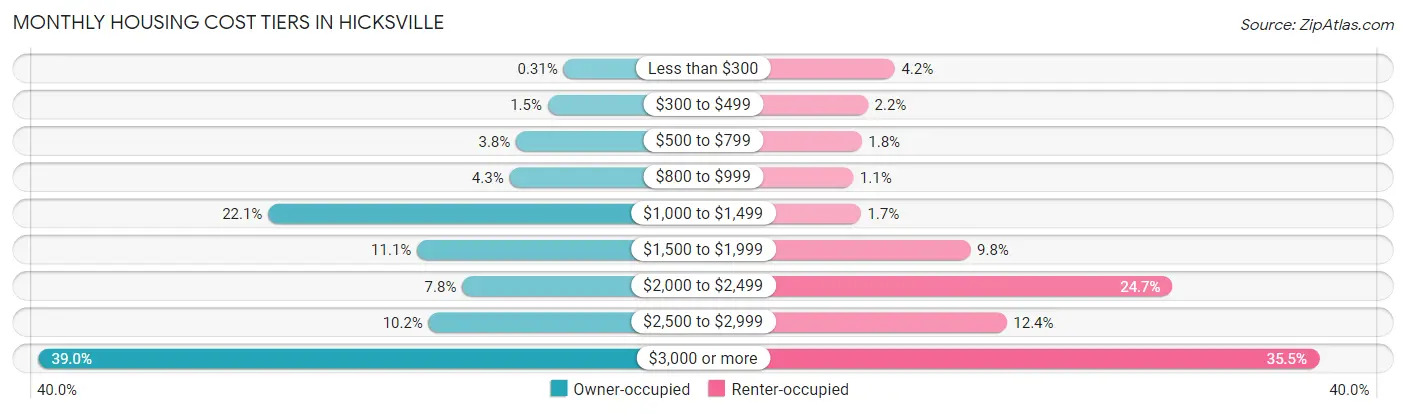
| Monthly Cost | Owner-occupied | Renter-occupied |
| Less than $300 | 36 (0.3%) | 74 (4.2%) |
| $300 to $499 | 171 (1.5%) | 39 (2.2%) |
| $500 to $799 | 443 (3.8%) | 31 (1.8%) |
| $800 to $999 | 500 (4.3%) | 20 (1.1%) |
| $1,000 to $1,499 | 2,569 (22.1%) | 30 (1.7%) |
| $1,500 to $1,999 | 1,291 (11.1%) | 172 (9.8%) |
| $2,000 to $2,499 | 905 (7.8%) | 434 (24.7%) |
| $2,500 to $2,999 | 1,193 (10.2%) | 219 (12.4%) |
| $3,000 or more | 4,538 (39.0%) | 624 (35.4%) |
| Total | 11,646 (100.0%) | 1,760 (100.0%) |
Physical Housing Characteristics in Hicksville
Housing Structures in Hicksville
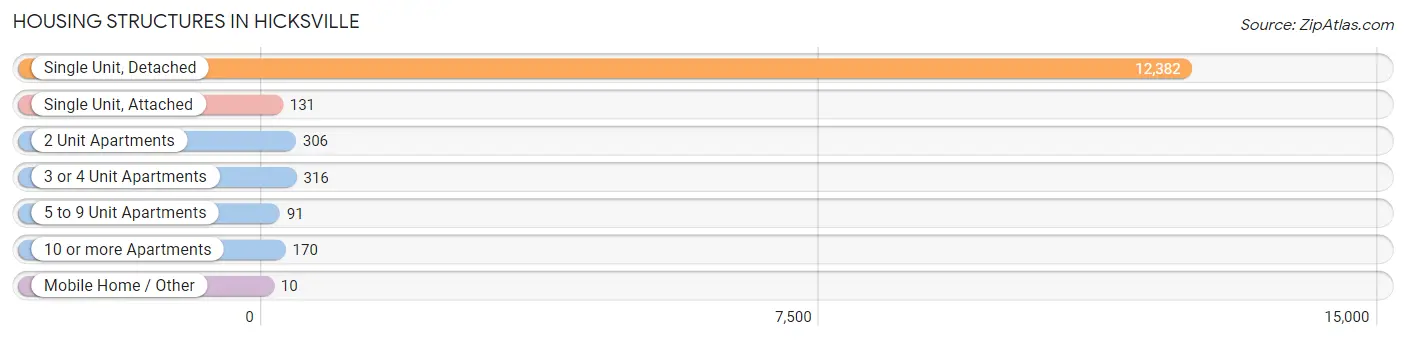
| Structure Type | # Housing Units | % Housing Units |
| Single Unit, Detached | 12,382 | 92.4% |
| Single Unit, Attached | 131 | 1.0% |
| 2 Unit Apartments | 306 | 2.3% |
| 3 or 4 Unit Apartments | 316 | 2.4% |
| 5 to 9 Unit Apartments | 91 | 0.7% |
| 10 or more Apartments | 170 | 1.3% |
| Mobile Home / Other | 10 | 0.1% |
| Total | 13,406 | 100.0% |
Housing Structures by Occupancy in Hicksville
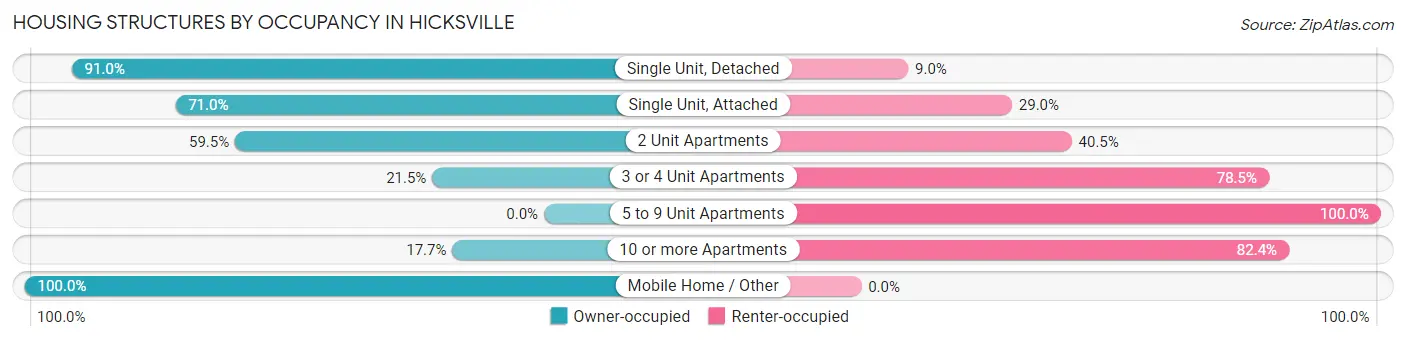
| Structure Type | Owner-occupied | Renter-occupied |
| Single Unit, Detached | 11,263 (91.0%) | 1,119 (9.0%) |
| Single Unit, Attached | 93 (71.0%) | 38 (29.0%) |
| 2 Unit Apartments | 182 (59.5%) | 124 (40.5%) |
| 3 or 4 Unit Apartments | 68 (21.5%) | 248 (78.5%) |
| 5 to 9 Unit Apartments | 0 (0.0%) | 91 (100.0%) |
| 10 or more Apartments | 30 (17.6%) | 140 (82.4%) |
| Mobile Home / Other | 10 (100.0%) | 0 (0.0%) |
| Total | 11,646 (86.9%) | 1,760 (13.1%) |
Housing Structures by Number of Rooms in Hicksville
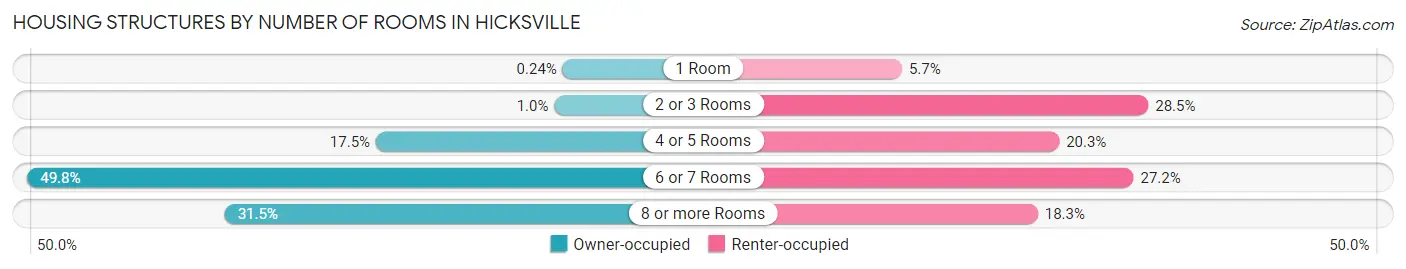
| Number of Rooms | Owner-occupied | Renter-occupied |
| 1 Room | 28 (0.2%) | 101 (5.7%) |
| 2 or 3 Rooms | 118 (1.0%) | 502 (28.5%) |
| 4 or 5 Rooms | 2,039 (17.5%) | 357 (20.3%) |
| 6 or 7 Rooms | 5,794 (49.7%) | 478 (27.2%) |
| 8 or more Rooms | 3,667 (31.5%) | 322 (18.3%) |
| Total | 11,646 (100.0%) | 1,760 (100.0%) |
Housing Structure by Heating Type in Hicksville
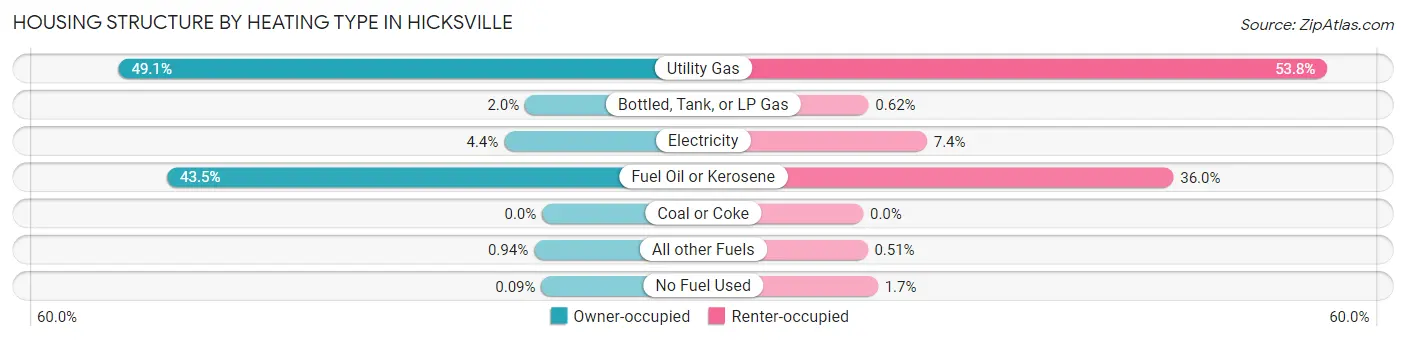
| Heating Type | Owner-occupied | Renter-occupied |
| Utility Gas | 5,719 (49.1%) | 947 (53.8%) |
| Bottled, Tank, or LP Gas | 231 (2.0%) | 11 (0.6%) |
| Electricity | 513 (4.4%) | 130 (7.4%) |
| Fuel Oil or Kerosene | 5,063 (43.5%) | 633 (36.0%) |
| Coal or Coke | 0 (0.0%) | 0 (0.0%) |
| All other Fuels | 109 (0.9%) | 9 (0.5%) |
| No Fuel Used | 11 (0.1%) | 30 (1.7%) |
| Total | 11,646 (100.0%) | 1,760 (100.0%) |
Household Vehicle Usage in Hicksville
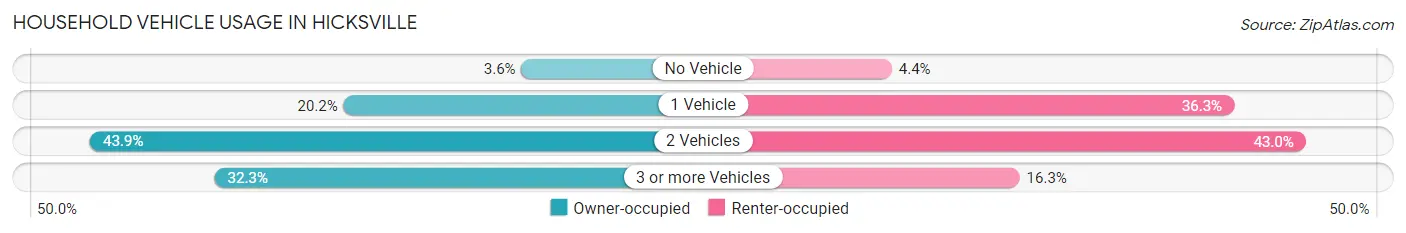
| Vehicles per Household | Owner-occupied | Renter-occupied |
| No Vehicle | 422 (3.6%) | 77 (4.4%) |
| 1 Vehicle | 2,356 (20.2%) | 639 (36.3%) |
| 2 Vehicles | 5,111 (43.9%) | 757 (43.0%) |
| 3 or more Vehicles | 3,757 (32.3%) | 287 (16.3%) |
| Total | 11,646 (100.0%) | 1,760 (100.0%) |
Real Estate & Mortgages in Hicksville
Real Estate and Mortgage Overview in Hicksville
| Characteristic | Without Mortgage | With Mortgage |
| Housing Units | 4,713 | 6,933 |
| Median Property Value | $558,900 | $611,800 |
| Median Household Income | $104,596 | $3,802 |
| Monthly Housing Costs | $1,256 | $4,501 |
| Real Estate Taxes | $9,631 | $46 |
Property Value by Mortgage Status in Hicksville
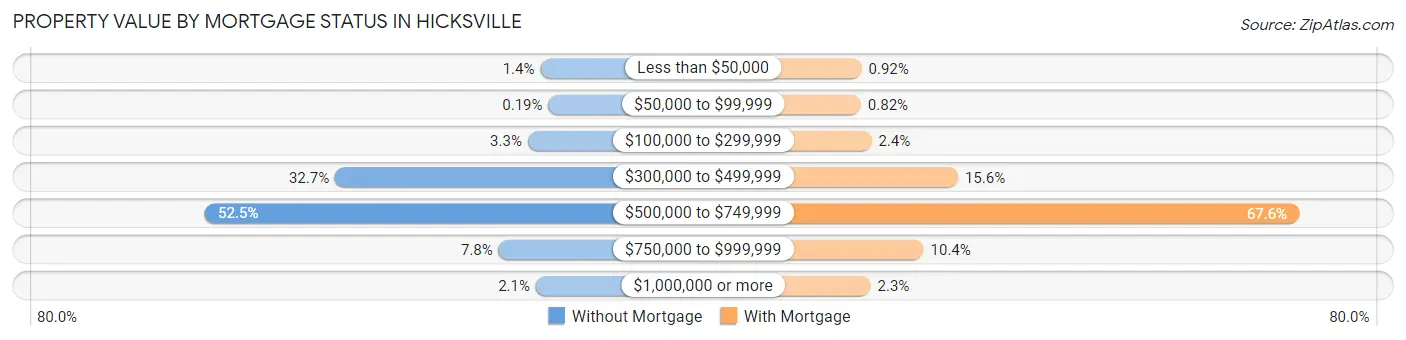
| Property Value | Without Mortgage | With Mortgage |
| Less than $50,000 | 67 (1.4%) | 64 (0.9%) |
| $50,000 to $99,999 | 9 (0.2%) | 57 (0.8%) |
| $100,000 to $299,999 | 157 (3.3%) | 168 (2.4%) |
| $300,000 to $499,999 | 1,541 (32.7%) | 1,082 (15.6%) |
| $500,000 to $749,999 | 2,474 (52.5%) | 4,684 (67.6%) |
| $750,000 to $999,999 | 366 (7.8%) | 719 (10.4%) |
| $1,000,000 or more | 99 (2.1%) | 159 (2.3%) |
| Total | 4,713 (100.0%) | 6,933 (100.0%) |
Household Income by Mortgage Status in Hicksville
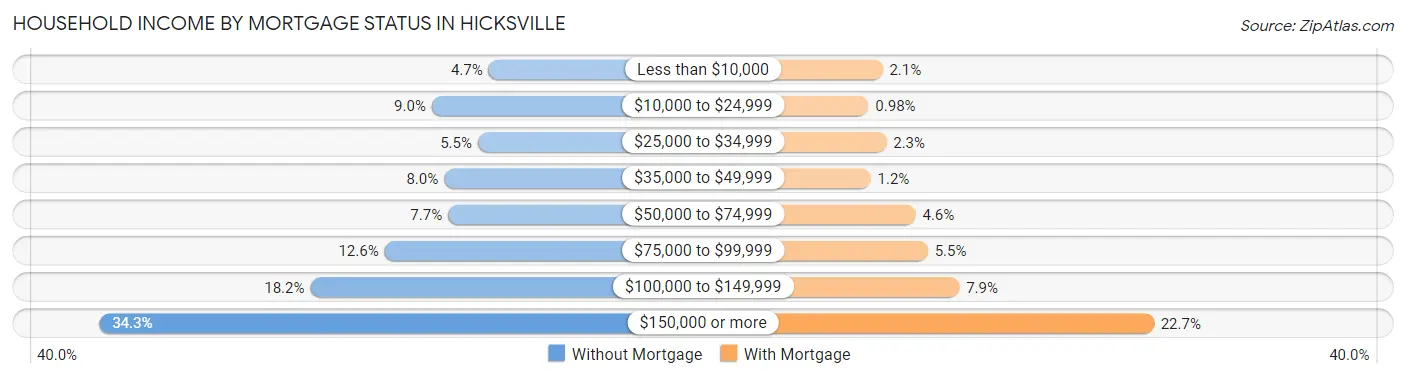
| Household Income | Without Mortgage | With Mortgage |
| Less than $10,000 | 219 (4.6%) | 142 (2.1%) |
| $10,000 to $24,999 | 423 (9.0%) | 68 (1.0%) |
| $25,000 to $34,999 | 258 (5.5%) | 162 (2.3%) |
| $35,000 to $49,999 | 379 (8.0%) | 80 (1.1%) |
| $50,000 to $74,999 | 365 (7.7%) | 317 (4.6%) |
| $75,000 to $99,999 | 593 (12.6%) | 381 (5.5%) |
| $100,000 to $149,999 | 859 (18.2%) | 548 (7.9%) |
| $150,000 or more | 1,617 (34.3%) | 1,575 (22.7%) |
| Total | 4,713 (100.0%) | 6,933 (100.0%) |
Property Value to Household Income Ratio in Hicksville
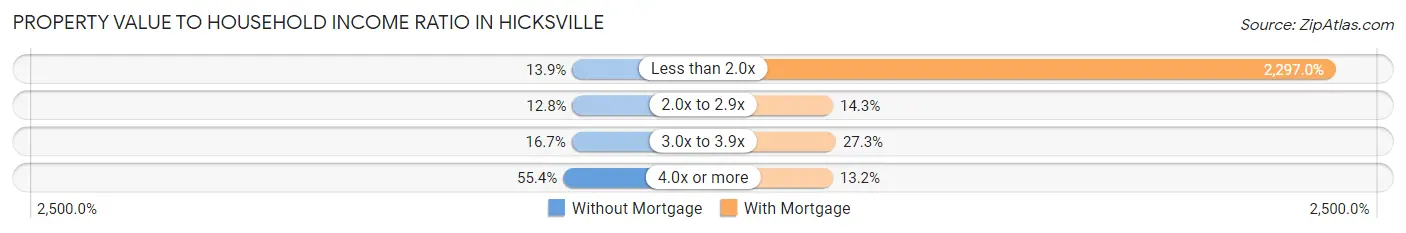
| Value-to-Income Ratio | Without Mortgage | With Mortgage |
| Less than 2.0x | 656 (13.9%) | 159,253 (2,297.0%) |
| 2.0x to 2.9x | 602 (12.8%) | 993 (14.3%) |
| 3.0x to 3.9x | 788 (16.7%) | 1,894 (27.3%) |
| 4.0x or more | 2,610 (55.4%) | 918 (13.2%) |
| Total | 4,713 (100.0%) | 6,933 (100.0%) |
Real Estate Taxes by Mortgage Status in Hicksville
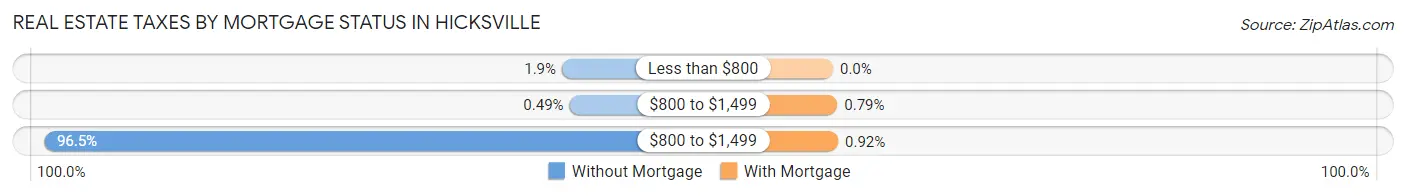
| Property Taxes | Without Mortgage | With Mortgage |
| Less than $800 | 88 (1.9%) | 0 (0.0%) |
| $800 to $1,499 | 23 (0.5%) | 55 (0.8%) |
| $800 to $1,499 | 4,546 (96.5%) | 64 (0.9%) |
| Total | 4,713 (100.0%) | 6,933 (100.0%) |
Health & Disability in Hicksville
Health Insurance Coverage by Age in Hicksville
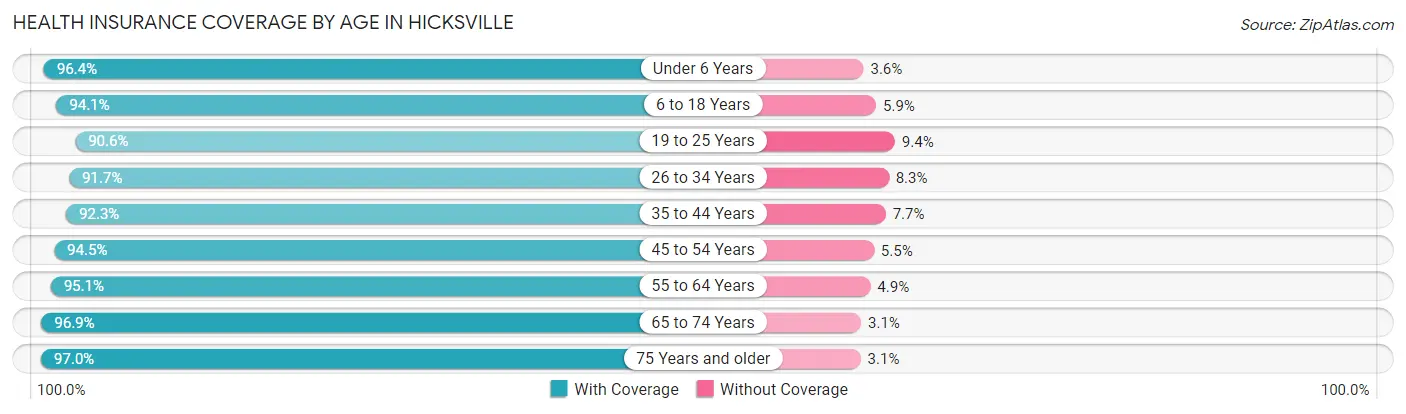
| Age Bracket | With Coverage | Without Coverage |
| Under 6 Years | 2,447 (96.4%) | 91 (3.6%) |
| 6 to 18 Years | 5,506 (94.1%) | 347 (5.9%) |
| 19 to 25 Years | 4,375 (90.6%) | 456 (9.4%) |
| 26 to 34 Years | 4,662 (91.7%) | 421 (8.3%) |
| 35 to 44 Years | 4,803 (92.3%) | 402 (7.7%) |
| 45 to 54 Years | 5,017 (94.5%) | 293 (5.5%) |
| 55 to 64 Years | 6,951 (95.1%) | 356 (4.9%) |
| 65 to 74 Years | 4,118 (96.9%) | 133 (3.1%) |
| 75 Years and older | 3,593 (97.0%) | 113 (3.0%) |
| Total | 41,472 (94.1%) | 2,612 (5.9%) |
Health Insurance Coverage by Citizenship Status in Hicksville
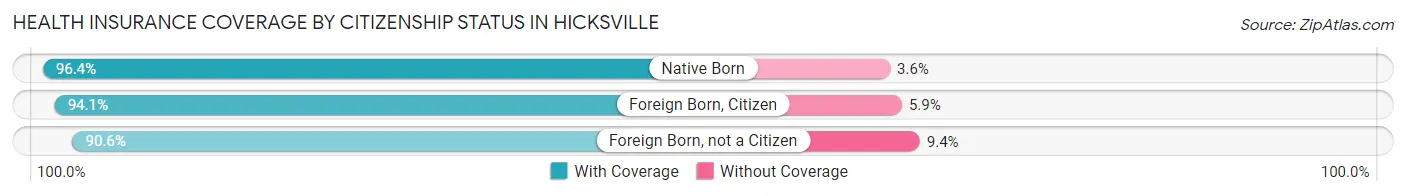
| Citizenship Status | With Coverage | Without Coverage |
| Native Born | 2,447 (96.4%) | 91 (3.6%) |
| Foreign Born, Citizen | 5,506 (94.1%) | 347 (5.9%) |
| Foreign Born, not a Citizen | 4,375 (90.6%) | 456 (9.4%) |
Health Insurance Coverage by Household Income in Hicksville
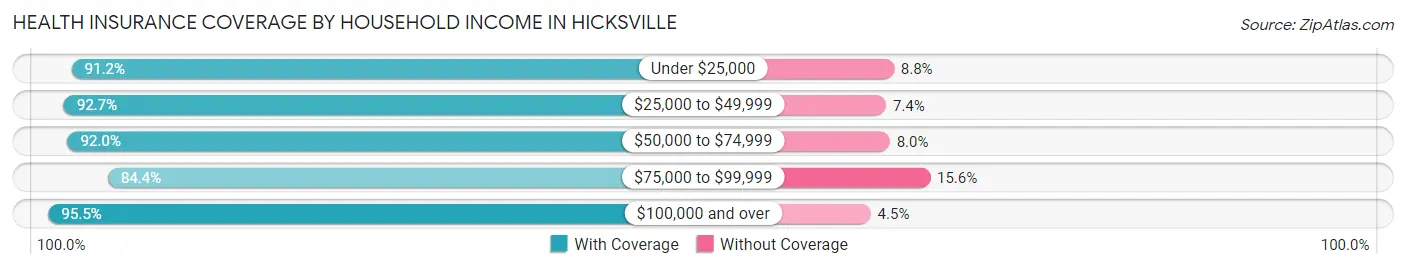
| Household Income | With Coverage | Without Coverage |
| Under $25,000 | 1,800 (91.2%) | 174 (8.8%) |
| $25,000 to $49,999 | 1,777 (92.6%) | 141 (7.3%) |
| $50,000 to $74,999 | 2,184 (92.0%) | 191 (8.0%) |
| $75,000 to $99,999 | 3,201 (84.4%) | 591 (15.6%) |
| $100,000 and over | 32,399 (95.5%) | 1,515 (4.5%) |
Public vs Private Health Insurance Coverage by Age in Hicksville
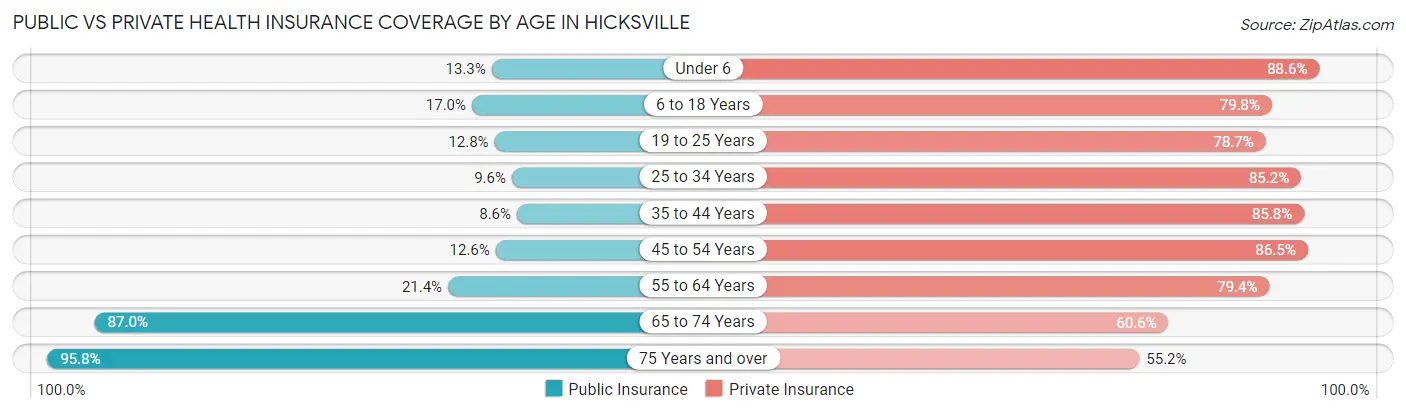
| Age Bracket | Public Insurance | Private Insurance |
| Under 6 | 338 (13.3%) | 2,249 (88.6%) |
| 6 to 18 Years | 994 (17.0%) | 4,672 (79.8%) |
| 19 to 25 Years | 618 (12.8%) | 3,800 (78.7%) |
| 25 to 34 Years | 486 (9.6%) | 4,332 (85.2%) |
| 35 to 44 Years | 449 (8.6%) | 4,466 (85.8%) |
| 45 to 54 Years | 668 (12.6%) | 4,591 (86.5%) |
| 55 to 64 Years | 1,565 (21.4%) | 5,799 (79.4%) |
| 65 to 74 Years | 3,698 (87.0%) | 2,578 (60.6%) |
| 75 Years and over | 3,550 (95.8%) | 2,047 (55.2%) |
| Total | 12,366 (28.1%) | 34,534 (78.3%) |
Disability Status by Sex by Age in Hicksville
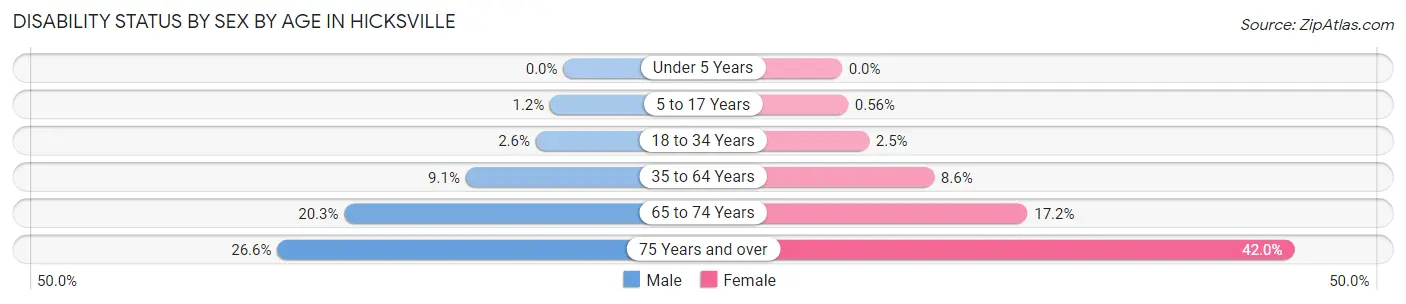
| Age Bracket | Male | Female |
| Under 5 Years | 0 (0.0%) | 0 (0.0%) |
| 5 to 17 Years | 39 (1.2%) | 17 (0.6%) |
| 18 to 34 Years | 150 (2.6%) | 113 (2.5%) |
| 35 to 64 Years | 826 (9.1%) | 744 (8.6%) |
| 65 to 74 Years | 445 (20.3%) | 355 (17.2%) |
| 75 Years and over | 420 (26.6%) | 892 (42.0%) |
Disability Class by Sex by Age in Hicksville
Disability Class: Hearing Difficulty
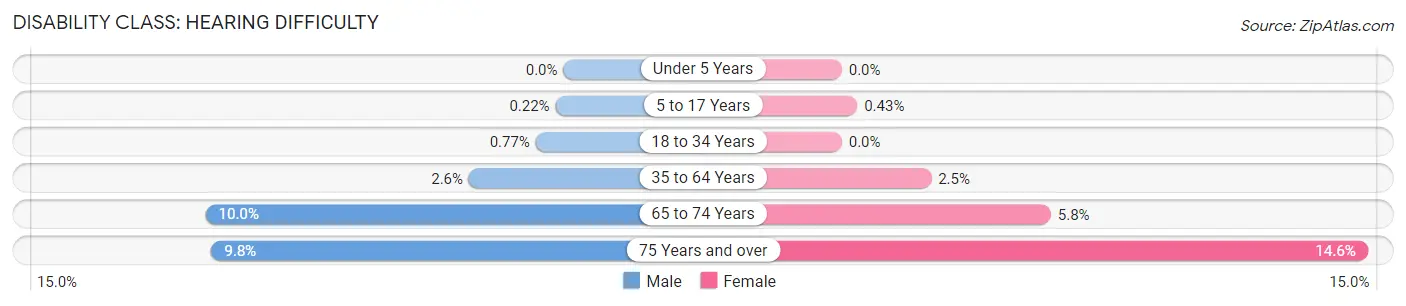
| Age Bracket | Male | Female |
| Under 5 Years | 0 (0.0%) | 0 (0.0%) |
| 5 to 17 Years | 7 (0.2%) | 13 (0.4%) |
| 18 to 34 Years | 45 (0.8%) | 0 (0.0%) |
| 35 to 64 Years | 240 (2.6%) | 217 (2.5%) |
| 65 to 74 Years | 218 (10.0%) | 120 (5.8%) |
| 75 Years and over | 155 (9.8%) | 311 (14.6%) |
Disability Class: Vision Difficulty
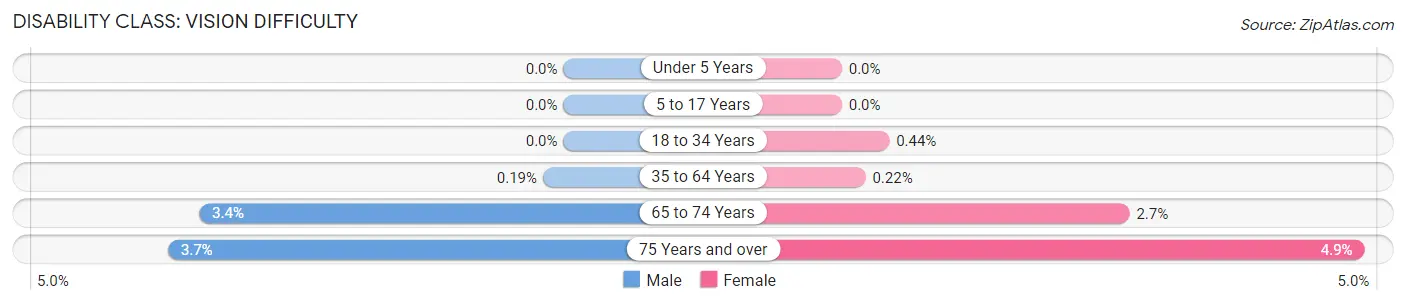
| Age Bracket | Male | Female |
| Under 5 Years | 0 (0.0%) | 0 (0.0%) |
| 5 to 17 Years | 0 (0.0%) | 0 (0.0%) |
| 18 to 34 Years | 0 (0.0%) | 20 (0.4%) |
| 35 to 64 Years | 17 (0.2%) | 19 (0.2%) |
| 65 to 74 Years | 74 (3.4%) | 55 (2.7%) |
| 75 Years and over | 58 (3.7%) | 103 (4.9%) |
Disability Class: Cognitive Difficulty
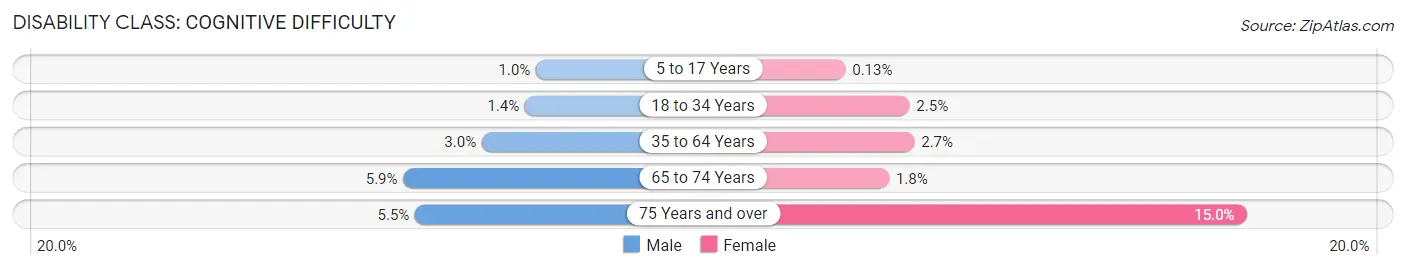
| Age Bracket | Male | Female |
| 5 to 17 Years | 32 (1.0%) | 4 (0.1%) |
| 18 to 34 Years | 83 (1.4%) | 113 (2.5%) |
| 35 to 64 Years | 275 (3.0%) | 234 (2.7%) |
| 65 to 74 Years | 130 (5.9%) | 36 (1.8%) |
| 75 Years and over | 87 (5.5%) | 319 (15.0%) |
Disability Class: Ambulatory Difficulty
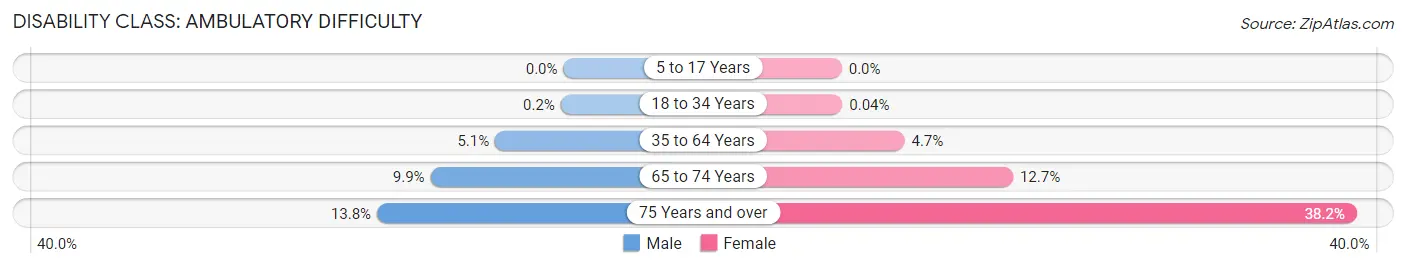
| Age Bracket | Male | Female |
| 5 to 17 Years | 0 (0.0%) | 0 (0.0%) |
| 18 to 34 Years | 12 (0.2%) | 2 (0.0%) |
| 35 to 64 Years | 462 (5.1%) | 406 (4.7%) |
| 65 to 74 Years | 216 (9.9%) | 262 (12.7%) |
| 75 Years and over | 219 (13.8%) | 812 (38.2%) |
Disability Class: Self-Care Difficulty
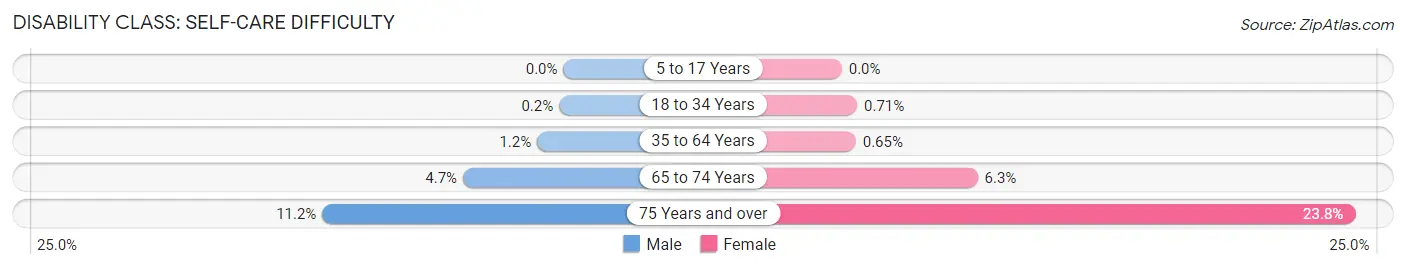
| Age Bracket | Male | Female |
| 5 to 17 Years | 0 (0.0%) | 0 (0.0%) |
| 18 to 34 Years | 12 (0.2%) | 32 (0.7%) |
| 35 to 64 Years | 111 (1.2%) | 57 (0.6%) |
| 65 to 74 Years | 102 (4.7%) | 130 (6.3%) |
| 75 Years and over | 177 (11.2%) | 506 (23.8%) |
Technology Access in Hicksville
Computing Device Access in Hicksville
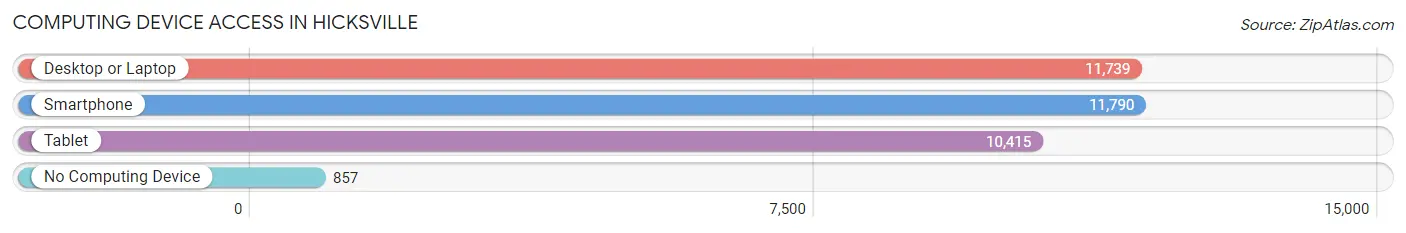
| Device Type | # Households | % Households |
| Desktop or Laptop | 11,739 | 87.6% |
| Smartphone | 11,790 | 87.9% |
| Tablet | 10,415 | 77.7% |
| No Computing Device | 857 | 6.4% |
| Total | 13,406 | 100.0% |
Internet Access in Hicksville
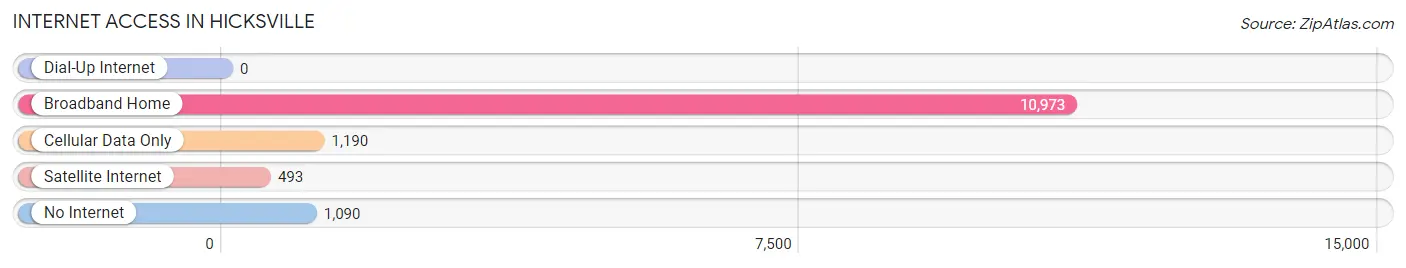
| Internet Type | # Households | % Households |
| Dial-Up Internet | 0 | 0.0% |
| Broadband Home | 10,973 | 81.9% |
| Cellular Data Only | 1,190 | 8.9% |
| Satellite Internet | 493 | 3.7% |
| No Internet | 1,090 | 8.1% |
| Total | 13,406 | 100.0% |
Hicksville Summary
Hicksville is a hamlet located in the Town of Oyster Bay in Nassau County, New York. It is located on the South Shore of Long Island, approximately 40 miles east of Manhattan. The hamlet is home to a population of approximately 41,547 people, according to the 2010 census.
Geography
Hicksville is located in the Town of Oyster Bay, which is located in the southwestern part of Nassau County. It is bordered by the hamlets of Bethpage to the west, Plainview to the north, Levittown to the east, and Massapequa to the south. The hamlet is situated on the South Shore of Long Island, approximately 40 miles east of Manhattan. The hamlet is located in the Nassau-Suffolk metropolitan area, which is part of the larger New York metropolitan area.
The hamlet is located on the Hempstead Plains, which is a flat, low-lying area of land that is characterized by sandy soil and grassy meadows. The area is home to a variety of wildlife, including white-tailed deer, red foxes, and various species of birds. The area is also home to a variety of plant life, including oak and hickory trees, as well as various species of wildflowers.
Climate
Hicksville has a humid subtropical climate, with hot, humid summers and cold, wet winters. The average high temperature in July is 81°F, and the average low temperature in January is 24°F. The average annual precipitation is approximately 46 inches.
History
Hicksville was first settled in the late 17th century by English settlers. The hamlet was named after the Hicks family, who were among the first settlers in the area. The hamlet was officially incorporated in 1839.
In the late 19th century, the hamlet began to experience rapid growth due to the construction of the Long Island Rail Road. The railroad provided easy access to New York City, and the hamlet quickly became a popular destination for commuters.
In the early 20th century, the hamlet experienced a period of rapid growth and development. The hamlet was home to a variety of businesses, including a number of factories and warehouses. The hamlet also became home to a number of large retail stores, including Sears and J.C. Penney.
Economy
Hicksville is home to a variety of businesses, including retail stores, restaurants, and manufacturing companies. The hamlet is also home to a number of corporate offices, including those of Canon USA, Inc., and the Long Island Power Authority.
The hamlet is also home to a number of educational institutions, including the Hicksville Public Library, the Hicksville High School, and the Nassau Community College.
Demographics
According to the 2010 census, Hicksville has a population of 41,547 people. The population is approximately 57.3% White, 16.2% Hispanic or Latino, 15.2% Asian, and 11.3% African American. The median household income is approximately $90,000, and the median home value is approximately $400,000.
Conclusion
Hicksville is a hamlet located in the Town of Oyster Bay in Nassau County, New York. It is located on the South Shore of Long Island, approximately 40 miles east of Manhattan. The hamlet is home to a population of approximately 41,547 people, according to the 2010 census. The hamlet is located on the Hempstead Plains, and has a humid subtropical climate. The hamlet was first settled in the late 17th century by English settlers, and was officially incorporated in 1839. The hamlet experienced rapid growth in the late 19th century due to the construction of the Long Island Rail Road, and is now home to a variety of businesses, including retail stores, restaurants, and manufacturing companies. The population of Hicksville is approximately 57.3% White, 16.2% Hispanic or Latino, 15.2% Asian, and 11.3% African American. The median household income is approximately $90,000, and the median home value is approximately $400,000.
Common Questions
What is Per Capita Income in Hicksville?
Per Capita income in Hicksville is $50,412.
What is the Median Family Income in Hicksville?
Median Family Income in Hicksville is $150,425.
What is the Median Household income in Hicksville?
Median Household Income in Hicksville is $139,809.
What is Income or Wage Gap in Hicksville?
Income or Wage Gap in Hicksville is 23.4%.
Women in Hicksville earn 76.6 cents for every dollar earned by a man.
What is Inequality or Gini Index in Hicksville?
Inequality or Gini Index in Hicksville is 0.40.
What is the Total Population of Hicksville?
Total Population of Hicksville is 44,084.
What is the Total Male Population of Hicksville?
Total Male Population of Hicksville is 22,819.
What is the Total Female Population of Hicksville?
Total Female Population of Hicksville is 21,265.
What is the Ratio of Males per 100 Females in Hicksville?
There are 107.31 Males per 100 Females in Hicksville.
What is the Ratio of Females per 100 Males in Hicksville?
There are 93.19 Females per 100 Males in Hicksville.
What is the Median Population Age in Hicksville?
Median Population Age in Hicksville is 41.3 Years.
What is the Average Family Size in Hicksville
Average Family Size in Hicksville is 3.6 People.
What is the Average Household Size in Hicksville
Average Household Size in Hicksville is 3.3 People.
How Large is the Labor Force in Hicksville?
There are 24,450 People in the Labor Forcein in Hicksville.
What is the Percentage of People in the Labor Force in Hicksville?
65.9% of People are in the Labor Force in Hicksville.
What is the Unemployment Rate in Hicksville?
Unemployment Rate in Hicksville is 3.8%.