New Hyde Park, NY Map & Demographics
New Hyde Park Map
New Hyde Park Overview
$60,050
PER CAPITA INCOME
$160,435
AVG FAMILY INCOME
$144,375
AVG HOUSEHOLD INCOME
39.0%
WAGE / INCOME GAP [ % ]
61.0¢/ $1
WAGE / INCOME GAP [ $ ]
0.43
INEQUALITY / GINI INDEX
10,235
TOTAL POPULATION
5,254
MALE POPULATION
4,981
FEMALE POPULATION
105.48
MALES / 100 FEMALES
94.80
FEMALES / 100 MALES
41.7
MEDIAN AGE
3.5
AVG FAMILY SIZE
3.1
AVG HOUSEHOLD SIZE
5,857
LABOR FORCE [ PEOPLE ]
68.7%
PERCENT IN LABOR FORCE
4.3%
UNEMPLOYMENT RATE
New Hyde Park Area Codes
Income in New Hyde Park
Income Overview in New Hyde Park
Per Capita Income in New Hyde Park is $60,050, while median incomes of families and households are $160,435 and $144,375 respectively.
| Characteristic | Number | Measure |
| Per Capita Income | 10,235 | $60,050 |
| Median Family Income | 2,637 | $160,435 |
| Mean Family Income | 2,637 | $195,869 |
| Median Household Income | 3,290 | $144,375 |
| Mean Household Income | 3,290 | $183,570 |
| Income Deficit | 2,637 | $0 |
| Wage / Income Gap (%) | 10,235 | 39.02% |
| Wage / Income Gap ($) | 10,235 | 60.98¢ per $1 |
| Gini / Inequality Index | 10,235 | 0.43 |
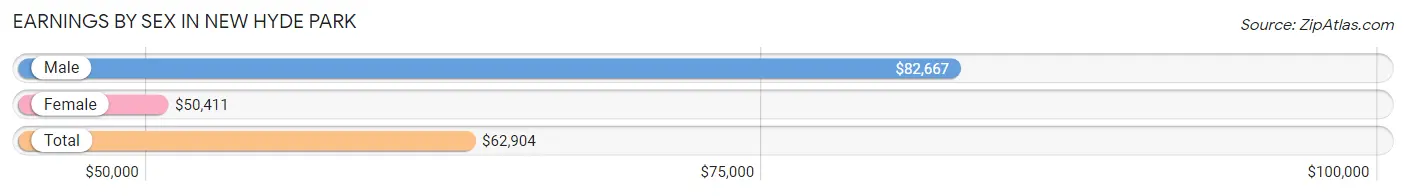
Earnings by Sex in New Hyde Park
Average Earnings in New Hyde Park are $62,904, $82,667 for men and $50,411 for women, a difference of 39.0%.
| Sex | Number | Average Earnings |
| Male | 3,146 (52.9%) | $82,667 |
| Female | 2,798 (47.1%) | $50,411 |
| Total | 5,944 (100.0%) | $62,904 |
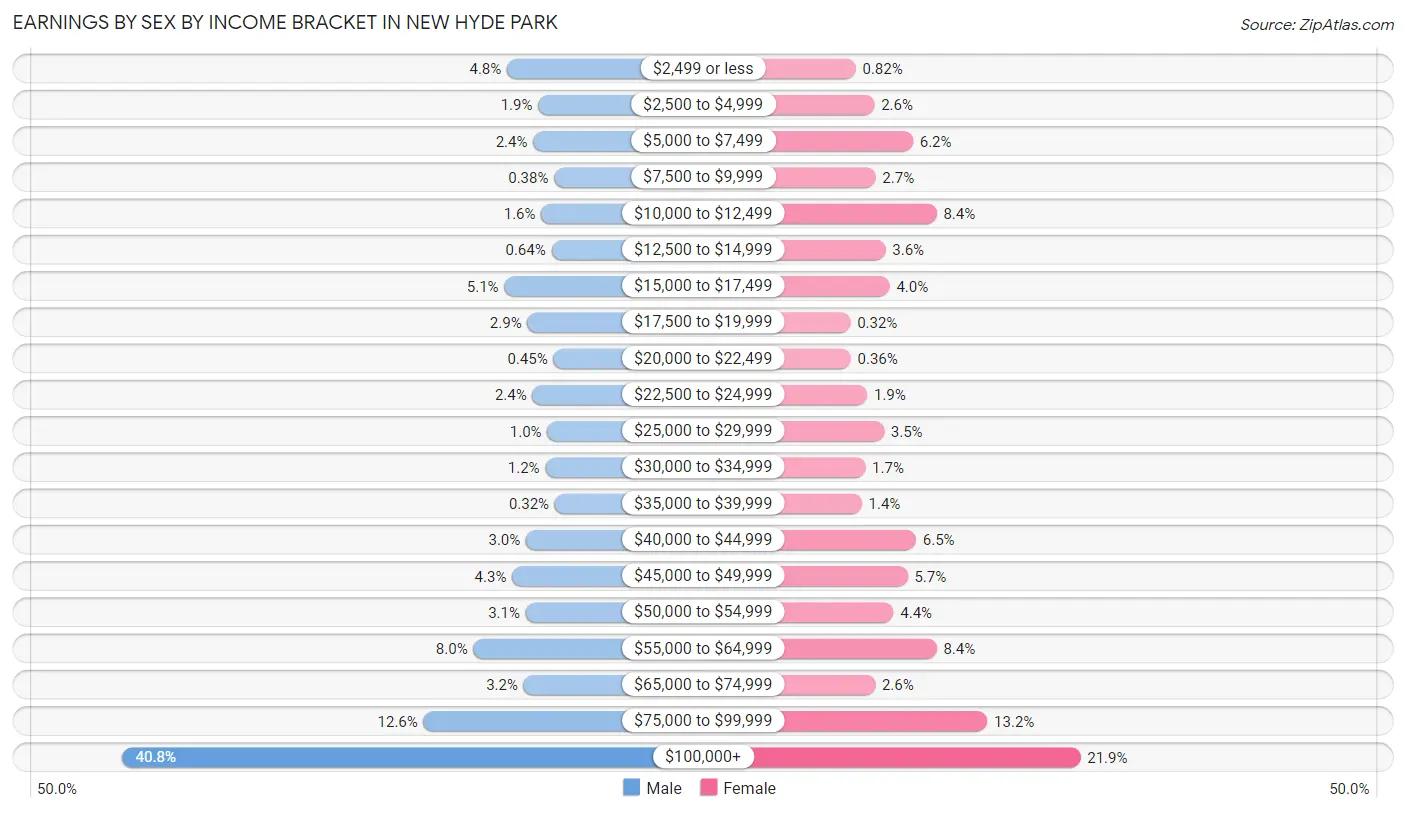
Earnings by Sex by Income Bracket in New Hyde Park
The most common earnings brackets in New Hyde Park are $100,000+ for men (1,284 | 40.8%) and $100,000+ for women (612 | 21.9%).
| Income | Male | Female |
| $2,499 or less | 151 (4.8%) | 23 (0.8%) |
| $2,500 to $4,999 | 59 (1.9%) | 72 (2.6%) |
| $5,000 to $7,499 | 74 (2.4%) | 173 (6.2%) |
| $7,500 to $9,999 | 12 (0.4%) | 75 (2.7%) |
| $10,000 to $12,499 | 50 (1.6%) | 235 (8.4%) |
| $12,500 to $14,999 | 20 (0.6%) | 101 (3.6%) |
| $15,000 to $17,499 | 159 (5.1%) | 112 (4.0%) |
| $17,500 to $19,999 | 91 (2.9%) | 9 (0.3%) |
| $20,000 to $22,499 | 14 (0.4%) | 10 (0.4%) |
| $22,500 to $24,999 | 76 (2.4%) | 53 (1.9%) |
| $25,000 to $29,999 | 32 (1.0%) | 97 (3.5%) |
| $30,000 to $34,999 | 38 (1.2%) | 48 (1.7%) |
| $35,000 to $39,999 | 10 (0.3%) | 39 (1.4%) |
| $40,000 to $44,999 | 95 (3.0%) | 181 (6.5%) |
| $45,000 to $49,999 | 136 (4.3%) | 159 (5.7%) |
| $50,000 to $54,999 | 96 (3.0%) | 122 (4.4%) |
| $55,000 to $64,999 | 250 (8.0%) | 235 (8.4%) |
| $65,000 to $74,999 | 102 (3.2%) | 74 (2.6%) |
| $75,000 to $99,999 | 397 (12.6%) | 368 (13.2%) |
| $100,000+ | 1,284 (40.8%) | 612 (21.9%) |
| Total | 3,146 (100.0%) | 2,798 (100.0%) |
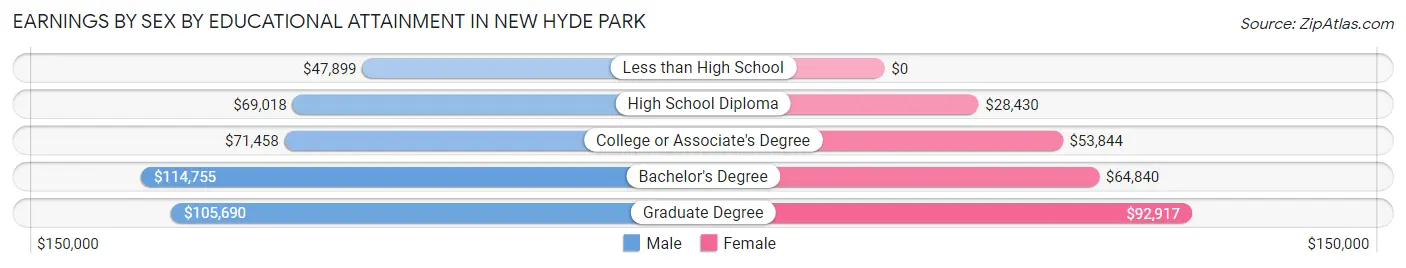
Earnings by Sex by Educational Attainment in New Hyde Park
Average earnings in New Hyde Park are $93,520 for men and $57,090 for women, a difference of 39.0%. Men with an educational attainment of bachelor's degree enjoy the highest average annual earnings of $114,755, while those with less than high school education earn the least with $47,899. Women with an educational attainment of graduate degree earn the most with the average annual earnings of $92,917, while those with high school diploma education have the smallest earnings of $28,430.
| Educational Attainment | Male Income | Female Income |
| Less than High School | $47,899 | $0 |
| High School Diploma | $69,018 | $28,430 |
| College or Associate's Degree | $71,458 | $53,844 |
| Bachelor's Degree | $114,755 | $64,840 |
| Graduate Degree | $105,690 | $92,917 |
| Total | $93,520 | $57,090 |
Family Income in New Hyde Park
Family Income Brackets in New Hyde Park
According to the New Hyde Park family income data, there are 923 families falling into the $200,000+ income range, which is the most common income bracket and makes up 35.0% of all families.
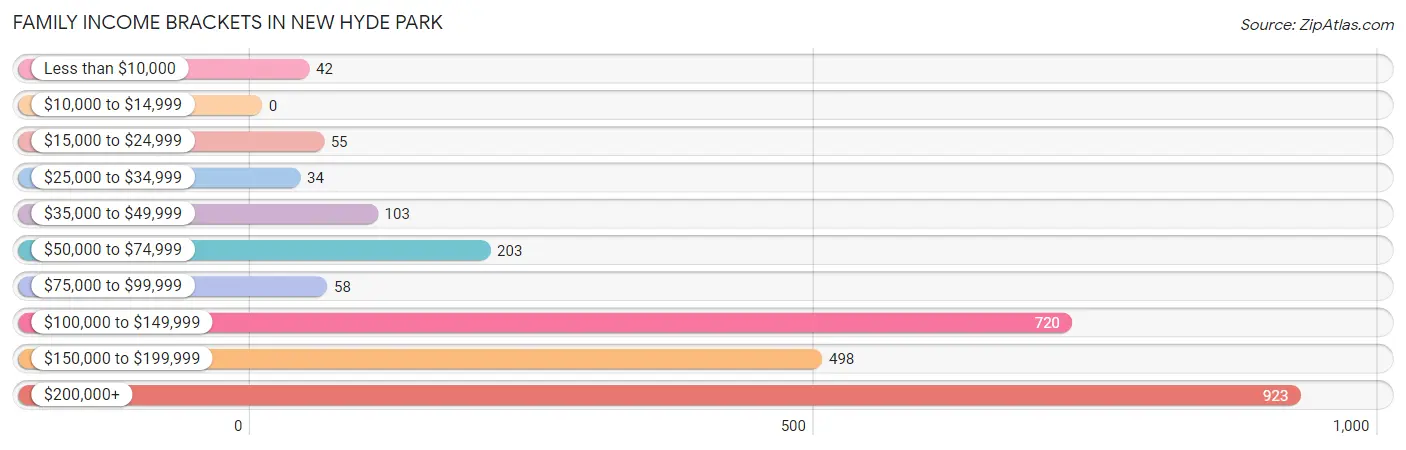
| Income Bracket | # Families | % Families |
| Less than $10,000 | 42 | 1.6% |
| $10,000 to $14,999 | 0 | 0.0% |
| $15,000 to $24,999 | 55 | 2.1% |
| $25,000 to $34,999 | 34 | 1.3% |
| $35,000 to $49,999 | 103 | 3.9% |
| $50,000 to $74,999 | 203 | 7.7% |
| $75,000 to $99,999 | 58 | 2.2% |
| $100,000 to $149,999 | 720 | 27.3% |
| $150,000 to $199,999 | 498 | 18.9% |
| $200,000+ | 923 | 35.0% |
Family Income by Famaliy Size in New Hyde Park
6-person families (86 | 3.3%) account for the highest median family income in New Hyde Park with $250,001 per family, while 3-person families (485 | 18.4%) have the highest median income of $64,217 per family member.
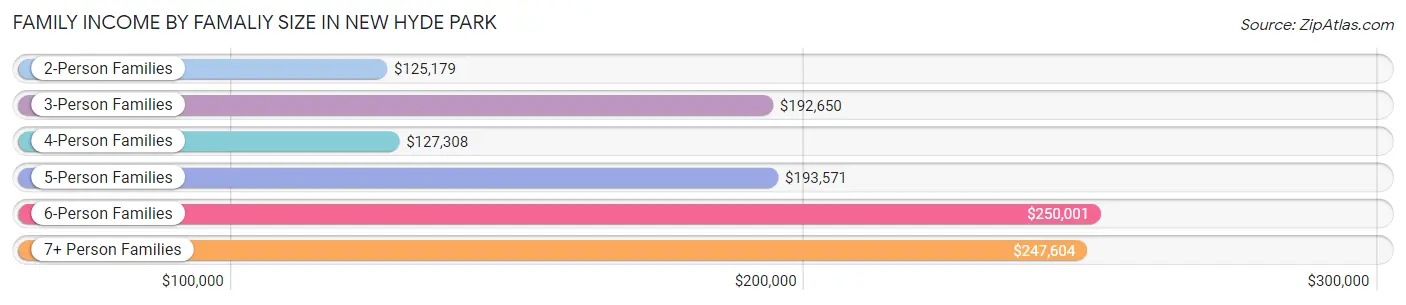
| Income Bracket | # Families | Median Income |
| 2-Person Families | 829 (31.4%) | $125,179 |
| 3-Person Families | 485 (18.4%) | $192,650 |
| 4-Person Families | 818 (31.0%) | $127,308 |
| 5-Person Families | 354 (13.4%) | $193,571 |
| 6-Person Families | 86 (3.3%) | $250,001 |
| 7+ Person Families | 65 (2.5%) | $247,604 |
| Total | 2,637 (100.0%) | $160,435 |
Family Income by Number of Earners in New Hyde Park
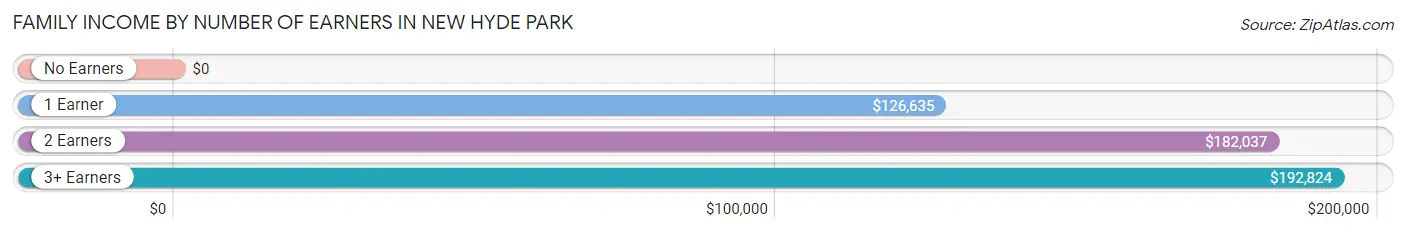
| Number of Earners | # Families | Median Income |
| No Earners | 380 (14.4%) | $0 |
| 1 Earner | 513 (19.5%) | $126,635 |
| 2 Earners | 804 (30.5%) | $182,037 |
| 3+ Earners | 940 (35.6%) | $192,824 |
| Total | 2,637 (100.0%) | $160,435 |
Household Income in New Hyde Park
Household Income Brackets in New Hyde Park
With 1,003 households falling in the category, the $200,000+ income range is the most frequent in New Hyde Park, accounting for 30.5% of all households. In contrast, only 53 households (1.6%) fall into the $10,000 to $14,999 income bracket, making it the least populous group.
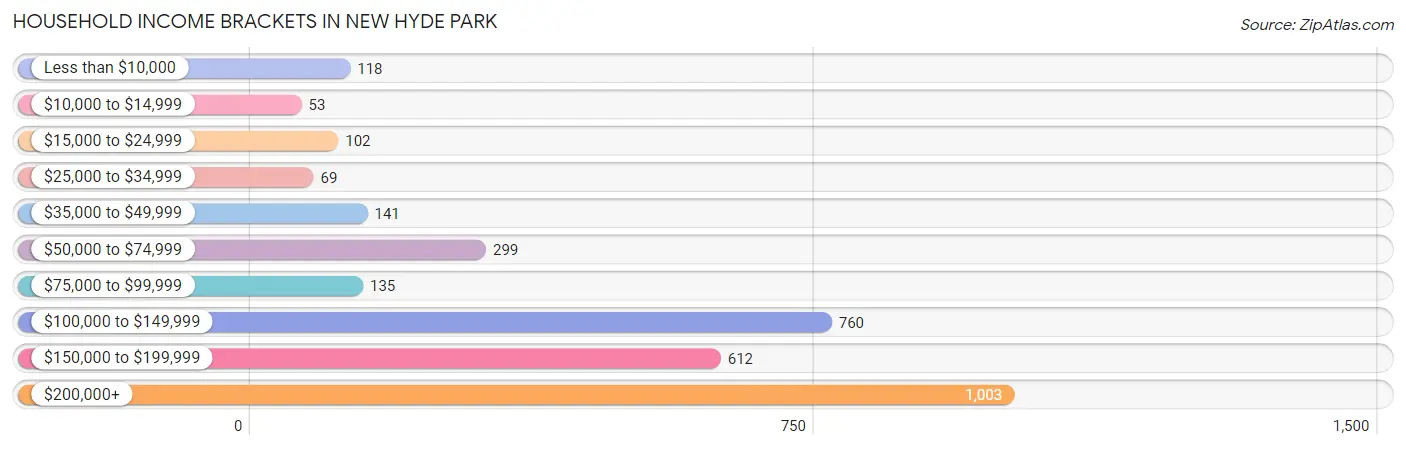
| Income Bracket | # Households | % Households |
| Less than $10,000 | 118 | 3.6% |
| $10,000 to $14,999 | 53 | 1.6% |
| $15,000 to $24,999 | 102 | 3.1% |
| $25,000 to $34,999 | 69 | 2.1% |
| $35,000 to $49,999 | 141 | 4.3% |
| $50,000 to $74,999 | 299 | 9.1% |
| $75,000 to $99,999 | 135 | 4.1% |
| $100,000 to $149,999 | 760 | 23.1% |
| $150,000 to $199,999 | 612 | 18.6% |
| $200,000+ | 1,003 | 30.5% |
Household Income by Householder Age in New Hyde Park
The median household income in New Hyde Park is $144,375, with the highest median household income of $162,656 found in the 45 to 64 years age bracket for the primary householder. A total of 1,420 households (43.2%) fall into this category.
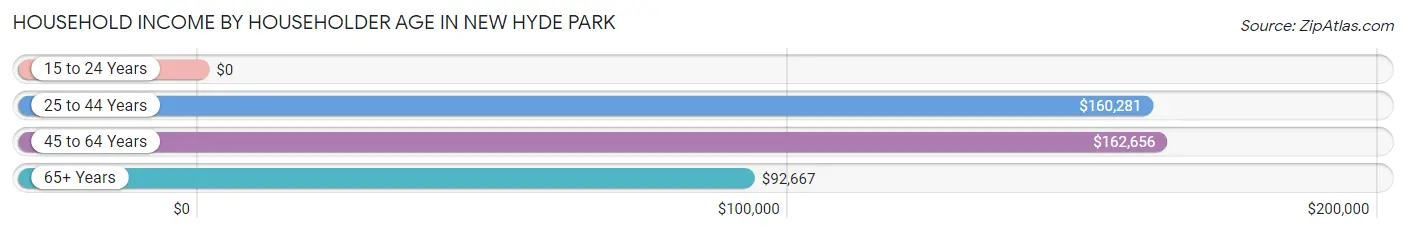
| Income Bracket | # Households | Median Income |
| 15 to 24 Years | 0 (0.0%) | $0 |
| 25 to 44 Years | 910 (27.7%) | $160,281 |
| 45 to 64 Years | 1,420 (43.2%) | $162,656 |
| 65+ Years | 960 (29.2%) | $92,667 |
| Total | 3,290 (100.0%) | $144,375 |
Poverty in New Hyde Park
Income Below Poverty by Sex and Age in New Hyde Park
With 1.8% poverty level for males and 5.8% for females among the residents of New Hyde Park, under 5 year old males and 5 year old females are the most vulnerable to poverty, with 39 males (13.3%) and 9 females (45.0%) in their respective age groups living below the poverty level.
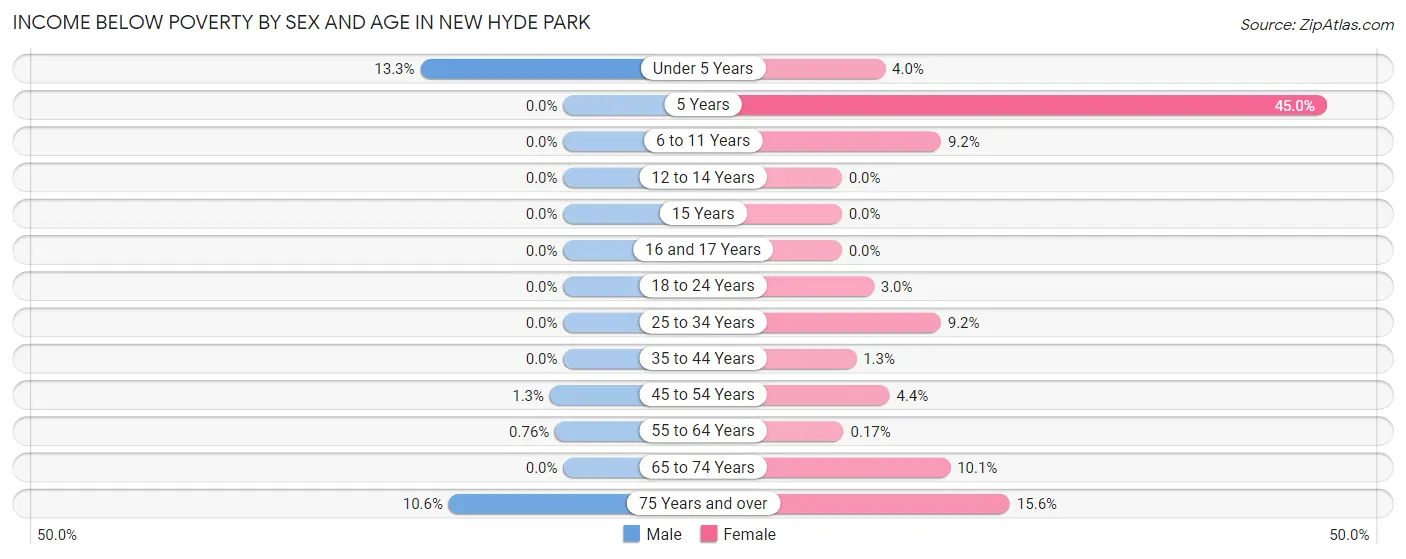
| Age Bracket | Male | Female |
| Under 5 Years | 39 (13.3%) | 9 (4.0%) |
| 5 Years | 0 (0.0%) | 9 (45.0%) |
| 6 to 11 Years | 0 (0.0%) | 29 (9.2%) |
| 12 to 14 Years | 0 (0.0%) | 0 (0.0%) |
| 15 Years | 0 (0.0%) | 0 (0.0%) |
| 16 and 17 Years | 0 (0.0%) | 0 (0.0%) |
| 18 to 24 Years | 0 (0.0%) | 14 (3.0%) |
| 25 to 34 Years | 0 (0.0%) | 53 (9.2%) |
| 35 to 44 Years | 0 (0.0%) | 9 (1.3%) |
| 45 to 54 Years | 10 (1.3%) | 30 (4.4%) |
| 55 to 64 Years | 5 (0.8%) | 1 (0.2%) |
| 65 to 74 Years | 0 (0.0%) | 64 (10.1%) |
| 75 Years and over | 42 (10.6%) | 71 (15.6%) |
| Total | 96 (1.8%) | 289 (5.8%) |
Income Above Poverty by Sex and Age in New Hyde Park
According to the poverty statistics in New Hyde Park, males aged 5 years and females aged 12 to 14 years are the age groups that are most secure financially, with 100.0% of males and 100.0% of females in these age groups living above the poverty line.
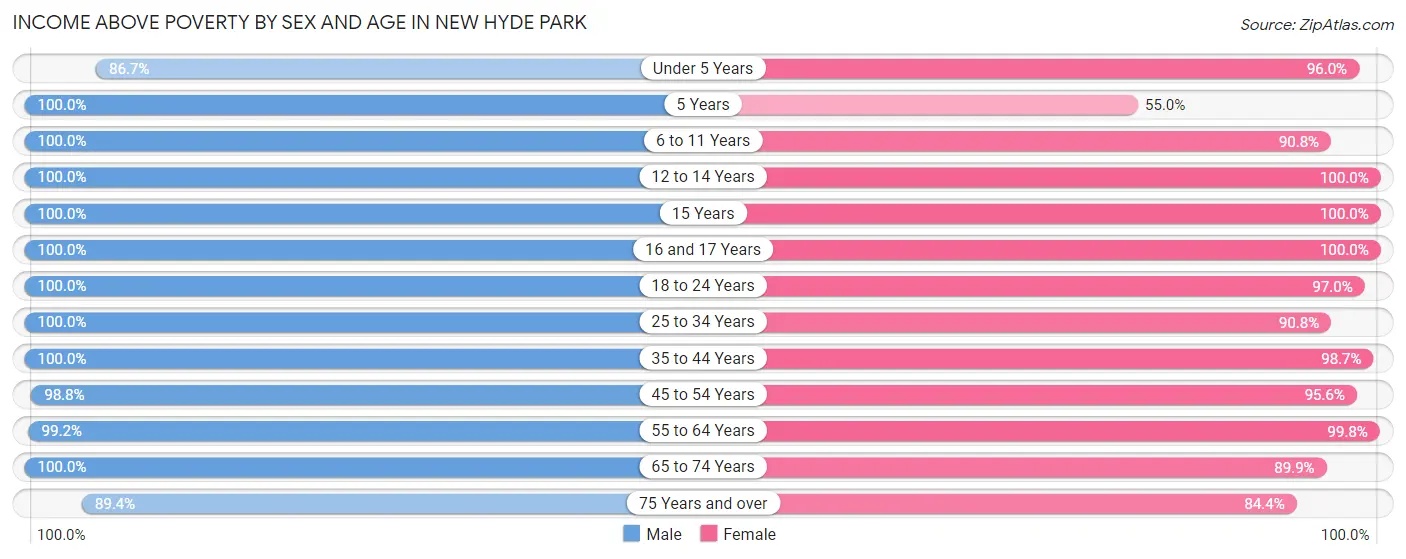
| Age Bracket | Male | Female |
| Under 5 Years | 255 (86.7%) | 215 (96.0%) |
| 5 Years | 113 (100.0%) | 11 (55.0%) |
| 6 to 11 Years | 383 (100.0%) | 286 (90.8%) |
| 12 to 14 Years | 106 (100.0%) | 186 (100.0%) |
| 15 Years | 61 (100.0%) | 6 (100.0%) |
| 16 and 17 Years | 171 (100.0%) | 138 (100.0%) |
| 18 to 24 Years | 543 (100.0%) | 458 (97.0%) |
| 25 to 34 Years | 412 (100.0%) | 524 (90.8%) |
| 35 to 44 Years | 889 (100.0%) | 664 (98.7%) |
| 45 to 54 Years | 791 (98.8%) | 647 (95.6%) |
| 55 to 64 Years | 650 (99.2%) | 601 (99.8%) |
| 65 to 74 Years | 429 (100.0%) | 572 (89.9%) |
| 75 Years and over | 353 (89.4%) | 384 (84.4%) |
| Total | 5,156 (98.2%) | 4,692 (94.2%) |
Income Below Poverty Among Married-Couple Families in New Hyde Park
The poverty statistics for married-couple families in New Hyde Park show that 1.3% or 29 of the total 2,201 families live below the poverty line. Families with no children have the highest poverty rate of 1.7%, comprising of 19 families. On the other hand, families with 3 or 4 children have the lowest poverty rate of 0.0%, which includes 0 families.
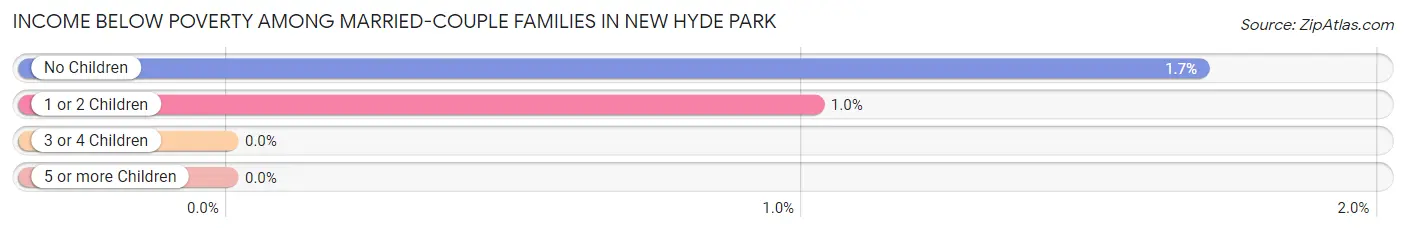
| Children | Above Poverty | Below Poverty |
| No Children | 1,103 (98.3%) | 19 (1.7%) |
| 1 or 2 Children | 966 (99.0%) | 10 (1.0%) |
| 3 or 4 Children | 76 (100.0%) | 0 (0.0%) |
| 5 or more Children | 27 (100.0%) | 0 (0.0%) |
| Total | 2,172 (98.7%) | 29 (1.3%) |
Income Below Poverty Among Single-Parent Households in New Hyde Park
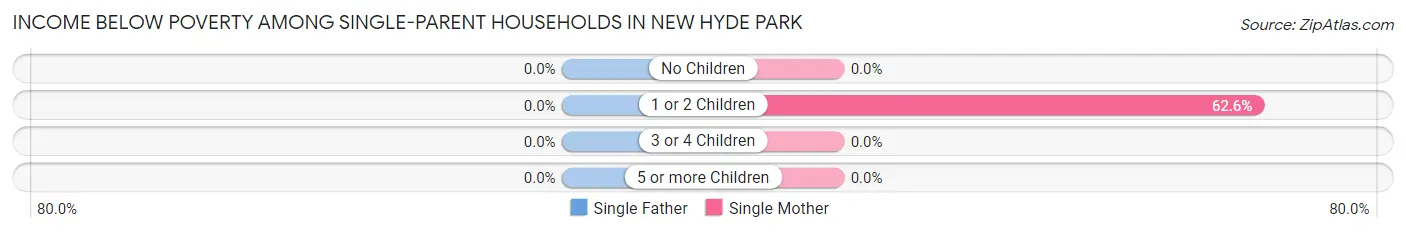
| Children | Single Father | Single Mother |
| No Children | 0 (0.0%) | 0 (0.0%) |
| 1 or 2 Children | 0 (0.0%) | 57 (62.6%) |
| 3 or 4 Children | 0 (0.0%) | 0 (0.0%) |
| 5 or more Children | 0 (0.0%) | 0 (0.0%) |
| Total | 0 (0.0%) | 57 (24.4%) |
Income Below Poverty Among Married-Couple vs Single-Parent Households in New Hyde Park
The poverty data for New Hyde Park shows that 29 of the married-couple family households (1.3%) and 57 of the single-parent households (13.1%) are living below the poverty level. Within the married-couple family households, those with no children have the highest poverty rate, with 19 households (1.7%) falling below the poverty line. Among the single-parent households, those with 1 or 2 children have the highest poverty rate, with 57 household (42.9%) living below poverty.
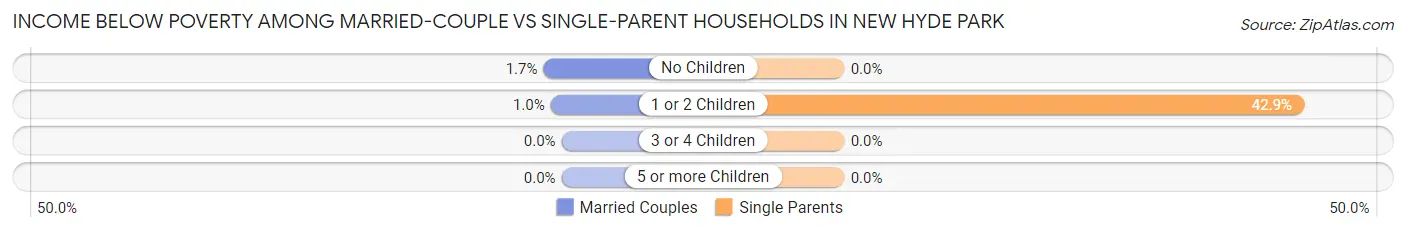
| Children | Married-Couple Families | Single-Parent Households |
| No Children | 19 (1.7%) | 0 (0.0%) |
| 1 or 2 Children | 10 (1.0%) | 57 (42.9%) |
| 3 or 4 Children | 0 (0.0%) | 0 (0.0%) |
| 5 or more Children | 0 (0.0%) | 0 (0.0%) |
| Total | 29 (1.3%) | 57 (13.1%) |
Race in New Hyde Park
The most populous races in New Hyde Park are White / Caucasian (5,264 | 51.4%), Asian (2,918 | 28.5%), and Hispanic or Latino (1,956 | 19.1%).
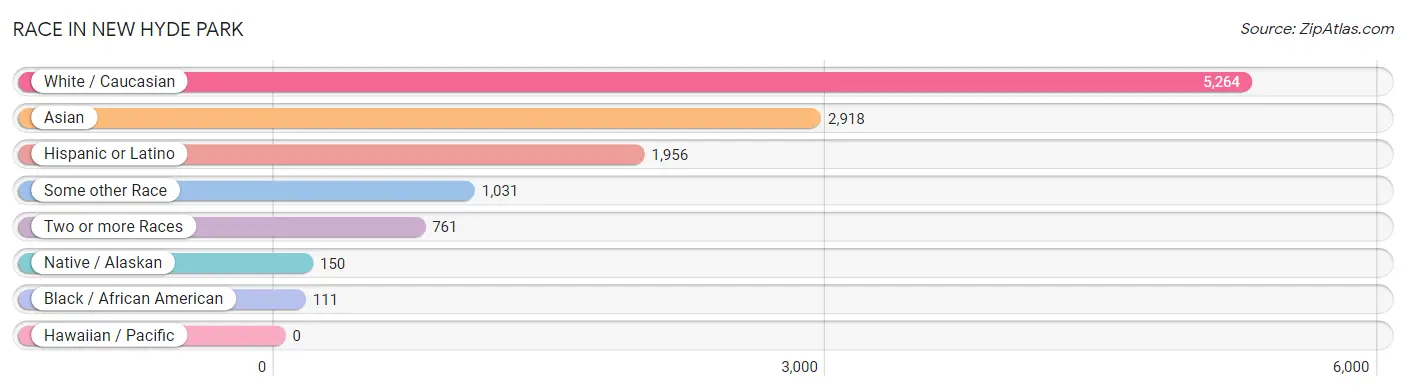
| Race | # Population | % Population |
| Asian | 2,918 | 28.5% |
| Black / African American | 111 | 1.1% |
| Hawaiian / Pacific | 0 | 0.0% |
| Hispanic or Latino | 1,956 | 19.1% |
| Native / Alaskan | 150 | 1.5% |
| White / Caucasian | 5,264 | 51.4% |
| Two or more Races | 761 | 7.4% |
| Some other Race | 1,031 | 10.1% |
| Total | 10,235 | 100.0% |
Ancestry in New Hyde Park
The most populous ancestries reported in New Hyde Park are Italian (1,999 | 19.5%), Thai (1,490 | 14.6%), Irish (1,110 | 10.8%), Indian (Asian) (1,028 | 10.0%), and German (1,027 | 10.0%), together accounting for 65.0% of all New Hyde Park residents.
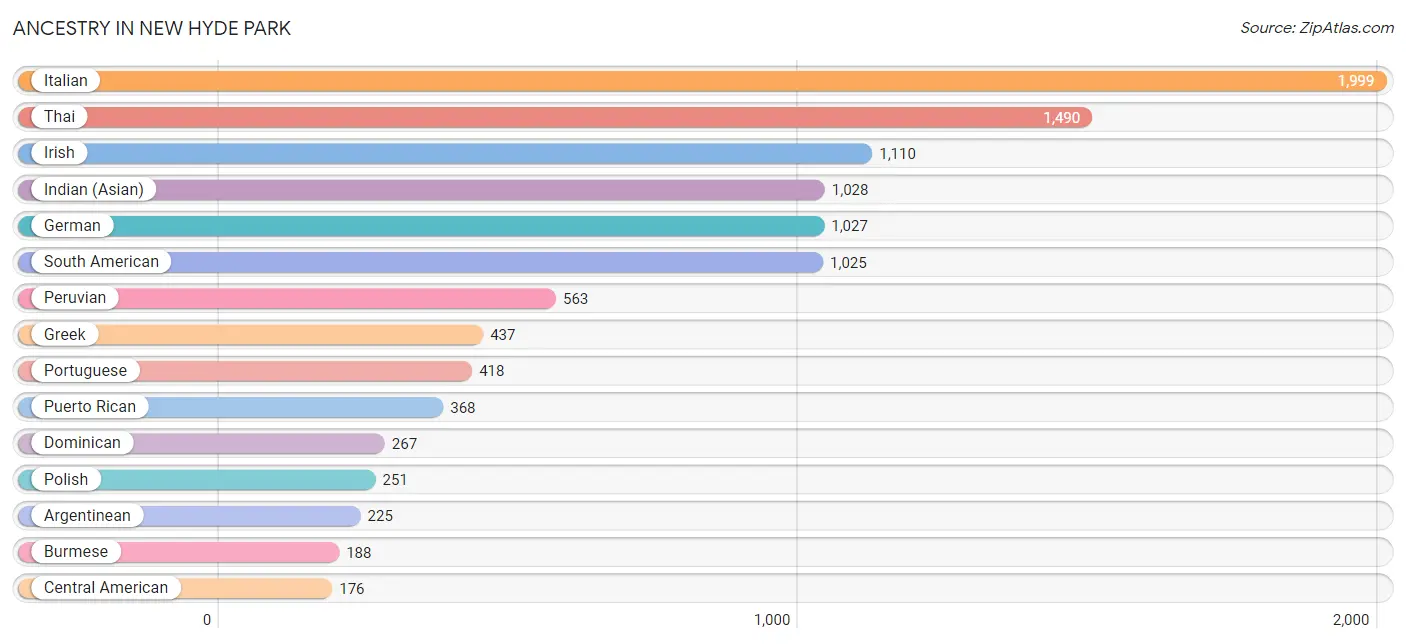
| Ancestry | # Population | % Population |
| American | 72 | 0.7% |
| Arab | 7 | 0.1% |
| Argentinean | 225 | 2.2% |
| Austrian | 3 | 0.0% |
| Belgian | 6 | 0.1% |
| Brazilian | 11 | 0.1% |
| Burmese | 188 | 1.8% |
| Celtic | 27 | 0.3% |
| Central American | 176 | 1.7% |
| Colombian | 168 | 1.6% |
| Croatian | 67 | 0.6% |
| Cuban | 66 | 0.6% |
| Czech | 35 | 0.3% |
| Dominican | 267 | 2.6% |
| Ecuadorian | 69 | 0.7% |
| English | 70 | 0.7% |
| European | 49 | 0.5% |
| German | 1,027 | 10.0% |
| Greek | 437 | 4.3% |
| Guyanese | 42 | 0.4% |
| Honduran | 176 | 1.7% |
| Indian (Asian) | 1,028 | 10.0% |
| Indonesian | 13 | 0.1% |
| Irish | 1,110 | 10.8% |
| Italian | 1,999 | 19.5% |
| Jamaican | 97 | 0.9% |
| Kenyan | 1 | 0.0% |
| Korean | 146 | 1.4% |
| Lithuanian | 23 | 0.2% |
| Maltese | 24 | 0.2% |
| Mexican | 9 | 0.1% |
| Nigerian | 1 | 0.0% |
| Norwegian | 82 | 0.8% |
| Peruvian | 563 | 5.5% |
| Polish | 251 | 2.5% |
| Portuguese | 418 | 4.1% |
| Puerto Rican | 368 | 3.6% |
| Romanian | 33 | 0.3% |
| Russian | 169 | 1.7% |
| Scottish | 12 | 0.1% |
| Slovak | 49 | 0.5% |
| South American | 1,025 | 10.0% |
| South American Indian | 84 | 0.8% |
| Spaniard | 1 | 0.0% |
| Spanish | 17 | 0.2% |
| Sri Lankan | 41 | 0.4% |
| Subsaharan African | 2 | 0.0% |
| Swedish | 14 | 0.1% |
| Thai | 1,490 | 14.6% |
| Trinidadian and Tobagonian | 18 | 0.2% |
| Turkish | 7 | 0.1% |
| Ukrainian | 38 | 0.4% |
| Vietnamese | 117 | 1.1% |
| Welsh | 37 | 0.4% | View All 54 Rows |
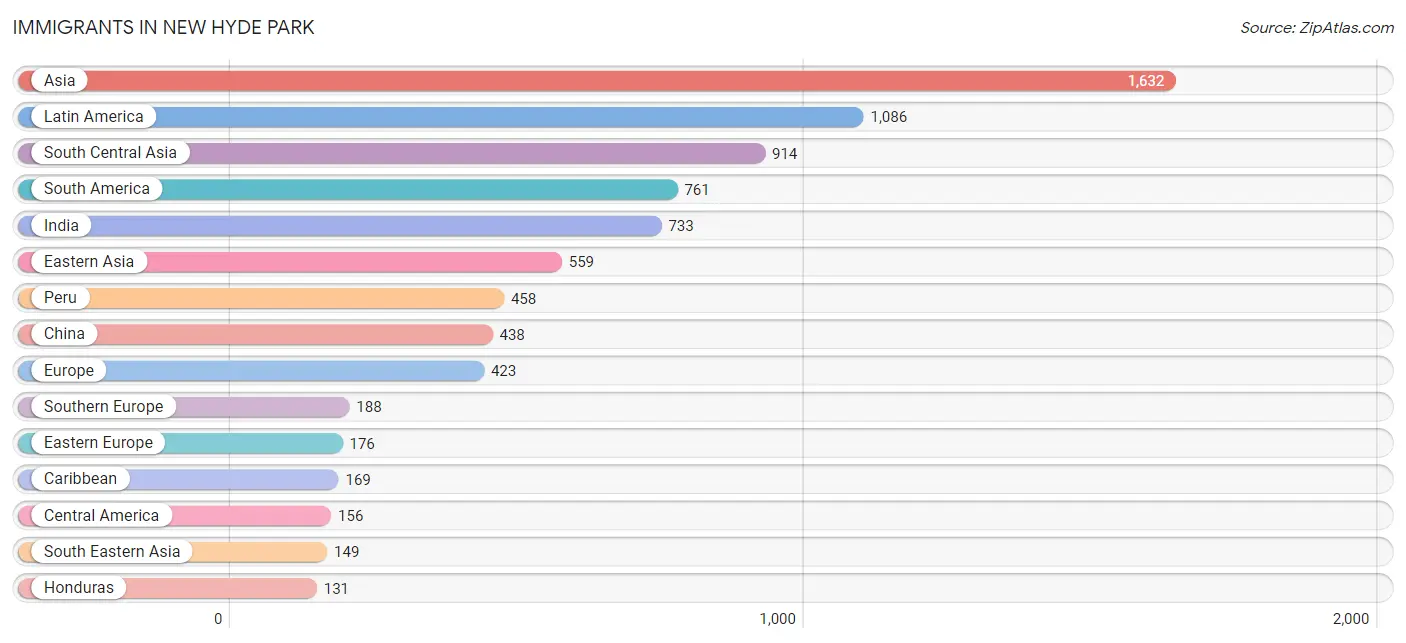
Immigrants in New Hyde Park
The most numerous immigrant groups reported in New Hyde Park came from Asia (1,632 | 16.0%), Latin America (1,086 | 10.6%), South Central Asia (914 | 8.9%), South America (761 | 7.4%), and India (733 | 7.2%), together accounting for 50.1% of all New Hyde Park residents.
| Immigration Origin | # Population | % Population |
| Africa | 15 | 0.2% |
| Argentina | 11 | 0.1% |
| Asia | 1,632 | 16.0% |
| Bangladesh | 110 | 1.1% |
| Belize | 8 | 0.1% |
| Brazil | 118 | 1.1% |
| Caribbean | 169 | 1.7% |
| Central America | 156 | 1.5% |
| China | 438 | 4.3% |
| Colombia | 103 | 1.0% |
| Croatia | 15 | 0.2% |
| Dominican Republic | 76 | 0.7% |
| Eastern Africa | 14 | 0.1% |
| Eastern Asia | 559 | 5.5% |
| Eastern Europe | 176 | 1.7% |
| Ecuador | 24 | 0.2% |
| El Salvador | 17 | 0.2% |
| Europe | 423 | 4.1% |
| Germany | 37 | 0.4% |
| Greece | 74 | 0.7% |
| Grenada | 8 | 0.1% |
| Guyana | 47 | 0.5% |
| Honduras | 131 | 1.3% |
| Hong Kong | 80 | 0.8% |
| India | 733 | 7.2% |
| Italy | 85 | 0.8% |
| Jamaica | 67 | 0.6% |
| Kenya | 1 | 0.0% |
| Korea | 121 | 1.2% |
| Latin America | 1,086 | 10.6% |
| Nigeria | 1 | 0.0% |
| Northern Europe | 22 | 0.2% |
| Pakistan | 71 | 0.7% |
| Peru | 458 | 4.5% |
| Philippines | 58 | 0.6% |
| Poland | 9 | 0.1% |
| Portugal | 28 | 0.3% |
| Romania | 33 | 0.3% |
| Russia | 71 | 0.7% |
| South America | 761 | 7.4% |
| South Central Asia | 914 | 8.9% |
| South Eastern Asia | 149 | 1.5% |
| Southern Europe | 188 | 1.8% |
| Spain | 1 | 0.0% |
| Taiwan | 41 | 0.4% |
| Thailand | 28 | 0.3% |
| Trinidad and Tobago | 18 | 0.2% |
| Ukraine | 48 | 0.5% |
| Vietnam | 8 | 0.1% |
| Western Africa | 1 | 0.0% |
| Western Asia | 10 | 0.1% |
| Western Europe | 37 | 0.4% | View All 52 Rows |
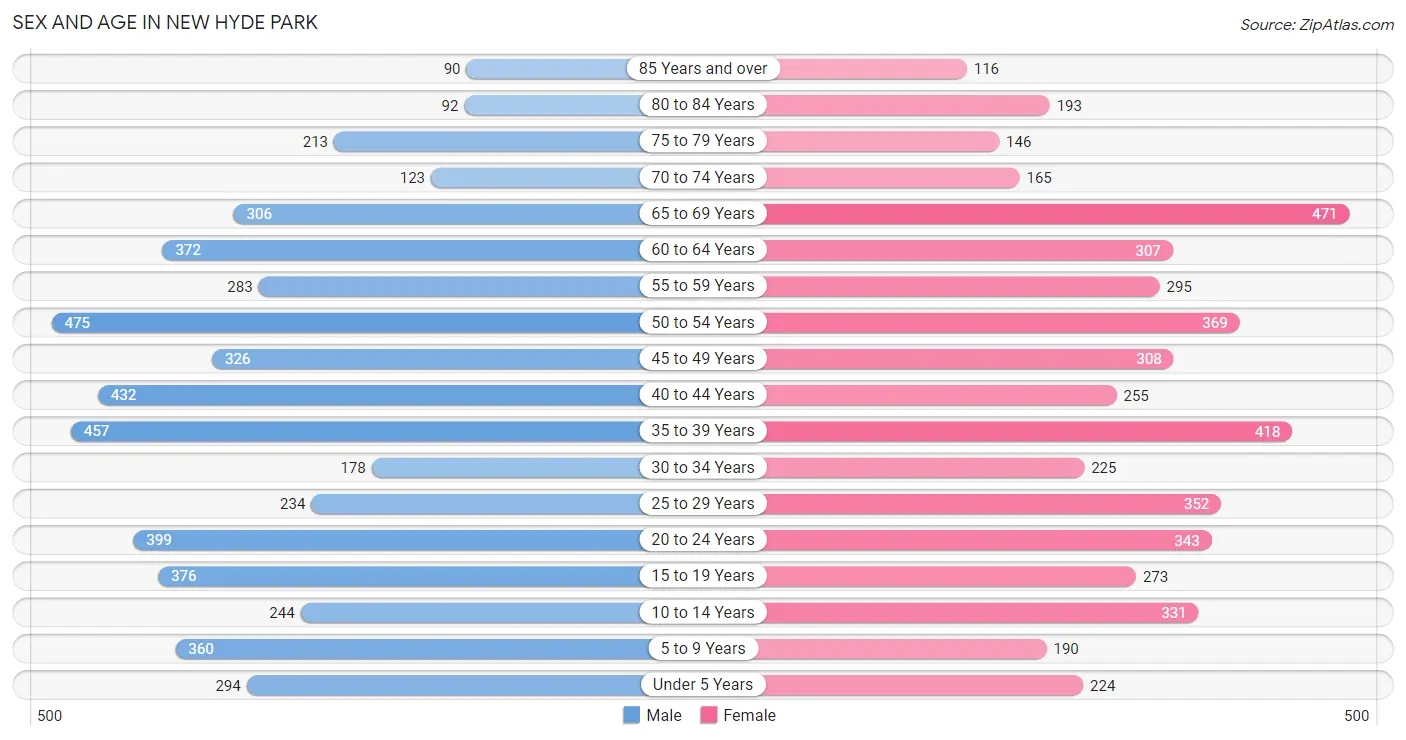
Sex and Age in New Hyde Park
Sex and Age in New Hyde Park
The most populous age groups in New Hyde Park are 50 to 54 Years (475 | 9.0%) for men and 65 to 69 Years (471 | 9.5%) for women.
| Age Bracket | Male | Female |
| Under 5 Years | 294 (5.6%) | 224 (4.5%) |
| 5 to 9 Years | 360 (6.9%) | 190 (3.8%) |
| 10 to 14 Years | 244 (4.6%) | 331 (6.7%) |
| 15 to 19 Years | 376 (7.2%) | 273 (5.5%) |
| 20 to 24 Years | 399 (7.6%) | 343 (6.9%) |
| 25 to 29 Years | 234 (4.4%) | 352 (7.1%) |
| 30 to 34 Years | 178 (3.4%) | 225 (4.5%) |
| 35 to 39 Years | 457 (8.7%) | 418 (8.4%) |
| 40 to 44 Years | 432 (8.2%) | 255 (5.1%) |
| 45 to 49 Years | 326 (6.2%) | 308 (6.2%) |
| 50 to 54 Years | 475 (9.0%) | 369 (7.4%) |
| 55 to 59 Years | 283 (5.4%) | 295 (5.9%) |
| 60 to 64 Years | 372 (7.1%) | 307 (6.2%) |
| 65 to 69 Years | 306 (5.8%) | 471 (9.5%) |
| 70 to 74 Years | 123 (2.3%) | 165 (3.3%) |
| 75 to 79 Years | 213 (4.1%) | 146 (2.9%) |
| 80 to 84 Years | 92 (1.8%) | 193 (3.9%) |
| 85 Years and over | 90 (1.7%) | 116 (2.3%) |
| Total | 5,254 (100.0%) | 4,981 (100.0%) |
Families and Households in New Hyde Park
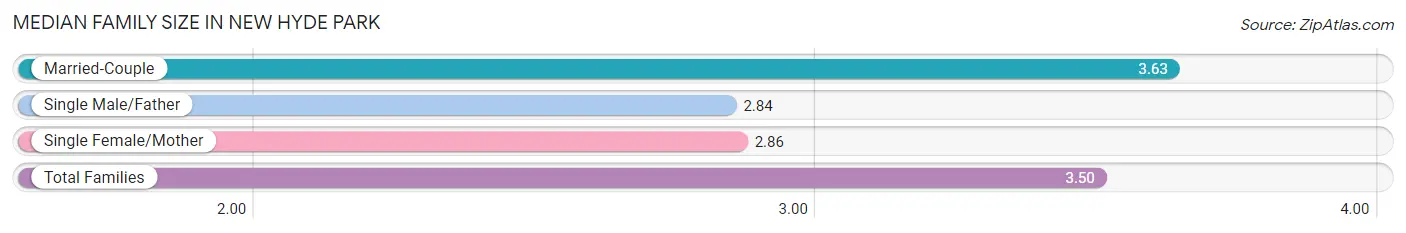
Median Family Size in New Hyde Park
The median family size in New Hyde Park is 3.50 persons per family, with married-couple families (2,201 | 83.5%) accounting for the largest median family size of 3.63 persons per family. On the other hand, single male/father families (202 | 7.7%) represent the smallest median family size with 2.84 persons per family.
| Family Type | # Families | Family Size |
| Married-Couple | 2,201 (83.5%) | 3.63 |
| Single Male/Father | 202 (7.7%) | 2.84 |
| Single Female/Mother | 234 (8.9%) | 2.86 |
| Total Families | 2,637 (100.0%) | 3.50 |
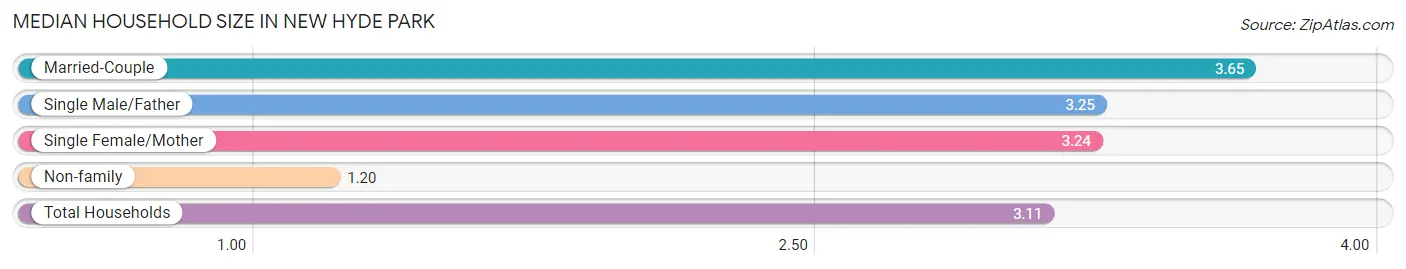
Median Household Size in New Hyde Park
The median household size in New Hyde Park is 3.11 persons per household, with married-couple households (2,201 | 66.9%) accounting for the largest median household size of 3.65 persons per household. non-family households (653 | 19.9%) represent the smallest median household size with 1.20 persons per household.
| Household Type | # Households | Household Size |
| Married-Couple | 2,201 (66.9%) | 3.65 |
| Single Male/Father | 202 (6.1%) | 3.25 |
| Single Female/Mother | 234 (7.1%) | 3.24 |
| Non-family | 653 (19.9%) | 1.20 |
| Total Households | 3,290 (100.0%) | 3.11 |
Household Size by Marriage Status in New Hyde Park
Out of a total of 3,290 households in New Hyde Park, 2,637 (80.1%) are family households, while 653 (19.9%) are nonfamily households. The most numerous type of family households are 4-person households, comprising 930, and the most common type of nonfamily households are 1-person households, comprising 519.
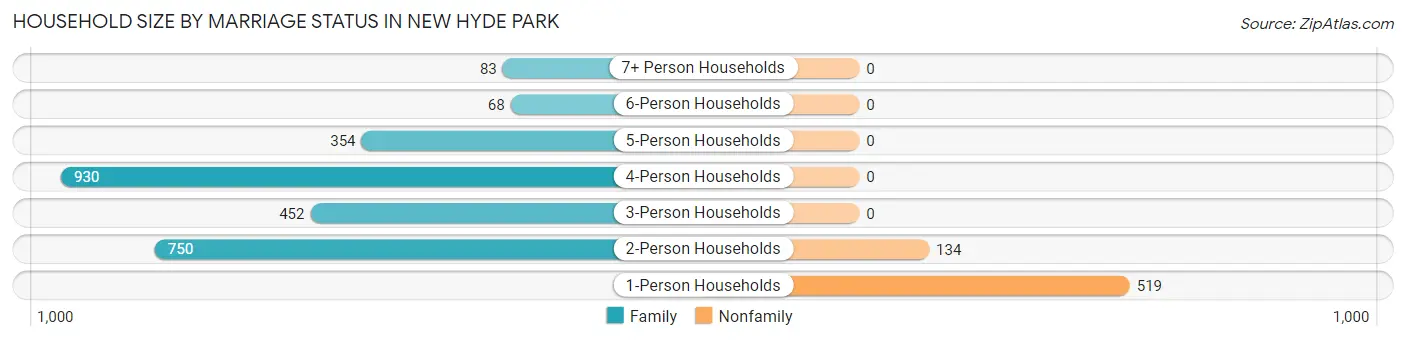
| Household Size | Family Households | Nonfamily Households |
| 1-Person Households | - | 519 (15.8%) |
| 2-Person Households | 750 (22.8%) | 134 (4.1%) |
| 3-Person Households | 452 (13.7%) | 0 (0.0%) |
| 4-Person Households | 930 (28.3%) | 0 (0.0%) |
| 5-Person Households | 354 (10.8%) | 0 (0.0%) |
| 6-Person Households | 68 (2.1%) | 0 (0.0%) |
| 7+ Person Households | 83 (2.5%) | 0 (0.0%) |
| Total | 2,637 (80.1%) | 653 (19.9%) |
Female Fertility in New Hyde Park
Fertility by Age in New Hyde Park
Average fertility rate in New Hyde Park is 76.0 births per 1,000 women. Women in the age bracket of 20 to 34 years have the highest fertility rate with 89.0 births per 1,000 women. Women in the age bracket of 35 to 50 years acount for 51.8% of all women with births.
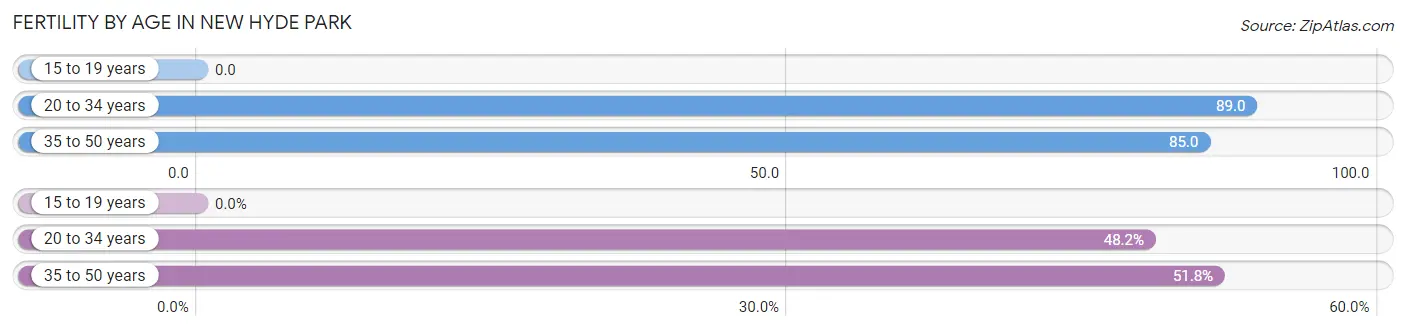
| Age Bracket | Women with Births | Births / 1,000 Women |
| 15 to 19 years | 0 (0.0%) | 0.0 |
| 20 to 34 years | 82 (48.2%) | 89.0 |
| 35 to 50 years | 88 (51.8%) | 85.0 |
| Total | 170 (100.0%) | 76.0 |
Fertility by Age by Marriage Status in New Hyde Park
84.1% of women with births (170) in New Hyde Park are married. The highest percentage of unmarried women with births falls into 20 to 34 years age bracket with 32.9% of them unmarried at the time of birth, while the lowest percentage of unmarried women with births belong to 35 to 50 years age bracket with 0.0% of them unmarried.
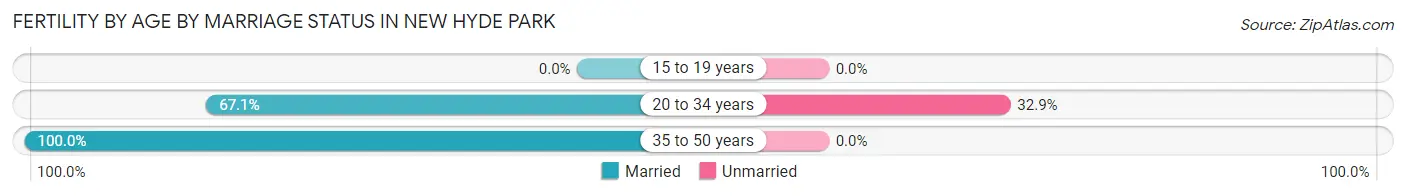
| Age Bracket | Married | Unmarried |
| 15 to 19 years | 0 (0.0%) | 0 (0.0%) |
| 20 to 34 years | 55 (67.1%) | 27 (32.9%) |
| 35 to 50 years | 88 (100.0%) | 0 (0.0%) |
| Total | 143 (84.1%) | 27 (15.9%) |
Fertility by Education in New Hyde Park
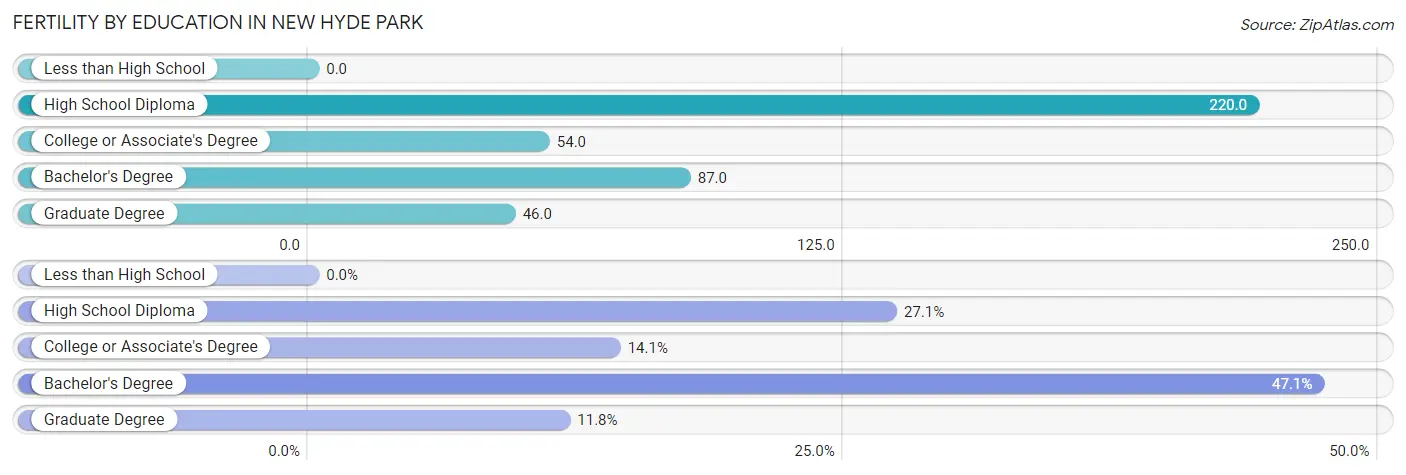
| Educational Attainment | Women with Births | Births / 1,000 Women |
| Less than High School | 0 (0.0%) | 0.0 |
| High School Diploma | 46 (27.1%) | 220.0 |
| College or Associate's Degree | 24 (14.1%) | 54.0 |
| Bachelor's Degree | 80 (47.1%) | 87.0 |
| Graduate Degree | 20 (11.8%) | 46.0 |
| Total | 170 (100.0%) | 76.0 |
Fertility by Education by Marriage Status in New Hyde Park
15.9% of women with births in New Hyde Park are unmarried. Women with the educational attainment of bachelor's degree are most likely to be married with 100.0% of them married at childbirth, while women with the educational attainment of college or associate's degree are least likely to be married with 50.0% of them unmarried at childbirth.
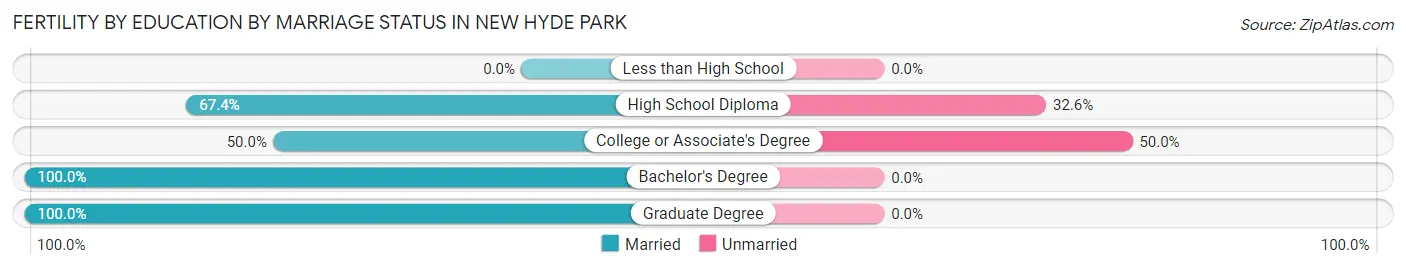
| Educational Attainment | Married | Unmarried |
| Less than High School | 0 (0.0%) | 0 (0.0%) |
| High School Diploma | 31 (67.4%) | 15 (32.6%) |
| College or Associate's Degree | 12 (50.0%) | 12 (50.0%) |
| Bachelor's Degree | 80 (100.0%) | 0 (0.0%) |
| Graduate Degree | 20 (100.0%) | 0 (0.0%) |
| Total | 143 (84.1%) | 27 (15.9%) |
Employment Characteristics in New Hyde Park
Employment by Class of Employer in New Hyde Park
Among the 5,555 employed individuals in New Hyde Park, private company employees (3,740 | 67.3%), not-for-profit organizations (588 | 10.6%), and local government employees (470 | 8.5%) make up the most common classes of employment.
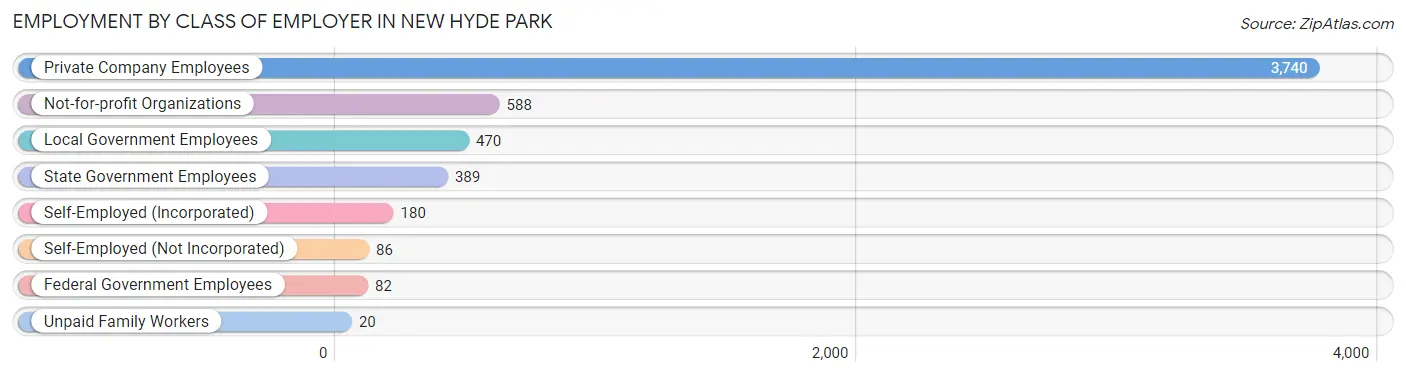
| Employer Class | # Employees | % Employees |
| Private Company Employees | 3,740 | 67.3% |
| Self-Employed (Incorporated) | 180 | 3.2% |
| Self-Employed (Not Incorporated) | 86 | 1.5% |
| Not-for-profit Organizations | 588 | 10.6% |
| Local Government Employees | 470 | 8.5% |
| State Government Employees | 389 | 7.0% |
| Federal Government Employees | 82 | 1.5% |
| Unpaid Family Workers | 20 | 0.4% |
| Total | 5,555 | 100.0% |
Employment Status by Age in New Hyde Park
According to the labor force statistics for New Hyde Park, out of the total population over 16 years of age (8,525), 68.7% or 5,857 individuals are in the labor force, with 4.3% or 252 of them unemployed. The age group with the highest labor force participation rate is 25 to 29 years, with 95.4% or 559 individuals in the labor force. Within the labor force, the 65 to 74 years age range has the highest percentage of unemployed individuals, with 9.6% or 36 of them being unemployed.
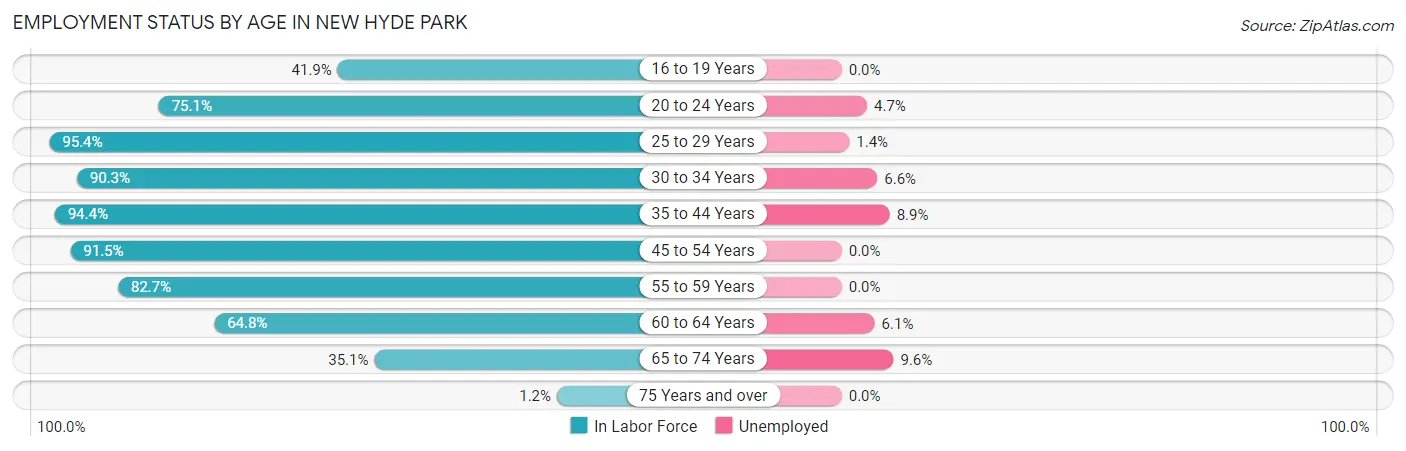
| Age Bracket | In Labor Force | Unemployed |
| 16 to 19 Years | 244 (41.9%) | 0 (0.0%) |
| 20 to 24 Years | 557 (75.1%) | 26 (4.7%) |
| 25 to 29 Years | 559 (95.4%) | 8 (1.4%) |
| 30 to 34 Years | 364 (90.3%) | 24 (6.6%) |
| 35 to 44 Years | 1,475 (94.4%) | 131 (8.9%) |
| 45 to 54 Years | 1,352 (91.5%) | 0 (0.0%) |
| 55 to 59 Years | 478 (82.7%) | 0 (0.0%) |
| 60 to 64 Years | 440 (64.8%) | 27 (6.1%) |
| 65 to 74 Years | 374 (35.1%) | 36 (9.6%) |
| 75 Years and over | 10 (1.2%) | 0 (0.0%) |
| Total | 5,857 (68.7%) | 252 (4.3%) |
Employment Status by Educational Attainment in New Hyde Park
According to labor force statistics for New Hyde Park, 88.3% of individuals (4,668) out of the total population between 25 and 64 years of age (5,286) are in the labor force, with 4.1% or 191 of them being unemployed. The group with the highest labor force participation rate are those with the educational attainment of bachelor's degree or higher, with 91.9% or 2,628 individuals in the labor force. Within the labor force, individuals with bachelor's degree or higher education have the highest percentage of unemployment, with 5.9% or 155 of them being unemployed.
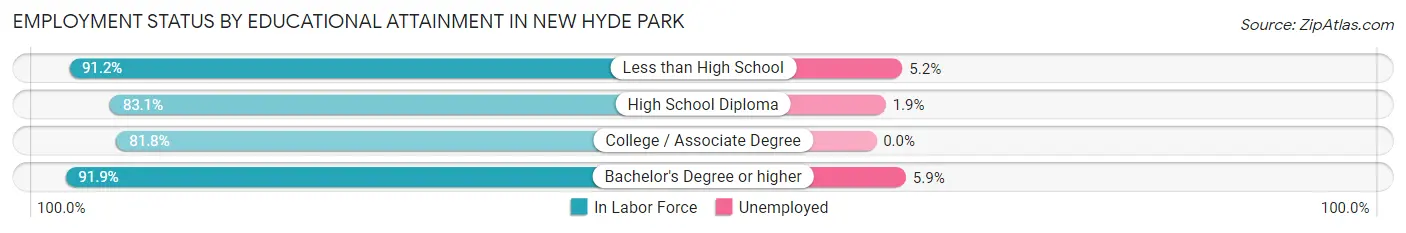
| Educational Attainment | In Labor Force | Unemployed |
| Less than High School | 423 (91.2%) | 24 (5.2%) |
| High School Diploma | 734 (83.1%) | 17 (1.9%) |
| College / Associate Degree | 883 (81.8%) | 0 (0.0%) |
| Bachelor's Degree or higher | 2,628 (91.9%) | 169 (5.9%) |
| Total | 4,668 (88.3%) | 217 (4.1%) |
Employment Occupations by Sex in New Hyde Park
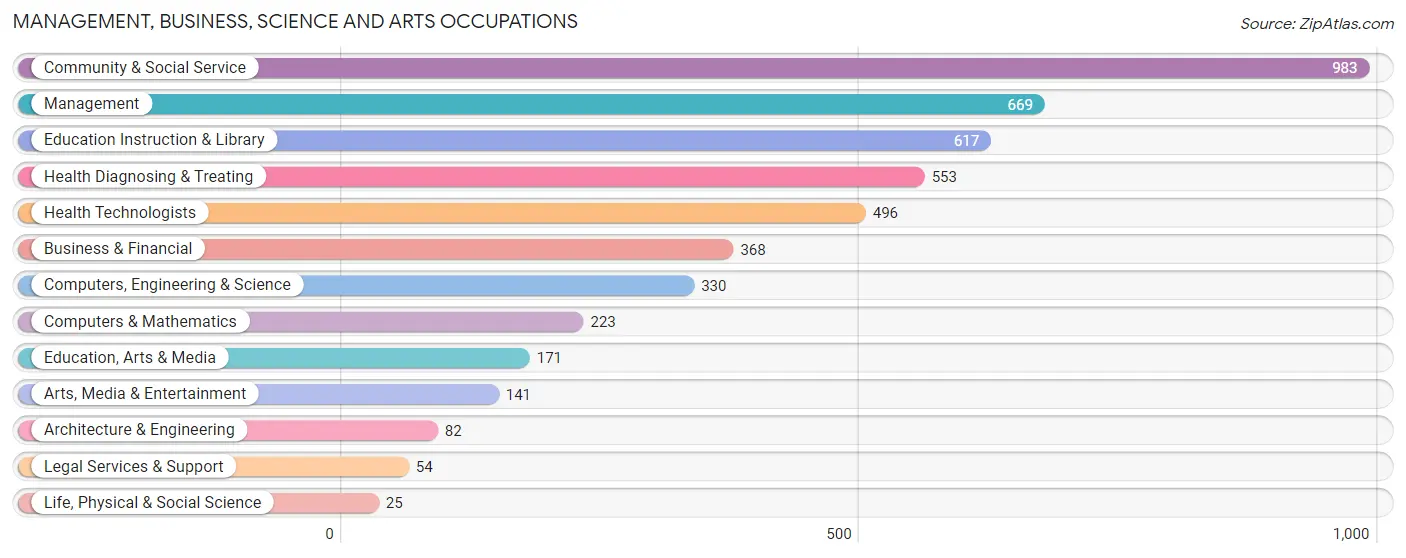
Management, Business, Science and Arts Occupations
The most common Management, Business, Science and Arts occupations in New Hyde Park are Community & Social Service (983 | 17.5%), Management (669 | 11.9%), Education Instruction & Library (617 | 11.0%), Health Diagnosing & Treating (553 | 9.9%), and Health Technologists (496 | 8.9%).
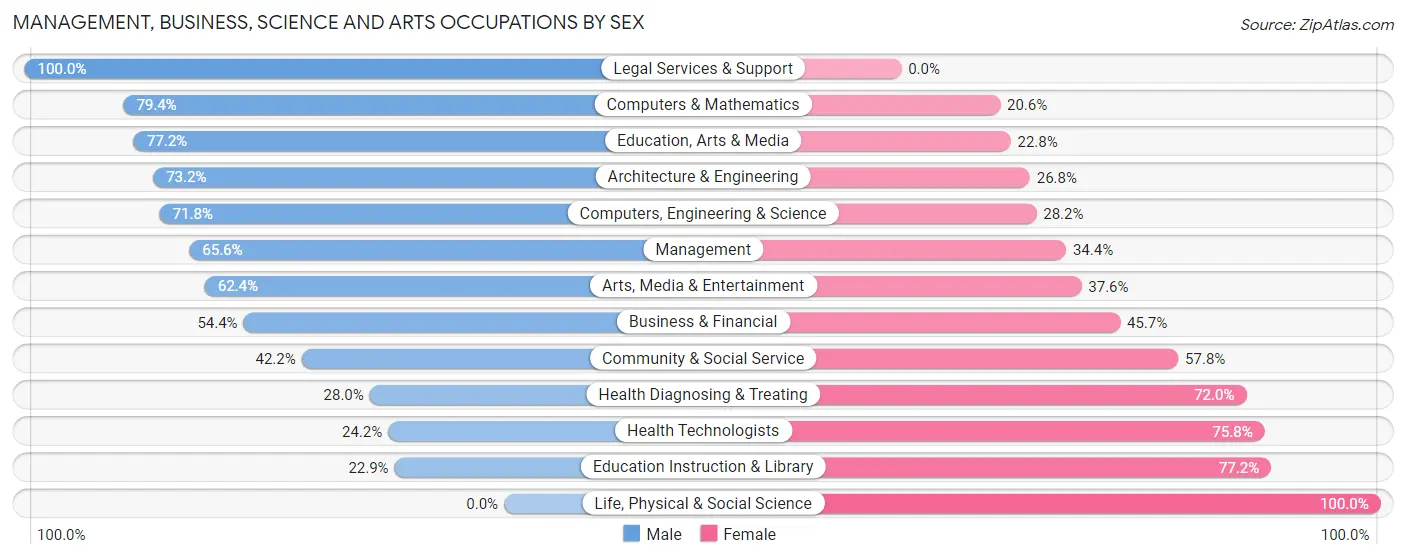
Management, Business, Science and Arts Occupations by Sex
Within the Management, Business, Science and Arts occupations in New Hyde Park, the most male-oriented occupations are Legal Services & Support (100.0%), Computers & Mathematics (79.4%), and Education, Arts & Media (77.2%), while the most female-oriented occupations are Life, Physical & Social Science (100.0%), Education Instruction & Library (77.1%), and Health Technologists (75.8%).
| Occupation | Male | Female |
| Management | 439 (65.6%) | 230 (34.4%) |
| Business & Financial | 200 (54.3%) | 168 (45.7%) |
| Computers, Engineering & Science | 237 (71.8%) | 93 (28.2%) |
| Computers & Mathematics | 177 (79.4%) | 46 (20.6%) |
| Architecture & Engineering | 60 (73.2%) | 22 (26.8%) |
| Life, Physical & Social Science | 0 (0.0%) | 25 (100.0%) |
| Community & Social Service | 415 (42.2%) | 568 (57.8%) |
| Education, Arts & Media | 132 (77.2%) | 39 (22.8%) |
| Legal Services & Support | 54 (100.0%) | 0 (0.0%) |
| Education Instruction & Library | 141 (22.9%) | 476 (77.1%) |
| Arts, Media & Entertainment | 88 (62.4%) | 53 (37.6%) |
| Health Diagnosing & Treating | 155 (28.0%) | 398 (72.0%) |
| Health Technologists | 120 (24.2%) | 376 (75.8%) |
| Total (Category) | 1,446 (49.8%) | 1,457 (50.2%) |
| Total (Overall) | 2,877 (51.4%) | 2,724 (48.6%) |
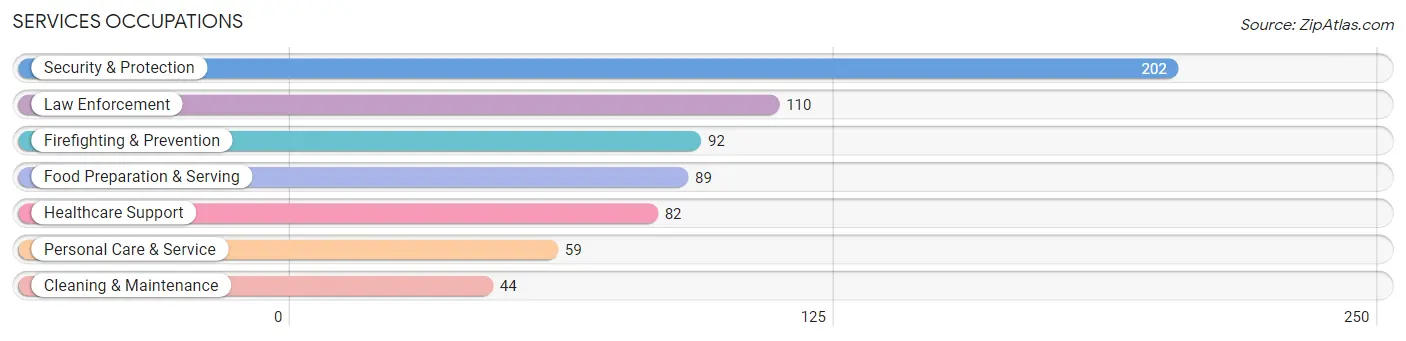
Services Occupations
The most common Services occupations in New Hyde Park are Security & Protection (202 | 3.6%), Law Enforcement (110 | 2.0%), Firefighting & Prevention (92 | 1.6%), Food Preparation & Serving (89 | 1.6%), and Healthcare Support (82 | 1.5%).
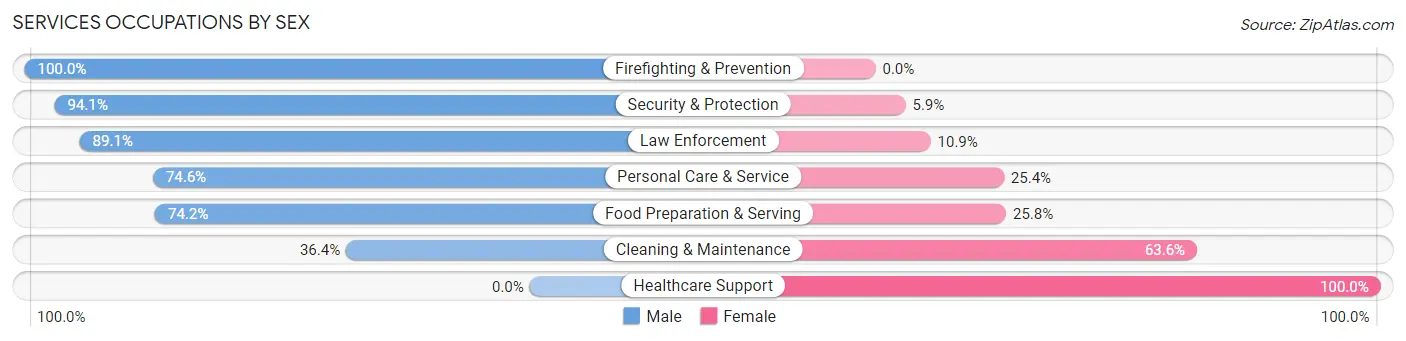
Services Occupations by Sex
Within the Services occupations in New Hyde Park, the most male-oriented occupations are Firefighting & Prevention (100.0%), Security & Protection (94.1%), and Law Enforcement (89.1%), while the most female-oriented occupations are Healthcare Support (100.0%), Cleaning & Maintenance (63.6%), and Food Preparation & Serving (25.8%).
| Occupation | Male | Female |
| Healthcare Support | 0 (0.0%) | 82 (100.0%) |
| Security & Protection | 190 (94.1%) | 12 (5.9%) |
| Firefighting & Prevention | 92 (100.0%) | 0 (0.0%) |
| Law Enforcement | 98 (89.1%) | 12 (10.9%) |
| Food Preparation & Serving | 66 (74.2%) | 23 (25.8%) |
| Cleaning & Maintenance | 16 (36.4%) | 28 (63.6%) |
| Personal Care & Service | 44 (74.6%) | 15 (25.4%) |
| Total (Category) | 316 (66.4%) | 160 (33.6%) |
| Total (Overall) | 2,877 (51.4%) | 2,724 (48.6%) |
Sales and Office Occupations
The most common Sales and Office occupations in New Hyde Park are Sales & Related (814 | 14.5%), and Office & Administration (574 | 10.2%).
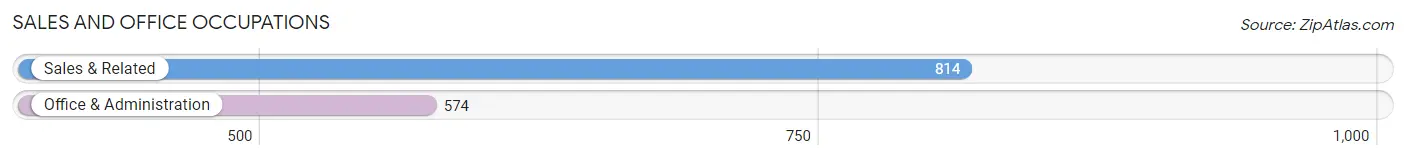
Sales and Office Occupations by Sex
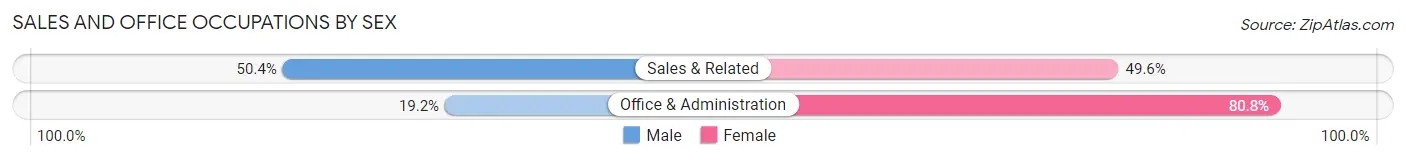
| Occupation | Male | Female |
| Sales & Related | 410 (50.4%) | 404 (49.6%) |
| Office & Administration | 110 (19.2%) | 464 (80.8%) |
| Total (Category) | 520 (37.5%) | 868 (62.5%) |
| Total (Overall) | 2,877 (51.4%) | 2,724 (48.6%) |
Natural Resources, Construction and Maintenance Occupations
The most common Natural Resources, Construction and Maintenance occupations in New Hyde Park are Installation, Maintenance & Repair (117 | 2.1%), and Construction & Extraction (112 | 2.0%).
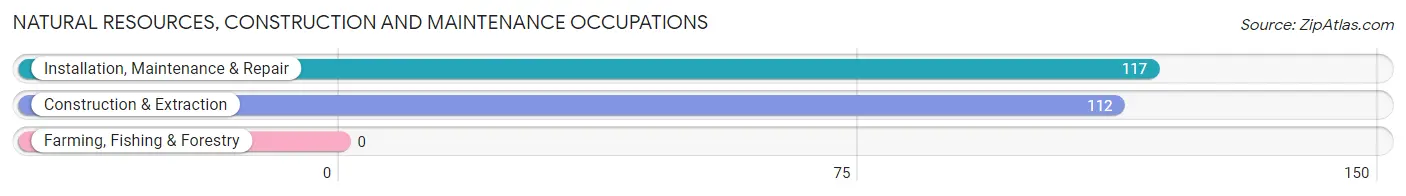
Natural Resources, Construction and Maintenance Occupations by Sex
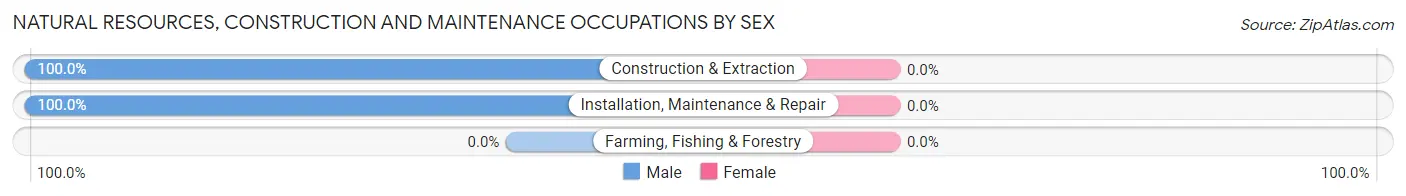
| Occupation | Male | Female |
| Farming, Fishing & Forestry | 0 (0.0%) | 0 (0.0%) |
| Construction & Extraction | 112 (100.0%) | 0 (0.0%) |
| Installation, Maintenance & Repair | 117 (100.0%) | 0 (0.0%) |
| Total (Category) | 229 (100.0%) | 0 (0.0%) |
| Total (Overall) | 2,877 (51.4%) | 2,724 (48.6%) |
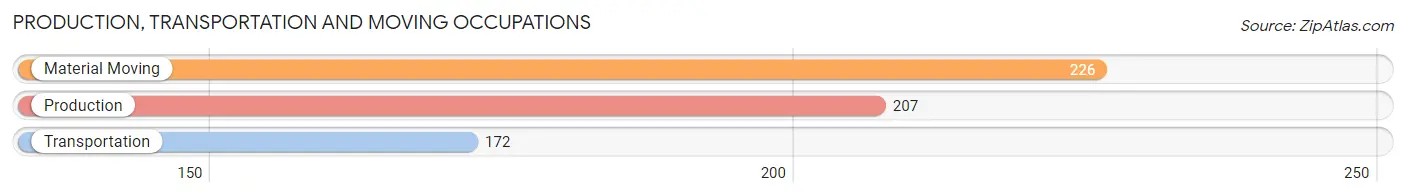
Production, Transportation and Moving Occupations
The most common Production, Transportation and Moving occupations in New Hyde Park are Material Moving (226 | 4.0%), Production (207 | 3.7%), and Transportation (172 | 3.1%).
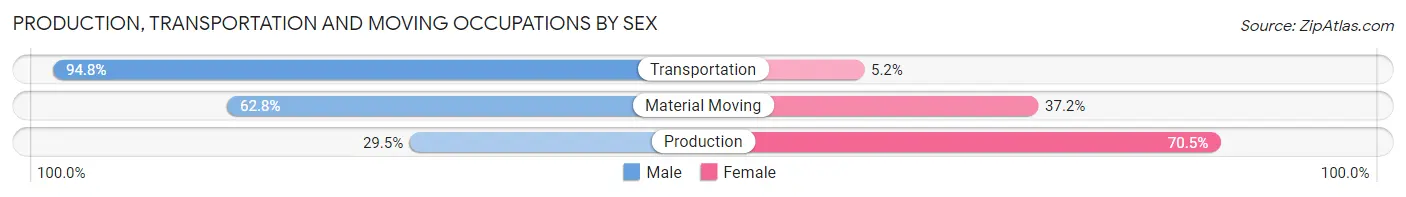
Production, Transportation and Moving Occupations by Sex
| Occupation | Male | Female |
| Production | 61 (29.5%) | 146 (70.5%) |
| Transportation | 163 (94.8%) | 9 (5.2%) |
| Material Moving | 142 (62.8%) | 84 (37.2%) |
| Total (Category) | 366 (60.5%) | 239 (39.5%) |
| Total (Overall) | 2,877 (51.4%) | 2,724 (48.6%) |
Employment Industries by Sex in New Hyde Park
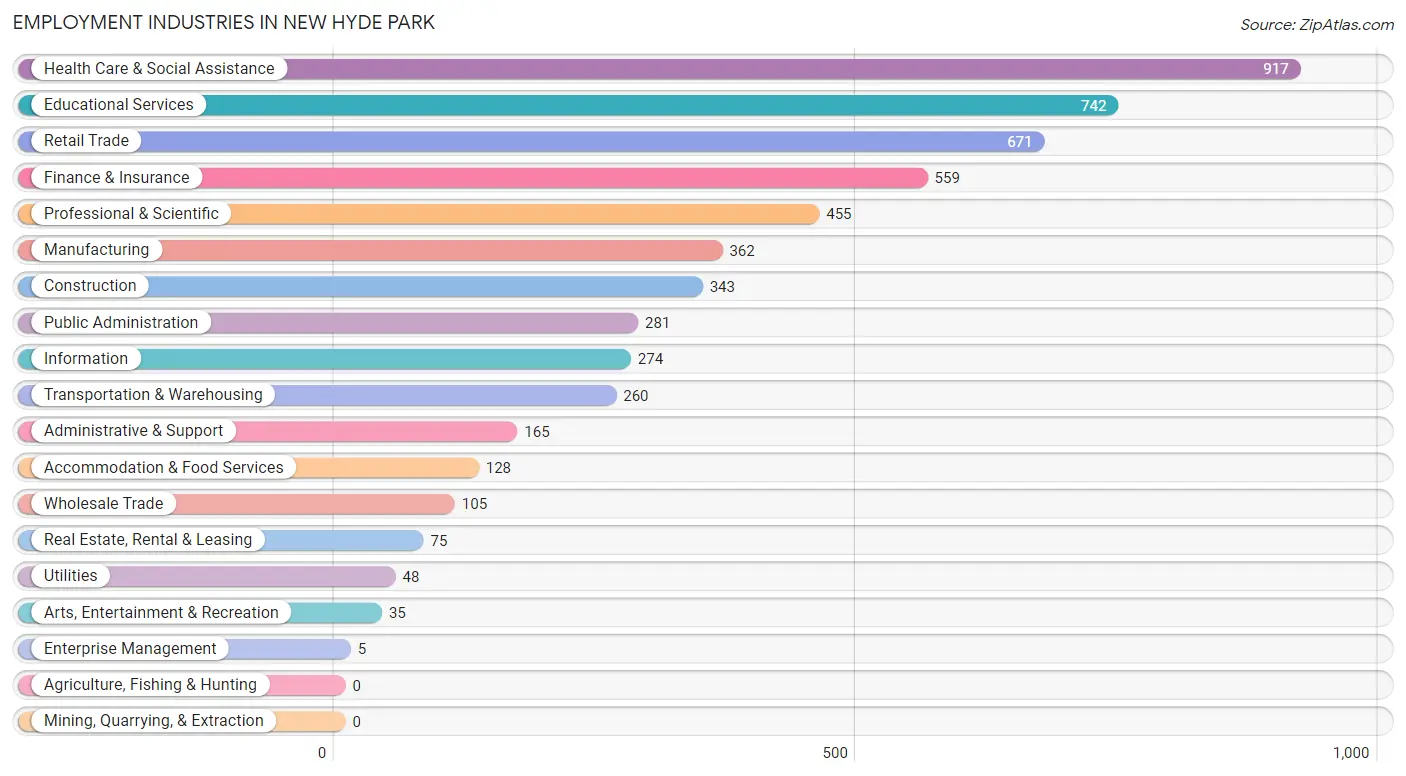
Employment Industries in New Hyde Park
The major employment industries in New Hyde Park include Health Care & Social Assistance (917 | 16.4%), Educational Services (742 | 13.3%), Retail Trade (671 | 12.0%), Finance & Insurance (559 | 10.0%), and Professional & Scientific (455 | 8.1%).
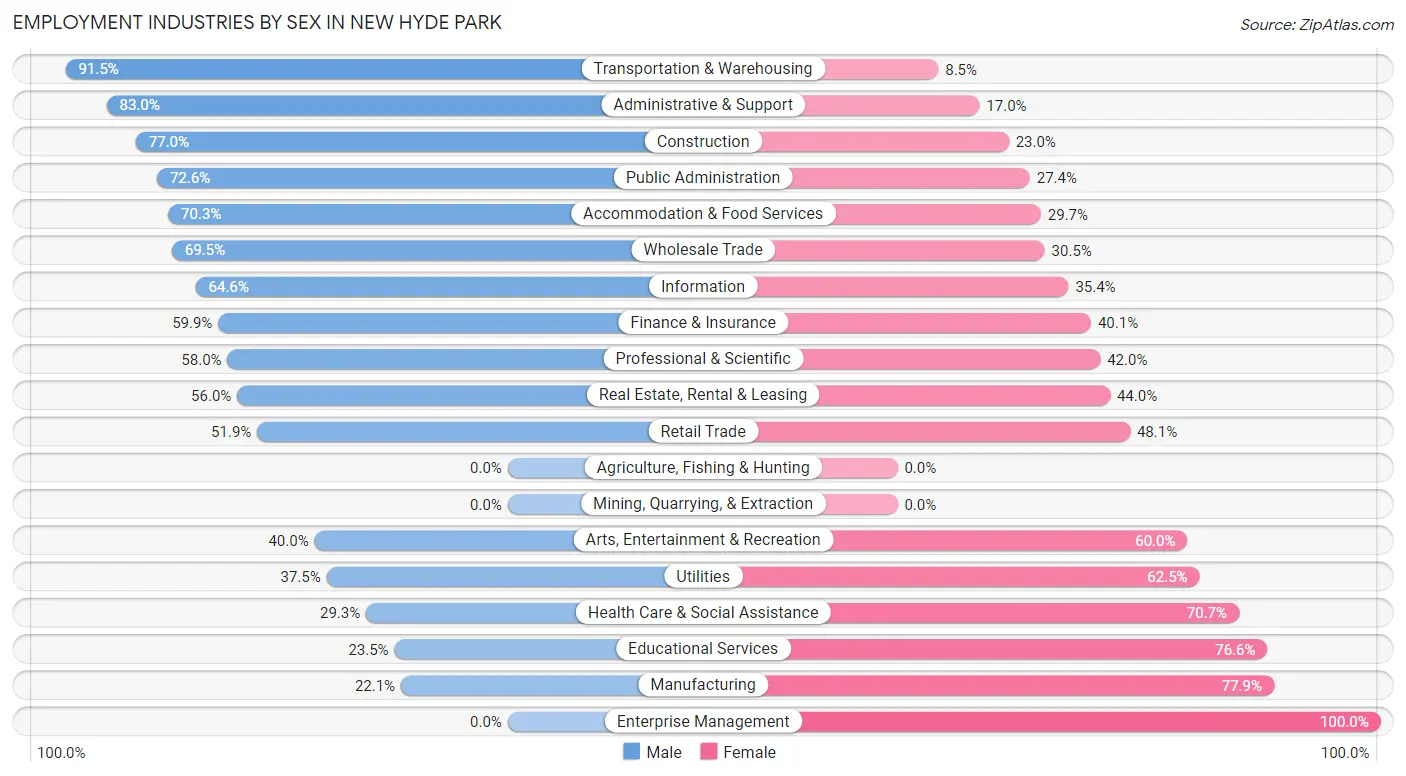
Employment Industries by Sex in New Hyde Park
The New Hyde Park industries that see more men than women are Transportation & Warehousing (91.5%), Administrative & Support (83.0%), and Construction (77.0%), whereas the industries that tend to have a higher number of women are Enterprise Management (100.0%), Manufacturing (77.9%), and Educational Services (76.5%).
| Industry | Male | Female |
| Agriculture, Fishing & Hunting | 0 (0.0%) | 0 (0.0%) |
| Mining, Quarrying, & Extraction | 0 (0.0%) | 0 (0.0%) |
| Construction | 264 (77.0%) | 79 (23.0%) |
| Manufacturing | 80 (22.1%) | 282 (77.9%) |
| Wholesale Trade | 73 (69.5%) | 32 (30.5%) |
| Retail Trade | 348 (51.9%) | 323 (48.1%) |
| Transportation & Warehousing | 238 (91.5%) | 22 (8.5%) |
| Utilities | 18 (37.5%) | 30 (62.5%) |
| Information | 177 (64.6%) | 97 (35.4%) |
| Finance & Insurance | 335 (59.9%) | 224 (40.1%) |
| Real Estate, Rental & Leasing | 42 (56.0%) | 33 (44.0%) |
| Professional & Scientific | 264 (58.0%) | 191 (42.0%) |
| Enterprise Management | 0 (0.0%) | 5 (100.0%) |
| Administrative & Support | 137 (83.0%) | 28 (17.0%) |
| Educational Services | 174 (23.4%) | 568 (76.5%) |
| Health Care & Social Assistance | 269 (29.3%) | 648 (70.7%) |
| Arts, Entertainment & Recreation | 14 (40.0%) | 21 (60.0%) |
| Accommodation & Food Services | 90 (70.3%) | 38 (29.7%) |
| Public Administration | 204 (72.6%) | 77 (27.4%) |
| Total | 2,877 (51.4%) | 2,724 (48.6%) |
Education in New Hyde Park
School Enrollment in New Hyde Park
The most common levels of schooling among the 2,614 students in New Hyde Park are college / undergraduate (702 | 26.9%), middle school (463 | 17.7%), and high school (428 | 16.4%).
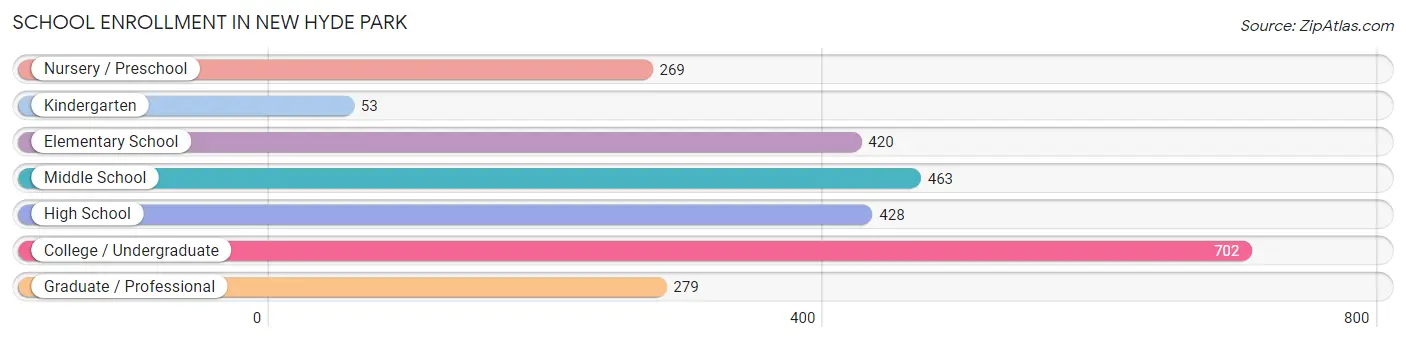
| School Level | # Students | % Students |
| Nursery / Preschool | 269 | 10.3% |
| Kindergarten | 53 | 2.0% |
| Elementary School | 420 | 16.1% |
| Middle School | 463 | 17.7% |
| High School | 428 | 16.4% |
| College / Undergraduate | 702 | 26.9% |
| Graduate / Professional | 279 | 10.7% |
| Total | 2,614 | 100.0% |
School Enrollment by Age by Funding Source in New Hyde Park
Out of a total of 2,614 students who are enrolled in schools in New Hyde Park, 1,056 (40.4%) attend a private institution, while the remaining 1,558 (59.6%) are enrolled in public schools. The age group of 25 to 34 year olds has the highest likelihood of being enrolled in private schools, with 144 (92.3% in the age bracket) enrolled. Conversely, the age group of 18 to 19 year olds has the lowest likelihood of being enrolled in a private school, with 157 (83.1% in the age bracket) attending a public institution.
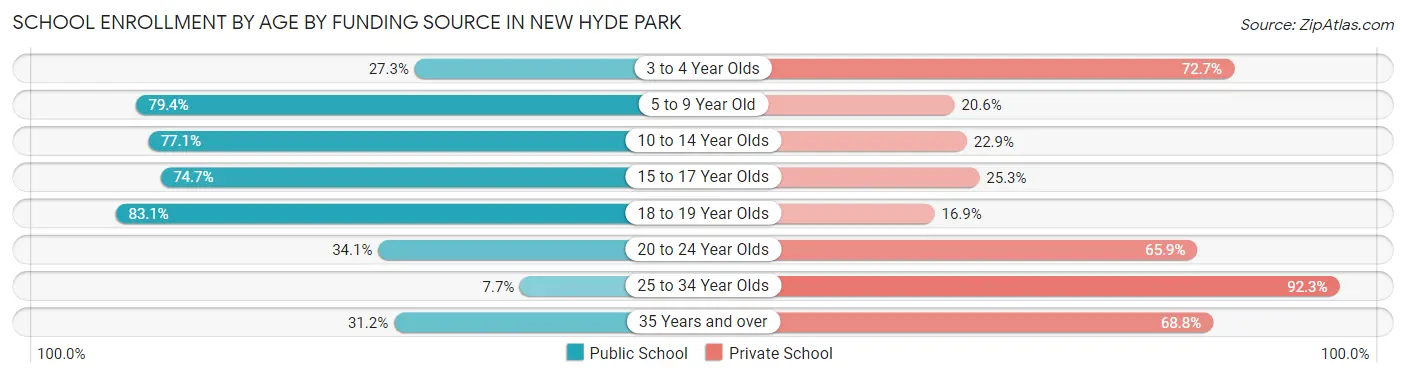
| Age Bracket | Public School | Private School |
| 3 to 4 Year Olds | 44 (27.3%) | 117 (72.7%) |
| 5 to 9 Year Old | 423 (79.4%) | 110 (20.6%) |
| 10 to 14 Year Olds | 430 (77.1%) | 128 (22.9%) |
| 15 to 17 Year Olds | 281 (74.7%) | 95 (25.3%) |
| 18 to 19 Year Olds | 157 (83.1%) | 32 (16.9%) |
| 20 to 24 Year Olds | 128 (34.1%) | 247 (65.9%) |
| 25 to 34 Year Olds | 12 (7.7%) | 144 (92.3%) |
| 35 Years and over | 83 (31.2%) | 183 (68.8%) |
| Total | 1,558 (59.6%) | 1,056 (40.4%) |
Educational Attainment by Field of Study in New Hyde Park
Science & technology (669 | 18.0%), business (618 | 16.6%), education (438 | 11.8%), social sciences (360 | 9.7%), and engineering (289 | 7.8%) are the most common fields of study among 3,722 individuals in New Hyde Park who have obtained a bachelor's degree or higher.
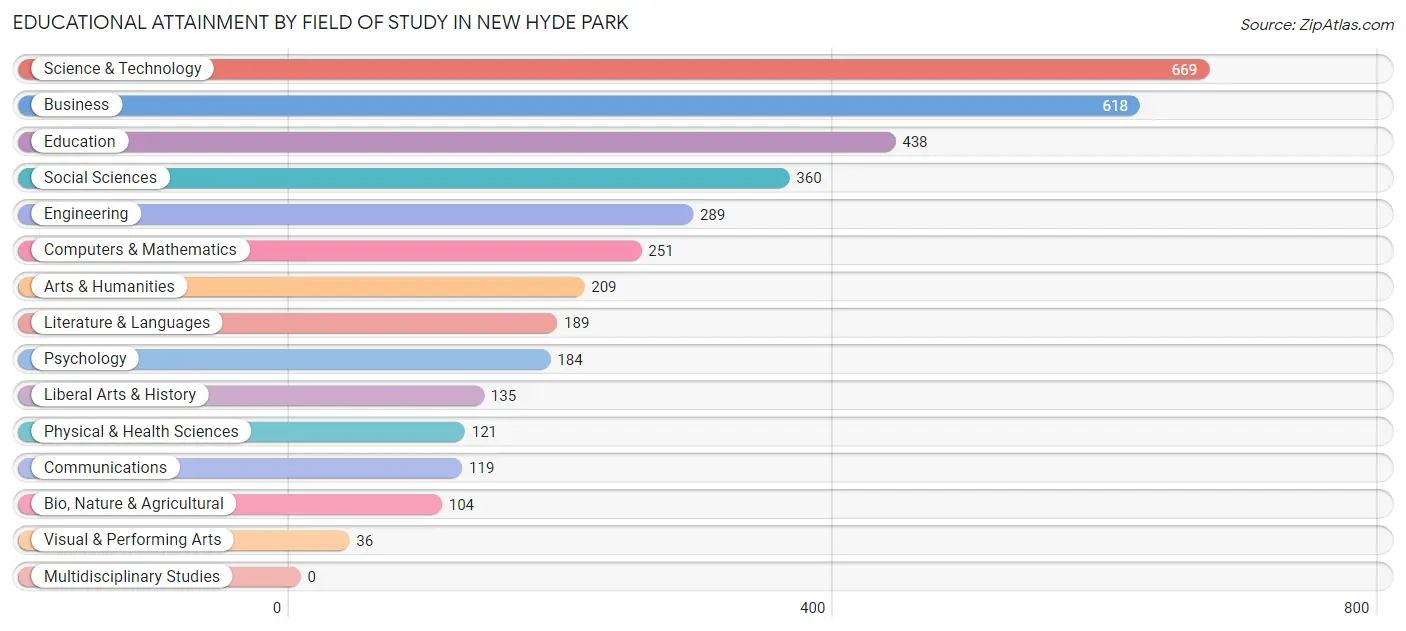
| Field of Study | # Graduates | % Graduates |
| Computers & Mathematics | 251 | 6.7% |
| Bio, Nature & Agricultural | 104 | 2.8% |
| Physical & Health Sciences | 121 | 3.3% |
| Psychology | 184 | 4.9% |
| Social Sciences | 360 | 9.7% |
| Engineering | 289 | 7.8% |
| Multidisciplinary Studies | 0 | 0.0% |
| Science & Technology | 669 | 18.0% |
| Business | 618 | 16.6% |
| Education | 438 | 11.8% |
| Literature & Languages | 189 | 5.1% |
| Liberal Arts & History | 135 | 3.6% |
| Visual & Performing Arts | 36 | 1.0% |
| Communications | 119 | 3.2% |
| Arts & Humanities | 209 | 5.6% |
| Total | 3,722 | 100.0% |
Transportation & Commute in New Hyde Park
Vehicle Availability by Sex in New Hyde Park
The most prevalent vehicle ownership categories in New Hyde Park are males with 2 vehicles (1,506, accounting for 53.0%) and females with 2 vehicles (1,366, making up 55.6%).
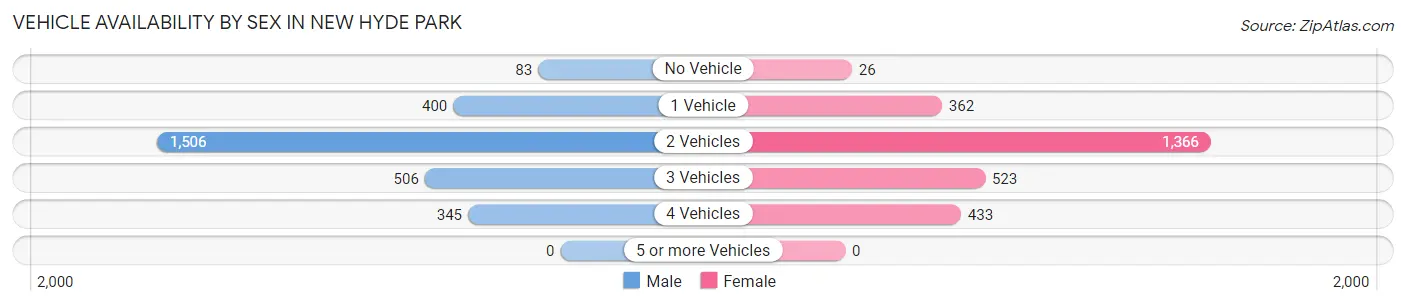
| Vehicles Available | Male | Female |
| No Vehicle | 83 (2.9%) | 26 (1.0%) |
| 1 Vehicle | 400 (14.1%) | 362 (13.4%) |
| 2 Vehicles | 1,506 (53.0%) | 1,366 (50.4%) |
| 3 Vehicles | 506 (17.8%) | 523 (19.3%) |
| 4 Vehicles | 345 (12.1%) | 433 (16.0%) |
| 5 or more Vehicles | 0 (0.0%) | 0 (0.0%) |
| Total | 2,840 (100.0%) | 2,710 (100.0%) |
Commute Time in New Hyde Park
The most frequently occuring commute durations in New Hyde Park are 60 to 89 minutes (1,054 commuters, 21.9%), 30 to 34 minutes (715 commuters, 14.9%), and 20 to 24 minutes (630 commuters, 13.1%).
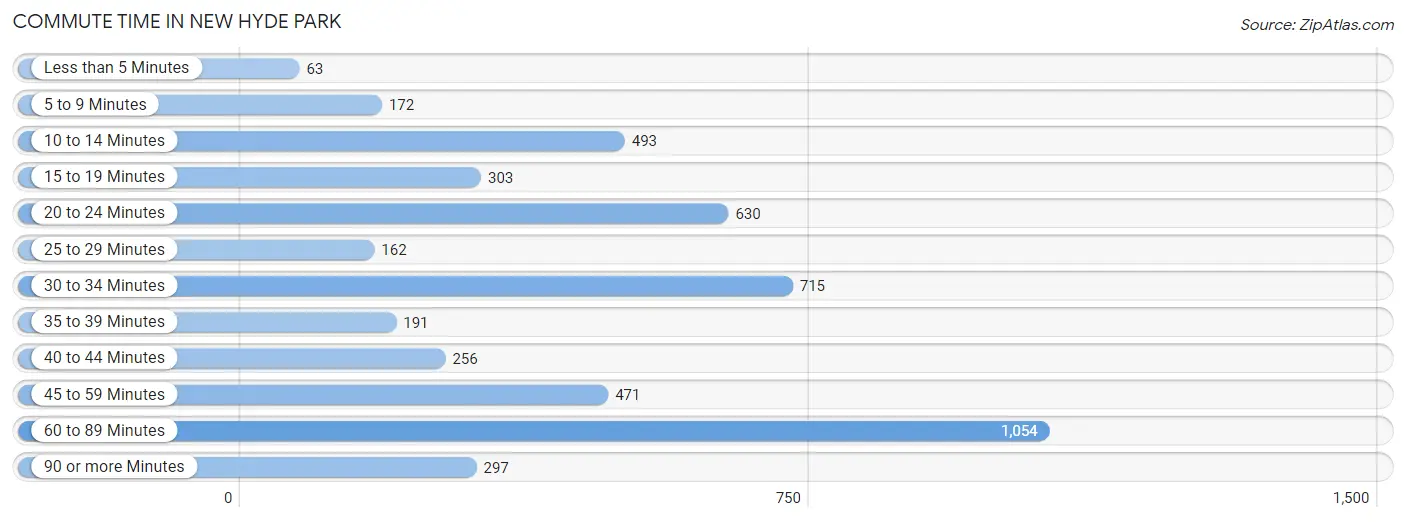
| Commute Time | # Commuters | % Commuters |
| Less than 5 Minutes | 63 | 1.3% |
| 5 to 9 Minutes | 172 | 3.6% |
| 10 to 14 Minutes | 493 | 10.3% |
| 15 to 19 Minutes | 303 | 6.3% |
| 20 to 24 Minutes | 630 | 13.1% |
| 25 to 29 Minutes | 162 | 3.4% |
| 30 to 34 Minutes | 715 | 14.9% |
| 35 to 39 Minutes | 191 | 4.0% |
| 40 to 44 Minutes | 256 | 5.3% |
| 45 to 59 Minutes | 471 | 9.8% |
| 60 to 89 Minutes | 1,054 | 21.9% |
| 90 or more Minutes | 297 | 6.2% |
Commute Time by Sex in New Hyde Park
The most common commute times in New Hyde Park are 60 to 89 minutes (645 commuters, 26.4%) for males and 60 to 89 minutes (409 commuters, 17.3%) for females.
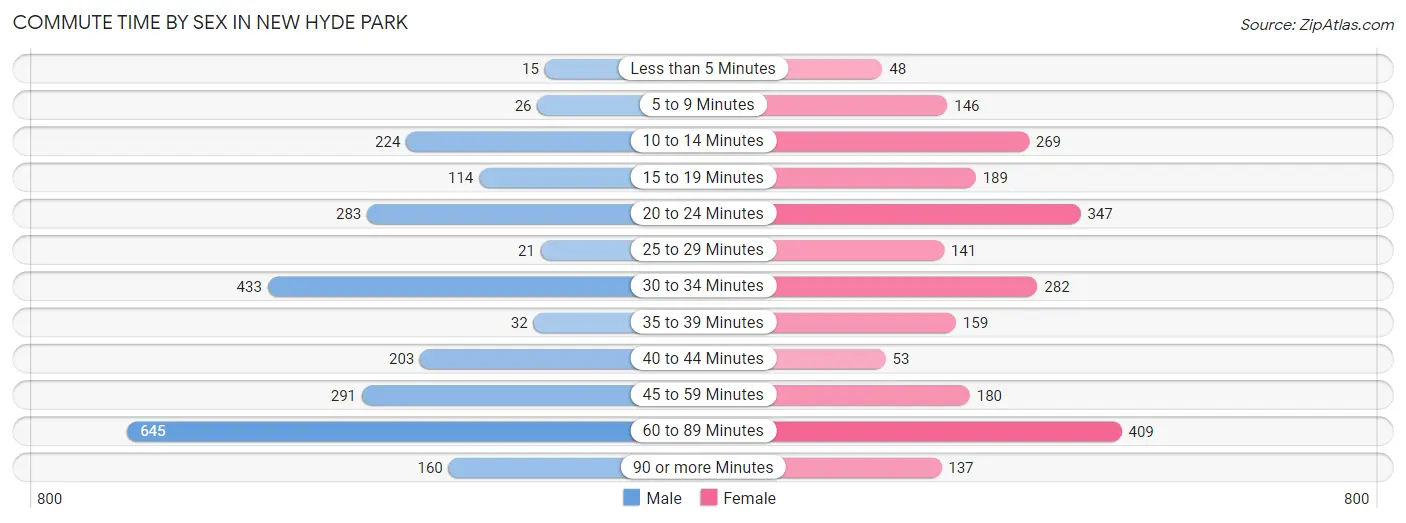
| Commute Time | Male | Female |
| Less than 5 Minutes | 15 (0.6%) | 48 (2.0%) |
| 5 to 9 Minutes | 26 (1.1%) | 146 (6.2%) |
| 10 to 14 Minutes | 224 (9.1%) | 269 (11.4%) |
| 15 to 19 Minutes | 114 (4.7%) | 189 (8.0%) |
| 20 to 24 Minutes | 283 (11.6%) | 347 (14.7%) |
| 25 to 29 Minutes | 21 (0.9%) | 141 (6.0%) |
| 30 to 34 Minutes | 433 (17.7%) | 282 (11.9%) |
| 35 to 39 Minutes | 32 (1.3%) | 159 (6.7%) |
| 40 to 44 Minutes | 203 (8.3%) | 53 (2.2%) |
| 45 to 59 Minutes | 291 (11.9%) | 180 (7.6%) |
| 60 to 89 Minutes | 645 (26.4%) | 409 (17.3%) |
| 90 or more Minutes | 160 (6.5%) | 137 (5.8%) |
Time of Departure to Work by Sex in New Hyde Park
The most frequent times of departure to work in New Hyde Park are 7:30 AM to 7:59 AM (410, 16.8%) for males and 7:30 AM to 7:59 AM (398, 16.9%) for females.
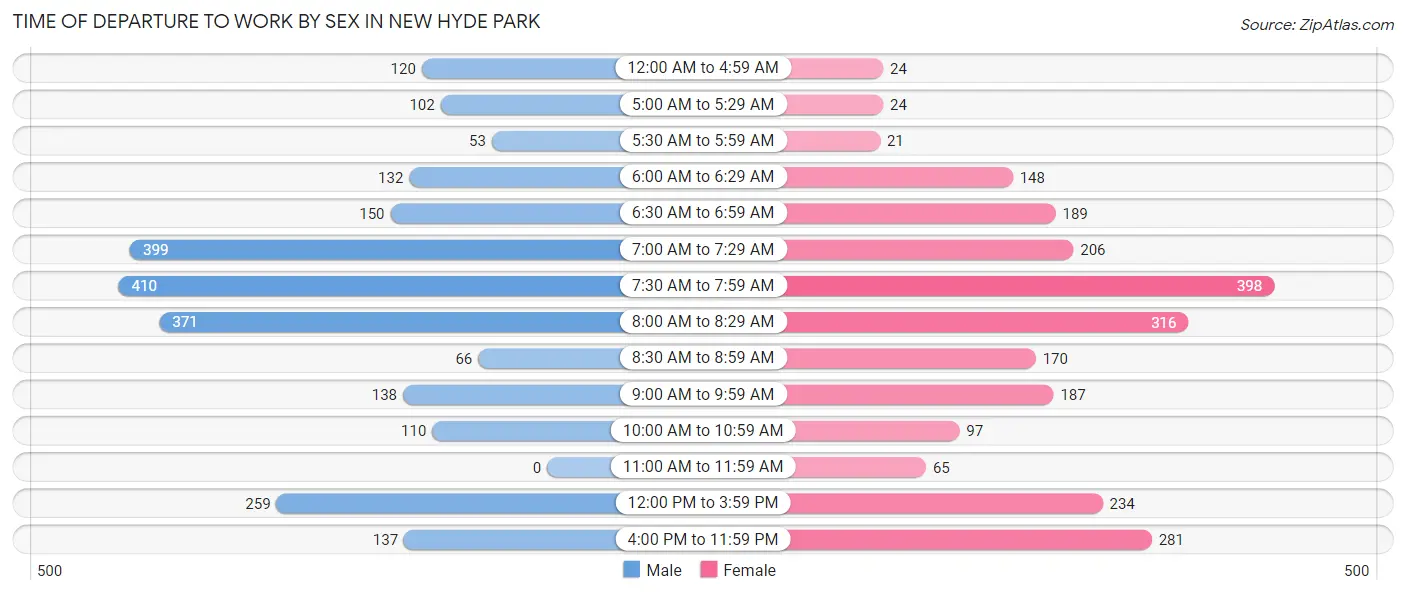
| Time of Departure | Male | Female |
| 12:00 AM to 4:59 AM | 120 (4.9%) | 24 (1.0%) |
| 5:00 AM to 5:29 AM | 102 (4.2%) | 24 (1.0%) |
| 5:30 AM to 5:59 AM | 53 (2.2%) | 21 (0.9%) |
| 6:00 AM to 6:29 AM | 132 (5.4%) | 148 (6.3%) |
| 6:30 AM to 6:59 AM | 150 (6.1%) | 189 (8.0%) |
| 7:00 AM to 7:29 AM | 399 (16.3%) | 206 (8.7%) |
| 7:30 AM to 7:59 AM | 410 (16.8%) | 398 (16.9%) |
| 8:00 AM to 8:29 AM | 371 (15.2%) | 316 (13.4%) |
| 8:30 AM to 8:59 AM | 66 (2.7%) | 170 (7.2%) |
| 9:00 AM to 9:59 AM | 138 (5.6%) | 187 (7.9%) |
| 10:00 AM to 10:59 AM | 110 (4.5%) | 97 (4.1%) |
| 11:00 AM to 11:59 AM | 0 (0.0%) | 65 (2.8%) |
| 12:00 PM to 3:59 PM | 259 (10.6%) | 234 (9.9%) |
| 4:00 PM to 11:59 PM | 137 (5.6%) | 281 (11.9%) |
| Total | 2,447 (100.0%) | 2,360 (100.0%) |
Housing Occupancy in New Hyde Park
Occupancy by Ownership in New Hyde Park
Of the total 3,290 dwellings in New Hyde Park, owner-occupied units account for 2,735 (83.1%), while renter-occupied units make up 555 (16.9%).
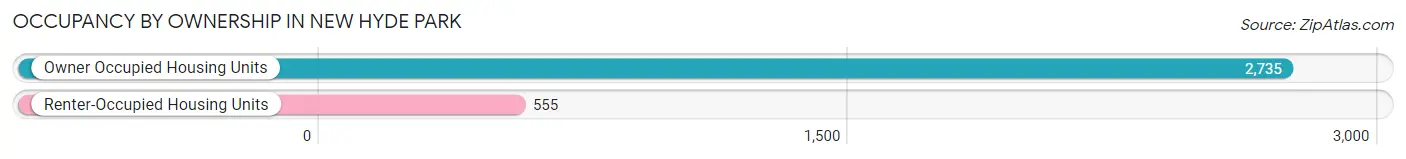
| Occupancy | # Housing Units | % Housing Units |
| Owner Occupied Housing Units | 2,735 | 83.1% |
| Renter-Occupied Housing Units | 555 | 16.9% |
| Total Occupied Housing Units | 3,290 | 100.0% |
Occupancy by Household Size in New Hyde Park
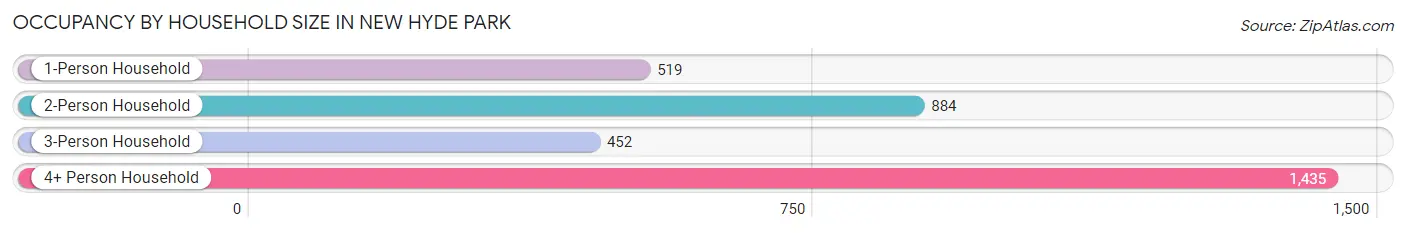
| Household Size | # Housing Units | % Housing Units |
| 1-Person Household | 519 | 15.8% |
| 2-Person Household | 884 | 26.9% |
| 3-Person Household | 452 | 13.7% |
| 4+ Person Household | 1,435 | 43.6% |
| Total Housing Units | 3,290 | 100.0% |
Occupancy by Ownership by Household Size in New Hyde Park
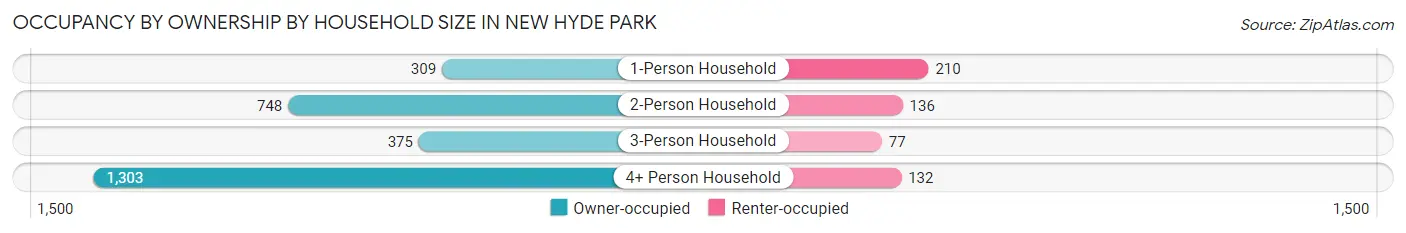
| Household Size | Owner-occupied | Renter-occupied |
| 1-Person Household | 309 (59.5%) | 210 (40.5%) |
| 2-Person Household | 748 (84.6%) | 136 (15.4%) |
| 3-Person Household | 375 (83.0%) | 77 (17.0%) |
| 4+ Person Household | 1,303 (90.8%) | 132 (9.2%) |
| Total Housing Units | 2,735 (83.1%) | 555 (16.9%) |
Occupancy by Educational Attainment in New Hyde Park
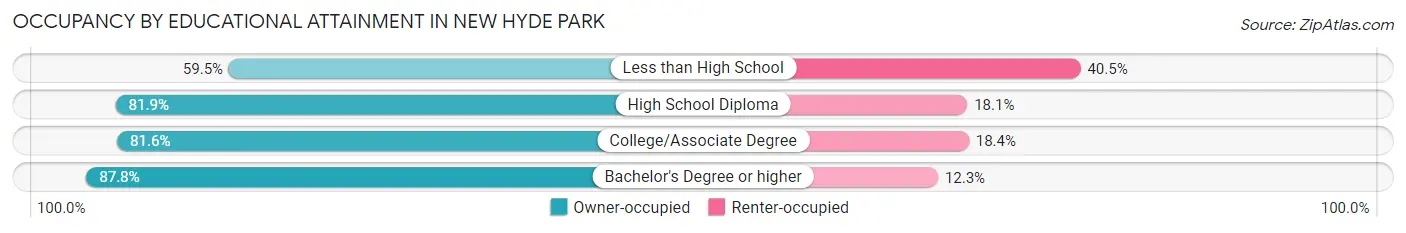
| Household Size | Owner-occupied | Renter-occupied |
| Less than High School | 141 (59.5%) | 96 (40.5%) |
| High School Diploma | 472 (81.9%) | 104 (18.1%) |
| College/Associate Degree | 689 (81.6%) | 155 (18.4%) |
| Bachelor's Degree or higher | 1,433 (87.7%) | 200 (12.2%) |
Occupancy by Age of Householder in New Hyde Park
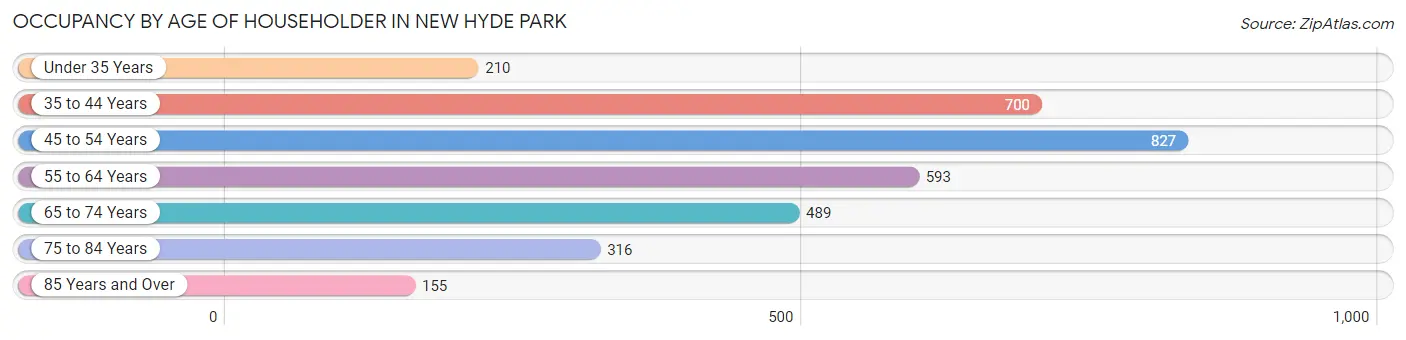
| Age Bracket | # Households | % Households |
| Under 35 Years | 210 | 6.4% |
| 35 to 44 Years | 700 | 21.3% |
| 45 to 54 Years | 827 | 25.1% |
| 55 to 64 Years | 593 | 18.0% |
| 65 to 74 Years | 489 | 14.9% |
| 75 to 84 Years | 316 | 9.6% |
| 85 Years and Over | 155 | 4.7% |
| Total | 3,290 | 100.0% |
Housing Finances in New Hyde Park
Median Income by Occupancy in New Hyde Park
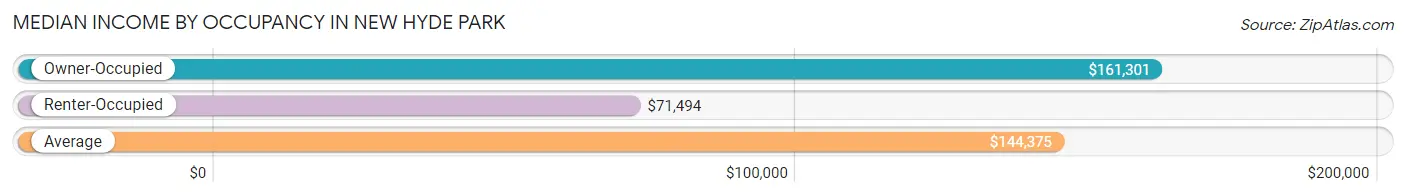
| Occupancy Type | # Households | Median Income |
| Owner-Occupied | 2,735 (83.1%) | $161,301 |
| Renter-Occupied | 555 (16.9%) | $71,494 |
| Average | 3,290 (100.0%) | $144,375 |
Occupancy by Householder Income Bracket in New Hyde Park
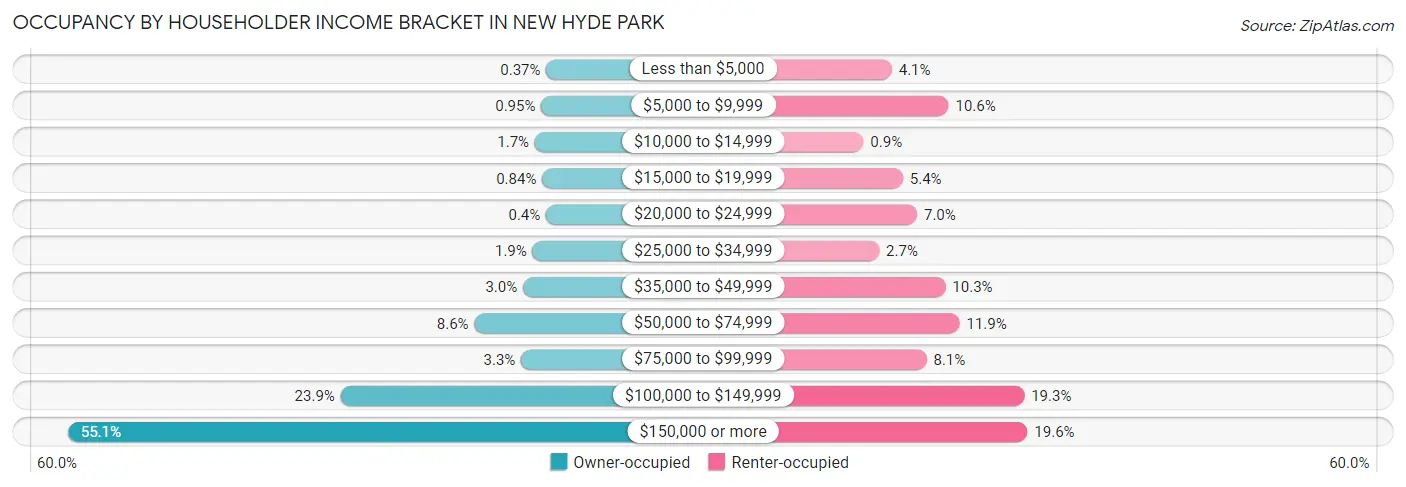
| Income Bracket | Owner-occupied | Renter-occupied |
| Less than $5,000 | 10 (0.4%) | 23 (4.1%) |
| $5,000 to $9,999 | 26 (0.9%) | 59 (10.6%) |
| $10,000 to $14,999 | 46 (1.7%) | 5 (0.9%) |
| $15,000 to $19,999 | 23 (0.8%) | 30 (5.4%) |
| $20,000 to $24,999 | 11 (0.4%) | 39 (7.0%) |
| $25,000 to $34,999 | 53 (1.9%) | 15 (2.7%) |
| $35,000 to $49,999 | 83 (3.0%) | 57 (10.3%) |
| $50,000 to $74,999 | 235 (8.6%) | 66 (11.9%) |
| $75,000 to $99,999 | 89 (3.3%) | 45 (8.1%) |
| $100,000 to $149,999 | 653 (23.9%) | 107 (19.3%) |
| $150,000 or more | 1,506 (55.1%) | 109 (19.6%) |
| Total | 2,735 (100.0%) | 555 (100.0%) |
Monthly Housing Cost Tiers in New Hyde Park
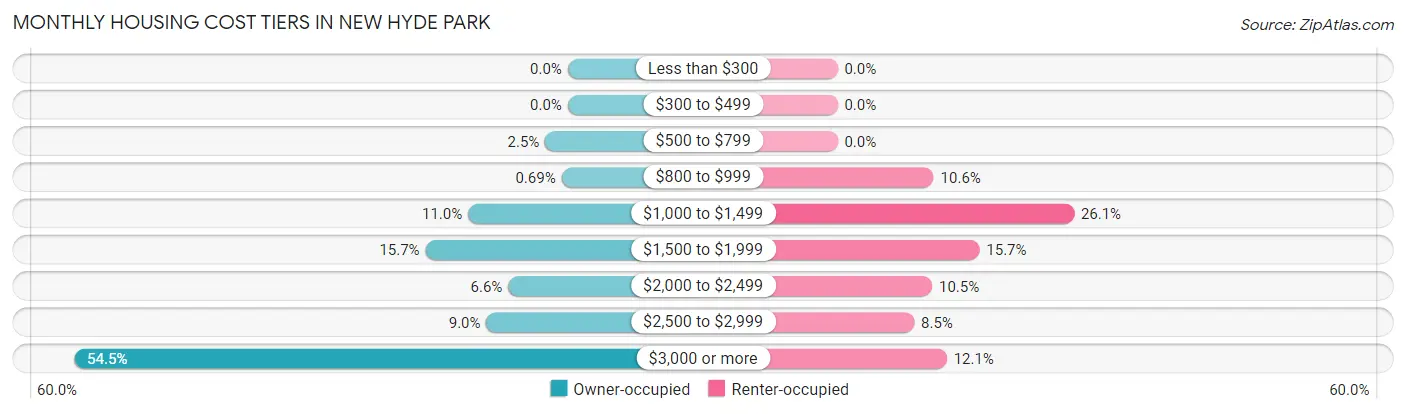
| Monthly Cost | Owner-occupied | Renter-occupied |
| Less than $300 | 0 (0.0%) | 0 (0.0%) |
| $300 to $499 | 0 (0.0%) | 0 (0.0%) |
| $500 to $799 | 68 (2.5%) | 0 (0.0%) |
| $800 to $999 | 19 (0.7%) | 59 (10.6%) |
| $1,000 to $1,499 | 301 (11.0%) | 145 (26.1%) |
| $1,500 to $1,999 | 430 (15.7%) | 87 (15.7%) |
| $2,000 to $2,499 | 180 (6.6%) | 58 (10.4%) |
| $2,500 to $2,999 | 246 (9.0%) | 47 (8.5%) |
| $3,000 or more | 1,491 (54.5%) | 67 (12.1%) |
| Total | 2,735 (100.0%) | 555 (100.0%) |
Physical Housing Characteristics in New Hyde Park
Housing Structures in New Hyde Park
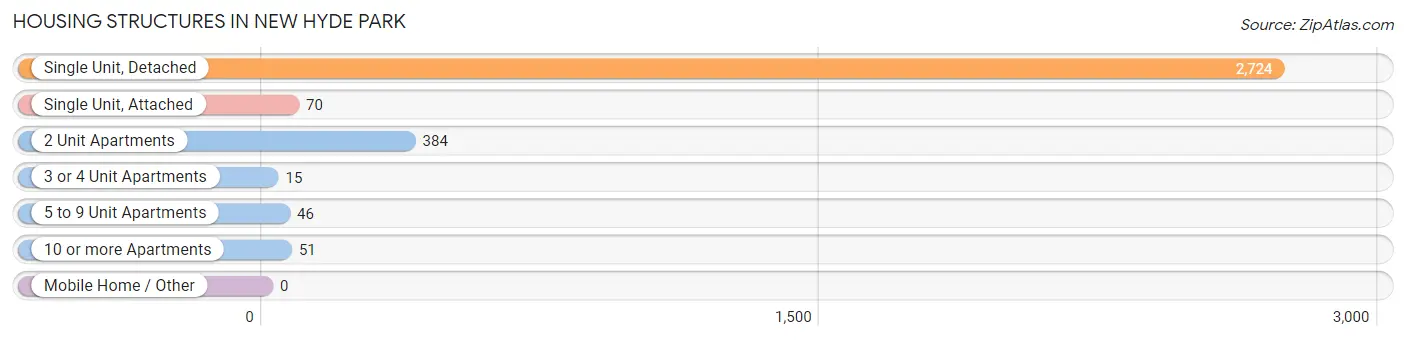
| Structure Type | # Housing Units | % Housing Units |
| Single Unit, Detached | 2,724 | 82.8% |
| Single Unit, Attached | 70 | 2.1% |
| 2 Unit Apartments | 384 | 11.7% |
| 3 or 4 Unit Apartments | 15 | 0.5% |
| 5 to 9 Unit Apartments | 46 | 1.4% |
| 10 or more Apartments | 51 | 1.5% |
| Mobile Home / Other | 0 | 0.0% |
| Total | 3,290 | 100.0% |
Housing Structures by Occupancy in New Hyde Park
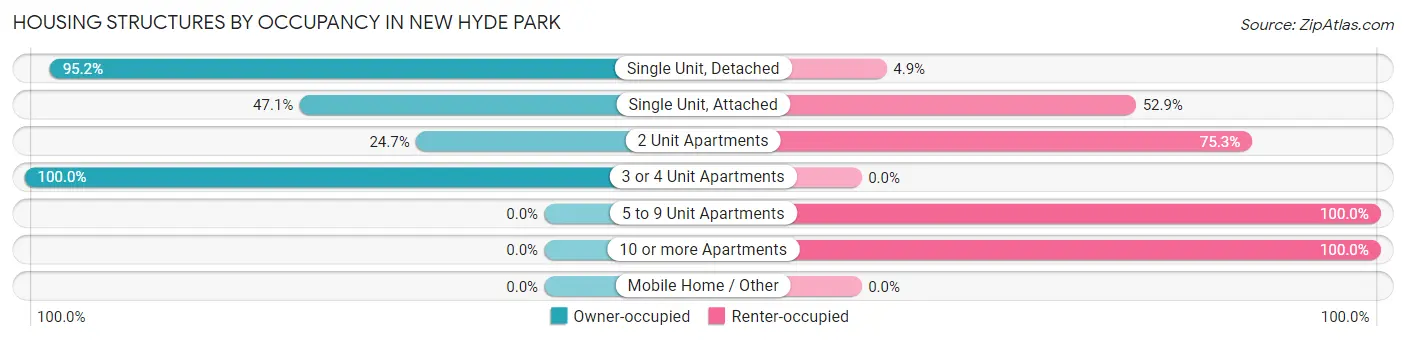
| Structure Type | Owner-occupied | Renter-occupied |
| Single Unit, Detached | 2,592 (95.2%) | 132 (4.9%) |
| Single Unit, Attached | 33 (47.1%) | 37 (52.9%) |
| 2 Unit Apartments | 95 (24.7%) | 289 (75.3%) |
| 3 or 4 Unit Apartments | 15 (100.0%) | 0 (0.0%) |
| 5 to 9 Unit Apartments | 0 (0.0%) | 46 (100.0%) |
| 10 or more Apartments | 0 (0.0%) | 51 (100.0%) |
| Mobile Home / Other | 0 (0.0%) | 0 (0.0%) |
| Total | 2,735 (83.1%) | 555 (16.9%) |
Housing Structures by Number of Rooms in New Hyde Park
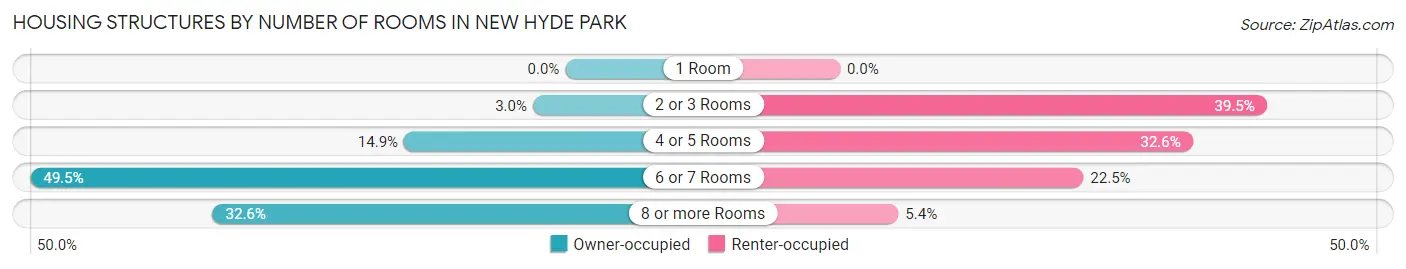
| Number of Rooms | Owner-occupied | Renter-occupied |
| 1 Room | 0 (0.0%) | 0 (0.0%) |
| 2 or 3 Rooms | 82 (3.0%) | 219 (39.5%) |
| 4 or 5 Rooms | 408 (14.9%) | 181 (32.6%) |
| 6 or 7 Rooms | 1,353 (49.5%) | 125 (22.5%) |
| 8 or more Rooms | 892 (32.6%) | 30 (5.4%) |
| Total | 2,735 (100.0%) | 555 (100.0%) |
Housing Structure by Heating Type in New Hyde Park
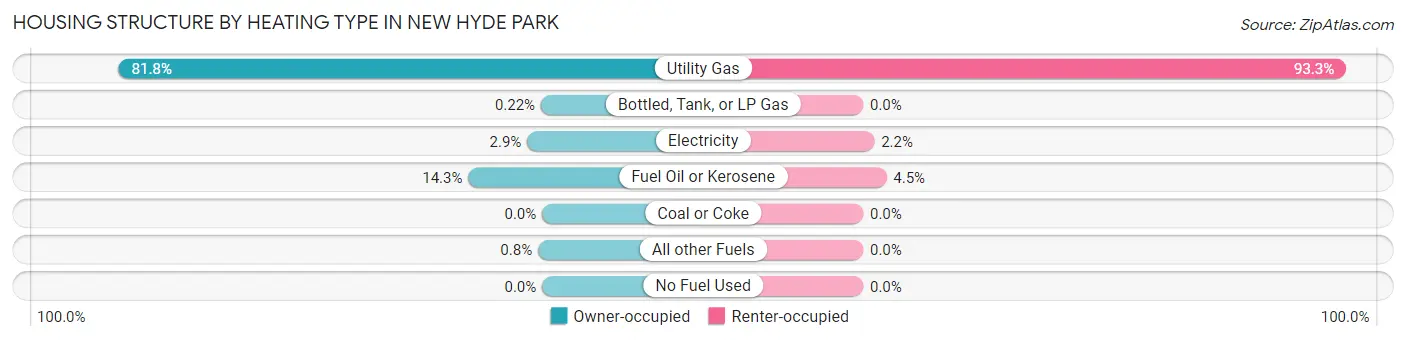
| Heating Type | Owner-occupied | Renter-occupied |
| Utility Gas | 2,238 (81.8%) | 518 (93.3%) |
| Bottled, Tank, or LP Gas | 6 (0.2%) | 0 (0.0%) |
| Electricity | 79 (2.9%) | 12 (2.2%) |
| Fuel Oil or Kerosene | 390 (14.3%) | 25 (4.5%) |
| Coal or Coke | 0 (0.0%) | 0 (0.0%) |
| All other Fuels | 22 (0.8%) | 0 (0.0%) |
| No Fuel Used | 0 (0.0%) | 0 (0.0%) |
| Total | 2,735 (100.0%) | 555 (100.0%) |
Household Vehicle Usage in New Hyde Park
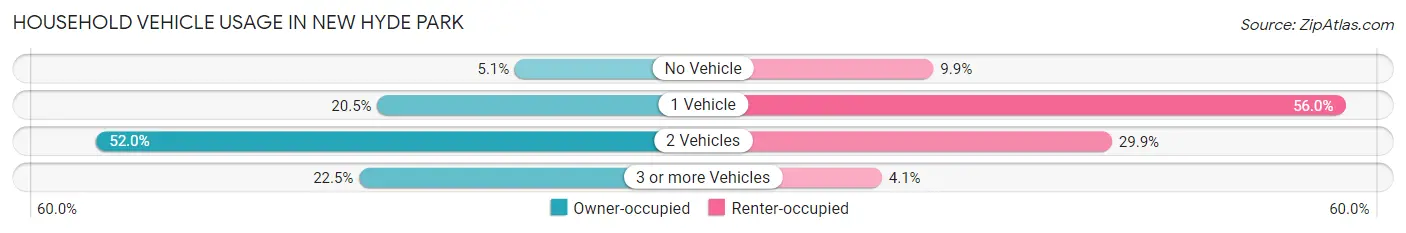
| Vehicles per Household | Owner-occupied | Renter-occupied |
| No Vehicle | 138 (5.1%) | 55 (9.9%) |
| 1 Vehicle | 560 (20.5%) | 311 (56.0%) |
| 2 Vehicles | 1,421 (52.0%) | 166 (29.9%) |
| 3 or more Vehicles | 616 (22.5%) | 23 (4.1%) |
| Total | 2,735 (100.0%) | 555 (100.0%) |
Real Estate & Mortgages in New Hyde Park
Real Estate and Mortgage Overview in New Hyde Park
| Characteristic | Without Mortgage | With Mortgage |
| Housing Units | 861 | 1,874 |
| Median Property Value | $658,400 | $713,100 |
| Median Household Income | $118,494 | $1,224 |
| Monthly Housing Costs | $1,501 | $1,491 |
| Real Estate Taxes | $10,001 | $9 |
Property Value by Mortgage Status in New Hyde Park
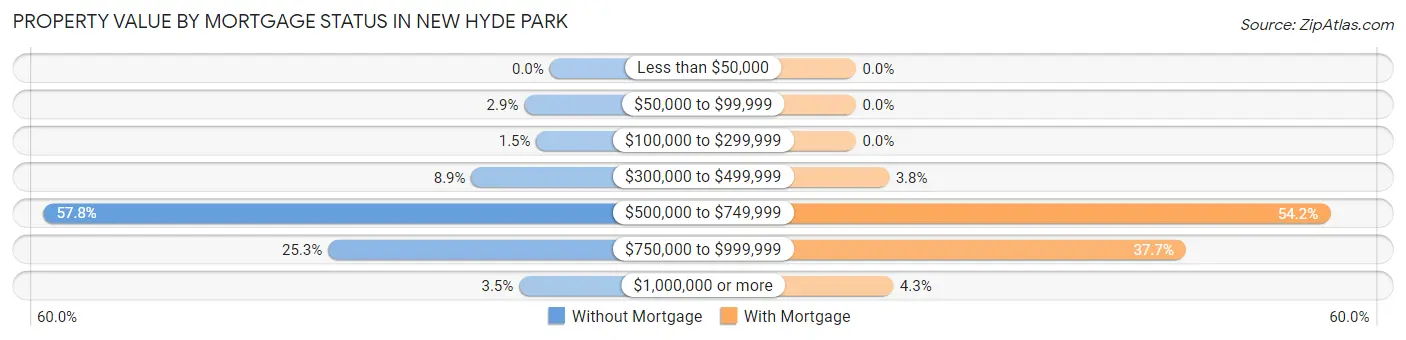
| Property Value | Without Mortgage | With Mortgage |
| Less than $50,000 | 0 (0.0%) | 0 (0.0%) |
| $50,000 to $99,999 | 25 (2.9%) | 0 (0.0%) |
| $100,000 to $299,999 | 13 (1.5%) | 0 (0.0%) |
| $300,000 to $499,999 | 77 (8.9%) | 71 (3.8%) |
| $500,000 to $749,999 | 498 (57.8%) | 1,016 (54.2%) |
| $750,000 to $999,999 | 218 (25.3%) | 707 (37.7%) |
| $1,000,000 or more | 30 (3.5%) | 80 (4.3%) |
| Total | 861 (100.0%) | 1,874 (100.0%) |
Household Income by Mortgage Status in New Hyde Park
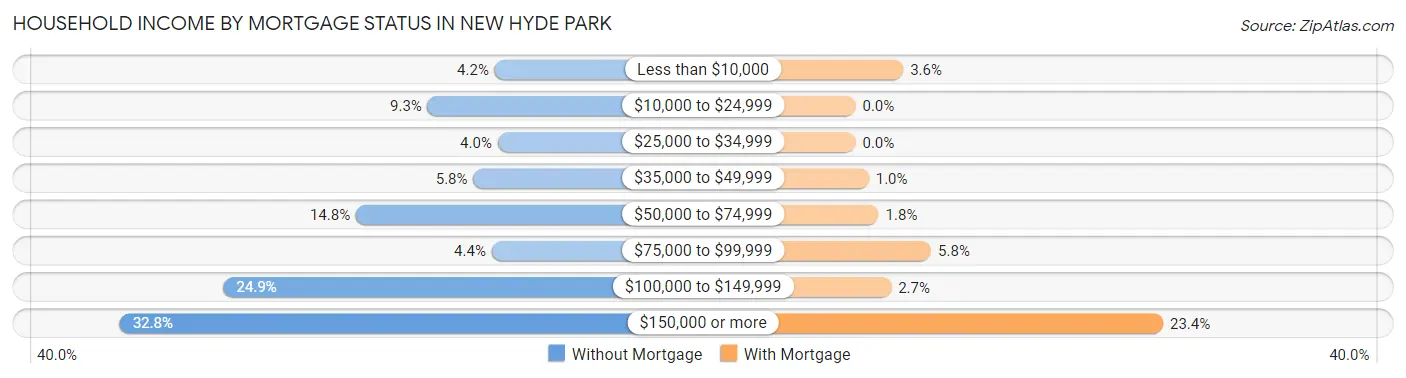
| Household Income | Without Mortgage | With Mortgage |
| Less than $10,000 | 36 (4.2%) | 68 (3.6%) |
| $10,000 to $24,999 | 80 (9.3%) | 0 (0.0%) |
| $25,000 to $34,999 | 34 (4.0%) | 0 (0.0%) |
| $35,000 to $49,999 | 50 (5.8%) | 19 (1.0%) |
| $50,000 to $74,999 | 127 (14.7%) | 33 (1.8%) |
| $75,000 to $99,999 | 38 (4.4%) | 108 (5.8%) |
| $100,000 to $149,999 | 214 (24.8%) | 51 (2.7%) |
| $150,000 or more | 282 (32.8%) | 439 (23.4%) |
| Total | 861 (100.0%) | 1,874 (100.0%) |
Property Value to Household Income Ratio in New Hyde Park
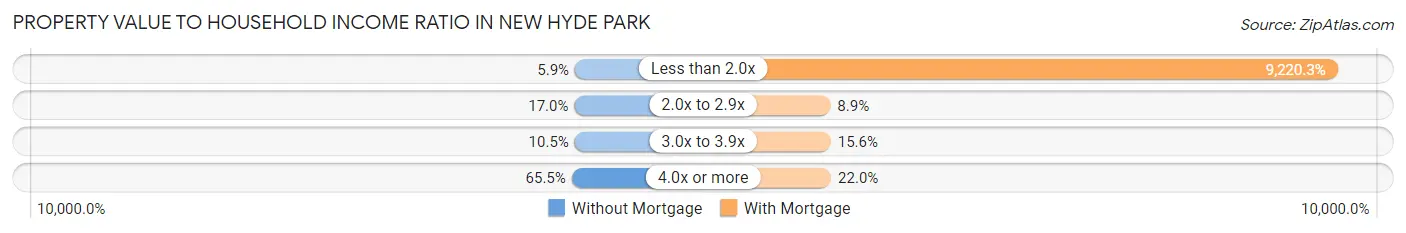
| Value-to-Income Ratio | Without Mortgage | With Mortgage |
| Less than 2.0x | 51 (5.9%) | 172,788 (9,220.3%) |
| 2.0x to 2.9x | 146 (17.0%) | 167 (8.9%) |
| 3.0x to 3.9x | 90 (10.4%) | 293 (15.6%) |
| 4.0x or more | 564 (65.5%) | 413 (22.0%) |
| Total | 861 (100.0%) | 1,874 (100.0%) |
Real Estate Taxes by Mortgage Status in New Hyde Park
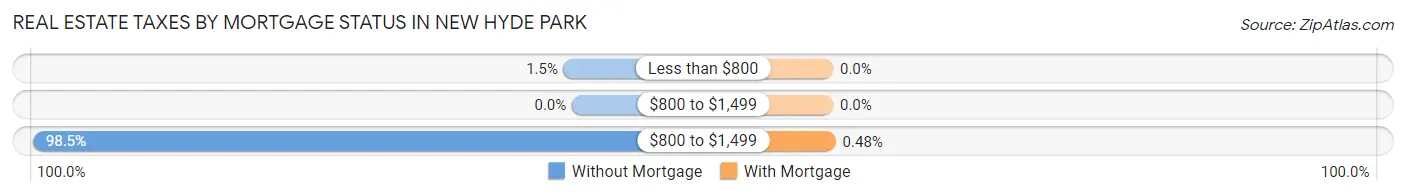
| Property Taxes | Without Mortgage | With Mortgage |
| Less than $800 | 13 (1.5%) | 0 (0.0%) |
| $800 to $1,499 | 0 (0.0%) | 0 (0.0%) |
| $800 to $1,499 | 848 (98.5%) | 9 (0.5%) |
| Total | 861 (100.0%) | 1,874 (100.0%) |
Health & Disability in New Hyde Park
Health Insurance Coverage by Age in New Hyde Park
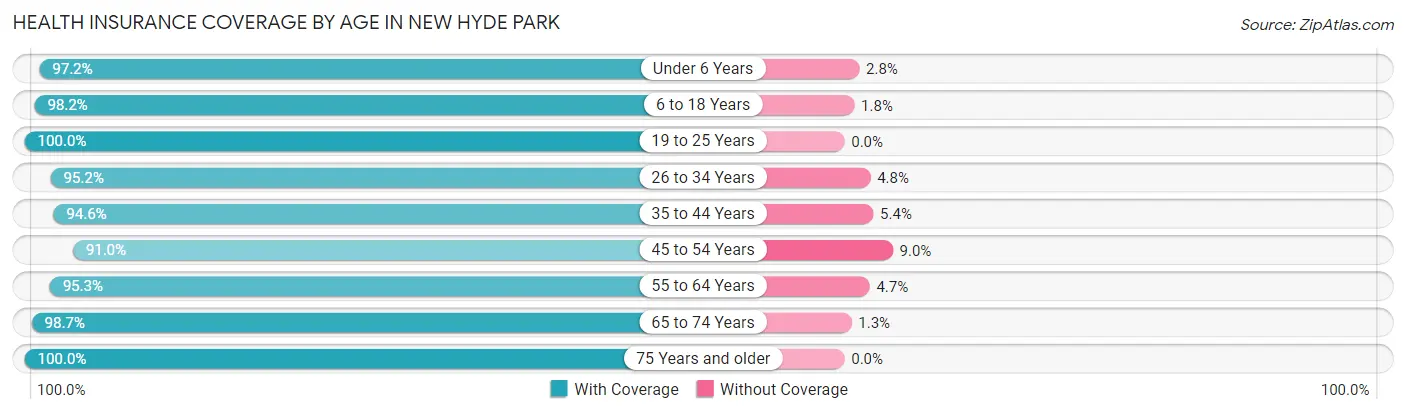
| Age Bracket | With Coverage | Without Coverage |
| Under 6 Years | 633 (97.2%) | 18 (2.8%) |
| 6 to 18 Years | 1,441 (98.2%) | 27 (1.8%) |
| 19 to 25 Years | 1,056 (100.0%) | 0 (0.0%) |
| 26 to 34 Years | 807 (95.2%) | 41 (4.8%) |
| 35 to 44 Years | 1,478 (94.6%) | 84 (5.4%) |
| 45 to 54 Years | 1,345 (91.0%) | 133 (9.0%) |
| 55 to 64 Years | 1,198 (95.3%) | 59 (4.7%) |
| 65 to 74 Years | 1,051 (98.7%) | 14 (1.3%) |
| 75 Years and older | 850 (100.0%) | 0 (0.0%) |
| Total | 9,859 (96.3%) | 376 (3.7%) |
Health Insurance Coverage by Citizenship Status in New Hyde Park
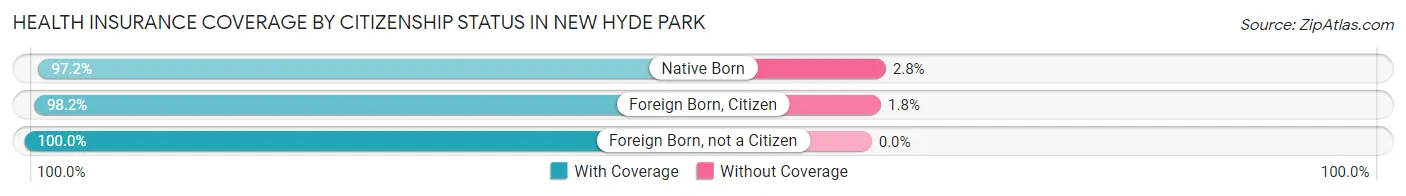
| Citizenship Status | With Coverage | Without Coverage |
| Native Born | 633 (97.2%) | 18 (2.8%) |
| Foreign Born, Citizen | 1,441 (98.2%) | 27 (1.8%) |
| Foreign Born, not a Citizen | 1,056 (100.0%) | 0 (0.0%) |
Health Insurance Coverage by Household Income in New Hyde Park
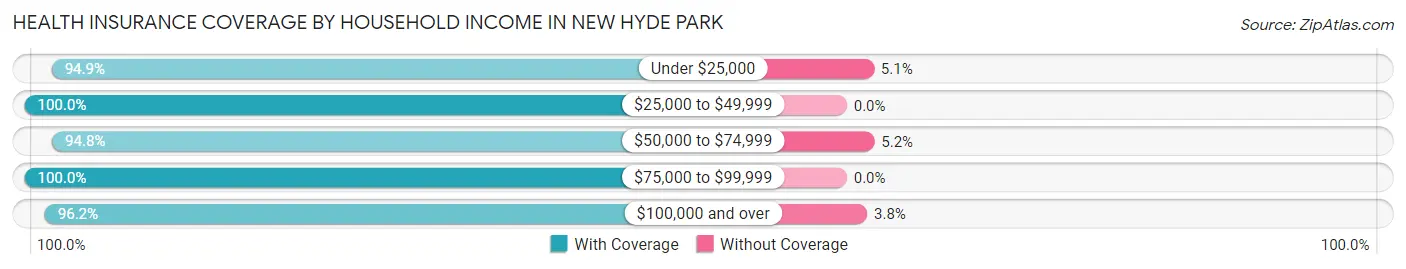
| Household Income | With Coverage | Without Coverage |
| Under $25,000 | 411 (94.9%) | 22 (5.1%) |
| $25,000 to $49,999 | 425 (100.0%) | 0 (0.0%) |
| $50,000 to $74,999 | 532 (94.8%) | 29 (5.2%) |
| $75,000 to $99,999 | 246 (100.0%) | 0 (0.0%) |
| $100,000 and over | 8,235 (96.2%) | 325 (3.8%) |
Public vs Private Health Insurance Coverage by Age in New Hyde Park
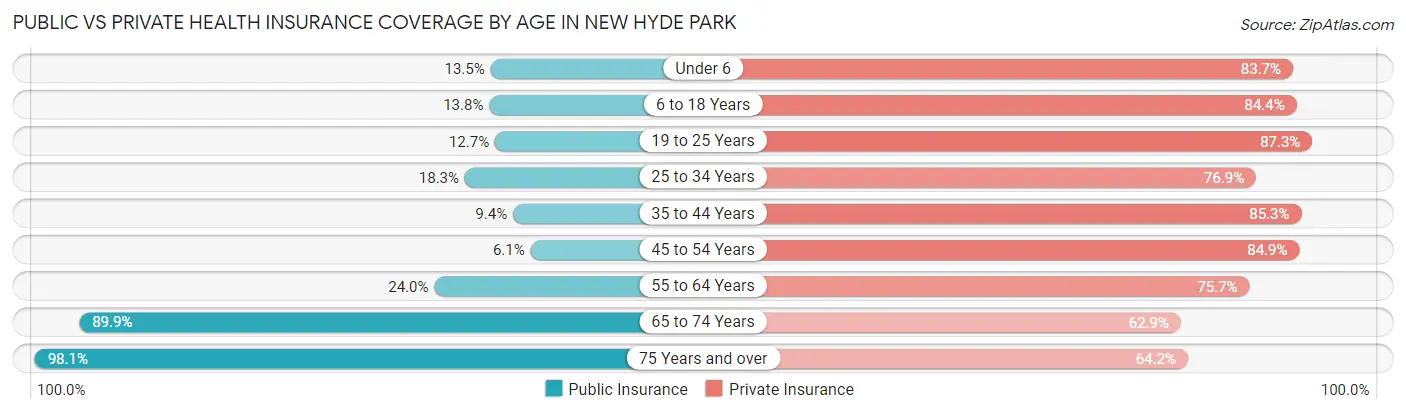
| Age Bracket | Public Insurance | Private Insurance |
| Under 6 | 88 (13.5%) | 545 (83.7%) |
| 6 to 18 Years | 202 (13.8%) | 1,239 (84.4%) |
| 19 to 25 Years | 134 (12.7%) | 922 (87.3%) |
| 25 to 34 Years | 155 (18.3%) | 652 (76.9%) |
| 35 to 44 Years | 146 (9.3%) | 1,332 (85.3%) |
| 45 to 54 Years | 90 (6.1%) | 1,255 (84.9%) |
| 55 to 64 Years | 301 (23.9%) | 951 (75.7%) |
| 65 to 74 Years | 957 (89.9%) | 670 (62.9%) |
| 75 Years and over | 834 (98.1%) | 546 (64.2%) |
| Total | 2,907 (28.4%) | 8,112 (79.3%) |
Disability Status by Sex by Age in New Hyde Park
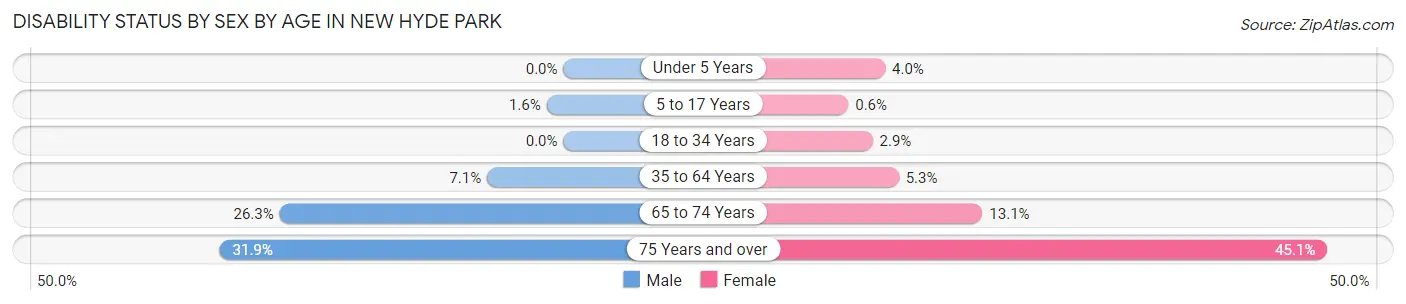
| Age Bracket | Male | Female |
| Under 5 Years | 0 (0.0%) | 9 (4.0%) |
| 5 to 17 Years | 13 (1.6%) | 4 (0.6%) |
| 18 to 34 Years | 0 (0.0%) | 30 (2.9%) |
| 35 to 64 Years | 166 (7.1%) | 103 (5.3%) |
| 65 to 74 Years | 113 (26.3%) | 83 (13.1%) |
| 75 Years and over | 126 (31.9%) | 205 (45.1%) |
Disability Class by Sex by Age in New Hyde Park
Disability Class: Hearing Difficulty
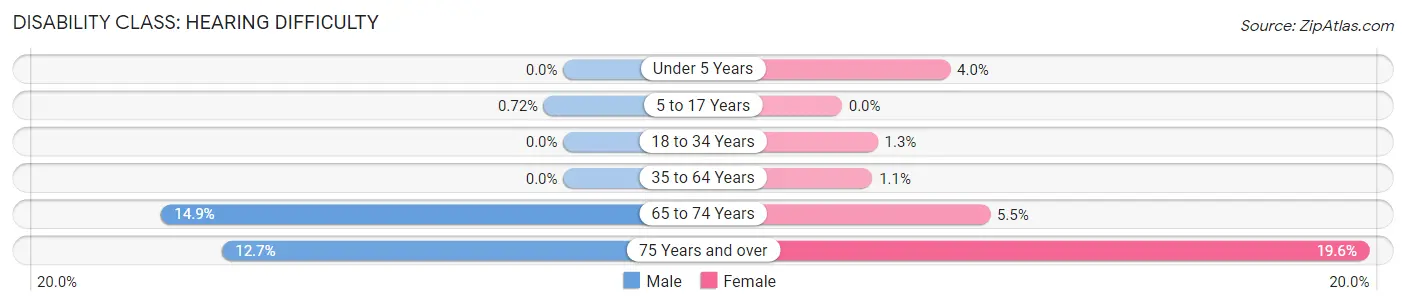
| Age Bracket | Male | Female |
| Under 5 Years | 0 (0.0%) | 9 (4.0%) |
| 5 to 17 Years | 6 (0.7%) | 0 (0.0%) |
| 18 to 34 Years | 0 (0.0%) | 14 (1.3%) |
| 35 to 64 Years | 0 (0.0%) | 22 (1.1%) |
| 65 to 74 Years | 64 (14.9%) | 35 (5.5%) |
| 75 Years and over | 50 (12.7%) | 89 (19.6%) |
Disability Class: Vision Difficulty
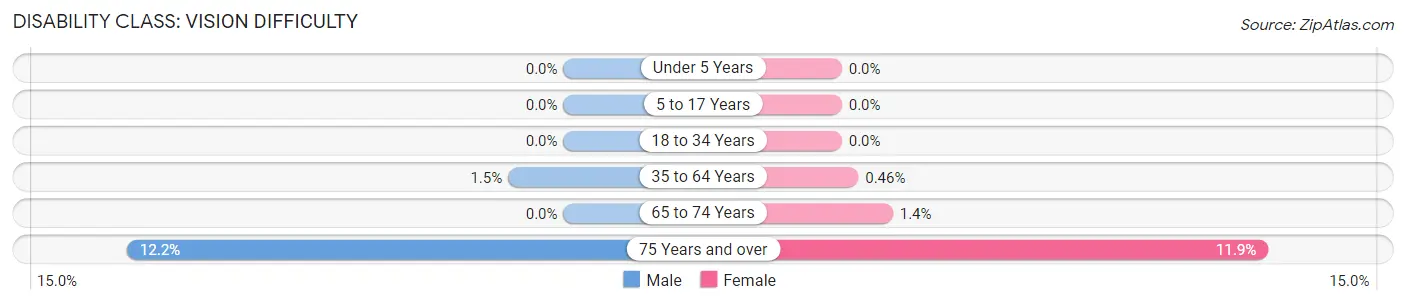
| Age Bracket | Male | Female |
| Under 5 Years | 0 (0.0%) | 0 (0.0%) |
| 5 to 17 Years | 0 (0.0%) | 0 (0.0%) |
| 18 to 34 Years | 0 (0.0%) | 0 (0.0%) |
| 35 to 64 Years | 36 (1.5%) | 9 (0.5%) |
| 65 to 74 Years | 0 (0.0%) | 9 (1.4%) |
| 75 Years and over | 48 (12.1%) | 54 (11.9%) |
Disability Class: Cognitive Difficulty
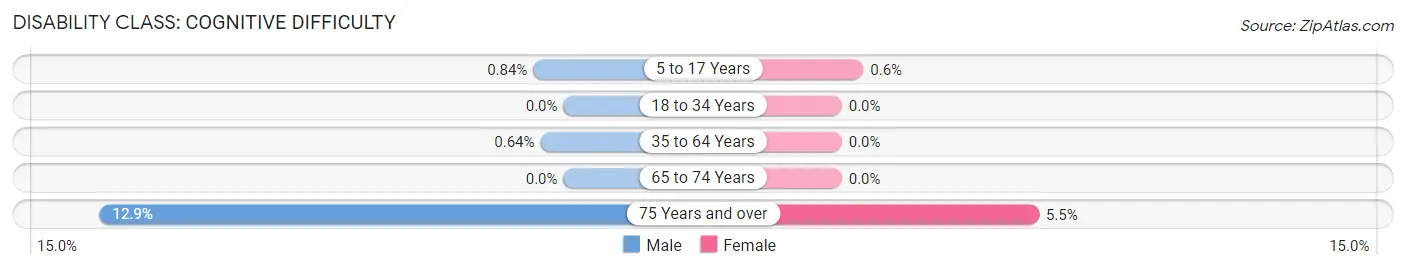
| Age Bracket | Male | Female |
| 5 to 17 Years | 7 (0.8%) | 4 (0.6%) |
| 18 to 34 Years | 0 (0.0%) | 0 (0.0%) |
| 35 to 64 Years | 15 (0.6%) | 0 (0.0%) |
| 65 to 74 Years | 0 (0.0%) | 0 (0.0%) |
| 75 Years and over | 51 (12.9%) | 25 (5.5%) |
Disability Class: Ambulatory Difficulty
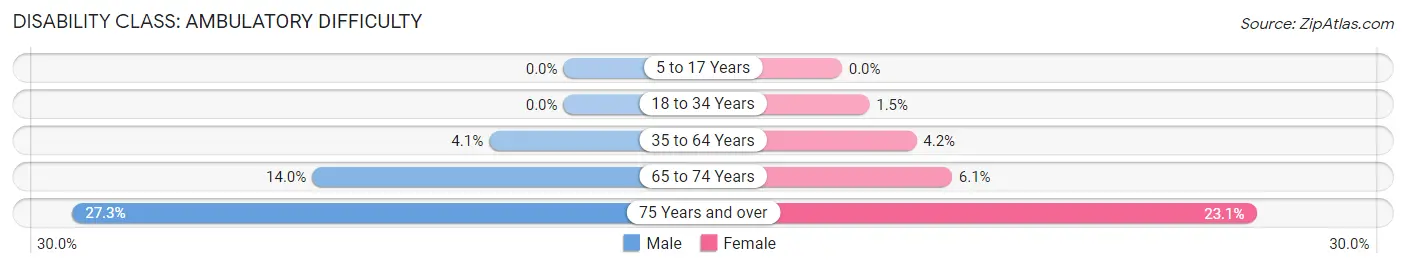
| Age Bracket | Male | Female |
| 5 to 17 Years | 0 (0.0%) | 0 (0.0%) |
| 18 to 34 Years | 0 (0.0%) | 16 (1.5%) |
| 35 to 64 Years | 97 (4.1%) | 81 (4.2%) |
| 65 to 74 Years | 60 (14.0%) | 39 (6.1%) |
| 75 Years and over | 108 (27.3%) | 105 (23.1%) |
Disability Class: Self-Care Difficulty
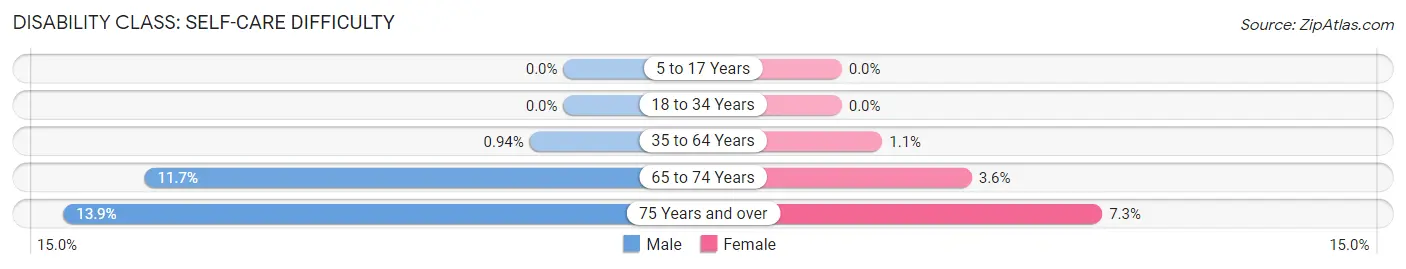
| Age Bracket | Male | Female |
| 5 to 17 Years | 0 (0.0%) | 0 (0.0%) |
| 18 to 34 Years | 0 (0.0%) | 0 (0.0%) |
| 35 to 64 Years | 22 (0.9%) | 22 (1.1%) |
| 65 to 74 Years | 50 (11.7%) | 23 (3.6%) |
| 75 Years and over | 55 (13.9%) | 33 (7.2%) |
Technology Access in New Hyde Park
Computing Device Access in New Hyde Park
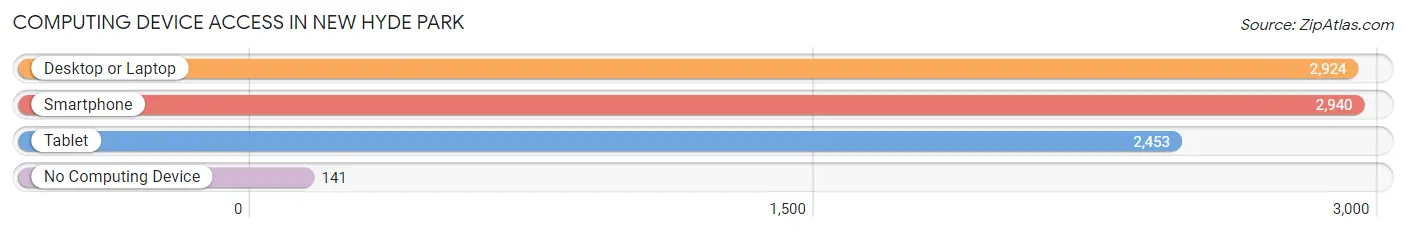
| Device Type | # Households | % Households |
| Desktop or Laptop | 2,924 | 88.9% |
| Smartphone | 2,940 | 89.4% |
| Tablet | 2,453 | 74.6% |
| No Computing Device | 141 | 4.3% |
| Total | 3,290 | 100.0% |
Internet Access in New Hyde Park
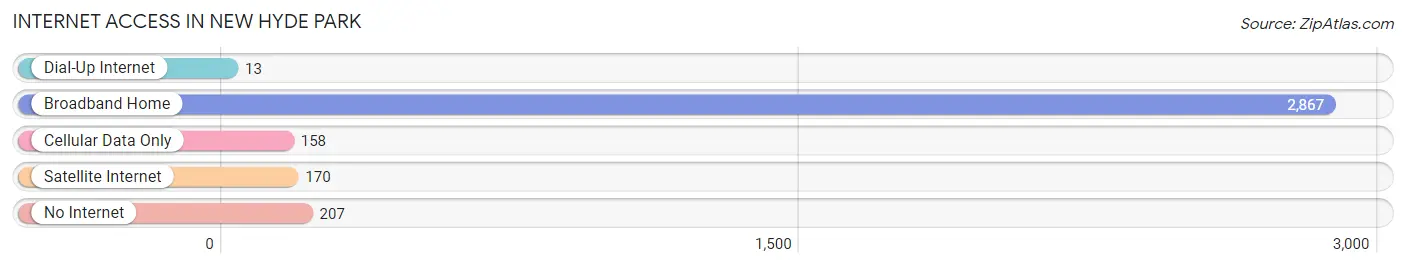
| Internet Type | # Households | % Households |
| Dial-Up Internet | 13 | 0.4% |
| Broadband Home | 2,867 | 87.1% |
| Cellular Data Only | 158 | 4.8% |
| Satellite Internet | 170 | 5.2% |
| No Internet | 207 | 6.3% |
| Total | 3,290 | 100.0% |
New Hyde Park Summary
New Hyde Park is a hamlet and census-designated place (CDP) located in the Town of North Hempstead in Nassau County, New York, United States. The population was 9,712 at the 2010 census.
History
New Hyde Park was originally part of the Hempstead Plains, a large area of flat, treeless land that stretched from the present-day Queens-Nassau border to the present-day Nassau-Suffolk border. The area was first settled by Europeans in the 1640s, and the hamlet of New Hyde Park was established in the late 19th century.
The hamlet was named after the Hyde family, who were among the first settlers in the area. The family owned a large tract of land that stretched from the present-day Queens-Nassau border to the present-day Nassau-Suffolk border. The family also owned a large farm, which was located near the present-day intersection of Jericho Turnpike and New Hyde Park Road.
In the late 19th century, the area began to develop rapidly. The Long Island Rail Road opened a station in the area in 1869, and the hamlet was officially incorporated in 1871. The hamlet continued to grow throughout the 20th century, and by the 1950s, it had become a bustling suburban community.
Geography
New Hyde Park is located at 40°43'17" North, 73°41'17" West (40.7214, -73.6881). According to the United States Census Bureau, the CDP has a total area of 2.3 square miles (6.0 km2), all of it land.
Economy
New Hyde Park is a primarily residential community, but it does have a few businesses. The most prominent business in the area is the New Hyde Park Inn, a hotel and conference center located on Jericho Turnpike. The inn is a popular destination for weddings and other special events.
The hamlet also has a few retail stores, including a grocery store, a pharmacy, and a few restaurants. There are also a few professional offices, including doctors, lawyers, and accountants.
Demographics
As of the 2010 census, there were 9,712 people, 3,717 households, and 2,717 families residing in the CDP. The population density was 4,213.3 people per square mile (1,619.7/km2). There were 3,919 housing units at an average density of 1,689.3 per square mile (651.3/km2). The racial makeup of the CDP was 79.2% White, 4.2% African American, 0.2% Native American, 11.2% Asian, 0.1% Pacific Islander, 3.2% from other races, and 2.1% from two or more races. Hispanic or Latino of any race were 8.7% of the population.
There were 3,717 households, out of which 33.2% had children under the age of 18 living with them, 57.2% were married couples living together, 10.7% had a female householder with no husband present, and 27.3% were non-families. 22.2% of all households were made up of individuals, and 10.2% had someone living alone who was 65 years of age or older. The average household size was 2.60 and the average family size was 3.08.
In the CDP, the population was spread out, with 22.7% under the age of 18, 6.2% from 18 to 24, 28.2% from 25 to 44, 25.7% from 45 to 64, and 17.2% who were 65 years of age or older. The median age was 40 years. For every 100 females, there were 93.2 males. For every 100 females age 18 and over, there were 90.2 males.
The median income for a household in the CDP was $76,945, and the median income for a family was $87,945. Males had a median income of $60,000 versus $41,250 for females. The per capita income for the CDP was $33,945. About 2.7% of families and 3.7% of the population were below the poverty line, including 4.2% of those under age 18 and 4.2% of those age 65 or over.
Common Questions
What is Per Capita Income in New Hyde Park?
Per Capita income in New Hyde Park is $60,050.
What is the Median Family Income in New Hyde Park?
Median Family Income in New Hyde Park is $160,435.
What is the Median Household income in New Hyde Park?
Median Household Income in New Hyde Park is $144,375.
What is Income or Wage Gap in New Hyde Park?
Income or Wage Gap in New Hyde Park is 39.0%.
Women in New Hyde Park earn 61.0 cents for every dollar earned by a man.
What is Inequality or Gini Index in New Hyde Park?
Inequality or Gini Index in New Hyde Park is 0.43.
What is the Total Population of New Hyde Park?
Total Population of New Hyde Park is 10,235.
What is the Total Male Population of New Hyde Park?
Total Male Population of New Hyde Park is 5,254.
What is the Total Female Population of New Hyde Park?
Total Female Population of New Hyde Park is 4,981.
What is the Ratio of Males per 100 Females in New Hyde Park?
There are 105.48 Males per 100 Females in New Hyde Park.
What is the Ratio of Females per 100 Males in New Hyde Park?
There are 94.80 Females per 100 Males in New Hyde Park.
What is the Median Population Age in New Hyde Park?
Median Population Age in New Hyde Park is 41.7 Years.
What is the Average Family Size in New Hyde Park
Average Family Size in New Hyde Park is 3.5 People.
What is the Average Household Size in New Hyde Park
Average Household Size in New Hyde Park is 3.1 People.
How Large is the Labor Force in New Hyde Park?
There are 5,857 People in the Labor Forcein in New Hyde Park.
What is the Percentage of People in the Labor Force in New Hyde Park?
68.7% of People are in the Labor Force in New Hyde Park.
What is the Unemployment Rate in New Hyde Park?
Unemployment Rate in New Hyde Park is 4.3%.