Noyack, NY Map & Demographics
Noyack Map
Noyack Overview
$69,664
PER CAPITA INCOME
$101,653
AVG FAMILY INCOME
$100,222
AVG HOUSEHOLD INCOME
48.6%
WAGE / INCOME GAP [ % ]
51.4¢/ $1
WAGE / INCOME GAP [ $ ]
0.54
INEQUALITY / GINI INDEX
4,797
TOTAL POPULATION
2,217
MALE POPULATION
2,580
FEMALE POPULATION
85.93
MALES / 100 FEMALES
116.37
FEMALES / 100 MALES
46.0
MEDIAN AGE
2.8
AVG FAMILY SIZE
2.4
AVG HOUSEHOLD SIZE
2,801
LABOR FORCE [ PEOPLE ]
71.1%
PERCENT IN LABOR FORCE
4.9%
UNEMPLOYMENT RATE
Income in Noyack
Income Overview in Noyack
Per Capita Income in Noyack is $69,664, while median incomes of families and households are $101,653 and $100,222 respectively.
| Characteristic | Number | Measure |
| Per Capita Income | 4,797 | $69,664 |
| Median Family Income | 1,436 | $101,653 |
| Mean Family Income | 1,436 | $185,820 |
| Median Household Income | 1,995 | $100,222 |
| Mean Household Income | 1,995 | $168,788 |
| Income Deficit | 1,436 | $0 |
| Wage / Income Gap (%) | 4,797 | 48.61% |
| Wage / Income Gap ($) | 4,797 | 51.39¢ per $1 |
| Gini / Inequality Index | 4,797 | 0.54 |
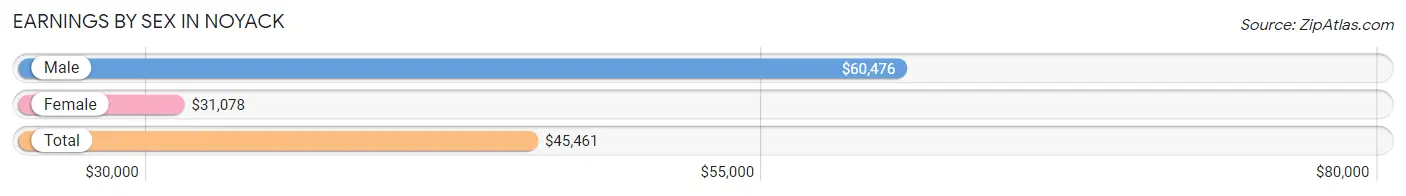
Earnings by Sex in Noyack
Average Earnings in Noyack are $45,461, $60,476 for men and $31,078 for women, a difference of 48.6%.
| Sex | Number | Average Earnings |
| Male | 1,538 (52.5%) | $60,476 |
| Female | 1,391 (47.5%) | $31,078 |
| Total | 2,929 (100.0%) | $45,461 |
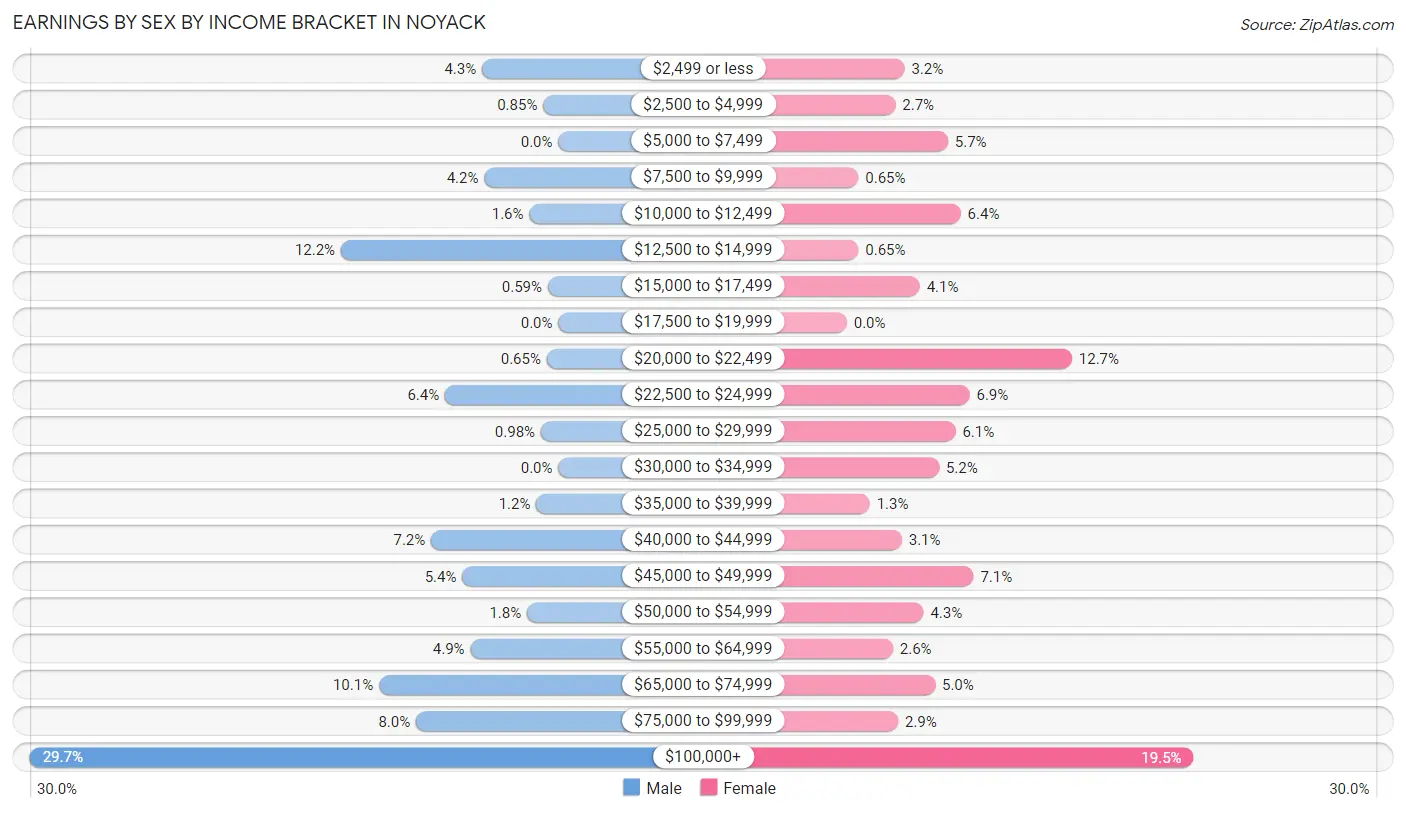
Earnings by Sex by Income Bracket in Noyack
The most common earnings brackets in Noyack are $100,000+ for men (457 | 29.7%) and $100,000+ for women (271 | 19.5%).
| Income | Male | Female |
| $2,499 or less | 66 (4.3%) | 45 (3.2%) |
| $2,500 to $4,999 | 13 (0.9%) | 38 (2.7%) |
| $5,000 to $7,499 | 0 (0.0%) | 79 (5.7%) |
| $7,500 to $9,999 | 64 (4.2%) | 9 (0.6%) |
| $10,000 to $12,499 | 25 (1.6%) | 89 (6.4%) |
| $12,500 to $14,999 | 188 (12.2%) | 9 (0.6%) |
| $15,000 to $17,499 | 9 (0.6%) | 57 (4.1%) |
| $17,500 to $19,999 | 0 (0.0%) | 0 (0.0%) |
| $20,000 to $22,499 | 10 (0.6%) | 176 (12.7%) |
| $22,500 to $24,999 | 98 (6.4%) | 96 (6.9%) |
| $25,000 to $29,999 | 15 (1.0%) | 85 (6.1%) |
| $30,000 to $34,999 | 0 (0.0%) | 72 (5.2%) |
| $35,000 to $39,999 | 19 (1.2%) | 18 (1.3%) |
| $40,000 to $44,999 | 110 (7.1%) | 43 (3.1%) |
| $45,000 to $49,999 | 83 (5.4%) | 99 (7.1%) |
| $50,000 to $54,999 | 27 (1.8%) | 60 (4.3%) |
| $55,000 to $64,999 | 76 (4.9%) | 36 (2.6%) |
| $65,000 to $74,999 | 155 (10.1%) | 69 (5.0%) |
| $75,000 to $99,999 | 123 (8.0%) | 40 (2.9%) |
| $100,000+ | 457 (29.7%) | 271 (19.5%) |
| Total | 1,538 (100.0%) | 1,391 (100.0%) |
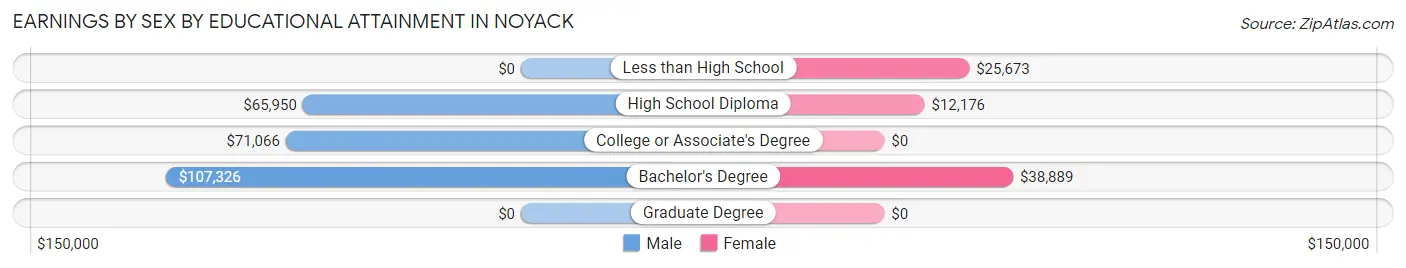
Earnings by Sex by Educational Attainment in Noyack
Average earnings in Noyack are $70,356 for men and $34,913 for women, a difference of 50.4%. Men with an educational attainment of bachelor's degree enjoy the highest average annual earnings of $107,326, while those with high school diploma education earn the least with $65,950. Women with an educational attainment of bachelor's degree earn the most with the average annual earnings of $38,889, while those with high school diploma education have the smallest earnings of $12,176.
| Educational Attainment | Male Income | Female Income |
| Less than High School | - | - |
| High School Diploma | $65,950 | $12,176 |
| College or Associate's Degree | $71,066 | $0 |
| Bachelor's Degree | $107,326 | $38,889 |
| Graduate Degree | - | - |
| Total | $70,356 | $34,913 |
Family Income in Noyack
Family Income Brackets in Noyack
According to the Noyack family income data, there are 358 families falling into the $100,000 to $149,999 income range, which is the most common income bracket and makes up 24.9% of all families.
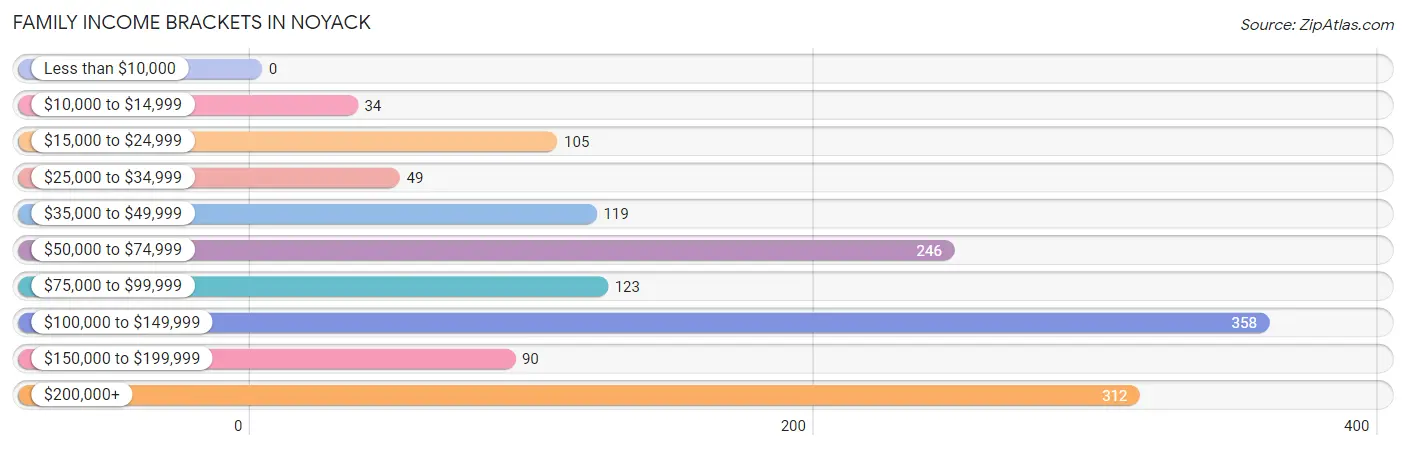
| Income Bracket | # Families | % Families |
| Less than $10,000 | 0 | 0.0% |
| $10,000 to $14,999 | 34 | 2.4% |
| $15,000 to $24,999 | 105 | 7.3% |
| $25,000 to $34,999 | 49 | 3.4% |
| $35,000 to $49,999 | 119 | 8.3% |
| $50,000 to $74,999 | 246 | 17.1% |
| $75,000 to $99,999 | 123 | 8.6% |
| $100,000 to $149,999 | 358 | 24.9% |
| $150,000 to $199,999 | 90 | 6.3% |
| $200,000+ | 312 | 21.7% |
Family Income by Famaliy Size in Noyack
4-person families (392 | 27.3%) account for the highest median family income in Noyack with $131,875 per family, while 2-person families (758 | 52.8%) have the highest median income of $49,044 per family member.
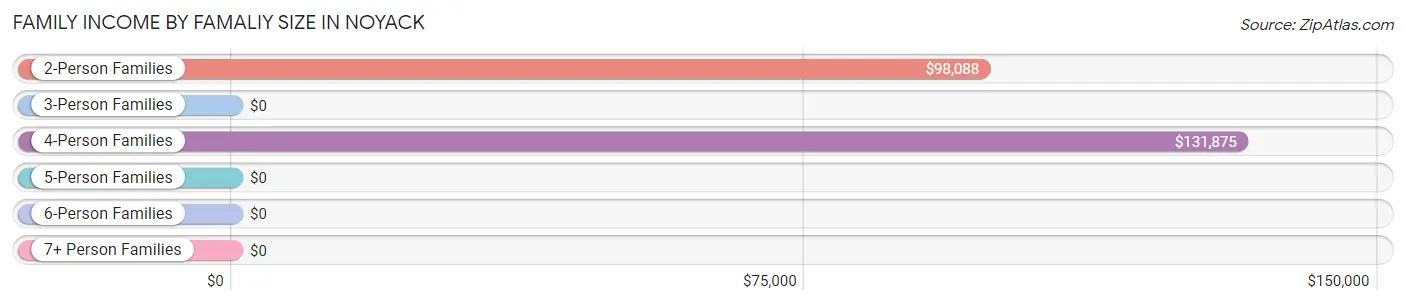
| Income Bracket | # Families | Median Income |
| 2-Person Families | 758 (52.8%) | $98,088 |
| 3-Person Families | 152 (10.6%) | $0 |
| 4-Person Families | 392 (27.3%) | $131,875 |
| 5-Person Families | 118 (8.2%) | $0 |
| 6-Person Families | 16 (1.1%) | $0 |
| 7+ Person Families | 0 (0.0%) | $0 |
| Total | 1,436 (100.0%) | $101,653 |
Family Income by Number of Earners in Noyack
The median family income in Noyack is $101,653, with families comprising 3+ earners (262) having the highest median family income of $138,529, while families with 1 earner (411) have the lowest median family income of $60,804, accounting for 18.2% and 28.6% of families, respectively.
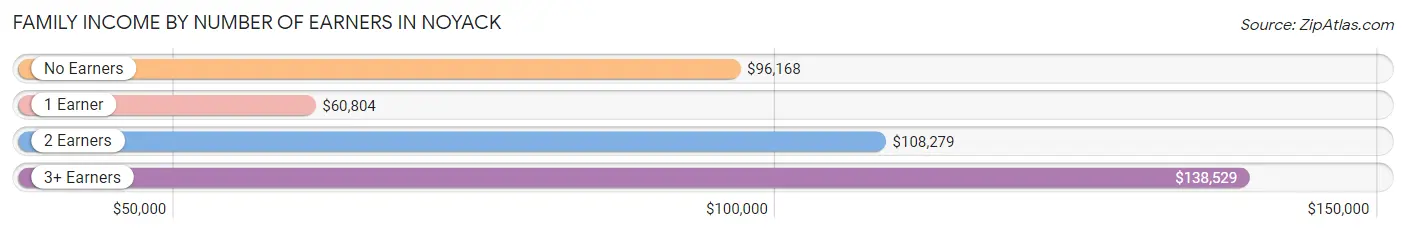
| Number of Earners | # Families | Median Income |
| No Earners | 163 (11.4%) | $96,168 |
| 1 Earner | 411 (28.6%) | $60,804 |
| 2 Earners | 600 (41.8%) | $108,279 |
| 3+ Earners | 262 (18.2%) | $138,529 |
| Total | 1,436 (100.0%) | $101,653 |
Household Income in Noyack
Household Income Brackets in Noyack
With 525 households falling in the category, the $100,000 to $149,999 income range is the most frequent in Noyack, accounting for 26.3% of all households.
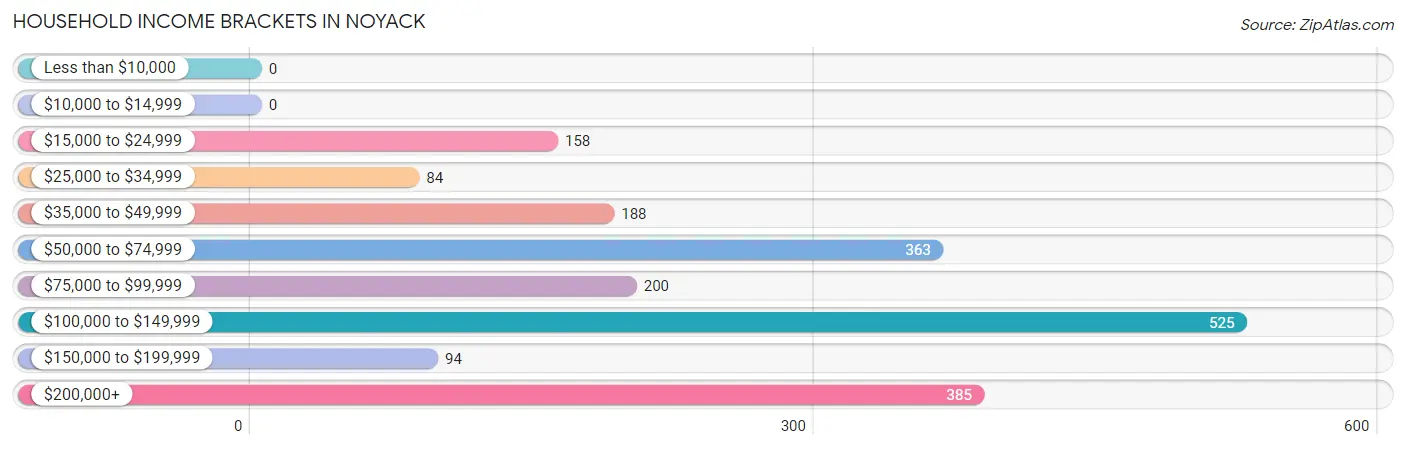
| Income Bracket | # Households | % Households |
| Less than $10,000 | 0 | 0.0% |
| $10,000 to $14,999 | 0 | 0.0% |
| $15,000 to $24,999 | 158 | 7.9% |
| $25,000 to $34,999 | 84 | 4.2% |
| $35,000 to $49,999 | 188 | 9.4% |
| $50,000 to $74,999 | 363 | 18.2% |
| $75,000 to $99,999 | 200 | 10.0% |
| $100,000 to $149,999 | 525 | 26.3% |
| $150,000 to $199,999 | 94 | 4.7% |
| $200,000+ | 385 | 19.3% |
Household Income by Householder Age in Noyack
The median household income in Noyack is $100,222, with the highest median household income of $120,833 found in the 45 to 64 years age bracket for the primary householder. A total of 702 households (35.2%) fall into this category.
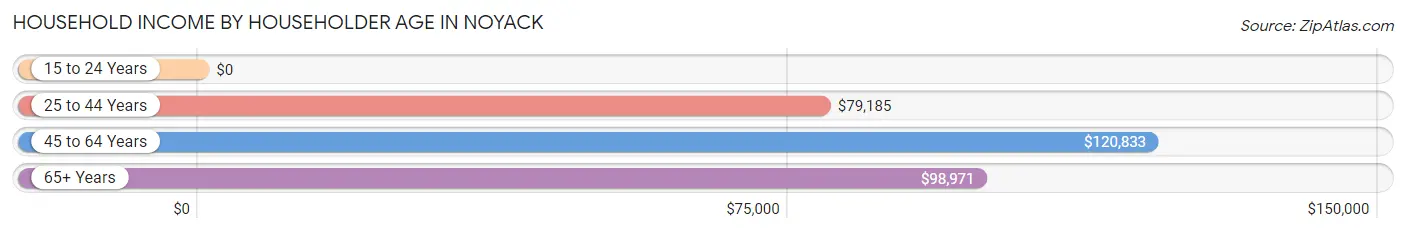
| Income Bracket | # Households | Median Income |
| 15 to 24 Years | 0 (0.0%) | $0 |
| 25 to 44 Years | 551 (27.6%) | $79,185 |
| 45 to 64 Years | 702 (35.2%) | $120,833 |
| 65+ Years | 742 (37.2%) | $98,971 |
| Total | 1,995 (100.0%) | $100,222 |
Poverty in Noyack
Income Below Poverty by Sex and Age in Noyack
With 4.9% poverty level for males and 4.7% for females among the residents of Noyack, 15 year old males and 18 to 24 year old females are the most vulnerable to poverty, with 24 males (55.8%) and 34 females (23.3%) in their respective age groups living below the poverty level.
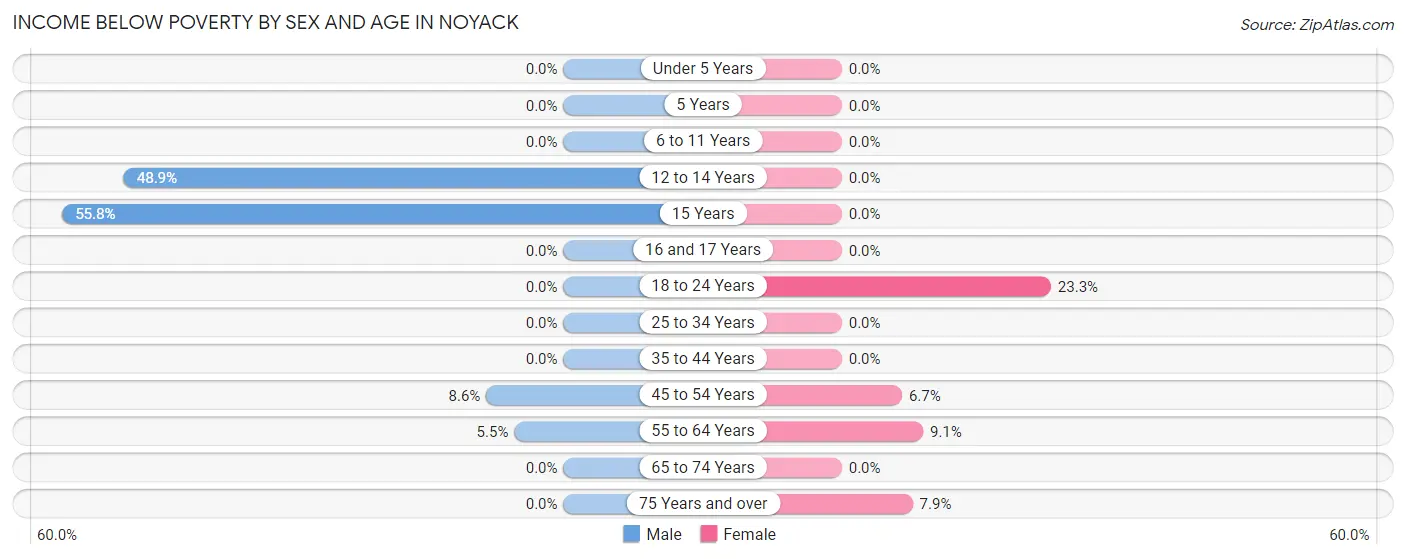
| Age Bracket | Male | Female |
| Under 5 Years | 0 (0.0%) | 0 (0.0%) |
| 5 Years | 0 (0.0%) | 0 (0.0%) |
| 6 to 11 Years | 0 (0.0%) | 0 (0.0%) |
| 12 to 14 Years | 46 (48.9%) | 0 (0.0%) |
| 15 Years | 24 (55.8%) | 0 (0.0%) |
| 16 and 17 Years | 0 (0.0%) | 0 (0.0%) |
| 18 to 24 Years | 0 (0.0%) | 34 (23.3%) |
| 25 to 34 Years | 0 (0.0%) | 0 (0.0%) |
| 35 to 44 Years | 0 (0.0%) | 0 (0.0%) |
| 45 to 54 Years | 25 (8.6%) | 27 (6.7%) |
| 55 to 64 Years | 14 (5.5%) | 39 (9.0%) |
| 65 to 74 Years | 0 (0.0%) | 0 (0.0%) |
| 75 Years and over | 0 (0.0%) | 22 (7.9%) |
| Total | 109 (4.9%) | 122 (4.7%) |
Income Above Poverty by Sex and Age in Noyack
According to the poverty statistics in Noyack, males aged under 5 years and females aged under 5 years are the age groups that are most secure financially, with 100.0% of males and 100.0% of females in these age groups living above the poverty line.
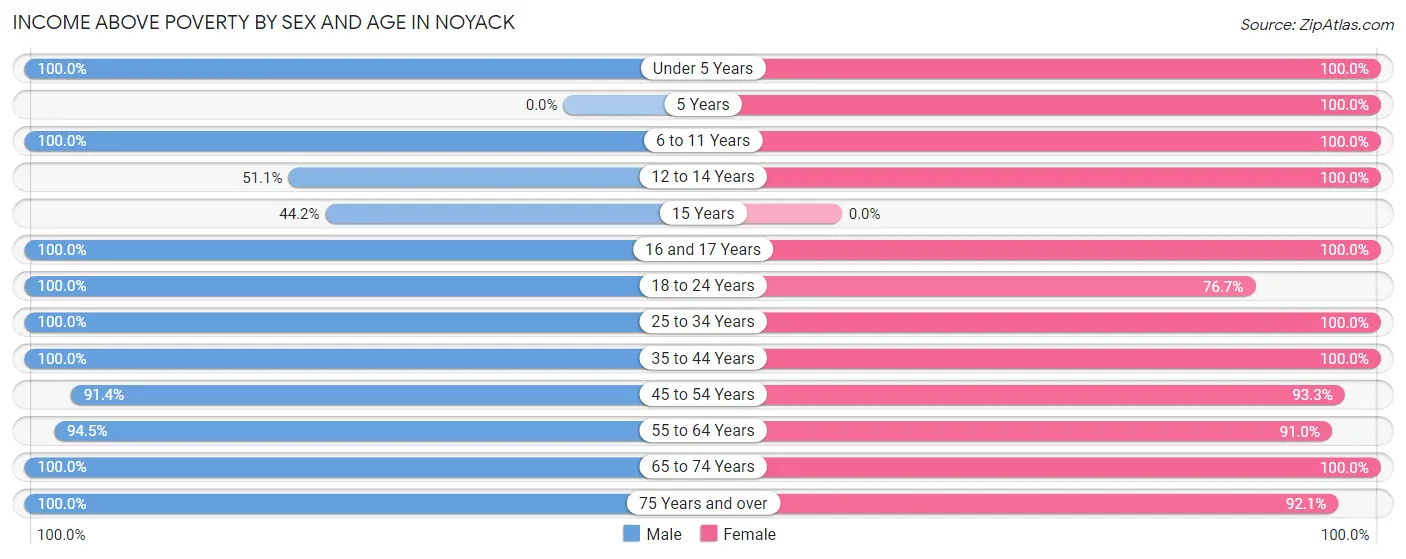
| Age Bracket | Male | Female |
| Under 5 Years | 59 (100.0%) | 176 (100.0%) |
| 5 Years | 0 (0.0%) | 39 (100.0%) |
| 6 to 11 Years | 143 (100.0%) | 281 (100.0%) |
| 12 to 14 Years | 48 (51.1%) | 22 (100.0%) |
| 15 Years | 19 (44.2%) | 0 (0.0%) |
| 16 and 17 Years | 39 (100.0%) | 89 (100.0%) |
| 18 to 24 Years | 144 (100.0%) | 112 (76.7%) |
| 25 to 34 Years | 130 (100.0%) | 195 (100.0%) |
| 35 to 44 Years | 444 (100.0%) | 245 (100.0%) |
| 45 to 54 Years | 266 (91.4%) | 376 (93.3%) |
| 55 to 64 Years | 242 (94.5%) | 392 (90.9%) |
| 65 to 74 Years | 341 (100.0%) | 274 (100.0%) |
| 75 Years and over | 233 (100.0%) | 257 (92.1%) |
| Total | 2,108 (95.1%) | 2,458 (95.3%) |
Income Below Poverty Among Married-Couple Families in Noyack
The poverty statistics for married-couple families in Noyack show that 2.3% or 27 of the total 1,159 families live below the poverty line. Families with 1 or 2 children have the highest poverty rate of 5.1%, comprising of 27 families. On the other hand, families with no children have the lowest poverty rate of 0.0%, which includes 0 families.
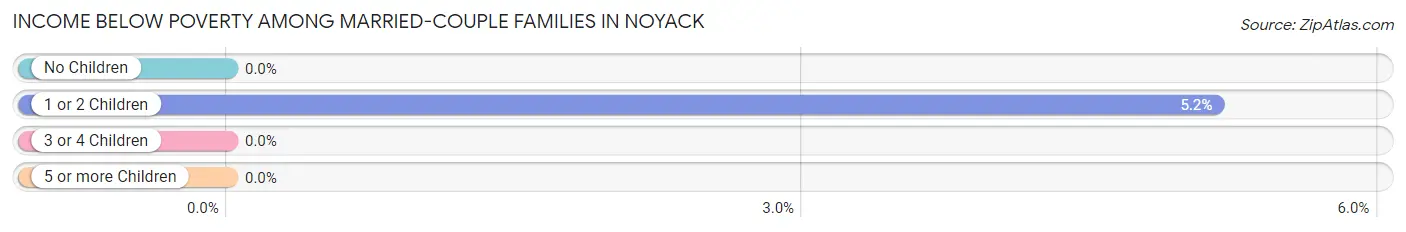
| Children | Above Poverty | Below Poverty |
| No Children | 611 (100.0%) | 0 (0.0%) |
| 1 or 2 Children | 497 (94.9%) | 27 (5.1%) |
| 3 or 4 Children | 24 (100.0%) | 0 (0.0%) |
| 5 or more Children | 0 (0.0%) | 0 (0.0%) |
| Total | 1,132 (97.7%) | 27 (2.3%) |
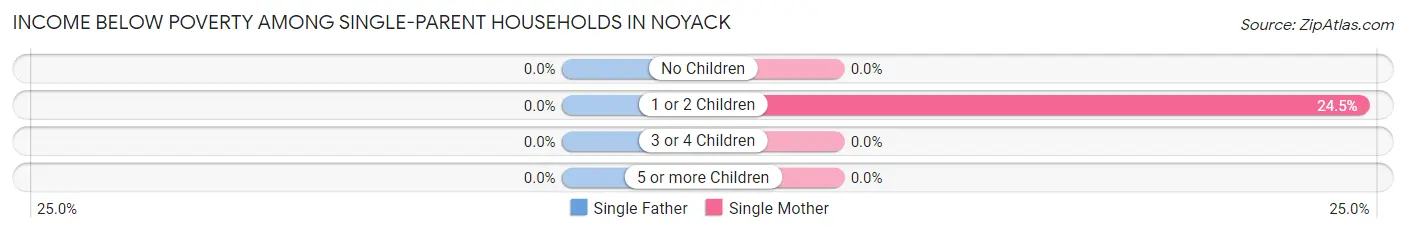
Income Below Poverty Among Single-Parent Households in Noyack
| Children | Single Father | Single Mother |
| No Children | 0 (0.0%) | 0 (0.0%) |
| 1 or 2 Children | 0 (0.0%) | 35 (24.5%) |
| 3 or 4 Children | 0 (0.0%) | 0 (0.0%) |
| 5 or more Children | 0 (0.0%) | 0 (0.0%) |
| Total | 0 (0.0%) | 35 (17.1%) |
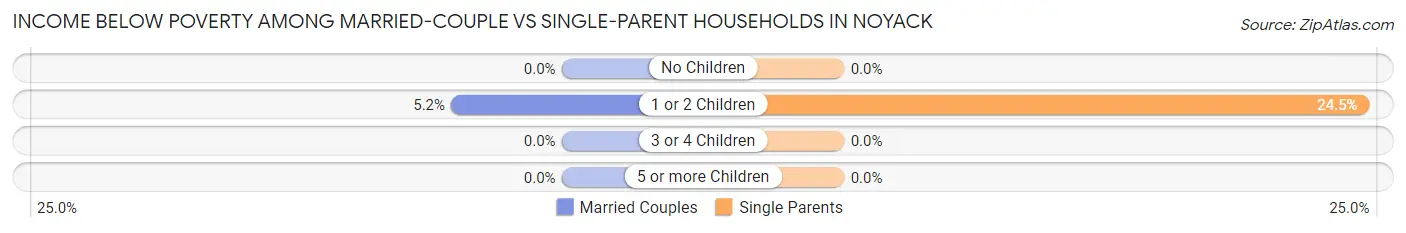
Income Below Poverty Among Married-Couple vs Single-Parent Households in Noyack
The poverty data for Noyack shows that 27 of the married-couple family households (2.3%) and 35 of the single-parent households (12.6%) are living below the poverty level. Within the married-couple family households, those with 1 or 2 children have the highest poverty rate, with 27 households (5.1%) falling below the poverty line. Among the single-parent households, those with 1 or 2 children have the highest poverty rate, with 35 household (24.5%) living below poverty.
| Children | Married-Couple Families | Single-Parent Households |
| No Children | 0 (0.0%) | 0 (0.0%) |
| 1 or 2 Children | 27 (5.1%) | 35 (24.5%) |
| 3 or 4 Children | 0 (0.0%) | 0 (0.0%) |
| 5 or more Children | 0 (0.0%) | 0 (0.0%) |
| Total | 27 (2.3%) | 35 (12.6%) |
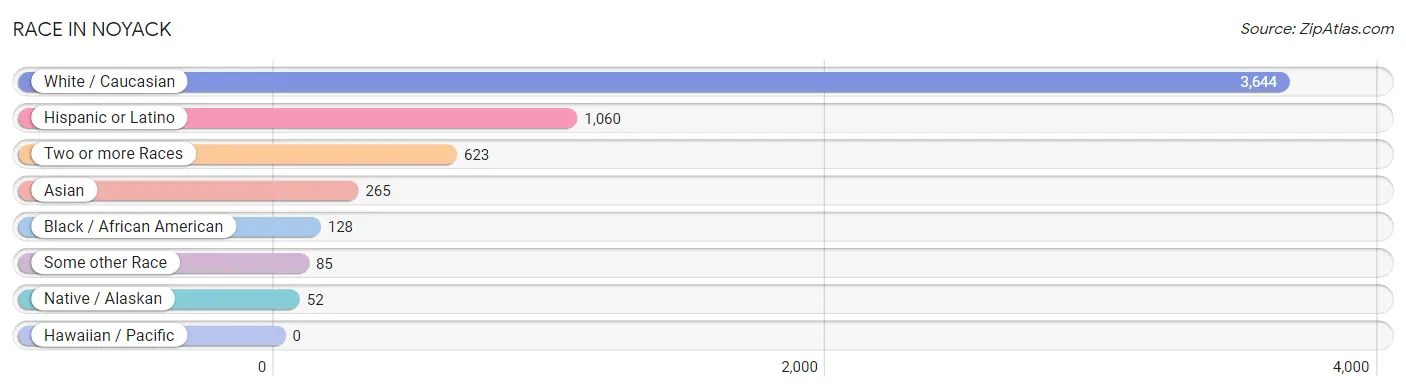
Race in Noyack
The most populous races in Noyack are White / Caucasian (3,644 | 76.0%), Hispanic or Latino (1,060 | 22.1%), and Two or more Races (623 | 13.0%).
| Race | # Population | % Population |
| Asian | 265 | 5.5% |
| Black / African American | 128 | 2.7% |
| Hawaiian / Pacific | 0 | 0.0% |
| Hispanic or Latino | 1,060 | 22.1% |
| Native / Alaskan | 52 | 1.1% |
| White / Caucasian | 3,644 | 76.0% |
| Two or more Races | 623 | 13.0% |
| Some other Race | 85 | 1.8% |
| Total | 4,797 | 100.0% |
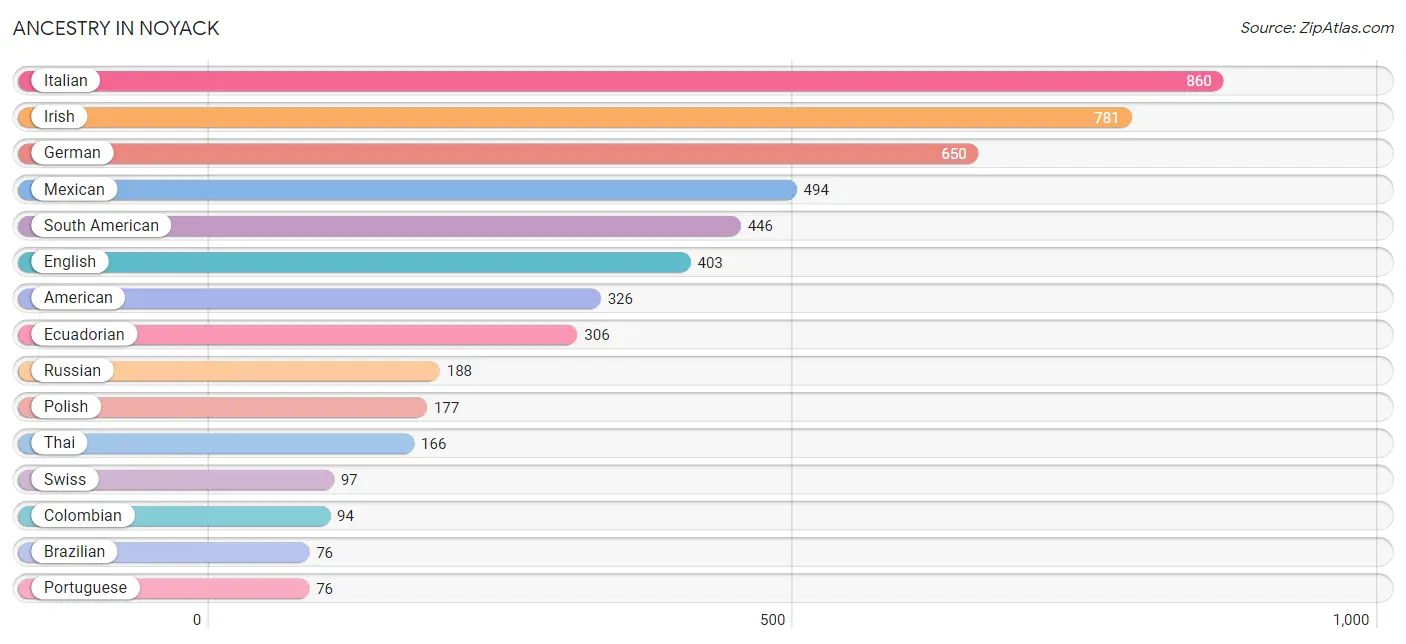
Ancestry in Noyack
The most populous ancestries reported in Noyack are Italian (860 | 17.9%), Irish (781 | 16.3%), German (650 | 13.6%), Mexican (494 | 10.3%), and South American (446 | 9.3%), together accounting for 67.4% of all Noyack residents.
| Ancestry | # Population | % Population |
| American | 326 | 6.8% |
| Austrian | 44 | 0.9% |
| Bhutanese | 22 | 0.5% |
| Brazilian | 76 | 1.6% |
| Central American Indian | 15 | 0.3% |
| Colombian | 94 | 2.0% |
| Croatian | 36 | 0.7% |
| Cuban | 40 | 0.8% |
| Danish | 21 | 0.4% |
| Eastern European | 56 | 1.2% |
| Ecuadorian | 306 | 6.4% |
| English | 403 | 8.4% |
| European | 33 | 0.7% |
| French | 34 | 0.7% |
| German | 650 | 13.6% |
| Hungarian | 27 | 0.6% |
| Indian (Asian) | 37 | 0.8% |
| Irish | 781 | 16.3% |
| Italian | 860 | 17.9% |
| Mexican | 494 | 10.3% |
| Mexican American Indian | 52 | 1.1% |
| Norwegian | 13 | 0.3% |
| Pakistani | 40 | 0.8% |
| Polish | 177 | 3.7% |
| Portuguese | 76 | 1.6% |
| Puerto Rican | 54 | 1.1% |
| Romanian | 11 | 0.2% |
| Russian | 188 | 3.9% |
| Scandinavian | 46 | 1.0% |
| Scotch-Irish | 15 | 0.3% |
| South American | 446 | 9.3% |
| Swedish | 12 | 0.3% |
| Swiss | 97 | 2.0% |
| Thai | 166 | 3.5% |
| Venezuelan | 46 | 1.0% |
| Welsh | 28 | 0.6% | View All 36 Rows |
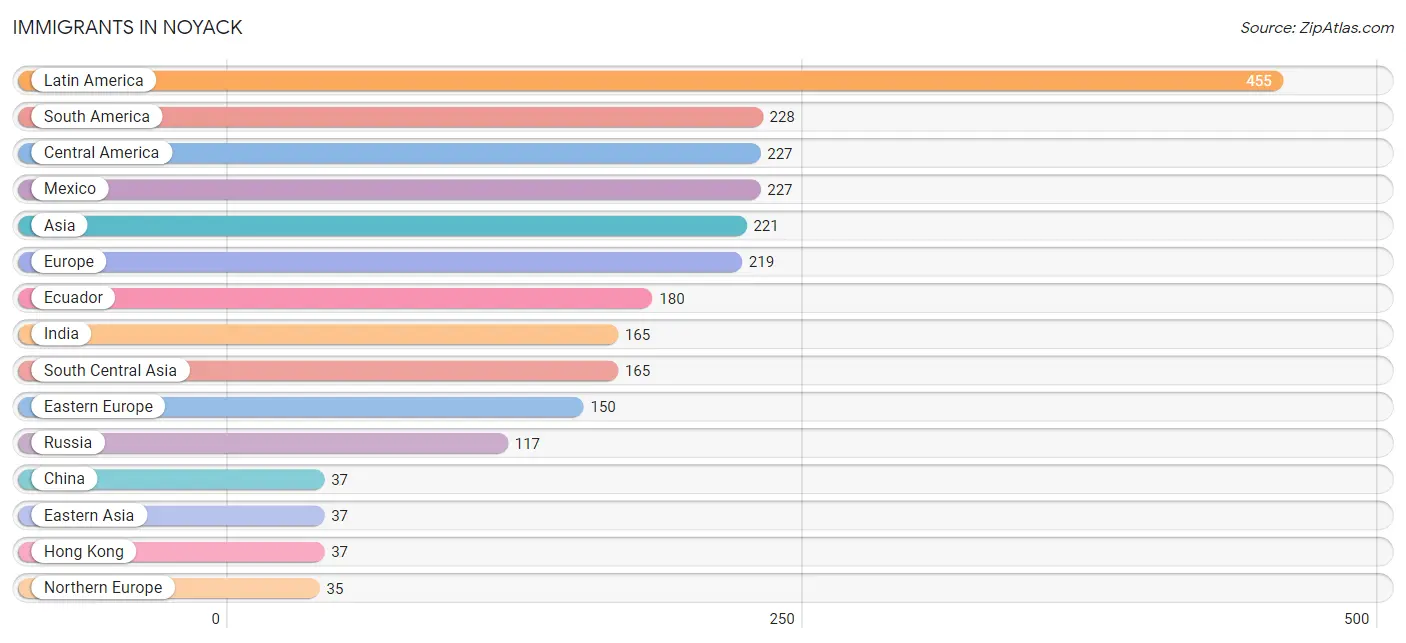
Immigrants in Noyack
The most numerous immigrant groups reported in Noyack came from Latin America (455 | 9.5%), South America (228 | 4.8%), Central America (227 | 4.7%), Mexico (227 | 4.7%), and Asia (221 | 4.6%), together accounting for 28.3% of all Noyack residents.
| Immigration Origin | # Population | % Population |
| Asia | 221 | 4.6% |
| Australia | 24 | 0.5% |
| Central America | 227 | 4.7% |
| China | 37 | 0.8% |
| Colombia | 24 | 0.5% |
| Eastern Asia | 37 | 0.8% |
| Eastern Europe | 150 | 3.1% |
| Ecuador | 180 | 3.7% |
| Europe | 219 | 4.6% |
| France | 34 | 0.7% |
| Guyana | 24 | 0.5% |
| Hong Kong | 37 | 0.8% |
| India | 165 | 3.4% |
| Ireland | 23 | 0.5% |
| Latin America | 455 | 9.5% |
| Mexico | 227 | 4.7% |
| Northern Europe | 35 | 0.7% |
| Oceania | 24 | 0.5% |
| Romania | 33 | 0.7% |
| Russia | 117 | 2.4% |
| South America | 228 | 4.8% |
| South Central Asia | 165 | 3.4% |
| South Eastern Asia | 19 | 0.4% |
| Sweden | 12 | 0.3% |
| Thailand | 19 | 0.4% |
| Western Europe | 34 | 0.7% | View All 26 Rows |
Sex and Age in Noyack
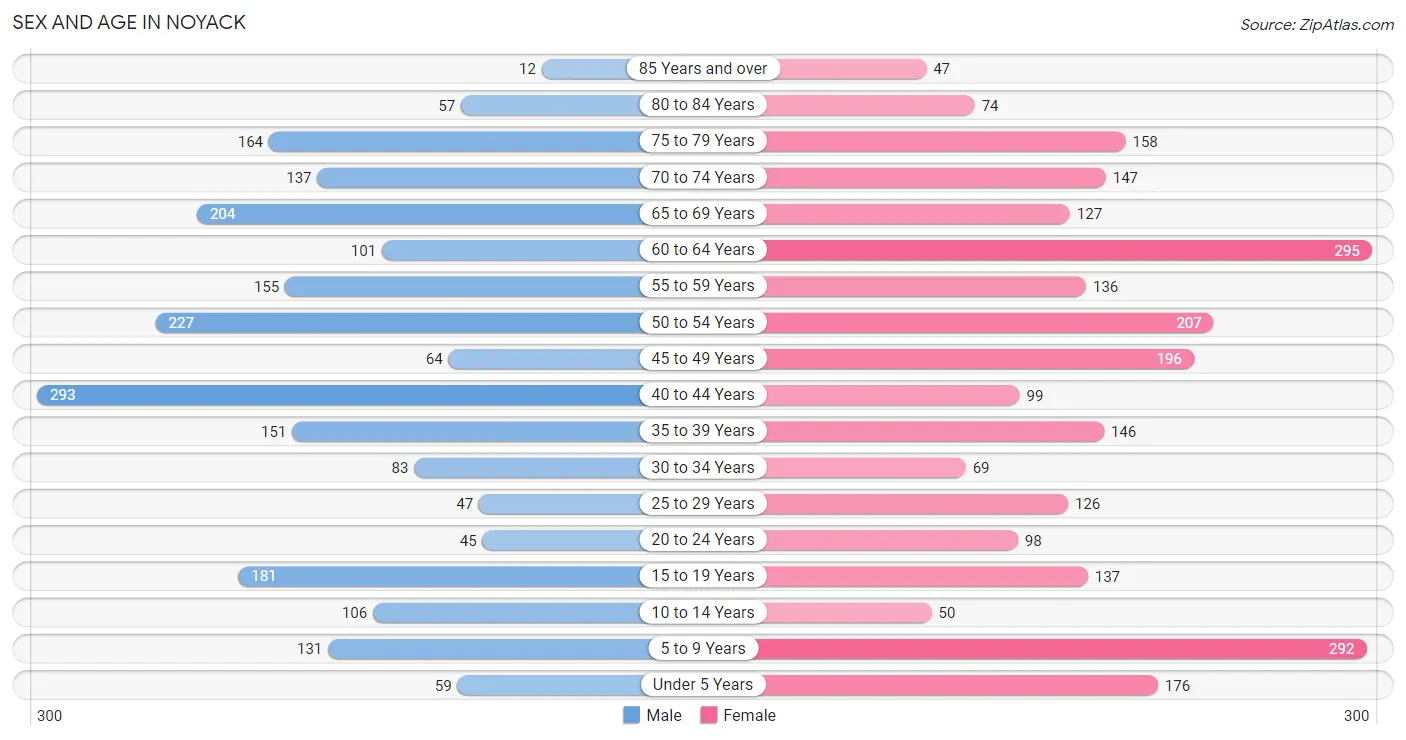
Sex and Age in Noyack
The most populous age groups in Noyack are 40 to 44 Years (293 | 13.2%) for men and 60 to 64 Years (295 | 11.4%) for women.
| Age Bracket | Male | Female |
| Under 5 Years | 59 (2.7%) | 176 (6.8%) |
| 5 to 9 Years | 131 (5.9%) | 292 (11.3%) |
| 10 to 14 Years | 106 (4.8%) | 50 (1.9%) |
| 15 to 19 Years | 181 (8.2%) | 137 (5.3%) |
| 20 to 24 Years | 45 (2.0%) | 98 (3.8%) |
| 25 to 29 Years | 47 (2.1%) | 126 (4.9%) |
| 30 to 34 Years | 83 (3.7%) | 69 (2.7%) |
| 35 to 39 Years | 151 (6.8%) | 146 (5.7%) |
| 40 to 44 Years | 293 (13.2%) | 99 (3.8%) |
| 45 to 49 Years | 64 (2.9%) | 196 (7.6%) |
| 50 to 54 Years | 227 (10.2%) | 207 (8.0%) |
| 55 to 59 Years | 155 (7.0%) | 136 (5.3%) |
| 60 to 64 Years | 101 (4.6%) | 295 (11.4%) |
| 65 to 69 Years | 204 (9.2%) | 127 (4.9%) |
| 70 to 74 Years | 137 (6.2%) | 147 (5.7%) |
| 75 to 79 Years | 164 (7.4%) | 158 (6.1%) |
| 80 to 84 Years | 57 (2.6%) | 74 (2.9%) |
| 85 Years and over | 12 (0.5%) | 47 (1.8%) |
| Total | 2,217 (100.0%) | 2,580 (100.0%) |
Families and Households in Noyack
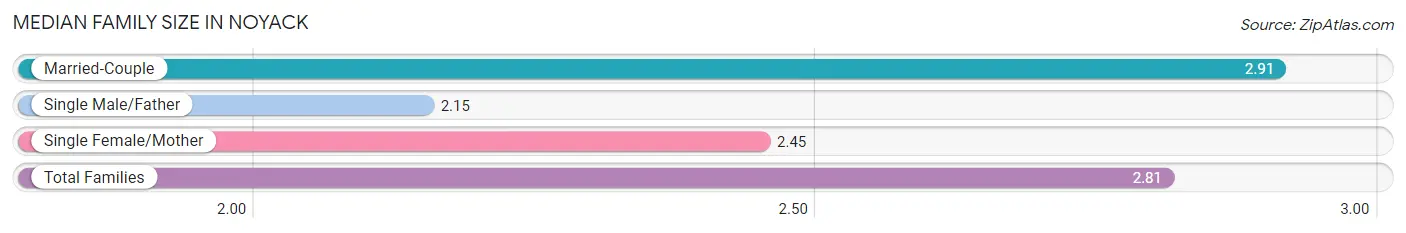
Median Family Size in Noyack
The median family size in Noyack is 2.81 persons per family, with married-couple families (1,159 | 80.7%) accounting for the largest median family size of 2.91 persons per family. On the other hand, single male/father families (72 | 5.0%) represent the smallest median family size with 2.15 persons per family.
| Family Type | # Families | Family Size |
| Married-Couple | 1,159 (80.7%) | 2.91 |
| Single Male/Father | 72 (5.0%) | 2.15 |
| Single Female/Mother | 205 (14.3%) | 2.45 |
| Total Families | 1,436 (100.0%) | 2.81 |
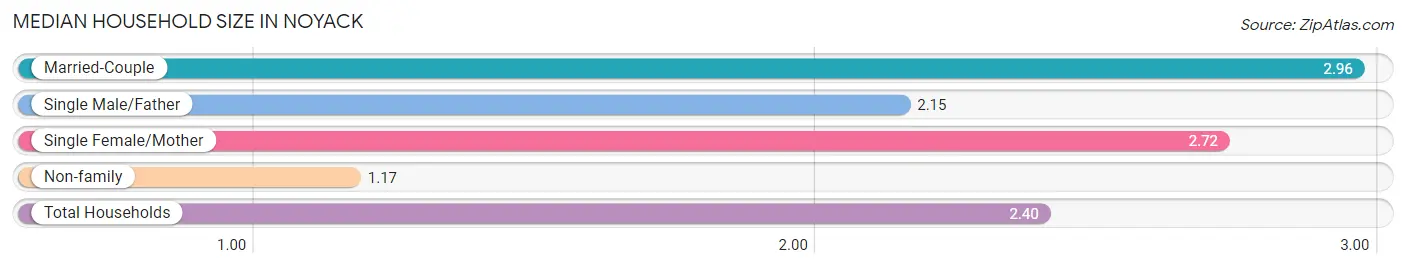
Median Household Size in Noyack
The median household size in Noyack is 2.40 persons per household, with married-couple households (1,159 | 58.1%) accounting for the largest median household size of 2.96 persons per household. non-family households (559 | 28.0%) represent the smallest median household size with 1.17 persons per household.
| Household Type | # Households | Household Size |
| Married-Couple | 1,159 (58.1%) | 2.96 |
| Single Male/Father | 72 (3.6%) | 2.15 |
| Single Female/Mother | 205 (10.3%) | 2.72 |
| Non-family | 559 (28.0%) | 1.17 |
| Total Households | 1,995 (100.0%) | 2.40 |
Household Size by Marriage Status in Noyack
Out of a total of 1,995 households in Noyack, 1,436 (72.0%) are family households, while 559 (28.0%) are nonfamily households. The most numerous type of family households are 2-person households, comprising 714, and the most common type of nonfamily households are 1-person households, comprising 469.
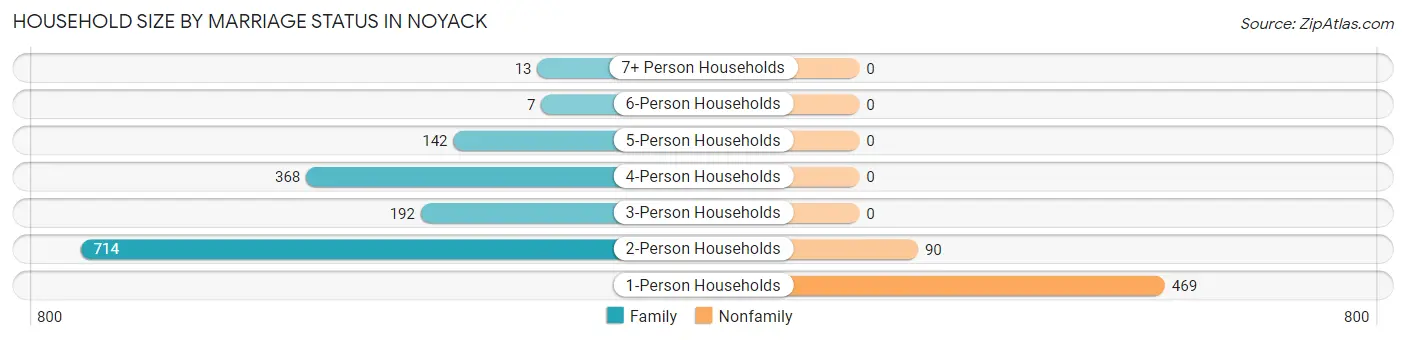
| Household Size | Family Households | Nonfamily Households |
| 1-Person Households | - | 469 (23.5%) |
| 2-Person Households | 714 (35.8%) | 90 (4.5%) |
| 3-Person Households | 192 (9.6%) | 0 (0.0%) |
| 4-Person Households | 368 (18.4%) | 0 (0.0%) |
| 5-Person Households | 142 (7.1%) | 0 (0.0%) |
| 6-Person Households | 7 (0.4%) | 0 (0.0%) |
| 7+ Person Households | 13 (0.6%) | 0 (0.0%) |
| Total | 1,436 (72.0%) | 559 (28.0%) |
Female Fertility in Noyack
Fertility by Age in Noyack
Average fertility rate in Noyack is 12.0 births per 1,000 women. Women in the age bracket of 35 to 50 years have the highest fertility rate with 21.0 births per 1,000 women. Women in the age bracket of 35 to 50 years acount for 100.0% of all women with births.
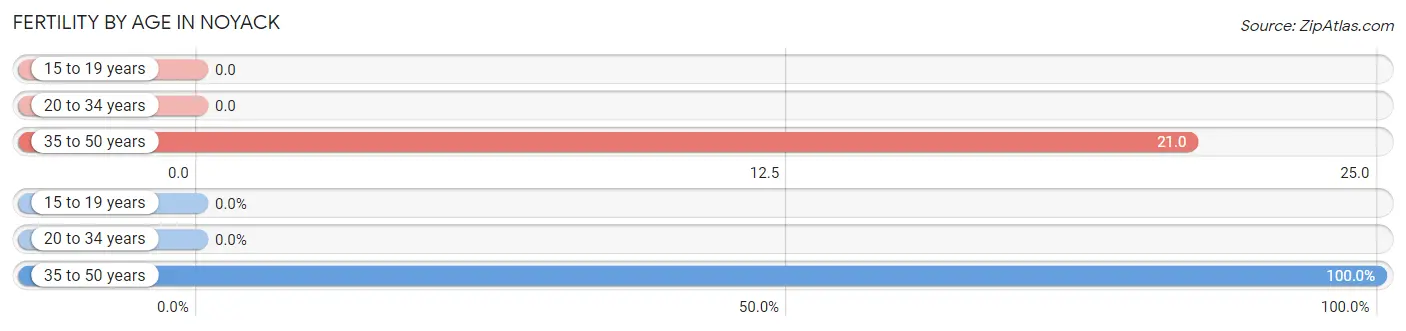
| Age Bracket | Women with Births | Births / 1,000 Women |
| 15 to 19 years | 0 (0.0%) | 0.0 |
| 20 to 34 years | 0 (0.0%) | 0.0 |
| 35 to 50 years | 11 (100.0%) | 21.0 |
| Total | 11 (100.0%) | 12.0 |
Fertility by Age by Marriage Status in Noyack
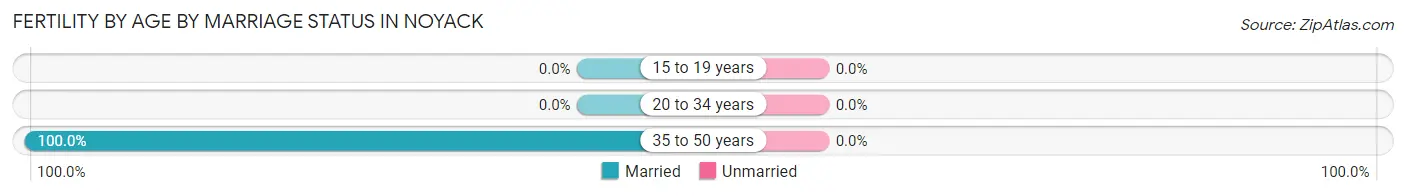
| Age Bracket | Married | Unmarried |
| 15 to 19 years | 0 (0.0%) | 0 (0.0%) |
| 20 to 34 years | 0 (0.0%) | 0 (0.0%) |
| 35 to 50 years | 11 (100.0%) | 0 (0.0%) |
| Total | 11 (100.0%) | 0 (0.0%) |
Fertility by Education in Noyack
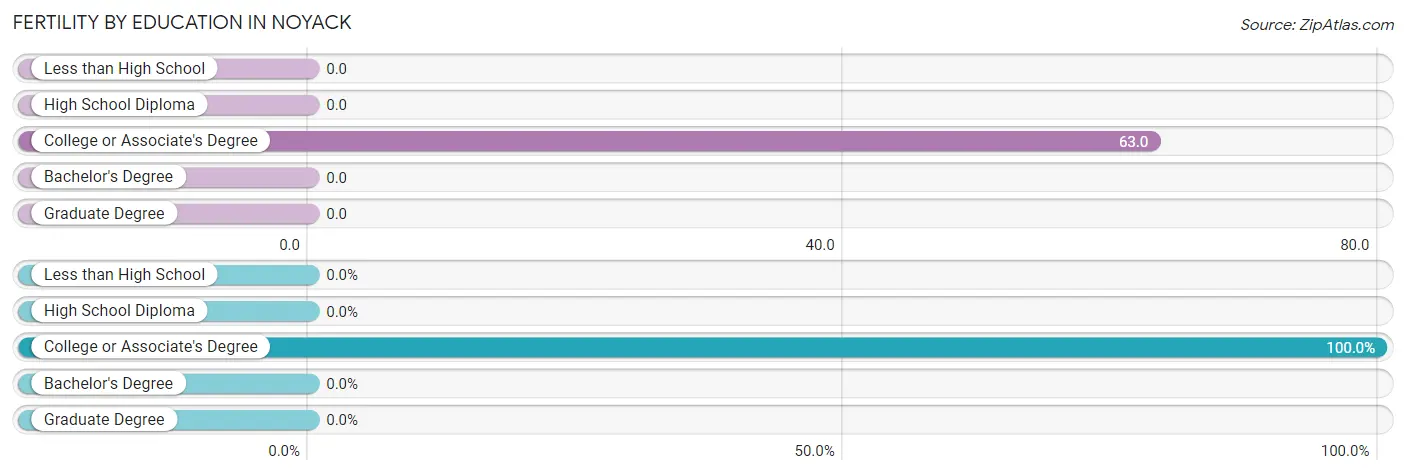
| Educational Attainment | Women with Births | Births / 1,000 Women |
| Less than High School | 0 (0.0%) | 0.0 |
| High School Diploma | 0 (0.0%) | 0.0 |
| College or Associate's Degree | 11 (100.0%) | 63.0 |
| Bachelor's Degree | 0 (0.0%) | 0.0 |
| Graduate Degree | 0 (0.0%) | 0.0 |
| Total | 11 (100.0%) | 12.0 |
Fertility by Education by Marriage Status in Noyack
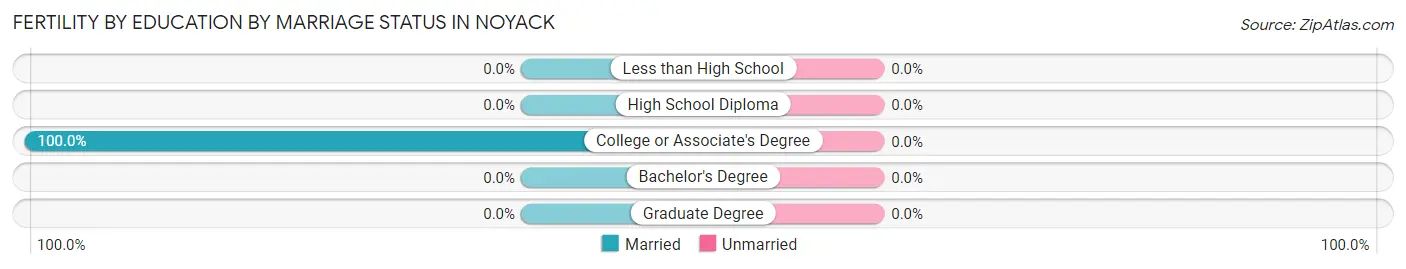
| Educational Attainment | Married | Unmarried |
| Less than High School | 0 (0.0%) | 0 (0.0%) |
| High School Diploma | 0 (0.0%) | 0 (0.0%) |
| College or Associate's Degree | 11 (100.0%) | 0 (0.0%) |
| Bachelor's Degree | 0 (0.0%) | 0 (0.0%) |
| Graduate Degree | 0 (0.0%) | 0 (0.0%) |
| Total | 11 (100.0%) | 0 (0.0%) |
Employment Characteristics in Noyack
Employment by Class of Employer in Noyack
Among the 2,565 employed individuals in Noyack, private company employees (1,397 | 54.5%), self-employed (incorporated) (332 | 12.9%), and self-employed (not incorporated) (329 | 12.8%) make up the most common classes of employment.
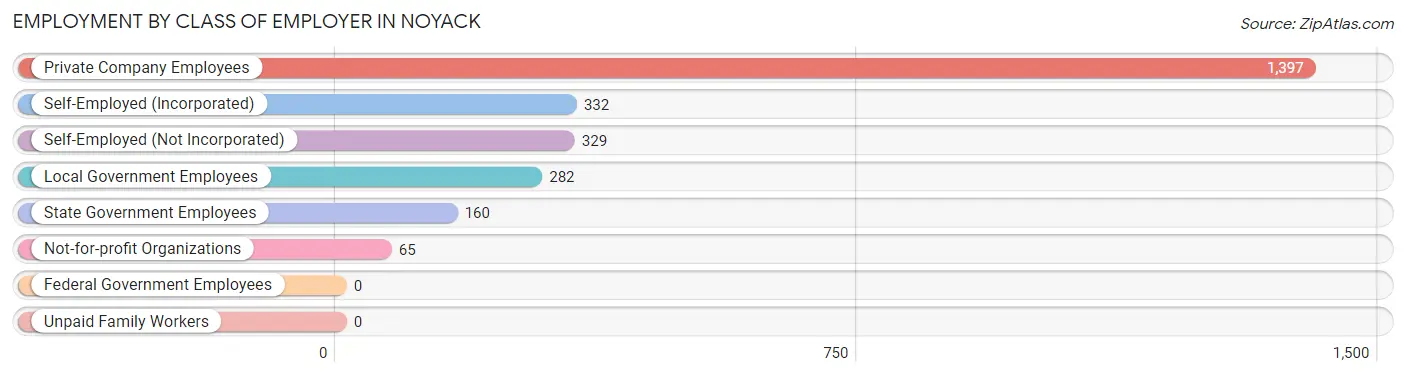
| Employer Class | # Employees | % Employees |
| Private Company Employees | 1,397 | 54.5% |
| Self-Employed (Incorporated) | 332 | 12.9% |
| Self-Employed (Not Incorporated) | 329 | 12.8% |
| Not-for-profit Organizations | 65 | 2.5% |
| Local Government Employees | 282 | 11.0% |
| State Government Employees | 160 | 6.2% |
| Federal Government Employees | 0 | 0.0% |
| Unpaid Family Workers | 0 | 0.0% |
| Total | 2,565 | 100.0% |
Employment Status by Age in Noyack
According to the labor force statistics for Noyack, out of the total population over 16 years of age (3,940), 71.1% or 2,801 individuals are in the labor force, with 4.9% or 137 of them unemployed. The age group with the highest labor force participation rate is 25 to 29 years, with 100.0% or 173 individuals in the labor force. Within the labor force, the 25 to 29 years age range has the highest percentage of unemployed individuals, with 27.7% or 48 of them being unemployed.
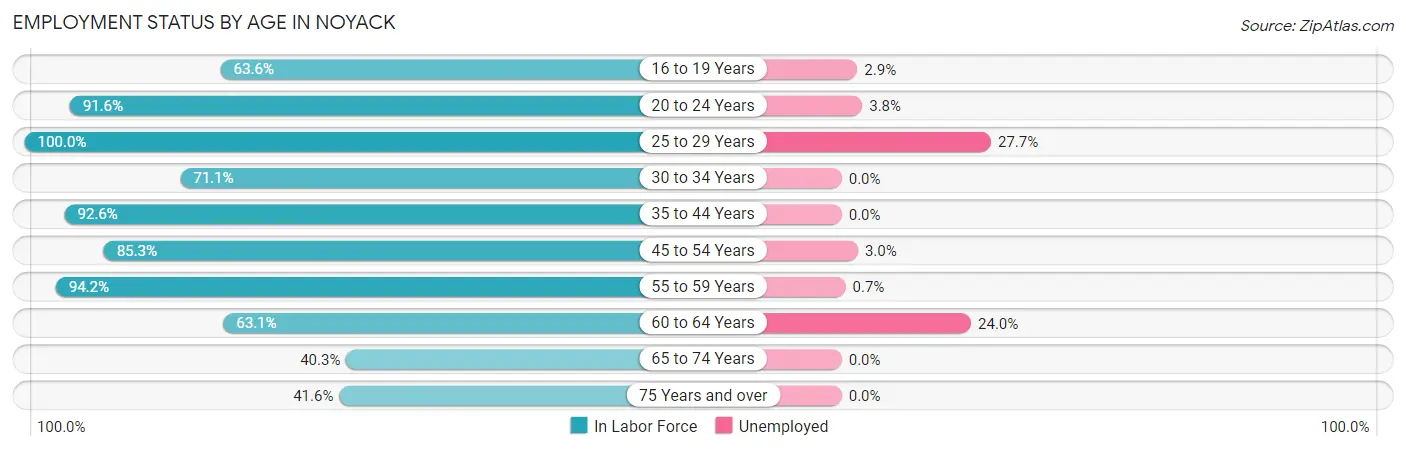
| Age Bracket | In Labor Force | Unemployed |
| 16 to 19 Years | 175 (63.6%) | 5 (2.9%) |
| 20 to 24 Years | 131 (91.6%) | 5 (3.8%) |
| 25 to 29 Years | 173 (100.0%) | 48 (27.7%) |
| 30 to 34 Years | 108 (71.1%) | 0 (0.0%) |
| 35 to 44 Years | 638 (92.6%) | 0 (0.0%) |
| 45 to 54 Years | 592 (85.3%) | 18 (3.0%) |
| 55 to 59 Years | 274 (94.2%) | 2 (0.7%) |
| 60 to 64 Years | 250 (63.1%) | 60 (24.0%) |
| 65 to 74 Years | 248 (40.3%) | 0 (0.0%) |
| 75 Years and over | 213 (41.6%) | 0 (0.0%) |
| Total | 2,801 (71.1%) | 137 (4.9%) |
Employment Status by Educational Attainment in Noyack
According to labor force statistics for Noyack, 85.0% of individuals (2,036) out of the total population between 25 and 64 years of age (2,395) are in the labor force, with 6.3% or 128 of them being unemployed. The group with the highest labor force participation rate are those with the educational attainment of less than high school, with 96.2% or 226 individuals in the labor force. Within the labor force, individuals with college / associate degree education have the highest percentage of unemployment, with 13.3% or 62 of them being unemployed.
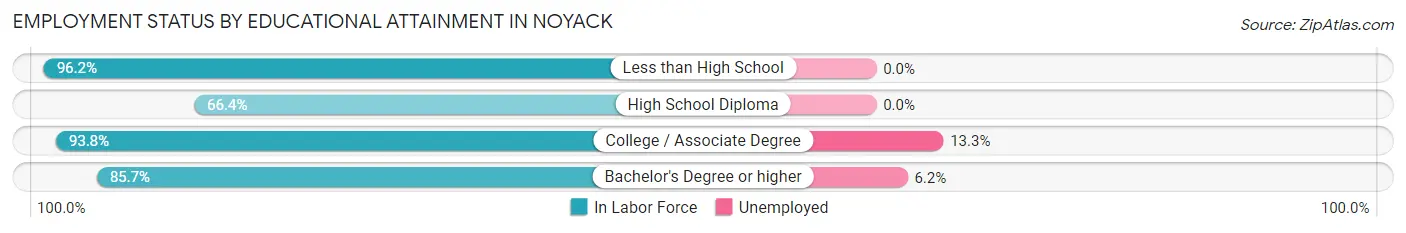
| Educational Attainment | In Labor Force | Unemployed |
| Less than High School | 226 (96.2%) | 0 (0.0%) |
| High School Diploma | 285 (66.4%) | 0 (0.0%) |
| College / Associate Degree | 466 (93.8%) | 66 (13.3%) |
| Bachelor's Degree or higher | 1,058 (85.7%) | 77 (6.2%) |
| Total | 2,036 (85.0%) | 151 (6.3%) |
Employment Occupations by Sex in Noyack
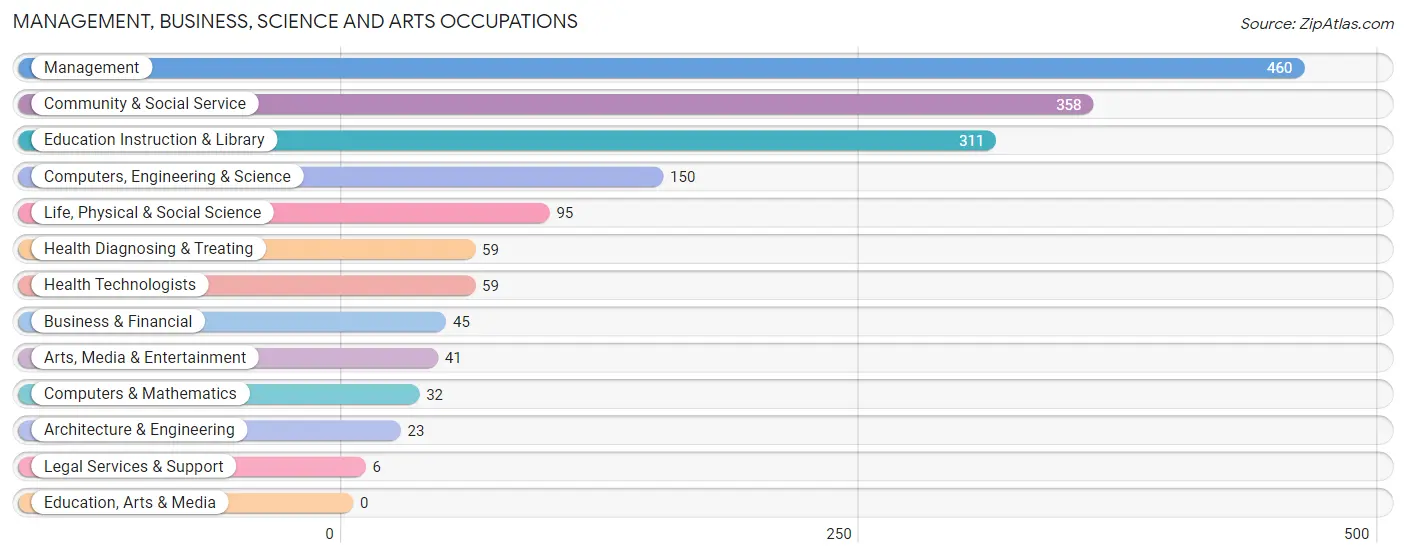
Management, Business, Science and Arts Occupations
The most common Management, Business, Science and Arts occupations in Noyack are Management (460 | 17.3%), Community & Social Service (358 | 13.4%), Education Instruction & Library (311 | 11.7%), Computers, Engineering & Science (150 | 5.6%), and Life, Physical & Social Science (95 | 3.6%).
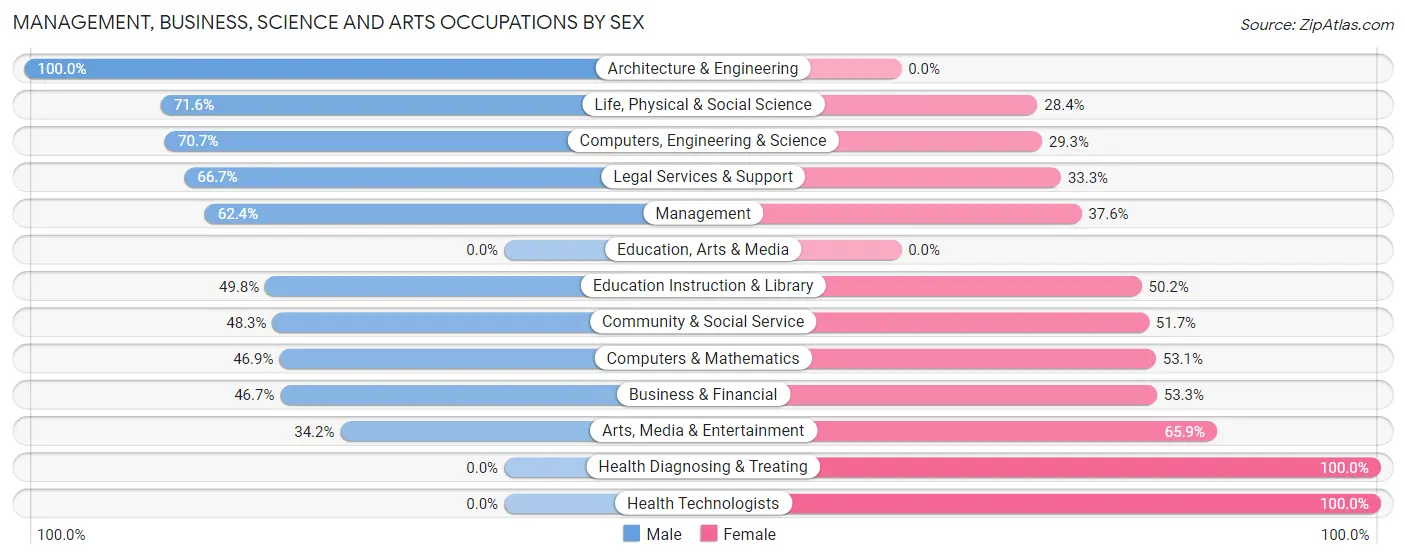
Management, Business, Science and Arts Occupations by Sex
Within the Management, Business, Science and Arts occupations in Noyack, the most male-oriented occupations are Architecture & Engineering (100.0%), Life, Physical & Social Science (71.6%), and Computers, Engineering & Science (70.7%), while the most female-oriented occupations are Health Diagnosing & Treating (100.0%), Health Technologists (100.0%), and Arts, Media & Entertainment (65.8%).
| Occupation | Male | Female |
| Management | 287 (62.4%) | 173 (37.6%) |
| Business & Financial | 21 (46.7%) | 24 (53.3%) |
| Computers, Engineering & Science | 106 (70.7%) | 44 (29.3%) |
| Computers & Mathematics | 15 (46.9%) | 17 (53.1%) |
| Architecture & Engineering | 23 (100.0%) | 0 (0.0%) |
| Life, Physical & Social Science | 68 (71.6%) | 27 (28.4%) |
| Community & Social Service | 173 (48.3%) | 185 (51.7%) |
| Education, Arts & Media | 0 (0.0%) | 0 (0.0%) |
| Legal Services & Support | 4 (66.7%) | 2 (33.3%) |
| Education Instruction & Library | 155 (49.8%) | 156 (50.2%) |
| Arts, Media & Entertainment | 14 (34.2%) | 27 (65.8%) |
| Health Diagnosing & Treating | 0 (0.0%) | 59 (100.0%) |
| Health Technologists | 0 (0.0%) | 59 (100.0%) |
| Total (Category) | 587 (54.8%) | 485 (45.2%) |
| Total (Overall) | 1,420 (53.3%) | 1,244 (46.7%) |
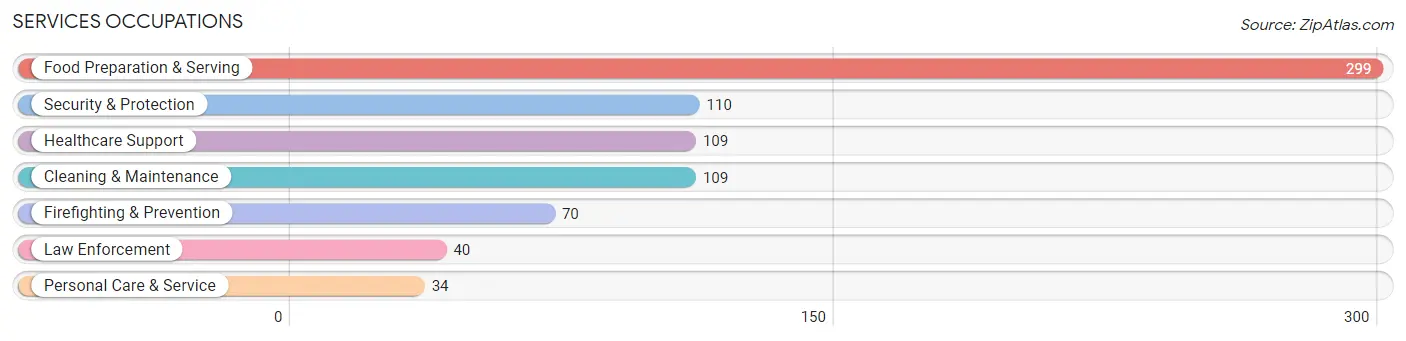
Services Occupations
The most common Services occupations in Noyack are Food Preparation & Serving (299 | 11.2%), Security & Protection (110 | 4.1%), Healthcare Support (109 | 4.1%), Cleaning & Maintenance (109 | 4.1%), and Firefighting & Prevention (70 | 2.6%).
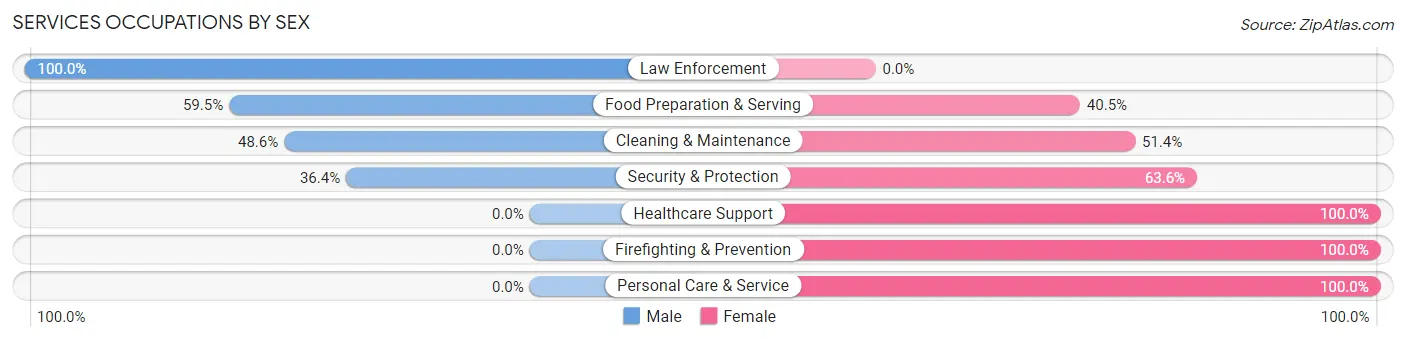
Services Occupations by Sex
Within the Services occupations in Noyack, the most male-oriented occupations are Law Enforcement (100.0%), Food Preparation & Serving (59.5%), and Cleaning & Maintenance (48.6%), while the most female-oriented occupations are Healthcare Support (100.0%), Firefighting & Prevention (100.0%), and Personal Care & Service (100.0%).
| Occupation | Male | Female |
| Healthcare Support | 0 (0.0%) | 109 (100.0%) |
| Security & Protection | 40 (36.4%) | 70 (63.6%) |
| Firefighting & Prevention | 0 (0.0%) | 70 (100.0%) |
| Law Enforcement | 40 (100.0%) | 0 (0.0%) |
| Food Preparation & Serving | 178 (59.5%) | 121 (40.5%) |
| Cleaning & Maintenance | 53 (48.6%) | 56 (51.4%) |
| Personal Care & Service | 0 (0.0%) | 34 (100.0%) |
| Total (Category) | 271 (41.0%) | 390 (59.0%) |
| Total (Overall) | 1,420 (53.3%) | 1,244 (46.7%) |
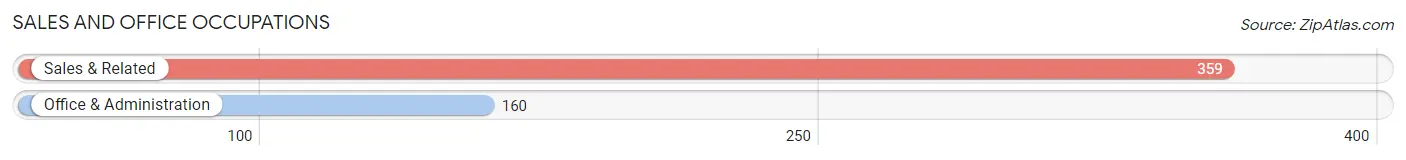
Sales and Office Occupations
The most common Sales and Office occupations in Noyack are Sales & Related (359 | 13.5%), and Office & Administration (160 | 6.0%).
Sales and Office Occupations by Sex
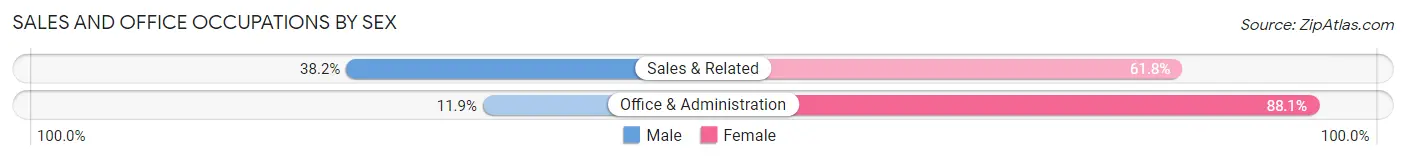
| Occupation | Male | Female |
| Sales & Related | 137 (38.2%) | 222 (61.8%) |
| Office & Administration | 19 (11.9%) | 141 (88.1%) |
| Total (Category) | 156 (30.1%) | 363 (69.9%) |
| Total (Overall) | 1,420 (53.3%) | 1,244 (46.7%) |
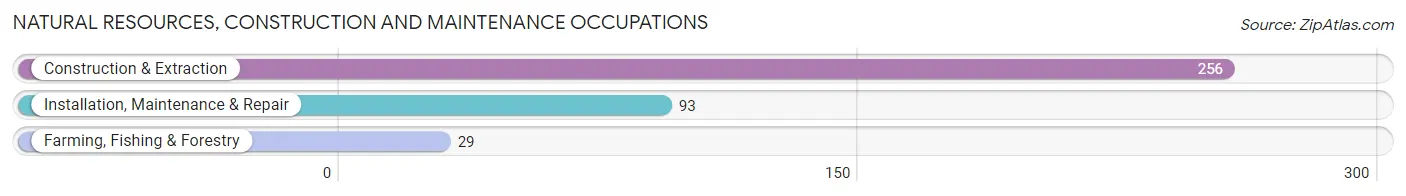
Natural Resources, Construction and Maintenance Occupations
The most common Natural Resources, Construction and Maintenance occupations in Noyack are Construction & Extraction (256 | 9.6%), Installation, Maintenance & Repair (93 | 3.5%), and Farming, Fishing & Forestry (29 | 1.1%).
Natural Resources, Construction and Maintenance Occupations by Sex
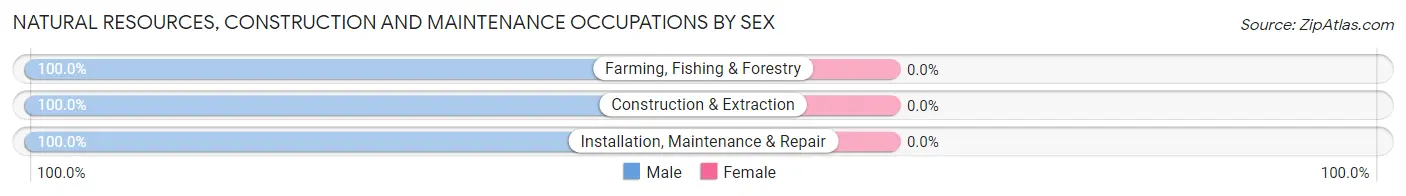
| Occupation | Male | Female |
| Farming, Fishing & Forestry | 29 (100.0%) | 0 (0.0%) |
| Construction & Extraction | 256 (100.0%) | 0 (0.0%) |
| Installation, Maintenance & Repair | 93 (100.0%) | 0 (0.0%) |
| Total (Category) | 378 (100.0%) | 0 (0.0%) |
| Total (Overall) | 1,420 (53.3%) | 1,244 (46.7%) |
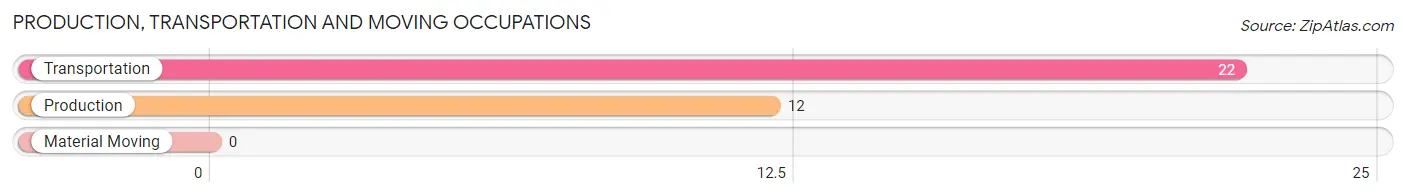
Production, Transportation and Moving Occupations
The most common Production, Transportation and Moving occupations in Noyack are Transportation (22 | 0.8%), and Production (12 | 0.4%).
Production, Transportation and Moving Occupations by Sex
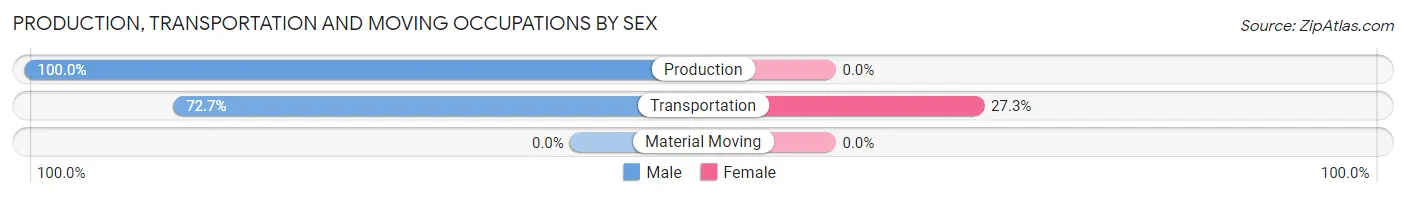
| Occupation | Male | Female |
| Production | 12 (100.0%) | 0 (0.0%) |
| Transportation | 16 (72.7%) | 6 (27.3%) |
| Material Moving | 0 (0.0%) | 0 (0.0%) |
| Total (Category) | 28 (82.4%) | 6 (17.6%) |
| Total (Overall) | 1,420 (53.3%) | 1,244 (46.7%) |
Employment Industries by Sex in Noyack
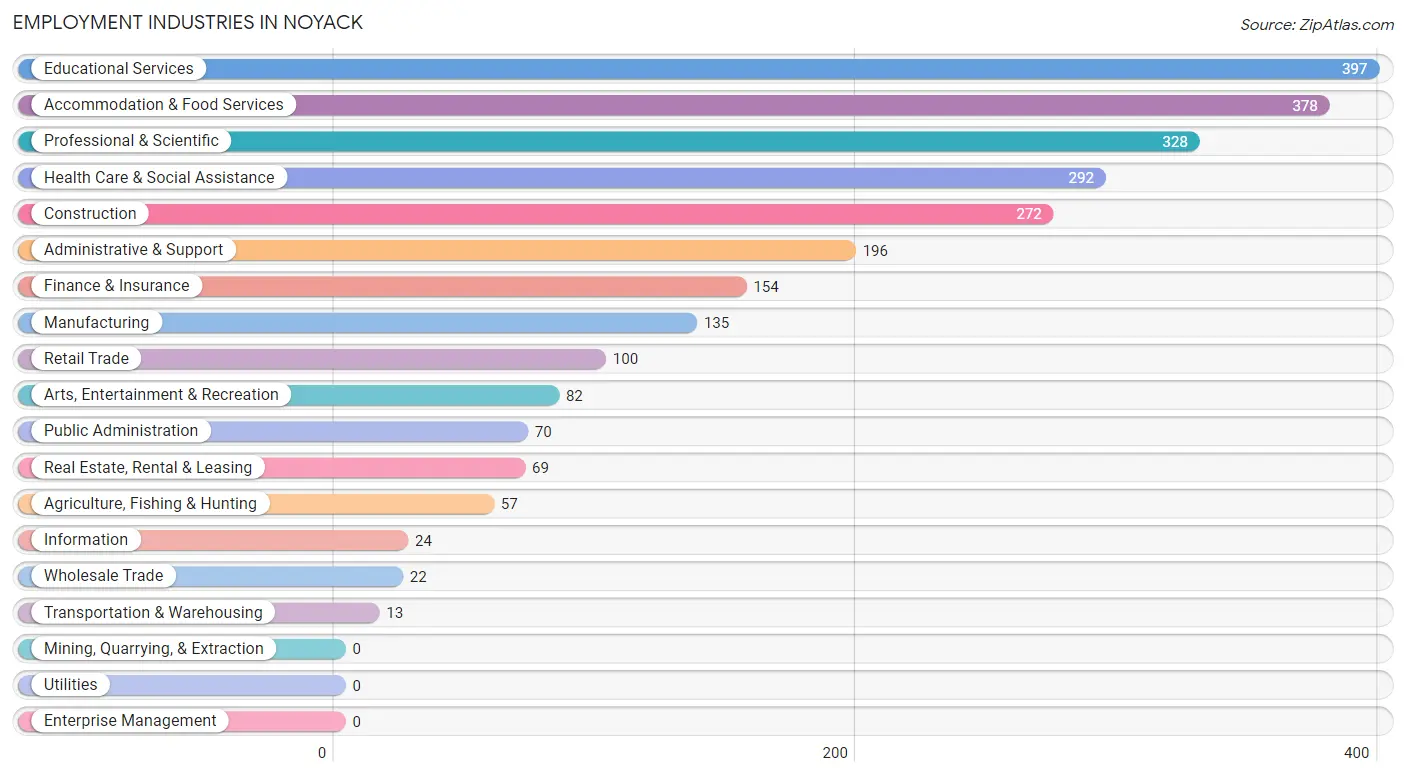
Employment Industries in Noyack
The major employment industries in Noyack include Educational Services (397 | 14.9%), Accommodation & Food Services (378 | 14.2%), Professional & Scientific (328 | 12.3%), Health Care & Social Assistance (292 | 11.0%), and Construction (272 | 10.2%).
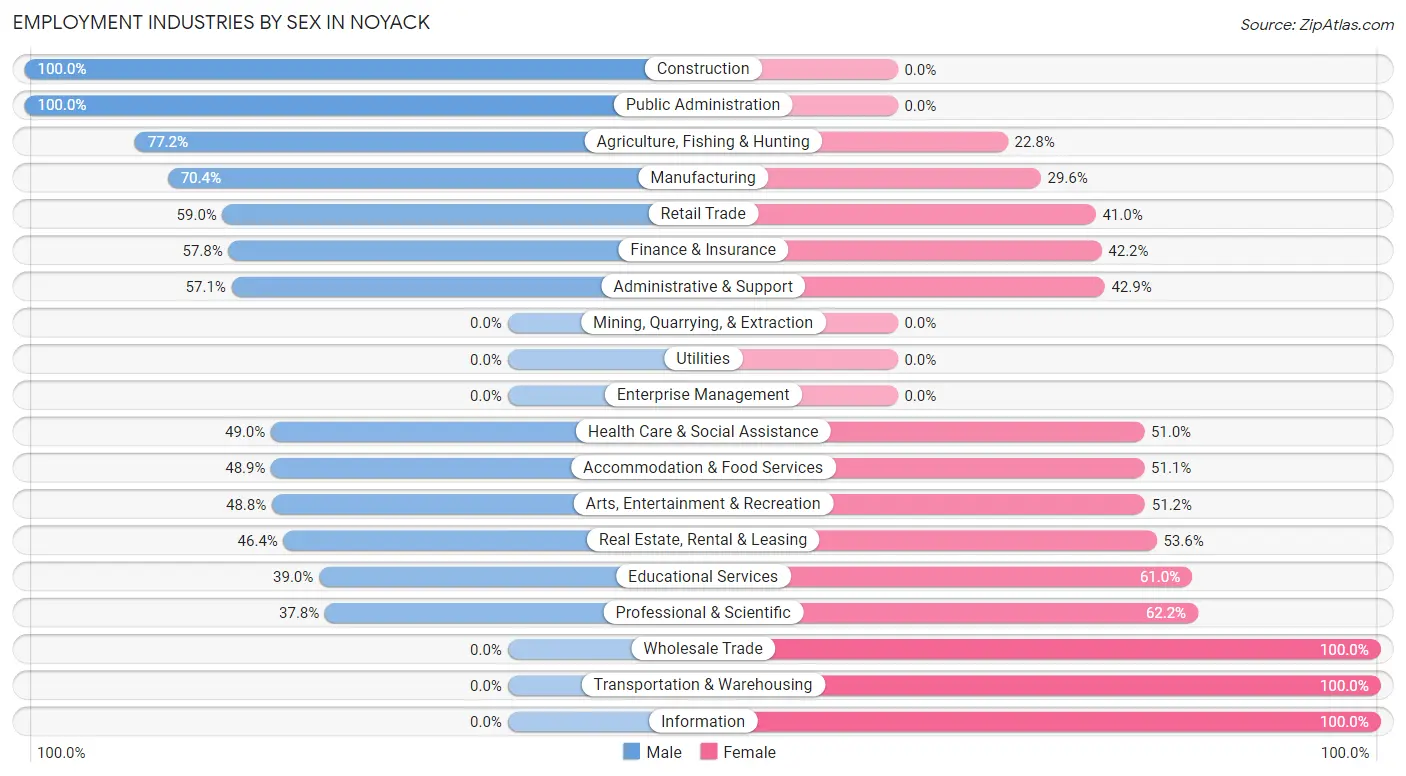
Employment Industries by Sex in Noyack
The Noyack industries that see more men than women are Construction (100.0%), Public Administration (100.0%), and Agriculture, Fishing & Hunting (77.2%), whereas the industries that tend to have a higher number of women are Wholesale Trade (100.0%), Transportation & Warehousing (100.0%), and Information (100.0%).
| Industry | Male | Female |
| Agriculture, Fishing & Hunting | 44 (77.2%) | 13 (22.8%) |
| Mining, Quarrying, & Extraction | 0 (0.0%) | 0 (0.0%) |
| Construction | 272 (100.0%) | 0 (0.0%) |
| Manufacturing | 95 (70.4%) | 40 (29.6%) |
| Wholesale Trade | 0 (0.0%) | 22 (100.0%) |
| Retail Trade | 59 (59.0%) | 41 (41.0%) |
| Transportation & Warehousing | 0 (0.0%) | 13 (100.0%) |
| Utilities | 0 (0.0%) | 0 (0.0%) |
| Information | 0 (0.0%) | 24 (100.0%) |
| Finance & Insurance | 89 (57.8%) | 65 (42.2%) |
| Real Estate, Rental & Leasing | 32 (46.4%) | 37 (53.6%) |
| Professional & Scientific | 124 (37.8%) | 204 (62.2%) |
| Enterprise Management | 0 (0.0%) | 0 (0.0%) |
| Administrative & Support | 112 (57.1%) | 84 (42.9%) |
| Educational Services | 155 (39.0%) | 242 (61.0%) |
| Health Care & Social Assistance | 143 (49.0%) | 149 (51.0%) |
| Arts, Entertainment & Recreation | 40 (48.8%) | 42 (51.2%) |
| Accommodation & Food Services | 185 (48.9%) | 193 (51.1%) |
| Public Administration | 70 (100.0%) | 0 (0.0%) |
| Total | 1,420 (53.3%) | 1,244 (46.7%) |
Education in Noyack
School Enrollment in Noyack
The most common levels of schooling among the 952 students in Noyack are elementary school (358 | 37.6%), high school (265 | 27.8%), and college / undergraduate (106 | 11.1%).
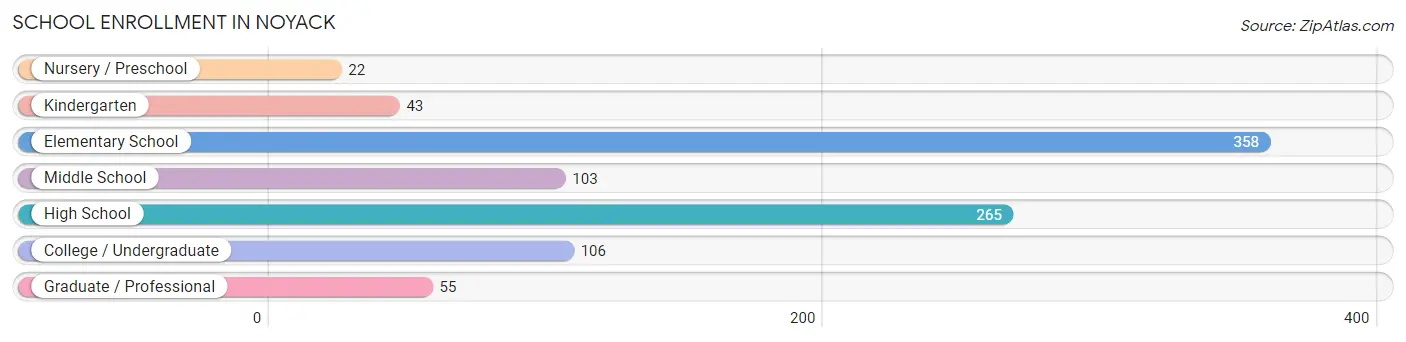
| School Level | # Students | % Students |
| Nursery / Preschool | 22 | 2.3% |
| Kindergarten | 43 | 4.5% |
| Elementary School | 358 | 37.6% |
| Middle School | 103 | 10.8% |
| High School | 265 | 27.8% |
| College / Undergraduate | 106 | 11.1% |
| Graduate / Professional | 55 | 5.8% |
| Total | 952 | 100.0% |
School Enrollment by Age by Funding Source in Noyack
Out of a total of 952 students who are enrolled in schools in Noyack, 175 (18.4%) attend a private institution, while the remaining 777 (81.6%) are enrolled in public schools. The age group of 20 to 24 year olds has the highest likelihood of being enrolled in private schools, with 11 (100.0% in the age bracket) enrolled. Conversely, the age group of 25 to 34 year olds has the lowest likelihood of being enrolled in a private school, with 44 (100.0% in the age bracket) attending a public institution.
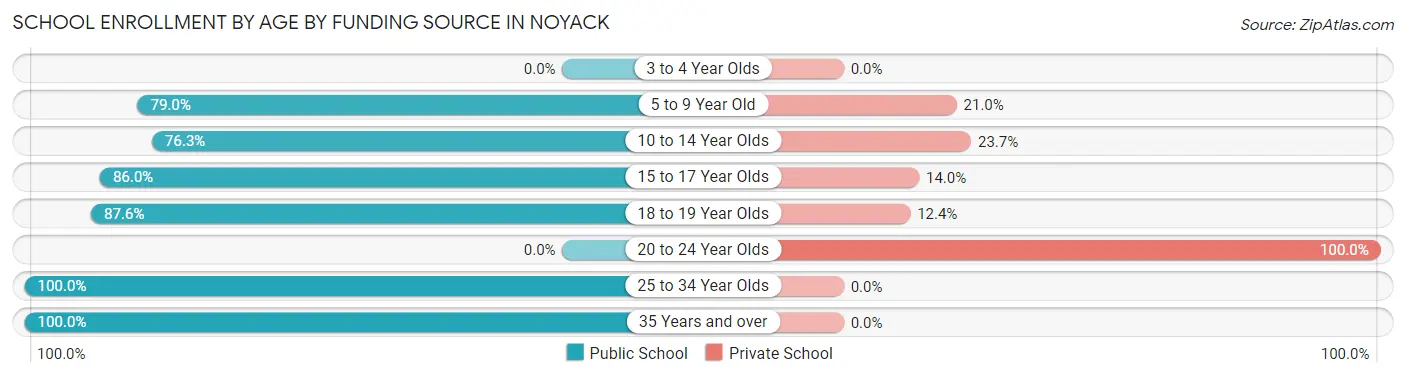
| Age Bracket | Public School | Private School |
| 3 to 4 Year Olds | 0 (0.0%) | 0 (0.0%) |
| 5 to 9 Year Old | 334 (79.0%) | 89 (21.0%) |
| 10 to 14 Year Olds | 119 (76.3%) | 37 (23.7%) |
| 15 to 17 Year Olds | 147 (86.0%) | 24 (14.0%) |
| 18 to 19 Year Olds | 99 (87.6%) | 14 (12.4%) |
| 20 to 24 Year Olds | 0 (0.0%) | 11 (100.0%) |
| 25 to 34 Year Olds | 44 (100.0%) | 0 (0.0%) |
| 35 Years and over | 34 (100.0%) | 0 (0.0%) |
| Total | 777 (81.6%) | 175 (18.4%) |
Educational Attainment by Field of Study in Noyack
Business (342 | 18.4%), literature & languages (260 | 14.0%), science & technology (229 | 12.3%), education (221 | 11.9%), and social sciences (149 | 8.0%) are the most common fields of study among 1,856 individuals in Noyack who have obtained a bachelor's degree or higher.
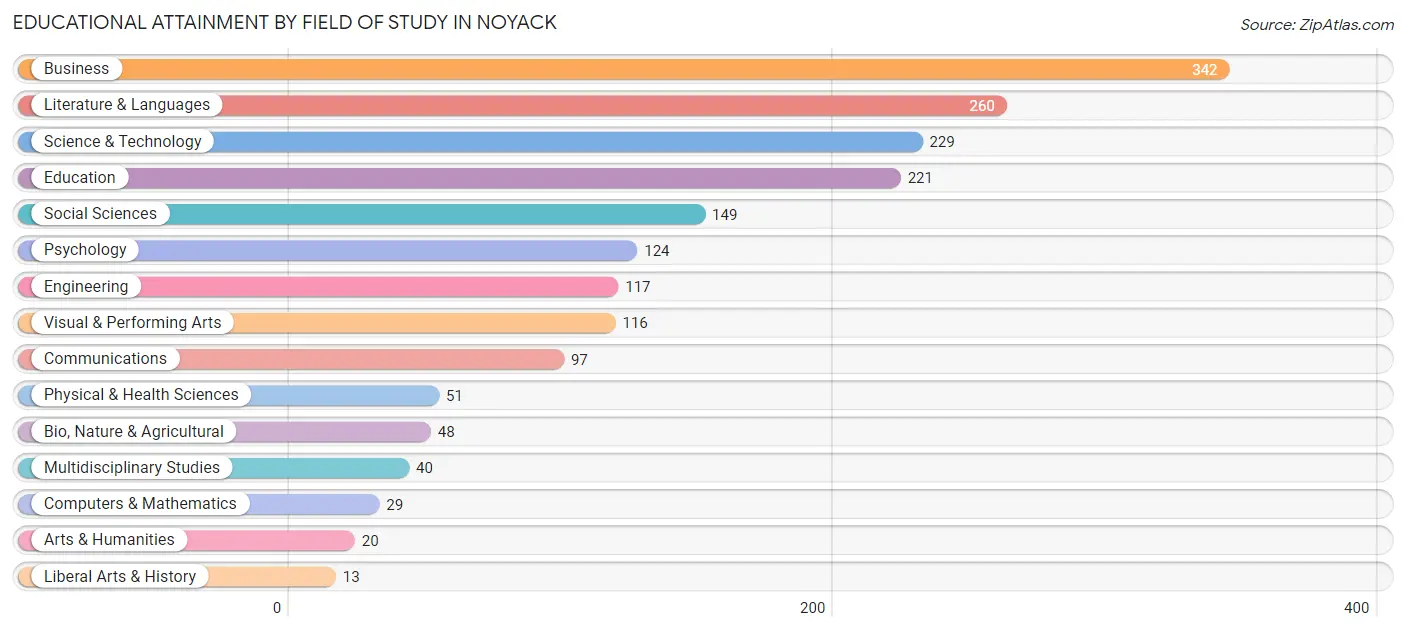
| Field of Study | # Graduates | % Graduates |
| Computers & Mathematics | 29 | 1.6% |
| Bio, Nature & Agricultural | 48 | 2.6% |
| Physical & Health Sciences | 51 | 2.8% |
| Psychology | 124 | 6.7% |
| Social Sciences | 149 | 8.0% |
| Engineering | 117 | 6.3% |
| Multidisciplinary Studies | 40 | 2.2% |
| Science & Technology | 229 | 12.3% |
| Business | 342 | 18.4% |
| Education | 221 | 11.9% |
| Literature & Languages | 260 | 14.0% |
| Liberal Arts & History | 13 | 0.7% |
| Visual & Performing Arts | 116 | 6.2% |
| Communications | 97 | 5.2% |
| Arts & Humanities | 20 | 1.1% |
| Total | 1,856 | 100.0% |
Transportation & Commute in Noyack
Vehicle Availability by Sex in Noyack
The most prevalent vehicle ownership categories in Noyack are males with 2 vehicles (623, accounting for 43.9%) and females with 2 vehicles (604, making up 54.4%).
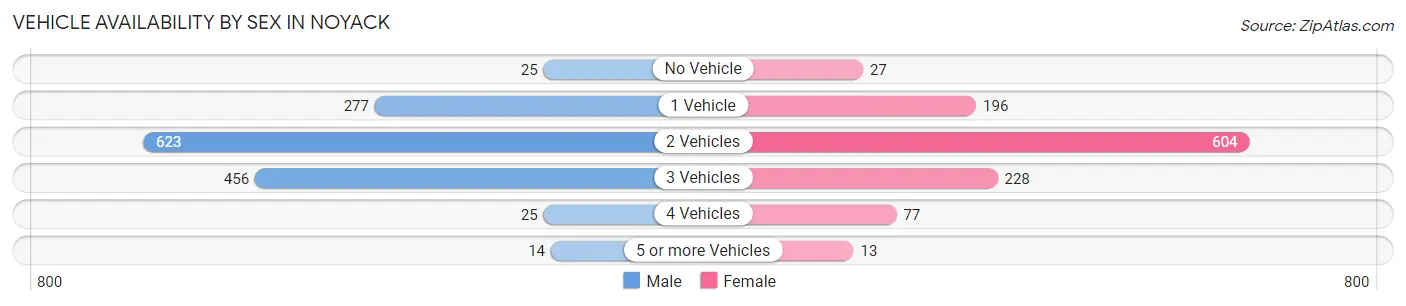
| Vehicles Available | Male | Female |
| No Vehicle | 25 (1.8%) | 27 (2.4%) |
| 1 Vehicle | 277 (19.5%) | 196 (17.1%) |
| 2 Vehicles | 623 (43.9%) | 604 (52.7%) |
| 3 Vehicles | 456 (32.1%) | 228 (19.9%) |
| 4 Vehicles | 25 (1.8%) | 77 (6.7%) |
| 5 or more Vehicles | 14 (1.0%) | 13 (1.1%) |
| Total | 1,420 (100.0%) | 1,145 (100.0%) |
Commute Time in Noyack
The most frequently occuring commute durations in Noyack are 5 to 9 minutes (583 commuters, 25.6%), 15 to 19 minutes (380 commuters, 16.7%), and 10 to 14 minutes (296 commuters, 13.0%).
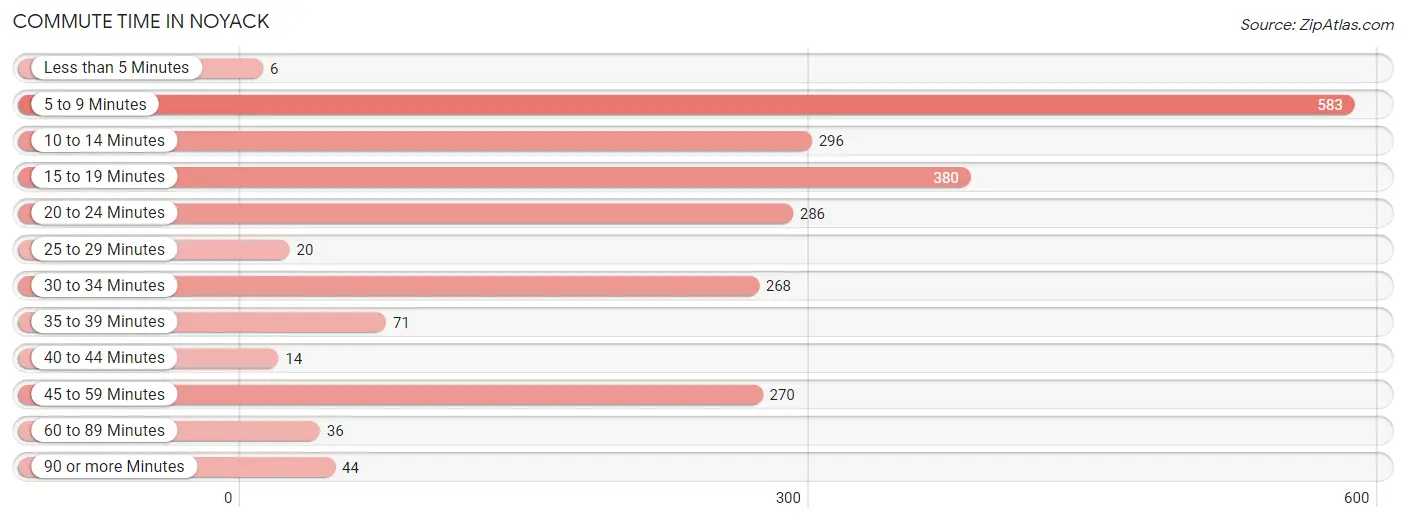
| Commute Time | # Commuters | % Commuters |
| Less than 5 Minutes | 6 | 0.3% |
| 5 to 9 Minutes | 583 | 25.6% |
| 10 to 14 Minutes | 296 | 13.0% |
| 15 to 19 Minutes | 380 | 16.7% |
| 20 to 24 Minutes | 286 | 12.6% |
| 25 to 29 Minutes | 20 | 0.9% |
| 30 to 34 Minutes | 268 | 11.8% |
| 35 to 39 Minutes | 71 | 3.1% |
| 40 to 44 Minutes | 14 | 0.6% |
| 45 to 59 Minutes | 270 | 11.9% |
| 60 to 89 Minutes | 36 | 1.6% |
| 90 or more Minutes | 44 | 1.9% |
Commute Time by Sex in Noyack
The most common commute times in Noyack are 5 to 9 minutes (341 commuters, 25.9%) for males and 5 to 9 minutes (242 commuters, 25.3%) for females.
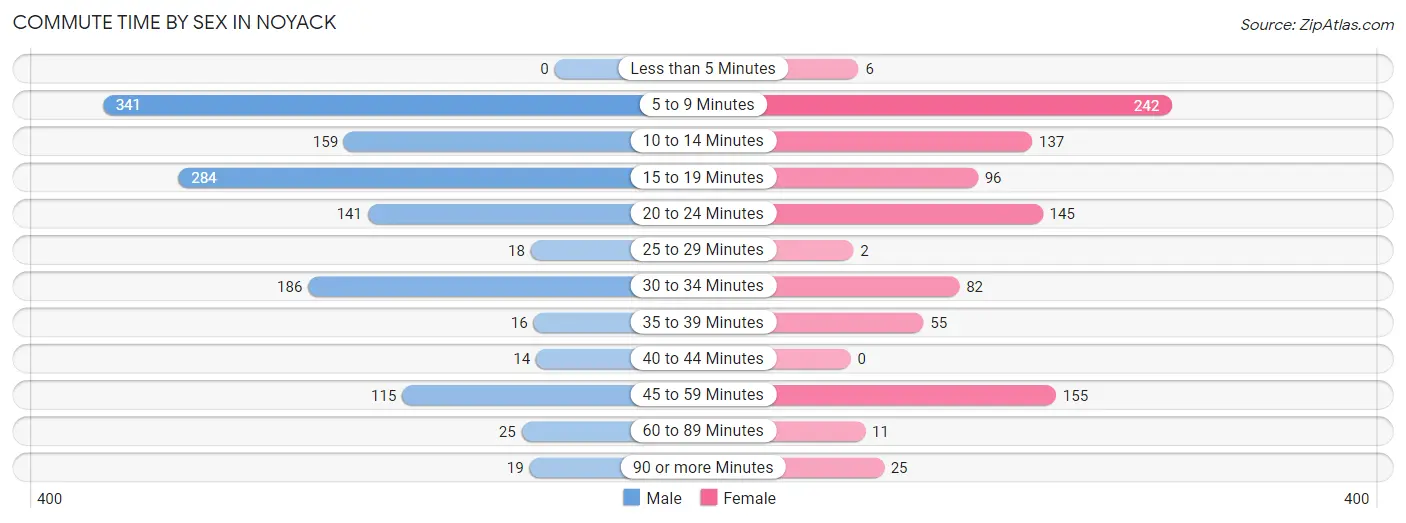
| Commute Time | Male | Female |
| Less than 5 Minutes | 0 (0.0%) | 6 (0.6%) |
| 5 to 9 Minutes | 341 (25.9%) | 242 (25.3%) |
| 10 to 14 Minutes | 159 (12.1%) | 137 (14.3%) |
| 15 to 19 Minutes | 284 (21.5%) | 96 (10.0%) |
| 20 to 24 Minutes | 141 (10.7%) | 145 (15.2%) |
| 25 to 29 Minutes | 18 (1.4%) | 2 (0.2%) |
| 30 to 34 Minutes | 186 (14.1%) | 82 (8.6%) |
| 35 to 39 Minutes | 16 (1.2%) | 55 (5.8%) |
| 40 to 44 Minutes | 14 (1.1%) | 0 (0.0%) |
| 45 to 59 Minutes | 115 (8.7%) | 155 (16.2%) |
| 60 to 89 Minutes | 25 (1.9%) | 11 (1.1%) |
| 90 or more Minutes | 19 (1.4%) | 25 (2.6%) |
Time of Departure to Work by Sex in Noyack
The most frequent times of departure to work in Noyack are 8:30 AM to 8:59 AM (395, 30.0%) for males and 10:00 AM to 10:59 AM (226, 23.6%) for females.
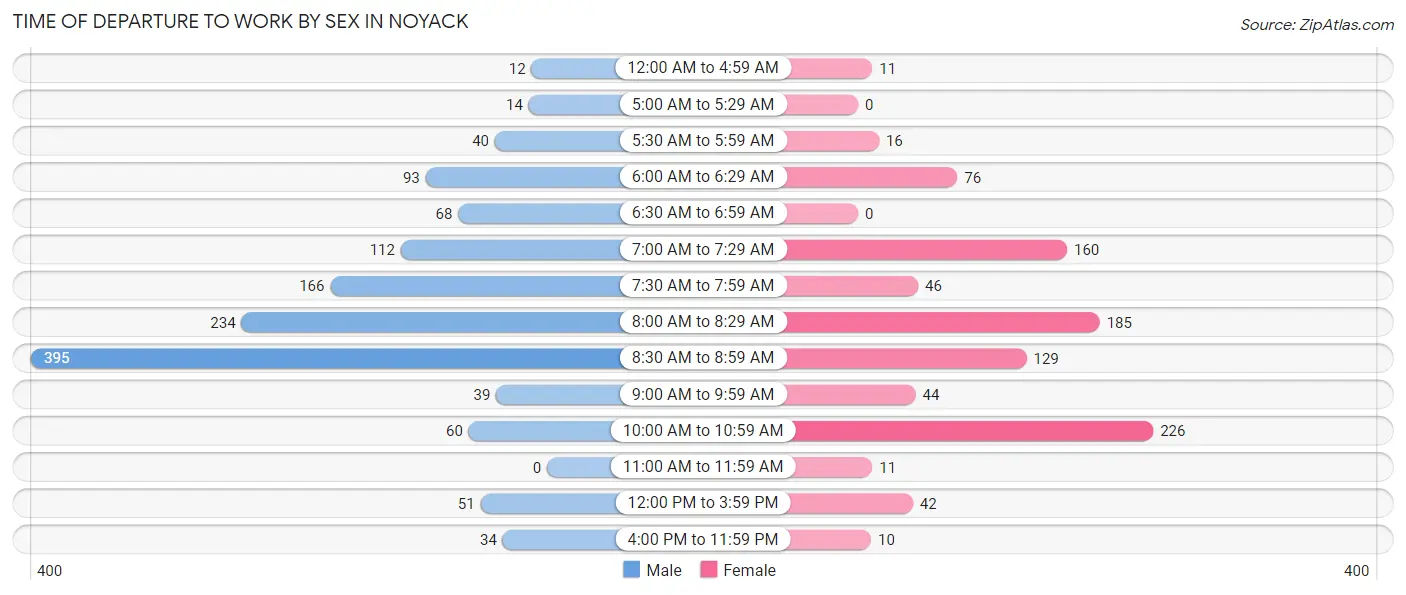
| Time of Departure | Male | Female |
| 12:00 AM to 4:59 AM | 12 (0.9%) | 11 (1.1%) |
| 5:00 AM to 5:29 AM | 14 (1.1%) | 0 (0.0%) |
| 5:30 AM to 5:59 AM | 40 (3.0%) | 16 (1.7%) |
| 6:00 AM to 6:29 AM | 93 (7.1%) | 76 (8.0%) |
| 6:30 AM to 6:59 AM | 68 (5.2%) | 0 (0.0%) |
| 7:00 AM to 7:29 AM | 112 (8.5%) | 160 (16.7%) |
| 7:30 AM to 7:59 AM | 166 (12.6%) | 46 (4.8%) |
| 8:00 AM to 8:29 AM | 234 (17.7%) | 185 (19.4%) |
| 8:30 AM to 8:59 AM | 395 (30.0%) | 129 (13.5%) |
| 9:00 AM to 9:59 AM | 39 (3.0%) | 44 (4.6%) |
| 10:00 AM to 10:59 AM | 60 (4.5%) | 226 (23.6%) |
| 11:00 AM to 11:59 AM | 0 (0.0%) | 11 (1.1%) |
| 12:00 PM to 3:59 PM | 51 (3.9%) | 42 (4.4%) |
| 4:00 PM to 11:59 PM | 34 (2.6%) | 10 (1.1%) |
| Total | 1,318 (100.0%) | 956 (100.0%) |
Housing Occupancy in Noyack
Occupancy by Ownership in Noyack
Of the total 1,995 dwellings in Noyack, owner-occupied units account for 1,672 (83.8%), while renter-occupied units make up 323 (16.2%).
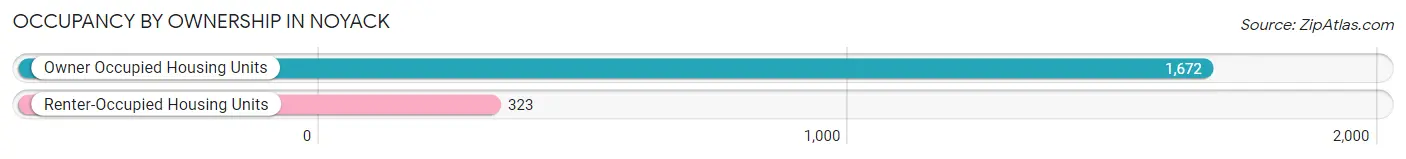
| Occupancy | # Housing Units | % Housing Units |
| Owner Occupied Housing Units | 1,672 | 83.8% |
| Renter-Occupied Housing Units | 323 | 16.2% |
| Total Occupied Housing Units | 1,995 | 100.0% |
Occupancy by Household Size in Noyack
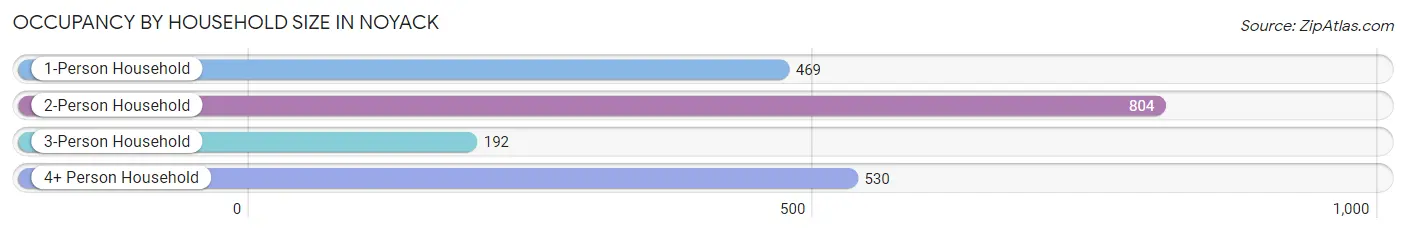
| Household Size | # Housing Units | % Housing Units |
| 1-Person Household | 469 | 23.5% |
| 2-Person Household | 804 | 40.3% |
| 3-Person Household | 192 | 9.6% |
| 4+ Person Household | 530 | 26.6% |
| Total Housing Units | 1,995 | 100.0% |
Occupancy by Ownership by Household Size in Noyack
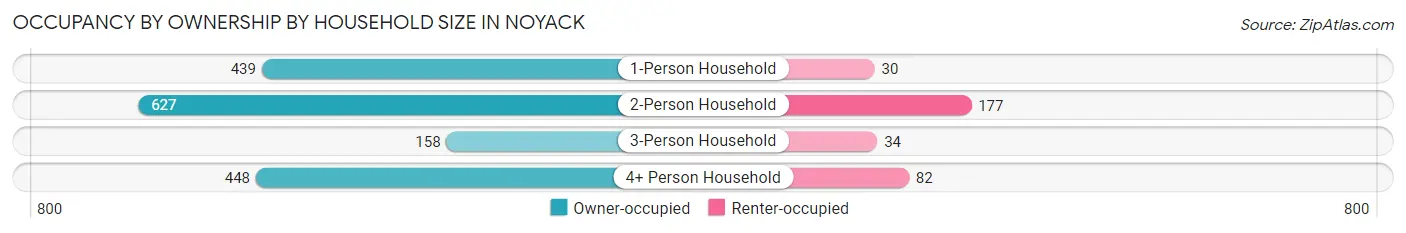
| Household Size | Owner-occupied | Renter-occupied |
| 1-Person Household | 439 (93.6%) | 30 (6.4%) |
| 2-Person Household | 627 (78.0%) | 177 (22.0%) |
| 3-Person Household | 158 (82.3%) | 34 (17.7%) |
| 4+ Person Household | 448 (84.5%) | 82 (15.5%) |
| Total Housing Units | 1,672 (83.8%) | 323 (16.2%) |
Occupancy by Educational Attainment in Noyack
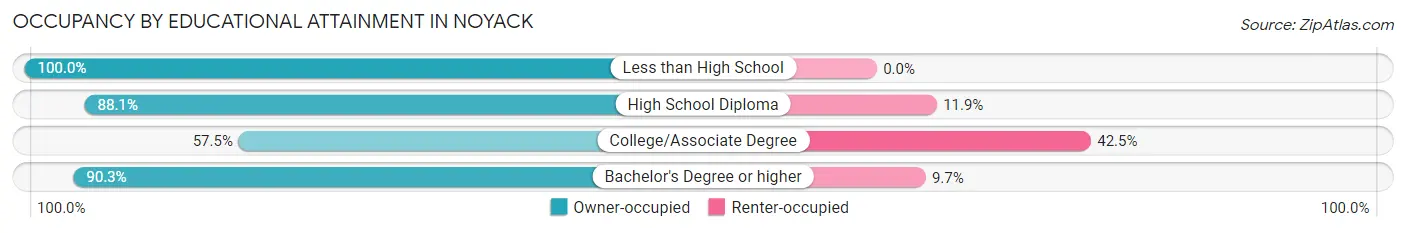
| Household Size | Owner-occupied | Renter-occupied |
| Less than High School | 195 (100.0%) | 0 (0.0%) |
| High School Diploma | 296 (88.1%) | 40 (11.9%) |
| College/Associate Degree | 248 (57.5%) | 183 (42.5%) |
| Bachelor's Degree or higher | 933 (90.3%) | 100 (9.7%) |
Occupancy by Age of Householder in Noyack
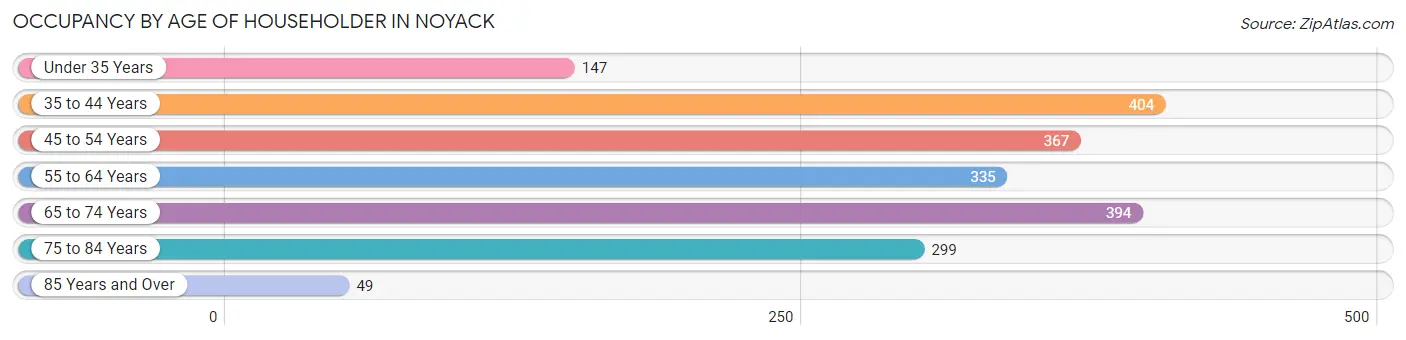
| Age Bracket | # Households | % Households |
| Under 35 Years | 147 | 7.4% |
| 35 to 44 Years | 404 | 20.3% |
| 45 to 54 Years | 367 | 18.4% |
| 55 to 64 Years | 335 | 16.8% |
| 65 to 74 Years | 394 | 19.8% |
| 75 to 84 Years | 299 | 15.0% |
| 85 Years and Over | 49 | 2.5% |
| Total | 1,995 | 100.0% |
Housing Finances in Noyack
Median Income by Occupancy in Noyack
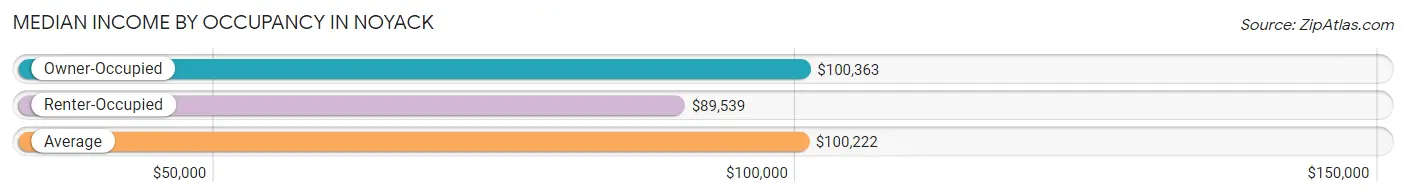
| Occupancy Type | # Households | Median Income |
| Owner-Occupied | 1,672 (83.8%) | $100,363 |
| Renter-Occupied | 323 (16.2%) | $89,539 |
| Average | 1,995 (100.0%) | $100,222 |
Occupancy by Householder Income Bracket in Noyack
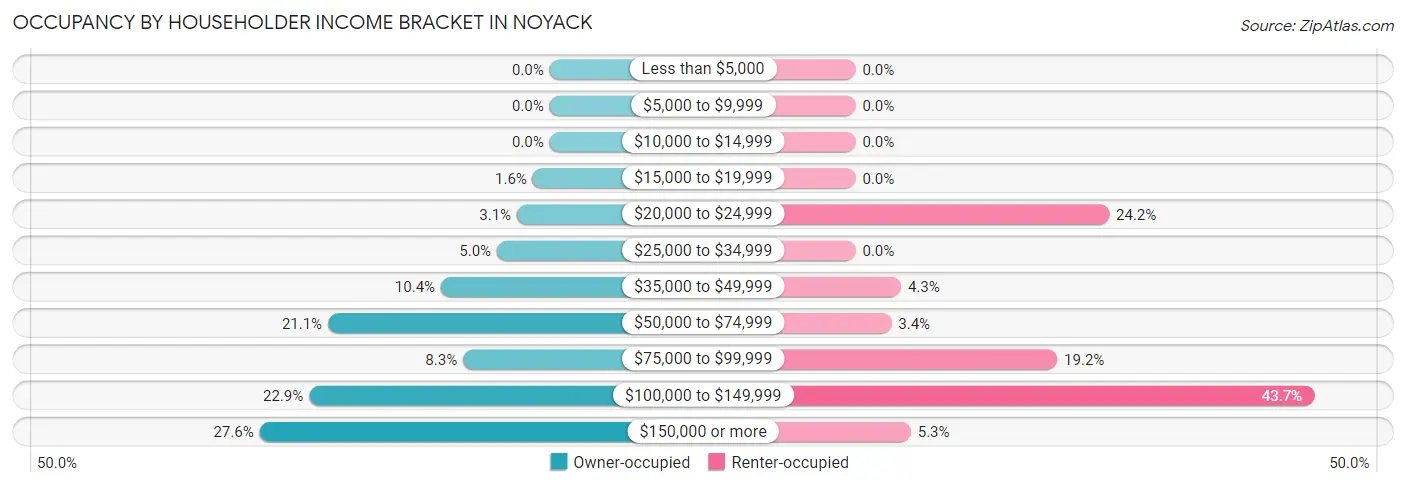
| Income Bracket | Owner-occupied | Renter-occupied |
| Less than $5,000 | 0 (0.0%) | 0 (0.0%) |
| $5,000 to $9,999 | 0 (0.0%) | 0 (0.0%) |
| $10,000 to $14,999 | 0 (0.0%) | 0 (0.0%) |
| $15,000 to $19,999 | 27 (1.6%) | 0 (0.0%) |
| $20,000 to $24,999 | 52 (3.1%) | 78 (24.1%) |
| $25,000 to $34,999 | 84 (5.0%) | 0 (0.0%) |
| $35,000 to $49,999 | 173 (10.3%) | 14 (4.3%) |
| $50,000 to $74,999 | 353 (21.1%) | 11 (3.4%) |
| $75,000 to $99,999 | 138 (8.3%) | 62 (19.2%) |
| $100,000 to $149,999 | 383 (22.9%) | 141 (43.6%) |
| $150,000 or more | 462 (27.6%) | 17 (5.3%) |
| Total | 1,672 (100.0%) | 323 (100.0%) |
Monthly Housing Cost Tiers in Noyack
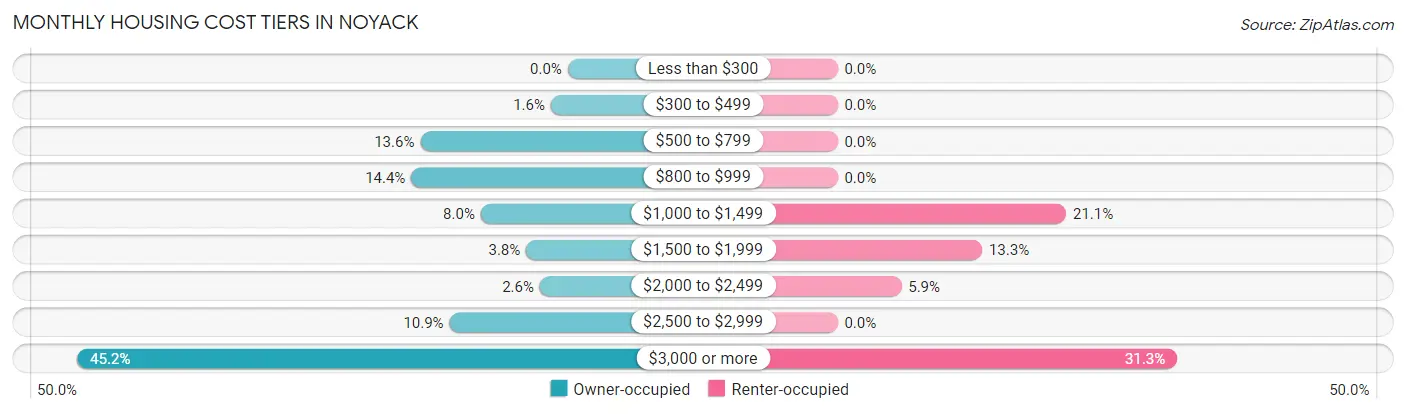
| Monthly Cost | Owner-occupied | Renter-occupied |
| Less than $300 | 0 (0.0%) | 0 (0.0%) |
| $300 to $499 | 26 (1.6%) | 0 (0.0%) |
| $500 to $799 | 227 (13.6%) | 0 (0.0%) |
| $800 to $999 | 241 (14.4%) | 0 (0.0%) |
| $1,000 to $1,499 | 134 (8.0%) | 68 (21.0%) |
| $1,500 to $1,999 | 64 (3.8%) | 43 (13.3%) |
| $2,000 to $2,499 | 43 (2.6%) | 19 (5.9%) |
| $2,500 to $2,999 | 182 (10.9%) | 0 (0.0%) |
| $3,000 or more | 755 (45.2%) | 101 (31.3%) |
| Total | 1,672 (100.0%) | 323 (100.0%) |
Physical Housing Characteristics in Noyack
Housing Structures in Noyack
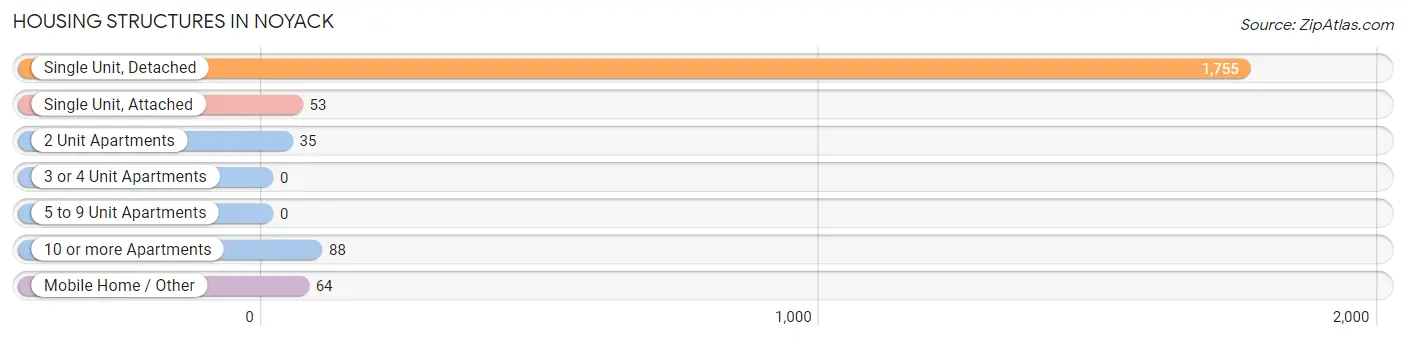
| Structure Type | # Housing Units | % Housing Units |
| Single Unit, Detached | 1,755 | 88.0% |
| Single Unit, Attached | 53 | 2.7% |
| 2 Unit Apartments | 35 | 1.8% |
| 3 or 4 Unit Apartments | 0 | 0.0% |
| 5 to 9 Unit Apartments | 0 | 0.0% |
| 10 or more Apartments | 88 | 4.4% |
| Mobile Home / Other | 64 | 3.2% |
| Total | 1,995 | 100.0% |
Housing Structures by Occupancy in Noyack
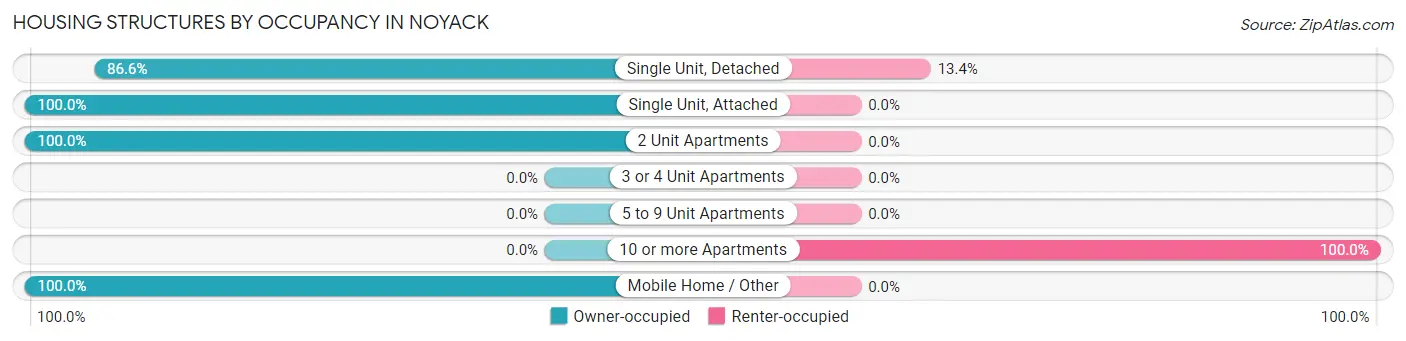
| Structure Type | Owner-occupied | Renter-occupied |
| Single Unit, Detached | 1,520 (86.6%) | 235 (13.4%) |
| Single Unit, Attached | 53 (100.0%) | 0 (0.0%) |
| 2 Unit Apartments | 35 (100.0%) | 0 (0.0%) |
| 3 or 4 Unit Apartments | 0 (0.0%) | 0 (0.0%) |
| 5 to 9 Unit Apartments | 0 (0.0%) | 0 (0.0%) |
| 10 or more Apartments | 0 (0.0%) | 88 (100.0%) |
| Mobile Home / Other | 64 (100.0%) | 0 (0.0%) |
| Total | 1,672 (83.8%) | 323 (16.2%) |
Housing Structures by Number of Rooms in Noyack
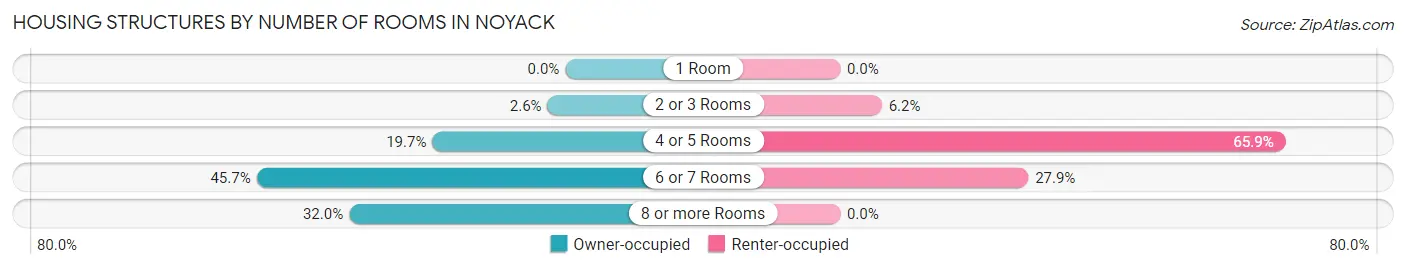
| Number of Rooms | Owner-occupied | Renter-occupied |
| 1 Room | 0 (0.0%) | 0 (0.0%) |
| 2 or 3 Rooms | 44 (2.6%) | 20 (6.2%) |
| 4 or 5 Rooms | 329 (19.7%) | 213 (65.9%) |
| 6 or 7 Rooms | 764 (45.7%) | 90 (27.9%) |
| 8 or more Rooms | 535 (32.0%) | 0 (0.0%) |
| Total | 1,672 (100.0%) | 323 (100.0%) |
Housing Structure by Heating Type in Noyack
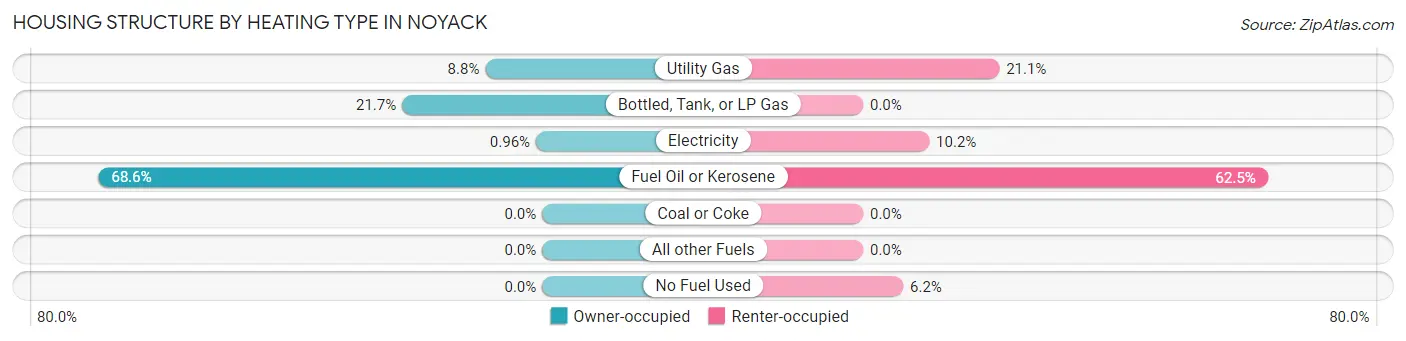
| Heating Type | Owner-occupied | Renter-occupied |
| Utility Gas | 147 (8.8%) | 68 (21.0%) |
| Bottled, Tank, or LP Gas | 362 (21.6%) | 0 (0.0%) |
| Electricity | 16 (1.0%) | 33 (10.2%) |
| Fuel Oil or Kerosene | 1,147 (68.6%) | 202 (62.5%) |
| Coal or Coke | 0 (0.0%) | 0 (0.0%) |
| All other Fuels | 0 (0.0%) | 0 (0.0%) |
| No Fuel Used | 0 (0.0%) | 20 (6.2%) |
| Total | 1,672 (100.0%) | 323 (100.0%) |
Household Vehicle Usage in Noyack
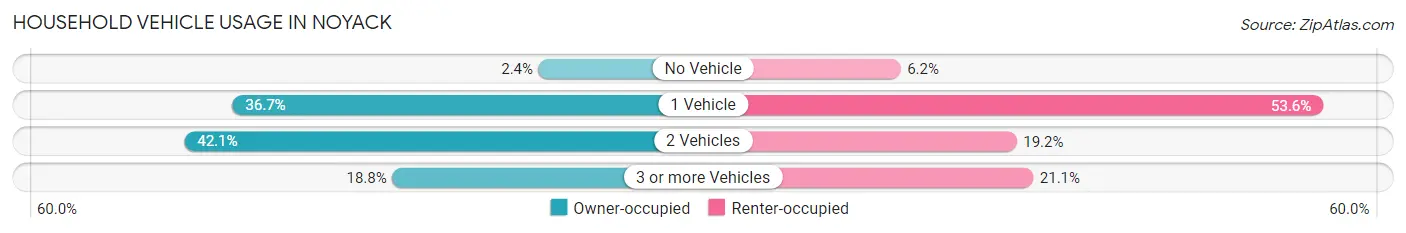
| Vehicles per Household | Owner-occupied | Renter-occupied |
| No Vehicle | 40 (2.4%) | 20 (6.2%) |
| 1 Vehicle | 614 (36.7%) | 173 (53.6%) |
| 2 Vehicles | 704 (42.1%) | 62 (19.2%) |
| 3 or more Vehicles | 314 (18.8%) | 68 (21.0%) |
| Total | 1,672 (100.0%) | 323 (100.0%) |
Real Estate & Mortgages in Noyack
Real Estate and Mortgage Overview in Noyack
| Characteristic | Without Mortgage | With Mortgage |
| Housing Units | 652 | 1,020 |
| Median Property Value | $928,800 | $888,100 |
| Median Household Income | $73,542 | $312 |
| Monthly Housing Costs | $860 | $755 |
| Real Estate Taxes | $4,927 | $13 |
Property Value by Mortgage Status in Noyack
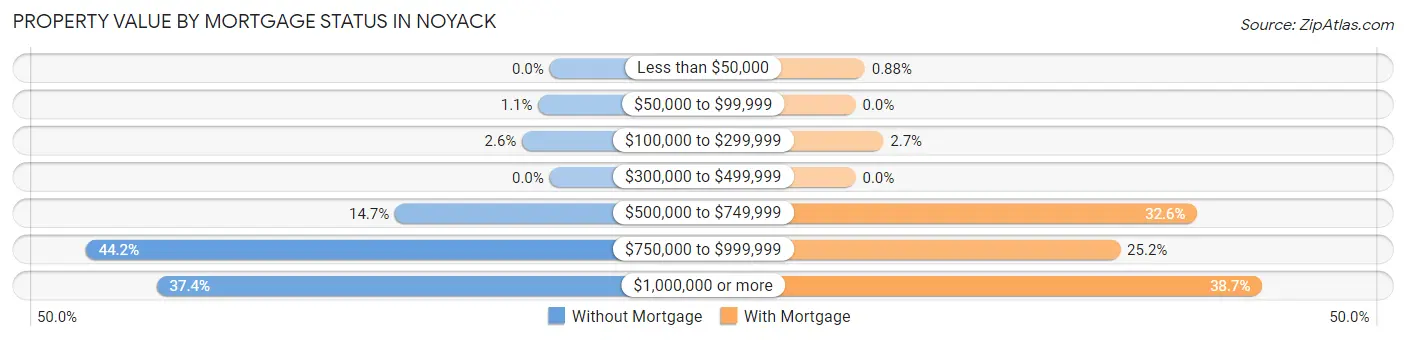
| Property Value | Without Mortgage | With Mortgage |
| Less than $50,000 | 0 (0.0%) | 9 (0.9%) |
| $50,000 to $99,999 | 7 (1.1%) | 0 (0.0%) |
| $100,000 to $299,999 | 17 (2.6%) | 27 (2.6%) |
| $300,000 to $499,999 | 0 (0.0%) | 0 (0.0%) |
| $500,000 to $749,999 | 96 (14.7%) | 332 (32.6%) |
| $750,000 to $999,999 | 288 (44.2%) | 257 (25.2%) |
| $1,000,000 or more | 244 (37.4%) | 395 (38.7%) |
| Total | 652 (100.0%) | 1,020 (100.0%) |
Household Income by Mortgage Status in Noyack
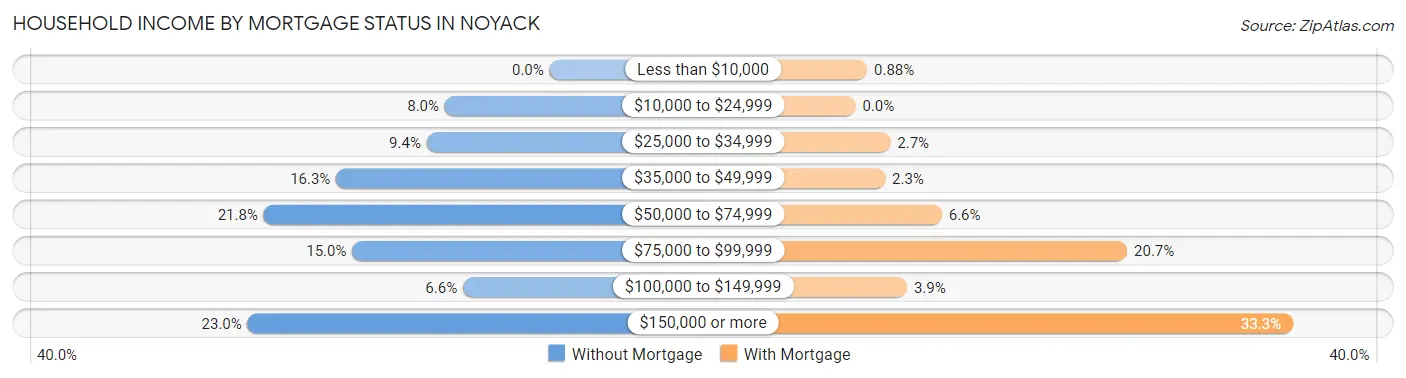
| Household Income | Without Mortgage | With Mortgage |
| Less than $10,000 | 0 (0.0%) | 9 (0.9%) |
| $10,000 to $24,999 | 52 (8.0%) | 0 (0.0%) |
| $25,000 to $34,999 | 61 (9.4%) | 27 (2.6%) |
| $35,000 to $49,999 | 106 (16.3%) | 23 (2.2%) |
| $50,000 to $74,999 | 142 (21.8%) | 67 (6.6%) |
| $75,000 to $99,999 | 98 (15.0%) | 211 (20.7%) |
| $100,000 to $149,999 | 43 (6.6%) | 40 (3.9%) |
| $150,000 or more | 150 (23.0%) | 340 (33.3%) |
| Total | 652 (100.0%) | 1,020 (100.0%) |
Property Value to Household Income Ratio in Noyack
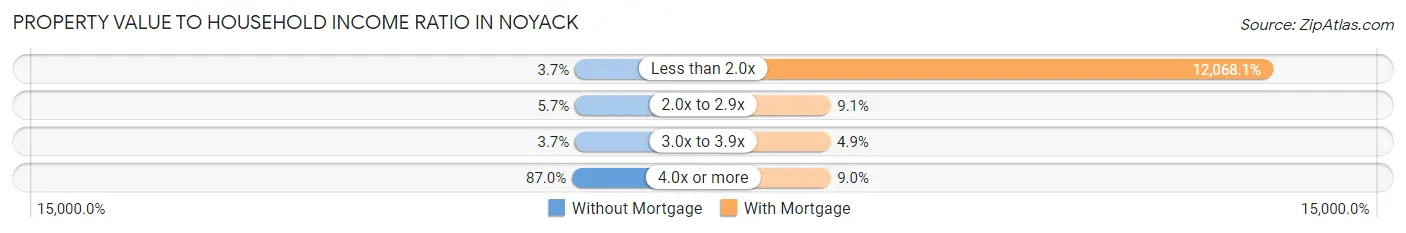
| Value-to-Income Ratio | Without Mortgage | With Mortgage |
| Less than 2.0x | 24 (3.7%) | 123,095 (12,068.1%) |
| 2.0x to 2.9x | 37 (5.7%) | 93 (9.1%) |
| 3.0x to 3.9x | 24 (3.7%) | 50 (4.9%) |
| 4.0x or more | 567 (87.0%) | 92 (9.0%) |
| Total | 652 (100.0%) | 1,020 (100.0%) |
Real Estate Taxes by Mortgage Status in Noyack
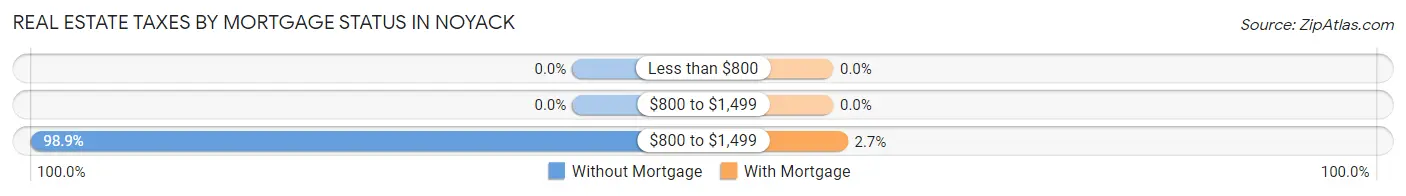
| Property Taxes | Without Mortgage | With Mortgage |
| Less than $800 | 0 (0.0%) | 0 (0.0%) |
| $800 to $1,499 | 0 (0.0%) | 0 (0.0%) |
| $800 to $1,499 | 645 (98.9%) | 27 (2.6%) |
| Total | 652 (100.0%) | 1,020 (100.0%) |
Health & Disability in Noyack
Health Insurance Coverage by Age in Noyack
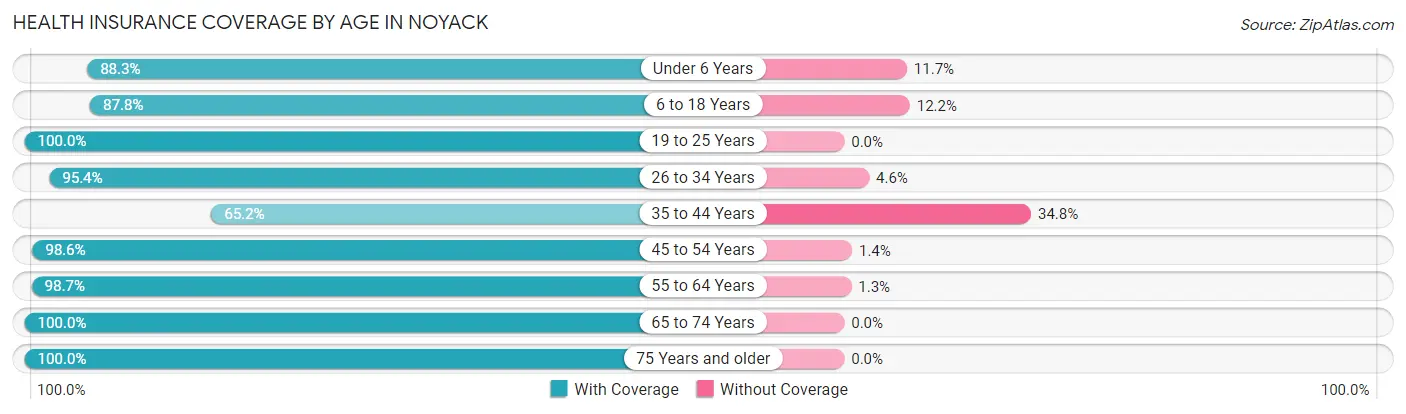
| Age Bracket | With Coverage | Without Coverage |
| Under 6 Years | 242 (88.3%) | 32 (11.7%) |
| 6 to 18 Years | 640 (87.8%) | 89 (12.2%) |
| 19 to 25 Years | 272 (100.0%) | 0 (0.0%) |
| 26 to 34 Years | 310 (95.4%) | 15 (4.6%) |
| 35 to 44 Years | 449 (65.2%) | 240 (34.8%) |
| 45 to 54 Years | 684 (98.6%) | 10 (1.4%) |
| 55 to 64 Years | 678 (98.7%) | 9 (1.3%) |
| 65 to 74 Years | 615 (100.0%) | 0 (0.0%) |
| 75 Years and older | 512 (100.0%) | 0 (0.0%) |
| Total | 4,402 (91.8%) | 395 (8.2%) |
Health Insurance Coverage by Citizenship Status in Noyack
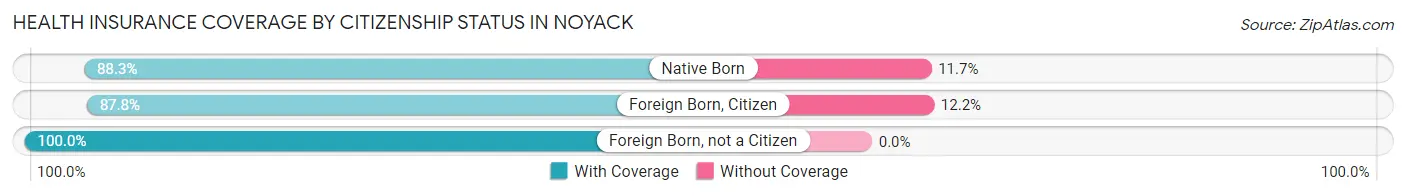
| Citizenship Status | With Coverage | Without Coverage |
| Native Born | 242 (88.3%) | 32 (11.7%) |
| Foreign Born, Citizen | 640 (87.8%) | 89 (12.2%) |
| Foreign Born, not a Citizen | 272 (100.0%) | 0 (0.0%) |
Health Insurance Coverage by Household Income in Noyack
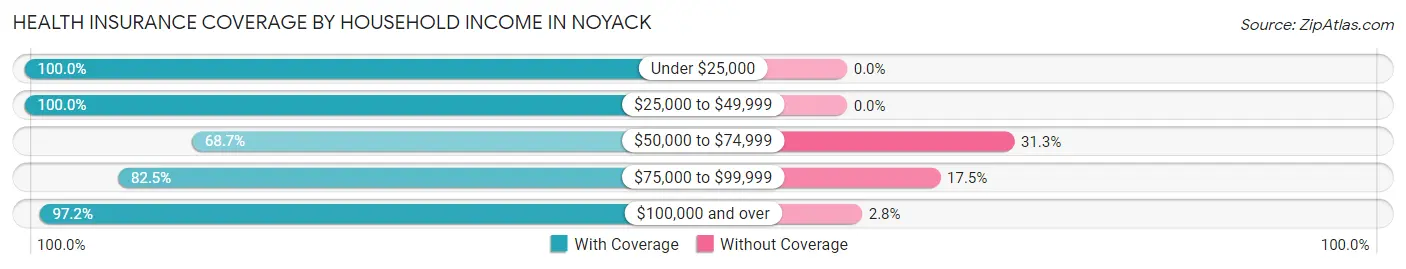
| Household Income | With Coverage | Without Coverage |
| Under $25,000 | 273 (100.0%) | 0 (0.0%) |
| $25,000 to $49,999 | 582 (100.0%) | 0 (0.0%) |
| $50,000 to $74,999 | 539 (68.7%) | 246 (31.3%) |
| $75,000 to $99,999 | 340 (82.5%) | 72 (17.5%) |
| $100,000 and over | 2,668 (97.2%) | 77 (2.8%) |
Public vs Private Health Insurance Coverage by Age in Noyack
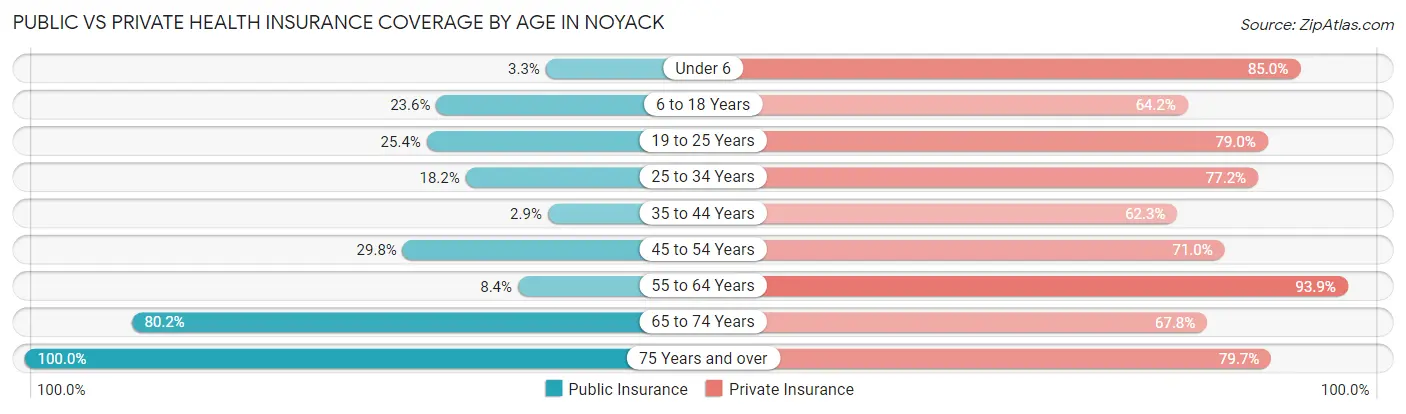
| Age Bracket | Public Insurance | Private Insurance |
| Under 6 | 9 (3.3%) | 233 (85.0%) |
| 6 to 18 Years | 172 (23.6%) | 468 (64.2%) |
| 19 to 25 Years | 69 (25.4%) | 215 (79.0%) |
| 25 to 34 Years | 59 (18.1%) | 251 (77.2%) |
| 35 to 44 Years | 20 (2.9%) | 429 (62.3%) |
| 45 to 54 Years | 207 (29.8%) | 493 (71.0%) |
| 55 to 64 Years | 58 (8.4%) | 645 (93.9%) |
| 65 to 74 Years | 493 (80.2%) | 417 (67.8%) |
| 75 Years and over | 512 (100.0%) | 408 (79.7%) |
| Total | 1,599 (33.3%) | 3,559 (74.2%) |
Disability Status by Sex by Age in Noyack
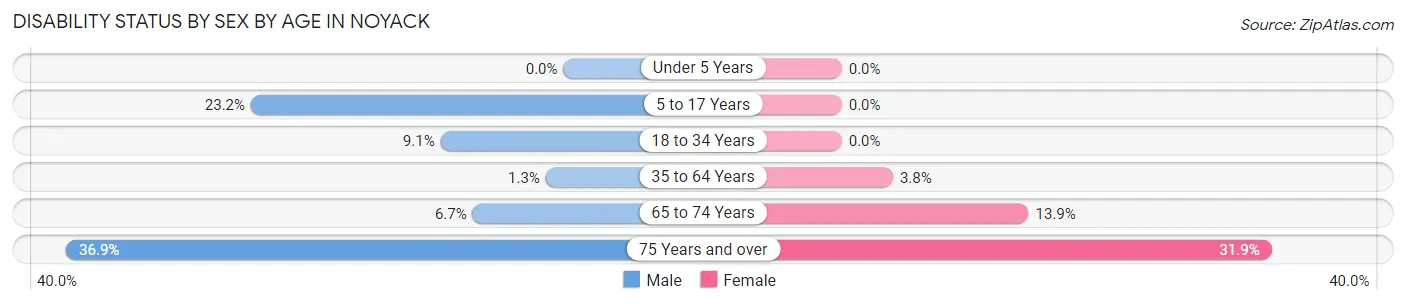
| Age Bracket | Male | Female |
| Under 5 Years | 0 (0.0%) | 0 (0.0%) |
| 5 to 17 Years | 74 (23.2%) | 0 (0.0%) |
| 18 to 34 Years | 25 (9.1%) | 0 (0.0%) |
| 35 to 64 Years | 13 (1.3%) | 41 (3.8%) |
| 65 to 74 Years | 23 (6.7%) | 38 (13.9%) |
| 75 Years and over | 86 (36.9%) | 89 (31.9%) |
Disability Class by Sex by Age in Noyack
Disability Class: Hearing Difficulty
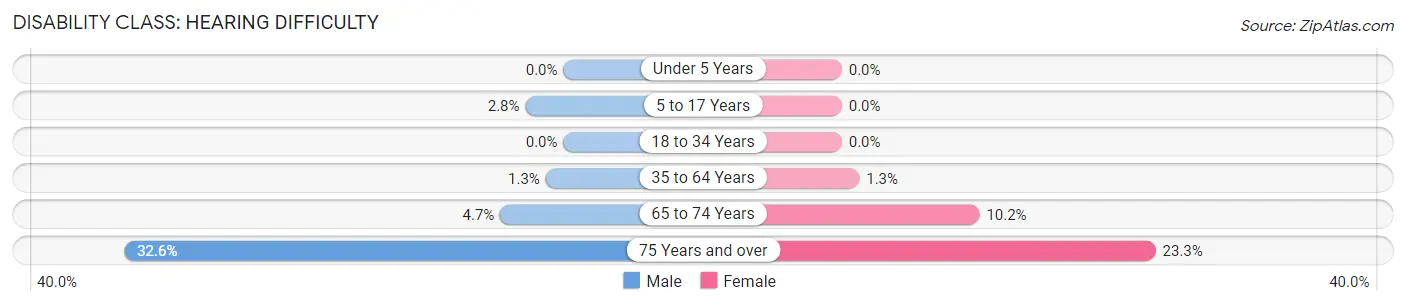
| Age Bracket | Male | Female |
| Under 5 Years | 0 (0.0%) | 0 (0.0%) |
| 5 to 17 Years | 9 (2.8%) | 0 (0.0%) |
| 18 to 34 Years | 0 (0.0%) | 0 (0.0%) |
| 35 to 64 Years | 13 (1.3%) | 14 (1.3%) |
| 65 to 74 Years | 16 (4.7%) | 28 (10.2%) |
| 75 Years and over | 76 (32.6%) | 65 (23.3%) |
Disability Class: Vision Difficulty
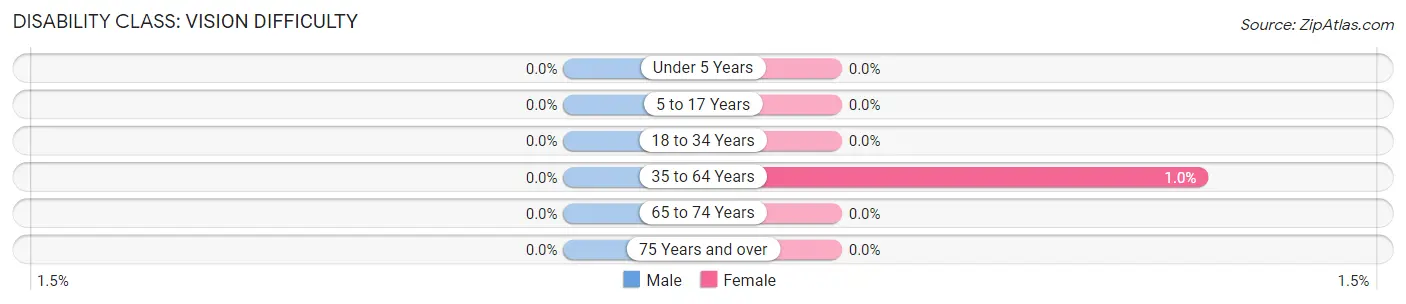
| Age Bracket | Male | Female |
| Under 5 Years | 0 (0.0%) | 0 (0.0%) |
| 5 to 17 Years | 0 (0.0%) | 0 (0.0%) |
| 18 to 34 Years | 0 (0.0%) | 0 (0.0%) |
| 35 to 64 Years | 0 (0.0%) | 11 (1.0%) |
| 65 to 74 Years | 0 (0.0%) | 0 (0.0%) |
| 75 Years and over | 0 (0.0%) | 0 (0.0%) |
Disability Class: Cognitive Difficulty
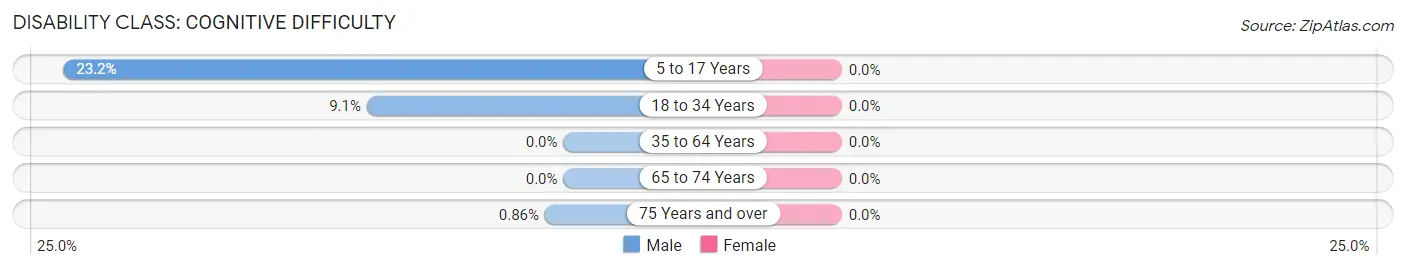
| Age Bracket | Male | Female |
| 5 to 17 Years | 74 (23.2%) | 0 (0.0%) |
| 18 to 34 Years | 25 (9.1%) | 0 (0.0%) |
| 35 to 64 Years | 0 (0.0%) | 0 (0.0%) |
| 65 to 74 Years | 0 (0.0%) | 0 (0.0%) |
| 75 Years and over | 2 (0.9%) | 0 (0.0%) |
Disability Class: Ambulatory Difficulty
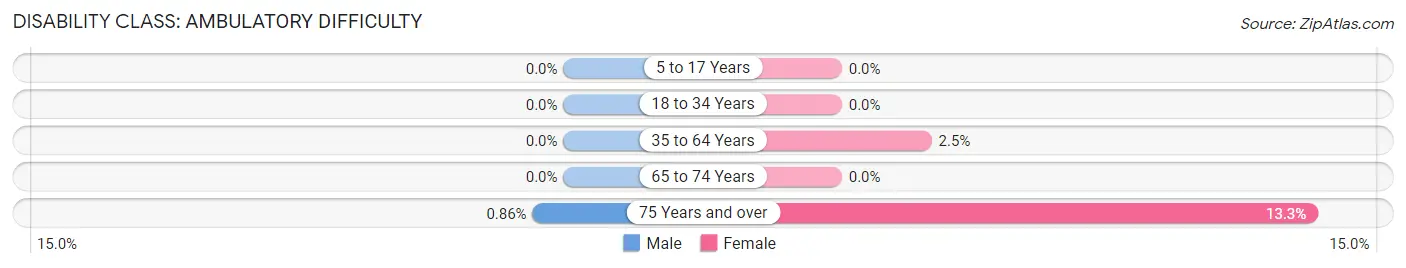
| Age Bracket | Male | Female |
| 5 to 17 Years | 0 (0.0%) | 0 (0.0%) |
| 18 to 34 Years | 0 (0.0%) | 0 (0.0%) |
| 35 to 64 Years | 0 (0.0%) | 27 (2.5%) |
| 65 to 74 Years | 0 (0.0%) | 0 (0.0%) |
| 75 Years and over | 2 (0.9%) | 37 (13.3%) |
Disability Class: Self-Care Difficulty
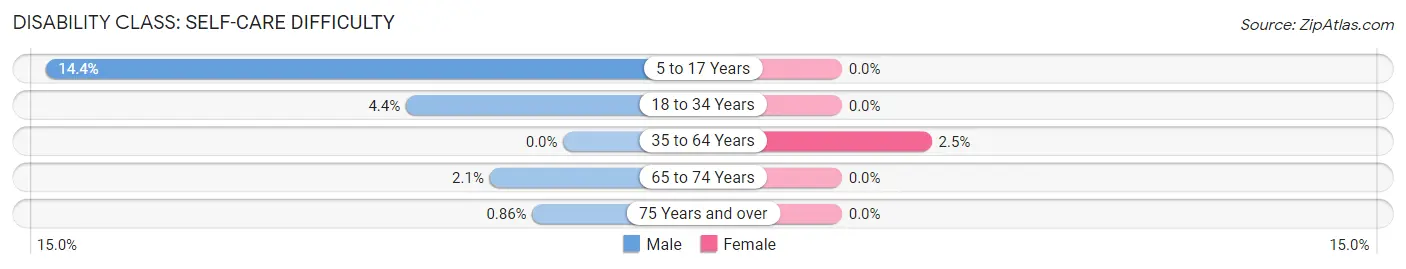
| Age Bracket | Male | Female |
| 5 to 17 Years | 46 (14.4%) | 0 (0.0%) |
| 18 to 34 Years | 12 (4.4%) | 0 (0.0%) |
| 35 to 64 Years | 0 (0.0%) | 27 (2.5%) |
| 65 to 74 Years | 7 (2.1%) | 0 (0.0%) |
| 75 Years and over | 2 (0.9%) | 0 (0.0%) |
Technology Access in Noyack
Computing Device Access in Noyack
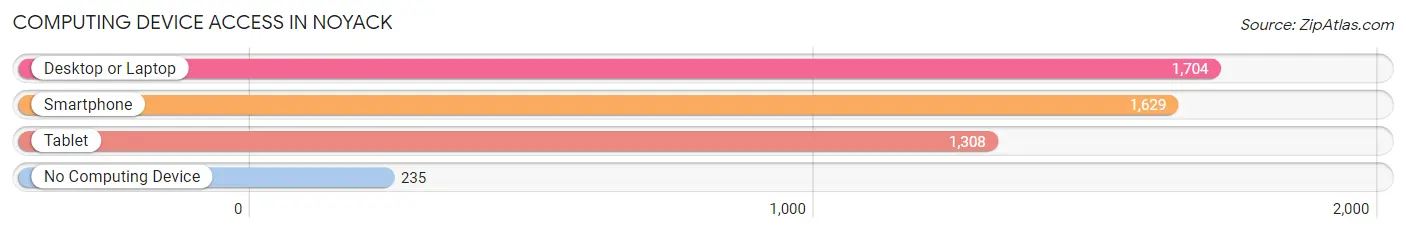
| Device Type | # Households | % Households |
| Desktop or Laptop | 1,704 | 85.4% |
| Smartphone | 1,629 | 81.7% |
| Tablet | 1,308 | 65.6% |
| No Computing Device | 235 | 11.8% |
| Total | 1,995 | 100.0% |
Internet Access in Noyack
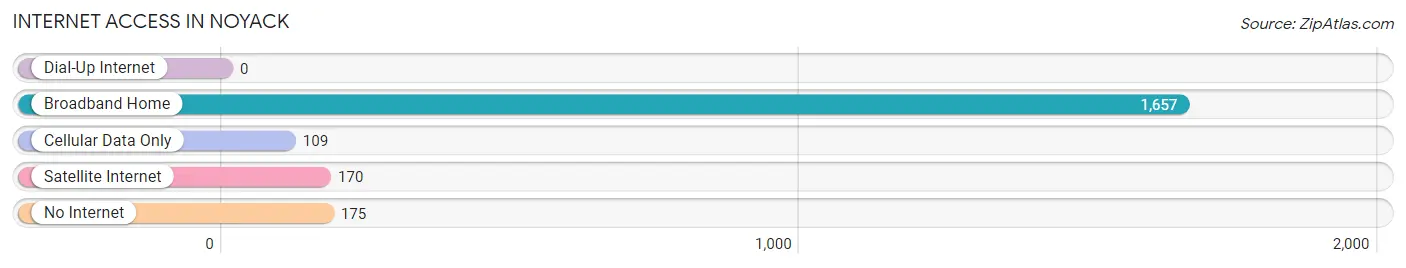
| Internet Type | # Households | % Households |
| Dial-Up Internet | 0 | 0.0% |
| Broadband Home | 1,657 | 83.1% |
| Cellular Data Only | 109 | 5.5% |
| Satellite Internet | 170 | 8.5% |
| No Internet | 175 | 8.8% |
| Total | 1,995 | 100.0% |
Noyack Summary
Noyack is a hamlet located in the Town of Southampton in Suffolk County, New York. It is situated on the eastern end of the South Fork of Long Island, approximately 80 miles east of New York City. The hamlet is bordered by the hamlets of North Sea to the west, Sag Harbor to the east, and Bridgehampton to the south. Noyack is a small, rural community with a population of approximately 1,500 people.
History
The area now known as Noyack was originally inhabited by the Shinnecock Native American tribe. The Shinnecock were a part of the Algonquian-speaking peoples who lived in the area for thousands of years before the arrival of European settlers. The first Europeans to settle in the area were Dutch and English settlers in the late 1600s. The hamlet was originally known as “Noyack”, which is derived from the Shinnecock word for “place of shells”.
In the late 1700s, the area was settled by farmers and fishermen. The hamlet was officially incorporated in 1872. During the late 1800s and early 1900s, Noyack was a popular summer destination for wealthy New Yorkers. The area was known for its beautiful beaches, fishing, and boating.
Geography
Noyack is located on the eastern end of the South Fork of Long Island. It is bordered by the hamlets of North Sea to the west, Sag Harbor to the east, and Bridgehampton to the south. The hamlet is situated on the Noyack Bay, which is part of the Peconic Bay. The bay is a popular destination for fishing, boating, and other recreational activities.
The hamlet is located in a rural area and is surrounded by farmland and woodlands. The area is known for its beautiful beaches, which are popular destinations for swimming, sunbathing, and other recreational activities.
Economy
The economy of Noyack is largely based on tourism and agriculture. The hamlet is home to several small businesses, including restaurants, shops, and galleries. The area is also known for its wineries, which produce a variety of wines.
The hamlet is also home to several farms, which produce a variety of fruits and vegetables. The area is also known for its seafood, which is harvested from the nearby Peconic Bay.
Demographics
As of the 2010 census, the population of Noyack was 1,500. The population is predominantly white (94.7%) and the median age is 44. The median household income is $87,500 and the median home value is $735,000.
The hamlet is home to a variety of religious denominations, including Catholic, Protestant, and Jewish. The hamlet is also home to a variety of ethnicities, including Irish, Italian, and Hispanic.
Conclusion
Noyack is a small, rural hamlet located on the eastern end of the South Fork of Long Island. The hamlet is known for its beautiful beaches, fishing, and boating. The economy of Noyack is largely based on tourism and agriculture. The population of Noyack is predominantly white and the median age is 44. The hamlet is home to a variety of religious denominations and ethnicities.
Common Questions
What is Per Capita Income in Noyack?
Per Capita income in Noyack is $69,664.
What is the Median Family Income in Noyack?
Median Family Income in Noyack is $101,653.
What is the Median Household income in Noyack?
Median Household Income in Noyack is $100,222.
What is Income or Wage Gap in Noyack?
Income or Wage Gap in Noyack is 48.6%.
Women in Noyack earn 51.4 cents for every dollar earned by a man.
What is Inequality or Gini Index in Noyack?
Inequality or Gini Index in Noyack is 0.54.
What is the Total Population of Noyack?
Total Population of Noyack is 4,797.
What is the Total Male Population of Noyack?
Total Male Population of Noyack is 2,217.
What is the Total Female Population of Noyack?
Total Female Population of Noyack is 2,580.
What is the Ratio of Males per 100 Females in Noyack?
There are 85.93 Males per 100 Females in Noyack.
What is the Ratio of Females per 100 Males in Noyack?
There are 116.37 Females per 100 Males in Noyack.
What is the Median Population Age in Noyack?
Median Population Age in Noyack is 46.0 Years.
What is the Average Family Size in Noyack
Average Family Size in Noyack is 2.8 People.
What is the Average Household Size in Noyack
Average Household Size in Noyack is 2.4 People.
How Large is the Labor Force in Noyack?
There are 2,801 People in the Labor Forcein in Noyack.
What is the Percentage of People in the Labor Force in Noyack?
71.1% of People are in the Labor Force in Noyack.
What is the Unemployment Rate in Noyack?
Unemployment Rate in Noyack is 4.9%.