Lynbrook, NY Map & Demographics
Lynbrook Map
Lynbrook Overview
$60,904
PER CAPITA INCOME
$164,677
AVG FAMILY INCOME
$139,266
AVG HOUSEHOLD INCOME
22.9%
WAGE / INCOME GAP [ % ]
77.1¢/ $1
WAGE / INCOME GAP [ $ ]
0.46
INEQUALITY / GINI INDEX
20,299
TOTAL POPULATION
9,480
MALE POPULATION
10,819
FEMALE POPULATION
87.62
MALES / 100 FEMALES
114.12
FEMALES / 100 MALES
44.0
MEDIAN AGE
3.4
AVG FAMILY SIZE
2.9
AVG HOUSEHOLD SIZE
11,229
LABOR FORCE [ PEOPLE ]
67.3%
PERCENT IN LABOR FORCE
3.9%
UNEMPLOYMENT RATE
Lynbrook Zip Codes
Lynbrook Area Codes
Income in Lynbrook
Income Overview in Lynbrook
Per Capita Income in Lynbrook is $60,904, while median incomes of families and households are $164,677 and $139,266 respectively.
| Characteristic | Number | Measure |
| Per Capita Income | 20,299 | $60,904 |
| Median Family Income | 5,205 | $164,677 |
| Mean Family Income | 5,205 | $204,053 |
| Median Household Income | 7,031 | $139,266 |
| Mean Household Income | 7,031 | $173,795 |
| Income Deficit | 5,205 | $0 |
| Wage / Income Gap (%) | 20,299 | 22.87% |
| Wage / Income Gap ($) | 20,299 | 77.13¢ per $1 |
| Gini / Inequality Index | 20,299 | 0.46 |
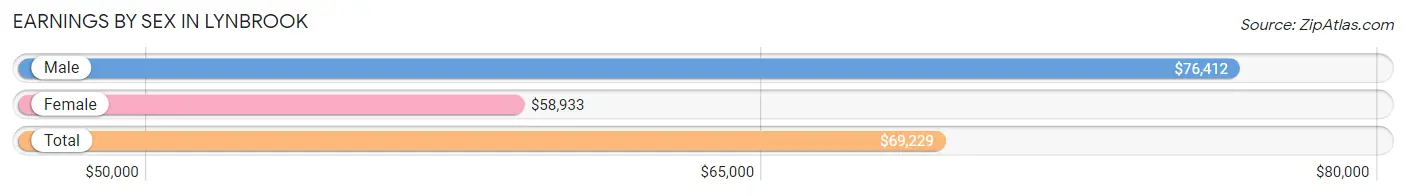
Earnings by Sex in Lynbrook
Average Earnings in Lynbrook are $69,229, $76,412 for men and $58,933 for women, a difference of 22.9%.
| Sex | Number | Average Earnings |
| Male | 6,242 (53.9%) | $76,412 |
| Female | 5,339 (46.1%) | $58,933 |
| Total | 11,581 (100.0%) | $69,229 |
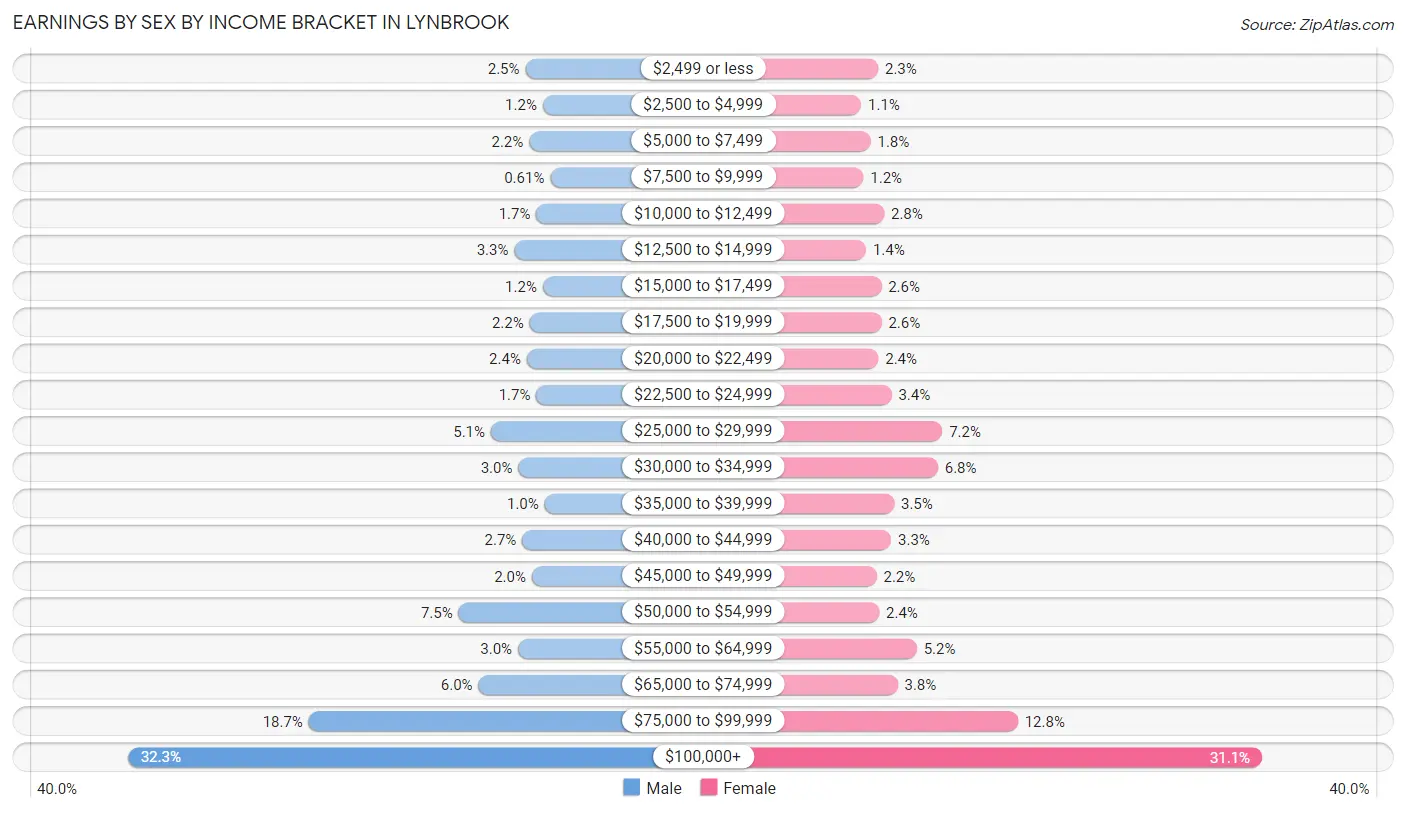
Earnings by Sex by Income Bracket in Lynbrook
The most common earnings brackets in Lynbrook are $100,000+ for men (2,014 | 32.3%) and $100,000+ for women (1,661 | 31.1%).
| Income | Male | Female |
| $2,499 or less | 154 (2.5%) | 125 (2.3%) |
| $2,500 to $4,999 | 73 (1.2%) | 57 (1.1%) |
| $5,000 to $7,499 | 137 (2.2%) | 95 (1.8%) |
| $7,500 to $9,999 | 38 (0.6%) | 66 (1.2%) |
| $10,000 to $12,499 | 103 (1.7%) | 149 (2.8%) |
| $12,500 to $14,999 | 206 (3.3%) | 77 (1.4%) |
| $15,000 to $17,499 | 73 (1.2%) | 138 (2.6%) |
| $17,500 to $19,999 | 135 (2.2%) | 139 (2.6%) |
| $20,000 to $22,499 | 148 (2.4%) | 126 (2.4%) |
| $22,500 to $24,999 | 103 (1.7%) | 179 (3.4%) |
| $25,000 to $29,999 | 316 (5.1%) | 382 (7.1%) |
| $30,000 to $34,999 | 187 (3.0%) | 364 (6.8%) |
| $35,000 to $39,999 | 64 (1.0%) | 189 (3.5%) |
| $40,000 to $44,999 | 169 (2.7%) | 177 (3.3%) |
| $45,000 to $49,999 | 124 (2.0%) | 119 (2.2%) |
| $50,000 to $54,999 | 467 (7.5%) | 129 (2.4%) |
| $55,000 to $64,999 | 189 (3.0%) | 280 (5.2%) |
| $65,000 to $74,999 | 374 (6.0%) | 203 (3.8%) |
| $75,000 to $99,999 | 1,168 (18.7%) | 684 (12.8%) |
| $100,000+ | 2,014 (32.3%) | 1,661 (31.1%) |
| Total | 6,242 (100.0%) | 5,339 (100.0%) |
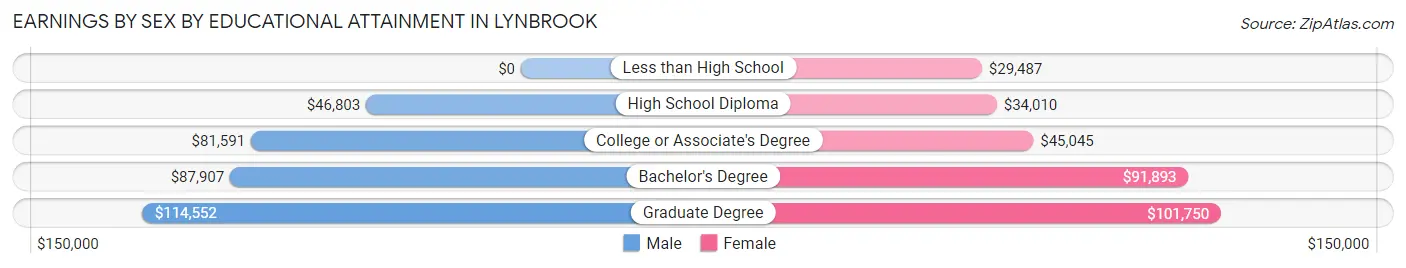
Earnings by Sex by Educational Attainment in Lynbrook
Average earnings in Lynbrook are $85,089 for men and $68,313 for women, a difference of 19.7%. Men with an educational attainment of graduate degree enjoy the highest average annual earnings of $114,552, while those with high school diploma education earn the least with $46,803. Women with an educational attainment of graduate degree earn the most with the average annual earnings of $101,750, while those with less than high school education have the smallest earnings of $29,487.
| Educational Attainment | Male Income | Female Income |
| Less than High School | - | - |
| High School Diploma | $46,803 | $34,010 |
| College or Associate's Degree | $81,591 | $45,045 |
| Bachelor's Degree | $87,907 | $91,893 |
| Graduate Degree | $114,552 | $101,750 |
| Total | $85,089 | $68,313 |
Family Income in Lynbrook
Family Income Brackets in Lynbrook
According to the Lynbrook family income data, there are 1,889 families falling into the $200,000+ income range, which is the most common income bracket and makes up 36.3% of all families. Conversely, the less than $10,000 income bracket is the least frequent group with only 57 families (1.1%) belonging to this category.
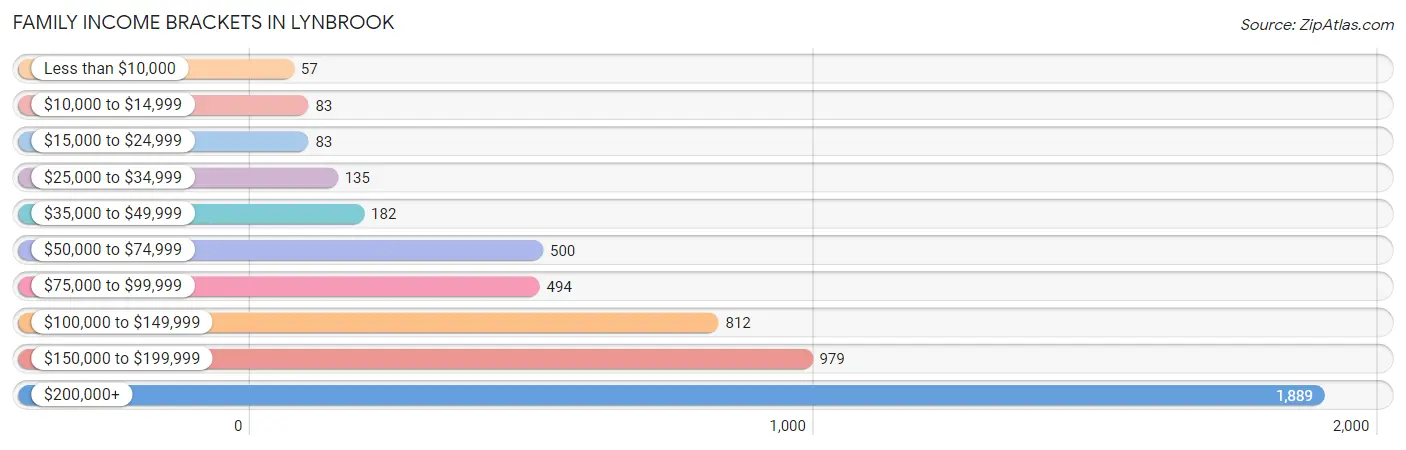
| Income Bracket | # Families | % Families |
| Less than $10,000 | 57 | 1.1% |
| $10,000 to $14,999 | 83 | 1.6% |
| $15,000 to $24,999 | 83 | 1.6% |
| $25,000 to $34,999 | 135 | 2.6% |
| $35,000 to $49,999 | 182 | 3.5% |
| $50,000 to $74,999 | 500 | 9.6% |
| $75,000 to $99,999 | 494 | 9.5% |
| $100,000 to $149,999 | 812 | 15.6% |
| $150,000 to $199,999 | 979 | 18.8% |
| $200,000+ | 1,889 | 36.3% |
Family Income by Famaliy Size in Lynbrook
5-person families (528 | 10.1%) account for the highest median family income in Lynbrook with $247,045 per family, while 2-person families (1,961 | 37.7%) have the highest median income of $59,347 per family member.
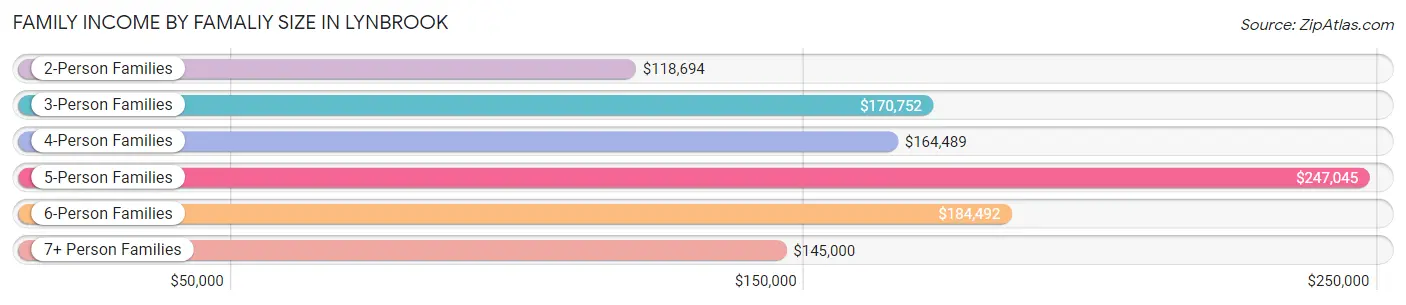
| Income Bracket | # Families | Median Income |
| 2-Person Families | 1,961 (37.7%) | $118,694 |
| 3-Person Families | 1,256 (24.1%) | $170,752 |
| 4-Person Families | 1,097 (21.1%) | $164,489 |
| 5-Person Families | 528 (10.1%) | $247,045 |
| 6-Person Families | 311 (6.0%) | $184,492 |
| 7+ Person Families | 52 (1.0%) | $145,000 |
| Total | 5,205 (100.0%) | $164,677 |
Family Income by Number of Earners in Lynbrook
The median family income in Lynbrook is $164,677, with families comprising 3+ earners (1,066) having the highest median family income of $229,375, while families with no earners (595) have the lowest median family income of $59,583, accounting for 20.5% and 11.4% of families, respectively.
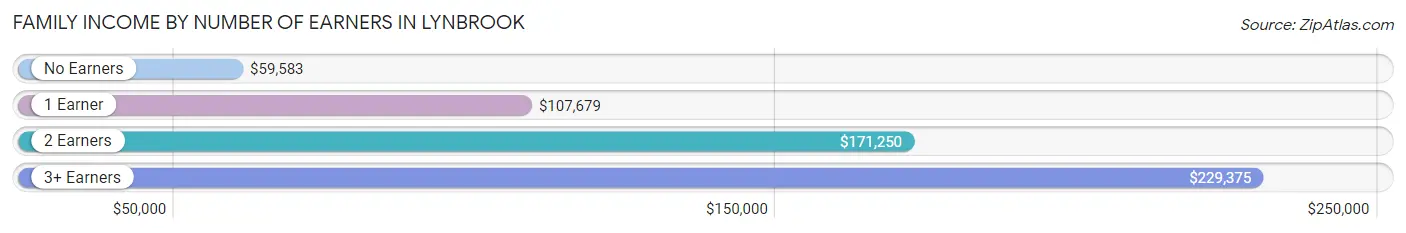
| Number of Earners | # Families | Median Income |
| No Earners | 595 (11.4%) | $59,583 |
| 1 Earner | 1,007 (19.4%) | $107,679 |
| 2 Earners | 2,537 (48.7%) | $171,250 |
| 3+ Earners | 1,066 (20.5%) | $229,375 |
| Total | 5,205 (100.0%) | $164,677 |
Household Income in Lynbrook
Household Income Brackets in Lynbrook
With 2,011 households falling in the category, the $200,000+ income range is the most frequent in Lynbrook, accounting for 28.6% of all households. In contrast, only 134 households (1.9%) fall into the $10,000 to $14,999 income bracket, making it the least populous group.
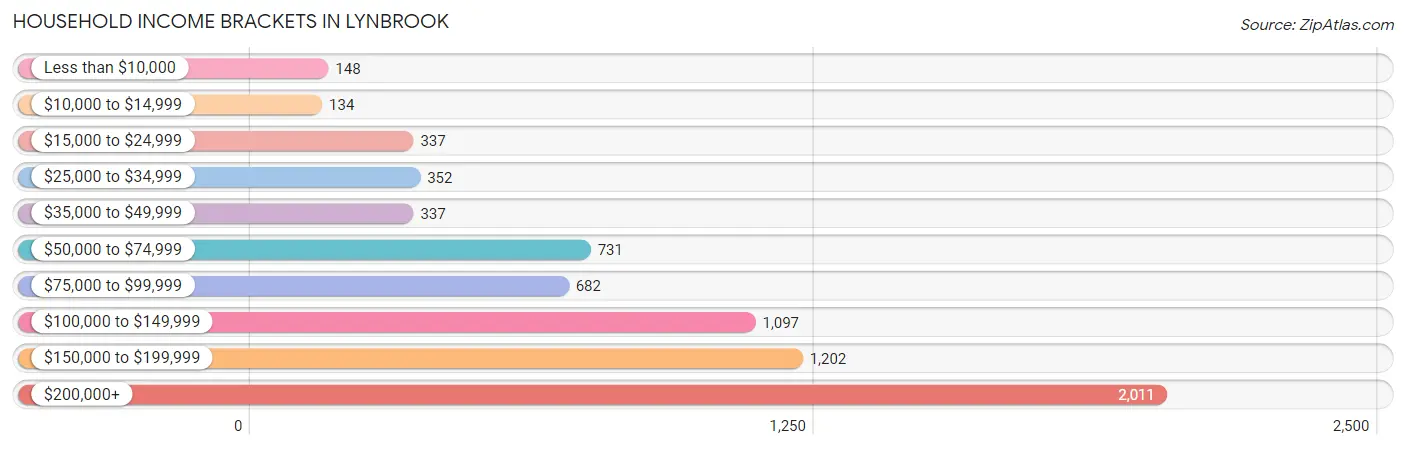
| Income Bracket | # Households | % Households |
| Less than $10,000 | 148 | 2.1% |
| $10,000 to $14,999 | 134 | 1.9% |
| $15,000 to $24,999 | 337 | 4.8% |
| $25,000 to $34,999 | 352 | 5.0% |
| $35,000 to $49,999 | 337 | 4.8% |
| $50,000 to $74,999 | 731 | 10.4% |
| $75,000 to $99,999 | 682 | 9.7% |
| $100,000 to $149,999 | 1,097 | 15.6% |
| $150,000 to $199,999 | 1,202 | 17.1% |
| $200,000+ | 2,011 | 28.6% |
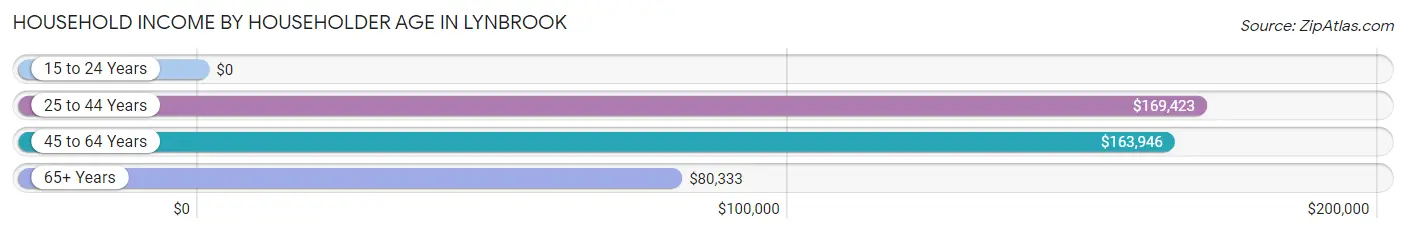
Household Income by Householder Age in Lynbrook
The median household income in Lynbrook is $139,266, with the highest median household income of $169,423 found in the 25 to 44 years age bracket for the primary householder. A total of 1,762 households (25.1%) fall into this category. Meanwhile, the 15 to 24 years age bracket for the primary householder has the lowest median household income of $0, with 23 households (0.3%) in this group.
| Income Bracket | # Households | Median Income |
| 15 to 24 Years | 23 (0.3%) | $0 |
| 25 to 44 Years | 1,762 (25.1%) | $169,423 |
| 45 to 64 Years | 2,868 (40.8%) | $163,946 |
| 65+ Years | 2,378 (33.8%) | $80,333 |
| Total | 7,031 (100.0%) | $139,266 |
Poverty in Lynbrook
Income Below Poverty by Sex and Age in Lynbrook
With 5.3% poverty level for males and 7.6% for females among the residents of Lynbrook, 16 and 17 year old males and 12 to 14 year old females are the most vulnerable to poverty, with 37 males (33.6%) and 184 females (31.4%) in their respective age groups living below the poverty level.
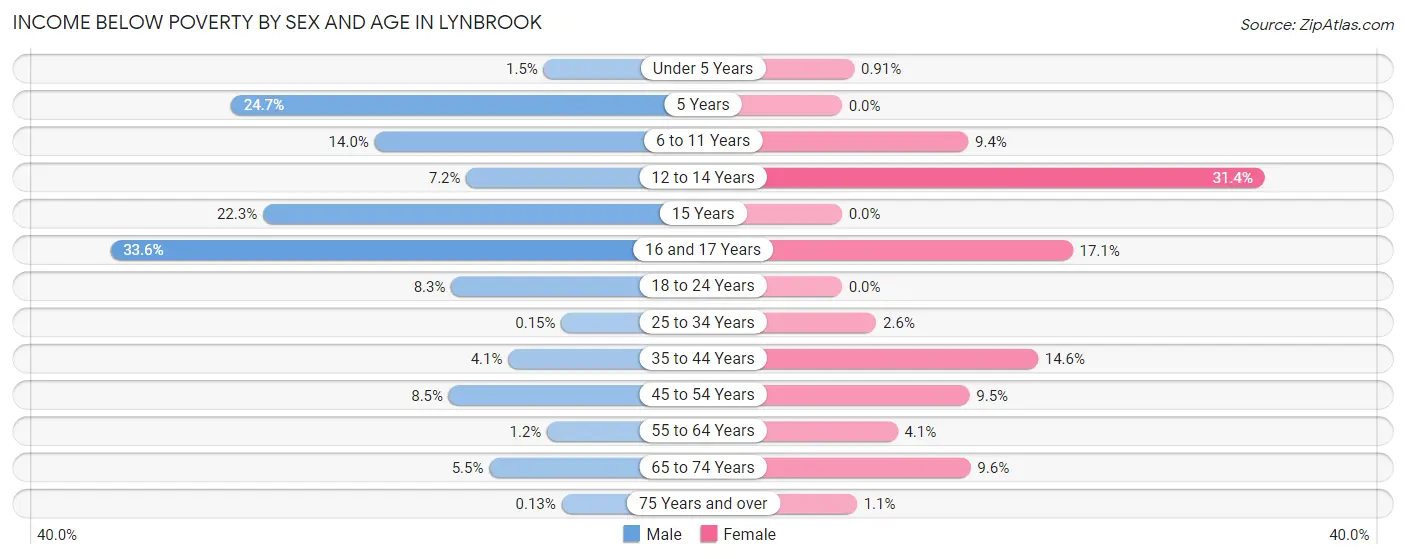
| Age Bracket | Male | Female |
| Under 5 Years | 7 (1.5%) | 7 (0.9%) |
| 5 Years | 20 (24.7%) | 0 (0.0%) |
| 6 to 11 Years | 65 (14.0%) | 45 (9.4%) |
| 12 to 14 Years | 19 (7.2%) | 184 (31.4%) |
| 15 Years | 31 (22.3%) | 0 (0.0%) |
| 16 and 17 Years | 37 (33.6%) | 56 (17.1%) |
| 18 to 24 Years | 77 (8.3%) | 0 (0.0%) |
| 25 to 34 Years | 2 (0.2%) | 34 (2.5%) |
| 35 to 44 Years | 48 (4.1%) | 182 (14.5%) |
| 45 to 54 Years | 120 (8.5%) | 126 (9.5%) |
| 55 to 64 Years | 16 (1.2%) | 62 (4.1%) |
| 65 to 74 Years | 56 (5.5%) | 113 (9.6%) |
| 75 Years and over | 1 (0.1%) | 14 (1.1%) |
| Total | 499 (5.3%) | 823 (7.6%) |
Income Above Poverty by Sex and Age in Lynbrook
According to the poverty statistics in Lynbrook, males aged 75 years and over and females aged 5 years are the age groups that are most secure financially, with 99.9% of males and 100.0% of females in these age groups living above the poverty line.
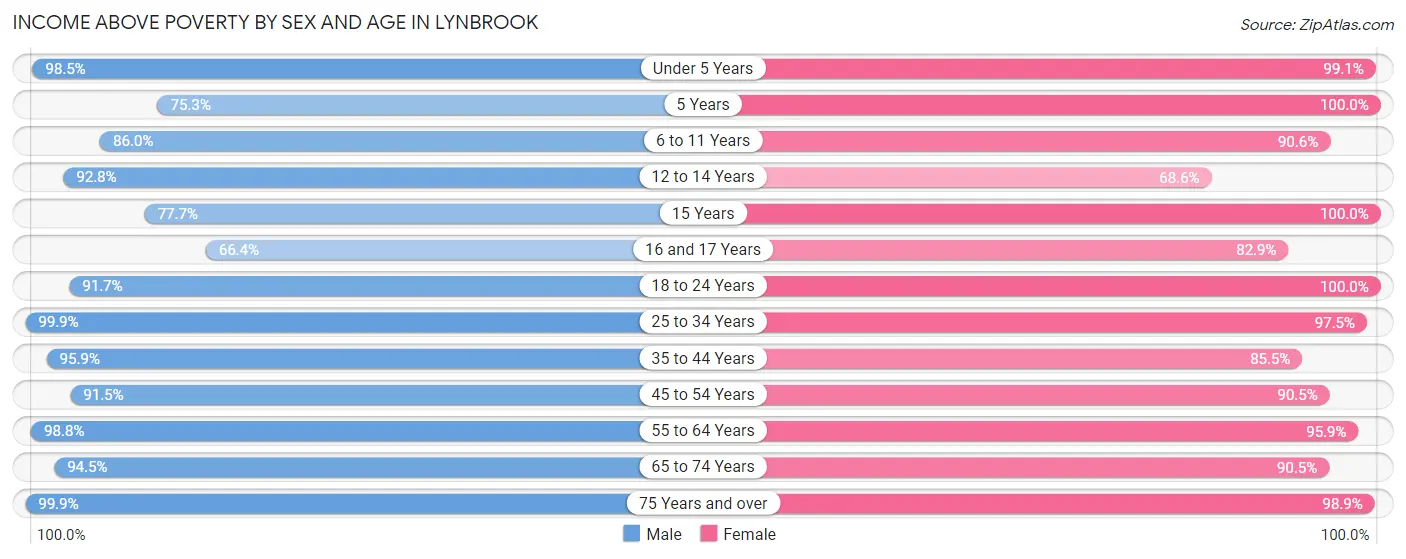
| Age Bracket | Male | Female |
| Under 5 Years | 471 (98.5%) | 763 (99.1%) |
| 5 Years | 61 (75.3%) | 89 (100.0%) |
| 6 to 11 Years | 399 (86.0%) | 435 (90.6%) |
| 12 to 14 Years | 245 (92.8%) | 402 (68.6%) |
| 15 Years | 108 (77.7%) | 222 (100.0%) |
| 16 and 17 Years | 73 (66.4%) | 271 (82.9%) |
| 18 to 24 Years | 849 (91.7%) | 463 (100.0%) |
| 25 to 34 Years | 1,301 (99.9%) | 1,297 (97.5%) |
| 35 to 44 Years | 1,127 (95.9%) | 1,069 (85.5%) |
| 45 to 54 Years | 1,292 (91.5%) | 1,204 (90.5%) |
| 55 to 64 Years | 1,316 (98.8%) | 1,440 (95.9%) |
| 65 to 74 Years | 963 (94.5%) | 1,070 (90.4%) |
| 75 Years and over | 759 (99.9%) | 1,247 (98.9%) |
| Total | 8,964 (94.7%) | 9,972 (92.4%) |
Income Below Poverty Among Married-Couple Families in Lynbrook
The poverty statistics for married-couple families in Lynbrook show that 2.8% or 115 of the total 4,116 families live below the poverty line. Families with 3 or 4 children have the highest poverty rate of 13.2%, comprising of 47 families. On the other hand, families with 5 or more children have the lowest poverty rate of 0.0%, which includes 0 families.
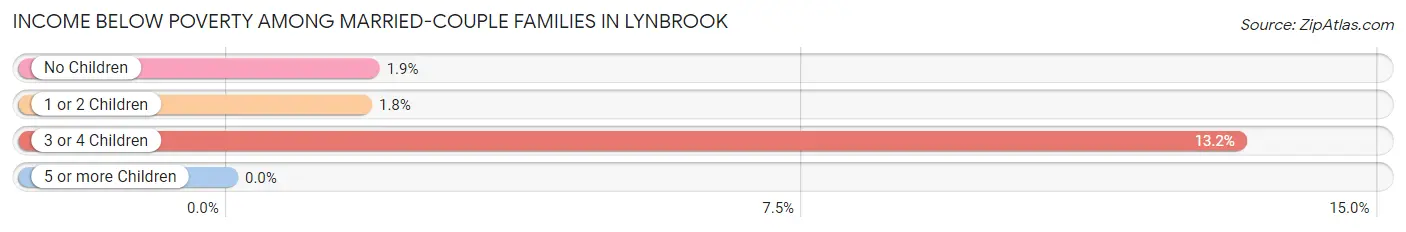
| Children | Above Poverty | Below Poverty |
| No Children | 2,224 (98.2%) | 42 (1.8%) |
| 1 or 2 Children | 1,461 (98.3%) | 26 (1.8%) |
| 3 or 4 Children | 310 (86.8%) | 47 (13.2%) |
| 5 or more Children | 6 (100.0%) | 0 (0.0%) |
| Total | 4,001 (97.2%) | 115 (2.8%) |
Income Below Poverty Among Single-Parent Households in Lynbrook
According to the poverty data in Lynbrook, 18.8% or 51 single-father households and 10.8% or 88 single-mother households are living below the poverty line. Among single-father households, those with 3 or 4 children have the highest poverty rate, with 30 households (100.0%) experiencing poverty. Likewise, among single-mother households, those with 1 or 2 children have the highest poverty rate, with 74 households (21.0%) falling below the poverty line.
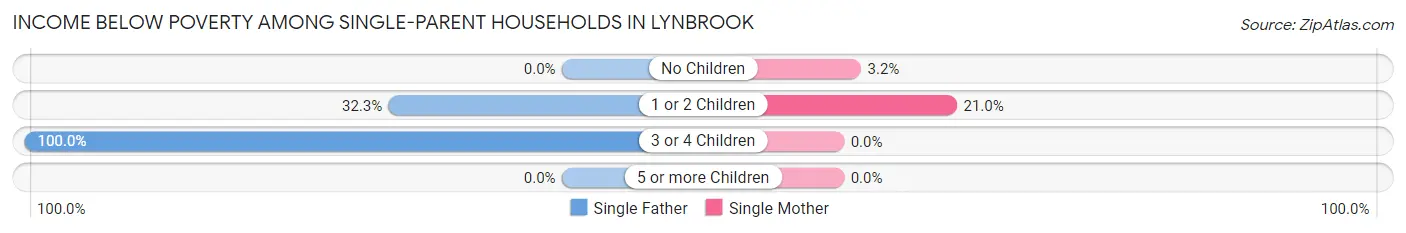
| Children | Single Father | Single Mother |
| No Children | 0 (0.0%) | 14 (3.2%) |
| 1 or 2 Children | 21 (32.3%) | 74 (21.0%) |
| 3 or 4 Children | 30 (100.0%) | 0 (0.0%) |
| 5 or more Children | 0 (0.0%) | 0 (0.0%) |
| Total | 51 (18.8%) | 88 (10.8%) |
Income Below Poverty Among Married-Couple vs Single-Parent Households in Lynbrook
The poverty data for Lynbrook shows that 115 of the married-couple family households (2.8%) and 139 of the single-parent households (12.8%) are living below the poverty level. Within the married-couple family households, those with 3 or 4 children have the highest poverty rate, with 47 households (13.2%) falling below the poverty line. Among the single-parent households, those with 3 or 4 children have the highest poverty rate, with 30 household (58.8%) living below poverty.
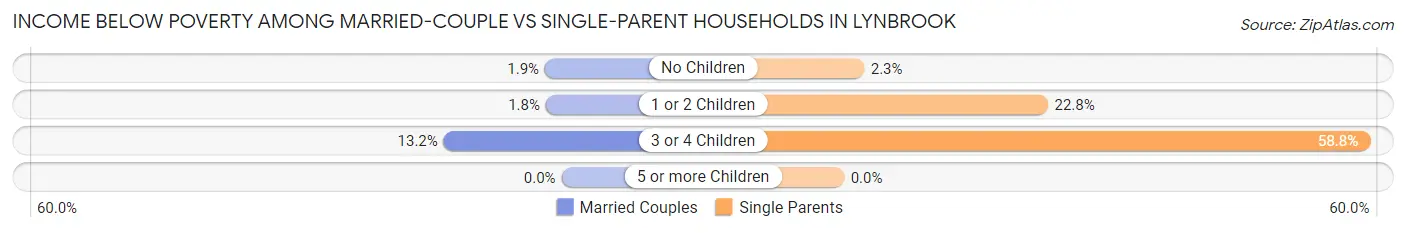
| Children | Married-Couple Families | Single-Parent Households |
| No Children | 42 (1.8%) | 14 (2.2%) |
| 1 or 2 Children | 26 (1.8%) | 95 (22.8%) |
| 3 or 4 Children | 47 (13.2%) | 30 (58.8%) |
| 5 or more Children | 0 (0.0%) | 0 (0.0%) |
| Total | 115 (2.8%) | 139 (12.8%) |
Race in Lynbrook
The most populous races in Lynbrook are White / Caucasian (13,543 | 66.7%), Hispanic or Latino (4,519 | 22.3%), and Two or more Races (2,218 | 10.9%).
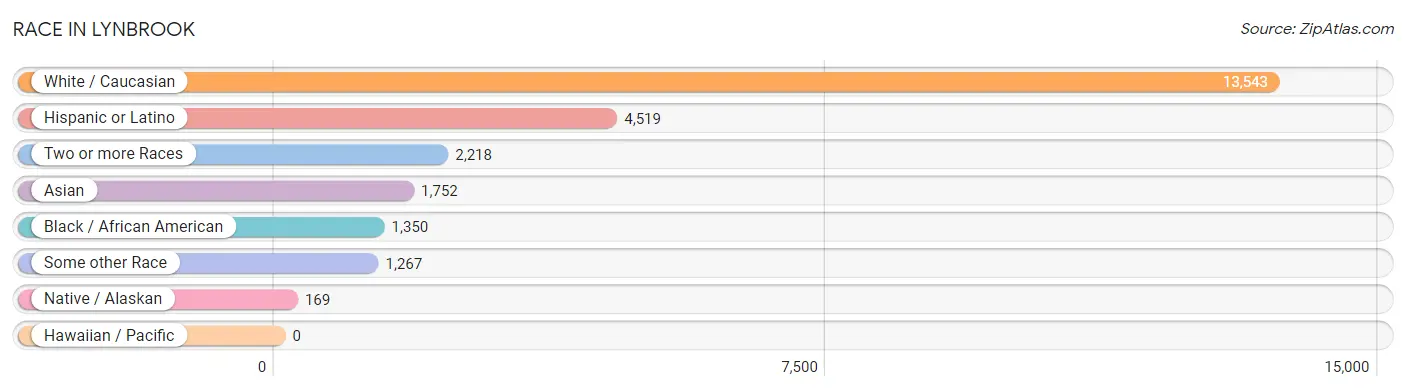
| Race | # Population | % Population |
| Asian | 1,752 | 8.6% |
| Black / African American | 1,350 | 6.7% |
| Hawaiian / Pacific | 0 | 0.0% |
| Hispanic or Latino | 4,519 | 22.3% |
| Native / Alaskan | 169 | 0.8% |
| White / Caucasian | 13,543 | 66.7% |
| Two or more Races | 2,218 | 10.9% |
| Some other Race | 1,267 | 6.2% |
| Total | 20,299 | 100.0% |
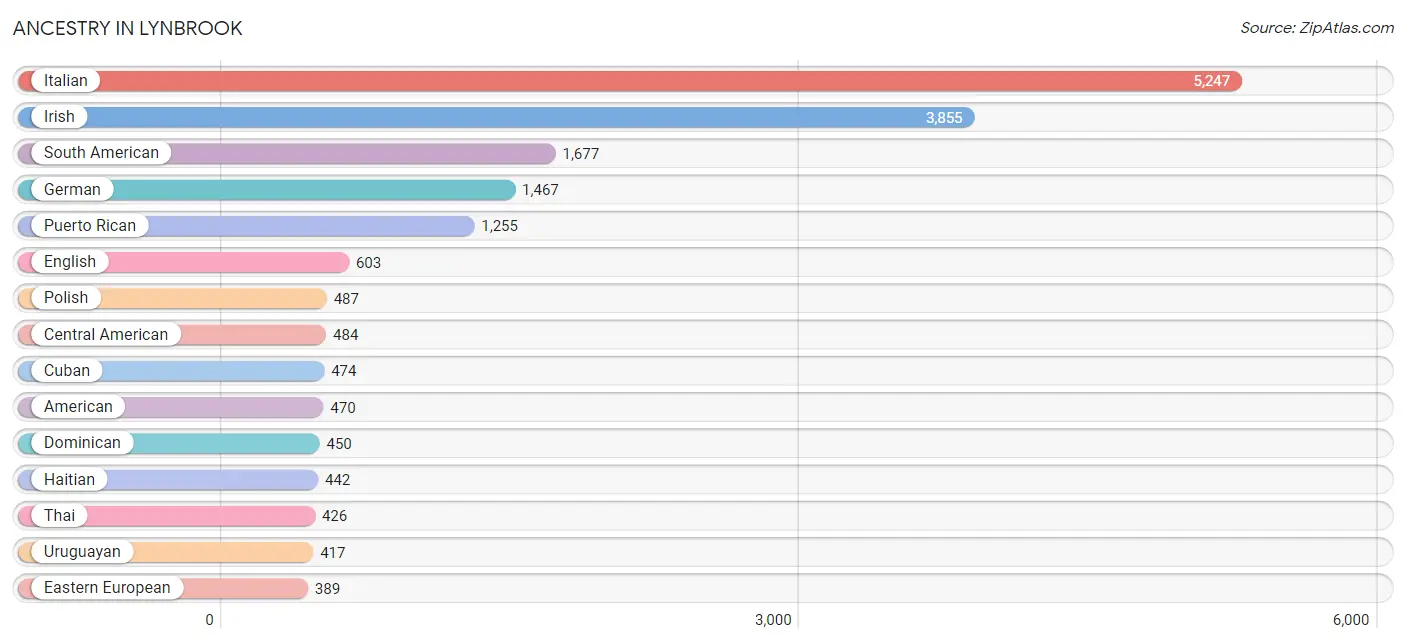
Ancestry in Lynbrook
The most populous ancestries reported in Lynbrook are Italian (5,247 | 25.9%), Irish (3,855 | 19.0%), South American (1,677 | 8.3%), German (1,467 | 7.2%), and Puerto Rican (1,255 | 6.2%), together accounting for 66.5% of all Lynbrook residents.
| Ancestry | # Population | % Population |
| African | 40 | 0.2% |
| Albanian | 22 | 0.1% |
| American | 470 | 2.3% |
| Argentinean | 32 | 0.2% |
| Armenian | 44 | 0.2% |
| Austrian | 39 | 0.2% |
| Belizean | 27 | 0.1% |
| Bhutanese | 29 | 0.1% |
| Bolivian | 119 | 0.6% |
| British | 8 | 0.0% |
| Burmese | 50 | 0.3% |
| Canadian | 58 | 0.3% |
| Central American | 484 | 2.4% |
| Chilean | 109 | 0.5% |
| Colombian | 369 | 1.8% |
| Costa Rican | 11 | 0.1% |
| Cree | 5 | 0.0% |
| Croatian | 54 | 0.3% |
| Cuban | 474 | 2.3% |
| Czech | 89 | 0.4% |
| Dominican | 450 | 2.2% |
| Eastern European | 389 | 1.9% |
| Ecuadorian | 303 | 1.5% |
| English | 603 | 3.0% |
| European | 137 | 0.7% |
| Filipino | 23 | 0.1% |
| Finnish | 29 | 0.1% |
| French | 271 | 1.3% |
| French Canadian | 88 | 0.4% |
| German | 1,467 | 7.2% |
| Greek | 228 | 1.1% |
| Guatemalan | 89 | 0.4% |
| Guyanese | 46 | 0.2% |
| Haitian | 442 | 2.2% |
| Honduran | 120 | 0.6% |
| Hungarian | 185 | 0.9% |
| Indian (Asian) | 240 | 1.2% |
| Irish | 3,855 | 19.0% |
| Israeli | 27 | 0.1% |
| Italian | 5,247 | 25.9% |
| Jamaican | 244 | 1.2% |
| Korean | 379 | 1.9% |
| Lithuanian | 64 | 0.3% |
| Mexican | 131 | 0.6% |
| Nicaraguan | 51 | 0.3% |
| Norwegian | 83 | 0.4% |
| Panamanian | 204 | 1.0% |
| Peruvian | 321 | 1.6% |
| Polish | 487 | 2.4% |
| Portuguese | 48 | 0.2% |
| Puerto Rican | 1,255 | 6.2% |
| Romanian | 115 | 0.6% |
| Russian | 388 | 1.9% |
| Salvadoran | 9 | 0.0% |
| Scandinavian | 9 | 0.0% |
| Scotch-Irish | 13 | 0.1% |
| Scottish | 28 | 0.1% |
| South American | 1,677 | 8.3% |
| Spaniard | 5 | 0.0% |
| Spanish | 16 | 0.1% |
| Sri Lankan | 5 | 0.0% |
| Subsaharan African | 40 | 0.2% |
| Swedish | 138 | 0.7% |
| Thai | 426 | 2.1% |
| Trinidadian and Tobagonian | 107 | 0.5% |
| Turkish | 39 | 0.2% |
| Ukrainian | 178 | 0.9% |
| Uruguayan | 417 | 2.1% |
| Venezuelan | 7 | 0.0% |
| Vietnamese | 14 | 0.1% |
| Welsh | 41 | 0.2% | View All 71 Rows |
Immigrants in Lynbrook
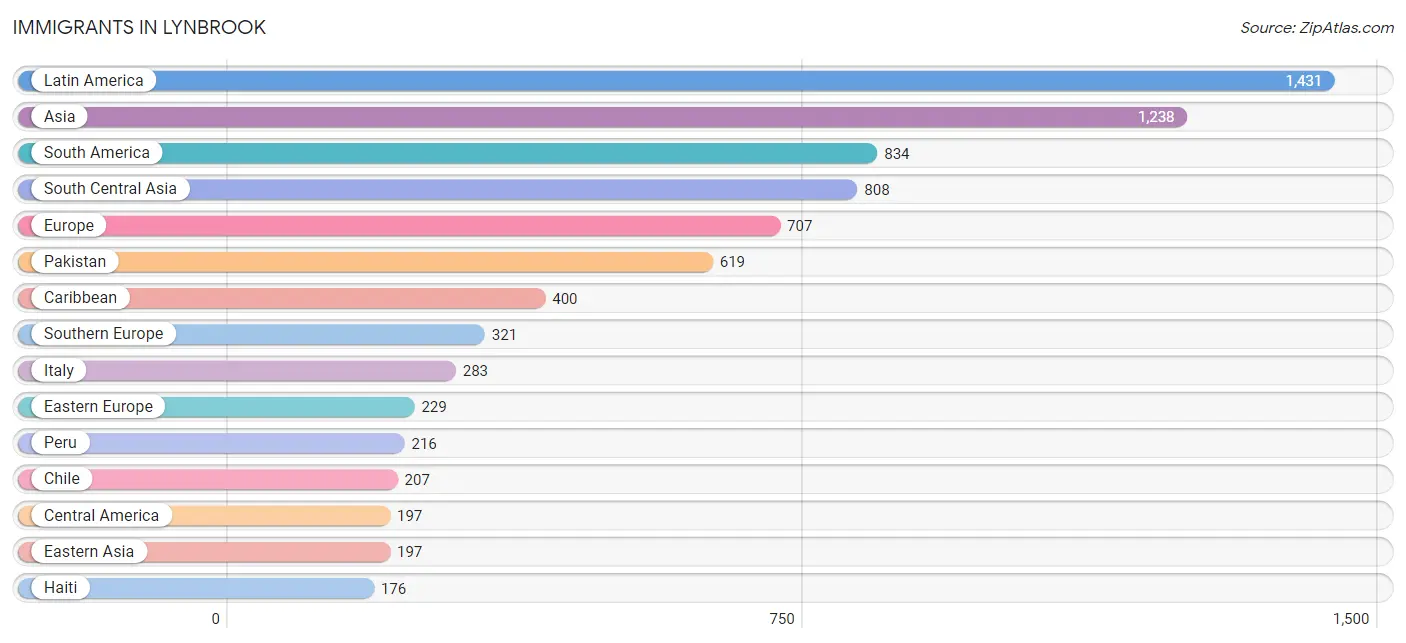
The most numerous immigrant groups reported in Lynbrook came from Latin America (1,431 | 7.0%), Asia (1,238 | 6.1%), South America (834 | 4.1%), South Central Asia (808 | 4.0%), and Europe (707 | 3.5%), together accounting for 24.7% of all Lynbrook residents.
| Immigration Origin | # Population | % Population |
| Africa | 102 | 0.5% |
| Argentina | 19 | 0.1% |
| Asia | 1,238 | 6.1% |
| Australia | 21 | 0.1% |
| Belgium | 16 | 0.1% |
| Belize | 9 | 0.0% |
| Bolivia | 62 | 0.3% |
| Canada | 19 | 0.1% |
| Caribbean | 400 | 2.0% |
| Central America | 197 | 1.0% |
| Chile | 207 | 1.0% |
| China | 128 | 0.6% |
| Colombia | 92 | 0.4% |
| Cuba | 29 | 0.1% |
| Dominican Republic | 42 | 0.2% |
| Eastern Asia | 197 | 1.0% |
| Eastern Europe | 229 | 1.1% |
| Ecuador | 72 | 0.4% |
| El Salvador | 9 | 0.0% |
| Europe | 707 | 3.5% |
| Germany | 10 | 0.1% |
| Greece | 22 | 0.1% |
| Guatemala | 4 | 0.0% |
| Guyana | 26 | 0.1% |
| Haiti | 176 | 0.9% |
| Honduras | 65 | 0.3% |
| Hong Kong | 16 | 0.1% |
| Hungary | 20 | 0.1% |
| India | 116 | 0.6% |
| Ireland | 105 | 0.5% |
| Israel | 27 | 0.1% |
| Italy | 283 | 1.4% |
| Jamaica | 55 | 0.3% |
| Japan | 19 | 0.1% |
| Korea | 50 | 0.3% |
| Latin America | 1,431 | 7.0% |
| Mexico | 51 | 0.3% |
| Nepal | 29 | 0.1% |
| Nicaragua | 32 | 0.2% |
| Nigeria | 17 | 0.1% |
| Northern Europe | 131 | 0.6% |
| Oceania | 21 | 0.1% |
| Pakistan | 619 | 3.0% |
| Panama | 27 | 0.1% |
| Peru | 216 | 1.1% |
| Philippines | 167 | 0.8% |
| Poland | 86 | 0.4% |
| Portugal | 16 | 0.1% |
| Romania | 73 | 0.4% |
| Russia | 21 | 0.1% |
| South Africa | 85 | 0.4% |
| South America | 834 | 4.1% |
| South Central Asia | 808 | 4.0% |
| South Eastern Asia | 172 | 0.9% |
| Southern Europe | 321 | 1.6% |
| Taiwan | 19 | 0.1% |
| Trinidad and Tobago | 98 | 0.5% |
| Turkey | 34 | 0.2% |
| Ukraine | 29 | 0.1% |
| Uruguay | 140 | 0.7% |
| Uzbekistan | 44 | 0.2% |
| Vietnam | 5 | 0.0% |
| Western Africa | 17 | 0.1% |
| Western Asia | 61 | 0.3% |
| Western Europe | 26 | 0.1% | View All 65 Rows |
Sex and Age in Lynbrook
Sex and Age in Lynbrook
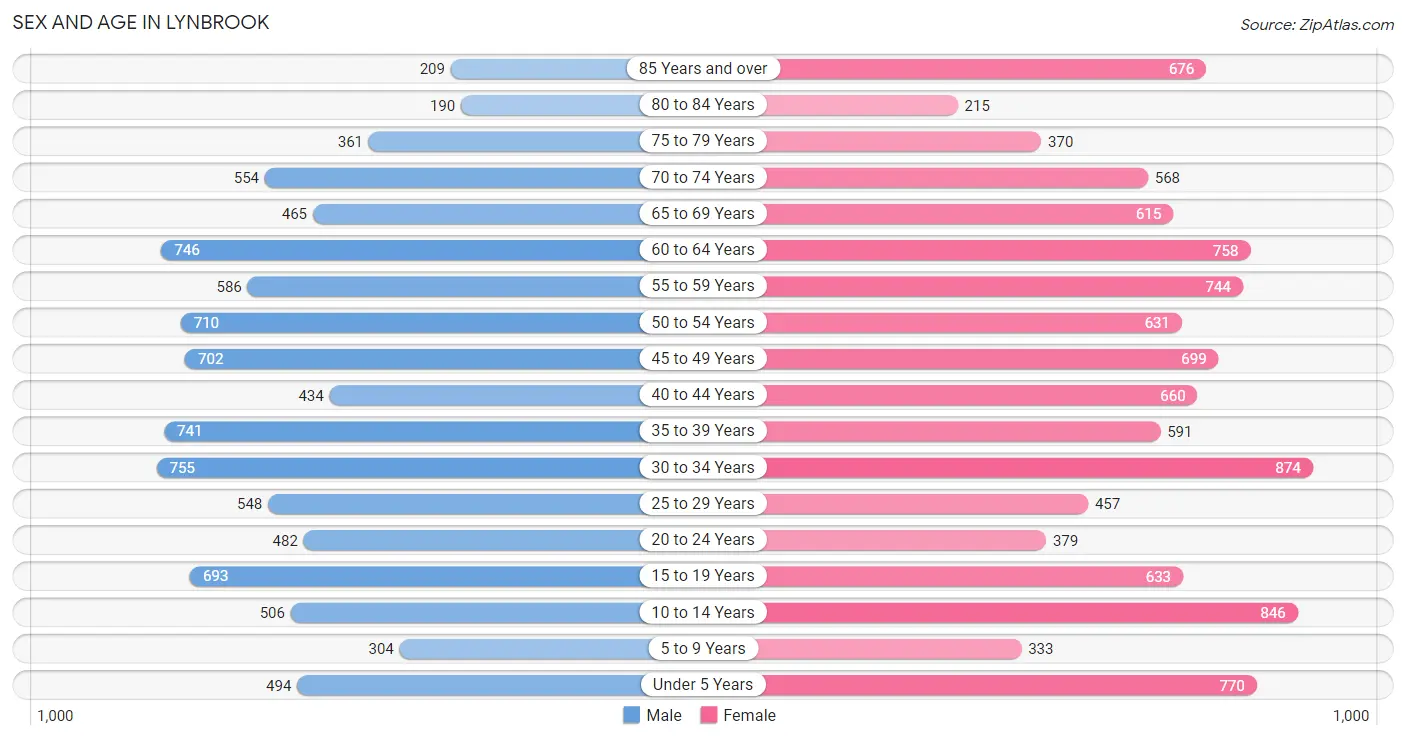
The most populous age groups in Lynbrook are 30 to 34 Years (755 | 8.0%) for men and 30 to 34 Years (874 | 8.1%) for women.
| Age Bracket | Male | Female |
| Under 5 Years | 494 (5.2%) | 770 (7.1%) |
| 5 to 9 Years | 304 (3.2%) | 333 (3.1%) |
| 10 to 14 Years | 506 (5.3%) | 846 (7.8%) |
| 15 to 19 Years | 693 (7.3%) | 633 (5.9%) |
| 20 to 24 Years | 482 (5.1%) | 379 (3.5%) |
| 25 to 29 Years | 548 (5.8%) | 457 (4.2%) |
| 30 to 34 Years | 755 (8.0%) | 874 (8.1%) |
| 35 to 39 Years | 741 (7.8%) | 591 (5.5%) |
| 40 to 44 Years | 434 (4.6%) | 660 (6.1%) |
| 45 to 49 Years | 702 (7.4%) | 699 (6.5%) |
| 50 to 54 Years | 710 (7.5%) | 631 (5.8%) |
| 55 to 59 Years | 586 (6.2%) | 744 (6.9%) |
| 60 to 64 Years | 746 (7.9%) | 758 (7.0%) |
| 65 to 69 Years | 465 (4.9%) | 615 (5.7%) |
| 70 to 74 Years | 554 (5.8%) | 568 (5.2%) |
| 75 to 79 Years | 361 (3.8%) | 370 (3.4%) |
| 80 to 84 Years | 190 (2.0%) | 215 (2.0%) |
| 85 Years and over | 209 (2.2%) | 676 (6.2%) |
| Total | 9,480 (100.0%) | 10,819 (100.0%) |
Families and Households in Lynbrook
Median Family Size in Lynbrook
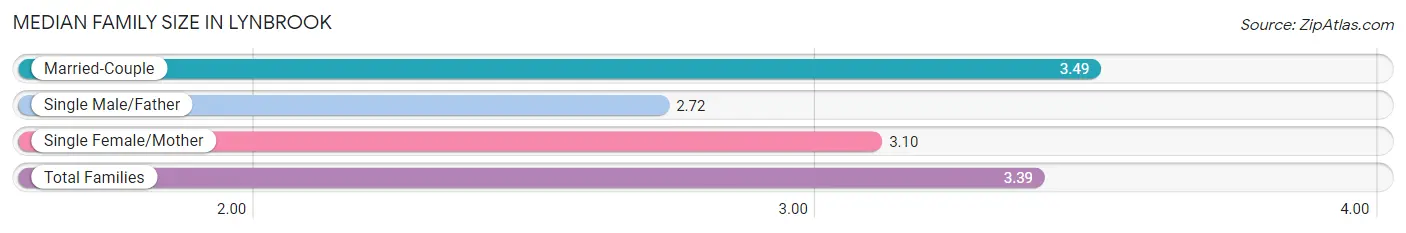
The median family size in Lynbrook is 3.39 persons per family, with married-couple families (4,116 | 79.1%) accounting for the largest median family size of 3.49 persons per family. On the other hand, single male/father families (272 | 5.2%) represent the smallest median family size with 2.72 persons per family.
| Family Type | # Families | Family Size |
| Married-Couple | 4,116 (79.1%) | 3.49 |
| Single Male/Father | 272 (5.2%) | 2.72 |
| Single Female/Mother | 817 (15.7%) | 3.10 |
| Total Families | 5,205 (100.0%) | 3.39 |
Median Household Size in Lynbrook
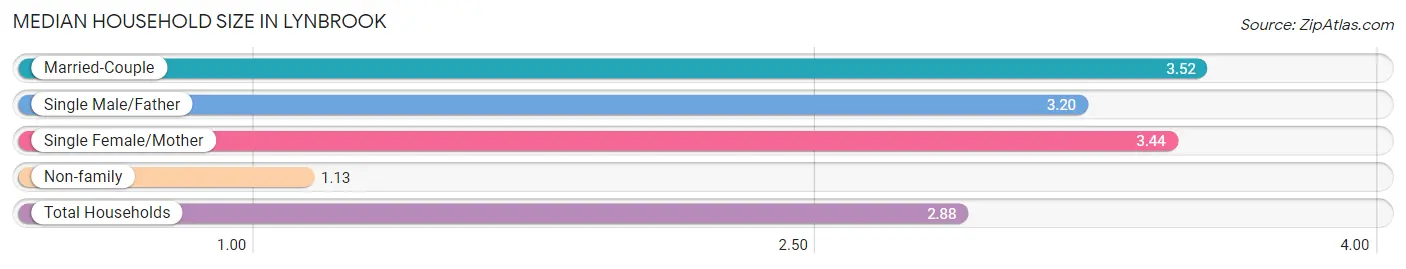
The median household size in Lynbrook is 2.88 persons per household, with married-couple households (4,116 | 58.5%) accounting for the largest median household size of 3.52 persons per household. non-family households (1,826 | 26.0%) represent the smallest median household size with 1.13 persons per household.
| Household Type | # Households | Household Size |
| Married-Couple | 4,116 (58.5%) | 3.52 |
| Single Male/Father | 272 (3.9%) | 3.20 |
| Single Female/Mother | 817 (11.6%) | 3.44 |
| Non-family | 1,826 (26.0%) | 1.13 |
| Total Households | 7,031 (100.0%) | 2.88 |
Household Size by Marriage Status in Lynbrook
Out of a total of 7,031 households in Lynbrook, 5,205 (74.0%) are family households, while 1,826 (26.0%) are nonfamily households. The most numerous type of family households are 2-person households, comprising 1,720, and the most common type of nonfamily households are 1-person households, comprising 1,666.
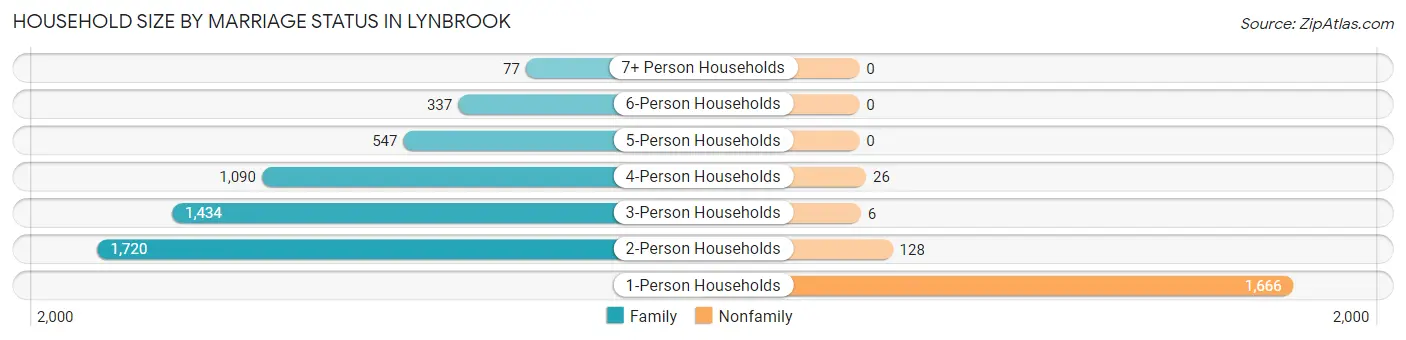
| Household Size | Family Households | Nonfamily Households |
| 1-Person Households | - | 1,666 (23.7%) |
| 2-Person Households | 1,720 (24.5%) | 128 (1.8%) |
| 3-Person Households | 1,434 (20.4%) | 6 (0.1%) |
| 4-Person Households | 1,090 (15.5%) | 26 (0.4%) |
| 5-Person Households | 547 (7.8%) | 0 (0.0%) |
| 6-Person Households | 337 (4.8%) | 0 (0.0%) |
| 7+ Person Households | 77 (1.1%) | 0 (0.0%) |
| Total | 5,205 (74.0%) | 1,826 (26.0%) |
Female Fertility in Lynbrook
Fertility by Age in Lynbrook
Average fertility rate in Lynbrook is 78.0 births per 1,000 women. Women in the age bracket of 20 to 34 years have the highest fertility rate with 158.0 births per 1,000 women. Women in the age bracket of 20 to 34 years acount for 78.5% of all women with births.
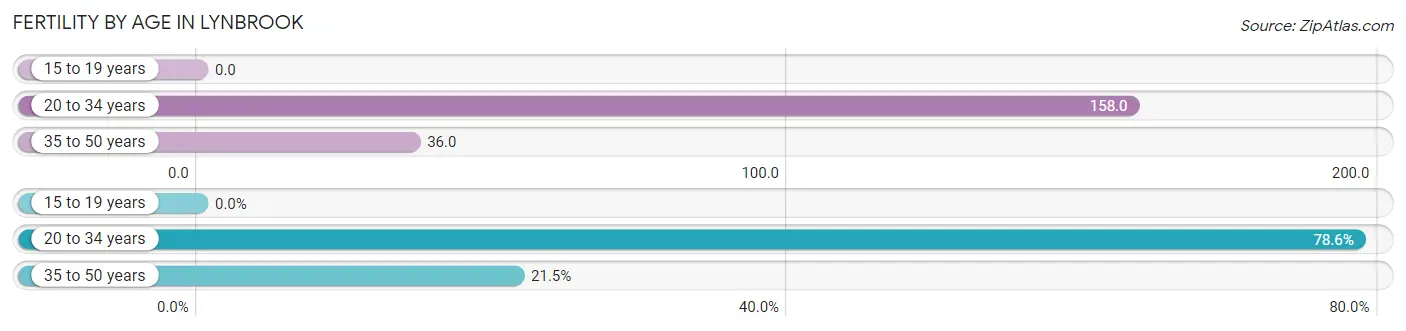
| Age Bracket | Women with Births | Births / 1,000 Women |
| 15 to 19 years | 0 (0.0%) | 0.0 |
| 20 to 34 years | 271 (78.5%) | 158.0 |
| 35 to 50 years | 74 (21.4%) | 36.0 |
| Total | 345 (100.0%) | 78.0 |
Fertility by Age by Marriage Status in Lynbrook
95.9% of women with births (345) in Lynbrook are married. The highest percentage of unmarried women with births falls into 20 to 34 years age bracket with 5.2% of them unmarried at the time of birth, while the lowest percentage of unmarried women with births belong to 35 to 50 years age bracket with 0.0% of them unmarried.
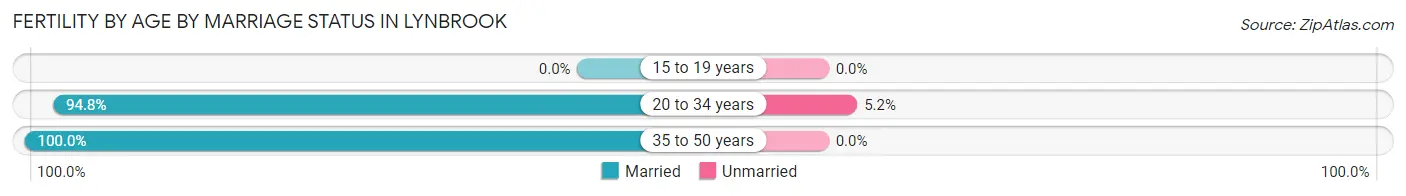
| Age Bracket | Married | Unmarried |
| 15 to 19 years | 0 (0.0%) | 0 (0.0%) |
| 20 to 34 years | 257 (94.8%) | 14 (5.2%) |
| 35 to 50 years | 74 (100.0%) | 0 (0.0%) |
| Total | 331 (95.9%) | 14 (4.1%) |
Fertility by Education in Lynbrook
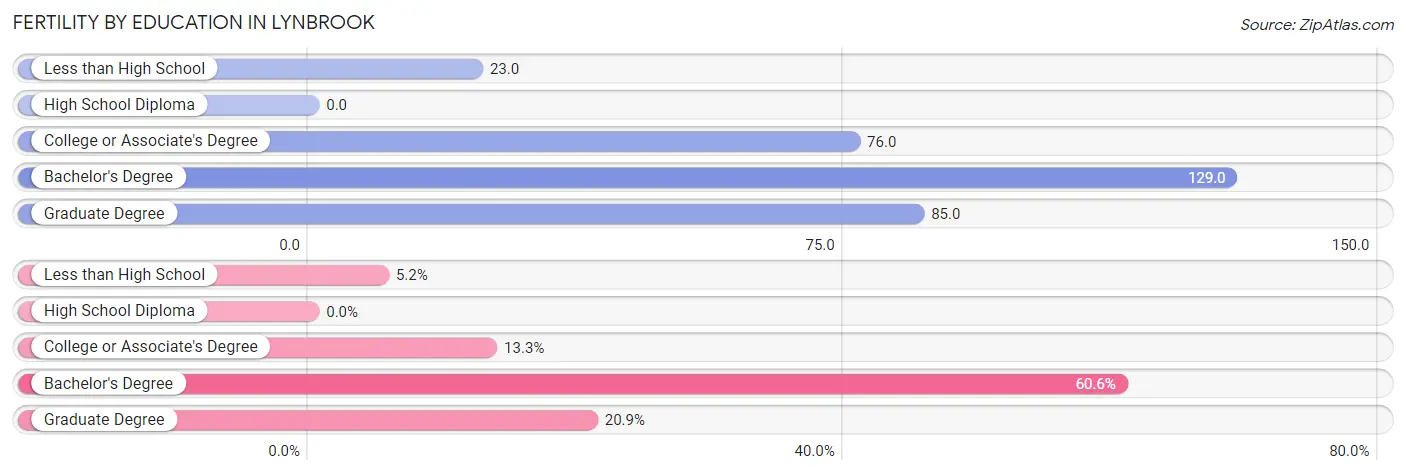
| Educational Attainment | Women with Births | Births / 1,000 Women |
| Less than High School | 18 (5.2%) | 23.0 |
| High School Diploma | 0 (0.0%) | 0.0 |
| College or Associate's Degree | 46 (13.3%) | 76.0 |
| Bachelor's Degree | 209 (60.6%) | 129.0 |
| Graduate Degree | 72 (20.9%) | 85.0 |
| Total | 345 (100.0%) | 78.0 |
Fertility by Education by Marriage Status in Lynbrook
4.1% of women with births in Lynbrook are unmarried. Women with the educational attainment of less than high school are most likely to be married with 100.0% of them married at childbirth, while women with the educational attainment of bachelor's degree are least likely to be married with 6.7% of them unmarried at childbirth.
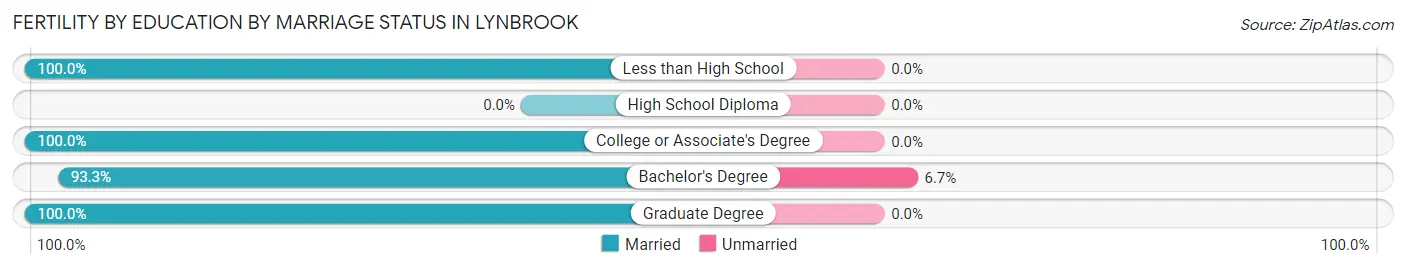
| Educational Attainment | Married | Unmarried |
| Less than High School | 18 (100.0%) | 0 (0.0%) |
| High School Diploma | 0 (0.0%) | 0 (0.0%) |
| College or Associate's Degree | 46 (100.0%) | 0 (0.0%) |
| Bachelor's Degree | 195 (93.3%) | 14 (6.7%) |
| Graduate Degree | 72 (100.0%) | 0 (0.0%) |
| Total | 331 (95.9%) | 14 (4.1%) |
Employment Characteristics in Lynbrook
Employment by Class of Employer in Lynbrook
Among the 10,437 employed individuals in Lynbrook, private company employees (6,248 | 59.9%), local government employees (1,544 | 14.8%), and self-employed (incorporated) (885 | 8.5%) make up the most common classes of employment.
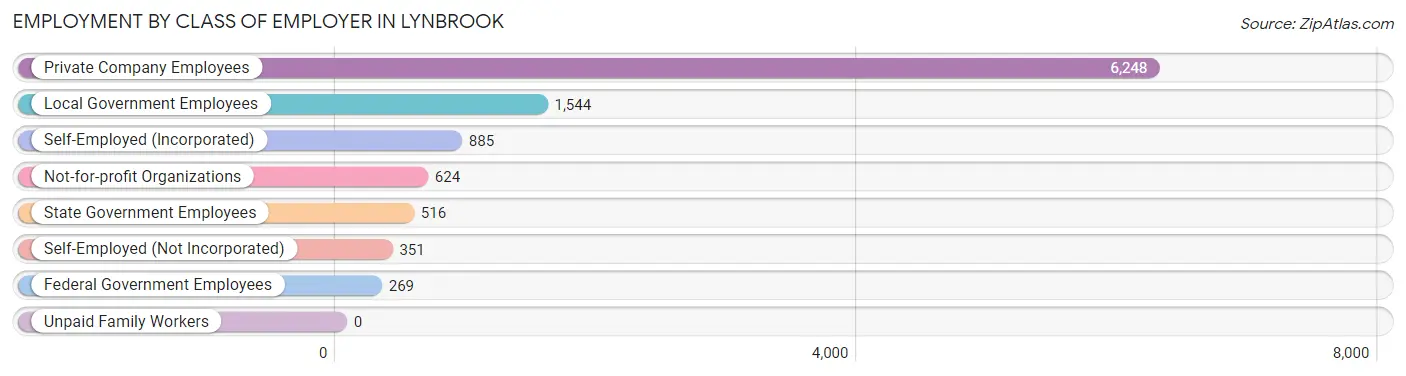
| Employer Class | # Employees | % Employees |
| Private Company Employees | 6,248 | 59.9% |
| Self-Employed (Incorporated) | 885 | 8.5% |
| Self-Employed (Not Incorporated) | 351 | 3.4% |
| Not-for-profit Organizations | 624 | 6.0% |
| Local Government Employees | 1,544 | 14.8% |
| State Government Employees | 516 | 4.9% |
| Federal Government Employees | 269 | 2.6% |
| Unpaid Family Workers | 0 | 0.0% |
| Total | 10,437 | 100.0% |
Employment Status by Age in Lynbrook
According to the labor force statistics for Lynbrook, out of the total population over 16 years of age (16,685), 67.3% or 11,229 individuals are in the labor force, with 3.9% or 438 of them unemployed. The age group with the highest labor force participation rate is 30 to 34 years, with 96.7% or 1,575 individuals in the labor force. Within the labor force, the 16 to 19 years age range has the highest percentage of unemployed individuals, with 10.8% or 36 of them being unemployed.
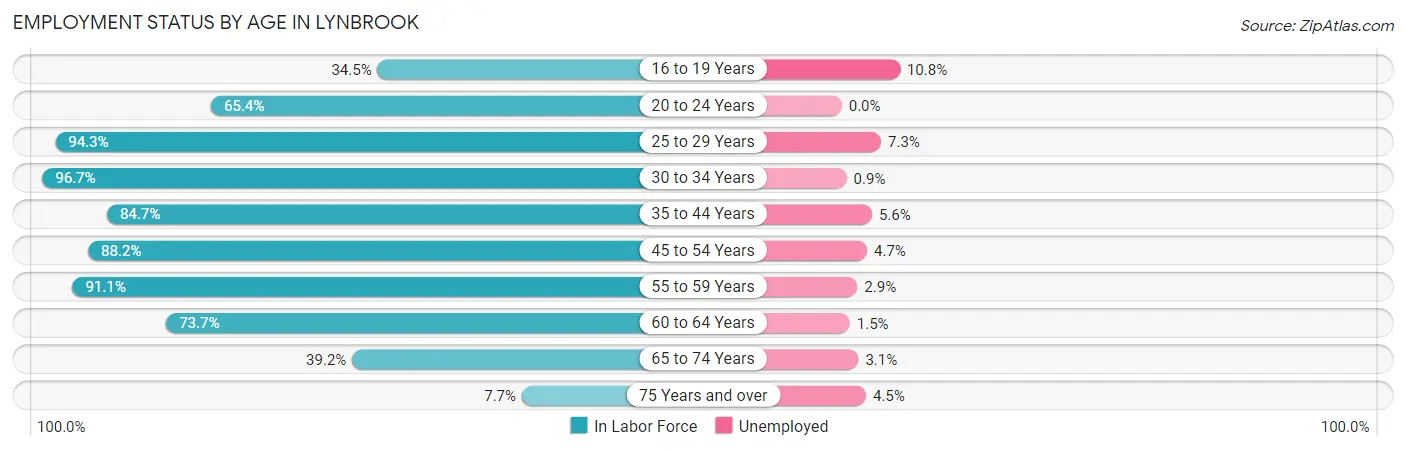
| Age Bracket | In Labor Force | Unemployed |
| 16 to 19 Years | 333 (34.5%) | 36 (10.8%) |
| 20 to 24 Years | 563 (65.4%) | 0 (0.0%) |
| 25 to 29 Years | 948 (94.3%) | 69 (7.3%) |
| 30 to 34 Years | 1,575 (96.7%) | 14 (0.9%) |
| 35 to 44 Years | 2,055 (84.7%) | 115 (5.6%) |
| 45 to 54 Years | 2,418 (88.2%) | 114 (4.7%) |
| 55 to 59 Years | 1,212 (91.1%) | 35 (2.9%) |
| 60 to 64 Years | 1,108 (73.7%) | 17 (1.5%) |
| 65 to 74 Years | 863 (39.2%) | 27 (3.1%) |
| 75 Years and over | 156 (7.7%) | 7 (4.5%) |
| Total | 11,229 (67.3%) | 438 (3.9%) |
Employment Status by Educational Attainment in Lynbrook
According to labor force statistics for Lynbrook, 87.6% of individuals (9,317) out of the total population between 25 and 64 years of age (10,636) are in the labor force, with 3.9% or 363 of them being unemployed. The group with the highest labor force participation rate are those with the educational attainment of bachelor's degree or higher, with 92.5% or 5,117 individuals in the labor force. Within the labor force, individuals with less than high school education have the highest percentage of unemployment, with 8.9% or 39 of them being unemployed.
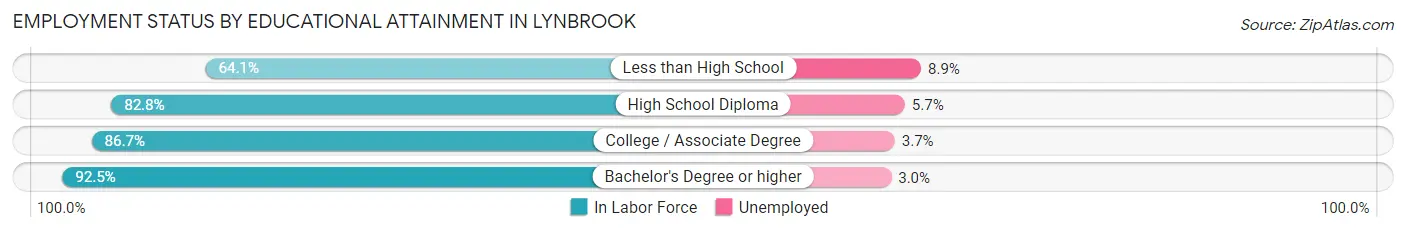
| Educational Attainment | In Labor Force | Unemployed |
| Less than High School | 439 (64.1%) | 61 (8.9%) |
| High School Diploma | 1,491 (82.8%) | 103 (5.7%) |
| College / Associate Degree | 2,270 (86.7%) | 97 (3.7%) |
| Bachelor's Degree or higher | 5,117 (92.5%) | 166 (3.0%) |
| Total | 9,317 (87.6%) | 415 (3.9%) |
Employment Occupations by Sex in Lynbrook
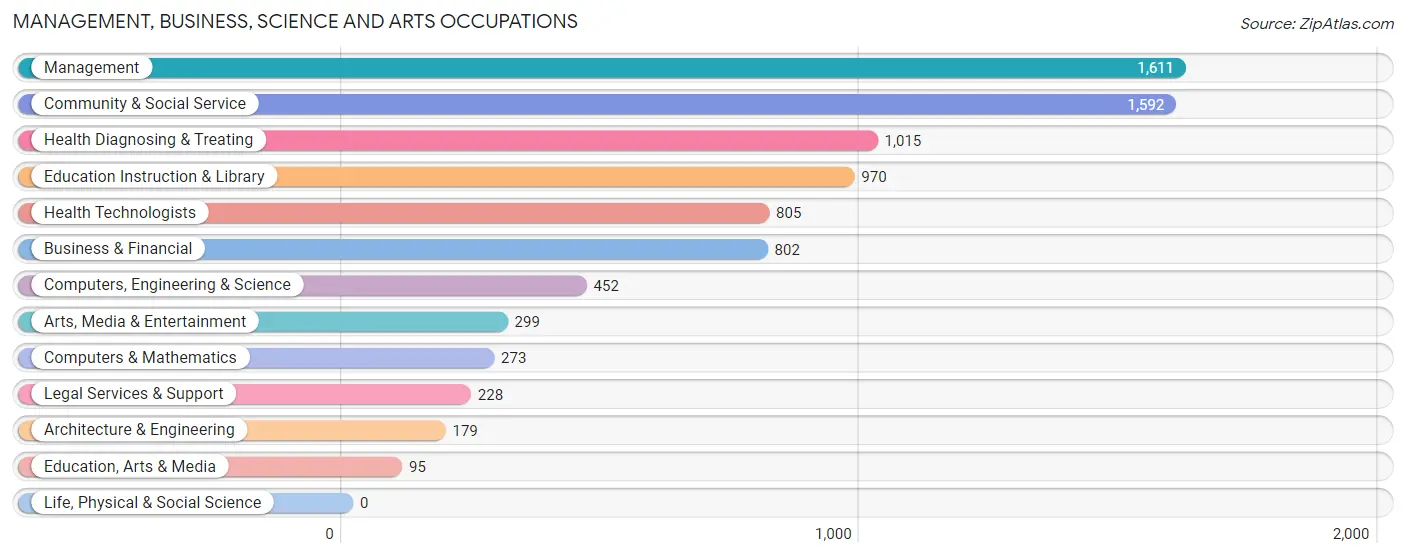
Management, Business, Science and Arts Occupations
The most common Management, Business, Science and Arts occupations in Lynbrook are Management (1,611 | 14.9%), Community & Social Service (1,592 | 14.7%), Health Diagnosing & Treating (1,015 | 9.4%), Education Instruction & Library (970 | 9.0%), and Health Technologists (805 | 7.5%).
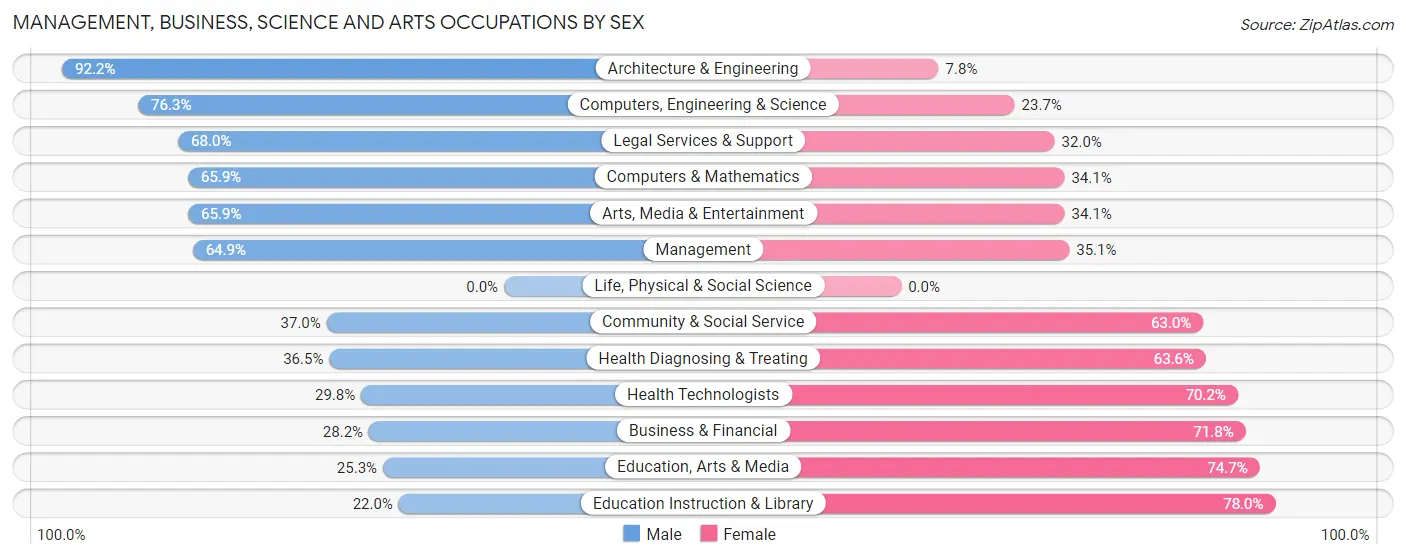
Management, Business, Science and Arts Occupations by Sex
Within the Management, Business, Science and Arts occupations in Lynbrook, the most male-oriented occupations are Architecture & Engineering (92.2%), Computers, Engineering & Science (76.3%), and Legal Services & Support (68.0%), while the most female-oriented occupations are Education Instruction & Library (78.0%), Education, Arts & Media (74.7%), and Business & Financial (71.8%).
| Occupation | Male | Female |
| Management | 1,046 (64.9%) | 565 (35.1%) |
| Business & Financial | 226 (28.2%) | 576 (71.8%) |
| Computers, Engineering & Science | 345 (76.3%) | 107 (23.7%) |
| Computers & Mathematics | 180 (65.9%) | 93 (34.1%) |
| Architecture & Engineering | 165 (92.2%) | 14 (7.8%) |
| Life, Physical & Social Science | 0 (0.0%) | 0 (0.0%) |
| Community & Social Service | 589 (37.0%) | 1,003 (63.0%) |
| Education, Arts & Media | 24 (25.3%) | 71 (74.7%) |
| Legal Services & Support | 155 (68.0%) | 73 (32.0%) |
| Education Instruction & Library | 213 (22.0%) | 757 (78.0%) |
| Arts, Media & Entertainment | 197 (65.9%) | 102 (34.1%) |
| Health Diagnosing & Treating | 370 (36.4%) | 645 (63.5%) |
| Health Technologists | 240 (29.8%) | 565 (70.2%) |
| Total (Category) | 2,576 (47.1%) | 2,896 (52.9%) |
| Total (Overall) | 5,826 (53.9%) | 4,972 (46.1%) |
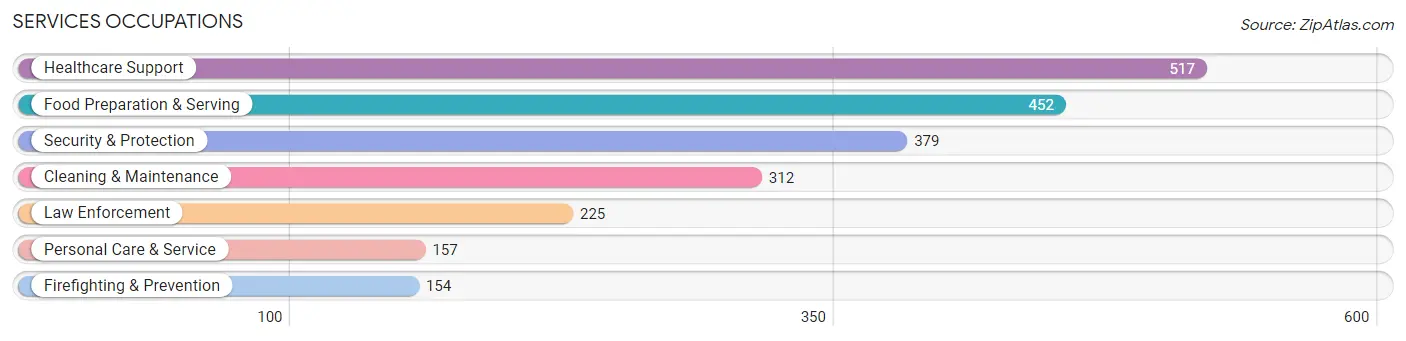
Services Occupations
The most common Services occupations in Lynbrook are Healthcare Support (517 | 4.8%), Food Preparation & Serving (452 | 4.2%), Security & Protection (379 | 3.5%), Cleaning & Maintenance (312 | 2.9%), and Law Enforcement (225 | 2.1%).
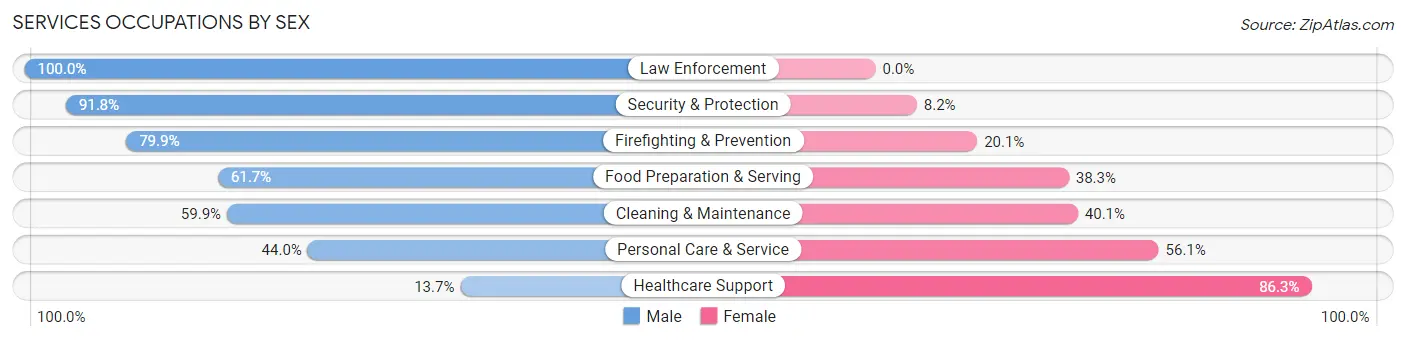
Services Occupations by Sex
Within the Services occupations in Lynbrook, the most male-oriented occupations are Law Enforcement (100.0%), Security & Protection (91.8%), and Firefighting & Prevention (79.9%), while the most female-oriented occupations are Healthcare Support (86.3%), Personal Care & Service (56.0%), and Cleaning & Maintenance (40.1%).
| Occupation | Male | Female |
| Healthcare Support | 71 (13.7%) | 446 (86.3%) |
| Security & Protection | 348 (91.8%) | 31 (8.2%) |
| Firefighting & Prevention | 123 (79.9%) | 31 (20.1%) |
| Law Enforcement | 225 (100.0%) | 0 (0.0%) |
| Food Preparation & Serving | 279 (61.7%) | 173 (38.3%) |
| Cleaning & Maintenance | 187 (59.9%) | 125 (40.1%) |
| Personal Care & Service | 69 (44.0%) | 88 (56.0%) |
| Total (Category) | 954 (52.5%) | 863 (47.5%) |
| Total (Overall) | 5,826 (53.9%) | 4,972 (46.1%) |
Sales and Office Occupations
The most common Sales and Office occupations in Lynbrook are Office & Administration (1,215 | 11.3%), and Sales & Related (937 | 8.7%).

Sales and Office Occupations by Sex
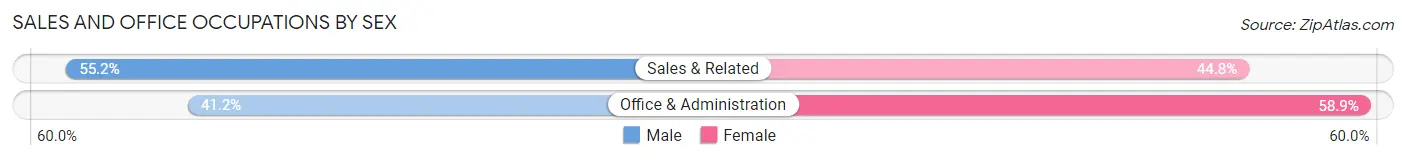
| Occupation | Male | Female |
| Sales & Related | 517 (55.2%) | 420 (44.8%) |
| Office & Administration | 500 (41.1%) | 715 (58.9%) |
| Total (Category) | 1,017 (47.3%) | 1,135 (52.7%) |
| Total (Overall) | 5,826 (53.9%) | 4,972 (46.1%) |
Natural Resources, Construction and Maintenance Occupations
The most common Natural Resources, Construction and Maintenance occupations in Lynbrook are Construction & Extraction (399 | 3.7%), and Installation, Maintenance & Repair (79 | 0.7%).

Natural Resources, Construction and Maintenance Occupations by Sex
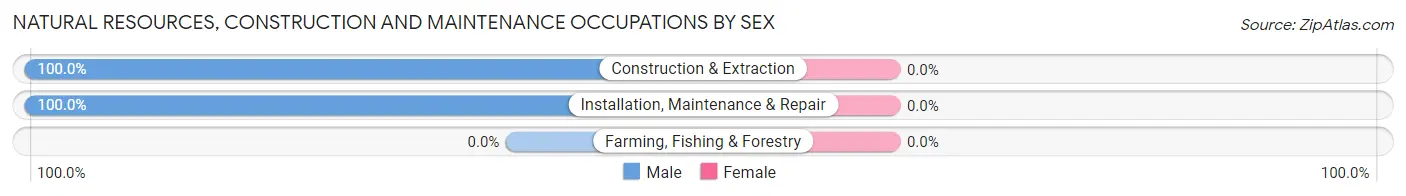
| Occupation | Male | Female |
| Farming, Fishing & Forestry | 0 (0.0%) | 0 (0.0%) |
| Construction & Extraction | 399 (100.0%) | 0 (0.0%) |
| Installation, Maintenance & Repair | 79 (100.0%) | 0 (0.0%) |
| Total (Category) | 478 (100.0%) | 0 (0.0%) |
| Total (Overall) | 5,826 (53.9%) | 4,972 (46.1%) |
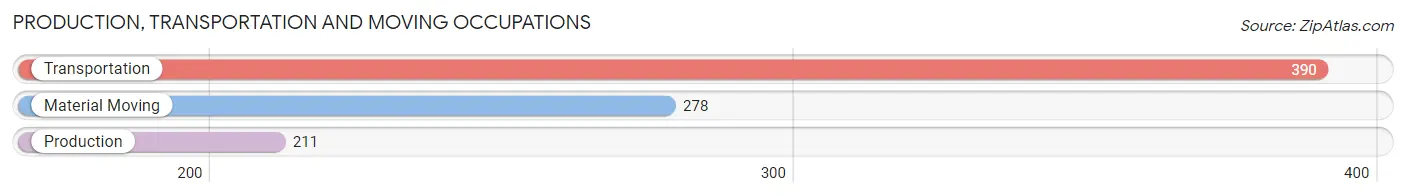
Production, Transportation and Moving Occupations
The most common Production, Transportation and Moving occupations in Lynbrook are Transportation (390 | 3.6%), Material Moving (278 | 2.6%), and Production (211 | 1.9%).
Production, Transportation and Moving Occupations by Sex
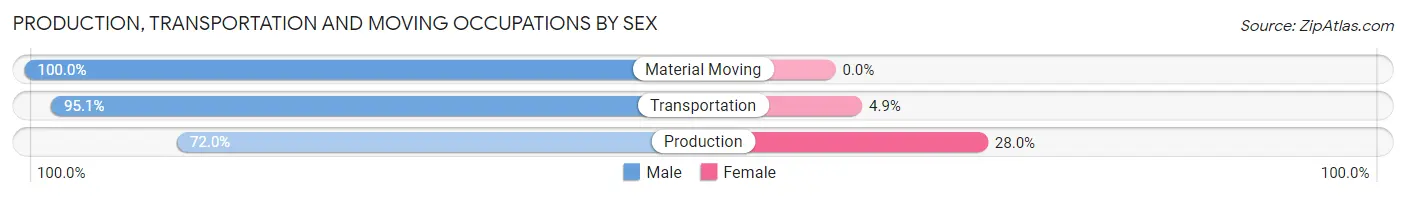
| Occupation | Male | Female |
| Production | 152 (72.0%) | 59 (28.0%) |
| Transportation | 371 (95.1%) | 19 (4.9%) |
| Material Moving | 278 (100.0%) | 0 (0.0%) |
| Total (Category) | 801 (91.1%) | 78 (8.9%) |
| Total (Overall) | 5,826 (53.9%) | 4,972 (46.1%) |
Employment Industries by Sex in Lynbrook
Employment Industries in Lynbrook
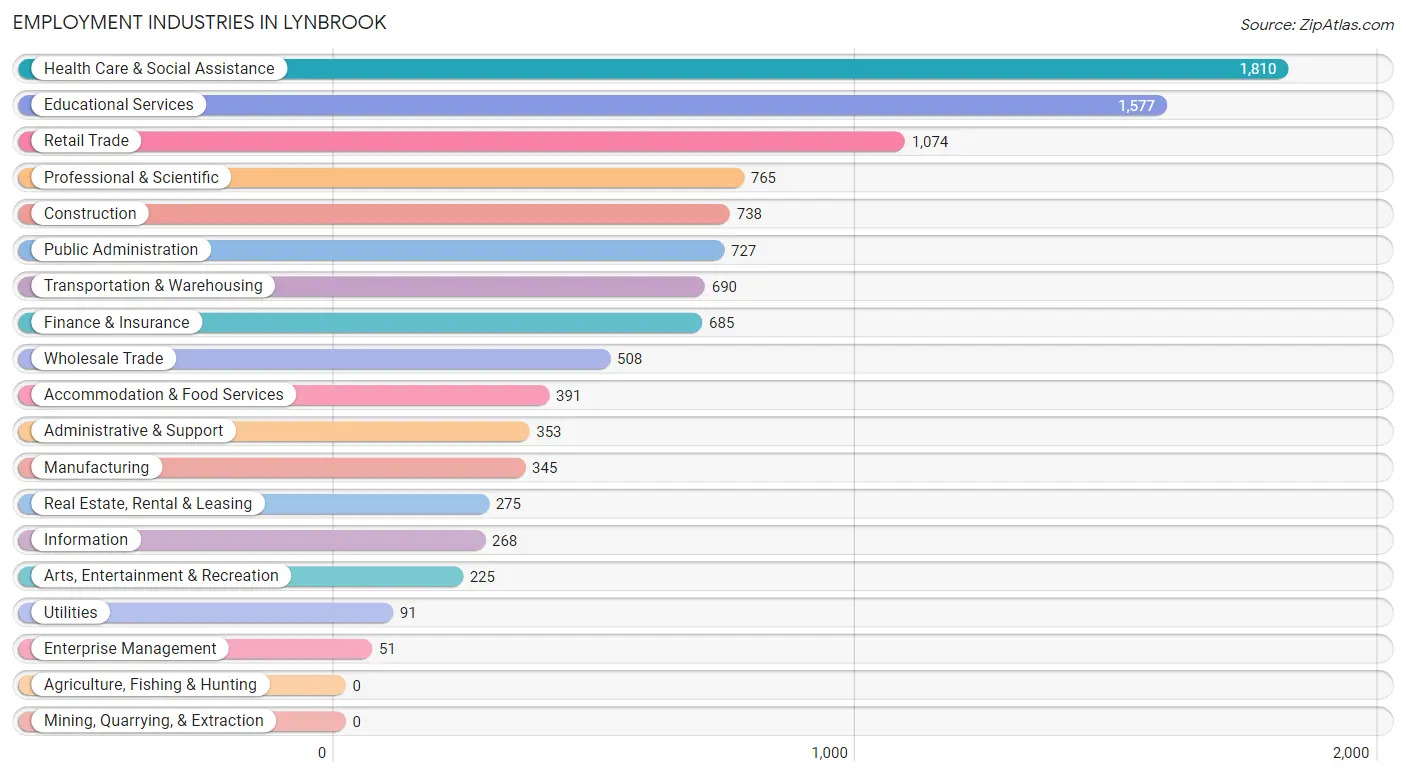
The major employment industries in Lynbrook include Health Care & Social Assistance (1,810 | 16.8%), Educational Services (1,577 | 14.6%), Retail Trade (1,074 | 10.0%), Professional & Scientific (765 | 7.1%), and Construction (738 | 6.8%).
Employment Industries by Sex in Lynbrook
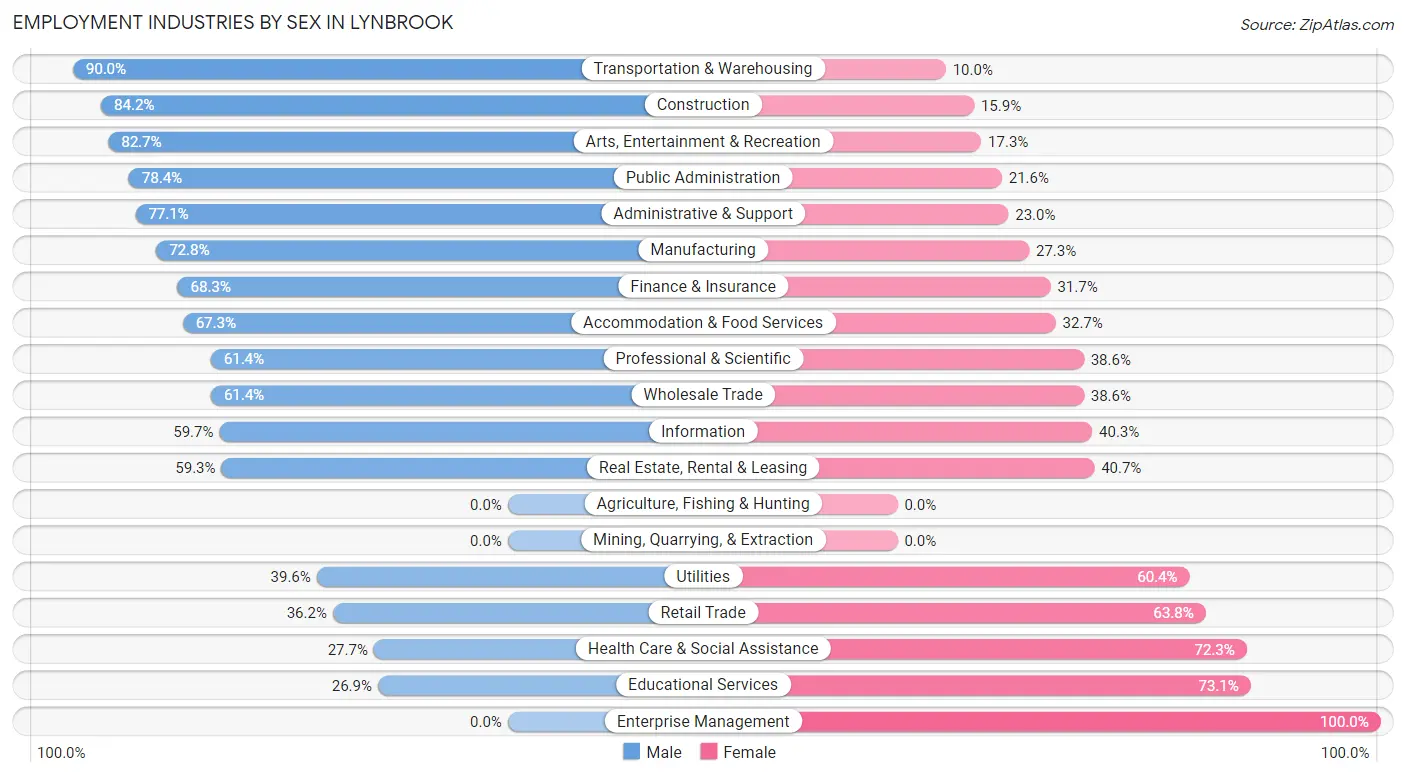
The Lynbrook industries that see more men than women are Transportation & Warehousing (90.0%), Construction (84.2%), and Arts, Entertainment & Recreation (82.7%), whereas the industries that tend to have a higher number of women are Enterprise Management (100.0%), Educational Services (73.1%), and Health Care & Social Assistance (72.3%).
| Industry | Male | Female |
| Agriculture, Fishing & Hunting | 0 (0.0%) | 0 (0.0%) |
| Mining, Quarrying, & Extraction | 0 (0.0%) | 0 (0.0%) |
| Construction | 621 (84.2%) | 117 (15.9%) |
| Manufacturing | 251 (72.8%) | 94 (27.3%) |
| Wholesale Trade | 312 (61.4%) | 196 (38.6%) |
| Retail Trade | 389 (36.2%) | 685 (63.8%) |
| Transportation & Warehousing | 621 (90.0%) | 69 (10.0%) |
| Utilities | 36 (39.6%) | 55 (60.4%) |
| Information | 160 (59.7%) | 108 (40.3%) |
| Finance & Insurance | 468 (68.3%) | 217 (31.7%) |
| Real Estate, Rental & Leasing | 163 (59.3%) | 112 (40.7%) |
| Professional & Scientific | 470 (61.4%) | 295 (38.6%) |
| Enterprise Management | 0 (0.0%) | 51 (100.0%) |
| Administrative & Support | 272 (77.0%) | 81 (23.0%) |
| Educational Services | 424 (26.9%) | 1,153 (73.1%) |
| Health Care & Social Assistance | 502 (27.7%) | 1,308 (72.3%) |
| Arts, Entertainment & Recreation | 186 (82.7%) | 39 (17.3%) |
| Accommodation & Food Services | 263 (67.3%) | 128 (32.7%) |
| Public Administration | 570 (78.4%) | 157 (21.6%) |
| Total | 5,826 (53.9%) | 4,972 (46.1%) |
Education in Lynbrook
School Enrollment in Lynbrook
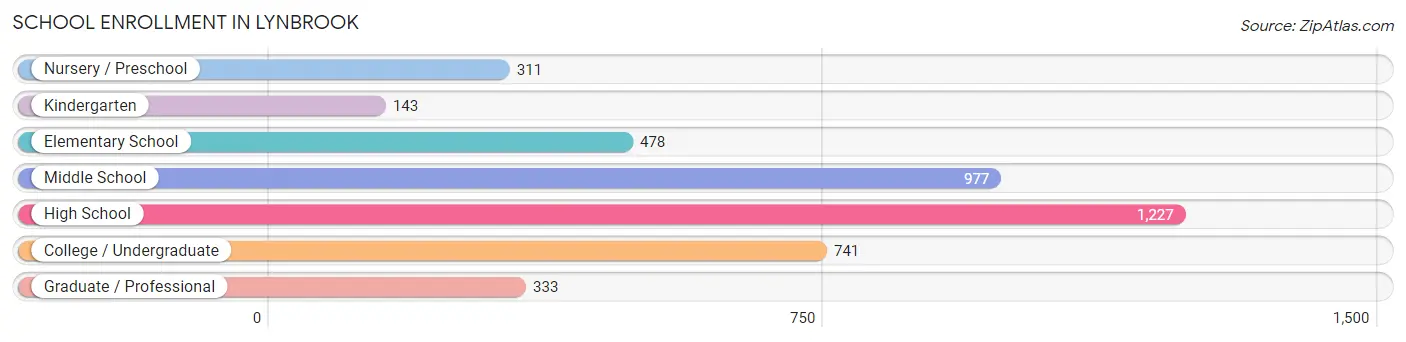
The most common levels of schooling among the 4,210 students in Lynbrook are high school (1,227 | 29.1%), middle school (977 | 23.2%), and college / undergraduate (741 | 17.6%).
| School Level | # Students | % Students |
| Nursery / Preschool | 311 | 7.4% |
| Kindergarten | 143 | 3.4% |
| Elementary School | 478 | 11.4% |
| Middle School | 977 | 23.2% |
| High School | 1,227 | 29.1% |
| College / Undergraduate | 741 | 17.6% |
| Graduate / Professional | 333 | 7.9% |
| Total | 4,210 | 100.0% |
School Enrollment by Age by Funding Source in Lynbrook
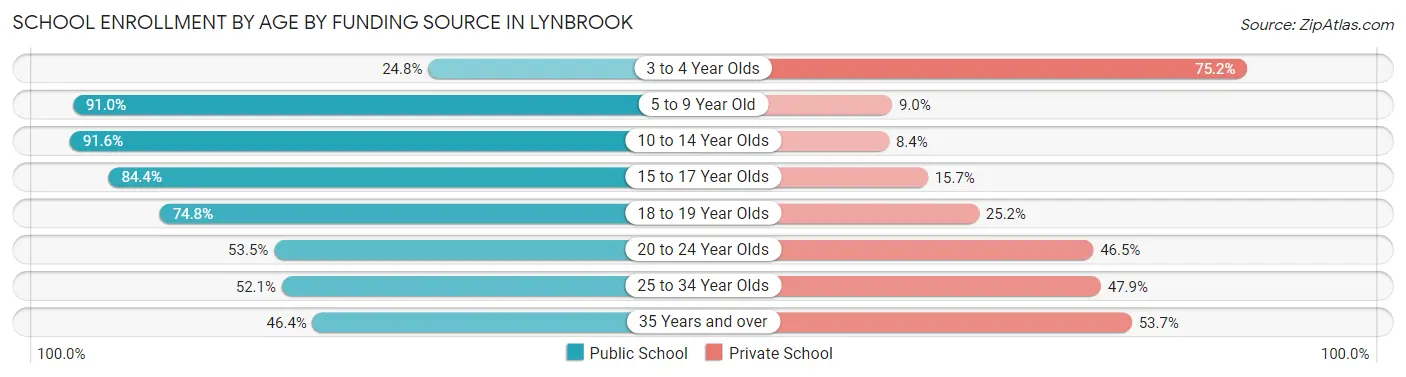
Out of a total of 4,210 students who are enrolled in schools in Lynbrook, 981 (23.3%) attend a private institution, while the remaining 3,229 (76.7%) are enrolled in public schools. The age group of 3 to 4 year olds has the highest likelihood of being enrolled in private schools, with 206 (75.2% in the age bracket) enrolled. Conversely, the age group of 10 to 14 year olds has the lowest likelihood of being enrolled in a private school, with 1,238 (91.6% in the age bracket) attending a public institution.
| Age Bracket | Public School | Private School |
| 3 to 4 Year Olds | 68 (24.8%) | 206 (75.2%) |
| 5 to 9 Year Old | 556 (91.0%) | 55 (9.0%) |
| 10 to 14 Year Olds | 1,238 (91.6%) | 114 (8.4%) |
| 15 to 17 Year Olds | 647 (84.4%) | 120 (15.7%) |
| 18 to 19 Year Olds | 315 (74.8%) | 106 (25.2%) |
| 20 to 24 Year Olds | 190 (53.5%) | 165 (46.5%) |
| 25 to 34 Year Olds | 124 (52.1%) | 114 (47.9%) |
| 35 Years and over | 89 (46.4%) | 103 (53.6%) |
| Total | 3,229 (76.7%) | 981 (23.3%) |
Educational Attainment by Field of Study in Lynbrook
Business (1,475 | 20.5%), education (942 | 13.1%), science & technology (863 | 12.0%), social sciences (811 | 11.3%), and psychology (441 | 6.1%) are the most common fields of study among 7,203 individuals in Lynbrook who have obtained a bachelor's degree or higher.
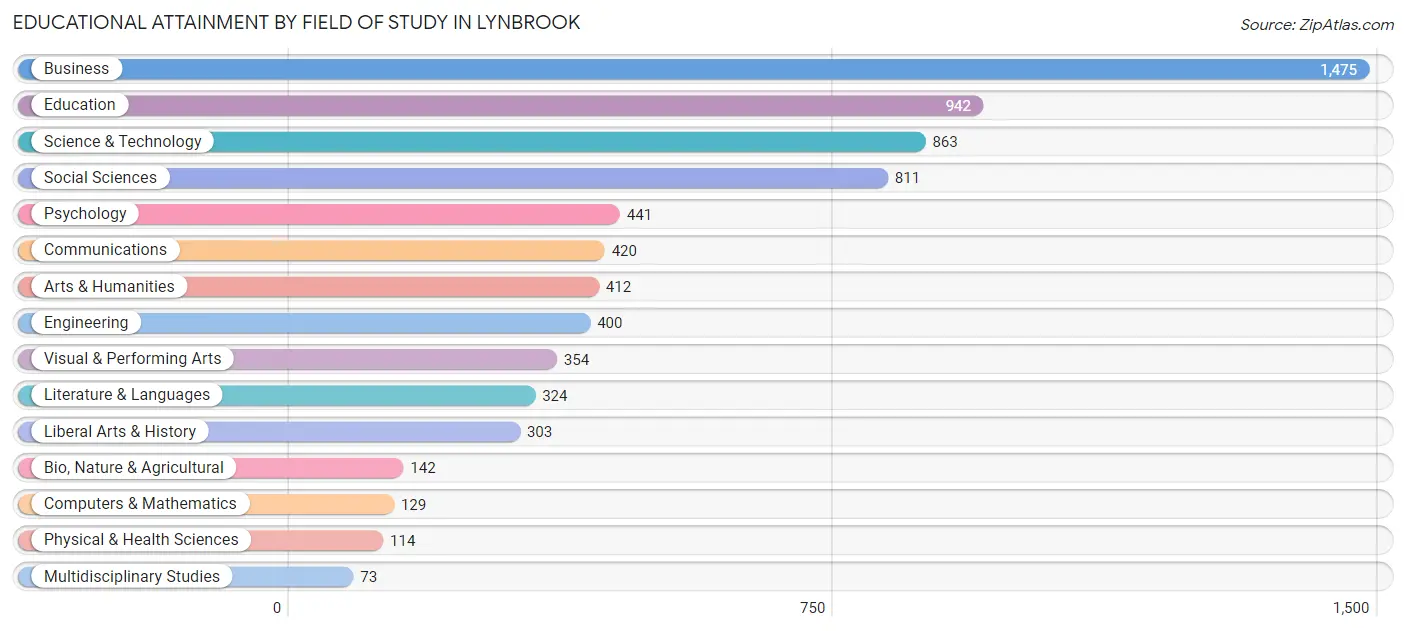
| Field of Study | # Graduates | % Graduates |
| Computers & Mathematics | 129 | 1.8% |
| Bio, Nature & Agricultural | 142 | 2.0% |
| Physical & Health Sciences | 114 | 1.6% |
| Psychology | 441 | 6.1% |
| Social Sciences | 811 | 11.3% |
| Engineering | 400 | 5.6% |
| Multidisciplinary Studies | 73 | 1.0% |
| Science & Technology | 863 | 12.0% |
| Business | 1,475 | 20.5% |
| Education | 942 | 13.1% |
| Literature & Languages | 324 | 4.5% |
| Liberal Arts & History | 303 | 4.2% |
| Visual & Performing Arts | 354 | 4.9% |
| Communications | 420 | 5.8% |
| Arts & Humanities | 412 | 5.7% |
| Total | 7,203 | 100.0% |
Transportation & Commute in Lynbrook
Vehicle Availability by Sex in Lynbrook
The most prevalent vehicle ownership categories in Lynbrook are males with 2 vehicles (2,328, accounting for 41.9%) and females with 2 vehicles (1,987, making up 48.0%).
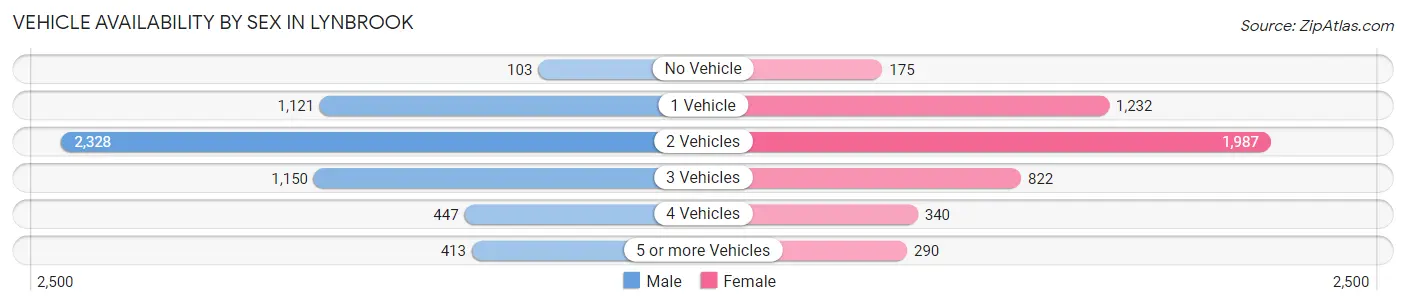
| Vehicles Available | Male | Female |
| No Vehicle | 103 (1.8%) | 175 (3.6%) |
| 1 Vehicle | 1,121 (20.2%) | 1,232 (25.4%) |
| 2 Vehicles | 2,328 (41.9%) | 1,987 (41.0%) |
| 3 Vehicles | 1,150 (20.7%) | 822 (17.0%) |
| 4 Vehicles | 447 (8.0%) | 340 (7.0%) |
| 5 or more Vehicles | 413 (7.4%) | 290 (6.0%) |
| Total | 5,562 (100.0%) | 4,846 (100.0%) |
Commute Time in Lynbrook
The most frequently occuring commute durations in Lynbrook are 60 to 89 minutes (1,601 commuters, 17.8%), 30 to 34 minutes (1,164 commuters, 12.9%), and 45 to 59 minutes (1,153 commuters, 12.8%).
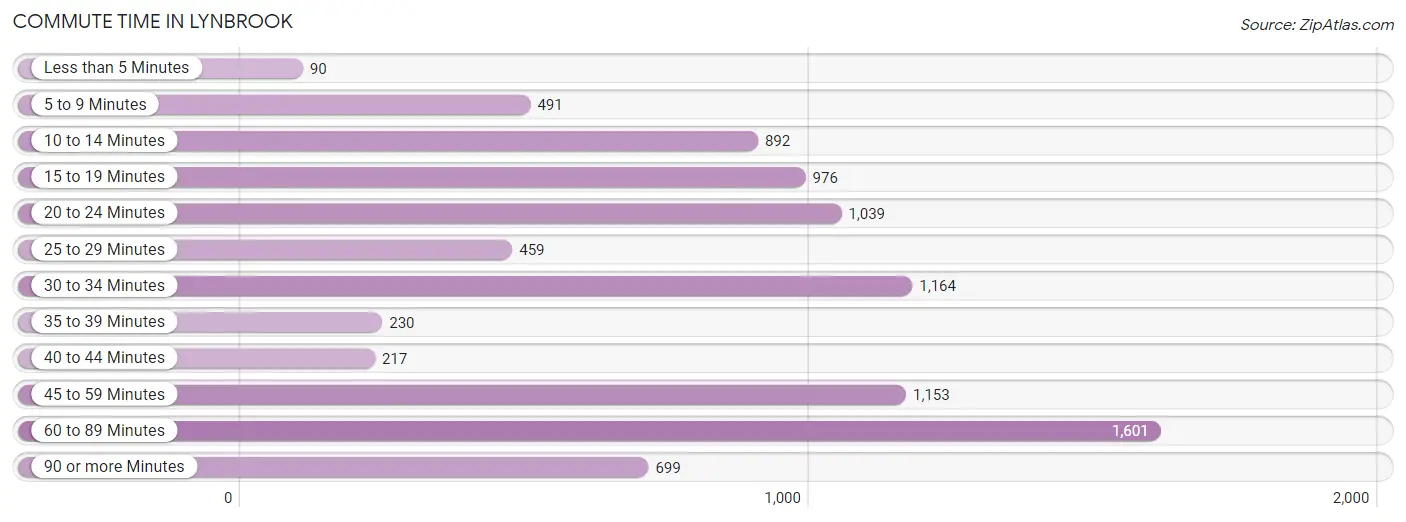
| Commute Time | # Commuters | % Commuters |
| Less than 5 Minutes | 90 | 1.0% |
| 5 to 9 Minutes | 491 | 5.4% |
| 10 to 14 Minutes | 892 | 9.9% |
| 15 to 19 Minutes | 976 | 10.8% |
| 20 to 24 Minutes | 1,039 | 11.5% |
| 25 to 29 Minutes | 459 | 5.1% |
| 30 to 34 Minutes | 1,164 | 12.9% |
| 35 to 39 Minutes | 230 | 2.5% |
| 40 to 44 Minutes | 217 | 2.4% |
| 45 to 59 Minutes | 1,153 | 12.8% |
| 60 to 89 Minutes | 1,601 | 17.8% |
| 90 or more Minutes | 699 | 7.8% |
Commute Time by Sex in Lynbrook
The most common commute times in Lynbrook are 60 to 89 minutes (1,153 commuters, 22.3%) for males and 10 to 14 minutes (599 commuters, 15.6%) for females.
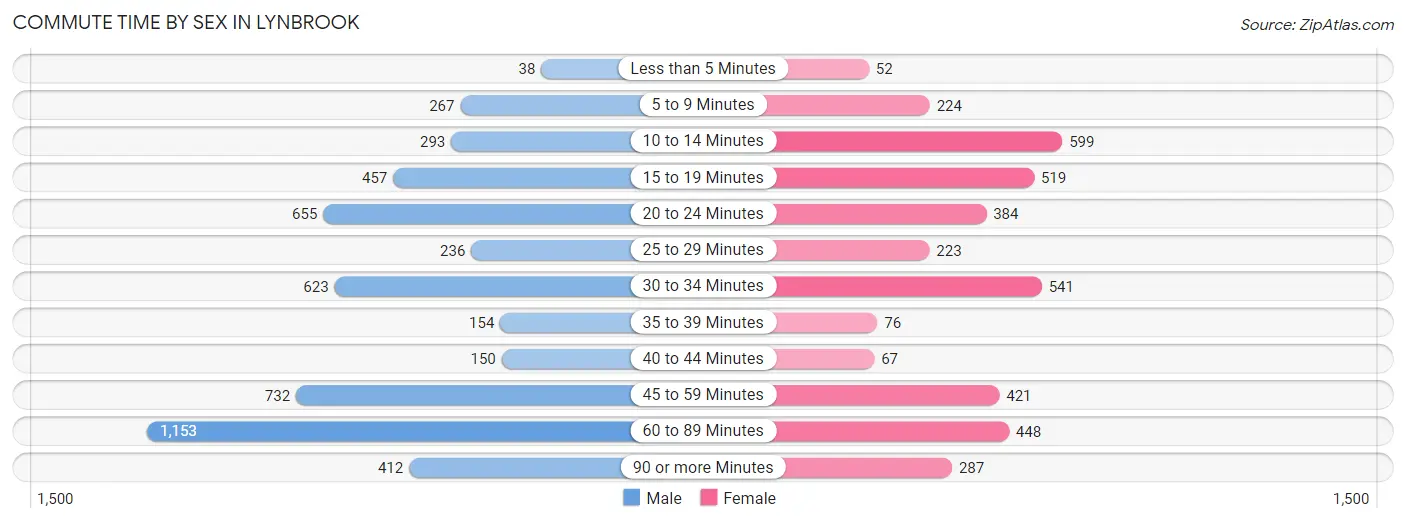
| Commute Time | Male | Female |
| Less than 5 Minutes | 38 (0.7%) | 52 (1.3%) |
| 5 to 9 Minutes | 267 (5.2%) | 224 (5.8%) |
| 10 to 14 Minutes | 293 (5.7%) | 599 (15.6%) |
| 15 to 19 Minutes | 457 (8.8%) | 519 (13.5%) |
| 20 to 24 Minutes | 655 (12.7%) | 384 (10.0%) |
| 25 to 29 Minutes | 236 (4.6%) | 223 (5.8%) |
| 30 to 34 Minutes | 623 (12.0%) | 541 (14.1%) |
| 35 to 39 Minutes | 154 (3.0%) | 76 (2.0%) |
| 40 to 44 Minutes | 150 (2.9%) | 67 (1.7%) |
| 45 to 59 Minutes | 732 (14.2%) | 421 (11.0%) |
| 60 to 89 Minutes | 1,153 (22.3%) | 448 (11.7%) |
| 90 or more Minutes | 412 (8.0%) | 287 (7.5%) |
Time of Departure to Work by Sex in Lynbrook
The most frequent times of departure to work in Lynbrook are 12:00 PM to 3:59 PM (628, 12.1%) for males and 8:00 AM to 8:29 AM (826, 21.5%) for females.
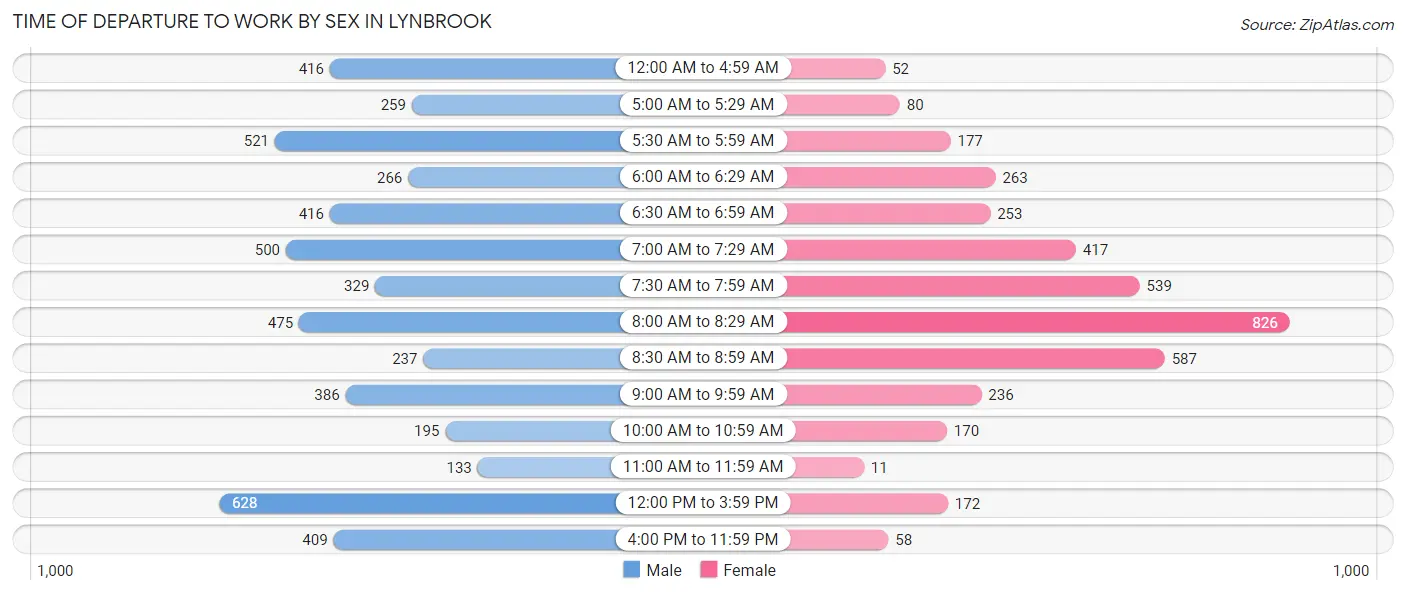
| Time of Departure | Male | Female |
| 12:00 AM to 4:59 AM | 416 (8.1%) | 52 (1.3%) |
| 5:00 AM to 5:29 AM | 259 (5.0%) | 80 (2.1%) |
| 5:30 AM to 5:59 AM | 521 (10.1%) | 177 (4.6%) |
| 6:00 AM to 6:29 AM | 266 (5.1%) | 263 (6.9%) |
| 6:30 AM to 6:59 AM | 416 (8.1%) | 253 (6.6%) |
| 7:00 AM to 7:29 AM | 500 (9.7%) | 417 (10.9%) |
| 7:30 AM to 7:59 AM | 329 (6.4%) | 539 (14.0%) |
| 8:00 AM to 8:29 AM | 475 (9.2%) | 826 (21.5%) |
| 8:30 AM to 8:59 AM | 237 (4.6%) | 587 (15.3%) |
| 9:00 AM to 9:59 AM | 386 (7.5%) | 236 (6.1%) |
| 10:00 AM to 10:59 AM | 195 (3.8%) | 170 (4.4%) |
| 11:00 AM to 11:59 AM | 133 (2.6%) | 11 (0.3%) |
| 12:00 PM to 3:59 PM | 628 (12.1%) | 172 (4.5%) |
| 4:00 PM to 11:59 PM | 409 (7.9%) | 58 (1.5%) |
| Total | 5,170 (100.0%) | 3,841 (100.0%) |
Housing Occupancy in Lynbrook
Occupancy by Ownership in Lynbrook
Of the total 7,031 dwellings in Lynbrook, owner-occupied units account for 5,200 (74.0%), while renter-occupied units make up 1,831 (26.0%).
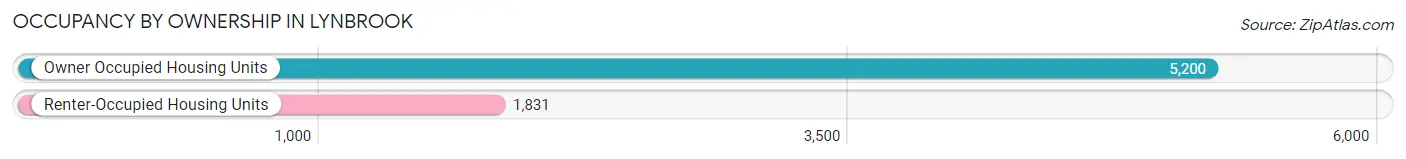
| Occupancy | # Housing Units | % Housing Units |
| Owner Occupied Housing Units | 5,200 | 74.0% |
| Renter-Occupied Housing Units | 1,831 | 26.0% |
| Total Occupied Housing Units | 7,031 | 100.0% |
Occupancy by Household Size in Lynbrook
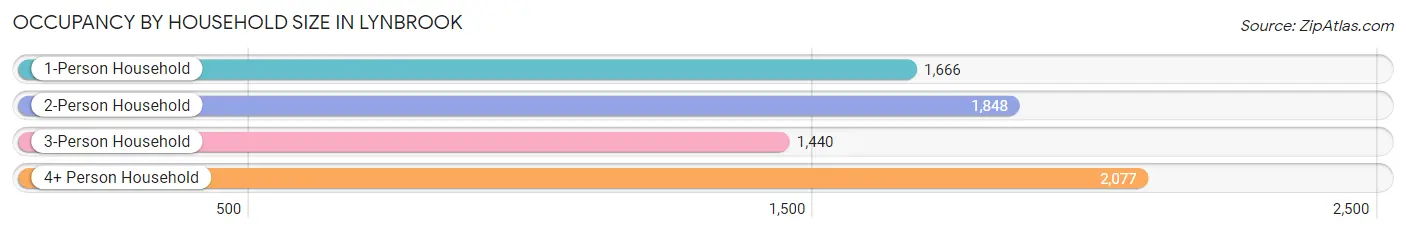
| Household Size | # Housing Units | % Housing Units |
| 1-Person Household | 1,666 | 23.7% |
| 2-Person Household | 1,848 | 26.3% |
| 3-Person Household | 1,440 | 20.5% |
| 4+ Person Household | 2,077 | 29.5% |
| Total Housing Units | 7,031 | 100.0% |
Occupancy by Ownership by Household Size in Lynbrook
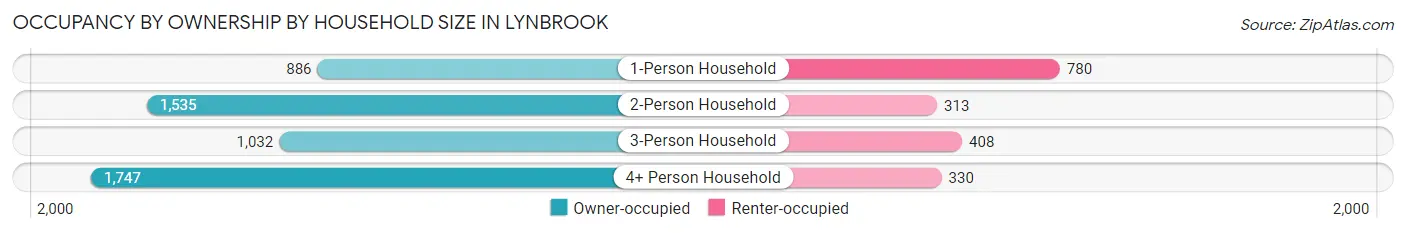
| Household Size | Owner-occupied | Renter-occupied |
| 1-Person Household | 886 (53.2%) | 780 (46.8%) |
| 2-Person Household | 1,535 (83.1%) | 313 (16.9%) |
| 3-Person Household | 1,032 (71.7%) | 408 (28.3%) |
| 4+ Person Household | 1,747 (84.1%) | 330 (15.9%) |
| Total Housing Units | 5,200 (74.0%) | 1,831 (26.0%) |
Occupancy by Educational Attainment in Lynbrook
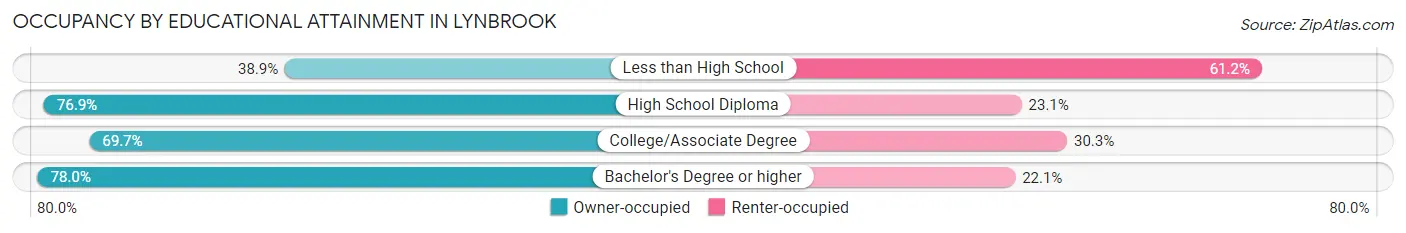
| Household Size | Owner-occupied | Renter-occupied |
| Less than High School | 115 (38.9%) | 181 (61.2%) |
| High School Diploma | 1,127 (76.9%) | 338 (23.1%) |
| College/Associate Degree | 1,271 (69.7%) | 552 (30.3%) |
| Bachelor's Degree or higher | 2,687 (77.9%) | 760 (22.1%) |
Occupancy by Age of Householder in Lynbrook
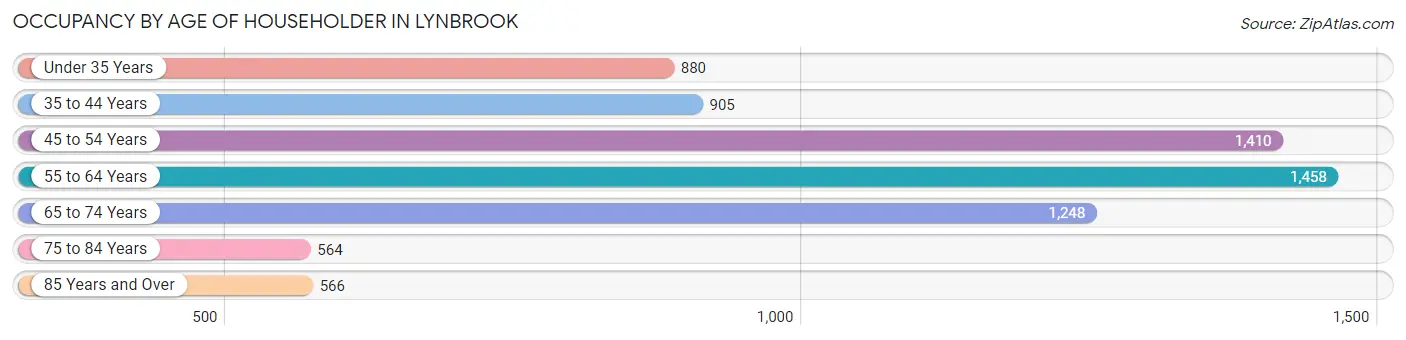
| Age Bracket | # Households | % Households |
| Under 35 Years | 880 | 12.5% |
| 35 to 44 Years | 905 | 12.9% |
| 45 to 54 Years | 1,410 | 20.1% |
| 55 to 64 Years | 1,458 | 20.7% |
| 65 to 74 Years | 1,248 | 17.7% |
| 75 to 84 Years | 564 | 8.0% |
| 85 Years and Over | 566 | 8.1% |
| Total | 7,031 | 100.0% |
Housing Finances in Lynbrook
Median Income by Occupancy in Lynbrook
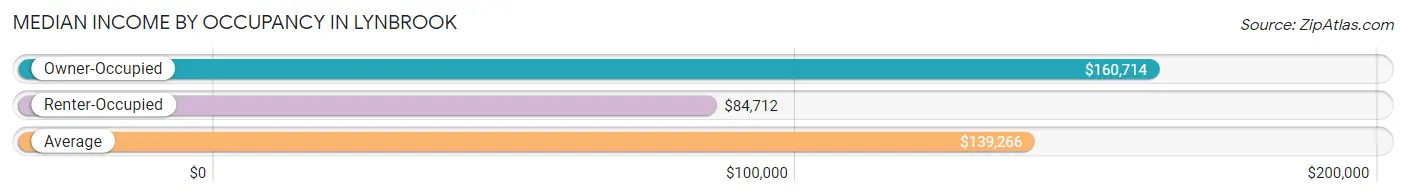
| Occupancy Type | # Households | Median Income |
| Owner-Occupied | 5,200 (74.0%) | $160,714 |
| Renter-Occupied | 1,831 (26.0%) | $84,712 |
| Average | 7,031 (100.0%) | $139,266 |
Occupancy by Householder Income Bracket in Lynbrook
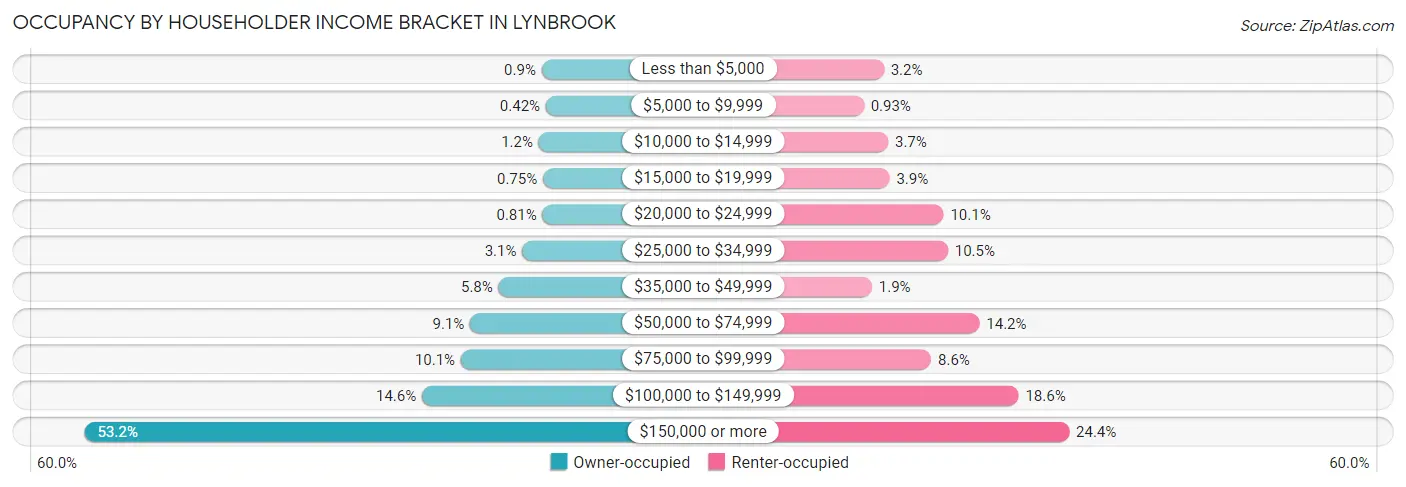
| Income Bracket | Owner-occupied | Renter-occupied |
| Less than $5,000 | 47 (0.9%) | 59 (3.2%) |
| $5,000 to $9,999 | 22 (0.4%) | 17 (0.9%) |
| $10,000 to $14,999 | 64 (1.2%) | 68 (3.7%) |
| $15,000 to $19,999 | 39 (0.7%) | 71 (3.9%) |
| $20,000 to $24,999 | 42 (0.8%) | 184 (10.1%) |
| $25,000 to $34,999 | 162 (3.1%) | 193 (10.5%) |
| $35,000 to $49,999 | 303 (5.8%) | 34 (1.9%) |
| $50,000 to $74,999 | 472 (9.1%) | 259 (14.1%) |
| $75,000 to $99,999 | 527 (10.1%) | 158 (8.6%) |
| $100,000 to $149,999 | 758 (14.6%) | 341 (18.6%) |
| $150,000 or more | 2,764 (53.1%) | 447 (24.4%) |
| Total | 5,200 (100.0%) | 1,831 (100.0%) |
Monthly Housing Cost Tiers in Lynbrook
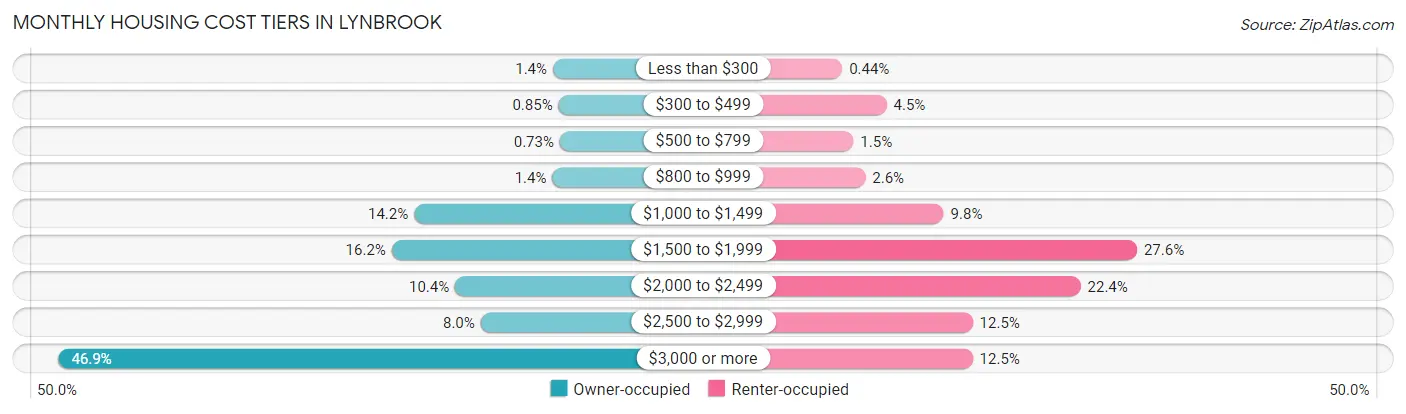
| Monthly Cost | Owner-occupied | Renter-occupied |
| Less than $300 | 71 (1.4%) | 8 (0.4%) |
| $300 to $499 | 44 (0.9%) | 83 (4.5%) |
| $500 to $799 | 38 (0.7%) | 27 (1.5%) |
| $800 to $999 | 74 (1.4%) | 47 (2.6%) |
| $1,000 to $1,499 | 736 (14.1%) | 179 (9.8%) |
| $1,500 to $1,999 | 843 (16.2%) | 505 (27.6%) |
| $2,000 to $2,499 | 539 (10.4%) | 410 (22.4%) |
| $2,500 to $2,999 | 417 (8.0%) | 228 (12.4%) |
| $3,000 or more | 2,438 (46.9%) | 228 (12.4%) |
| Total | 5,200 (100.0%) | 1,831 (100.0%) |
Physical Housing Characteristics in Lynbrook
Housing Structures in Lynbrook
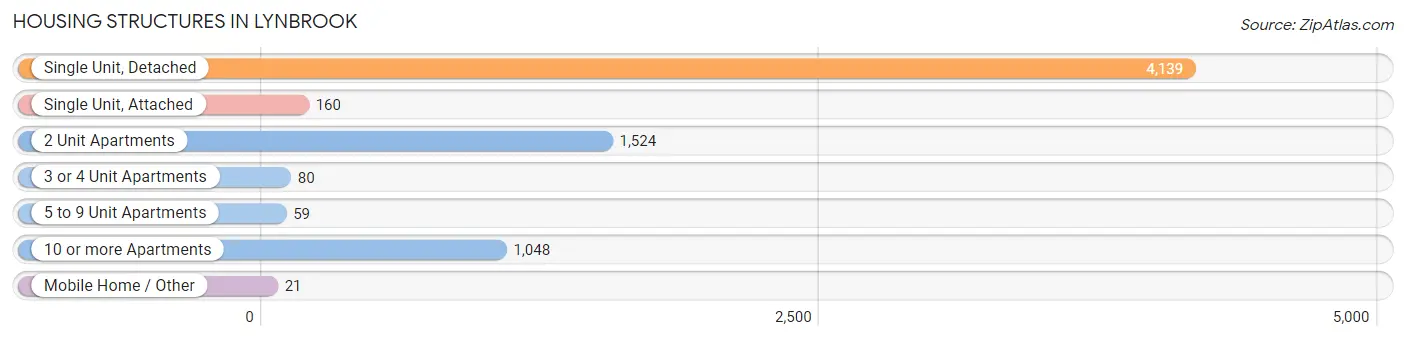
| Structure Type | # Housing Units | % Housing Units |
| Single Unit, Detached | 4,139 | 58.9% |
| Single Unit, Attached | 160 | 2.3% |
| 2 Unit Apartments | 1,524 | 21.7% |
| 3 or 4 Unit Apartments | 80 | 1.1% |
| 5 to 9 Unit Apartments | 59 | 0.8% |
| 10 or more Apartments | 1,048 | 14.9% |
| Mobile Home / Other | 21 | 0.3% |
| Total | 7,031 | 100.0% |
Housing Structures by Occupancy in Lynbrook
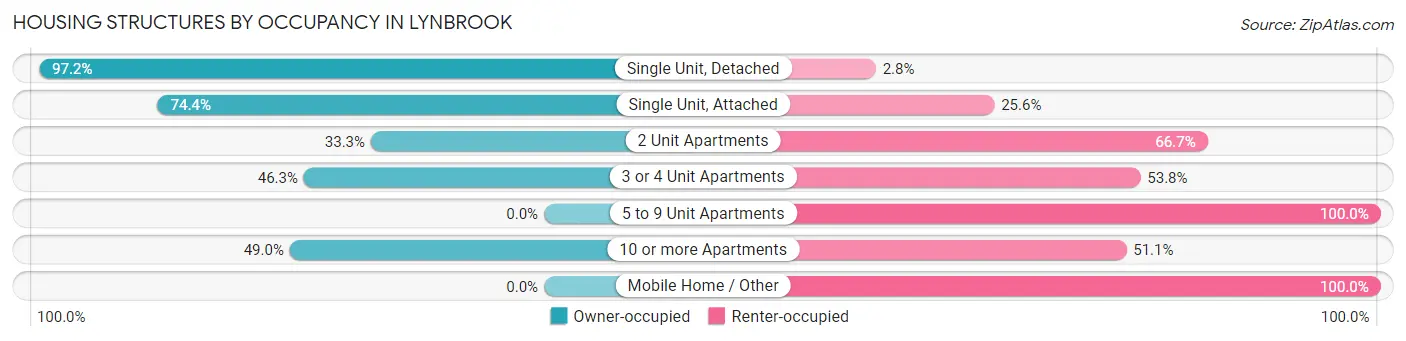
| Structure Type | Owner-occupied | Renter-occupied |
| Single Unit, Detached | 4,023 (97.2%) | 116 (2.8%) |
| Single Unit, Attached | 119 (74.4%) | 41 (25.6%) |
| 2 Unit Apartments | 508 (33.3%) | 1,016 (66.7%) |
| 3 or 4 Unit Apartments | 37 (46.3%) | 43 (53.7%) |
| 5 to 9 Unit Apartments | 0 (0.0%) | 59 (100.0%) |
| 10 or more Apartments | 513 (48.9%) | 535 (51.0%) |
| Mobile Home / Other | 0 (0.0%) | 21 (100.0%) |
| Total | 5,200 (74.0%) | 1,831 (26.0%) |
Housing Structures by Number of Rooms in Lynbrook
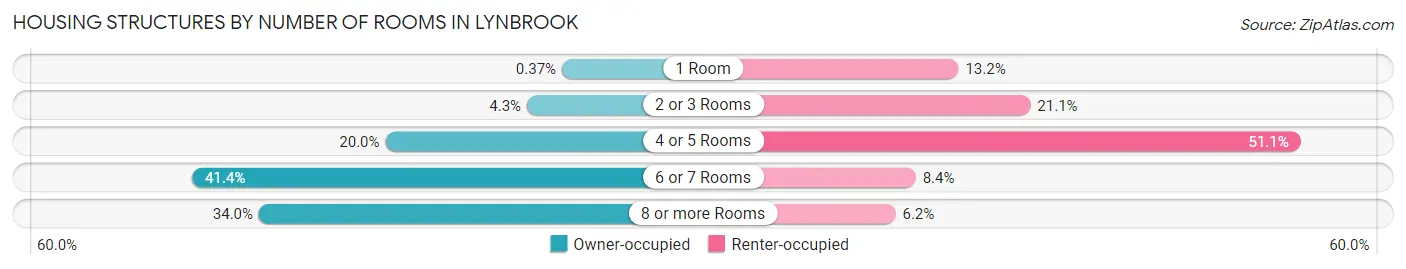
| Number of Rooms | Owner-occupied | Renter-occupied |
| 1 Room | 19 (0.4%) | 241 (13.2%) |
| 2 or 3 Rooms | 221 (4.3%) | 387 (21.1%) |
| 4 or 5 Rooms | 1,038 (20.0%) | 936 (51.1%) |
| 6 or 7 Rooms | 2,154 (41.4%) | 154 (8.4%) |
| 8 or more Rooms | 1,768 (34.0%) | 113 (6.2%) |
| Total | 5,200 (100.0%) | 1,831 (100.0%) |
Housing Structure by Heating Type in Lynbrook
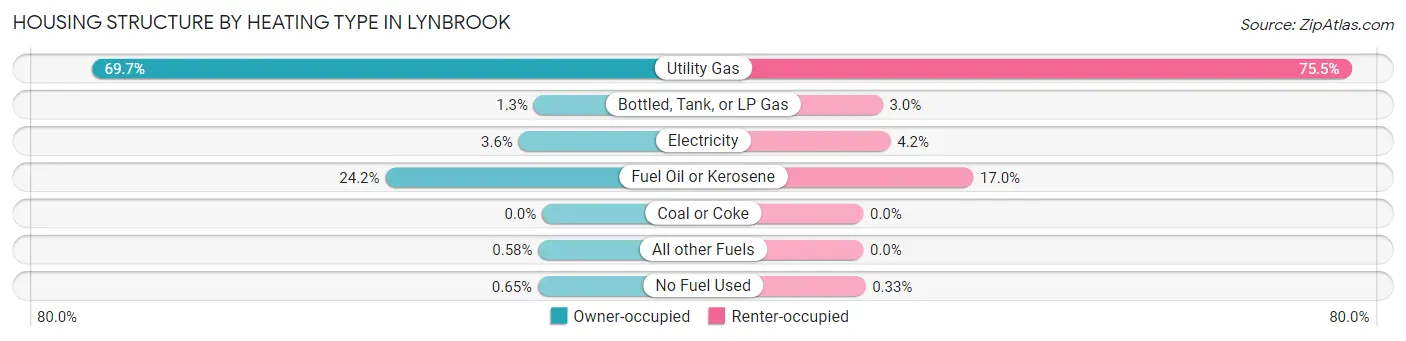
| Heating Type | Owner-occupied | Renter-occupied |
| Utility Gas | 3,622 (69.7%) | 1,382 (75.5%) |
| Bottled, Tank, or LP Gas | 66 (1.3%) | 55 (3.0%) |
| Electricity | 188 (3.6%) | 77 (4.2%) |
| Fuel Oil or Kerosene | 1,260 (24.2%) | 311 (17.0%) |
| Coal or Coke | 0 (0.0%) | 0 (0.0%) |
| All other Fuels | 30 (0.6%) | 0 (0.0%) |
| No Fuel Used | 34 (0.6%) | 6 (0.3%) |
| Total | 5,200 (100.0%) | 1,831 (100.0%) |
Household Vehicle Usage in Lynbrook
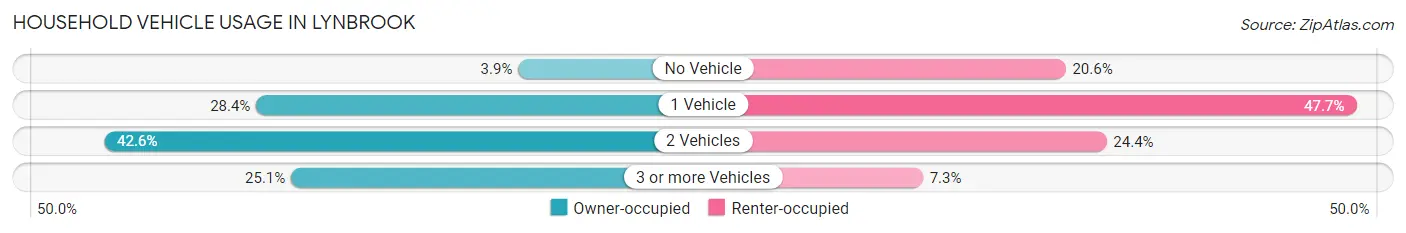
| Vehicles per Household | Owner-occupied | Renter-occupied |
| No Vehicle | 204 (3.9%) | 377 (20.6%) |
| 1 Vehicle | 1,476 (28.4%) | 874 (47.7%) |
| 2 Vehicles | 2,214 (42.6%) | 447 (24.4%) |
| 3 or more Vehicles | 1,306 (25.1%) | 133 (7.3%) |
| Total | 5,200 (100.0%) | 1,831 (100.0%) |
Real Estate & Mortgages in Lynbrook
Real Estate and Mortgage Overview in Lynbrook
| Characteristic | Without Mortgage | With Mortgage |
| Housing Units | 1,855 | 3,345 |
| Median Property Value | $561,900 | $598,400 |
| Median Household Income | $101,563 | $2,082 |
| Monthly Housing Costs | $1,501 | $2,400 |
| Real Estate Taxes | $10,001 | $219 |
Property Value by Mortgage Status in Lynbrook
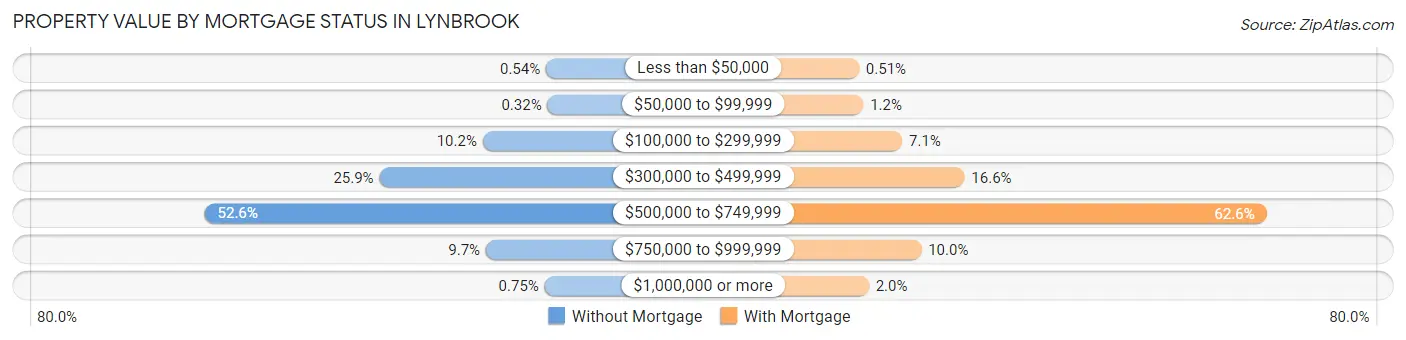
| Property Value | Without Mortgage | With Mortgage |
| Less than $50,000 | 10 (0.5%) | 17 (0.5%) |
| $50,000 to $99,999 | 6 (0.3%) | 39 (1.2%) |
| $100,000 to $299,999 | 189 (10.2%) | 237 (7.1%) |
| $300,000 to $499,999 | 481 (25.9%) | 555 (16.6%) |
| $500,000 to $749,999 | 975 (52.6%) | 2,095 (62.6%) |
| $750,000 to $999,999 | 180 (9.7%) | 335 (10.0%) |
| $1,000,000 or more | 14 (0.7%) | 67 (2.0%) |
| Total | 1,855 (100.0%) | 3,345 (100.0%) |
Household Income by Mortgage Status in Lynbrook
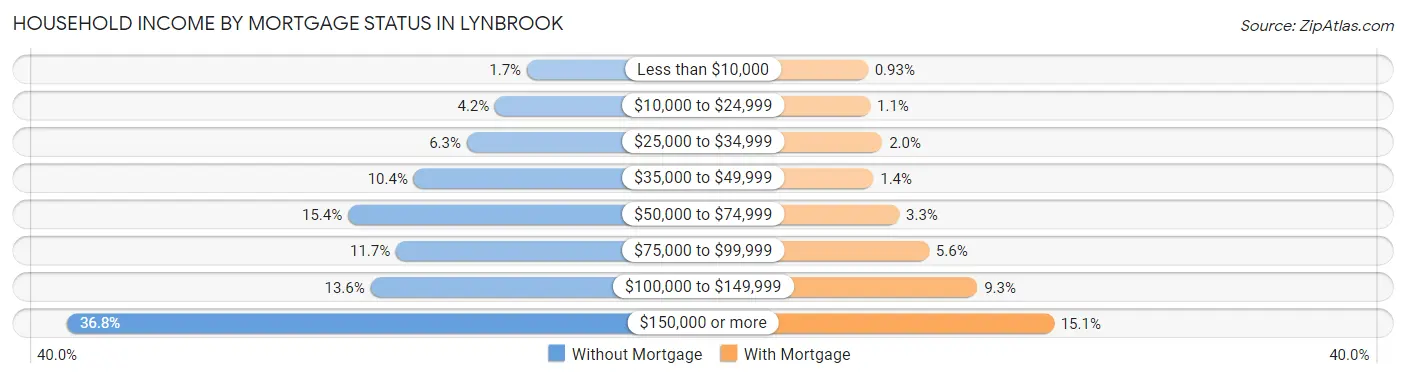
| Household Income | Without Mortgage | With Mortgage |
| Less than $10,000 | 32 (1.7%) | 31 (0.9%) |
| $10,000 to $24,999 | 77 (4.2%) | 37 (1.1%) |
| $25,000 to $34,999 | 117 (6.3%) | 68 (2.0%) |
| $35,000 to $49,999 | 192 (10.3%) | 45 (1.3%) |
| $50,000 to $74,999 | 285 (15.4%) | 111 (3.3%) |
| $75,000 to $99,999 | 217 (11.7%) | 187 (5.6%) |
| $100,000 to $149,999 | 253 (13.6%) | 310 (9.3%) |
| $150,000 or more | 682 (36.8%) | 505 (15.1%) |
| Total | 1,855 (100.0%) | 3,345 (100.0%) |
Property Value to Household Income Ratio in Lynbrook
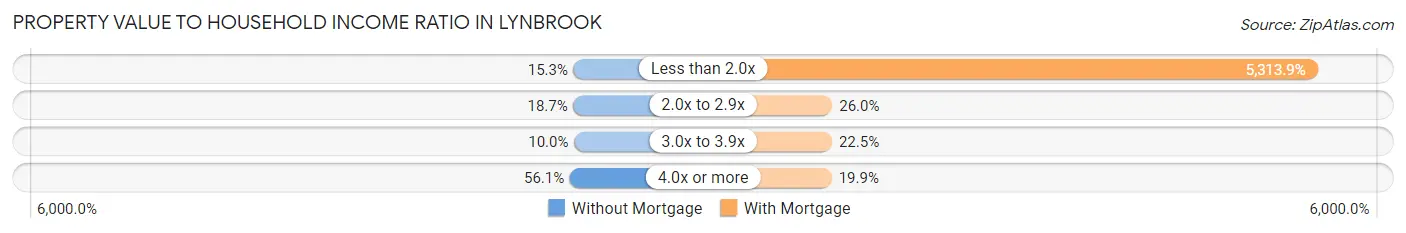
| Value-to-Income Ratio | Without Mortgage | With Mortgage |
| Less than 2.0x | 283 (15.3%) | 177,750 (5,313.9%) |
| 2.0x to 2.9x | 346 (18.6%) | 868 (26.0%) |
| 3.0x to 3.9x | 186 (10.0%) | 752 (22.5%) |
| 4.0x or more | 1,040 (56.1%) | 665 (19.9%) |
| Total | 1,855 (100.0%) | 3,345 (100.0%) |
Real Estate Taxes by Mortgage Status in Lynbrook
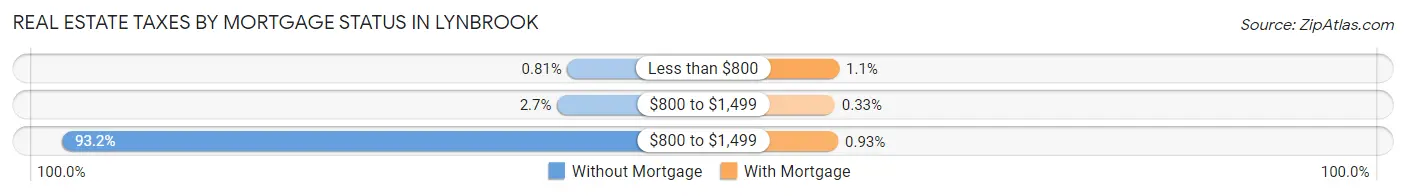
| Property Taxes | Without Mortgage | With Mortgage |
| Less than $800 | 15 (0.8%) | 37 (1.1%) |
| $800 to $1,499 | 50 (2.7%) | 11 (0.3%) |
| $800 to $1,499 | 1,728 (93.1%) | 31 (0.9%) |
| Total | 1,855 (100.0%) | 3,345 (100.0%) |
Health & Disability in Lynbrook
Health Insurance Coverage by Age in Lynbrook
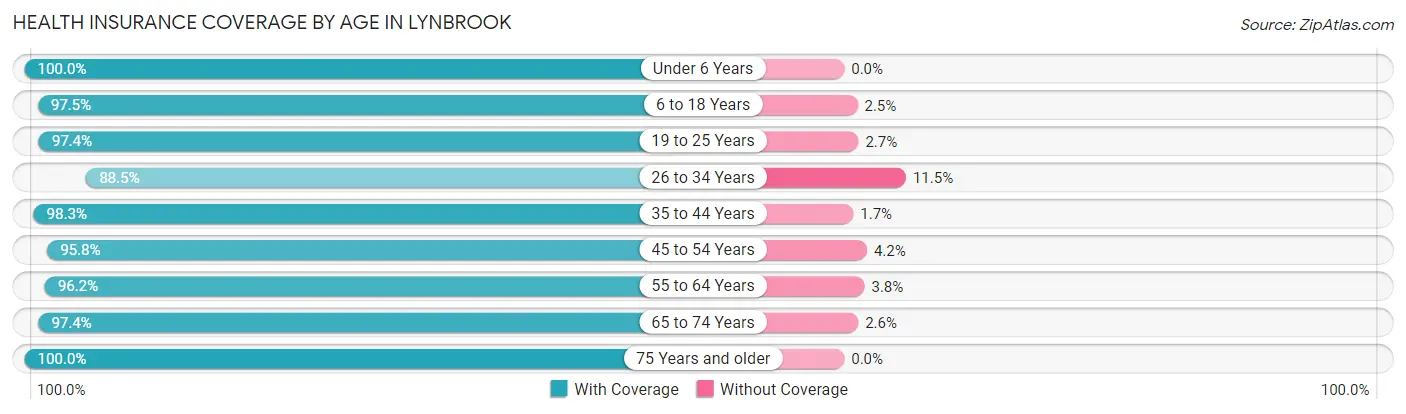
| Age Bracket | With Coverage | Without Coverage |
| Under 6 Years | 1,434 (100.0%) | 0 (0.0%) |
| 6 to 18 Years | 2,882 (97.5%) | 73 (2.5%) |
| 19 to 25 Years | 1,140 (97.4%) | 31 (2.6%) |
| 26 to 34 Years | 2,225 (88.5%) | 289 (11.5%) |
| 35 to 44 Years | 2,385 (98.3%) | 41 (1.7%) |
| 45 to 54 Years | 2,626 (95.8%) | 116 (4.2%) |
| 55 to 64 Years | 2,727 (96.2%) | 107 (3.8%) |
| 65 to 74 Years | 2,145 (97.4%) | 57 (2.6%) |
| 75 Years and older | 2,021 (100.0%) | 0 (0.0%) |
| Total | 19,585 (96.5%) | 714 (3.5%) |
Health Insurance Coverage by Citizenship Status in Lynbrook
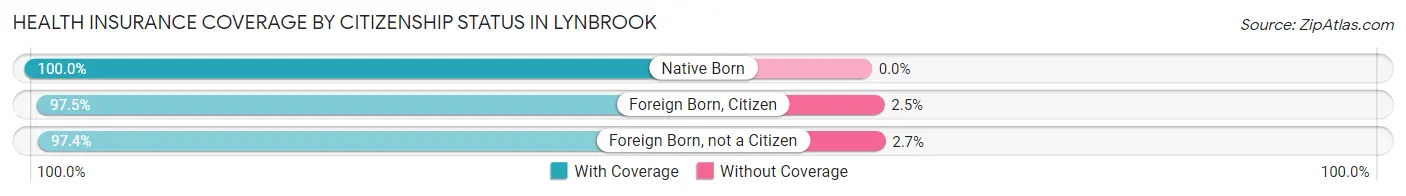
| Citizenship Status | With Coverage | Without Coverage |
| Native Born | 1,434 (100.0%) | 0 (0.0%) |
| Foreign Born, Citizen | 2,882 (97.5%) | 73 (2.5%) |
| Foreign Born, not a Citizen | 1,140 (97.4%) | 31 (2.6%) |
Health Insurance Coverage by Household Income in Lynbrook
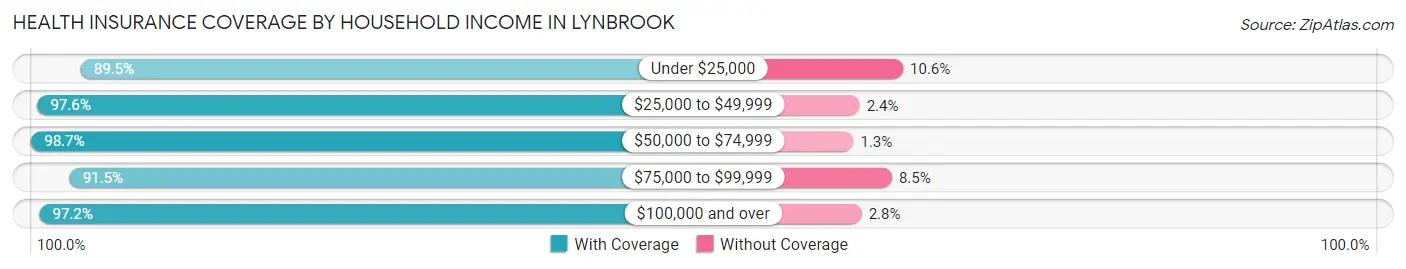
| Household Income | With Coverage | Without Coverage |
| Under $25,000 | 1,043 (89.4%) | 123 (10.5%) |
| $25,000 to $49,999 | 1,252 (97.6%) | 31 (2.4%) |
| $50,000 to $74,999 | 1,881 (98.7%) | 24 (1.3%) |
| $75,000 to $99,999 | 1,494 (91.5%) | 138 (8.5%) |
| $100,000 and over | 13,837 (97.2%) | 398 (2.8%) |
Public vs Private Health Insurance Coverage by Age in Lynbrook
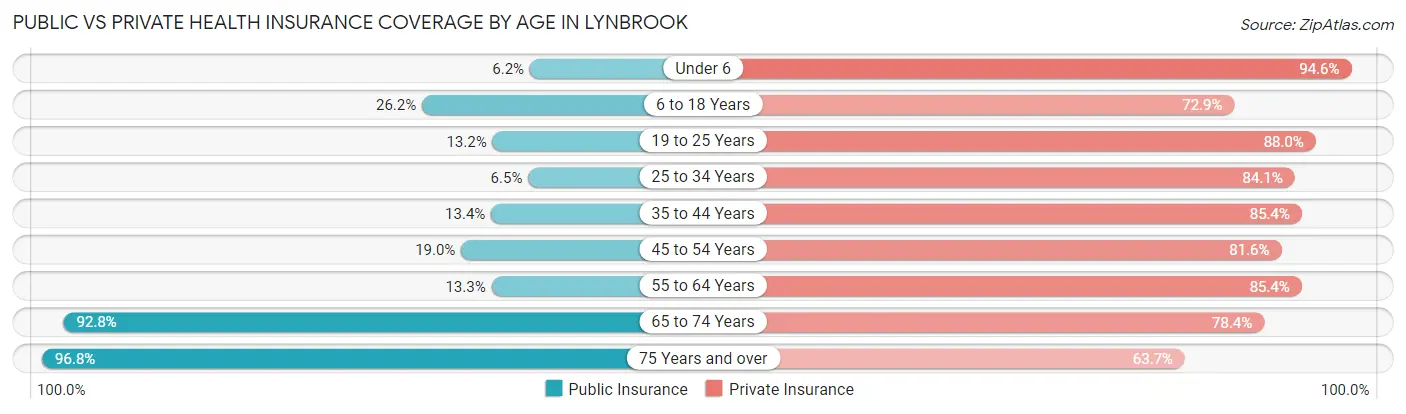
| Age Bracket | Public Insurance | Private Insurance |
| Under 6 | 89 (6.2%) | 1,356 (94.6%) |
| 6 to 18 Years | 775 (26.2%) | 2,153 (72.9%) |
| 19 to 25 Years | 154 (13.2%) | 1,030 (88.0%) |
| 25 to 34 Years | 164 (6.5%) | 2,113 (84.1%) |
| 35 to 44 Years | 325 (13.4%) | 2,071 (85.4%) |
| 45 to 54 Years | 520 (19.0%) | 2,237 (81.6%) |
| 55 to 64 Years | 378 (13.3%) | 2,419 (85.4%) |
| 65 to 74 Years | 2,043 (92.8%) | 1,726 (78.4%) |
| 75 Years and over | 1,956 (96.8%) | 1,287 (63.7%) |
| Total | 6,404 (31.6%) | 16,392 (80.7%) |
Disability Status by Sex by Age in Lynbrook
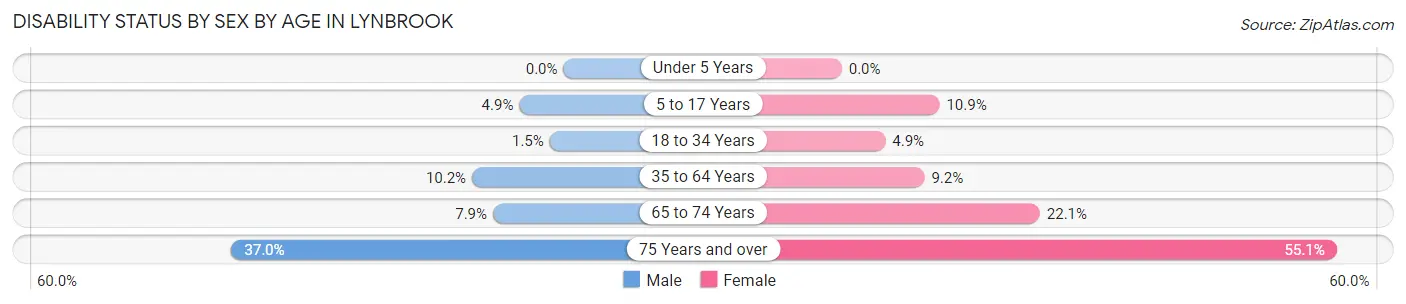
| Age Bracket | Male | Female |
| Under 5 Years | 0 (0.0%) | 0 (0.0%) |
| 5 to 17 Years | 52 (4.9%) | 188 (10.9%) |
| 18 to 34 Years | 34 (1.5%) | 87 (4.9%) |
| 35 to 64 Years | 399 (10.2%) | 376 (9.2%) |
| 65 to 74 Years | 80 (7.9%) | 261 (22.1%) |
| 75 Years and over | 281 (37.0%) | 695 (55.1%) |
Disability Class by Sex by Age in Lynbrook
Disability Class: Hearing Difficulty
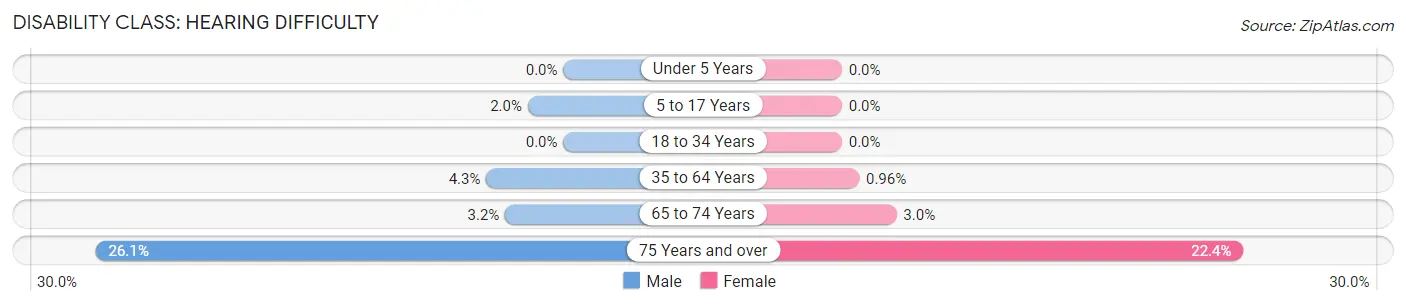
| Age Bracket | Male | Female |
| Under 5 Years | 0 (0.0%) | 0 (0.0%) |
| 5 to 17 Years | 21 (2.0%) | 0 (0.0%) |
| 18 to 34 Years | 0 (0.0%) | 0 (0.0%) |
| 35 to 64 Years | 168 (4.3%) | 39 (1.0%) |
| 65 to 74 Years | 33 (3.2%) | 36 (3.0%) |
| 75 Years and over | 198 (26.1%) | 282 (22.4%) |
Disability Class: Vision Difficulty
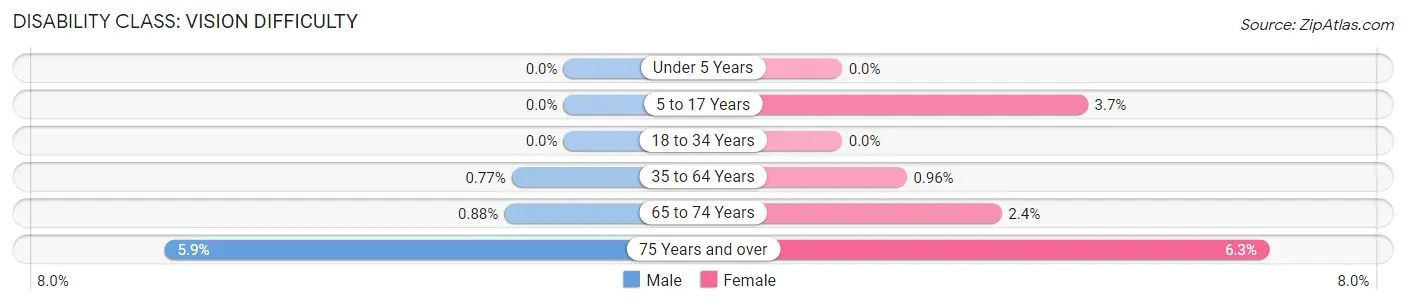
| Age Bracket | Male | Female |
| Under 5 Years | 0 (0.0%) | 0 (0.0%) |
| 5 to 17 Years | 0 (0.0%) | 63 (3.6%) |
| 18 to 34 Years | 0 (0.0%) | 0 (0.0%) |
| 35 to 64 Years | 30 (0.8%) | 39 (1.0%) |
| 65 to 74 Years | 9 (0.9%) | 28 (2.4%) |
| 75 Years and over | 45 (5.9%) | 80 (6.3%) |
Disability Class: Cognitive Difficulty
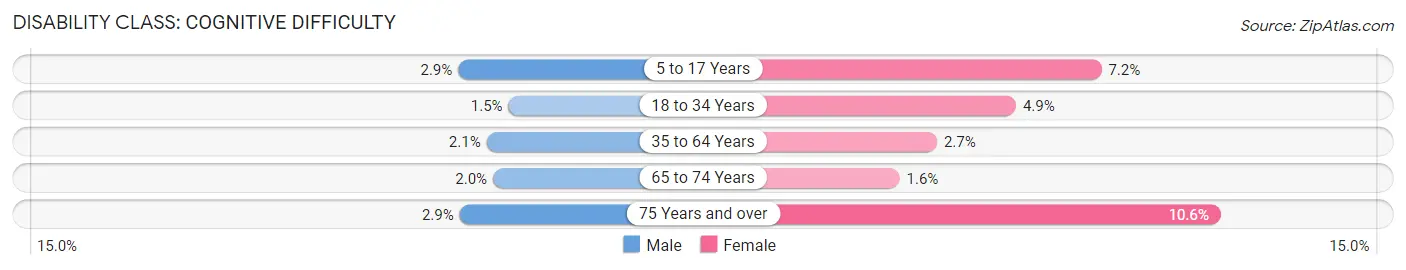
| Age Bracket | Male | Female |
| 5 to 17 Years | 31 (2.9%) | 125 (7.2%) |
| 18 to 34 Years | 34 (1.5%) | 87 (4.9%) |
| 35 to 64 Years | 84 (2.1%) | 108 (2.6%) |
| 65 to 74 Years | 20 (2.0%) | 19 (1.6%) |
| 75 Years and over | 22 (2.9%) | 133 (10.5%) |
Disability Class: Ambulatory Difficulty
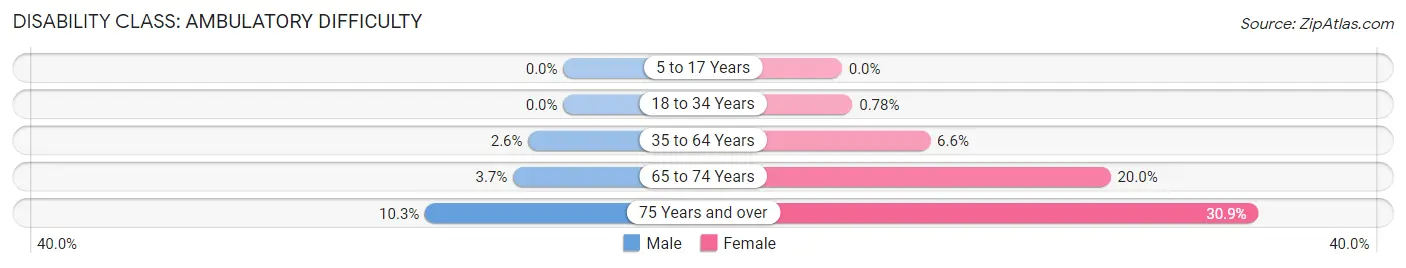
| Age Bracket | Male | Female |
| 5 to 17 Years | 0 (0.0%) | 0 (0.0%) |
| 18 to 34 Years | 0 (0.0%) | 14 (0.8%) |
| 35 to 64 Years | 102 (2.6%) | 268 (6.6%) |
| 65 to 74 Years | 38 (3.7%) | 236 (20.0%) |
| 75 Years and over | 78 (10.3%) | 390 (30.9%) |
Disability Class: Self-Care Difficulty
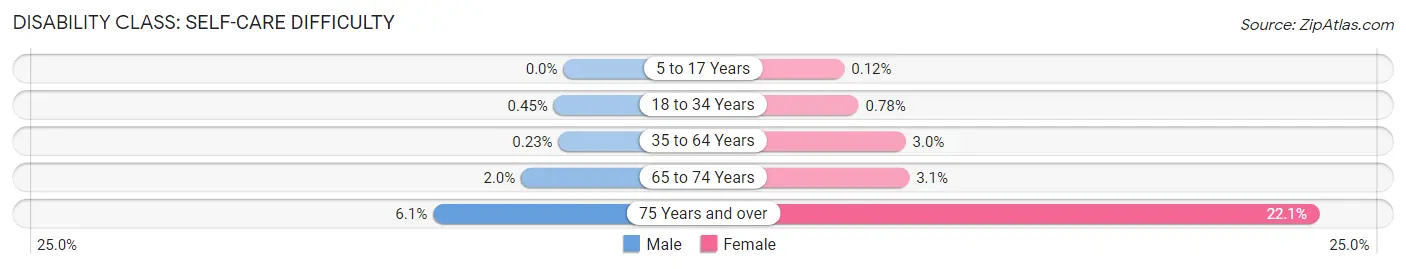
| Age Bracket | Male | Female |
| 5 to 17 Years | 0 (0.0%) | 2 (0.1%) |
| 18 to 34 Years | 10 (0.4%) | 14 (0.8%) |
| 35 to 64 Years | 9 (0.2%) | 121 (3.0%) |
| 65 to 74 Years | 20 (2.0%) | 37 (3.1%) |
| 75 Years and over | 46 (6.0%) | 279 (22.1%) |
Technology Access in Lynbrook
Computing Device Access in Lynbrook
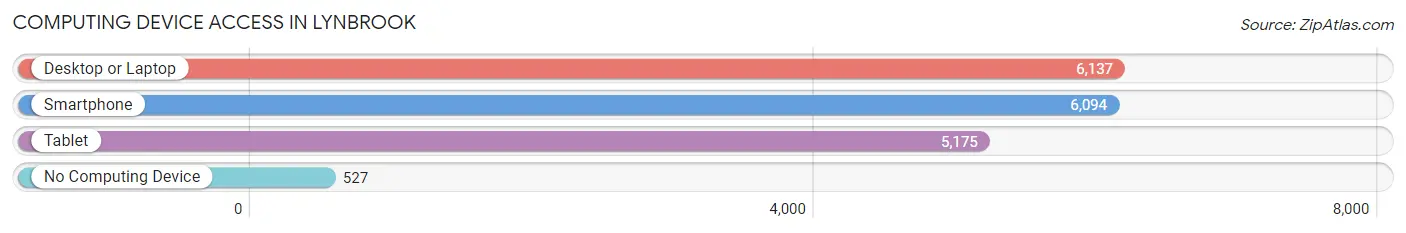
| Device Type | # Households | % Households |
| Desktop or Laptop | 6,137 | 87.3% |
| Smartphone | 6,094 | 86.7% |
| Tablet | 5,175 | 73.6% |
| No Computing Device | 527 | 7.5% |
| Total | 7,031 | 100.0% |
Internet Access in Lynbrook
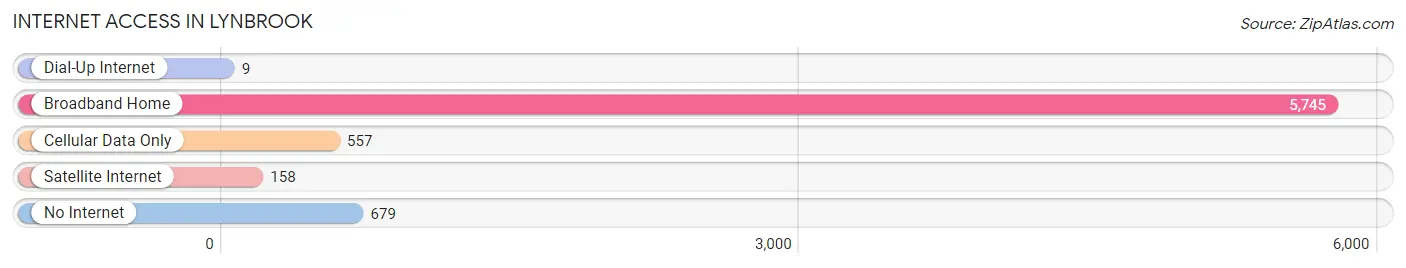
| Internet Type | # Households | % Households |
| Dial-Up Internet | 9 | 0.1% |
| Broadband Home | 5,745 | 81.7% |
| Cellular Data Only | 557 | 7.9% |
| Satellite Internet | 158 | 2.2% |
| No Internet | 679 | 9.7% |
| Total | 7,031 | 100.0% |
Lynbrook Summary
Lynbrook is a village located in Nassau County, New York, United States. It is located within the Town of Hempstead and is part of the Greater New York City metropolitan area. The population was 19,427 at the 2010 census.
Geography
Lynbrook is located at 40°38'25" North, 73°38'45" West (40.6403, -73.6459). According to the United States Census Bureau, the village has a total area of 2.2 square miles (5.7 km2), all land.
History
The area that is now Lynbrook was originally inhabited by the Meroke Indians. The first European settlers arrived in the area in the late 1600s. The area was originally known as Rechquaakie, which means "place of happy retreat" in the language of the Meroke Indians.
In 1894, the village of Lynbrook was incorporated. The name was derived from the combination of two nearby towns, Lynbrook and Rockville Centre.
Economy
The economy of Lynbrook is largely based on retail and services. The village is home to a variety of stores, restaurants, and other businesses. The village also has a number of professional offices, including law firms, accounting firms, and medical offices.
Demographics
As of the 2010 census, there were 19,427 people, 7,072 households, and 5,072 families residing in the village. The population density was 8,717.3 people per square mile (3,370.2/km2). There were 7,541 housing units at an average density of 3,400.3 per square mile (1,312.2/km2). The racial makeup of the village was 87.2% White, 4.2% African American, 0.2% Native American, 4.7% Asian, 0.1% Pacific Islander, 1.3% from other races, and 2.3% from two or more races. Hispanic or Latino of any race were 6.7% of the population.
There were 7,072 households, out of which 33.2% had children under the age of 18 living with them, 56.2% were married couples living together, 10.7% had a female householder with no husband present, and 29.2% were non-families. 24.2% of all households were made up of individuals, and 11.2% had someone living alone who was 65 years of age or older. The average household size was 2.72 and the average family size was 3.27.
In the village, the population was spread out, with 24.2% under the age of 18, 6.2% from 18 to 24, 28.2% from 25 to 44, 25.2% from 45 to 64, and 16.2% who were 65 years of age or older. The median age was 40 years. For every 100 females, there were 93.2 males. For every 100 females age 18 and over, there were 90.2 males.
The median income for a household in the village was $76,945, and the median income for a family was $90,945. Males had a median income of $60,945 versus $41,945 for females. The per capita income for the village was $33,945. About 2.7% of families and 3.7% of the population were below the poverty line, including 4.2% of those under age 18 and 4.2% of those age 65 or over.
Common Questions
What is Per Capita Income in Lynbrook?
Per Capita income in Lynbrook is $60,904.
What is the Median Family Income in Lynbrook?
Median Family Income in Lynbrook is $164,677.
What is the Median Household income in Lynbrook?
Median Household Income in Lynbrook is $139,266.
What is Income or Wage Gap in Lynbrook?
Income or Wage Gap in Lynbrook is 22.9%.
Women in Lynbrook earn 77.1 cents for every dollar earned by a man.
What is Inequality or Gini Index in Lynbrook?
Inequality or Gini Index in Lynbrook is 0.46.
What is the Total Population of Lynbrook?
Total Population of Lynbrook is 20,299.
What is the Total Male Population of Lynbrook?
Total Male Population of Lynbrook is 9,480.
What is the Total Female Population of Lynbrook?
Total Female Population of Lynbrook is 10,819.
What is the Ratio of Males per 100 Females in Lynbrook?
There are 87.62 Males per 100 Females in Lynbrook.
What is the Ratio of Females per 100 Males in Lynbrook?
There are 114.12 Females per 100 Males in Lynbrook.
What is the Median Population Age in Lynbrook?
Median Population Age in Lynbrook is 44.0 Years.
What is the Average Family Size in Lynbrook
Average Family Size in Lynbrook is 3.4 People.
What is the Average Household Size in Lynbrook
Average Household Size in Lynbrook is 2.9 People.
How Large is the Labor Force in Lynbrook?
There are 11,229 People in the Labor Forcein in Lynbrook.
What is the Percentage of People in the Labor Force in Lynbrook?
67.3% of People are in the Labor Force in Lynbrook.
What is the Unemployment Rate in Lynbrook?
Unemployment Rate in Lynbrook is 3.9%.