Crown Heights, NY Map & Demographics
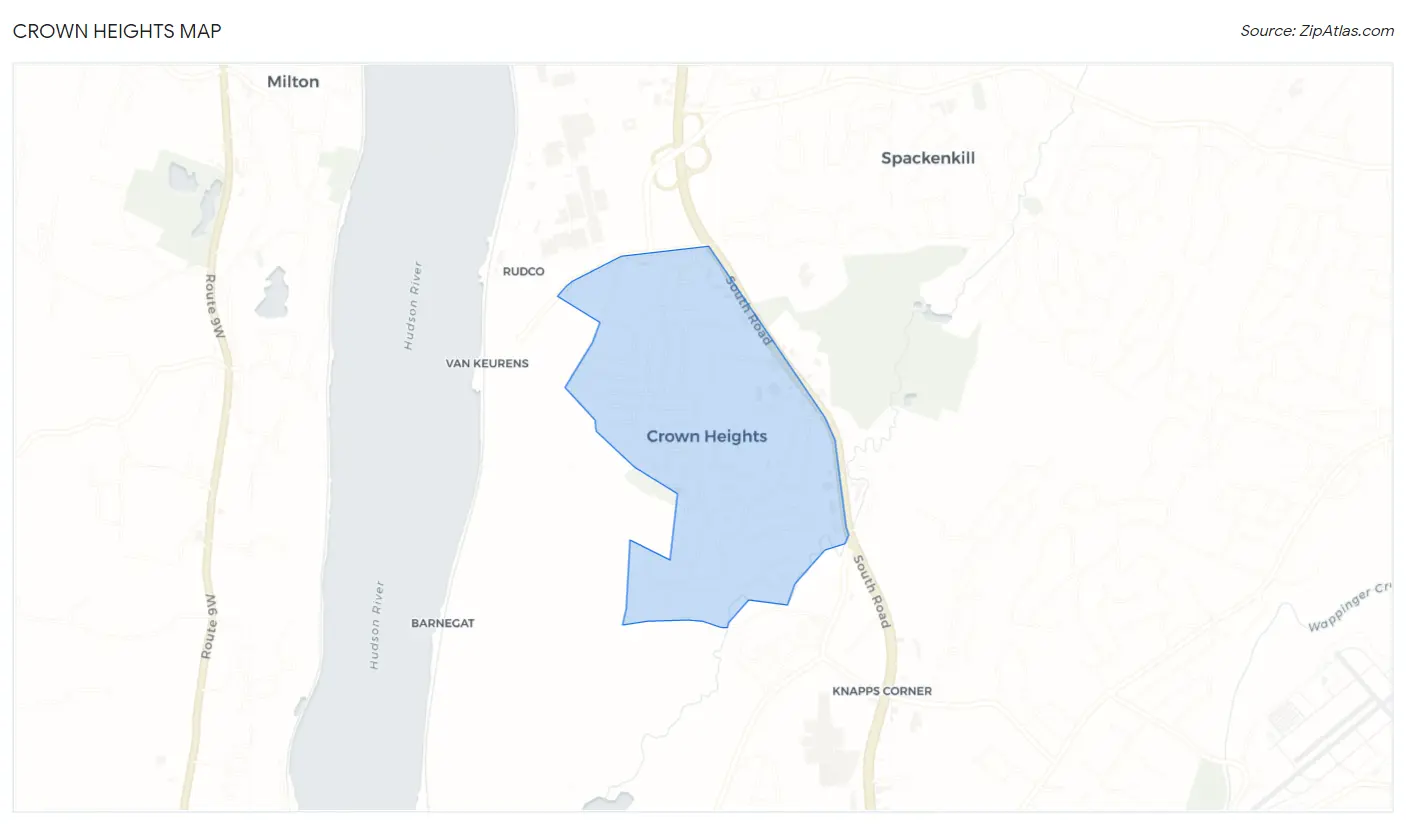
Crown Heights Map
Crown Heights Overview
$44,250
PER CAPITA INCOME
$147,775
AVG FAMILY INCOME
$115,833
AVG HOUSEHOLD INCOME
57.3%
WAGE / INCOME GAP [ % ]
42.7¢/ $1
WAGE / INCOME GAP [ $ ]
0.36
INEQUALITY / GINI INDEX
3,030
TOTAL POPULATION
1,531
MALE POPULATION
1,499
FEMALE POPULATION
102.13
MALES / 100 FEMALES
97.91
FEMALES / 100 MALES
44.7
MEDIAN AGE
3.6
AVG FAMILY SIZE
2.9
AVG HOUSEHOLD SIZE
1,675
LABOR FORCE [ PEOPLE ]
67.9%
PERCENT IN LABOR FORCE
9.9%
UNEMPLOYMENT RATE
Income in Crown Heights
Income Overview in Crown Heights
Per Capita Income in Crown Heights is $44,250, while median incomes of families and households are $147,775 and $115,833 respectively.
| Characteristic | Number | Measure |
| Per Capita Income | 3,030 | $44,250 |
| Median Family Income | 673 | $147,775 |
| Mean Family Income | 673 | $147,994 |
| Median Household Income | 1,052 | $115,833 |
| Mean Household Income | 1,052 | $120,932 |
| Income Deficit | 673 | $0 |
| Wage / Income Gap (%) | 3,030 | 57.26% |
| Wage / Income Gap ($) | 3,030 | 42.74¢ per $1 |
| Gini / Inequality Index | 3,030 | 0.36 |
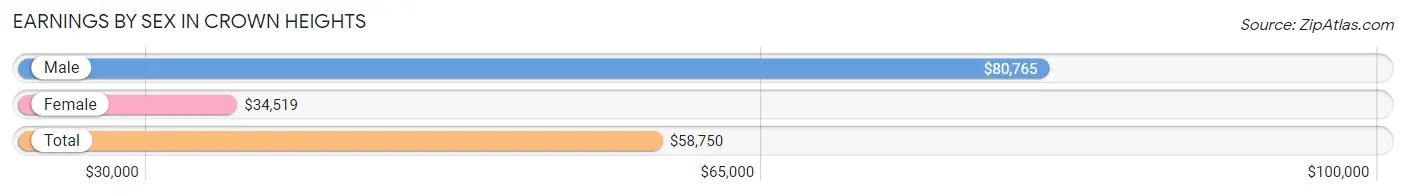
Earnings by Sex in Crown Heights
Average Earnings in Crown Heights are $58,750, $80,765 for men and $34,519 for women, a difference of 57.3%.
| Sex | Number | Average Earnings |
| Male | 816 (48.2%) | $80,765 |
| Female | 878 (51.8%) | $34,519 |
| Total | 1,694 (100.0%) | $58,750 |
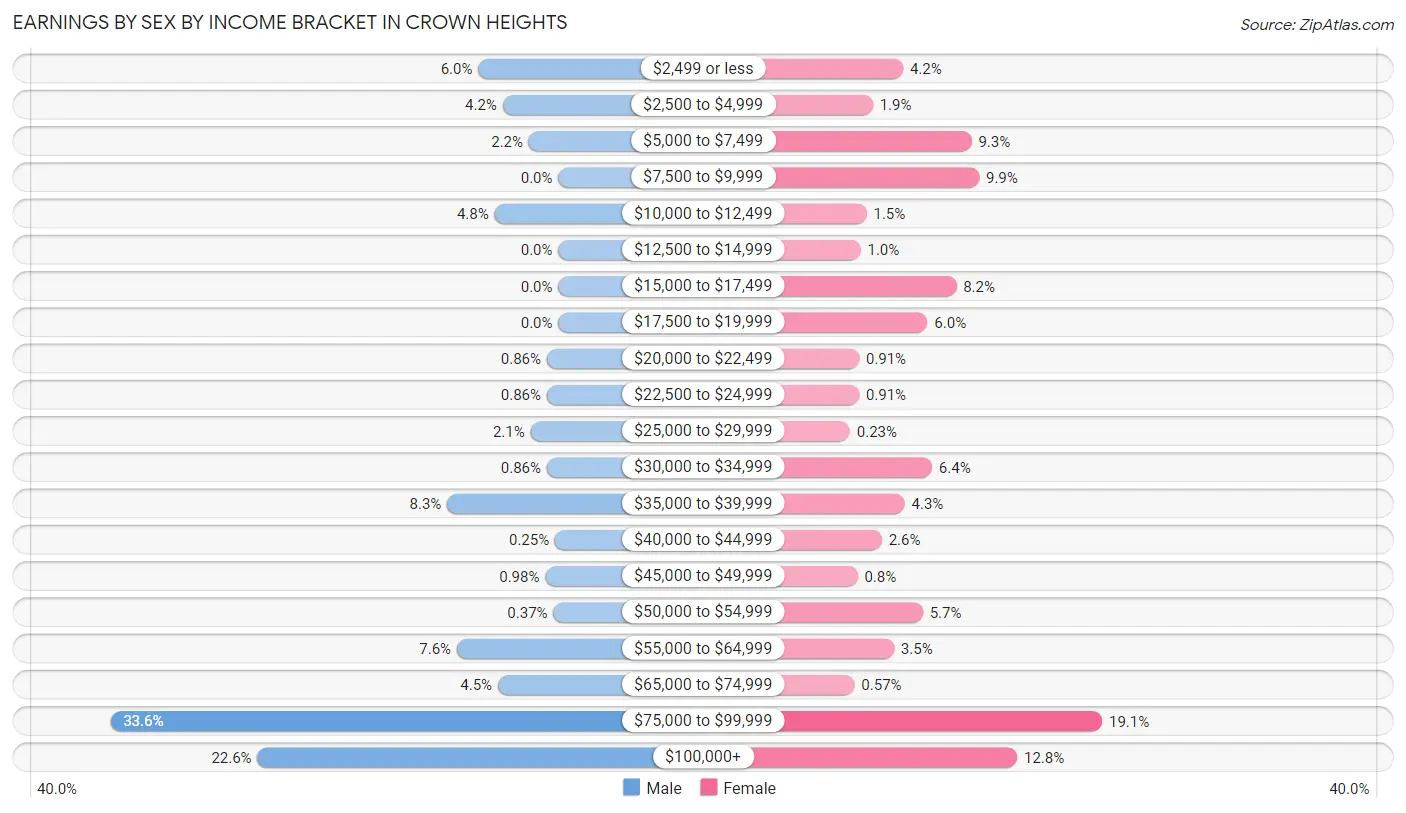
Earnings by Sex by Income Bracket in Crown Heights
The most common earnings brackets in Crown Heights are $75,000 to $99,999 for men (274 | 33.6%) and $75,000 to $99,999 for women (168 | 19.1%).
| Income | Male | Female |
| $2,499 or less | 49 (6.0%) | 37 (4.2%) |
| $2,500 to $4,999 | 34 (4.2%) | 17 (1.9%) |
| $5,000 to $7,499 | 18 (2.2%) | 82 (9.3%) |
| $7,500 to $9,999 | 0 (0.0%) | 87 (9.9%) |
| $10,000 to $12,499 | 39 (4.8%) | 13 (1.5%) |
| $12,500 to $14,999 | 0 (0.0%) | 9 (1.0%) |
| $15,000 to $17,499 | 0 (0.0%) | 72 (8.2%) |
| $17,500 to $19,999 | 0 (0.0%) | 53 (6.0%) |
| $20,000 to $22,499 | 7 (0.9%) | 8 (0.9%) |
| $22,500 to $24,999 | 7 (0.9%) | 8 (0.9%) |
| $25,000 to $29,999 | 17 (2.1%) | 2 (0.2%) |
| $30,000 to $34,999 | 7 (0.9%) | 56 (6.4%) |
| $35,000 to $39,999 | 68 (8.3%) | 38 (4.3%) |
| $40,000 to $44,999 | 2 (0.3%) | 23 (2.6%) |
| $45,000 to $49,999 | 8 (1.0%) | 7 (0.8%) |
| $50,000 to $54,999 | 3 (0.4%) | 50 (5.7%) |
| $55,000 to $64,999 | 62 (7.6%) | 31 (3.5%) |
| $65,000 to $74,999 | 37 (4.5%) | 5 (0.6%) |
| $75,000 to $99,999 | 274 (33.6%) | 168 (19.1%) |
| $100,000+ | 184 (22.6%) | 112 (12.8%) |
| Total | 816 (100.0%) | 878 (100.0%) |
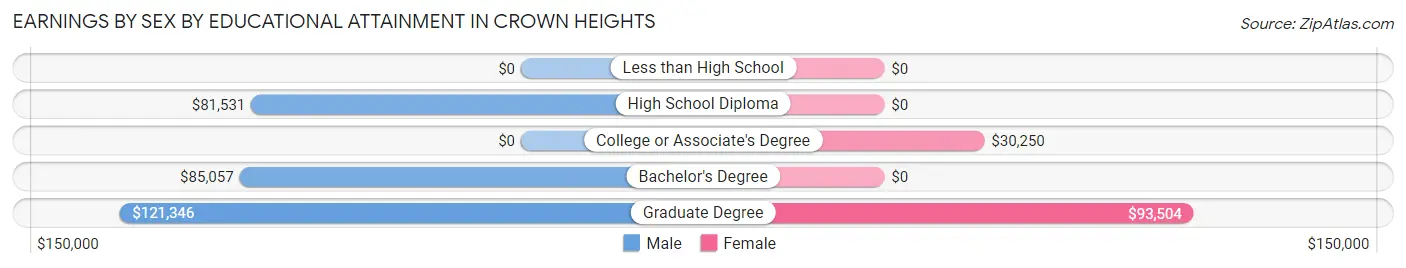
Earnings by Sex by Educational Attainment in Crown Heights
Average earnings in Crown Heights are $86,250 for men and $50,139 for women, a difference of 41.9%. Men with an educational attainment of graduate degree enjoy the highest average annual earnings of $121,346, while those with high school diploma education earn the least with $81,531. Women with an educational attainment of graduate degree earn the most with the average annual earnings of $93,504, while those with college or associate's degree education have the smallest earnings of $30,250.
| Educational Attainment | Male Income | Female Income |
| Less than High School | - | - |
| High School Diploma | $81,531 | $0 |
| College or Associate's Degree | - | - |
| Bachelor's Degree | $85,057 | $0 |
| Graduate Degree | $121,346 | $93,504 |
| Total | $86,250 | $50,139 |
Family Income in Crown Heights
Family Income Brackets in Crown Heights
According to the Crown Heights family income data, there are 201 families falling into the $100,000 to $149,999 income range, which is the most common income bracket and makes up 29.9% of all families.
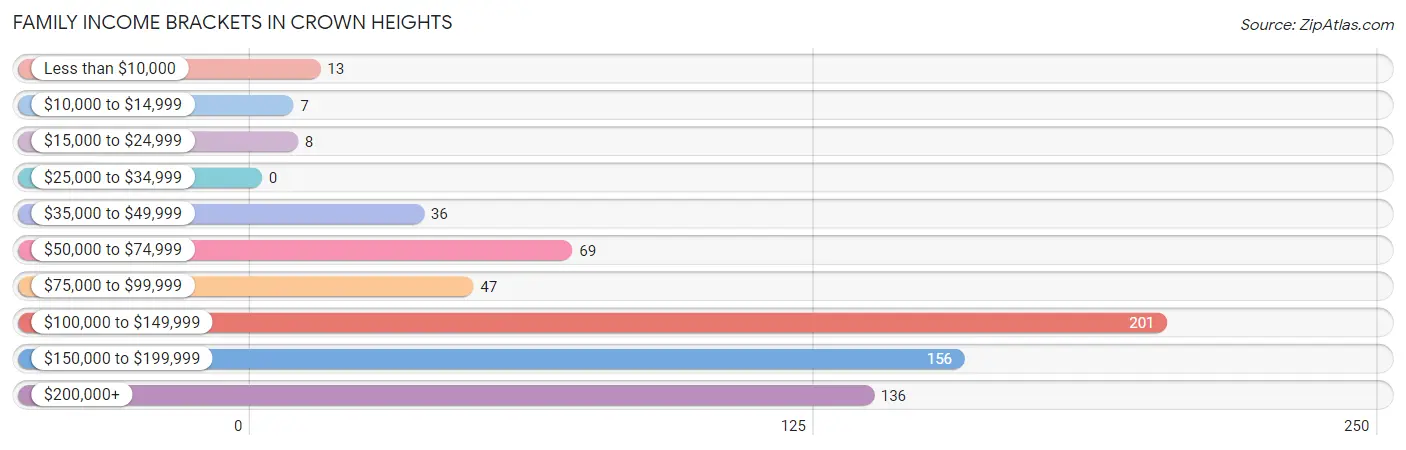
| Income Bracket | # Families | % Families |
| Less than $10,000 | 13 | 1.9% |
| $10,000 to $14,999 | 7 | 1.0% |
| $15,000 to $24,999 | 8 | 1.2% |
| $25,000 to $34,999 | 0 | 0.0% |
| $35,000 to $49,999 | 36 | 5.3% |
| $50,000 to $74,999 | 69 | 10.3% |
| $75,000 to $99,999 | 47 | 7.0% |
| $100,000 to $149,999 | 201 | 29.9% |
| $150,000 to $199,999 | 156 | 23.2% |
| $200,000+ | 136 | 20.2% |
Family Income by Famaliy Size in Crown Heights
4-person families (208 | 30.9%) account for the highest median family income in Crown Heights with $162,556 per family, while 2-person families (128 | 19.0%) have the highest median income of $62,981 per family member.
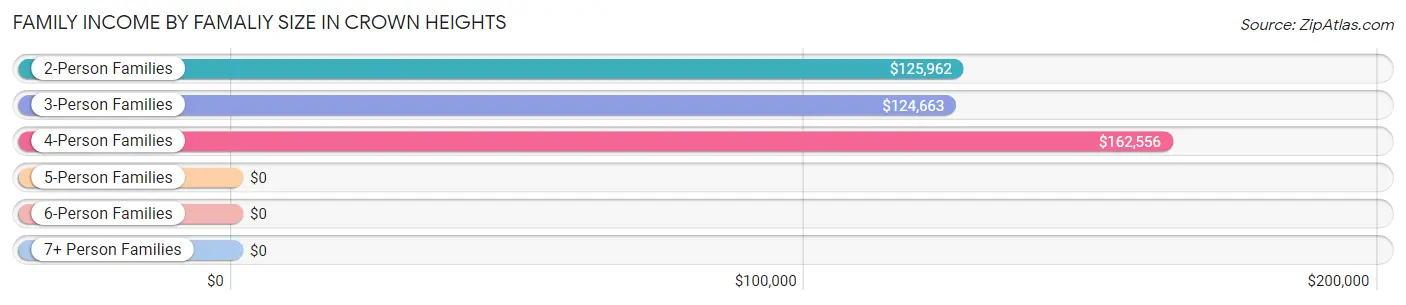
| Income Bracket | # Families | Median Income |
| 2-Person Families | 128 (19.0%) | $125,962 |
| 3-Person Families | 241 (35.8%) | $124,663 |
| 4-Person Families | 208 (30.9%) | $162,556 |
| 5-Person Families | 94 (14.0%) | $0 |
| 6-Person Families | 2 (0.3%) | $0 |
| 7+ Person Families | 0 (0.0%) | $0 |
| Total | 673 (100.0%) | $147,775 |
Family Income by Number of Earners in Crown Heights
The median family income in Crown Heights is $147,775, with families comprising 3+ earners (187) having the highest median family income of $213,472, while families with no earners (65) have the lowest median family income of $62,321, accounting for 27.8% and 9.7% of families, respectively.
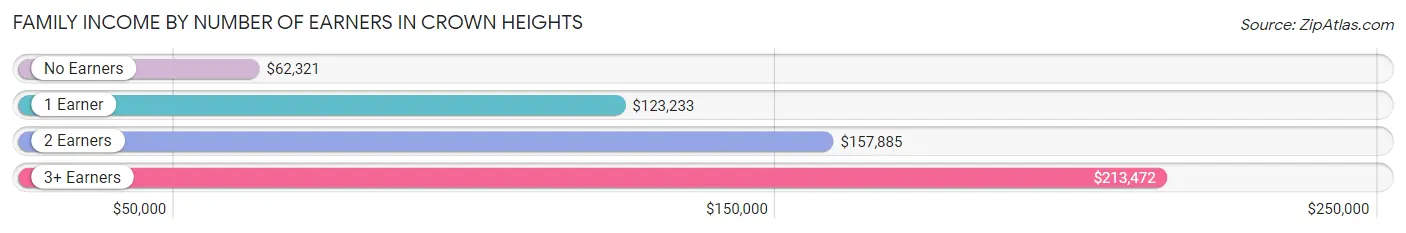
| Number of Earners | # Families | Median Income |
| No Earners | 65 (9.7%) | $62,321 |
| 1 Earner | 143 (21.2%) | $123,233 |
| 2 Earners | 278 (41.3%) | $157,885 |
| 3+ Earners | 187 (27.8%) | $213,472 |
| Total | 673 (100.0%) | $147,775 |
Household Income in Crown Heights
Household Income Brackets in Crown Heights
With 294 households falling in the category, the $100,000 to $149,999 income range is the most frequent in Crown Heights, accounting for 28.0% of all households.
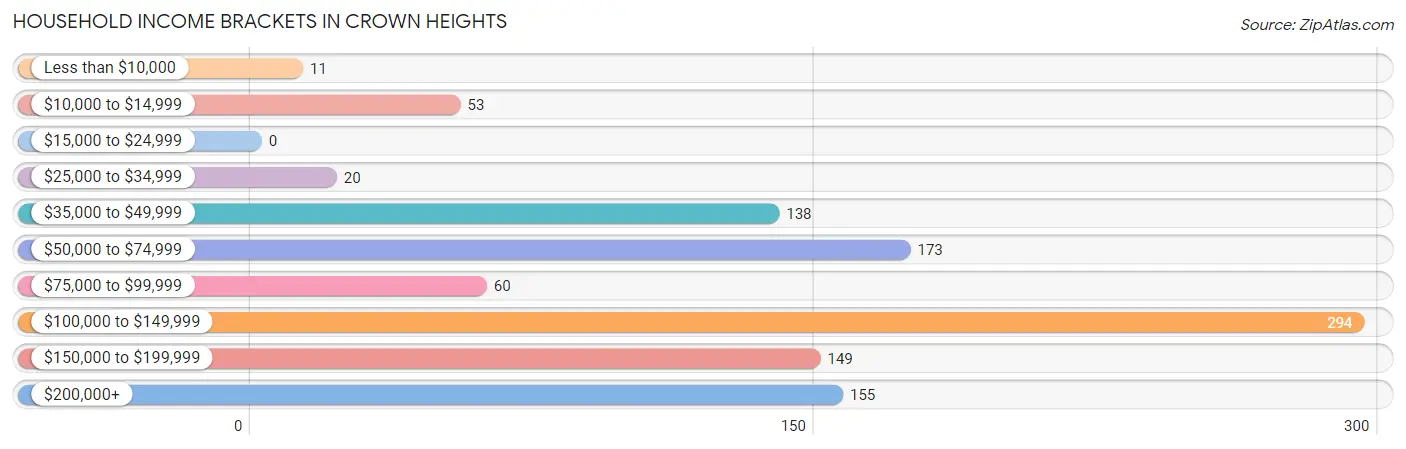
| Income Bracket | # Households | % Households |
| Less than $10,000 | 11 | 1.0% |
| $10,000 to $14,999 | 53 | 5.0% |
| $15,000 to $24,999 | 0 | 0.0% |
| $25,000 to $34,999 | 20 | 1.9% |
| $35,000 to $49,999 | 138 | 13.1% |
| $50,000 to $74,999 | 173 | 16.4% |
| $75,000 to $99,999 | 60 | 5.7% |
| $100,000 to $149,999 | 294 | 27.9% |
| $150,000 to $199,999 | 149 | 14.2% |
| $200,000+ | 155 | 14.7% |
Household Income by Householder Age in Crown Heights
The median household income in Crown Heights is $115,833, with the highest median household income of $149,925 found in the 25 to 44 years age bracket for the primary householder. A total of 255 households (24.2%) fall into this category.
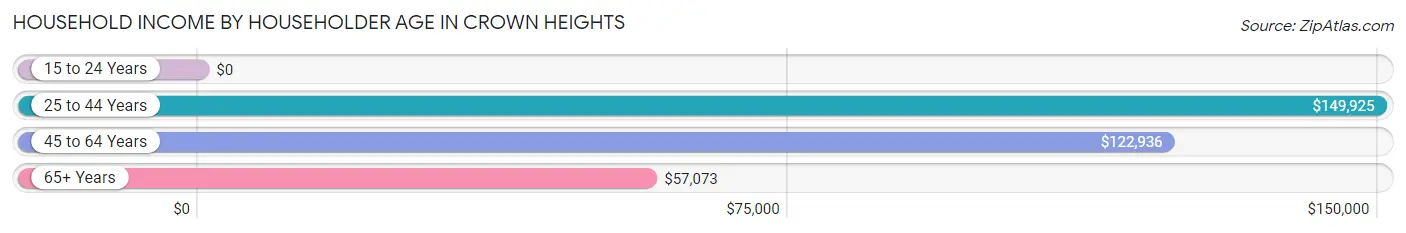
| Income Bracket | # Households | Median Income |
| 15 to 24 Years | 0 (0.0%) | $0 |
| 25 to 44 Years | 255 (24.2%) | $149,925 |
| 45 to 64 Years | 387 (36.8%) | $122,936 |
| 65+ Years | 410 (39.0%) | $57,073 |
| Total | 1,052 (100.0%) | $115,833 |
Poverty in Crown Heights
Income Below Poverty by Sex and Age in Crown Heights
With 4.3% poverty level for males and 4.6% for females among the residents of Crown Heights, 65 to 74 year old males and 16 and 17 year old females are the most vulnerable to poverty, with 39 males (20.3%) and 31 females (40.3%) in their respective age groups living below the poverty level.
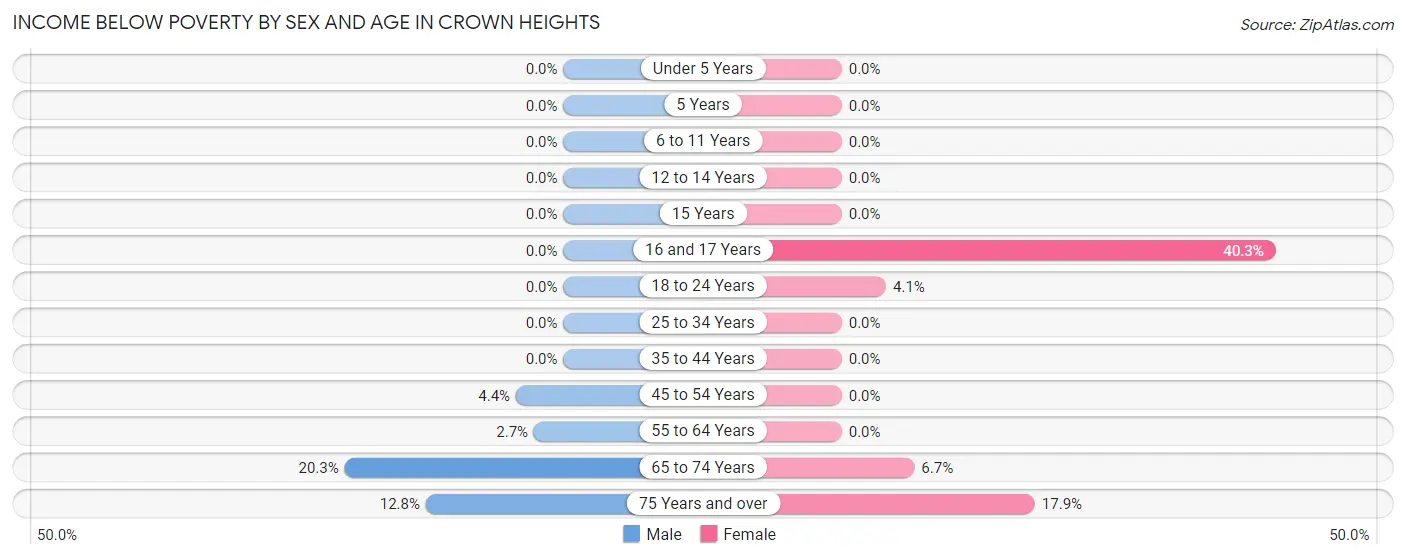
| Age Bracket | Male | Female |
| Under 5 Years | 0 (0.0%) | 0 (0.0%) |
| 5 Years | 0 (0.0%) | 0 (0.0%) |
| 6 to 11 Years | 0 (0.0%) | 0 (0.0%) |
| 12 to 14 Years | 0 (0.0%) | 0 (0.0%) |
| 15 Years | 0 (0.0%) | 0 (0.0%) |
| 16 and 17 Years | 0 (0.0%) | 31 (40.3%) |
| 18 to 24 Years | 0 (0.0%) | 6 (4.1%) |
| 25 to 34 Years | 0 (0.0%) | 0 (0.0%) |
| 35 to 44 Years | 0 (0.0%) | 0 (0.0%) |
| 45 to 54 Years | 7 (4.4%) | 0 (0.0%) |
| 55 to 64 Years | 8 (2.7%) | 0 (0.0%) |
| 65 to 74 Years | 39 (20.3%) | 12 (6.7%) |
| 75 Years and over | 12 (12.8%) | 19 (17.9%) |
| Total | 66 (4.3%) | 68 (4.6%) |
Income Above Poverty by Sex and Age in Crown Heights
According to the poverty statistics in Crown Heights, males aged under 5 years and females aged 6 to 11 years are the age groups that are most secure financially, with 100.0% of males and 100.0% of females in these age groups living above the poverty line.
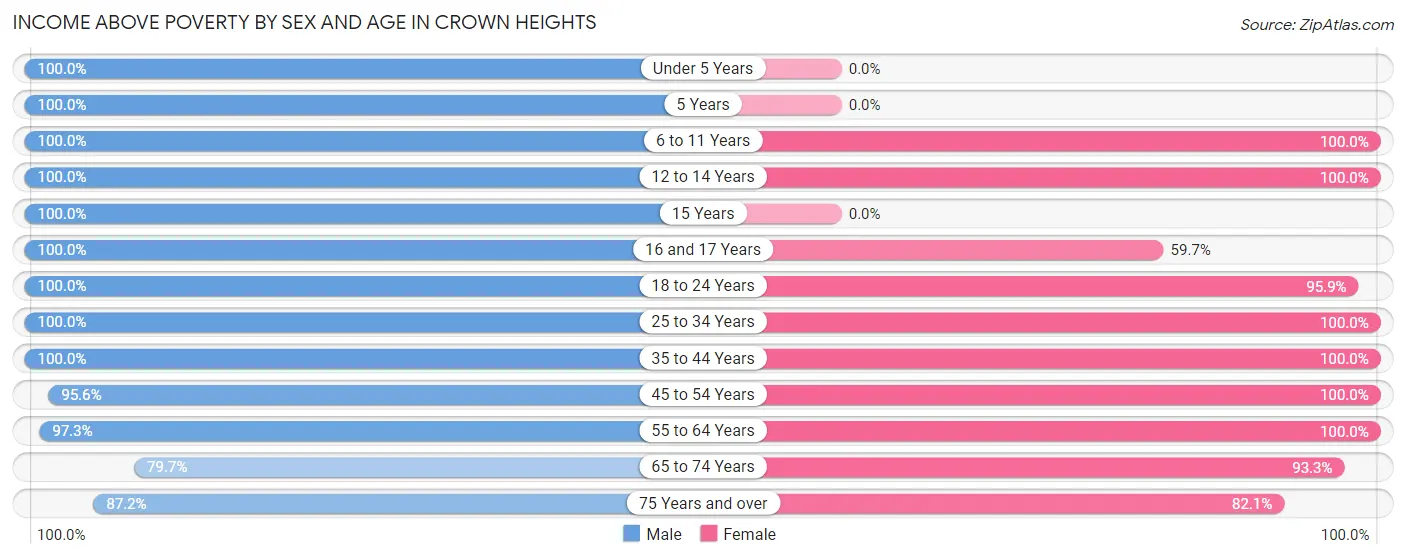
| Age Bracket | Male | Female |
| Under 5 Years | 173 (100.0%) | 0 (0.0%) |
| 5 Years | 45 (100.0%) | 0 (0.0%) |
| 6 to 11 Years | 20 (100.0%) | 116 (100.0%) |
| 12 to 14 Years | 9 (100.0%) | 145 (100.0%) |
| 15 Years | 41 (100.0%) | 0 (0.0%) |
| 16 and 17 Years | 48 (100.0%) | 46 (59.7%) |
| 18 to 24 Years | 121 (100.0%) | 140 (95.9%) |
| 25 to 34 Years | 118 (100.0%) | 105 (100.0%) |
| 35 to 44 Years | 218 (100.0%) | 142 (100.0%) |
| 45 to 54 Years | 152 (95.6%) | 236 (100.0%) |
| 55 to 64 Years | 285 (97.3%) | 234 (100.0%) |
| 65 to 74 Years | 153 (79.7%) | 166 (93.3%) |
| 75 Years and over | 82 (87.2%) | 87 (82.1%) |
| Total | 1,465 (95.7%) | 1,417 (95.4%) |
Income Below Poverty Among Married-Couple Families in Crown Heights
The poverty statistics for married-couple families in Crown Heights show that 2.1% or 12 of the total 575 families live below the poverty line. Families with no children have the highest poverty rate of 4.5%, comprising of 12 families. On the other hand, families with 1 or 2 children have the lowest poverty rate of 0.0%, which includes 0 families.
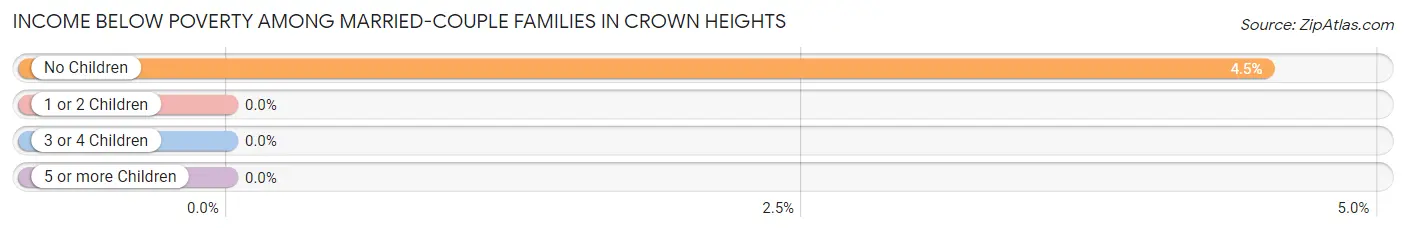
| Children | Above Poverty | Below Poverty |
| No Children | 254 (95.5%) | 12 (4.5%) |
| 1 or 2 Children | 243 (100.0%) | 0 (0.0%) |
| 3 or 4 Children | 66 (100.0%) | 0 (0.0%) |
| 5 or more Children | 0 (0.0%) | 0 (0.0%) |
| Total | 563 (97.9%) | 12 (2.1%) |
Income Below Poverty Among Single-Parent Households in Crown Heights
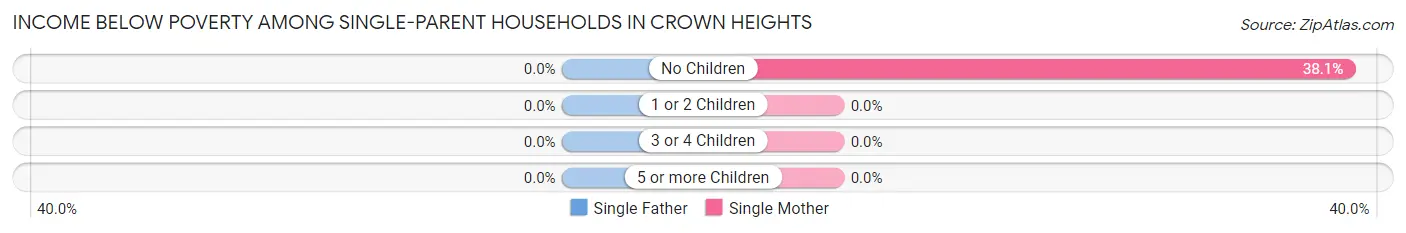
| Children | Single Father | Single Mother |
| No Children | 0 (0.0%) | 8 (38.1%) |
| 1 or 2 Children | 0 (0.0%) | 0 (0.0%) |
| 3 or 4 Children | 0 (0.0%) | 0 (0.0%) |
| 5 or more Children | 0 (0.0%) | 0 (0.0%) |
| Total | 0 (0.0%) | 8 (22.2%) |
Income Below Poverty Among Married-Couple vs Single-Parent Households in Crown Heights
The poverty data for Crown Heights shows that 12 of the married-couple family households (2.1%) and 8 of the single-parent households (8.2%) are living below the poverty level. Within the married-couple family households, those with no children have the highest poverty rate, with 12 households (4.5%) falling below the poverty line. Among the single-parent households, those with no children have the highest poverty rate, with 8 household (17.0%) living below poverty.
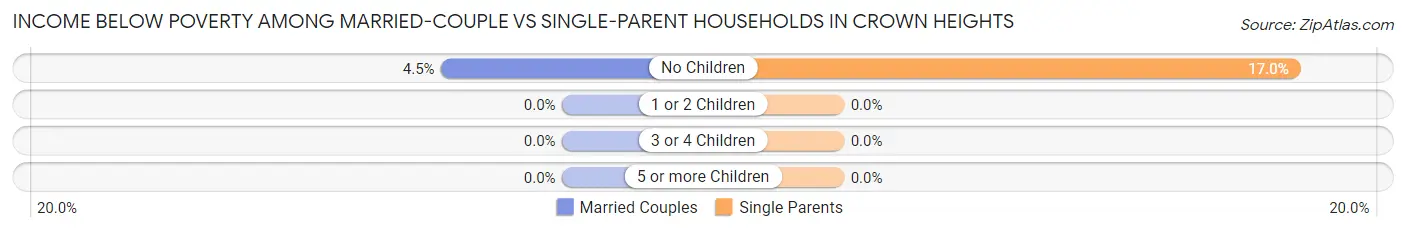
| Children | Married-Couple Families | Single-Parent Households |
| No Children | 12 (4.5%) | 8 (17.0%) |
| 1 or 2 Children | 0 (0.0%) | 0 (0.0%) |
| 3 or 4 Children | 0 (0.0%) | 0 (0.0%) |
| 5 or more Children | 0 (0.0%) | 0 (0.0%) |
| Total | 12 (2.1%) | 8 (8.2%) |
Race in Crown Heights
The most populous races in Crown Heights are White / Caucasian (2,245 | 74.1%), Hispanic or Latino (450 | 14.8%), and Two or more Races (291 | 9.6%).
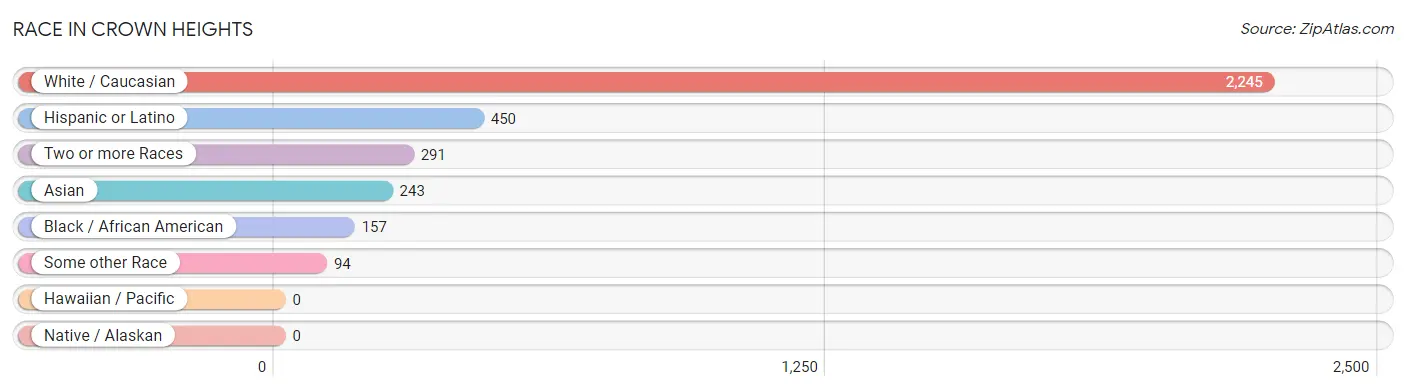
| Race | # Population | % Population |
| Asian | 243 | 8.0% |
| Black / African American | 157 | 5.2% |
| Hawaiian / Pacific | 0 | 0.0% |
| Hispanic or Latino | 450 | 14.8% |
| Native / Alaskan | 0 | 0.0% |
| White / Caucasian | 2,245 | 74.1% |
| Two or more Races | 291 | 9.6% |
| Some other Race | 94 | 3.1% |
| Total | 3,030 | 100.0% |
Ancestry in Crown Heights
The most populous ancestries reported in Crown Heights are Italian (1,114 | 36.8%), Irish (906 | 29.9%), German (337 | 11.1%), South American (179 | 5.9%), and Puerto Rican (178 | 5.9%), together accounting for 89.6% of all Crown Heights residents.
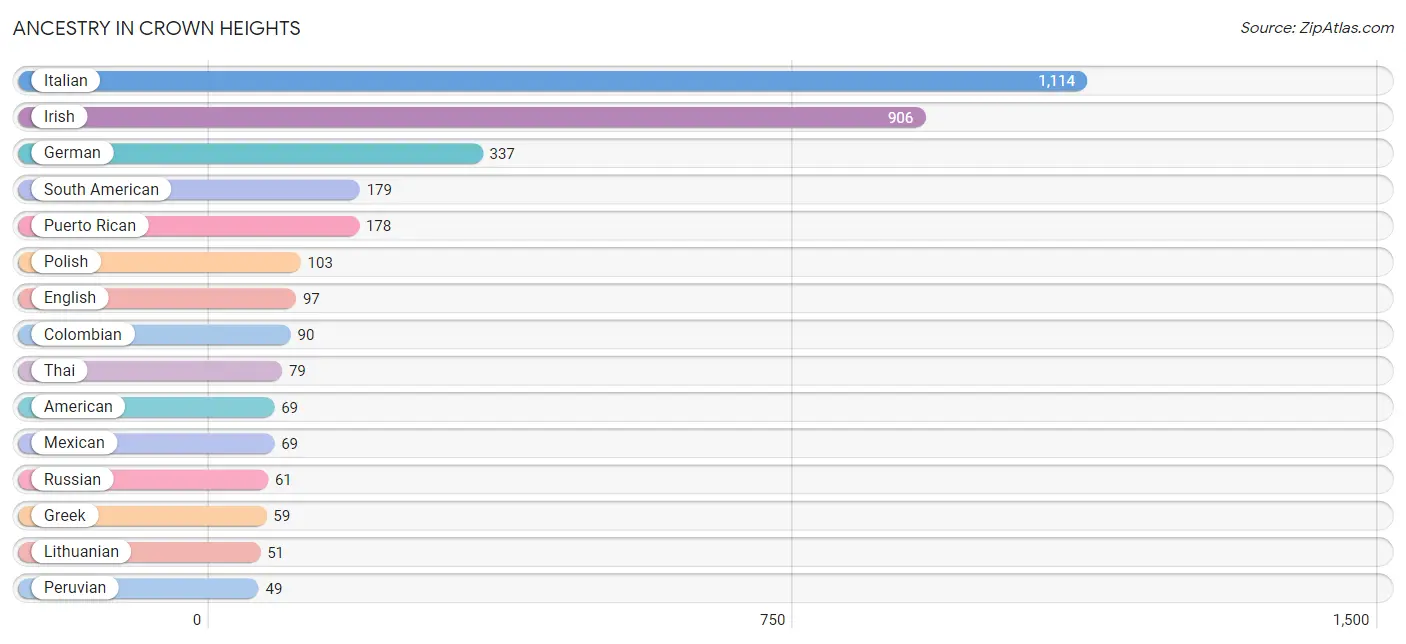
| Ancestry | # Population | % Population |
| Afghan | 7 | 0.2% |
| American | 69 | 2.3% |
| Bhutanese | 21 | 0.7% |
| Central American | 24 | 0.8% |
| Central American Indian | 16 | 0.5% |
| Colombian | 90 | 3.0% |
| Costa Rican | 24 | 0.8% |
| Ecuadorian | 40 | 1.3% |
| English | 97 | 3.2% |
| French | 14 | 0.5% |
| German | 337 | 11.1% |
| Greek | 59 | 1.9% |
| Hungarian | 38 | 1.3% |
| Irish | 906 | 29.9% |
| Italian | 1,114 | 36.8% |
| Jamaican | 36 | 1.2% |
| Korean | 6 | 0.2% |
| Lithuanian | 51 | 1.7% |
| Mexican | 69 | 2.3% |
| Peruvian | 49 | 1.6% |
| Polish | 103 | 3.4% |
| Puerto Rican | 178 | 5.9% |
| Russian | 61 | 2.0% |
| Scottish | 30 | 1.0% |
| South American | 179 | 5.9% |
| Subsaharan African | 44 | 1.5% |
| Thai | 79 | 2.6% |
| Trinidadian and Tobagonian | 4 | 0.1% | View All 28 Rows |
Immigrants in Crown Heights
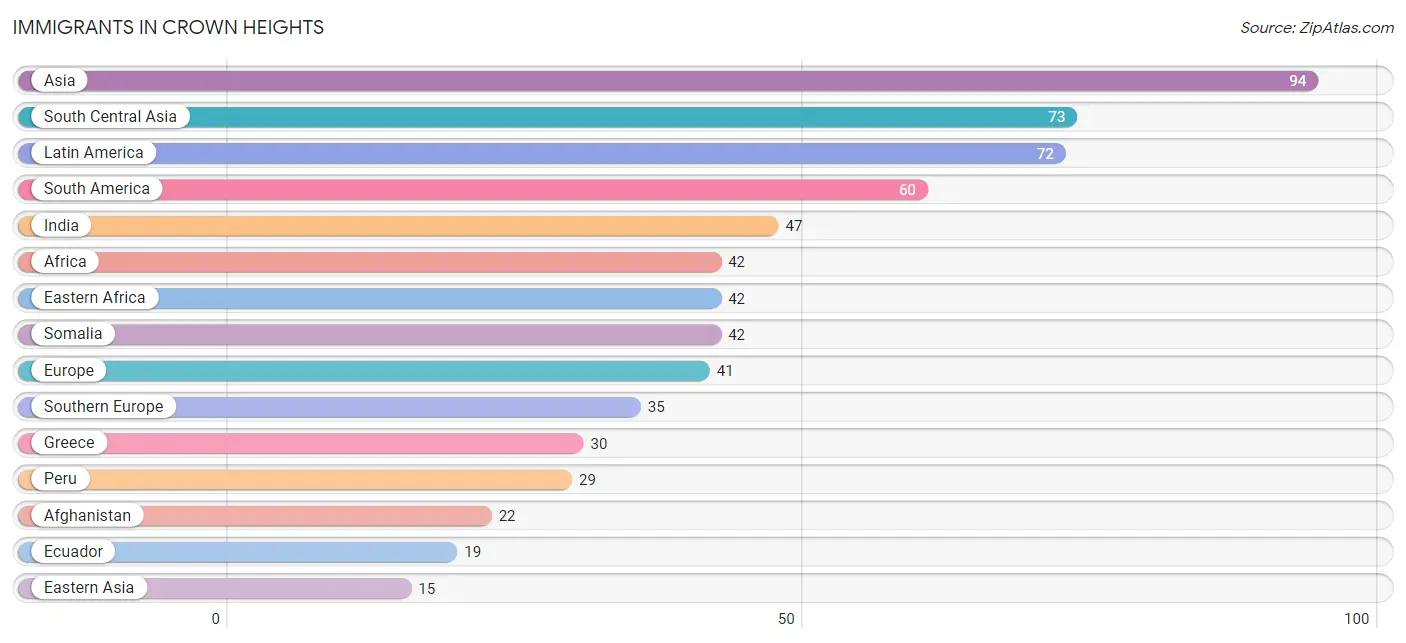
The most numerous immigrant groups reported in Crown Heights came from Asia (94 | 3.1%), South Central Asia (73 | 2.4%), Latin America (72 | 2.4%), South America (60 | 2.0%), and India (47 | 1.5%), together accounting for 11.4% of all Crown Heights residents.
| Immigration Origin | # Population | % Population |
| Afghanistan | 22 | 0.7% |
| Africa | 42 | 1.4% |
| Asia | 94 | 3.1% |
| Caribbean | 4 | 0.1% |
| Central America | 8 | 0.3% |
| Colombia | 12 | 0.4% |
| Costa Rica | 8 | 0.3% |
| Eastern Africa | 42 | 1.4% |
| Eastern Asia | 15 | 0.5% |
| Ecuador | 19 | 0.6% |
| England | 6 | 0.2% |
| Europe | 41 | 1.3% |
| Greece | 30 | 1.0% |
| India | 47 | 1.5% |
| Italy | 5 | 0.2% |
| Japan | 15 | 0.5% |
| Latin America | 72 | 2.4% |
| Northern Europe | 6 | 0.2% |
| Pakistan | 4 | 0.1% |
| Peru | 29 | 1.0% |
| Philippines | 6 | 0.2% |
| Somalia | 42 | 1.4% |
| South America | 60 | 2.0% |
| South Central Asia | 73 | 2.4% |
| South Eastern Asia | 6 | 0.2% |
| Southern Europe | 35 | 1.2% |
| Trinidad and Tobago | 4 | 0.1% | View All 27 Rows |
Sex and Age in Crown Heights
Sex and Age in Crown Heights
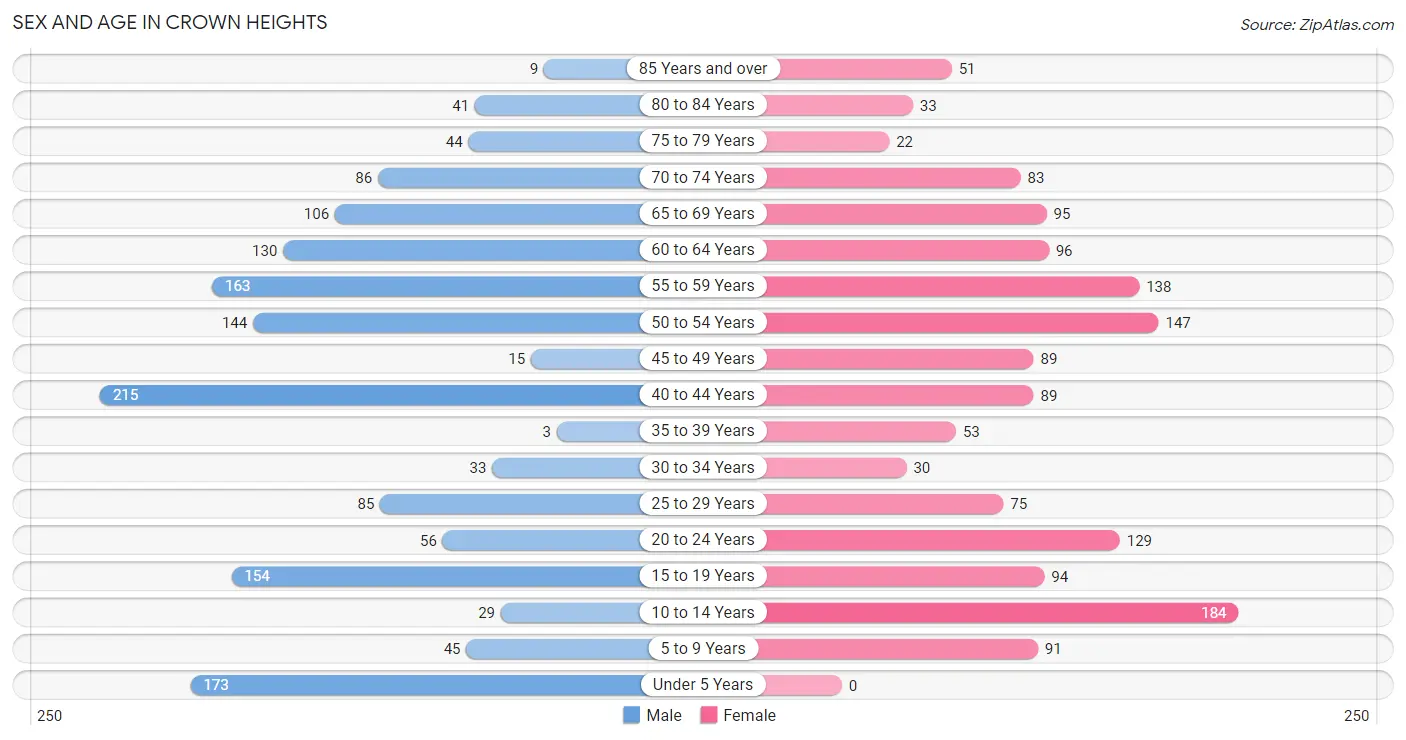
The most populous age groups in Crown Heights are 40 to 44 Years (215 | 14.0%) for men and 10 to 14 Years (184 | 12.3%) for women.
| Age Bracket | Male | Female |
| Under 5 Years | 173 (11.3%) | 0 (0.0%) |
| 5 to 9 Years | 45 (2.9%) | 91 (6.1%) |
| 10 to 14 Years | 29 (1.9%) | 184 (12.3%) |
| 15 to 19 Years | 154 (10.1%) | 94 (6.3%) |
| 20 to 24 Years | 56 (3.7%) | 129 (8.6%) |
| 25 to 29 Years | 85 (5.6%) | 75 (5.0%) |
| 30 to 34 Years | 33 (2.2%) | 30 (2.0%) |
| 35 to 39 Years | 3 (0.2%) | 53 (3.5%) |
| 40 to 44 Years | 215 (14.0%) | 89 (5.9%) |
| 45 to 49 Years | 15 (1.0%) | 89 (5.9%) |
| 50 to 54 Years | 144 (9.4%) | 147 (9.8%) |
| 55 to 59 Years | 163 (10.6%) | 138 (9.2%) |
| 60 to 64 Years | 130 (8.5%) | 96 (6.4%) |
| 65 to 69 Years | 106 (6.9%) | 95 (6.3%) |
| 70 to 74 Years | 86 (5.6%) | 83 (5.5%) |
| 75 to 79 Years | 44 (2.9%) | 22 (1.5%) |
| 80 to 84 Years | 41 (2.7%) | 33 (2.2%) |
| 85 Years and over | 9 (0.6%) | 51 (3.4%) |
| Total | 1,531 (100.0%) | 1,499 (100.0%) |
Families and Households in Crown Heights
Median Family Size in Crown Heights
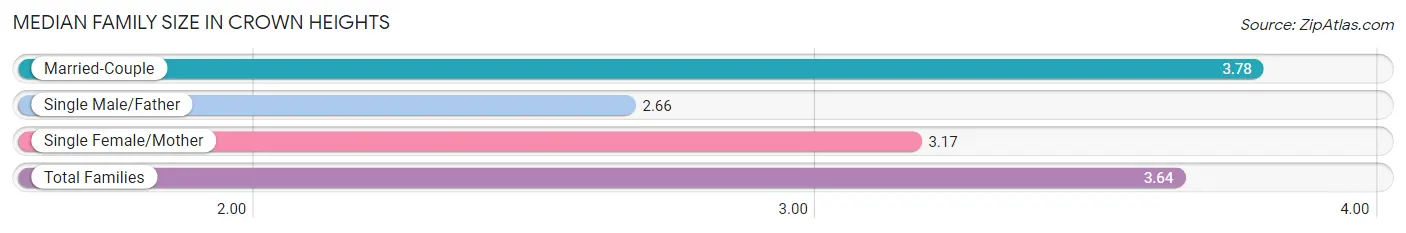
The median family size in Crown Heights is 3.64 persons per family, with married-couple families (575 | 85.4%) accounting for the largest median family size of 3.78 persons per family. On the other hand, single male/father families (62 | 9.2%) represent the smallest median family size with 2.66 persons per family.
| Family Type | # Families | Family Size |
| Married-Couple | 575 (85.4%) | 3.78 |
| Single Male/Father | 62 (9.2%) | 2.66 |
| Single Female/Mother | 36 (5.3%) | 3.17 |
| Total Families | 673 (100.0%) | 3.64 |
Median Household Size in Crown Heights
The median household size in Crown Heights is 2.88 persons per household, with single female/mother households (36 | 3.4%) accounting for the largest median household size of 3.92 persons per household. non-family households (379 | 36.0%) represent the smallest median household size with 1.45 persons per household.

| Household Type | # Households | Household Size |
| Married-Couple | 575 (54.7%) | 3.78 |
| Single Male/Father | 62 (5.9%) | 2.66 |
| Single Female/Mother | 36 (3.4%) | 3.92 |
| Non-family | 379 (36.0%) | 1.45 |
| Total Households | 1,052 (100.0%) | 2.88 |
Household Size by Marriage Status in Crown Heights
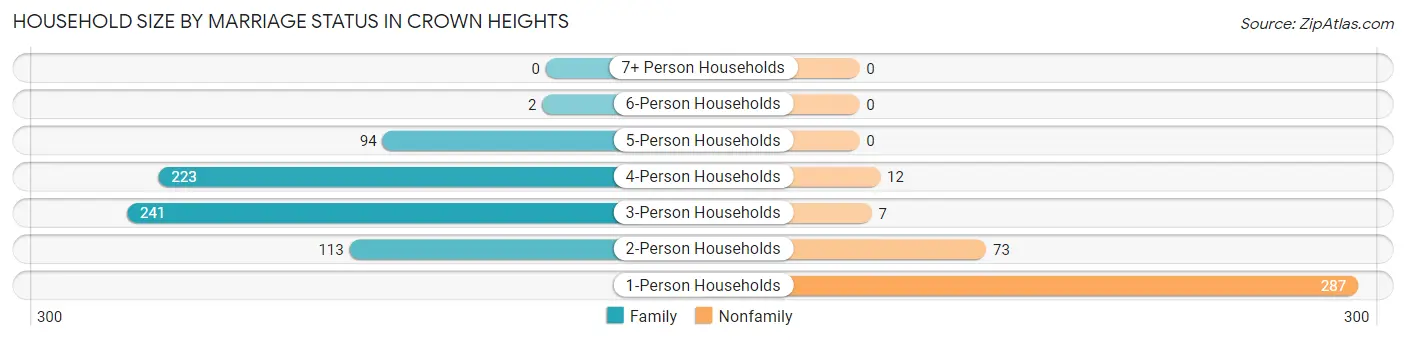
Out of a total of 1,052 households in Crown Heights, 673 (64.0%) are family households, while 379 (36.0%) are nonfamily households. The most numerous type of family households are 3-person households, comprising 241, and the most common type of nonfamily households are 1-person households, comprising 287.
| Household Size | Family Households | Nonfamily Households |
| 1-Person Households | - | 287 (27.3%) |
| 2-Person Households | 113 (10.7%) | 73 (6.9%) |
| 3-Person Households | 241 (22.9%) | 7 (0.7%) |
| 4-Person Households | 223 (21.2%) | 12 (1.1%) |
| 5-Person Households | 94 (8.9%) | 0 (0.0%) |
| 6-Person Households | 2 (0.2%) | 0 (0.0%) |
| 7+ Person Households | 0 (0.0%) | 0 (0.0%) |
| Total | 673 (64.0%) | 379 (36.0%) |
Female Fertility in Crown Heights
Fertility by Age in Crown Heights
Average fertility rate in Crown Heights is 100.0 births per 1,000 women. Women in the age bracket of 35 to 50 years have the highest fertility rate with 199.0 births per 1,000 women. Women in the age bracket of 35 to 50 years acount for 82.1% of all women with births.
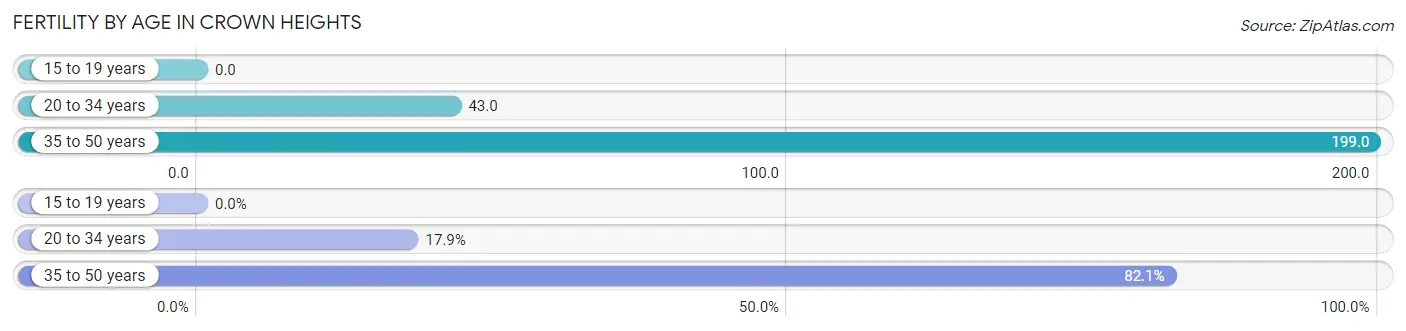
| Age Bracket | Women with Births | Births / 1,000 Women |
| 15 to 19 years | 0 (0.0%) | 0.0 |
| 20 to 34 years | 10 (17.9%) | 43.0 |
| 35 to 50 years | 46 (82.1%) | 199.0 |
| Total | 56 (100.0%) | 100.0 |
Fertility by Age by Marriage Status in Crown Heights
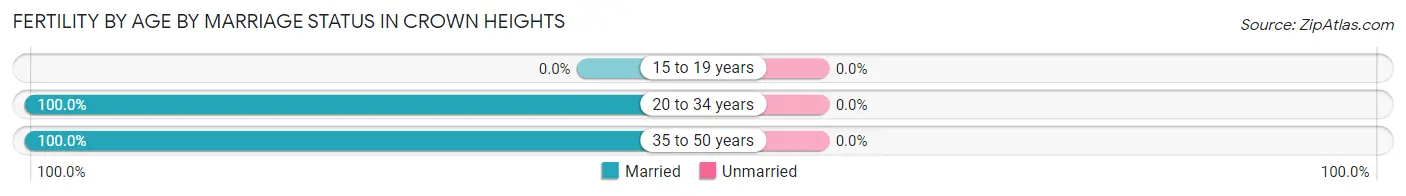
| Age Bracket | Married | Unmarried |
| 15 to 19 years | 0 (0.0%) | 0 (0.0%) |
| 20 to 34 years | 10 (100.0%) | 0 (0.0%) |
| 35 to 50 years | 46 (100.0%) | 0 (0.0%) |
| Total | 56 (100.0%) | 0 (0.0%) |
Fertility by Education in Crown Heights
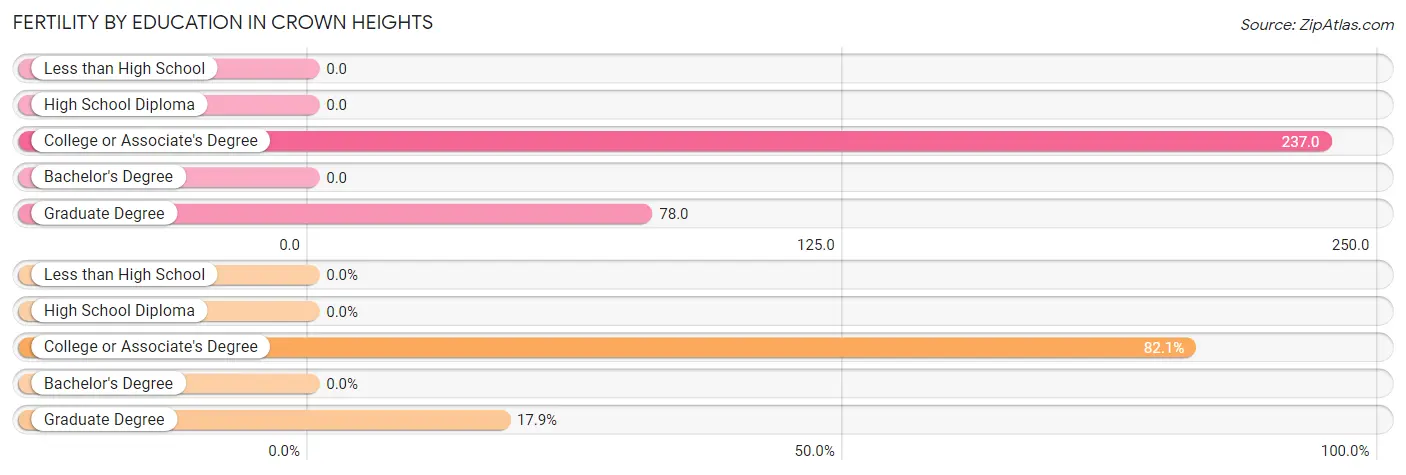
| Educational Attainment | Women with Births | Births / 1,000 Women |
| Less than High School | 0 (0.0%) | 0.0 |
| High School Diploma | 0 (0.0%) | 0.0 |
| College or Associate's Degree | 46 (82.1%) | 237.0 |
| Bachelor's Degree | 0 (0.0%) | 0.0 |
| Graduate Degree | 10 (17.9%) | 78.0 |
| Total | 56 (100.0%) | 100.0 |
Fertility by Education by Marriage Status in Crown Heights
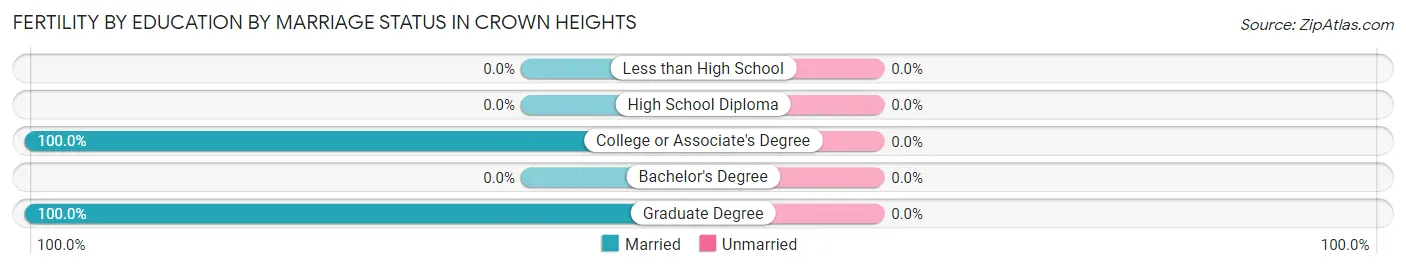
| Educational Attainment | Married | Unmarried |
| Less than High School | 0 (0.0%) | 0 (0.0%) |
| High School Diploma | 0 (0.0%) | 0 (0.0%) |
| College or Associate's Degree | 46 (100.0%) | 0 (0.0%) |
| Bachelor's Degree | 0 (0.0%) | 0 (0.0%) |
| Graduate Degree | 10 (100.0%) | 0 (0.0%) |
| Total | 56 (100.0%) | 0 (0.0%) |
Employment Characteristics in Crown Heights
Employment by Class of Employer in Crown Heights
Among the 1,461 employed individuals in Crown Heights, private company employees (830 | 56.8%), local government employees (270 | 18.5%), and not-for-profit organizations (151 | 10.3%) make up the most common classes of employment.
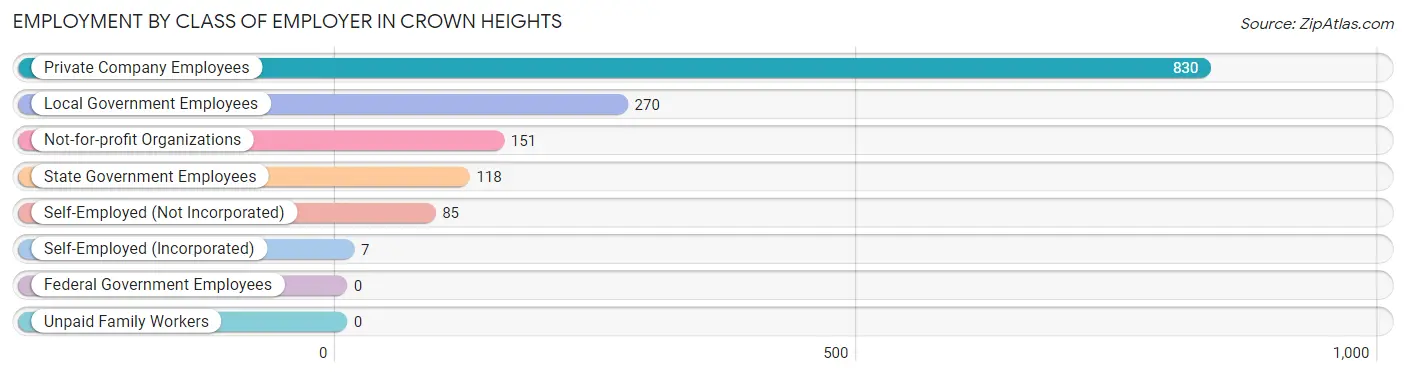
| Employer Class | # Employees | % Employees |
| Private Company Employees | 830 | 56.8% |
| Self-Employed (Incorporated) | 7 | 0.5% |
| Self-Employed (Not Incorporated) | 85 | 5.8% |
| Not-for-profit Organizations | 151 | 10.3% |
| Local Government Employees | 270 | 18.5% |
| State Government Employees | 118 | 8.1% |
| Federal Government Employees | 0 | 0.0% |
| Unpaid Family Workers | 0 | 0.0% |
| Total | 1,461 | 100.0% |
Employment Status by Age in Crown Heights
According to the labor force statistics for Crown Heights, out of the total population over 16 years of age (2,467), 67.9% or 1,675 individuals are in the labor force, with 9.9% or 166 of them unemployed. The age group with the highest labor force participation rate is 25 to 29 years, with 93.1% or 149 individuals in the labor force. Within the labor force, the 55 to 59 years age range has the highest percentage of unemployed individuals, with 44.0% or 113 of them being unemployed.
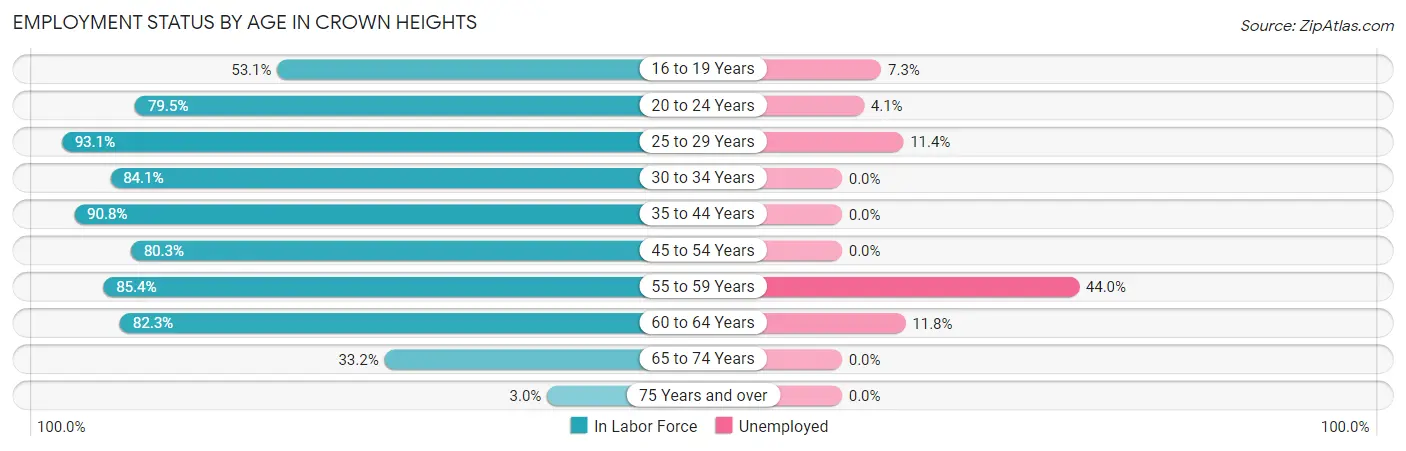
| Age Bracket | In Labor Force | Unemployed |
| 16 to 19 Years | 110 (53.1%) | 8 (7.3%) |
| 20 to 24 Years | 147 (79.5%) | 6 (4.1%) |
| 25 to 29 Years | 149 (93.1%) | 17 (11.4%) |
| 30 to 34 Years | 53 (84.1%) | 0 (0.0%) |
| 35 to 44 Years | 327 (90.8%) | 0 (0.0%) |
| 45 to 54 Years | 317 (80.3%) | 0 (0.0%) |
| 55 to 59 Years | 257 (85.4%) | 113 (44.0%) |
| 60 to 64 Years | 186 (82.3%) | 22 (11.8%) |
| 65 to 74 Years | 123 (33.2%) | 0 (0.0%) |
| 75 Years and over | 6 (3.0%) | 0 (0.0%) |
| Total | 1,675 (67.9%) | 166 (9.9%) |
Employment Status by Educational Attainment in Crown Heights
According to labor force statistics for Crown Heights, 85.6% of individuals (1,288) out of the total population between 25 and 64 years of age (1,505) are in the labor force, with 11.8% or 152 of them being unemployed. The group with the highest labor force participation rate are those with the educational attainment of college / associate degree, with 91.7% or 289 individuals in the labor force. Within the labor force, individuals with high school diploma education have the highest percentage of unemployment, with 25.2% or 107 of them being unemployed.
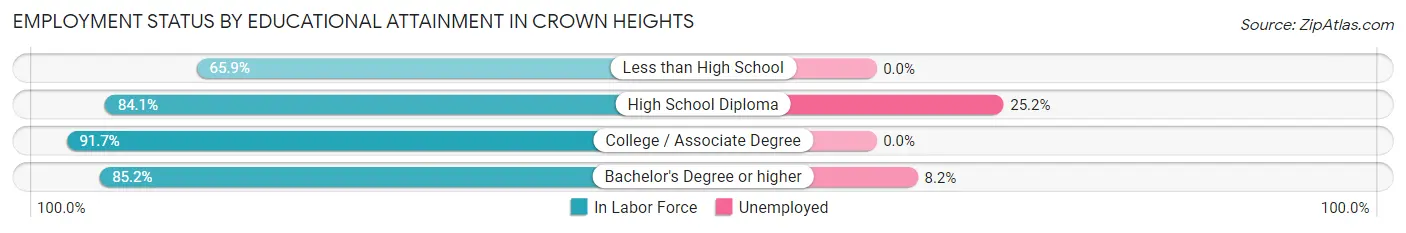
| Educational Attainment | In Labor Force | Unemployed |
| Less than High School | 29 (65.9%) | 0 (0.0%) |
| High School Diploma | 424 (84.1%) | 127 (25.2%) |
| College / Associate Degree | 289 (91.7%) | 0 (0.0%) |
| Bachelor's Degree or higher | 547 (85.2%) | 53 (8.2%) |
| Total | 1,288 (85.6%) | 178 (11.8%) |
Employment Occupations by Sex in Crown Heights
Management, Business, Science and Arts Occupations
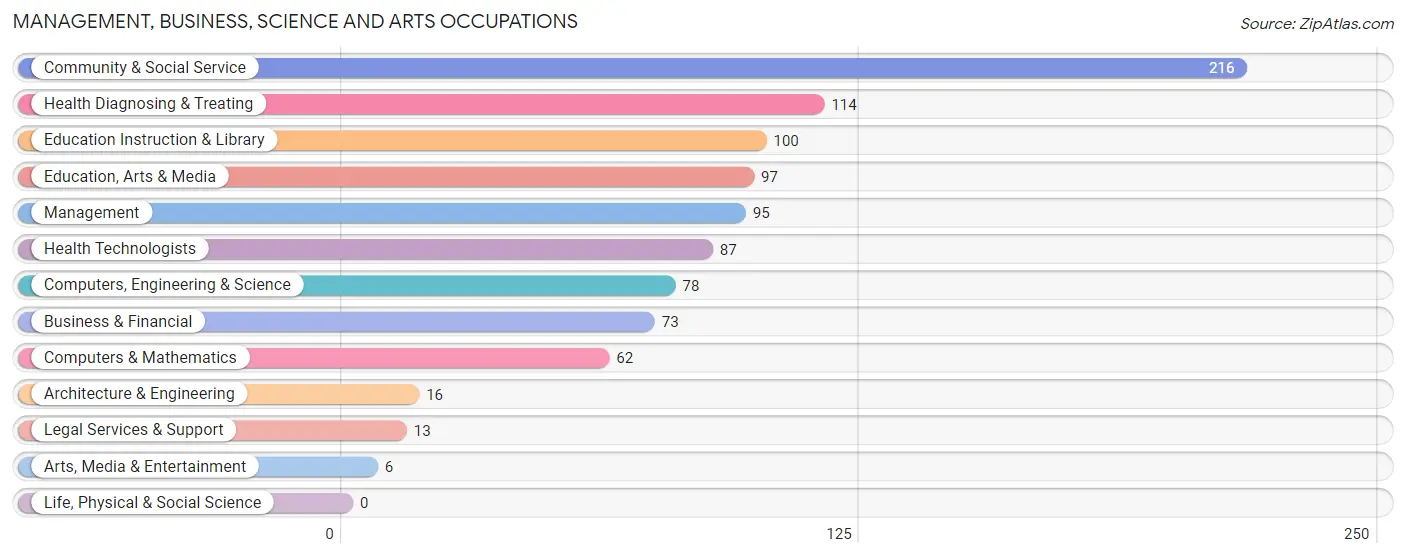
The most common Management, Business, Science and Arts occupations in Crown Heights are Community & Social Service (216 | 14.3%), Health Diagnosing & Treating (114 | 7.5%), Education Instruction & Library (100 | 6.6%), Education, Arts & Media (97 | 6.4%), and Management (95 | 6.3%).
Management, Business, Science and Arts Occupations by Sex
Within the Management, Business, Science and Arts occupations in Crown Heights, the most male-oriented occupations are Architecture & Engineering (100.0%), Computers, Engineering & Science (93.6%), and Computers & Mathematics (91.9%), while the most female-oriented occupations are Legal Services & Support (100.0%), Arts, Media & Entertainment (100.0%), and Education Instruction & Library (93.0%).
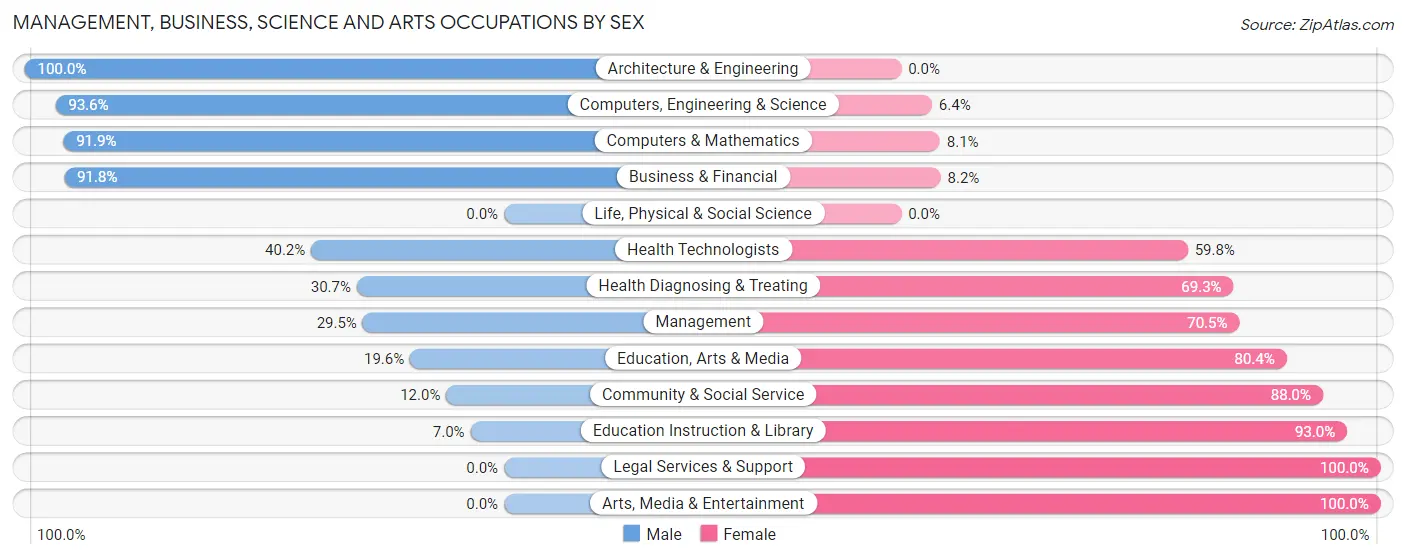
| Occupation | Male | Female |
| Management | 28 (29.5%) | 67 (70.5%) |
| Business & Financial | 67 (91.8%) | 6 (8.2%) |
| Computers, Engineering & Science | 73 (93.6%) | 5 (6.4%) |
| Computers & Mathematics | 57 (91.9%) | 5 (8.1%) |
| Architecture & Engineering | 16 (100.0%) | 0 (0.0%) |
| Life, Physical & Social Science | 0 (0.0%) | 0 (0.0%) |
| Community & Social Service | 26 (12.0%) | 190 (88.0%) |
| Education, Arts & Media | 19 (19.6%) | 78 (80.4%) |
| Legal Services & Support | 0 (0.0%) | 13 (100.0%) |
| Education Instruction & Library | 7 (7.0%) | 93 (93.0%) |
| Arts, Media & Entertainment | 0 (0.0%) | 6 (100.0%) |
| Health Diagnosing & Treating | 35 (30.7%) | 79 (69.3%) |
| Health Technologists | 35 (40.2%) | 52 (59.8%) |
| Total (Category) | 229 (39.8%) | 347 (60.2%) |
| Total (Overall) | 743 (49.2%) | 766 (50.8%) |
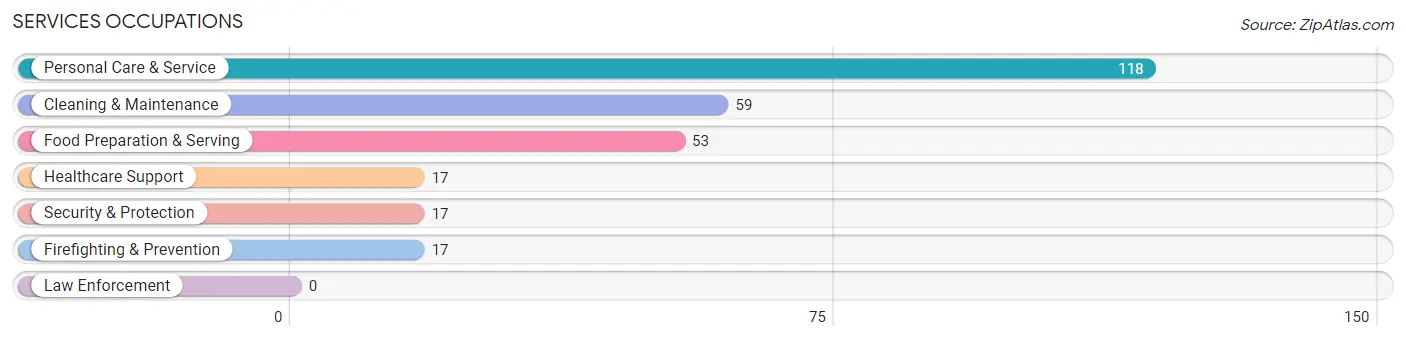
Services Occupations
The most common Services occupations in Crown Heights are Personal Care & Service (118 | 7.8%), Cleaning & Maintenance (59 | 3.9%), Food Preparation & Serving (53 | 3.5%), Healthcare Support (17 | 1.1%), and Security & Protection (17 | 1.1%).
Services Occupations by Sex
Within the Services occupations in Crown Heights, the most male-oriented occupations are Security & Protection (100.0%), Firefighting & Prevention (100.0%), and Cleaning & Maintenance (100.0%), while the most female-oriented occupations are Healthcare Support (100.0%), Food Preparation & Serving (81.1%), and Personal Care & Service (66.9%).
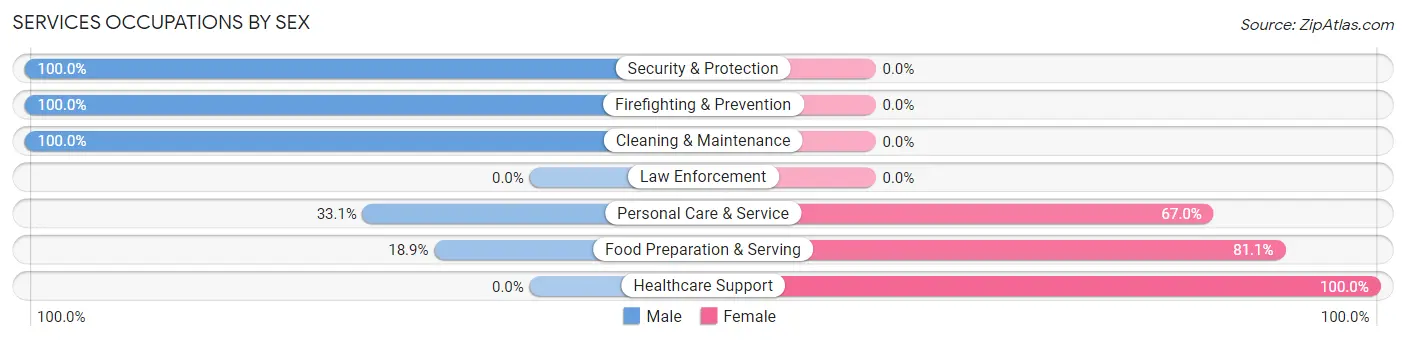
| Occupation | Male | Female |
| Healthcare Support | 0 (0.0%) | 17 (100.0%) |
| Security & Protection | 17 (100.0%) | 0 (0.0%) |
| Firefighting & Prevention | 17 (100.0%) | 0 (0.0%) |
| Law Enforcement | 0 (0.0%) | 0 (0.0%) |
| Food Preparation & Serving | 10 (18.9%) | 43 (81.1%) |
| Cleaning & Maintenance | 59 (100.0%) | 0 (0.0%) |
| Personal Care & Service | 39 (33.1%) | 79 (66.9%) |
| Total (Category) | 125 (47.3%) | 139 (52.6%) |
| Total (Overall) | 743 (49.2%) | 766 (50.8%) |
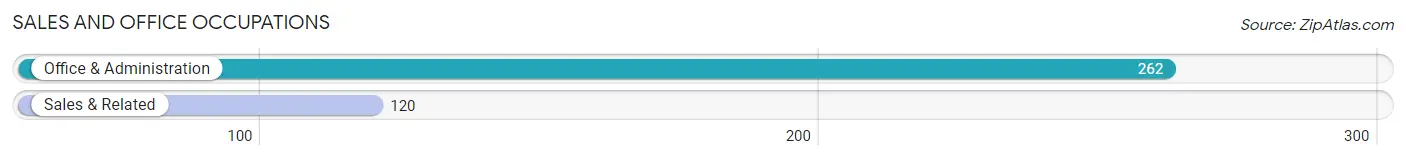
Sales and Office Occupations
The most common Sales and Office occupations in Crown Heights are Office & Administration (262 | 17.4%), and Sales & Related (120 | 8.0%).
Sales and Office Occupations by Sex
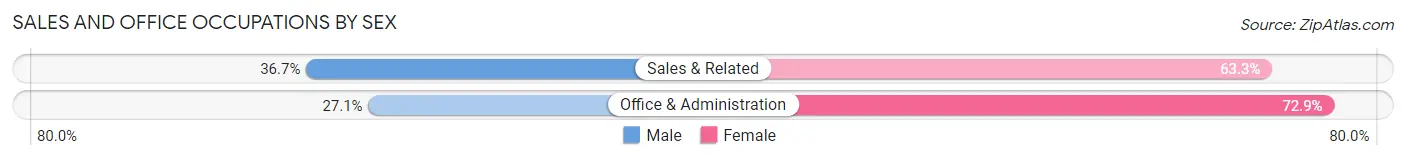
| Occupation | Male | Female |
| Sales & Related | 44 (36.7%) | 76 (63.3%) |
| Office & Administration | 71 (27.1%) | 191 (72.9%) |
| Total (Category) | 115 (30.1%) | 267 (69.9%) |
| Total (Overall) | 743 (49.2%) | 766 (50.8%) |
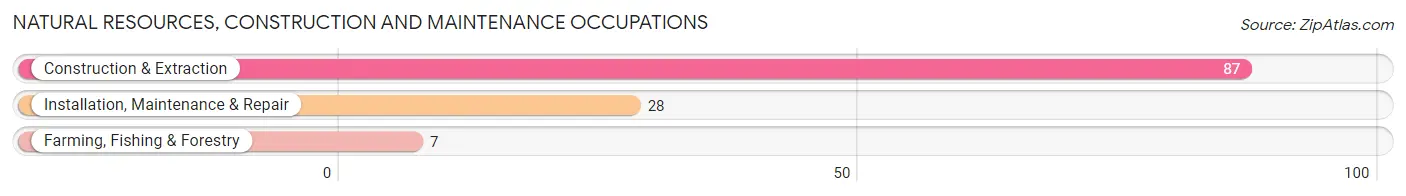
Natural Resources, Construction and Maintenance Occupations
The most common Natural Resources, Construction and Maintenance occupations in Crown Heights are Construction & Extraction (87 | 5.8%), Installation, Maintenance & Repair (28 | 1.9%), and Farming, Fishing & Forestry (7 | 0.5%).
Natural Resources, Construction and Maintenance Occupations by Sex
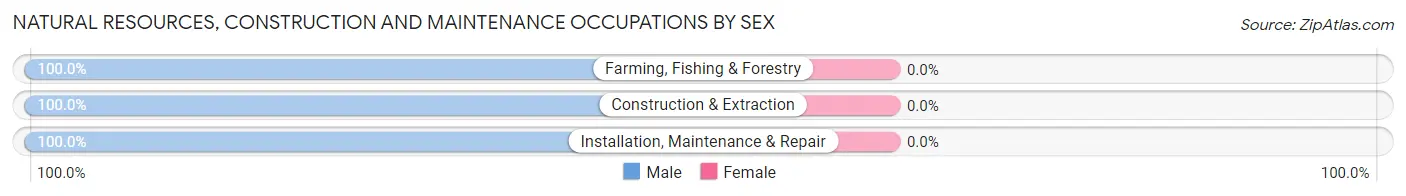
| Occupation | Male | Female |
| Farming, Fishing & Forestry | 7 (100.0%) | 0 (0.0%) |
| Construction & Extraction | 87 (100.0%) | 0 (0.0%) |
| Installation, Maintenance & Repair | 28 (100.0%) | 0 (0.0%) |
| Total (Category) | 122 (100.0%) | 0 (0.0%) |
| Total (Overall) | 743 (49.2%) | 766 (50.8%) |
Production, Transportation and Moving Occupations
The most common Production, Transportation and Moving occupations in Crown Heights are Production (75 | 5.0%), Transportation (48 | 3.2%), and Material Moving (42 | 2.8%).
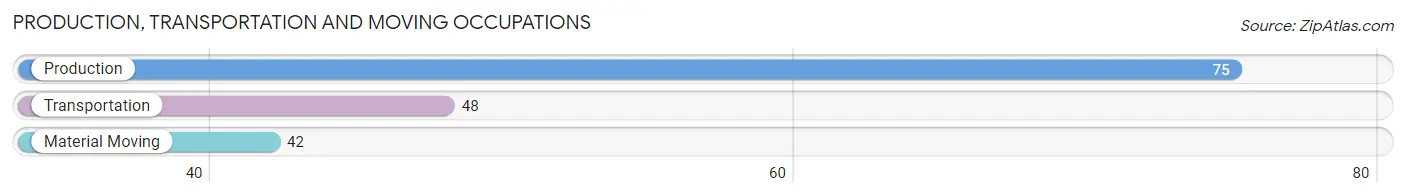
Production, Transportation and Moving Occupations by Sex
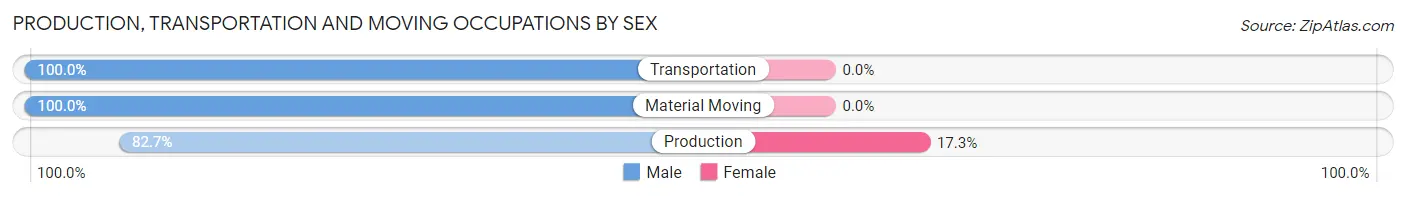
| Occupation | Male | Female |
| Production | 62 (82.7%) | 13 (17.3%) |
| Transportation | 48 (100.0%) | 0 (0.0%) |
| Material Moving | 42 (100.0%) | 0 (0.0%) |
| Total (Category) | 152 (92.1%) | 13 (7.9%) |
| Total (Overall) | 743 (49.2%) | 766 (50.8%) |
Employment Industries by Sex in Crown Heights
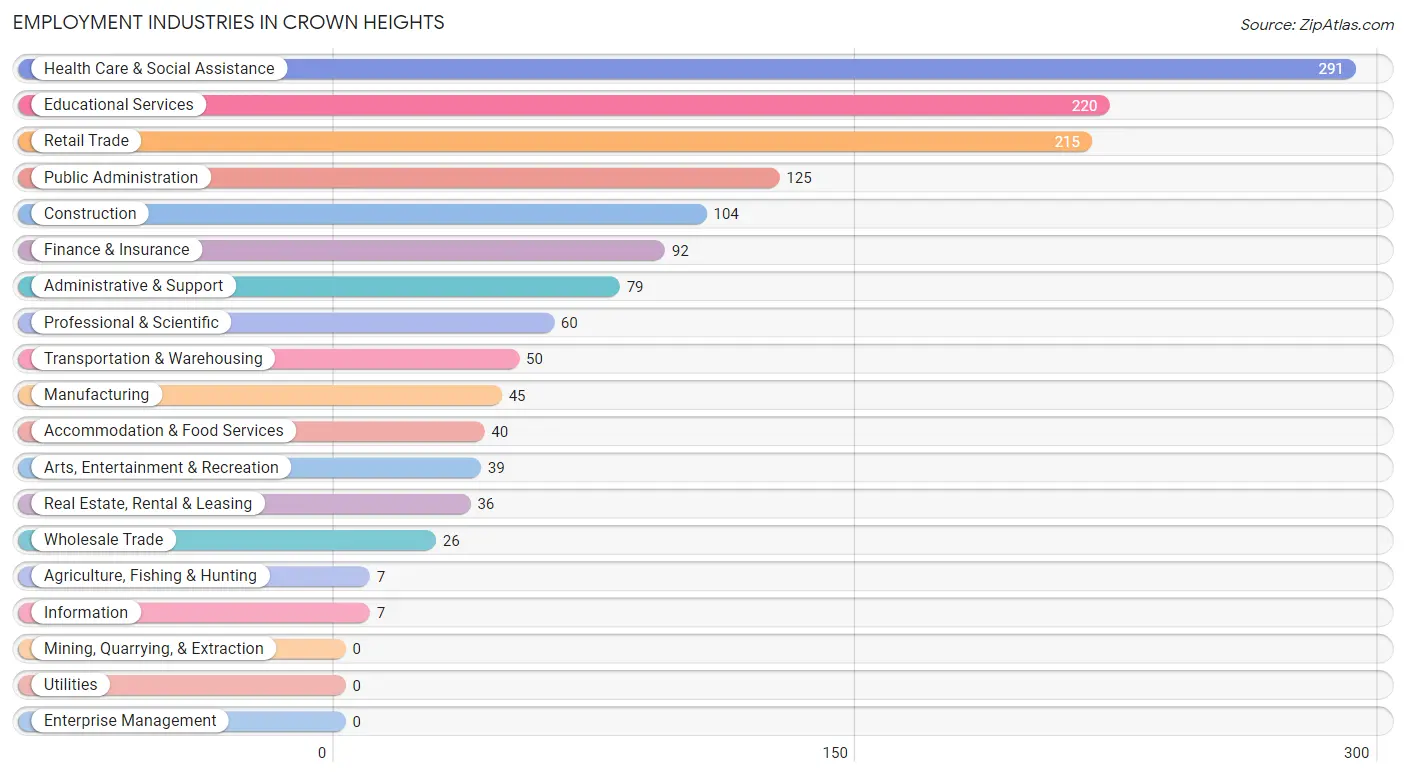
Employment Industries in Crown Heights
The major employment industries in Crown Heights include Health Care & Social Assistance (291 | 19.3%), Educational Services (220 | 14.6%), Retail Trade (215 | 14.2%), Public Administration (125 | 8.3%), and Construction (104 | 6.9%).
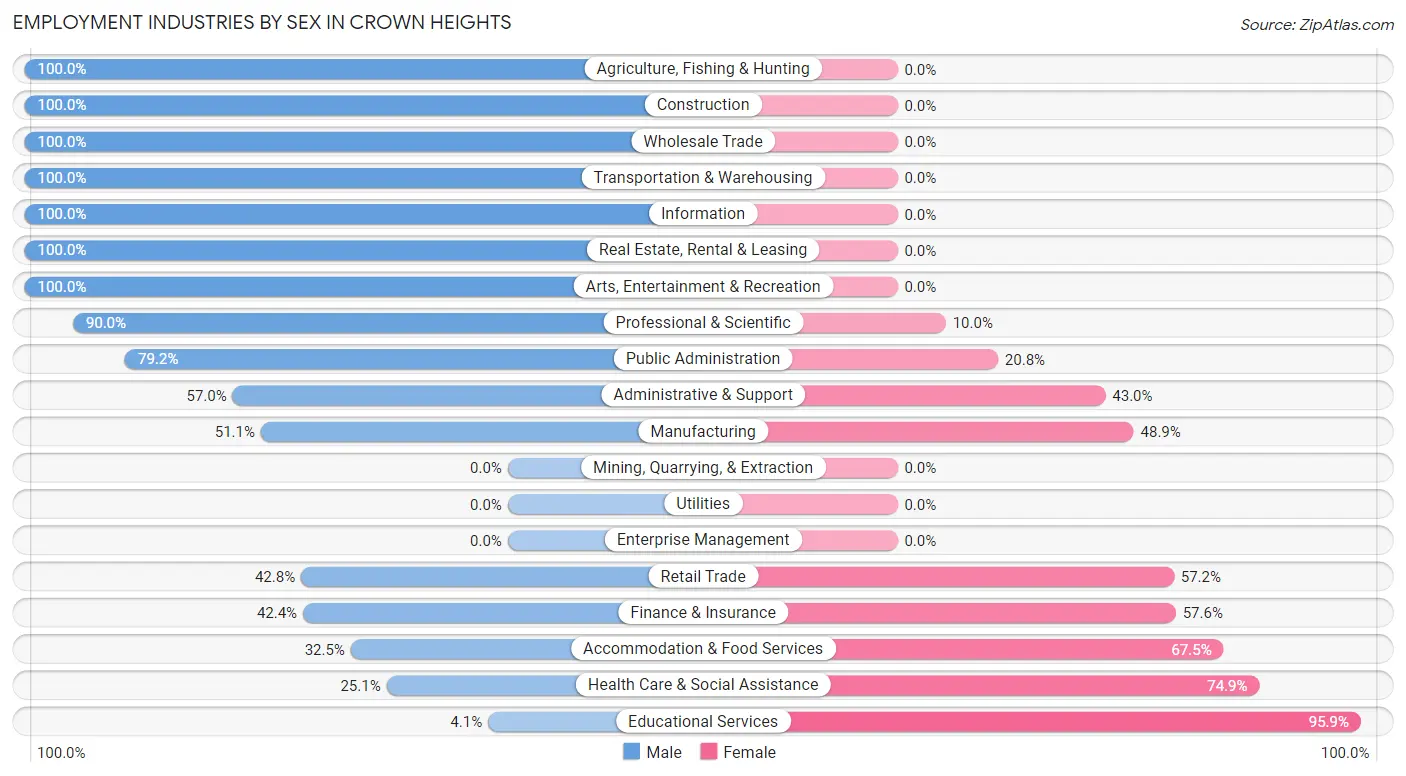
Employment Industries by Sex in Crown Heights
The Crown Heights industries that see more men than women are Agriculture, Fishing & Hunting (100.0%), Construction (100.0%), and Wholesale Trade (100.0%), whereas the industries that tend to have a higher number of women are Educational Services (95.9%), Health Care & Social Assistance (74.9%), and Accommodation & Food Services (67.5%).
| Industry | Male | Female |
| Agriculture, Fishing & Hunting | 7 (100.0%) | 0 (0.0%) |
| Mining, Quarrying, & Extraction | 0 (0.0%) | 0 (0.0%) |
| Construction | 104 (100.0%) | 0 (0.0%) |
| Manufacturing | 23 (51.1%) | 22 (48.9%) |
| Wholesale Trade | 26 (100.0%) | 0 (0.0%) |
| Retail Trade | 92 (42.8%) | 123 (57.2%) |
| Transportation & Warehousing | 50 (100.0%) | 0 (0.0%) |
| Utilities | 0 (0.0%) | 0 (0.0%) |
| Information | 7 (100.0%) | 0 (0.0%) |
| Finance & Insurance | 39 (42.4%) | 53 (57.6%) |
| Real Estate, Rental & Leasing | 36 (100.0%) | 0 (0.0%) |
| Professional & Scientific | 54 (90.0%) | 6 (10.0%) |
| Enterprise Management | 0 (0.0%) | 0 (0.0%) |
| Administrative & Support | 45 (57.0%) | 34 (43.0%) |
| Educational Services | 9 (4.1%) | 211 (95.9%) |
| Health Care & Social Assistance | 73 (25.1%) | 218 (74.9%) |
| Arts, Entertainment & Recreation | 39 (100.0%) | 0 (0.0%) |
| Accommodation & Food Services | 13 (32.5%) | 27 (67.5%) |
| Public Administration | 99 (79.2%) | 26 (20.8%) |
| Total | 743 (49.2%) | 766 (50.8%) |
Education in Crown Heights
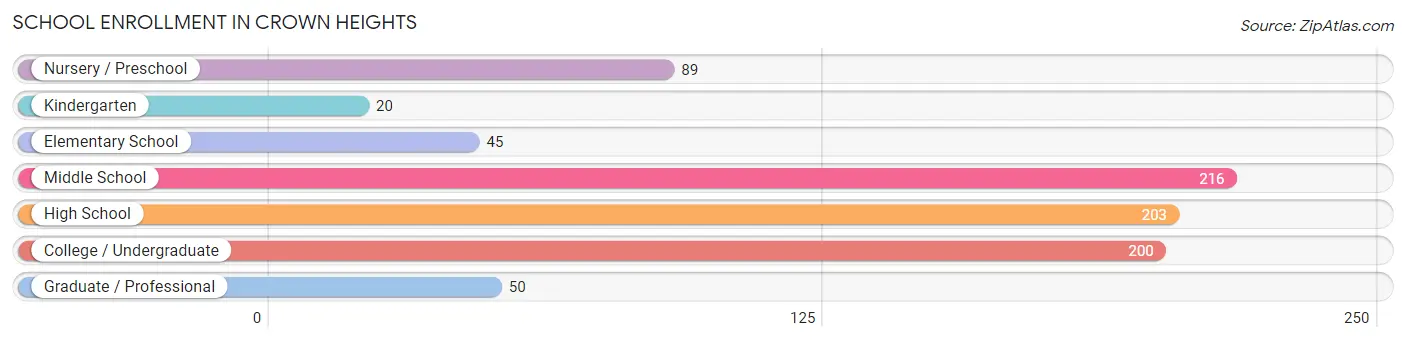
School Enrollment in Crown Heights
The most common levels of schooling among the 823 students in Crown Heights are middle school (216 | 26.3%), high school (203 | 24.7%), and college / undergraduate (200 | 24.3%).
| School Level | # Students | % Students |
| Nursery / Preschool | 89 | 10.8% |
| Kindergarten | 20 | 2.4% |
| Elementary School | 45 | 5.5% |
| Middle School | 216 | 26.3% |
| High School | 203 | 24.7% |
| College / Undergraduate | 200 | 24.3% |
| Graduate / Professional | 50 | 6.1% |
| Total | 823 | 100.0% |
School Enrollment by Age by Funding Source in Crown Heights
Out of a total of 823 students who are enrolled in schools in Crown Heights, 141 (17.1%) attend a private institution, while the remaining 682 (82.9%) are enrolled in public schools. The age group of 35 years and over has the highest likelihood of being enrolled in private schools, with 32 (54.2% in the age bracket) enrolled. Conversely, the age group of 5 to 9 year old has the lowest likelihood of being enrolled in a private school, with 45 (100.0% in the age bracket) attending a public institution.
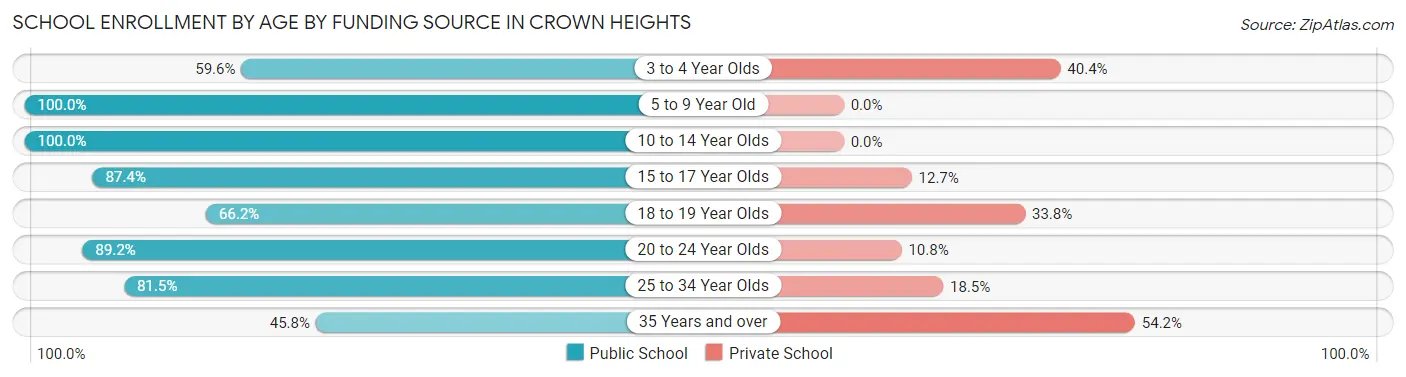
| Age Bracket | Public School | Private School |
| 3 to 4 Year Olds | 65 (59.6%) | 44 (40.4%) |
| 5 to 9 Year Old | 45 (100.0%) | 0 (0.0%) |
| 10 to 14 Year Olds | 213 (100.0%) | 0 (0.0%) |
| 15 to 17 Year Olds | 145 (87.4%) | 21 (12.7%) |
| 18 to 19 Year Olds | 49 (66.2%) | 25 (33.8%) |
| 20 to 24 Year Olds | 116 (89.2%) | 14 (10.8%) |
| 25 to 34 Year Olds | 22 (81.5%) | 5 (18.5%) |
| 35 Years and over | 27 (45.8%) | 32 (54.2%) |
| Total | 682 (82.9%) | 141 (17.1%) |
Educational Attainment by Field of Study in Crown Heights
Arts & humanities (154 | 19.4%), business (128 | 16.1%), engineering (82 | 10.3%), education (80 | 10.1%), and science & technology (72 | 9.1%) are the most common fields of study among 794 individuals in Crown Heights who have obtained a bachelor's degree or higher.
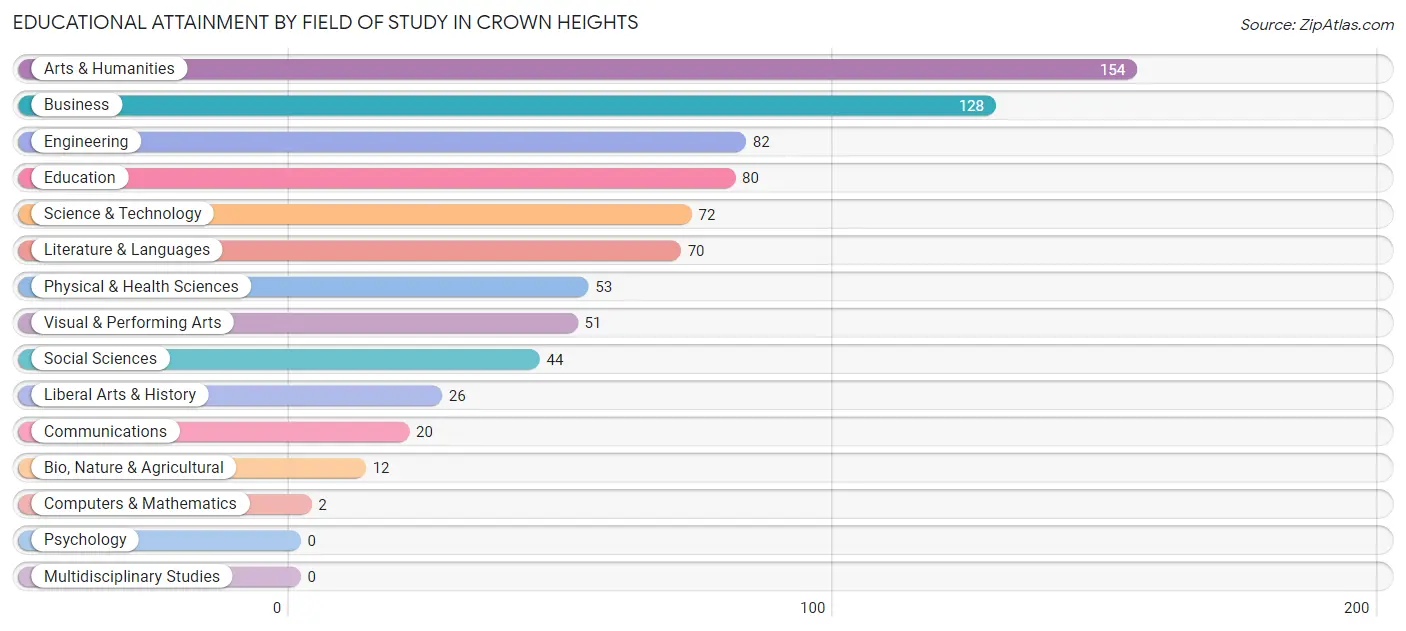
| Field of Study | # Graduates | % Graduates |
| Computers & Mathematics | 2 | 0.3% |
| Bio, Nature & Agricultural | 12 | 1.5% |
| Physical & Health Sciences | 53 | 6.7% |
| Psychology | 0 | 0.0% |
| Social Sciences | 44 | 5.5% |
| Engineering | 82 | 10.3% |
| Multidisciplinary Studies | 0 | 0.0% |
| Science & Technology | 72 | 9.1% |
| Business | 128 | 16.1% |
| Education | 80 | 10.1% |
| Literature & Languages | 70 | 8.8% |
| Liberal Arts & History | 26 | 3.3% |
| Visual & Performing Arts | 51 | 6.4% |
| Communications | 20 | 2.5% |
| Arts & Humanities | 154 | 19.4% |
| Total | 794 | 100.0% |
Transportation & Commute in Crown Heights
Vehicle Availability by Sex in Crown Heights
The most prevalent vehicle ownership categories in Crown Heights are males with 2 vehicles (255, accounting for 36.2%) and females with 2 vehicles (245, making up 33.7%).
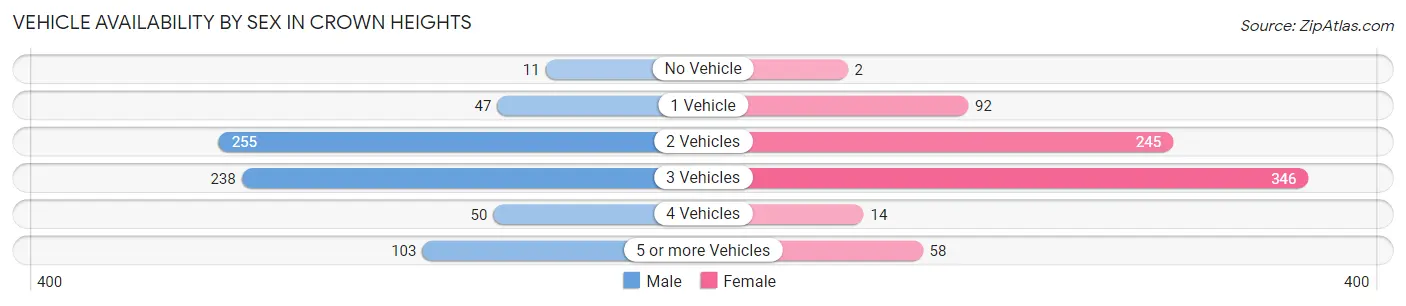
| Vehicles Available | Male | Female |
| No Vehicle | 11 (1.6%) | 2 (0.3%) |
| 1 Vehicle | 47 (6.7%) | 92 (12.1%) |
| 2 Vehicles | 255 (36.2%) | 245 (32.4%) |
| 3 Vehicles | 238 (33.8%) | 346 (45.7%) |
| 4 Vehicles | 50 (7.1%) | 14 (1.8%) |
| 5 or more Vehicles | 103 (14.6%) | 58 (7.7%) |
| Total | 704 (100.0%) | 757 (100.0%) |
Commute Time in Crown Heights
The most frequently occuring commute durations in Crown Heights are 60 to 89 minutes (322 commuters, 23.0%), 45 to 59 minutes (220 commuters, 15.7%), and 90 or more minutes (195 commuters, 13.9%).
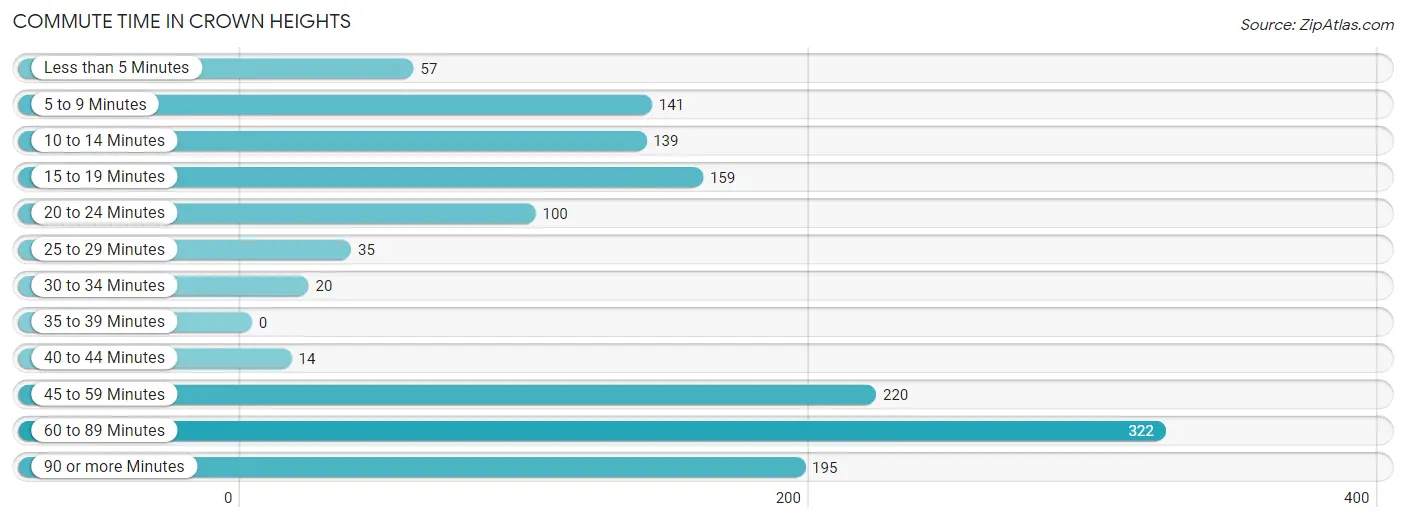
| Commute Time | # Commuters | % Commuters |
| Less than 5 Minutes | 57 | 4.1% |
| 5 to 9 Minutes | 141 | 10.1% |
| 10 to 14 Minutes | 139 | 9.9% |
| 15 to 19 Minutes | 159 | 11.3% |
| 20 to 24 Minutes | 100 | 7.1% |
| 25 to 29 Minutes | 35 | 2.5% |
| 30 to 34 Minutes | 20 | 1.4% |
| 35 to 39 Minutes | 0 | 0.0% |
| 40 to 44 Minutes | 14 | 1.0% |
| 45 to 59 Minutes | 220 | 15.7% |
| 60 to 89 Minutes | 322 | 23.0% |
| 90 or more Minutes | 195 | 13.9% |
Commute Time by Sex in Crown Heights
The most common commute times in Crown Heights are 45 to 59 minutes (154 commuters, 22.8%) for males and 60 to 89 minutes (183 commuters, 25.2%) for females.
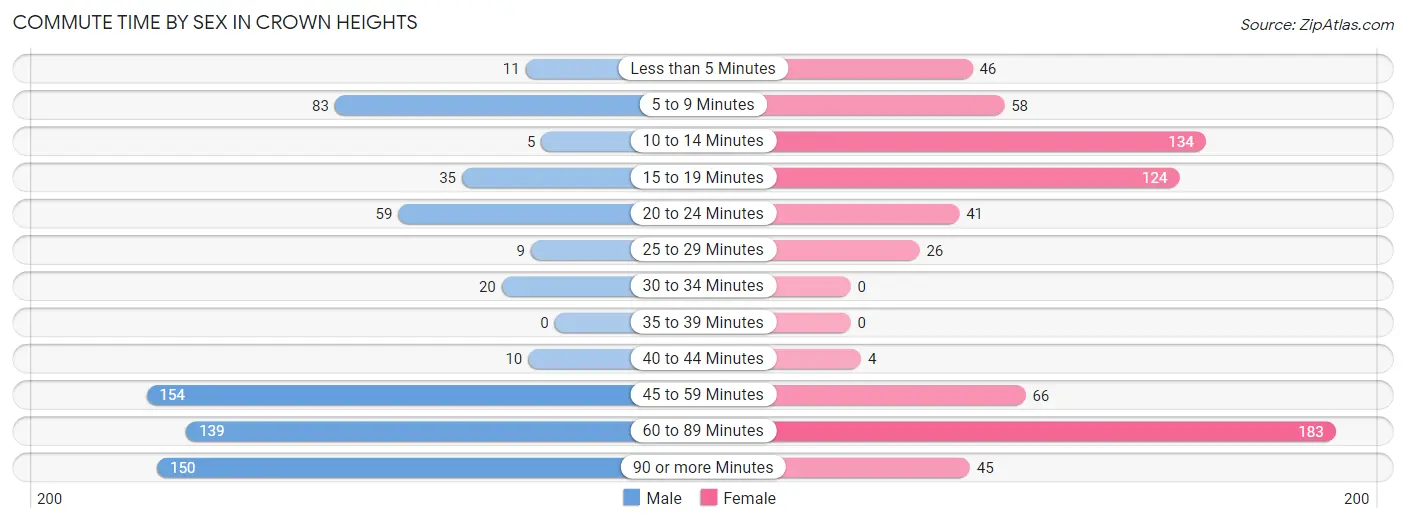
| Commute Time | Male | Female |
| Less than 5 Minutes | 11 (1.6%) | 46 (6.3%) |
| 5 to 9 Minutes | 83 (12.3%) | 58 (8.0%) |
| 10 to 14 Minutes | 5 (0.7%) | 134 (18.4%) |
| 15 to 19 Minutes | 35 (5.2%) | 124 (17.1%) |
| 20 to 24 Minutes | 59 (8.7%) | 41 (5.6%) |
| 25 to 29 Minutes | 9 (1.3%) | 26 (3.6%) |
| 30 to 34 Minutes | 20 (3.0%) | 0 (0.0%) |
| 35 to 39 Minutes | 0 (0.0%) | 0 (0.0%) |
| 40 to 44 Minutes | 10 (1.5%) | 4 (0.5%) |
| 45 to 59 Minutes | 154 (22.8%) | 66 (9.1%) |
| 60 to 89 Minutes | 139 (20.6%) | 183 (25.2%) |
| 90 or more Minutes | 150 (22.2%) | 45 (6.2%) |
Time of Departure to Work by Sex in Crown Heights
The most frequent times of departure to work in Crown Heights are 5:00 AM to 5:29 AM (205, 30.4%) for males and 7:30 AM to 7:59 AM (156, 21.5%) for females.
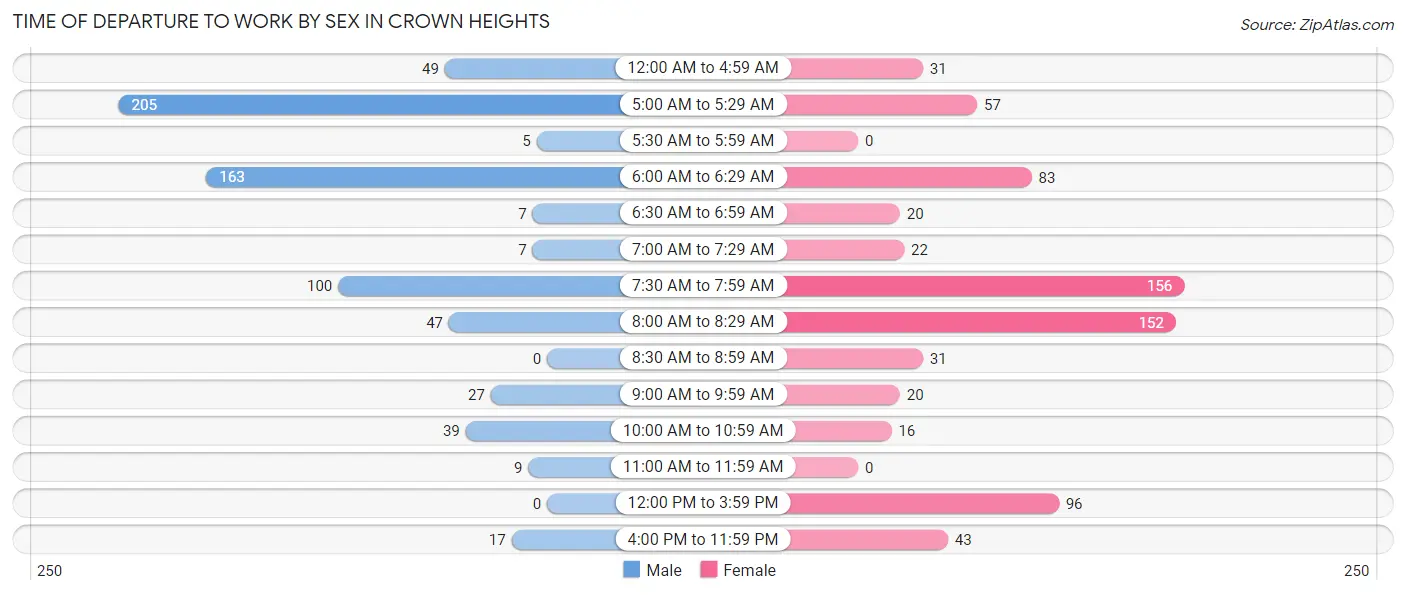
| Time of Departure | Male | Female |
| 12:00 AM to 4:59 AM | 49 (7.3%) | 31 (4.3%) |
| 5:00 AM to 5:29 AM | 205 (30.4%) | 57 (7.8%) |
| 5:30 AM to 5:59 AM | 5 (0.7%) | 0 (0.0%) |
| 6:00 AM to 6:29 AM | 163 (24.1%) | 83 (11.4%) |
| 6:30 AM to 6:59 AM | 7 (1.0%) | 20 (2.8%) |
| 7:00 AM to 7:29 AM | 7 (1.0%) | 22 (3.0%) |
| 7:30 AM to 7:59 AM | 100 (14.8%) | 156 (21.5%) |
| 8:00 AM to 8:29 AM | 47 (7.0%) | 152 (20.9%) |
| 8:30 AM to 8:59 AM | 0 (0.0%) | 31 (4.3%) |
| 9:00 AM to 9:59 AM | 27 (4.0%) | 20 (2.8%) |
| 10:00 AM to 10:59 AM | 39 (5.8%) | 16 (2.2%) |
| 11:00 AM to 11:59 AM | 9 (1.3%) | 0 (0.0%) |
| 12:00 PM to 3:59 PM | 0 (0.0%) | 96 (13.2%) |
| 4:00 PM to 11:59 PM | 17 (2.5%) | 43 (5.9%) |
| Total | 675 (100.0%) | 727 (100.0%) |
Housing Occupancy in Crown Heights
Occupancy by Ownership in Crown Heights
Of the total 1,052 dwellings in Crown Heights, owner-occupied units account for 883 (83.9%), while renter-occupied units make up 169 (16.1%).
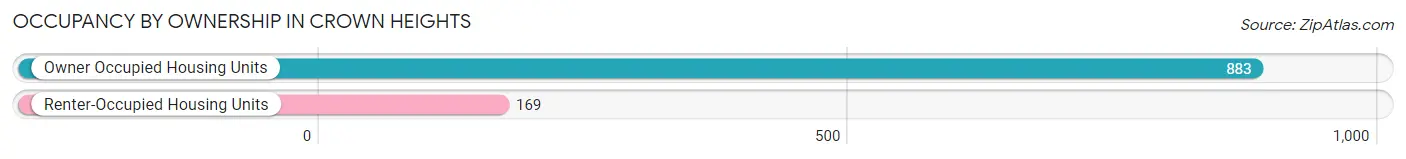
| Occupancy | # Housing Units | % Housing Units |
| Owner Occupied Housing Units | 883 | 83.9% |
| Renter-Occupied Housing Units | 169 | 16.1% |
| Total Occupied Housing Units | 1,052 | 100.0% |
Occupancy by Household Size in Crown Heights
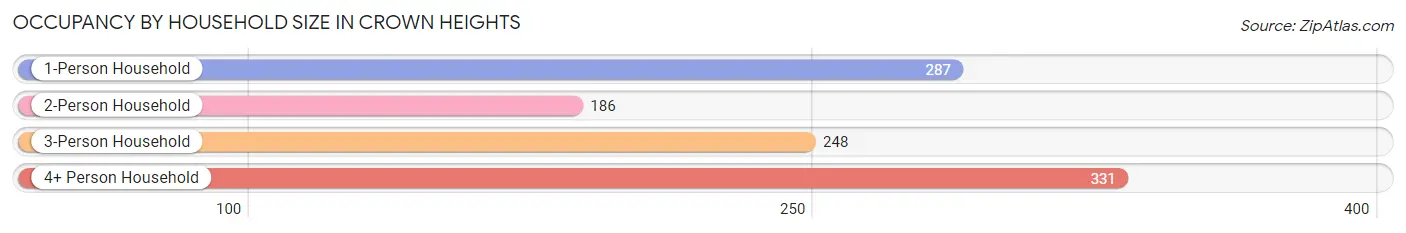
| Household Size | # Housing Units | % Housing Units |
| 1-Person Household | 287 | 27.3% |
| 2-Person Household | 186 | 17.7% |
| 3-Person Household | 248 | 23.6% |
| 4+ Person Household | 331 | 31.5% |
| Total Housing Units | 1,052 | 100.0% |
Occupancy by Ownership by Household Size in Crown Heights
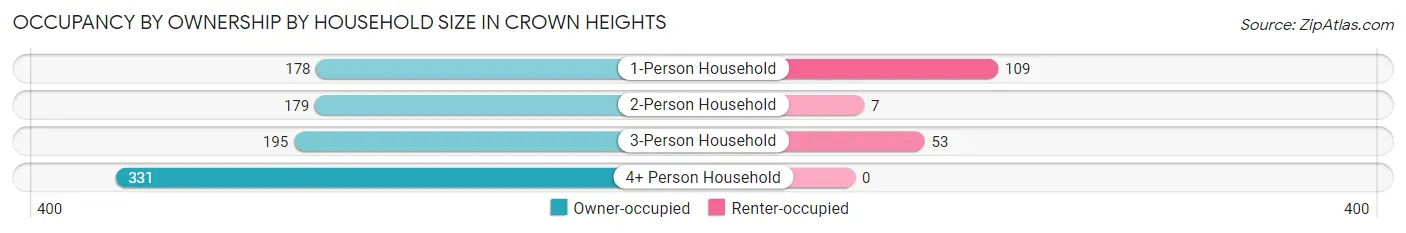
| Household Size | Owner-occupied | Renter-occupied |
| 1-Person Household | 178 (62.0%) | 109 (38.0%) |
| 2-Person Household | 179 (96.2%) | 7 (3.8%) |
| 3-Person Household | 195 (78.6%) | 53 (21.4%) |
| 4+ Person Household | 331 (100.0%) | 0 (0.0%) |
| Total Housing Units | 883 (83.9%) | 169 (16.1%) |
Occupancy by Educational Attainment in Crown Heights
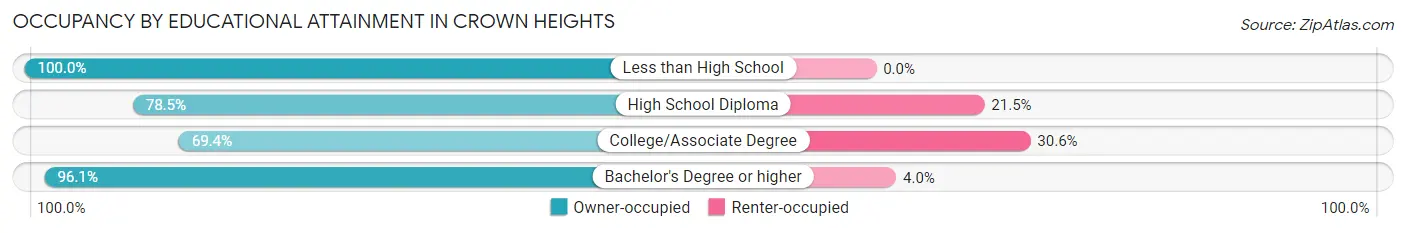
| Household Size | Owner-occupied | Renter-occupied |
| Less than High School | 11 (100.0%) | 0 (0.0%) |
| High School Diploma | 183 (78.5%) | 50 (21.5%) |
| College/Associate Degree | 227 (69.4%) | 100 (30.6%) |
| Bachelor's Degree or higher | 462 (96.1%) | 19 (4.0%) |
Occupancy by Age of Householder in Crown Heights
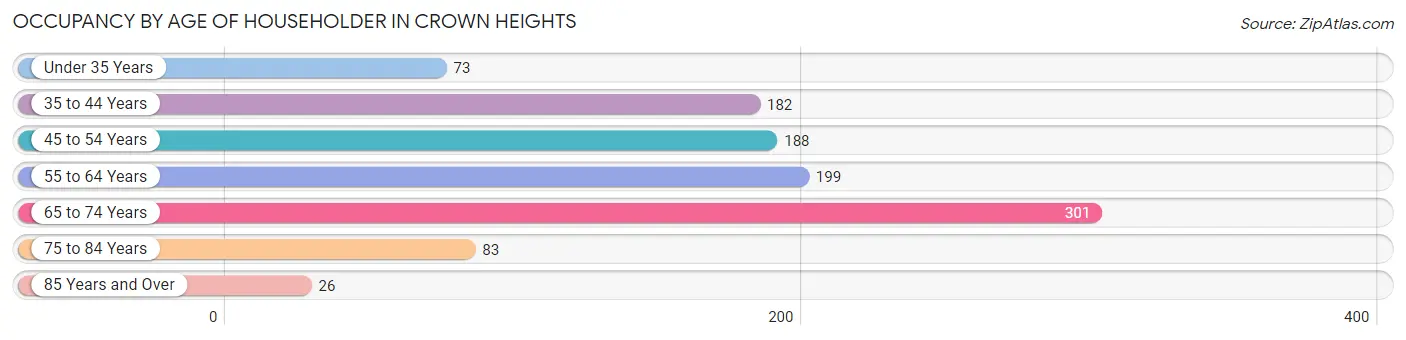
| Age Bracket | # Households | % Households |
| Under 35 Years | 73 | 6.9% |
| 35 to 44 Years | 182 | 17.3% |
| 45 to 54 Years | 188 | 17.9% |
| 55 to 64 Years | 199 | 18.9% |
| 65 to 74 Years | 301 | 28.6% |
| 75 to 84 Years | 83 | 7.9% |
| 85 Years and Over | 26 | 2.5% |
| Total | 1,052 | 100.0% |
Housing Finances in Crown Heights
Median Income by Occupancy in Crown Heights
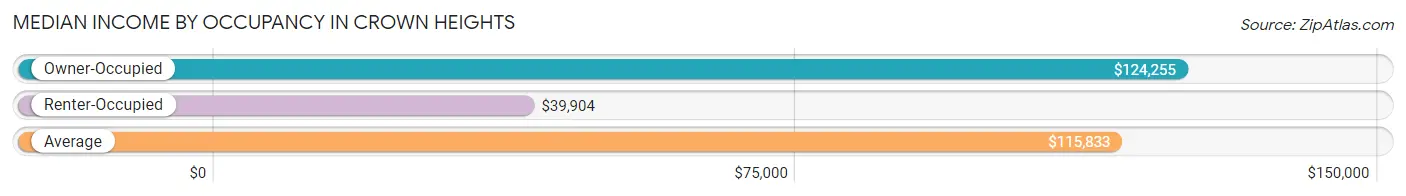
| Occupancy Type | # Households | Median Income |
| Owner-Occupied | 883 (83.9%) | $124,255 |
| Renter-Occupied | 169 (16.1%) | $39,904 |
| Average | 1,052 (100.0%) | $115,833 |
Occupancy by Householder Income Bracket in Crown Heights
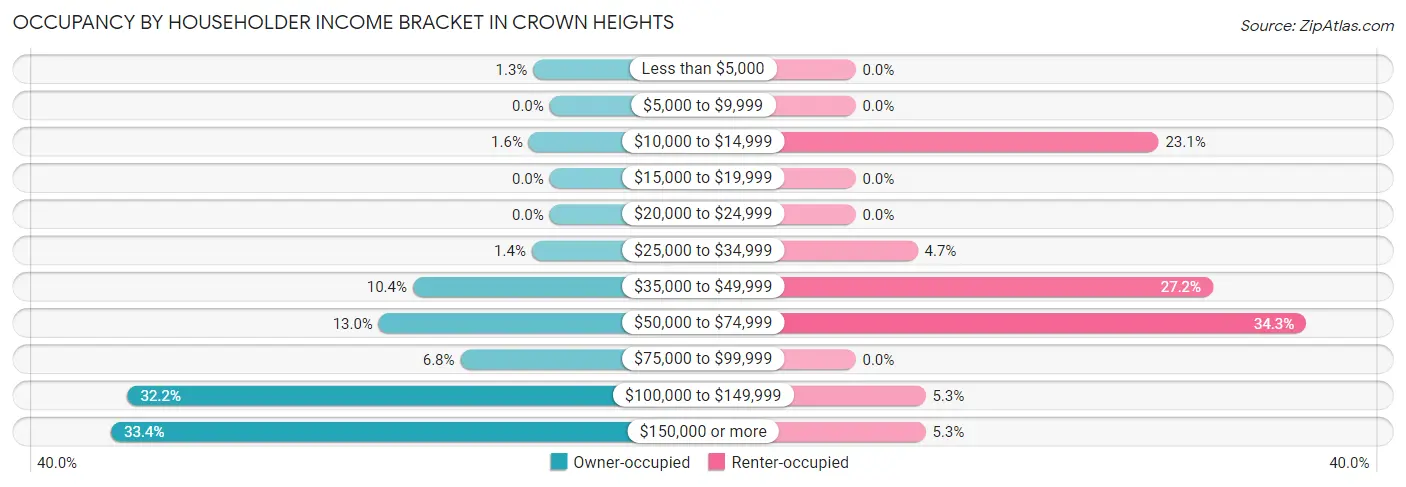
| Income Bracket | Owner-occupied | Renter-occupied |
| Less than $5,000 | 11 (1.3%) | 0 (0.0%) |
| $5,000 to $9,999 | 0 (0.0%) | 0 (0.0%) |
| $10,000 to $14,999 | 14 (1.6%) | 39 (23.1%) |
| $15,000 to $19,999 | 0 (0.0%) | 0 (0.0%) |
| $20,000 to $24,999 | 0 (0.0%) | 0 (0.0%) |
| $25,000 to $34,999 | 12 (1.4%) | 8 (4.7%) |
| $35,000 to $49,999 | 92 (10.4%) | 46 (27.2%) |
| $50,000 to $74,999 | 115 (13.0%) | 58 (34.3%) |
| $75,000 to $99,999 | 60 (6.8%) | 0 (0.0%) |
| $100,000 to $149,999 | 284 (32.2%) | 9 (5.3%) |
| $150,000 or more | 295 (33.4%) | 9 (5.3%) |
| Total | 883 (100.0%) | 169 (100.0%) |
Monthly Housing Cost Tiers in Crown Heights
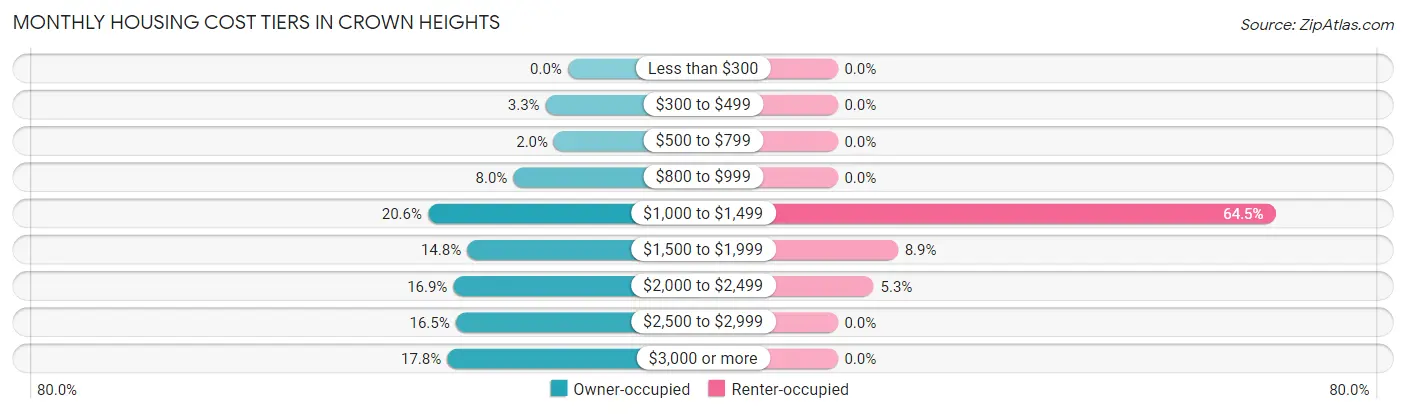
| Monthly Cost | Owner-occupied | Renter-occupied |
| Less than $300 | 0 (0.0%) | 0 (0.0%) |
| $300 to $499 | 29 (3.3%) | 0 (0.0%) |
| $500 to $799 | 18 (2.0%) | 0 (0.0%) |
| $800 to $999 | 71 (8.0%) | 0 (0.0%) |
| $1,000 to $1,499 | 182 (20.6%) | 109 (64.5%) |
| $1,500 to $1,999 | 131 (14.8%) | 15 (8.9%) |
| $2,000 to $2,499 | 149 (16.9%) | 9 (5.3%) |
| $2,500 to $2,999 | 146 (16.5%) | 0 (0.0%) |
| $3,000 or more | 157 (17.8%) | 0 (0.0%) |
| Total | 883 (100.0%) | 169 (100.0%) |
Physical Housing Characteristics in Crown Heights
Housing Structures in Crown Heights
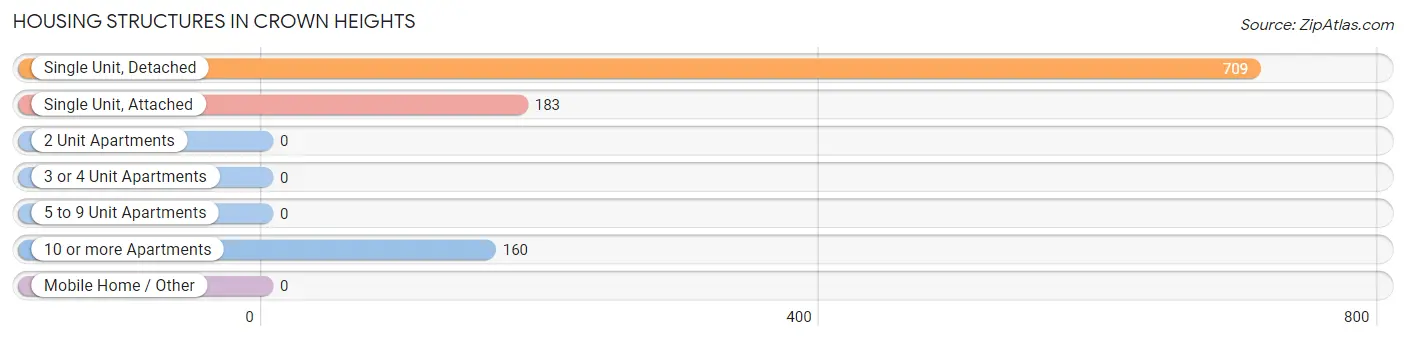
| Structure Type | # Housing Units | % Housing Units |
| Single Unit, Detached | 709 | 67.4% |
| Single Unit, Attached | 183 | 17.4% |
| 2 Unit Apartments | 0 | 0.0% |
| 3 or 4 Unit Apartments | 0 | 0.0% |
| 5 to 9 Unit Apartments | 0 | 0.0% |
| 10 or more Apartments | 160 | 15.2% |
| Mobile Home / Other | 0 | 0.0% |
| Total | 1,052 | 100.0% |
Housing Structures by Occupancy in Crown Heights
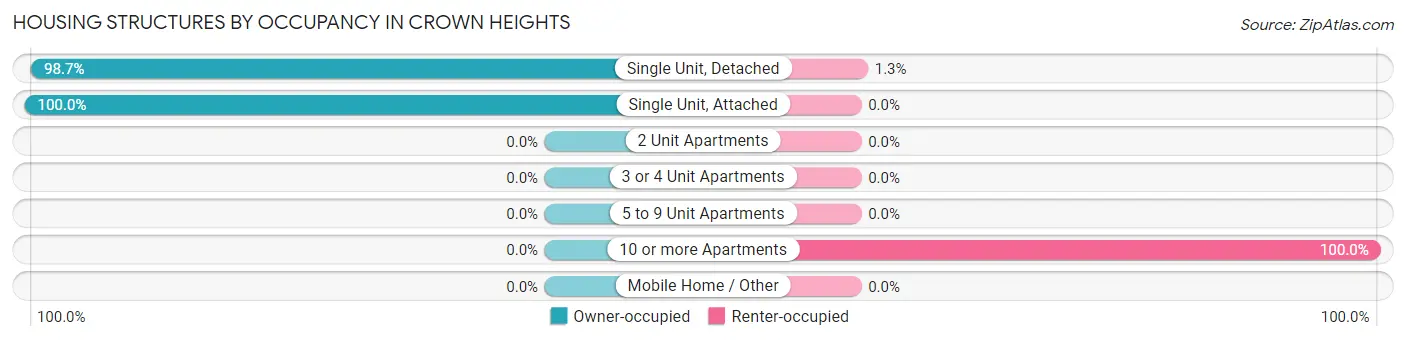
| Structure Type | Owner-occupied | Renter-occupied |
| Single Unit, Detached | 700 (98.7%) | 9 (1.3%) |
| Single Unit, Attached | 183 (100.0%) | 0 (0.0%) |
| 2 Unit Apartments | 0 (0.0%) | 0 (0.0%) |
| 3 or 4 Unit Apartments | 0 (0.0%) | 0 (0.0%) |
| 5 to 9 Unit Apartments | 0 (0.0%) | 0 (0.0%) |
| 10 or more Apartments | 0 (0.0%) | 160 (100.0%) |
| Mobile Home / Other | 0 (0.0%) | 0 (0.0%) |
| Total | 883 (83.9%) | 169 (16.1%) |
Housing Structures by Number of Rooms in Crown Heights
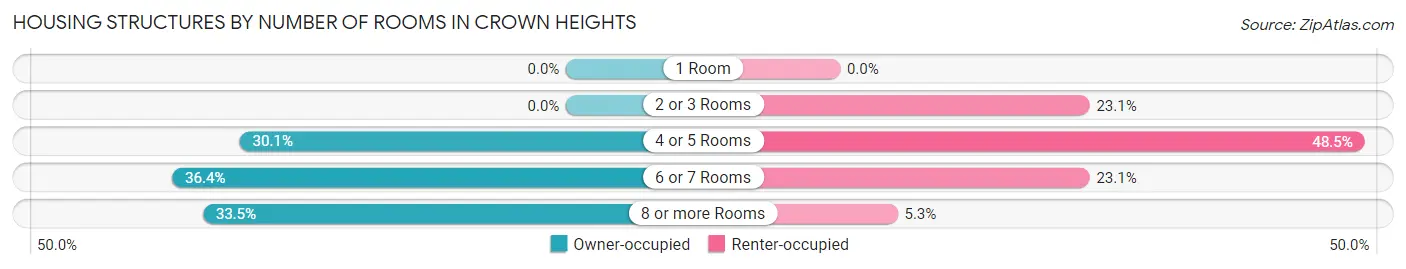
| Number of Rooms | Owner-occupied | Renter-occupied |
| 1 Room | 0 (0.0%) | 0 (0.0%) |
| 2 or 3 Rooms | 0 (0.0%) | 39 (23.1%) |
| 4 or 5 Rooms | 266 (30.1%) | 82 (48.5%) |
| 6 or 7 Rooms | 321 (36.3%) | 39 (23.1%) |
| 8 or more Rooms | 296 (33.5%) | 9 (5.3%) |
| Total | 883 (100.0%) | 169 (100.0%) |
Housing Structure by Heating Type in Crown Heights
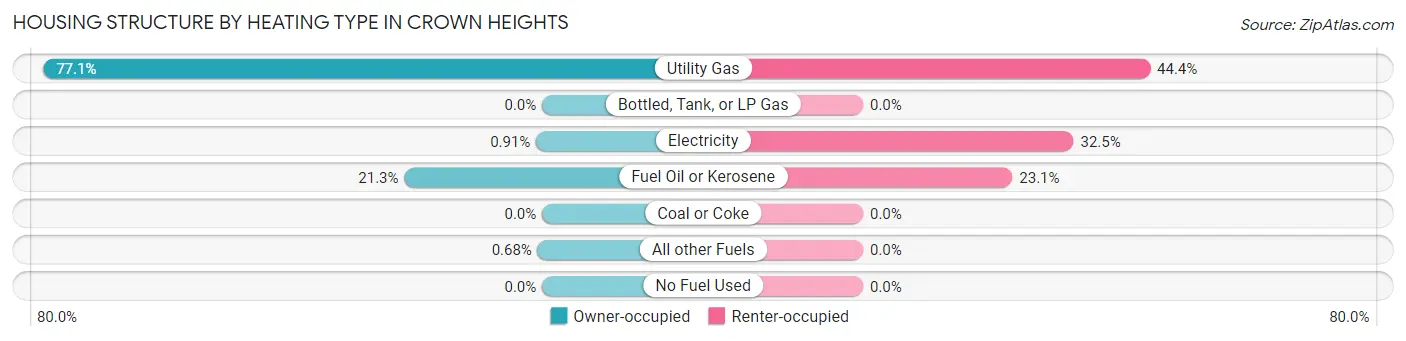
| Heating Type | Owner-occupied | Renter-occupied |
| Utility Gas | 681 (77.1%) | 75 (44.4%) |
| Bottled, Tank, or LP Gas | 0 (0.0%) | 0 (0.0%) |
| Electricity | 8 (0.9%) | 55 (32.5%) |
| Fuel Oil or Kerosene | 188 (21.3%) | 39 (23.1%) |
| Coal or Coke | 0 (0.0%) | 0 (0.0%) |
| All other Fuels | 6 (0.7%) | 0 (0.0%) |
| No Fuel Used | 0 (0.0%) | 0 (0.0%) |
| Total | 883 (100.0%) | 169 (100.0%) |
Household Vehicle Usage in Crown Heights
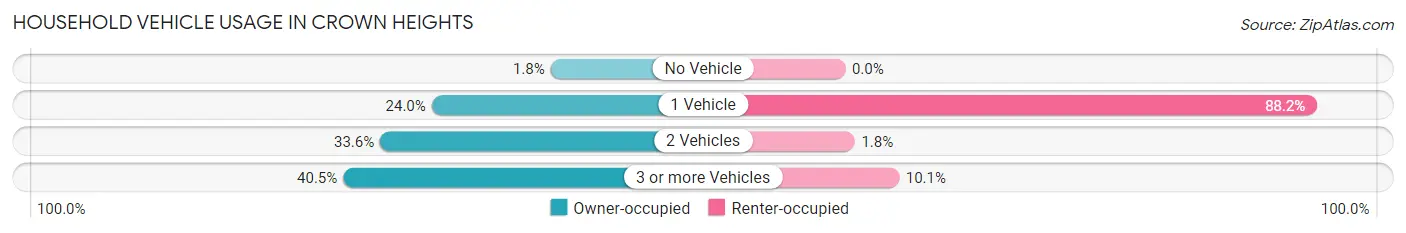
| Vehicles per Household | Owner-occupied | Renter-occupied |
| No Vehicle | 16 (1.8%) | 0 (0.0%) |
| 1 Vehicle | 212 (24.0%) | 149 (88.2%) |
| 2 Vehicles | 297 (33.6%) | 3 (1.8%) |
| 3 or more Vehicles | 358 (40.5%) | 17 (10.1%) |
| Total | 883 (100.0%) | 169 (100.0%) |
Real Estate & Mortgages in Crown Heights
Real Estate and Mortgage Overview in Crown Heights
| Characteristic | Without Mortgage | With Mortgage |
| Housing Units | 332 | 551 |
| Median Property Value | $265,200 | $308,300 |
| Median Household Income | $123,106 | $236 |
| Monthly Housing Costs | $1,223 | $157 |
| Real Estate Taxes | $6,997 | $7 |
Property Value by Mortgage Status in Crown Heights
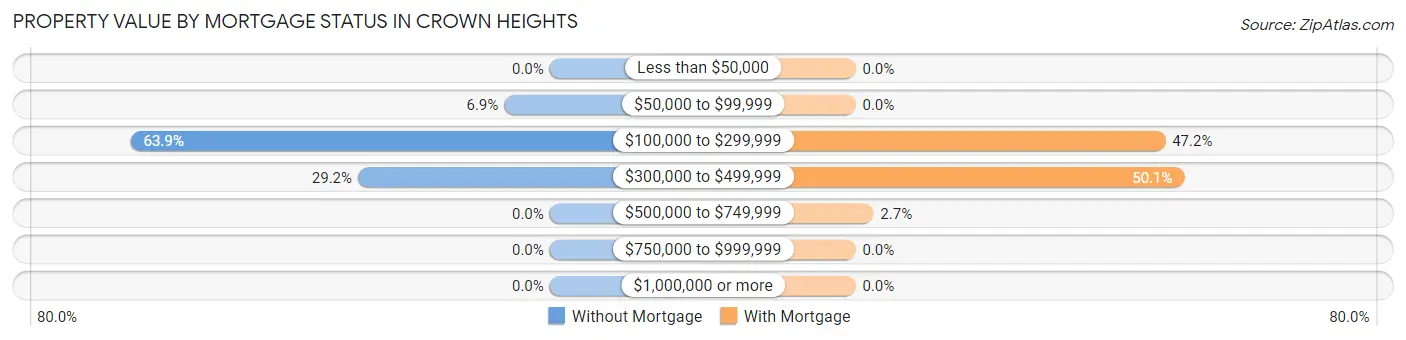
| Property Value | Without Mortgage | With Mortgage |
| Less than $50,000 | 0 (0.0%) | 0 (0.0%) |
| $50,000 to $99,999 | 23 (6.9%) | 0 (0.0%) |
| $100,000 to $299,999 | 212 (63.9%) | 260 (47.2%) |
| $300,000 to $499,999 | 97 (29.2%) | 276 (50.1%) |
| $500,000 to $749,999 | 0 (0.0%) | 15 (2.7%) |
| $750,000 to $999,999 | 0 (0.0%) | 0 (0.0%) |
| $1,000,000 or more | 0 (0.0%) | 0 (0.0%) |
| Total | 332 (100.0%) | 551 (100.0%) |
Household Income by Mortgage Status in Crown Heights

| Household Income | Without Mortgage | With Mortgage |
| Less than $10,000 | 11 (3.3%) | 6 (1.1%) |
| $10,000 to $24,999 | 14 (4.2%) | 0 (0.0%) |
| $25,000 to $34,999 | 4 (1.2%) | 0 (0.0%) |
| $35,000 to $49,999 | 4 (1.2%) | 8 (1.5%) |
| $50,000 to $74,999 | 69 (20.8%) | 88 (16.0%) |
| $75,000 to $99,999 | 31 (9.3%) | 46 (8.4%) |
| $100,000 to $149,999 | 140 (42.2%) | 29 (5.3%) |
| $150,000 or more | 59 (17.8%) | 144 (26.1%) |
| Total | 332 (100.0%) | 551 (100.0%) |
Property Value to Household Income Ratio in Crown Heights
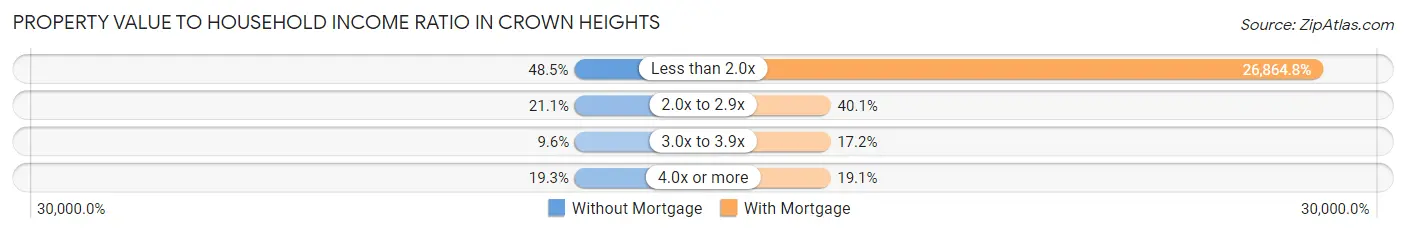
| Value-to-Income Ratio | Without Mortgage | With Mortgage |
| Less than 2.0x | 161 (48.5%) | 148,025 (26,864.8%) |
| 2.0x to 2.9x | 70 (21.1%) | 221 (40.1%) |
| 3.0x to 3.9x | 32 (9.6%) | 95 (17.2%) |
| 4.0x or more | 64 (19.3%) | 105 (19.1%) |
| Total | 332 (100.0%) | 551 (100.0%) |
Real Estate Taxes by Mortgage Status in Crown Heights
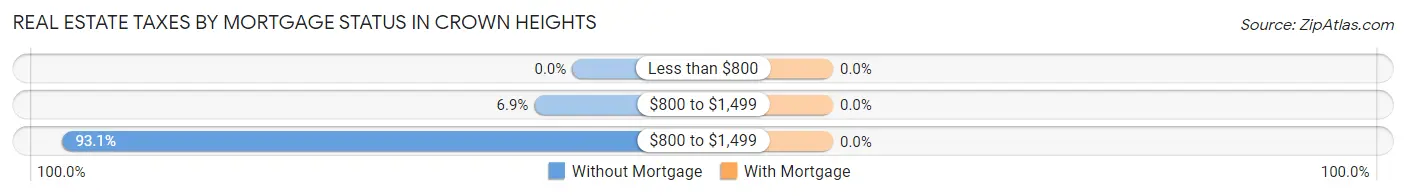
| Property Taxes | Without Mortgage | With Mortgage |
| Less than $800 | 0 (0.0%) | 0 (0.0%) |
| $800 to $1,499 | 23 (6.9%) | 0 (0.0%) |
| $800 to $1,499 | 309 (93.1%) | 0 (0.0%) |
| Total | 332 (100.0%) | 551 (100.0%) |
Health & Disability in Crown Heights
Health Insurance Coverage by Age in Crown Heights
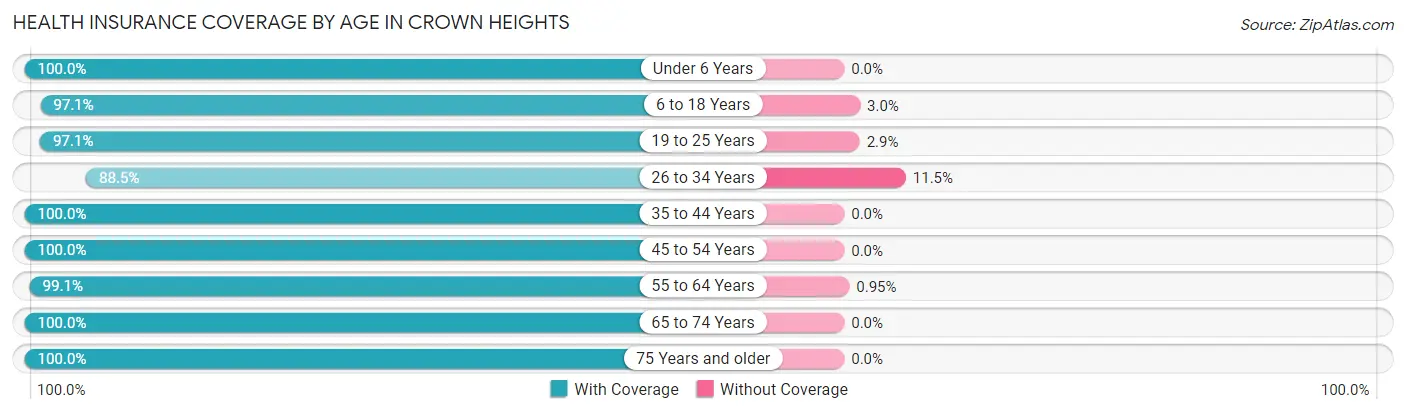
| Age Bracket | With Coverage | Without Coverage |
| Under 6 Years | 218 (100.0%) | 0 (0.0%) |
| 6 to 18 Years | 527 (97.1%) | 16 (2.9%) |
| 19 to 25 Years | 202 (97.1%) | 6 (2.9%) |
| 26 to 34 Years | 185 (88.5%) | 24 (11.5%) |
| 35 to 44 Years | 360 (100.0%) | 0 (0.0%) |
| 45 to 54 Years | 395 (100.0%) | 0 (0.0%) |
| 55 to 64 Years | 522 (99.1%) | 5 (0.9%) |
| 65 to 74 Years | 370 (100.0%) | 0 (0.0%) |
| 75 Years and older | 200 (100.0%) | 0 (0.0%) |
| Total | 2,979 (98.3%) | 51 (1.7%) |
Health Insurance Coverage by Citizenship Status in Crown Heights
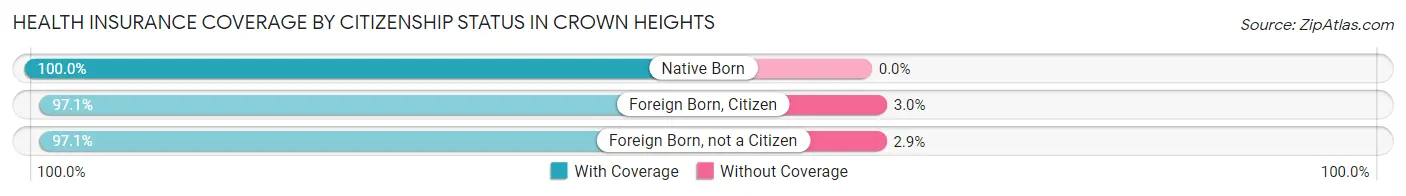
| Citizenship Status | With Coverage | Without Coverage |
| Native Born | 218 (100.0%) | 0 (0.0%) |
| Foreign Born, Citizen | 527 (97.1%) | 16 (2.9%) |
| Foreign Born, not a Citizen | 202 (97.1%) | 6 (2.9%) |
Health Insurance Coverage by Household Income in Crown Heights
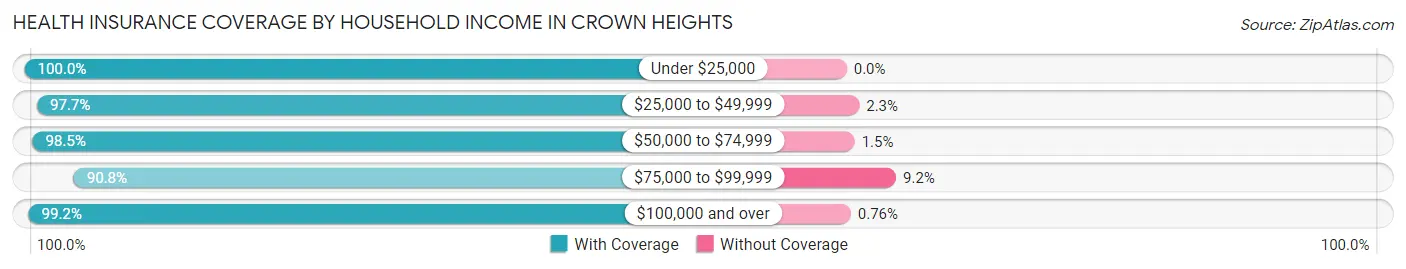
| Household Income | With Coverage | Without Coverage |
| Under $25,000 | 81 (100.0%) | 0 (0.0%) |
| $25,000 to $49,999 | 250 (97.7%) | 6 (2.3%) |
| $50,000 to $74,999 | 332 (98.5%) | 5 (1.5%) |
| $75,000 to $99,999 | 236 (90.8%) | 24 (9.2%) |
| $100,000 and over | 2,080 (99.2%) | 16 (0.8%) |
Public vs Private Health Insurance Coverage by Age in Crown Heights
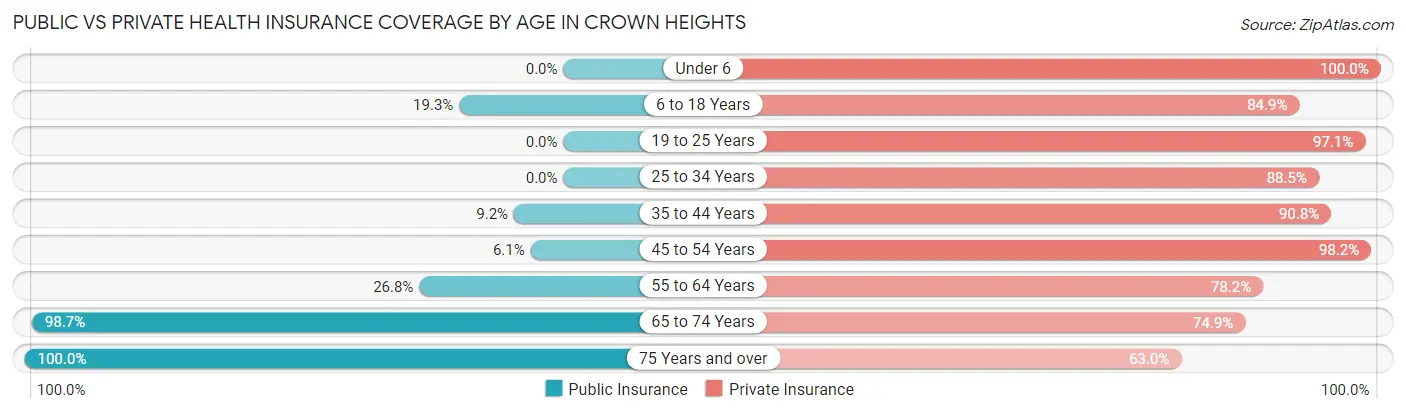
| Age Bracket | Public Insurance | Private Insurance |
| Under 6 | 0 (0.0%) | 218 (100.0%) |
| 6 to 18 Years | 105 (19.3%) | 461 (84.9%) |
| 19 to 25 Years | 0 (0.0%) | 202 (97.1%) |
| 25 to 34 Years | 0 (0.0%) | 185 (88.5%) |
| 35 to 44 Years | 33 (9.2%) | 327 (90.8%) |
| 45 to 54 Years | 24 (6.1%) | 388 (98.2%) |
| 55 to 64 Years | 141 (26.8%) | 412 (78.2%) |
| 65 to 74 Years | 365 (98.7%) | 277 (74.9%) |
| 75 Years and over | 200 (100.0%) | 126 (63.0%) |
| Total | 868 (28.6%) | 2,596 (85.7%) |
Disability Status by Sex by Age in Crown Heights
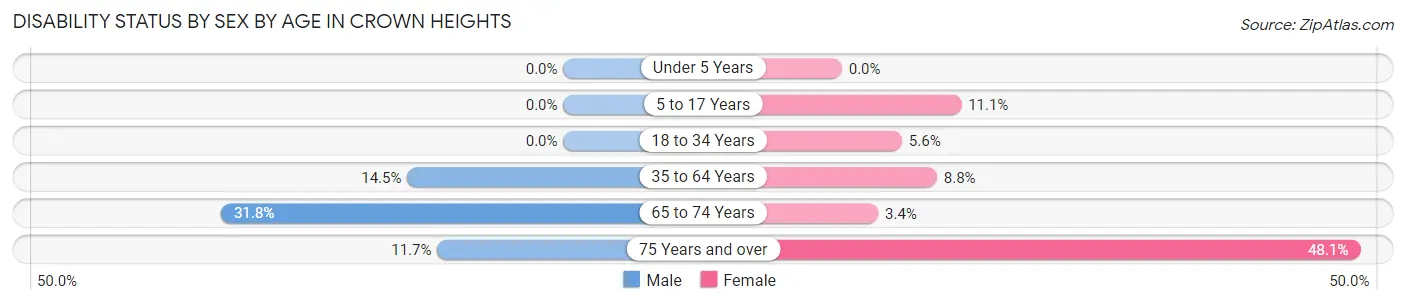
| Age Bracket | Male | Female |
| Under 5 Years | 0 (0.0%) | 0 (0.0%) |
| 5 to 17 Years | 0 (0.0%) | 39 (11.1%) |
| 18 to 34 Years | 0 (0.0%) | 14 (5.6%) |
| 35 to 64 Years | 97 (14.5%) | 54 (8.8%) |
| 65 to 74 Years | 61 (31.8%) | 6 (3.4%) |
| 75 Years and over | 11 (11.7%) | 51 (48.1%) |
Disability Class by Sex by Age in Crown Heights
Disability Class: Hearing Difficulty
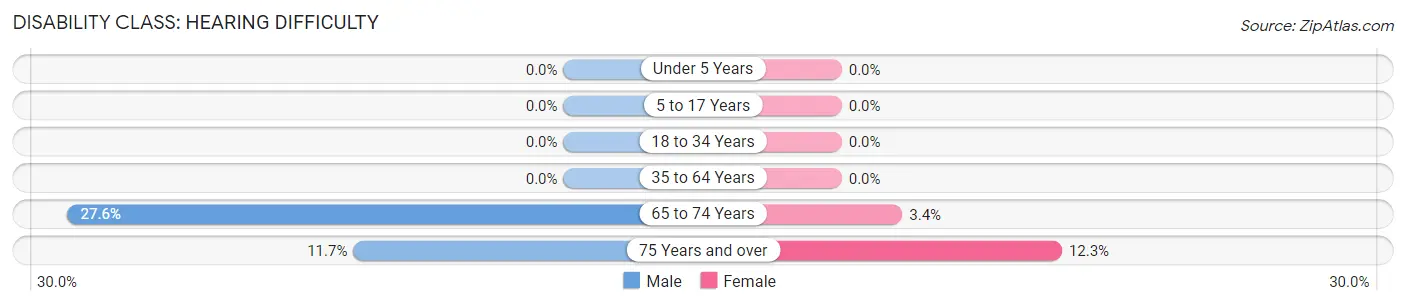
| Age Bracket | Male | Female |
| Under 5 Years | 0 (0.0%) | 0 (0.0%) |
| 5 to 17 Years | 0 (0.0%) | 0 (0.0%) |
| 18 to 34 Years | 0 (0.0%) | 0 (0.0%) |
| 35 to 64 Years | 0 (0.0%) | 0 (0.0%) |
| 65 to 74 Years | 53 (27.6%) | 6 (3.4%) |
| 75 Years and over | 11 (11.7%) | 13 (12.3%) |
Disability Class: Vision Difficulty
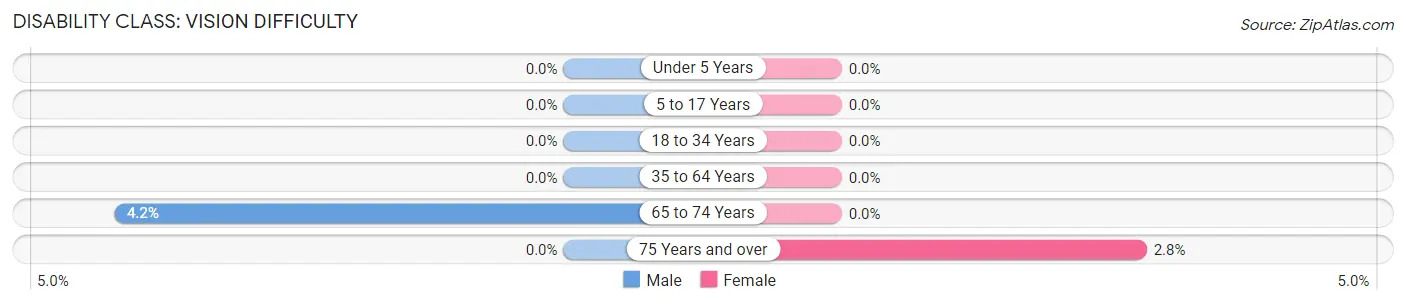
| Age Bracket | Male | Female |
| Under 5 Years | 0 (0.0%) | 0 (0.0%) |
| 5 to 17 Years | 0 (0.0%) | 0 (0.0%) |
| 18 to 34 Years | 0 (0.0%) | 0 (0.0%) |
| 35 to 64 Years | 0 (0.0%) | 0 (0.0%) |
| 65 to 74 Years | 8 (4.2%) | 0 (0.0%) |
| 75 Years and over | 0 (0.0%) | 3 (2.8%) |
Disability Class: Cognitive Difficulty
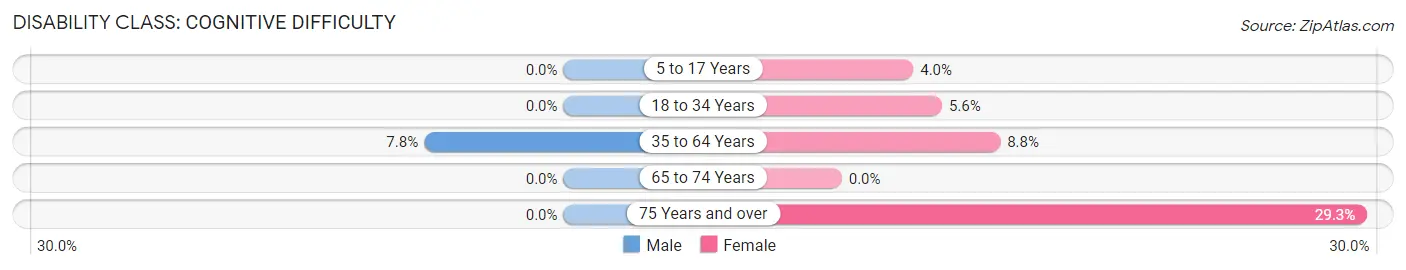
| Age Bracket | Male | Female |
| 5 to 17 Years | 0 (0.0%) | 14 (4.0%) |
| 18 to 34 Years | 0 (0.0%) | 14 (5.6%) |
| 35 to 64 Years | 52 (7.8%) | 54 (8.8%) |
| 65 to 74 Years | 0 (0.0%) | 0 (0.0%) |
| 75 Years and over | 0 (0.0%) | 31 (29.2%) |
Disability Class: Ambulatory Difficulty
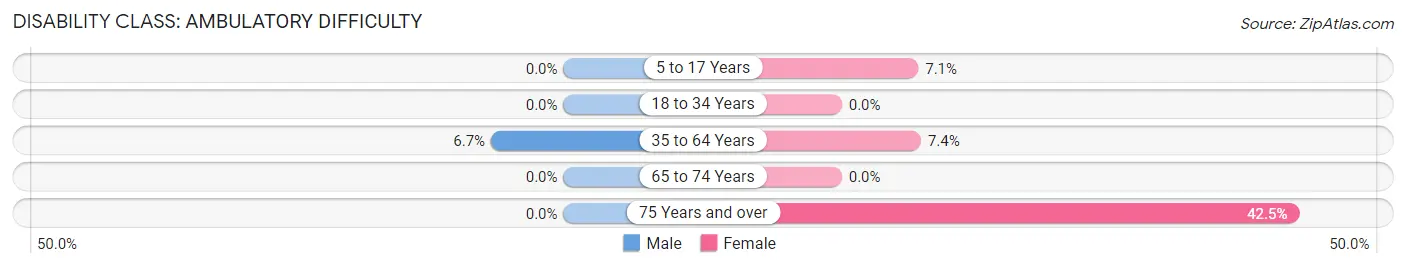
| Age Bracket | Male | Female |
| 5 to 17 Years | 0 (0.0%) | 25 (7.1%) |
| 18 to 34 Years | 0 (0.0%) | 0 (0.0%) |
| 35 to 64 Years | 45 (6.7%) | 45 (7.3%) |
| 65 to 74 Years | 0 (0.0%) | 0 (0.0%) |
| 75 Years and over | 0 (0.0%) | 45 (42.4%) |
Disability Class: Self-Care Difficulty
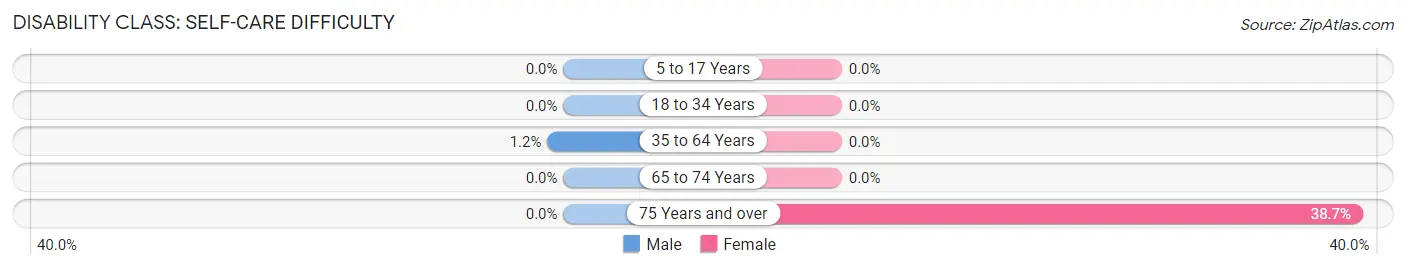
| Age Bracket | Male | Female |
| 5 to 17 Years | 0 (0.0%) | 0 (0.0%) |
| 18 to 34 Years | 0 (0.0%) | 0 (0.0%) |
| 35 to 64 Years | 8 (1.2%) | 0 (0.0%) |
| 65 to 74 Years | 0 (0.0%) | 0 (0.0%) |
| 75 Years and over | 0 (0.0%) | 41 (38.7%) |
Technology Access in Crown Heights
Computing Device Access in Crown Heights
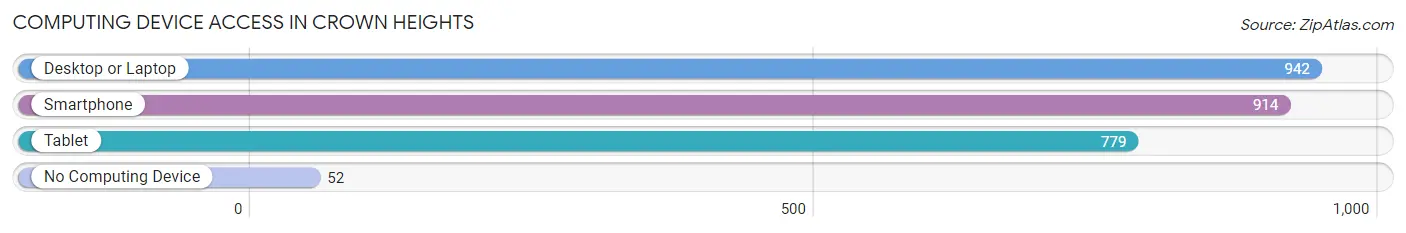
| Device Type | # Households | % Households |
| Desktop or Laptop | 942 | 89.5% |
| Smartphone | 914 | 86.9% |
| Tablet | 779 | 74.1% |
| No Computing Device | 52 | 4.9% |
| Total | 1,052 | 100.0% |
Internet Access in Crown Heights
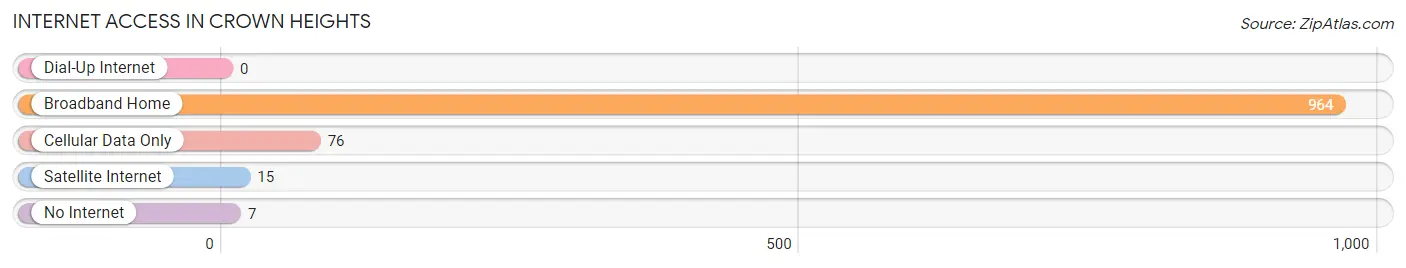
| Internet Type | # Households | % Households |
| Dial-Up Internet | 0 | 0.0% |
| Broadband Home | 964 | 91.6% |
| Cellular Data Only | 76 | 7.2% |
| Satellite Internet | 15 | 1.4% |
| No Internet | 7 | 0.7% |
| Total | 1,052 | 100.0% |
Crown Heights Summary
Crown Heights is a neighborhood located in the central portion of the New York City borough of Brooklyn. It is bounded by Prospect Heights to the north, Prospect Lefferts Gardens to the south, East Flatbush to the east, and Bedford-Stuyvesant to the west. The neighborhood is part of Brooklyn Community Board 8 and is served by the 77th Precinct of the New York City Police Department.
History
Crown Heights was originally part of the Town of Flatbush, which was established in 1651. The area was developed in the late 19th century as a streetcar suburb of Brooklyn. The neighborhood was originally populated by Dutch, Irish, and German immigrants. In the early 20th century, the area became home to a large number of Jewish immigrants from Eastern Europe.
In the 1950s and 1960s, the neighborhood experienced a period of white flight, as many of the white residents moved out of the area. This was followed by an influx of African-American and Caribbean immigrants, who moved into the area in the 1970s and 1980s.
In 1991, the neighborhood was the site of the Crown Heights riots, which were sparked by the death of a seven-year-old African-American boy, Gavin Cato, who was killed by a car driven by a Hasidic Jew. The riots lasted for three days and resulted in the death of another African-American man, Yankel Rosenbaum.
Geography
Crown Heights is located in the central portion of the borough of Brooklyn. It is bounded by Prospect Heights to the north, Prospect Lefferts Gardens to the south, East Flatbush to the east, and Bedford-Stuyvesant to the west. The neighborhood is part of Brooklyn Community Board 8 and is served by the 77th Precinct of the New York City Police Department.
The area is served by the New York City Subway's 2, 3, 4, 5, and S trains. The neighborhood is also served by the Long Island Rail Road's Atlantic Terminal station.
Economy
Crown Heights is home to a variety of businesses, including restaurants, bars, retail stores, and professional services. The neighborhood is also home to a number of small businesses, including auto repair shops, beauty salons, and barbershops.
The neighborhood is also home to a number of cultural institutions, including the Brooklyn Children's Museum, the Brooklyn Museum, and the Brooklyn Public Library.
Demographics
As of the 2010 United States Census, there were 95,074 people living in Crown Heights. The racial makeup of the neighborhood was 44.3% African American, 28.3% White, 16.2% Hispanic or Latino, 8.2% Asian, and 2.0% other races.
The median household income in the neighborhood was $37,945, and the median rent was $1,092. The median age of the population was 33.7 years.
Conclusion
Crown Heights is a diverse and vibrant neighborhood located in the central portion of the borough of Brooklyn. The area has a rich history, and has been home to a variety of ethnic and racial groups over the years. The neighborhood is home to a variety of businesses, cultural institutions, and other amenities. The population of the neighborhood is diverse, with a median age of 33.7 years and a median household income of $37,945.
Common Questions
What is Per Capita Income in Crown Heights?
Per Capita income in Crown Heights is $44,250.
What is the Median Family Income in Crown Heights?
Median Family Income in Crown Heights is $147,775.
What is the Median Household income in Crown Heights?
Median Household Income in Crown Heights is $115,833.
What is Income or Wage Gap in Crown Heights?
Income or Wage Gap in Crown Heights is 57.3%.
Women in Crown Heights earn 42.7 cents for every dollar earned by a man.
What is Inequality or Gini Index in Crown Heights?
Inequality or Gini Index in Crown Heights is 0.36.
What is the Total Population of Crown Heights?
Total Population of Crown Heights is 3,030.
What is the Total Male Population of Crown Heights?
Total Male Population of Crown Heights is 1,531.
What is the Total Female Population of Crown Heights?
Total Female Population of Crown Heights is 1,499.
What is the Ratio of Males per 100 Females in Crown Heights?
There are 102.13 Males per 100 Females in Crown Heights.
What is the Ratio of Females per 100 Males in Crown Heights?
There are 97.91 Females per 100 Males in Crown Heights.
What is the Median Population Age in Crown Heights?
Median Population Age in Crown Heights is 44.7 Years.
What is the Average Family Size in Crown Heights
Average Family Size in Crown Heights is 3.6 People.
What is the Average Household Size in Crown Heights
Average Household Size in Crown Heights is 2.9 People.
How Large is the Labor Force in Crown Heights?
There are 1,675 People in the Labor Forcein in Crown Heights.
What is the Percentage of People in the Labor Force in Crown Heights?
67.9% of People are in the Labor Force in Crown Heights.
What is the Unemployment Rate in Crown Heights?
Unemployment Rate in Crown Heights is 9.9%.