Manhasset Hills, NY Map & Demographics
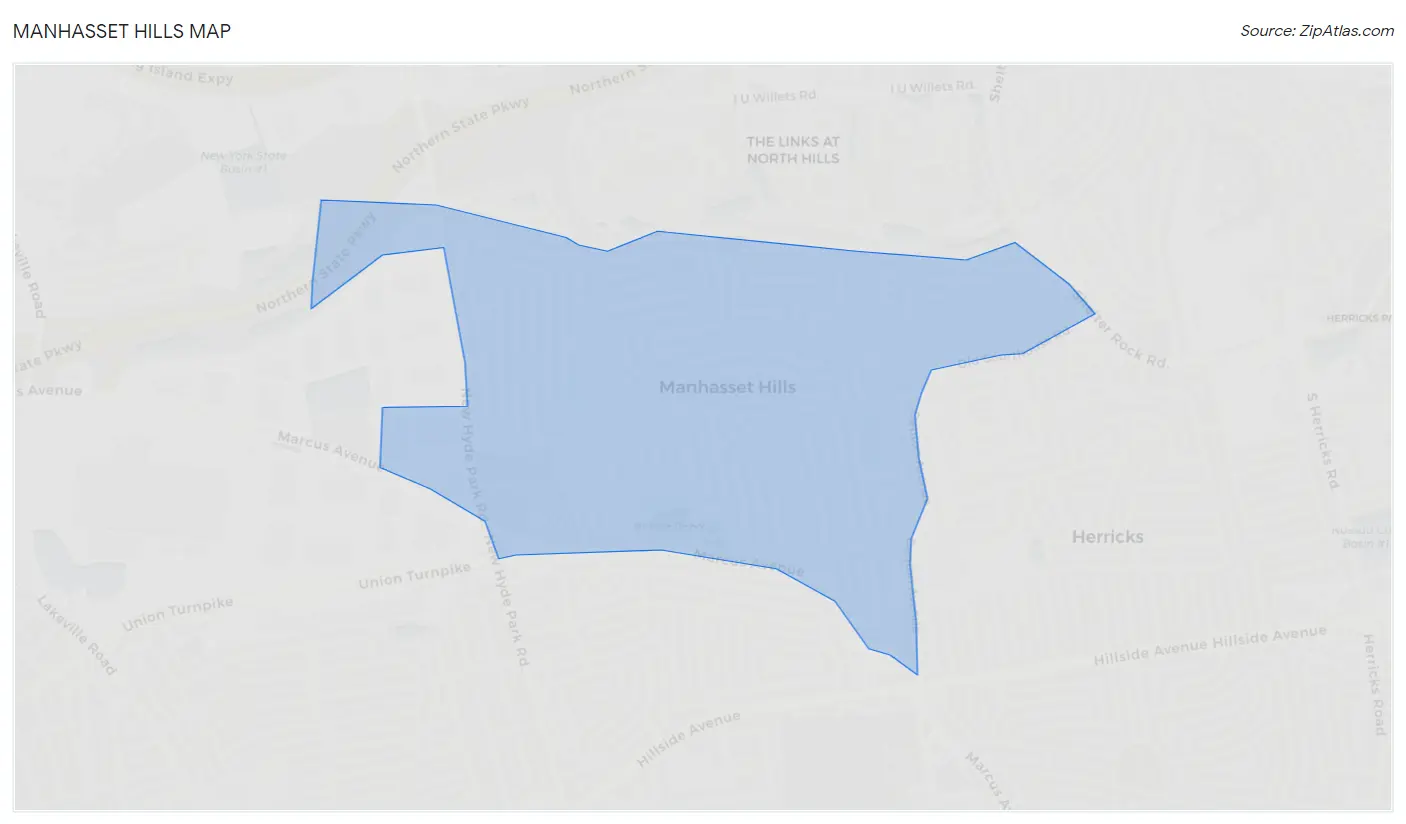
Manhasset Hills Map
Manhasset Hills Overview
$59,061
PER CAPITA INCOME
$189,479
AVG FAMILY INCOME
$181,667
AVG HOUSEHOLD INCOME
1.7%
WAGE / INCOME GAP [ % ]
98.3¢/ $1
WAGE / INCOME GAP [ $ ]
0.38
INEQUALITY / GINI INDEX
3,904
TOTAL POPULATION
2,061
MALE POPULATION
1,843
FEMALE POPULATION
111.83
MALES / 100 FEMALES
89.42
FEMALES / 100 MALES
43.0
MEDIAN AGE
3.5
AVG FAMILY SIZE
3.3
AVG HOUSEHOLD SIZE
1,848
LABOR FORCE [ PEOPLE ]
56.9%
PERCENT IN LABOR FORCE
2.5%
UNEMPLOYMENT RATE
Manhasset Hills Area Codes
Income in Manhasset Hills
Income Overview in Manhasset Hills
Per Capita Income in Manhasset Hills is $59,061, while median incomes of families and households are $189,479 and $181,667 respectively.
| Characteristic | Number | Measure |
| Per Capita Income | 3,904 | $59,061 |
| Median Family Income | 1,089 | $189,479 |
| Mean Family Income | 1,089 | $201,690 |
| Median Household Income | 1,176 | $181,667 |
| Mean Household Income | 1,176 | $196,213 |
| Income Deficit | 1,089 | $0 |
| Wage / Income Gap (%) | 3,904 | 1.73% |
| Wage / Income Gap ($) | 3,904 | 98.27¢ per $1 |
| Gini / Inequality Index | 3,904 | 0.38 |
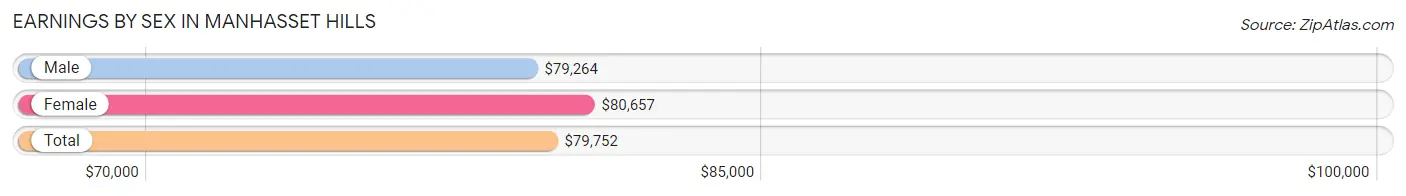
Earnings by Sex in Manhasset Hills
Average Earnings in Manhasset Hills are $79,752, $79,264 for men and $80,657 for women, a difference of 1.7%.
| Sex | Number | Average Earnings |
| Male | 917 (49.4%) | $79,264 |
| Female | 939 (50.6%) | $80,657 |
| Total | 1,856 (100.0%) | $79,752 |
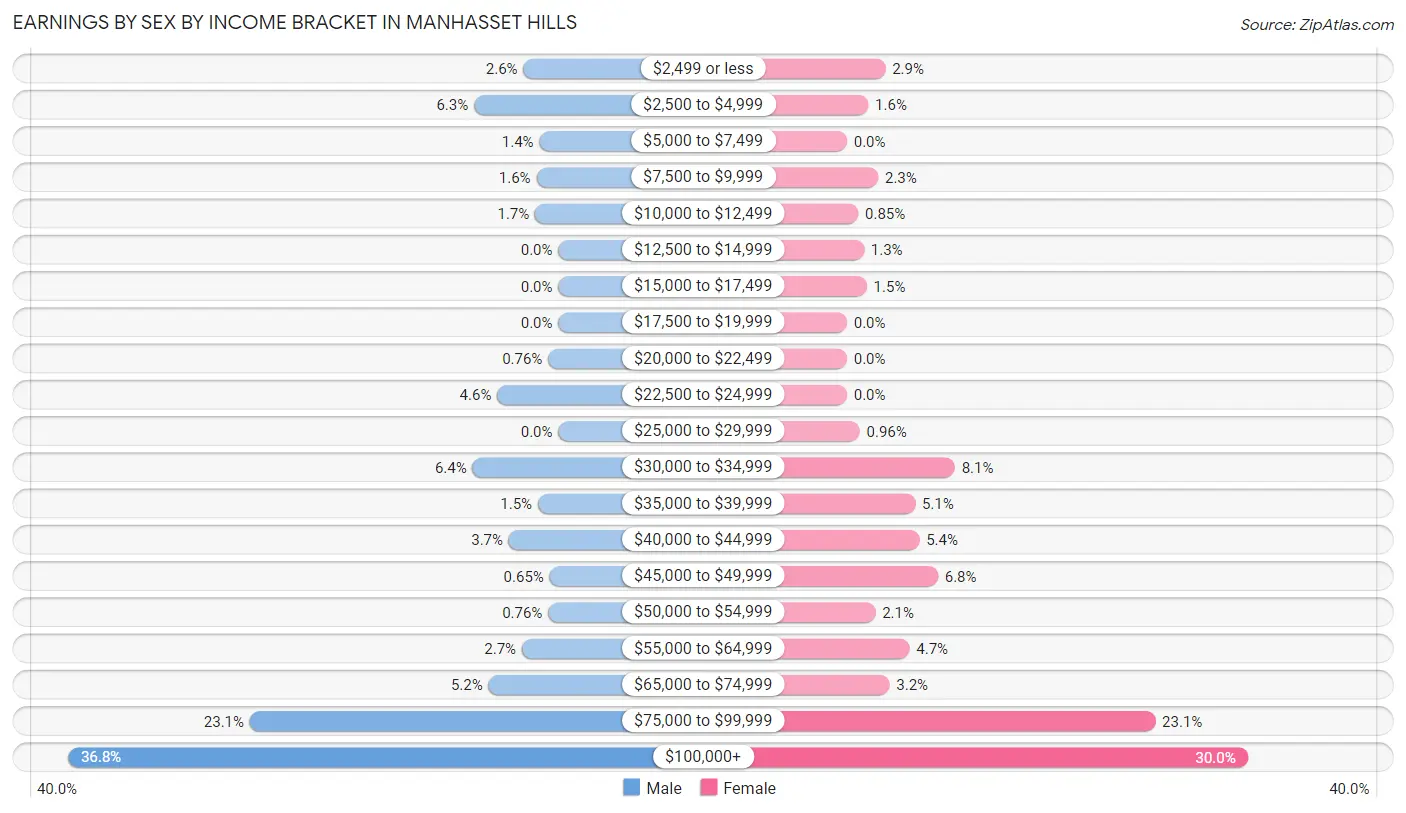
Earnings by Sex by Income Bracket in Manhasset Hills
The most common earnings brackets in Manhasset Hills are $100,000+ for men (337 | 36.7%) and $100,000+ for women (282 | 30.0%).
| Income | Male | Female |
| $2,499 or less | 24 (2.6%) | 27 (2.9%) |
| $2,500 to $4,999 | 58 (6.3%) | 15 (1.6%) |
| $5,000 to $7,499 | 13 (1.4%) | 0 (0.0%) |
| $7,500 to $9,999 | 15 (1.6%) | 22 (2.3%) |
| $10,000 to $12,499 | 16 (1.7%) | 8 (0.9%) |
| $12,500 to $14,999 | 0 (0.0%) | 12 (1.3%) |
| $15,000 to $17,499 | 0 (0.0%) | 14 (1.5%) |
| $17,500 to $19,999 | 0 (0.0%) | 0 (0.0%) |
| $20,000 to $22,499 | 7 (0.8%) | 0 (0.0%) |
| $22,500 to $24,999 | 42 (4.6%) | 0 (0.0%) |
| $25,000 to $29,999 | 0 (0.0%) | 9 (1.0%) |
| $30,000 to $34,999 | 59 (6.4%) | 76 (8.1%) |
| $35,000 to $39,999 | 14 (1.5%) | 48 (5.1%) |
| $40,000 to $44,999 | 34 (3.7%) | 51 (5.4%) |
| $45,000 to $49,999 | 6 (0.6%) | 64 (6.8%) |
| $50,000 to $54,999 | 7 (0.8%) | 20 (2.1%) |
| $55,000 to $64,999 | 25 (2.7%) | 44 (4.7%) |
| $65,000 to $74,999 | 48 (5.2%) | 30 (3.2%) |
| $75,000 to $99,999 | 212 (23.1%) | 217 (23.1%) |
| $100,000+ | 337 (36.7%) | 282 (30.0%) |
| Total | 917 (100.0%) | 939 (100.0%) |
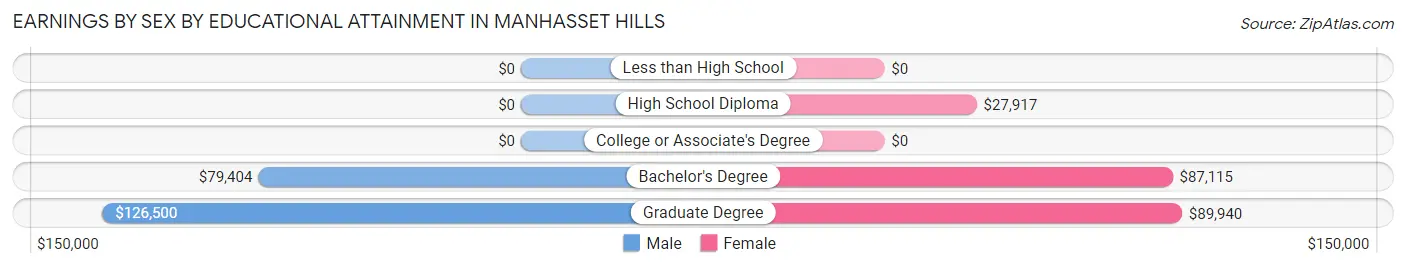
Earnings by Sex by Educational Attainment in Manhasset Hills
Average earnings in Manhasset Hills are $79,871 for men and $81,683 for women, a difference of 2.2%. Men with an educational attainment of graduate degree enjoy the highest average annual earnings of $126,500, while those with bachelor's degree education earn the least with $79,404. Women with an educational attainment of graduate degree earn the most with the average annual earnings of $89,940, while those with high school diploma education have the smallest earnings of $27,917.
| Educational Attainment | Male Income | Female Income |
| Less than High School | - | - |
| High School Diploma | - | - |
| College or Associate's Degree | - | - |
| Bachelor's Degree | $79,404 | $87,115 |
| Graduate Degree | $126,500 | $89,940 |
| Total | $79,871 | $81,683 |
Family Income in Manhasset Hills
Family Income Brackets in Manhasset Hills
According to the Manhasset Hills family income data, there are 461 families falling into the $200,000+ income range, which is the most common income bracket and makes up 42.3% of all families.
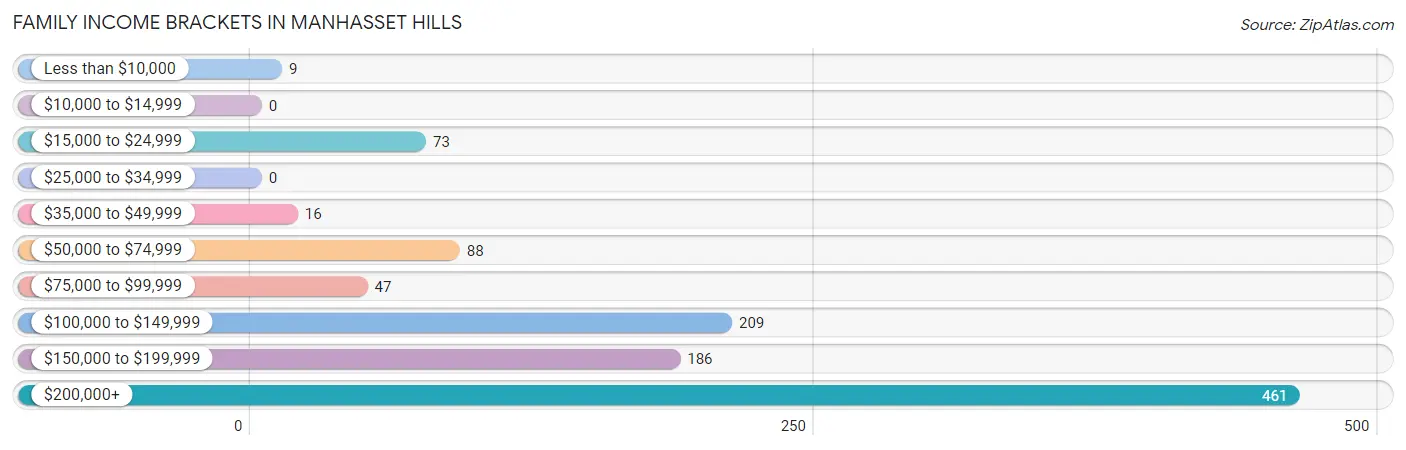
| Income Bracket | # Families | % Families |
| Less than $10,000 | 9 | 0.8% |
| $10,000 to $14,999 | 0 | 0.0% |
| $15,000 to $24,999 | 73 | 6.7% |
| $25,000 to $34,999 | 0 | 0.0% |
| $35,000 to $49,999 | 16 | 1.5% |
| $50,000 to $74,999 | 88 | 8.1% |
| $75,000 to $99,999 | 47 | 4.3% |
| $100,000 to $149,999 | 209 | 19.2% |
| $150,000 to $199,999 | 186 | 17.1% |
| $200,000+ | 461 | 42.3% |
Family Income by Famaliy Size in Manhasset Hills
5-person families (148 | 13.6%) account for the highest median family income in Manhasset Hills with $250,001 per family, while 2-person families (302 | 27.7%) have the highest median income of $70,972 per family member.
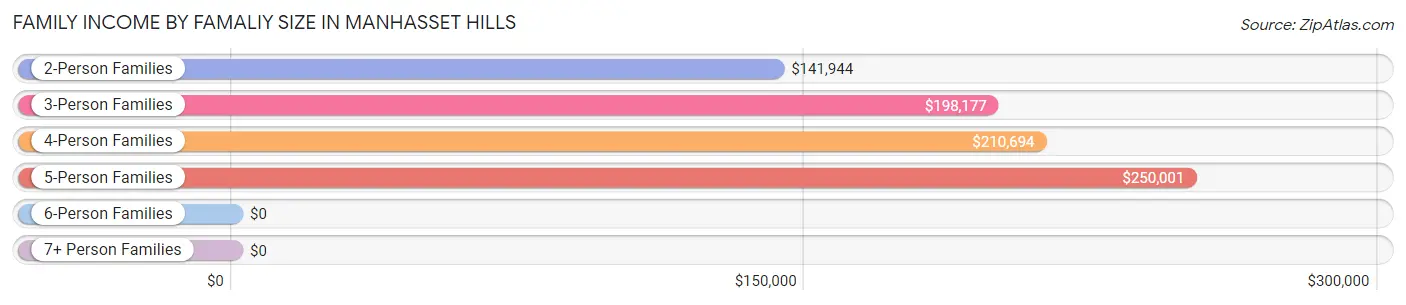
| Income Bracket | # Families | Median Income |
| 2-Person Families | 302 (27.7%) | $141,944 |
| 3-Person Families | 350 (32.1%) | $198,177 |
| 4-Person Families | 230 (21.1%) | $210,694 |
| 5-Person Families | 148 (13.6%) | $250,001 |
| 6-Person Families | 38 (3.5%) | $0 |
| 7+ Person Families | 21 (1.9%) | $0 |
| Total | 1,089 (100.0%) | $189,479 |
Family Income by Number of Earners in Manhasset Hills
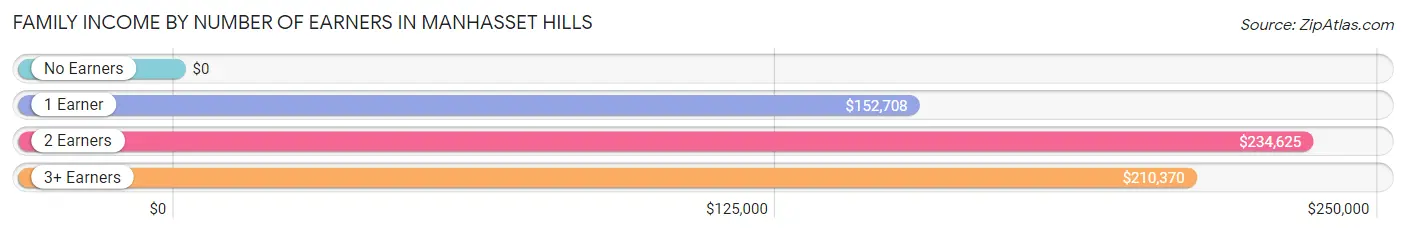
| Number of Earners | # Families | Median Income |
| No Earners | 132 (12.1%) | $0 |
| 1 Earner | 360 (33.1%) | $152,708 |
| 2 Earners | 407 (37.4%) | $234,625 |
| 3+ Earners | 190 (17.4%) | $210,370 |
| Total | 1,089 (100.0%) | $189,479 |
Household Income in Manhasset Hills
Household Income Brackets in Manhasset Hills
With 469 households falling in the category, the $200,000+ income range is the most frequent in Manhasset Hills, accounting for 39.9% of all households. In contrast, only 9 households (0.8%) fall into the less than $10,000 income bracket, making it the least populous group.
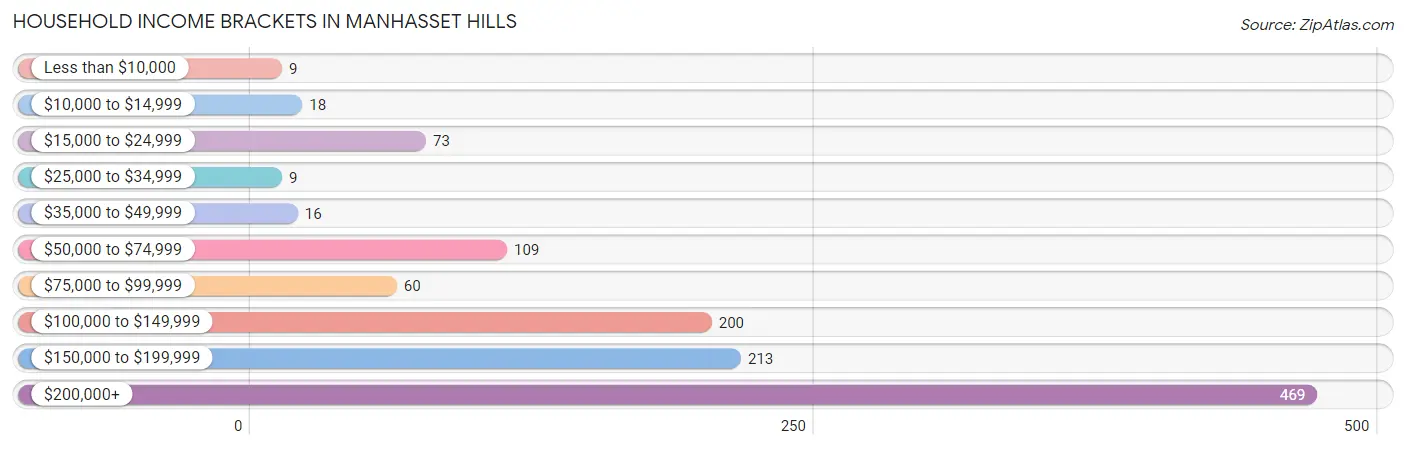
| Income Bracket | # Households | % Households |
| Less than $10,000 | 9 | 0.8% |
| $10,000 to $14,999 | 18 | 1.5% |
| $15,000 to $24,999 | 73 | 6.2% |
| $25,000 to $34,999 | 9 | 0.8% |
| $35,000 to $49,999 | 16 | 1.4% |
| $50,000 to $74,999 | 109 | 9.3% |
| $75,000 to $99,999 | 60 | 5.1% |
| $100,000 to $149,999 | 200 | 17.0% |
| $150,000 to $199,999 | 213 | 18.1% |
| $200,000+ | 469 | 39.9% |
Household Income by Householder Age in Manhasset Hills
The median household income in Manhasset Hills is $181,667, with the highest median household income of $250,001 found in the 25 to 44 years age bracket for the primary householder. A total of 260 households (22.1%) fall into this category.
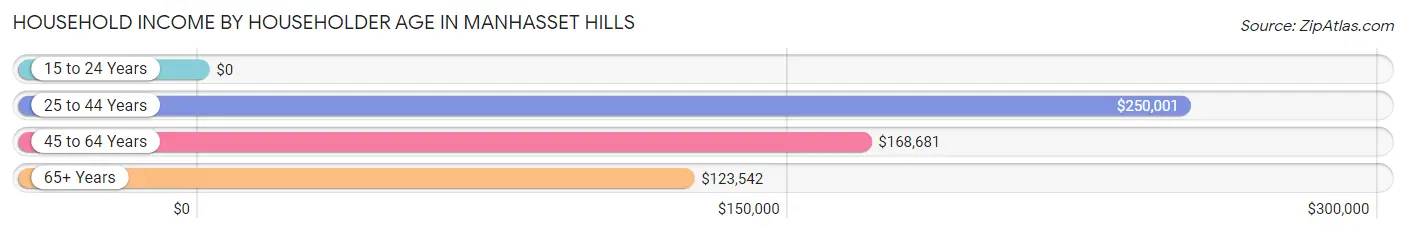
| Income Bracket | # Households | Median Income |
| 15 to 24 Years | 0 (0.0%) | $0 |
| 25 to 44 Years | 260 (22.1%) | $250,001 |
| 45 to 64 Years | 445 (37.8%) | $168,681 |
| 65+ Years | 471 (40.1%) | $123,542 |
| Total | 1,176 (100.0%) | $181,667 |
Poverty in Manhasset Hills
Income Below Poverty by Sex and Age in Manhasset Hills
With 3.7% poverty level for males and 3.2% for females among the residents of Manhasset Hills, 16 and 17 year old males and 16 and 17 year old females are the most vulnerable to poverty, with 4 males (21.0%) and 4 females (40.0%) in their respective age groups living below the poverty level.
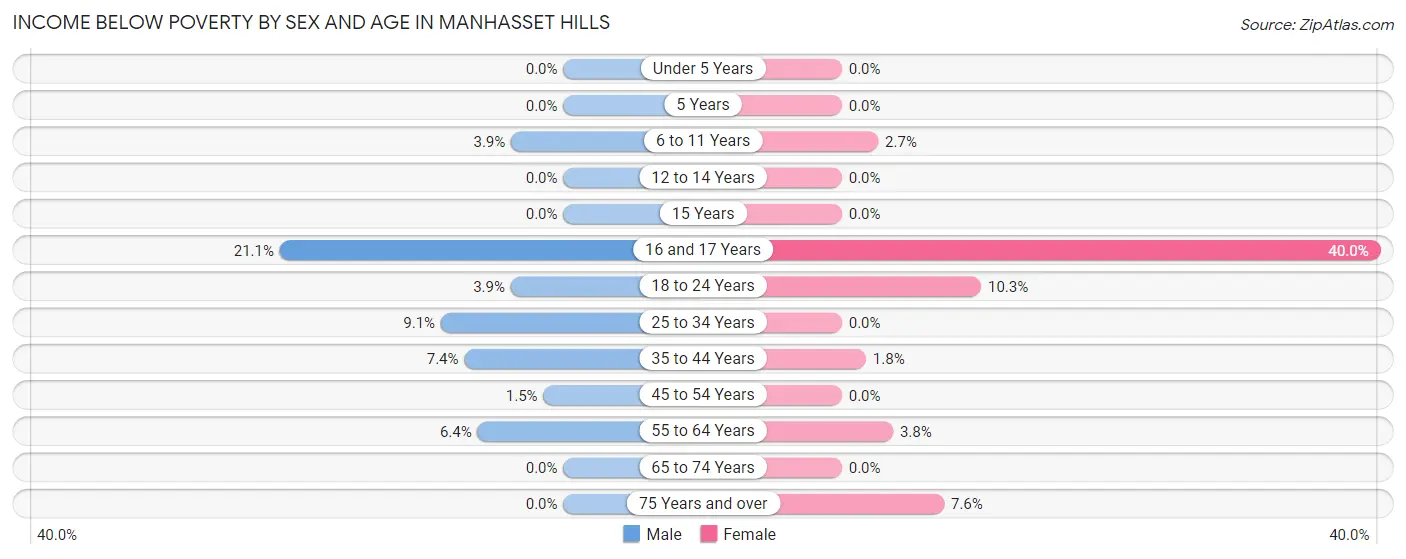
| Age Bracket | Male | Female |
| Under 5 Years | 0 (0.0%) | 0 (0.0%) |
| 5 Years | 0 (0.0%) | 0 (0.0%) |
| 6 to 11 Years | 4 (3.9%) | 4 (2.7%) |
| 12 to 14 Years | 0 (0.0%) | 0 (0.0%) |
| 15 Years | 0 (0.0%) | 0 (0.0%) |
| 16 and 17 Years | 4 (21.0%) | 4 (40.0%) |
| 18 to 24 Years | 14 (3.9%) | 15 (10.3%) |
| 25 to 34 Years | 14 (9.1%) | 0 (0.0%) |
| 35 to 44 Years | 23 (7.3%) | 4 (1.8%) |
| 45 to 54 Years | 4 (1.5%) | 0 (0.0%) |
| 55 to 64 Years | 13 (6.4%) | 13 (3.8%) |
| 65 to 74 Years | 0 (0.0%) | 0 (0.0%) |
| 75 Years and over | 0 (0.0%) | 18 (7.6%) |
| Total | 76 (3.7%) | 58 (3.2%) |
Income Above Poverty by Sex and Age in Manhasset Hills
According to the poverty statistics in Manhasset Hills, males aged under 5 years and females aged under 5 years are the age groups that are most secure financially, with 100.0% of males and 100.0% of females in these age groups living above the poverty line.
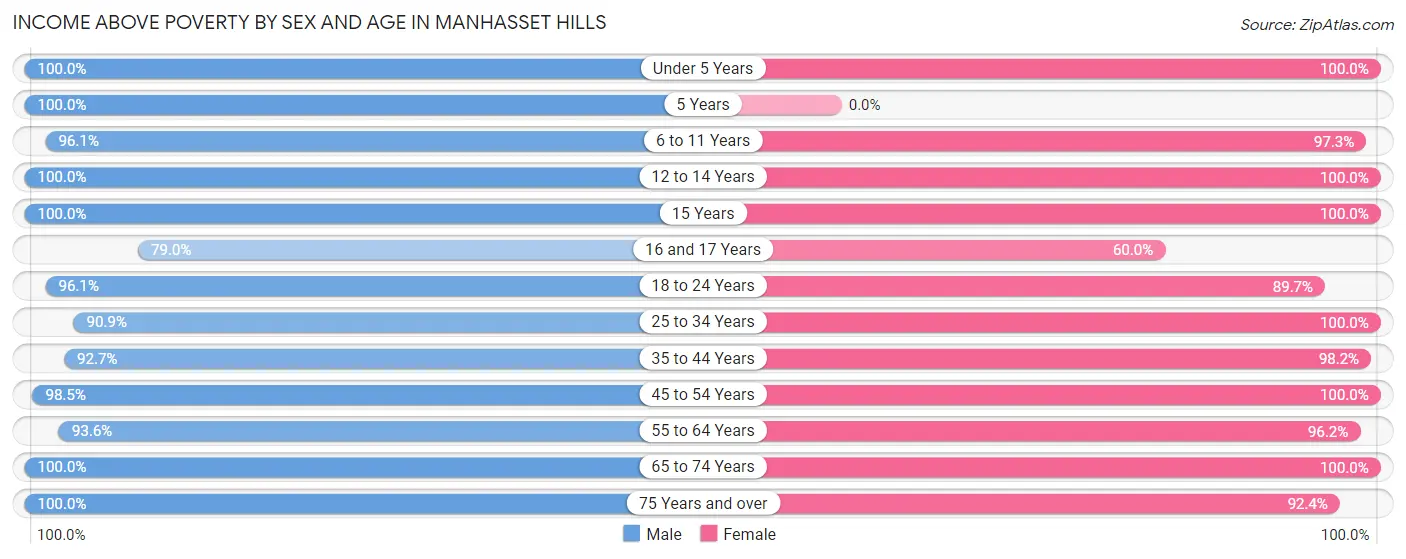
| Age Bracket | Male | Female |
| Under 5 Years | 148 (100.0%) | 54 (100.0%) |
| 5 Years | 8 (100.0%) | 0 (0.0%) |
| 6 to 11 Years | 99 (96.1%) | 144 (97.3%) |
| 12 to 14 Years | 71 (100.0%) | 93 (100.0%) |
| 15 Years | 16 (100.0%) | 15 (100.0%) |
| 16 and 17 Years | 15 (78.9%) | 6 (60.0%) |
| 18 to 24 Years | 345 (96.1%) | 130 (89.7%) |
| 25 to 34 Years | 140 (90.9%) | 165 (100.0%) |
| 35 to 44 Years | 290 (92.6%) | 220 (98.2%) |
| 45 to 54 Years | 267 (98.5%) | 216 (100.0%) |
| 55 to 64 Years | 191 (93.6%) | 329 (96.2%) |
| 65 to 74 Years | 216 (100.0%) | 194 (100.0%) |
| 75 Years and over | 179 (100.0%) | 219 (92.4%) |
| Total | 1,985 (96.3%) | 1,785 (96.9%) |
Income Below Poverty Among Married-Couple Families in Manhasset Hills
The poverty statistics for married-couple families in Manhasset Hills show that 2.3% or 18 of the total 794 families live below the poverty line. Families with no children have the highest poverty rate of 2.6%, comprising of 13 families. On the other hand, families with 3 or 4 children have the lowest poverty rate of 0.0%, which includes 0 families.
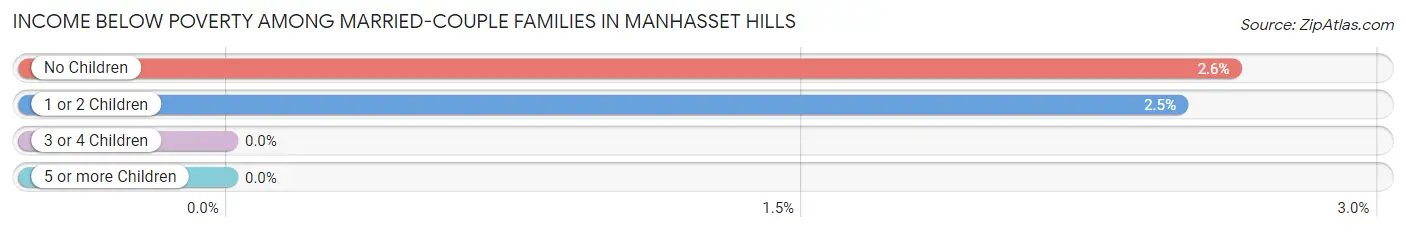
| Children | Above Poverty | Below Poverty |
| No Children | 483 (97.4%) | 13 (2.6%) |
| 1 or 2 Children | 197 (97.5%) | 5 (2.5%) |
| 3 or 4 Children | 96 (100.0%) | 0 (0.0%) |
| 5 or more Children | 0 (0.0%) | 0 (0.0%) |
| Total | 776 (97.7%) | 18 (2.3%) |
Income Below Poverty Among Single-Parent Households in Manhasset Hills
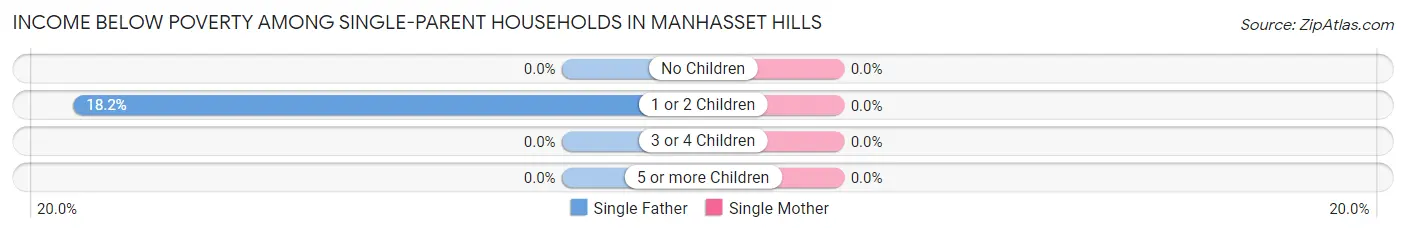
| Children | Single Father | Single Mother |
| No Children | 0 (0.0%) | 0 (0.0%) |
| 1 or 2 Children | 4 (18.2%) | 0 (0.0%) |
| 3 or 4 Children | 0 (0.0%) | 0 (0.0%) |
| 5 or more Children | 0 (0.0%) | 0 (0.0%) |
| Total | 4 (4.1%) | 0 (0.0%) |
Income Below Poverty Among Married-Couple vs Single-Parent Households in Manhasset Hills
The poverty data for Manhasset Hills shows that 18 of the married-couple family households (2.3%) and 4 of the single-parent households (1.4%) are living below the poverty level. Within the married-couple family households, those with no children have the highest poverty rate, with 13 households (2.6%) falling below the poverty line. Among the single-parent households, those with 1 or 2 children have the highest poverty rate, with 4 household (6.0%) living below poverty.
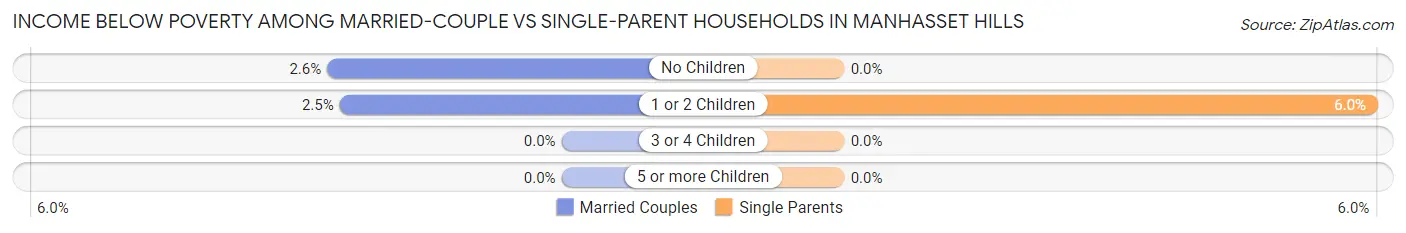
| Children | Married-Couple Families | Single-Parent Households |
| No Children | 13 (2.6%) | 0 (0.0%) |
| 1 or 2 Children | 5 (2.5%) | 4 (6.0%) |
| 3 or 4 Children | 0 (0.0%) | 0 (0.0%) |
| 5 or more Children | 0 (0.0%) | 0 (0.0%) |
| Total | 18 (2.3%) | 4 (1.4%) |
Race in Manhasset Hills
The most populous races in Manhasset Hills are Asian (2,072 | 53.1%), White / Caucasian (1,458 | 37.3%), and Hispanic or Latino (458 | 11.7%).
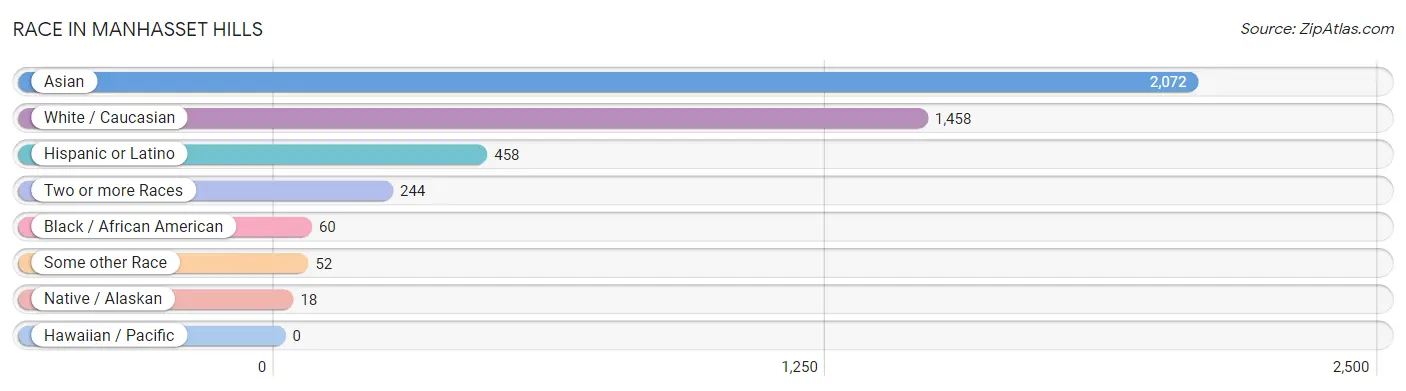
| Race | # Population | % Population |
| Asian | 2,072 | 53.1% |
| Black / African American | 60 | 1.5% |
| Hawaiian / Pacific | 0 | 0.0% |
| Hispanic or Latino | 458 | 11.7% |
| Native / Alaskan | 18 | 0.5% |
| White / Caucasian | 1,458 | 37.3% |
| Two or more Races | 244 | 6.2% |
| Some other Race | 52 | 1.3% |
| Total | 3,904 | 100.0% |
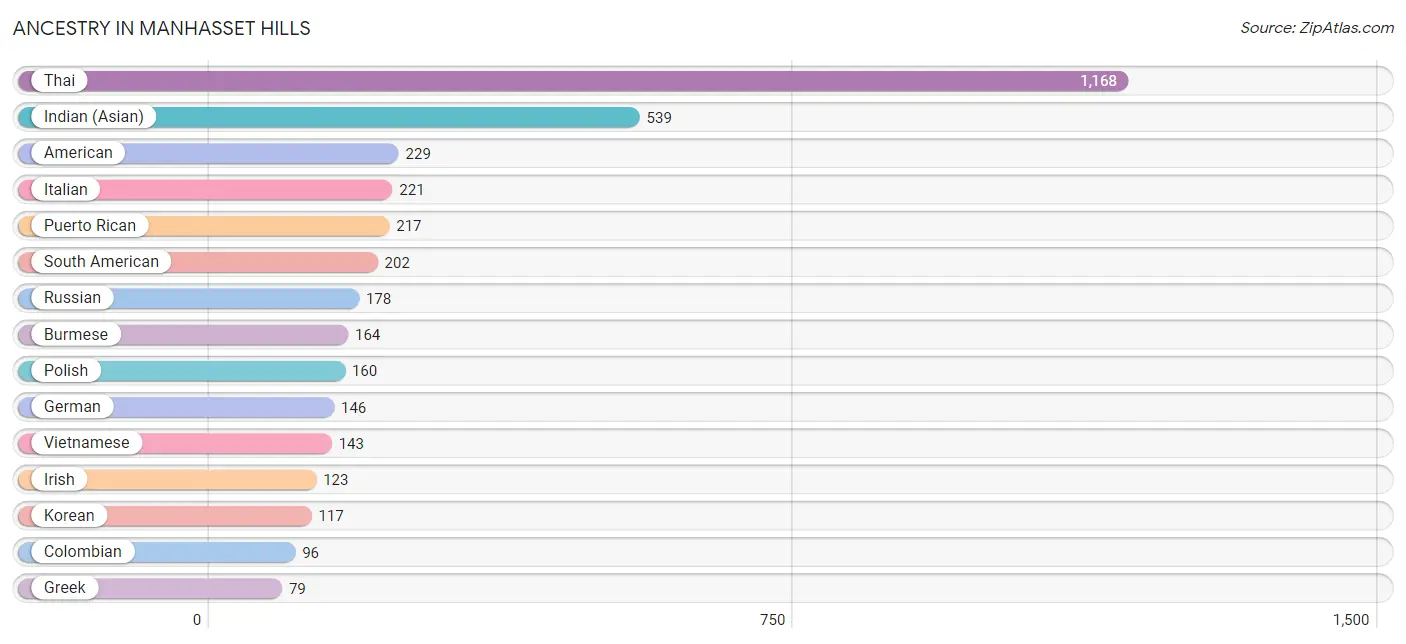
Ancestry in Manhasset Hills
The most populous ancestries reported in Manhasset Hills are Thai (1,168 | 29.9%), Indian (Asian) (539 | 13.8%), American (229 | 5.9%), Italian (221 | 5.7%), and Puerto Rican (217 | 5.6%), together accounting for 60.8% of all Manhasset Hills residents.
| Ancestry | # Population | % Population |
| American | 229 | 5.9% |
| Arab | 38 | 1.0% |
| Austrian | 9 | 0.2% |
| Bhutanese | 27 | 0.7% |
| Bolivian | 19 | 0.5% |
| Burmese | 164 | 4.2% |
| Canadian | 18 | 0.5% |
| Central American | 15 | 0.4% |
| Colombian | 96 | 2.5% |
| Dominican | 15 | 0.4% |
| Dutch | 44 | 1.1% |
| Eastern European | 31 | 0.8% |
| Ecuadorian | 18 | 0.5% |
| Filipino | 17 | 0.4% |
| German | 146 | 3.7% |
| Greek | 79 | 2.0% |
| Guatemalan | 15 | 0.4% |
| Guyanese | 45 | 1.1% |
| Hungarian | 47 | 1.2% |
| Indian (Asian) | 539 | 13.8% |
| Iranian | 76 | 1.9% |
| Iraqi | 38 | 1.0% |
| Irish | 123 | 3.2% |
| Italian | 221 | 5.7% |
| Korean | 117 | 3.0% |
| Pakistani | 13 | 0.3% |
| Peruvian | 69 | 1.8% |
| Polish | 160 | 4.1% |
| Potawatomi | 53 | 1.4% |
| Puerto Rican | 217 | 5.6% |
| Russian | 178 | 4.6% |
| South American | 202 | 5.2% |
| Spaniard | 9 | 0.2% |
| Thai | 1,168 | 29.9% |
| Vietnamese | 143 | 3.7% | View All 35 Rows |
Immigrants in Manhasset Hills
The most numerous immigrant groups reported in Manhasset Hills came from Asia (1,016 | 26.0%), South Central Asia (509 | 13.0%), Eastern Asia (371 | 9.5%), India (364 | 9.3%), and China (272 | 7.0%), together accounting for 64.8% of all Manhasset Hills residents.
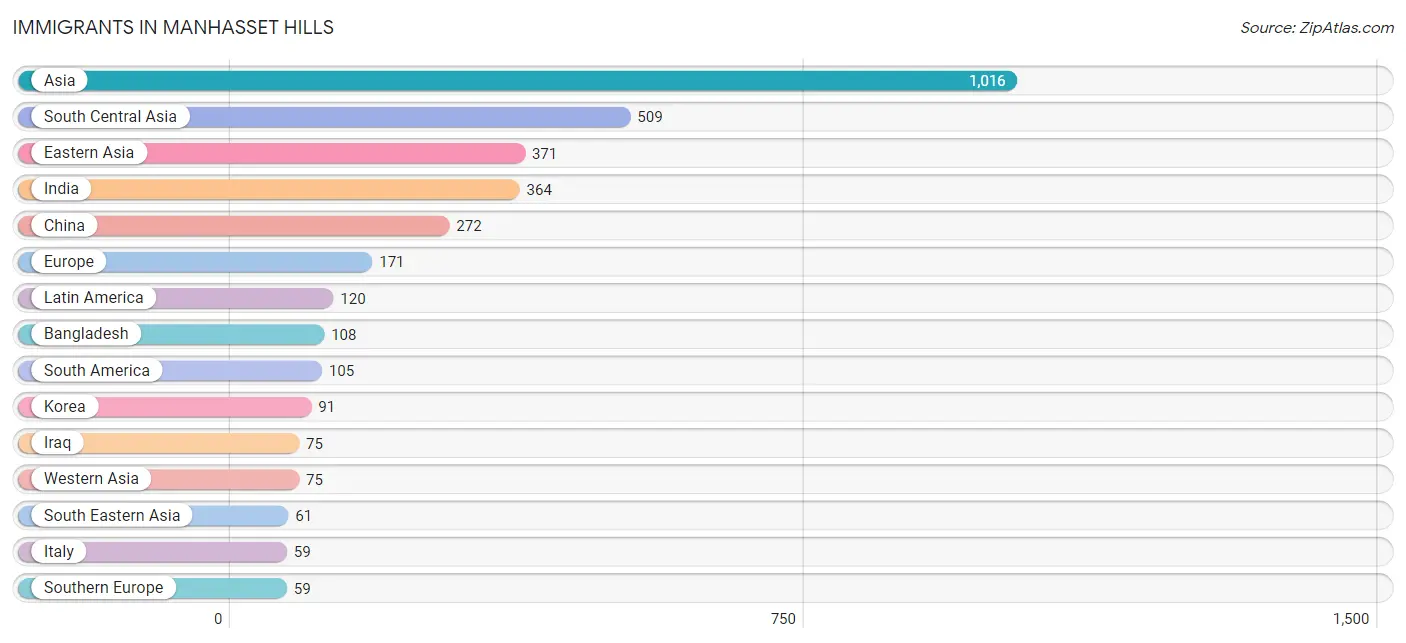
| Immigration Origin | # Population | % Population |
| Afghanistan | 19 | 0.5% |
| Asia | 1,016 | 26.0% |
| Bangladesh | 108 | 2.8% |
| Bolivia | 6 | 0.2% |
| Canada | 13 | 0.3% |
| Central America | 15 | 0.4% |
| China | 272 | 7.0% |
| Colombia | 27 | 0.7% |
| Eastern Asia | 371 | 9.5% |
| Eastern Europe | 40 | 1.0% |
| Europe | 171 | 4.4% |
| Germany | 40 | 1.0% |
| Guatemala | 15 | 0.4% |
| Guyana | 45 | 1.1% |
| Hong Kong | 39 | 1.0% |
| India | 364 | 9.3% |
| Iran | 18 | 0.5% |
| Iraq | 75 | 1.9% |
| Italy | 59 | 1.5% |
| Japan | 8 | 0.2% |
| Korea | 91 | 2.3% |
| Latin America | 120 | 3.1% |
| Netherlands | 11 | 0.3% |
| Northern Europe | 21 | 0.5% |
| Peru | 27 | 0.7% |
| Philippines | 39 | 1.0% |
| Poland | 26 | 0.7% |
| Russia | 14 | 0.4% |
| South America | 105 | 2.7% |
| South Central Asia | 509 | 13.0% |
| South Eastern Asia | 61 | 1.6% |
| Southern Europe | 59 | 1.5% |
| Taiwan | 13 | 0.3% |
| Thailand | 13 | 0.3% |
| Vietnam | 9 | 0.2% |
| Western Asia | 75 | 1.9% |
| Western Europe | 51 | 1.3% | View All 37 Rows |
Sex and Age in Manhasset Hills
Sex and Age in Manhasset Hills
The most populous age groups in Manhasset Hills are 40 to 44 Years (227 | 11.0%) for men and 55 to 59 Years (173 | 9.4%) for women.
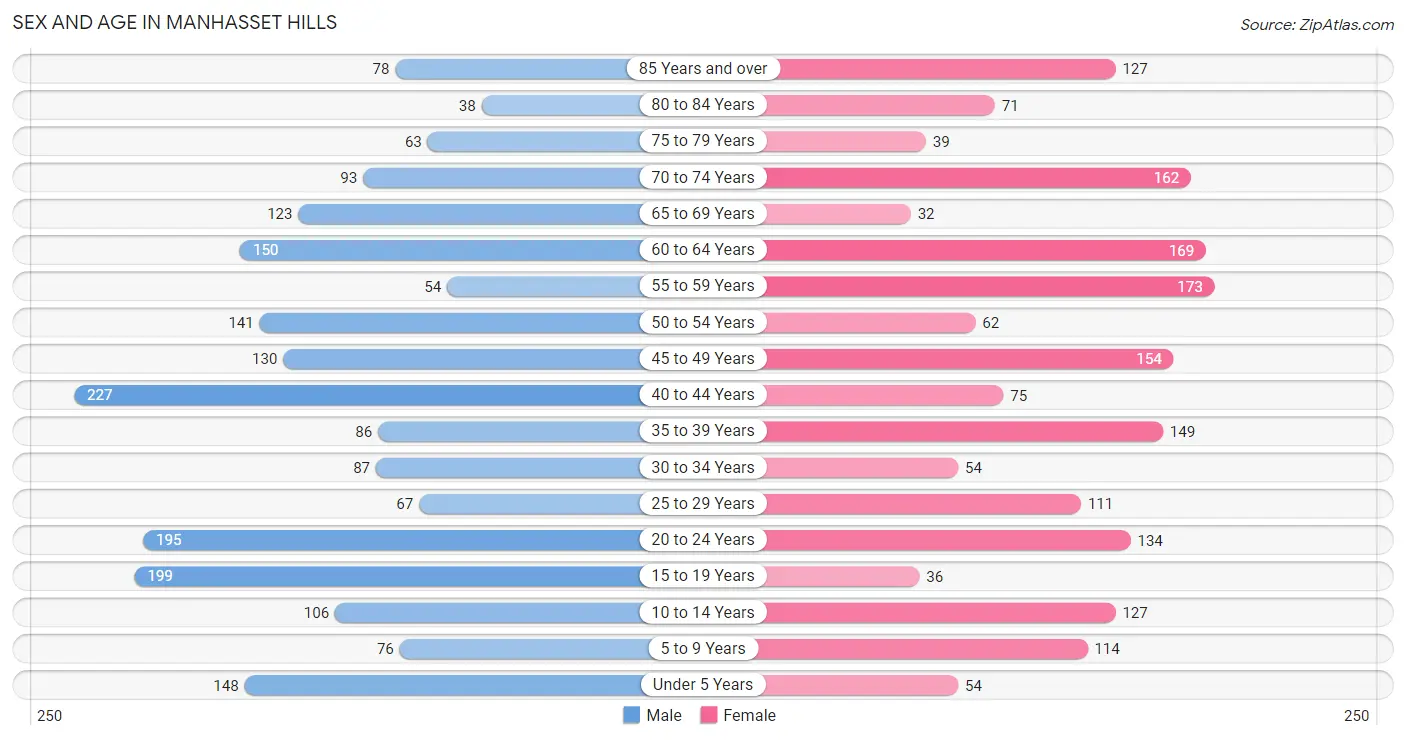
| Age Bracket | Male | Female |
| Under 5 Years | 148 (7.2%) | 54 (2.9%) |
| 5 to 9 Years | 76 (3.7%) | 114 (6.2%) |
| 10 to 14 Years | 106 (5.1%) | 127 (6.9%) |
| 15 to 19 Years | 199 (9.7%) | 36 (1.9%) |
| 20 to 24 Years | 195 (9.5%) | 134 (7.3%) |
| 25 to 29 Years | 67 (3.3%) | 111 (6.0%) |
| 30 to 34 Years | 87 (4.2%) | 54 (2.9%) |
| 35 to 39 Years | 86 (4.2%) | 149 (8.1%) |
| 40 to 44 Years | 227 (11.0%) | 75 (4.1%) |
| 45 to 49 Years | 130 (6.3%) | 154 (8.4%) |
| 50 to 54 Years | 141 (6.8%) | 62 (3.4%) |
| 55 to 59 Years | 54 (2.6%) | 173 (9.4%) |
| 60 to 64 Years | 150 (7.3%) | 169 (9.2%) |
| 65 to 69 Years | 123 (6.0%) | 32 (1.7%) |
| 70 to 74 Years | 93 (4.5%) | 162 (8.8%) |
| 75 to 79 Years | 63 (3.1%) | 39 (2.1%) |
| 80 to 84 Years | 38 (1.8%) | 71 (3.8%) |
| 85 Years and over | 78 (3.8%) | 127 (6.9%) |
| Total | 2,061 (100.0%) | 1,843 (100.0%) |
Families and Households in Manhasset Hills
Median Family Size in Manhasset Hills
The median family size in Manhasset Hills is 3.45 persons per family, with single male/father families (97 | 8.9%) accounting for the largest median family size of 3.86 persons per family. On the other hand, single female/mother families (198 | 18.2%) represent the smallest median family size with 3.15 persons per family.
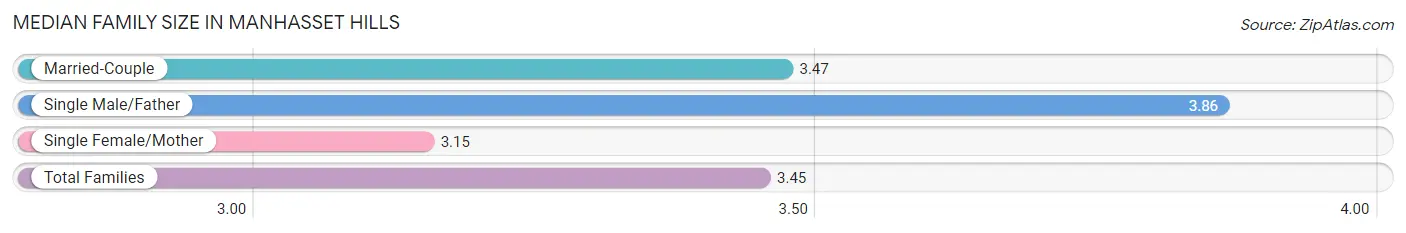
| Family Type | # Families | Family Size |
| Married-Couple | 794 (72.9%) | 3.47 |
| Single Male/Father | 97 (8.9%) | 3.86 |
| Single Female/Mother | 198 (18.2%) | 3.15 |
| Total Families | 1,089 (100.0%) | 3.45 |
Median Household Size in Manhasset Hills
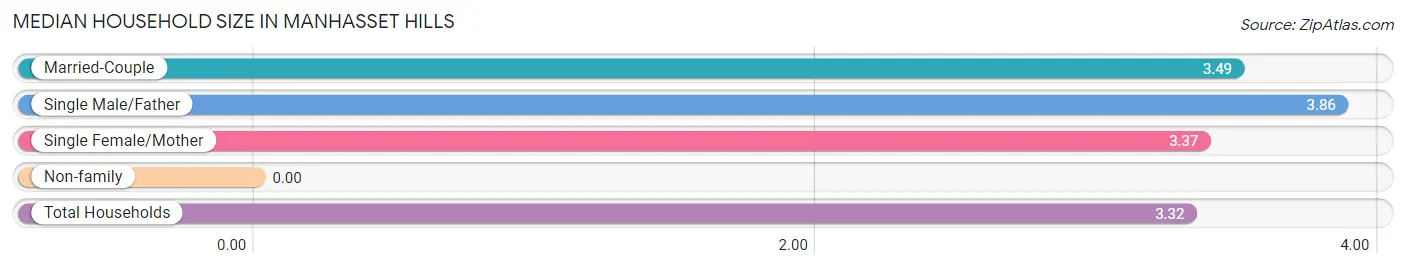
| Household Type | # Households | Household Size |
| Married-Couple | 794 (67.5%) | 3.49 |
| Single Male/Father | 97 (8.3%) | 3.86 |
| Single Female/Mother | 198 (16.8%) | 3.37 |
| Non-family | 87 (7.4%) | - |
| Total Households | 1,176 (100.0%) | 3.32 |
Household Size by Marriage Status in Manhasset Hills
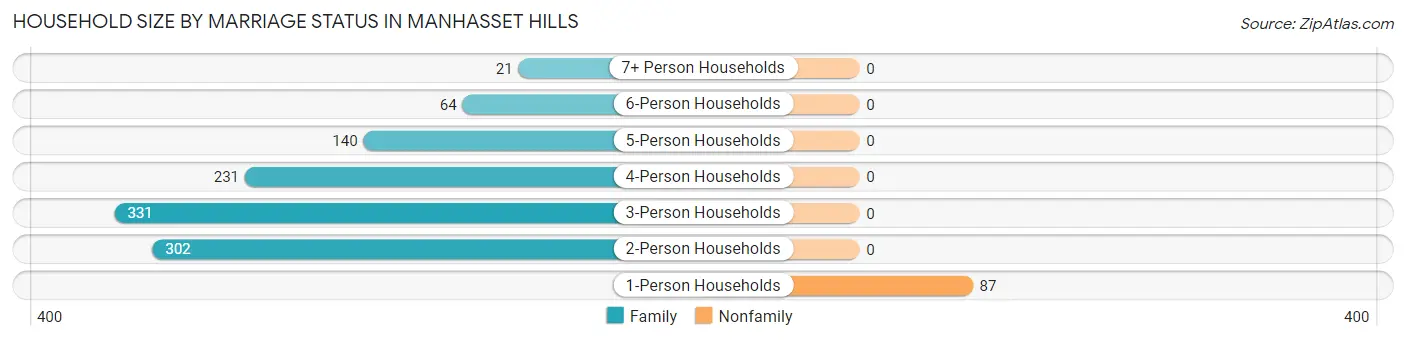
Out of a total of 1,176 households in Manhasset Hills, 1,089 (92.6%) are family households, while 87 (7.4%) are nonfamily households. The most numerous type of family households are 3-person households, comprising 331, and the most common type of nonfamily households are 1-person households, comprising 87.
| Household Size | Family Households | Nonfamily Households |
| 1-Person Households | - | 87 (7.4%) |
| 2-Person Households | 302 (25.7%) | 0 (0.0%) |
| 3-Person Households | 331 (28.1%) | 0 (0.0%) |
| 4-Person Households | 231 (19.6%) | 0 (0.0%) |
| 5-Person Households | 140 (11.9%) | 0 (0.0%) |
| 6-Person Households | 64 (5.4%) | 0 (0.0%) |
| 7+ Person Households | 21 (1.8%) | 0 (0.0%) |
| Total | 1,089 (92.6%) | 87 (7.4%) |
Female Fertility in Manhasset Hills
Fertility by Age in Manhasset Hills
| Age Bracket | Women with Births | Births / 1,000 Women |
| 15 to 19 years | 0 (0.0%) | 0.0 |
| 20 to 34 years | 0 (0.0%) | 0.0 |
| 35 to 50 years | 0 (0.0%) | 0.0 |
| Total | 0 (0.0%) | 0.0 |
Fertility by Age by Marriage Status in Manhasset Hills
| Age Bracket | Married | Unmarried |
| 15 to 19 years | 0 (0.0%) | 0 (0.0%) |
| 20 to 34 years | 0 (0.0%) | 0 (0.0%) |
| 35 to 50 years | 0 (0.0%) | 0 (0.0%) |
| Total | 0 (0.0%) | 0 (0.0%) |
Fertility by Education in Manhasset Hills
| Educational Attainment | Women with Births | Births / 1,000 Women |
| Less than High School | 0 (0.0%) | 0.0 |
| High School Diploma | 0 (0.0%) | 0.0 |
| College or Associate's Degree | 0 (0.0%) | 0.0 |
| Bachelor's Degree | 0 (0.0%) | 0.0 |
| Graduate Degree | 0 (0.0%) | 0.0 |
| Total | 0 (0.0%) | 0.0 |
Fertility by Education by Marriage Status in Manhasset Hills
| Educational Attainment | Married | Unmarried |
| Less than High School | 0 (0.0%) | 0 (0.0%) |
| High School Diploma | 0 (0.0%) | 0 (0.0%) |
| College or Associate's Degree | 0 (0.0%) | 0 (0.0%) |
| Bachelor's Degree | 0 (0.0%) | 0 (0.0%) |
| Graduate Degree | 0 (0.0%) | 0 (0.0%) |
| Total | 0 (0.0%) | 0 (0.0%) |
Employment Characteristics in Manhasset Hills
Employment by Class of Employer in Manhasset Hills
Among the 1,788 employed individuals in Manhasset Hills, private company employees (1,006 | 56.3%), not-for-profit organizations (231 | 12.9%), and local government employees (218 | 12.2%) make up the most common classes of employment.
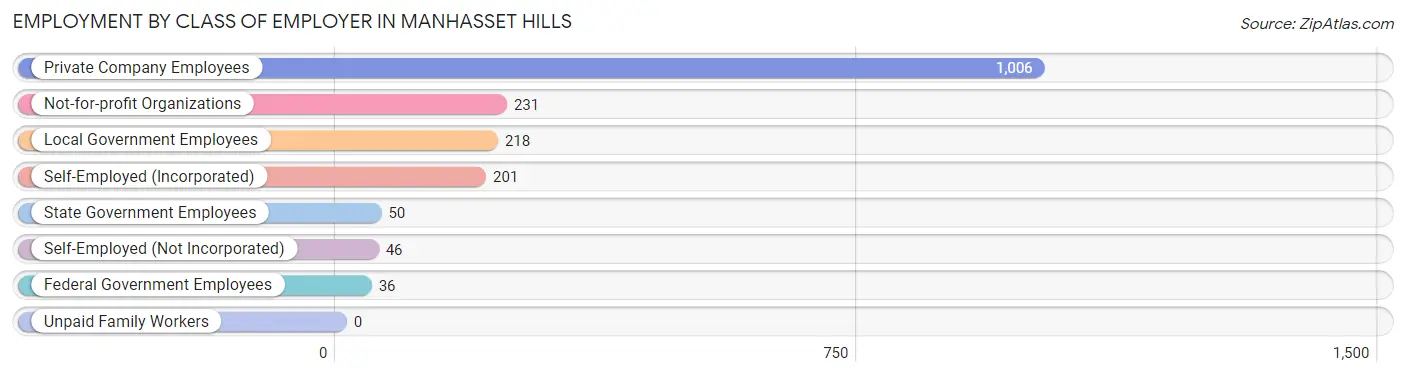
| Employer Class | # Employees | % Employees |
| Private Company Employees | 1,006 | 56.3% |
| Self-Employed (Incorporated) | 201 | 11.2% |
| Self-Employed (Not Incorporated) | 46 | 2.6% |
| Not-for-profit Organizations | 231 | 12.9% |
| Local Government Employees | 218 | 12.2% |
| State Government Employees | 50 | 2.8% |
| Federal Government Employees | 36 | 2.0% |
| Unpaid Family Workers | 0 | 0.0% |
| Total | 1,788 | 100.0% |
Employment Status by Age in Manhasset Hills
According to the labor force statistics for Manhasset Hills, out of the total population over 16 years of age (3,248), 56.9% or 1,848 individuals are in the labor force, with 2.5% or 46 of them unemployed. The age group with the highest labor force participation rate is 25 to 29 years, with 100.0% or 178 individuals in the labor force. Within the labor force, the 20 to 24 years age range has the highest percentage of unemployed individuals, with 14.7% or 14 of them being unemployed.
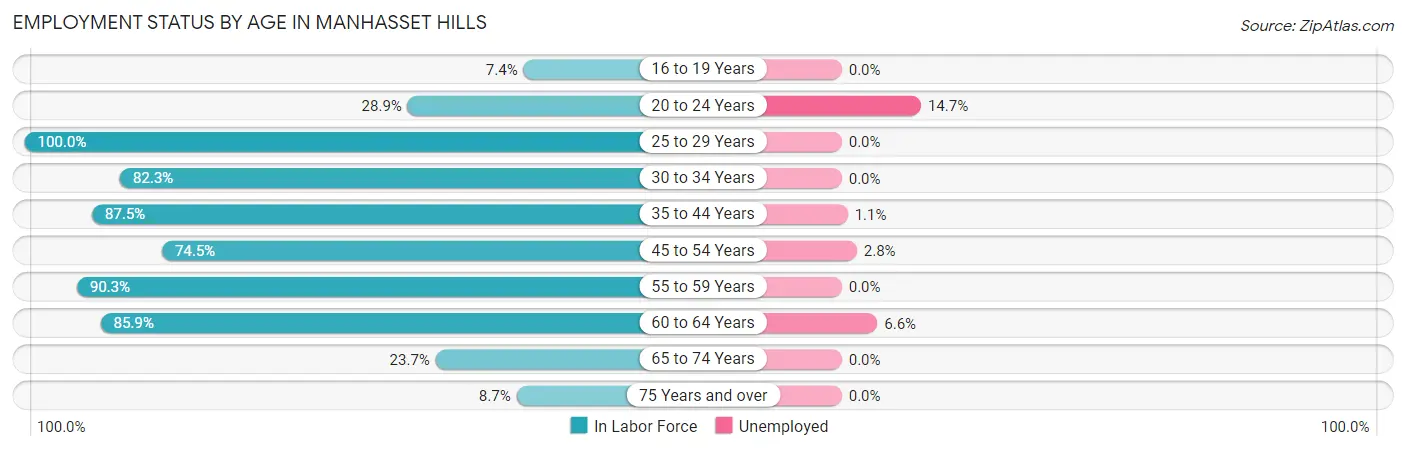
| Age Bracket | In Labor Force | Unemployed |
| 16 to 19 Years | 15 (7.4%) | 0 (0.0%) |
| 20 to 24 Years | 95 (28.9%) | 14 (14.7%) |
| 25 to 29 Years | 178 (100.0%) | 0 (0.0%) |
| 30 to 34 Years | 116 (82.3%) | 0 (0.0%) |
| 35 to 44 Years | 470 (87.5%) | 5 (1.1%) |
| 45 to 54 Years | 363 (74.5%) | 10 (2.8%) |
| 55 to 59 Years | 205 (90.3%) | 0 (0.0%) |
| 60 to 64 Years | 274 (85.9%) | 18 (6.6%) |
| 65 to 74 Years | 97 (23.7%) | 0 (0.0%) |
| 75 Years and over | 36 (8.7%) | 0 (0.0%) |
| Total | 1,848 (56.9%) | 46 (2.5%) |
Employment Status by Educational Attainment in Manhasset Hills
According to labor force statistics for Manhasset Hills, 85.0% of individuals (1,606) out of the total population between 25 and 64 years of age (1,889) are in the labor force, with 2.1% or 34 of them being unemployed. The group with the highest labor force participation rate are those with the educational attainment of bachelor's degree or higher, with 88.3% or 1,199 individuals in the labor force. Within the labor force, individuals with college / associate degree education have the highest percentage of unemployment, with 4.4% or 15 of them being unemployed.
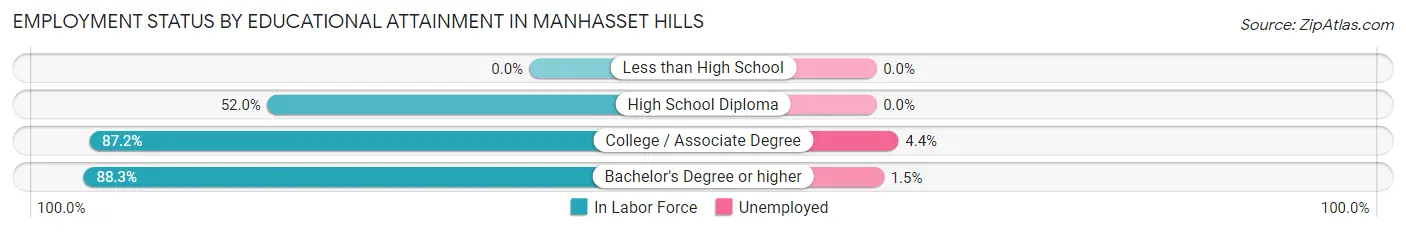
| Educational Attainment | In Labor Force | Unemployed |
| Less than High School | 0 (0.0%) | 0 (0.0%) |
| High School Diploma | 66 (52.0%) | 0 (0.0%) |
| College / Associate Degree | 341 (87.2%) | 17 (4.4%) |
| Bachelor's Degree or higher | 1,199 (88.3%) | 20 (1.5%) |
| Total | 1,606 (85.0%) | 40 (2.1%) |
Employment Occupations by Sex in Manhasset Hills
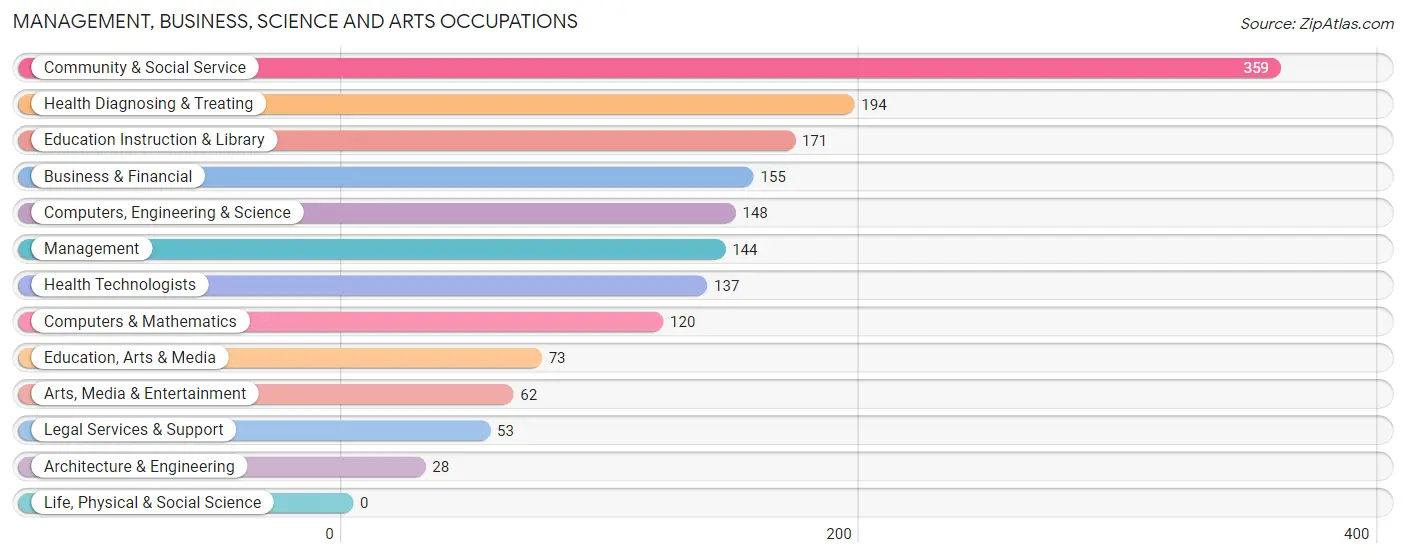
Management, Business, Science and Arts Occupations
The most common Management, Business, Science and Arts occupations in Manhasset Hills are Community & Social Service (359 | 19.9%), Health Diagnosing & Treating (194 | 10.8%), Education Instruction & Library (171 | 9.5%), Business & Financial (155 | 8.6%), and Computers, Engineering & Science (148 | 8.2%).
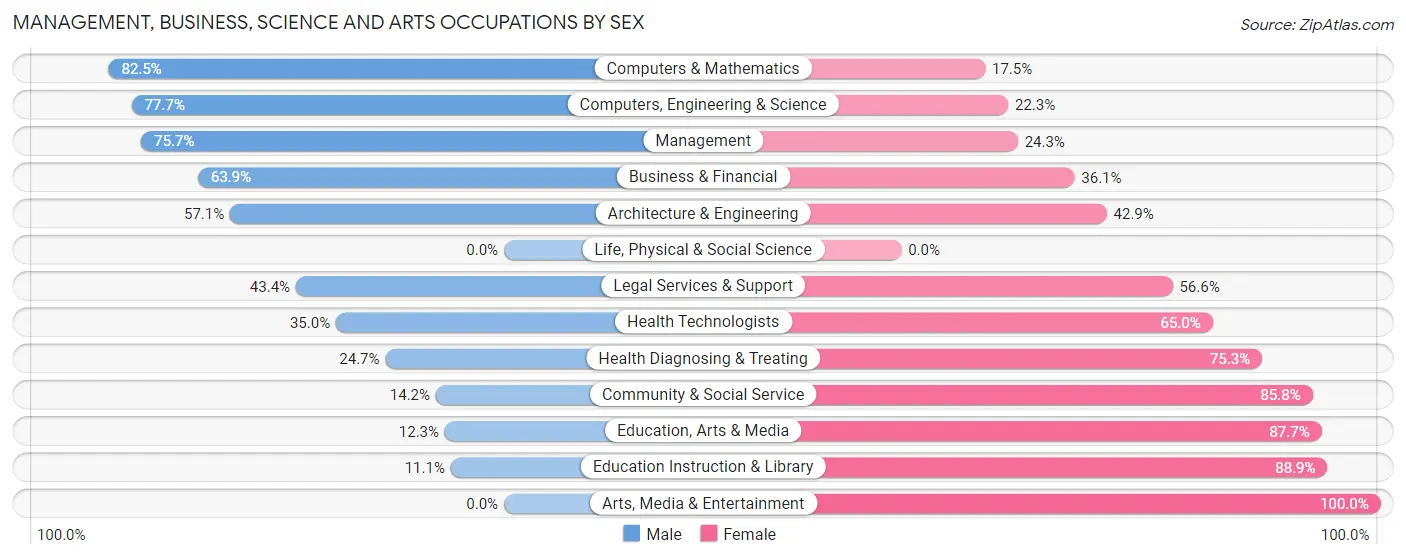
Management, Business, Science and Arts Occupations by Sex
Within the Management, Business, Science and Arts occupations in Manhasset Hills, the most male-oriented occupations are Computers & Mathematics (82.5%), Computers, Engineering & Science (77.7%), and Management (75.7%), while the most female-oriented occupations are Arts, Media & Entertainment (100.0%), Education Instruction & Library (88.9%), and Education, Arts & Media (87.7%).
| Occupation | Male | Female |
| Management | 109 (75.7%) | 35 (24.3%) |
| Business & Financial | 99 (63.9%) | 56 (36.1%) |
| Computers, Engineering & Science | 115 (77.7%) | 33 (22.3%) |
| Computers & Mathematics | 99 (82.5%) | 21 (17.5%) |
| Architecture & Engineering | 16 (57.1%) | 12 (42.9%) |
| Life, Physical & Social Science | 0 (0.0%) | 0 (0.0%) |
| Community & Social Service | 51 (14.2%) | 308 (85.8%) |
| Education, Arts & Media | 9 (12.3%) | 64 (87.7%) |
| Legal Services & Support | 23 (43.4%) | 30 (56.6%) |
| Education Instruction & Library | 19 (11.1%) | 152 (88.9%) |
| Arts, Media & Entertainment | 0 (0.0%) | 62 (100.0%) |
| Health Diagnosing & Treating | 48 (24.7%) | 146 (75.3%) |
| Health Technologists | 48 (35.0%) | 89 (65.0%) |
| Total (Category) | 422 (42.2%) | 578 (57.8%) |
| Total (Overall) | 874 (48.5%) | 928 (51.5%) |
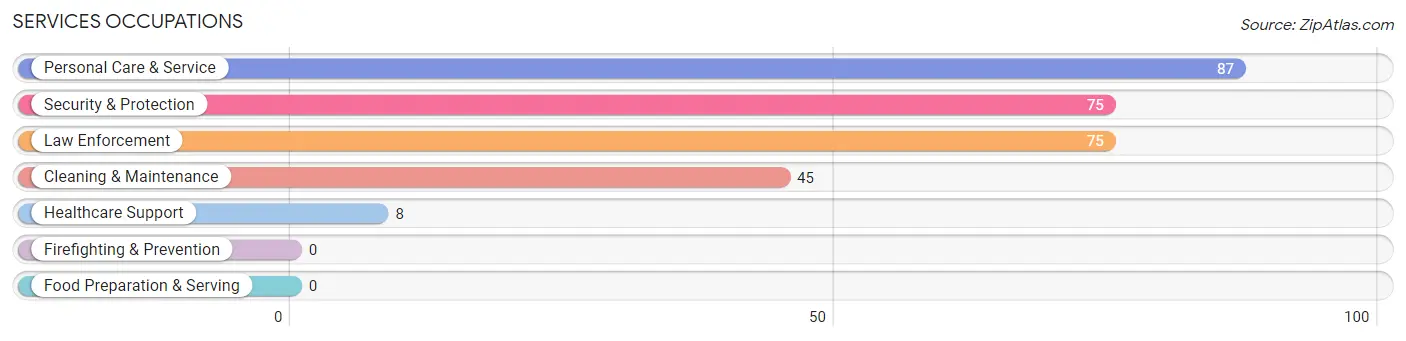
Services Occupations
The most common Services occupations in Manhasset Hills are Personal Care & Service (87 | 4.8%), Security & Protection (75 | 4.2%), Law Enforcement (75 | 4.2%), Cleaning & Maintenance (45 | 2.5%), and Healthcare Support (8 | 0.4%).
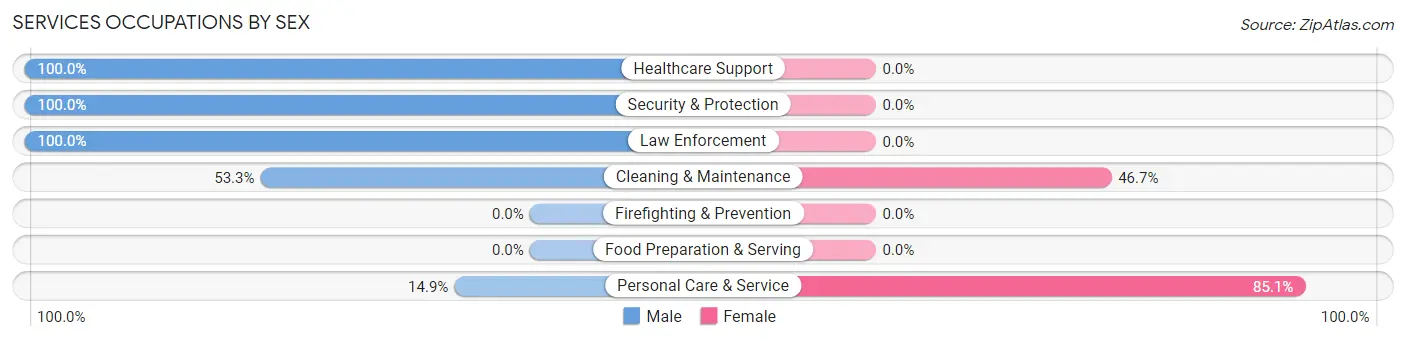
Services Occupations by Sex
Within the Services occupations in Manhasset Hills, the most male-oriented occupations are Healthcare Support (100.0%), Security & Protection (100.0%), and Law Enforcement (100.0%), while the most female-oriented occupations are Personal Care & Service (85.1%), and Cleaning & Maintenance (46.7%).
| Occupation | Male | Female |
| Healthcare Support | 8 (100.0%) | 0 (0.0%) |
| Security & Protection | 75 (100.0%) | 0 (0.0%) |
| Firefighting & Prevention | 0 (0.0%) | 0 (0.0%) |
| Law Enforcement | 75 (100.0%) | 0 (0.0%) |
| Food Preparation & Serving | 0 (0.0%) | 0 (0.0%) |
| Cleaning & Maintenance | 24 (53.3%) | 21 (46.7%) |
| Personal Care & Service | 13 (14.9%) | 74 (85.1%) |
| Total (Category) | 120 (55.8%) | 95 (44.2%) |
| Total (Overall) | 874 (48.5%) | 928 (51.5%) |
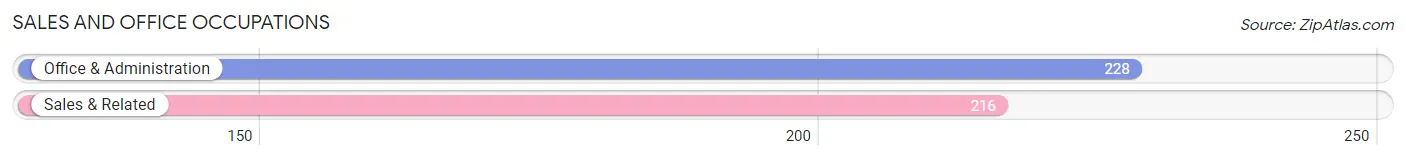
Sales and Office Occupations
The most common Sales and Office occupations in Manhasset Hills are Office & Administration (228 | 12.7%), and Sales & Related (216 | 12.0%).
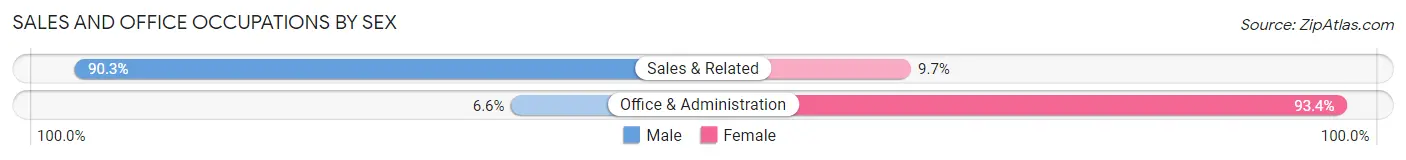
Sales and Office Occupations by Sex
| Occupation | Male | Female |
| Sales & Related | 195 (90.3%) | 21 (9.7%) |
| Office & Administration | 15 (6.6%) | 213 (93.4%) |
| Total (Category) | 210 (47.3%) | 234 (52.7%) |
| Total (Overall) | 874 (48.5%) | 928 (51.5%) |
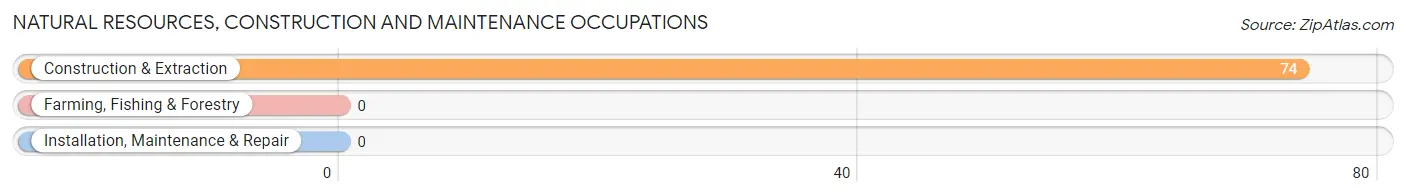
Natural Resources, Construction and Maintenance Occupations
The most common Natural Resources, Construction and Maintenance occupations in Manhasset Hills are , and Construction & Extraction (74 | 4.1%).
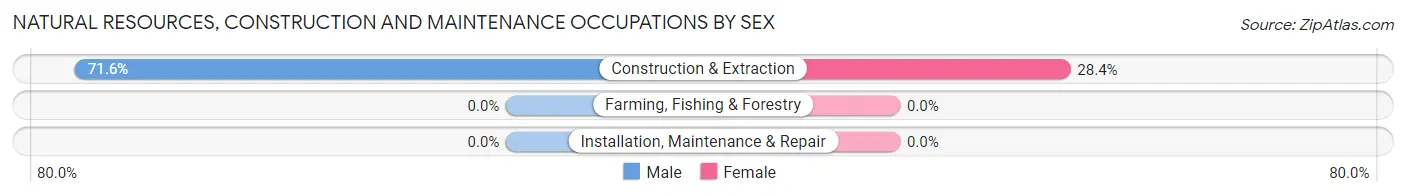
Natural Resources, Construction and Maintenance Occupations by Sex
| Occupation | Male | Female |
| Farming, Fishing & Forestry | 0 (0.0%) | 0 (0.0%) |
| Construction & Extraction | 53 (71.6%) | 21 (28.4%) |
| Installation, Maintenance & Repair | 0 (0.0%) | 0 (0.0%) |
| Total (Category) | 53 (71.6%) | 21 (28.4%) |
| Total (Overall) | 874 (48.5%) | 928 (51.5%) |
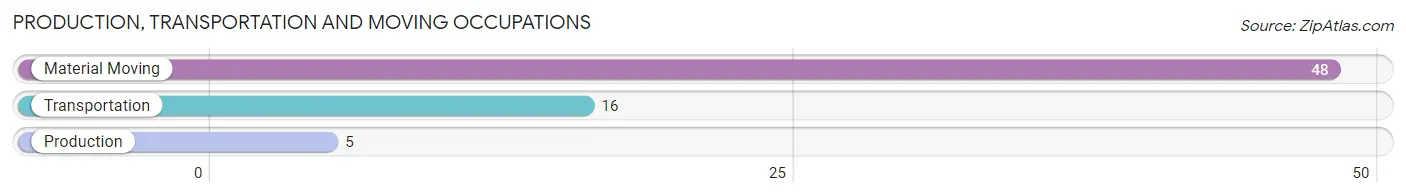
Production, Transportation and Moving Occupations
The most common Production, Transportation and Moving occupations in Manhasset Hills are Material Moving (48 | 2.7%), Transportation (16 | 0.9%), and Production (5 | 0.3%).
Production, Transportation and Moving Occupations by Sex
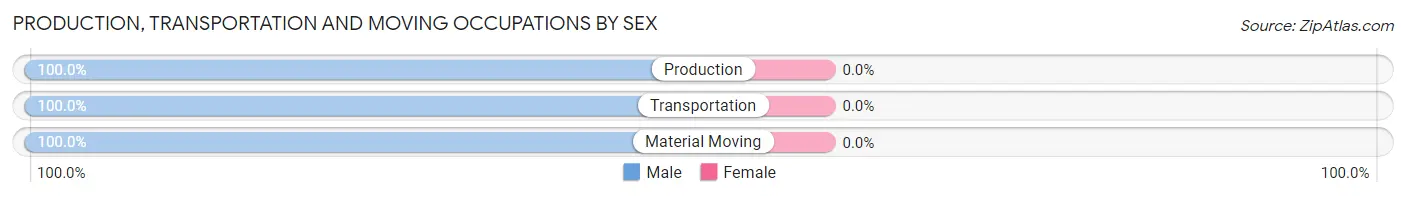
| Occupation | Male | Female |
| Production | 5 (100.0%) | 0 (0.0%) |
| Transportation | 16 (100.0%) | 0 (0.0%) |
| Material Moving | 48 (100.0%) | 0 (0.0%) |
| Total (Category) | 69 (100.0%) | 0 (0.0%) |
| Total (Overall) | 874 (48.5%) | 928 (51.5%) |
Employment Industries by Sex in Manhasset Hills
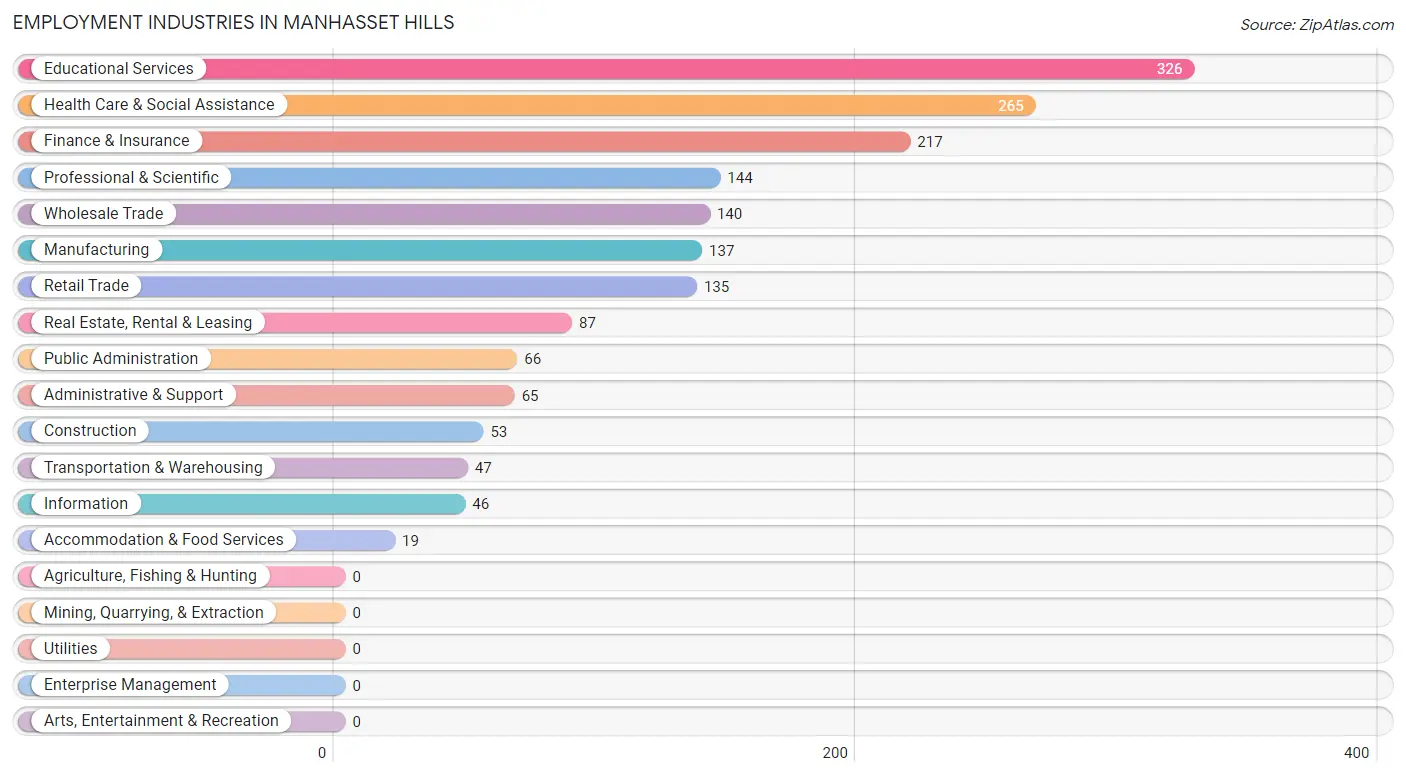
Employment Industries in Manhasset Hills
The major employment industries in Manhasset Hills include Educational Services (326 | 18.1%), Health Care & Social Assistance (265 | 14.7%), Finance & Insurance (217 | 12.0%), Professional & Scientific (144 | 8.0%), and Wholesale Trade (140 | 7.8%).
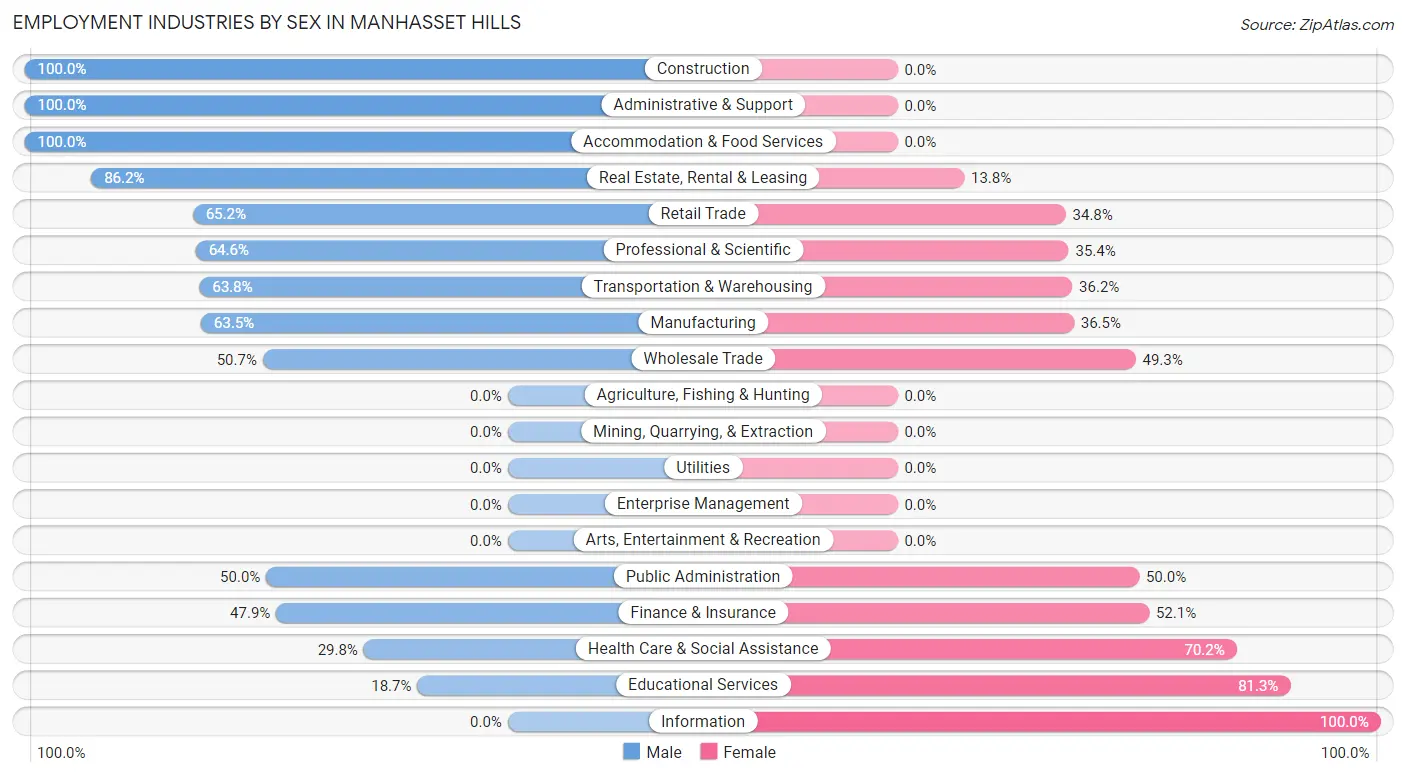
Employment Industries by Sex in Manhasset Hills
The Manhasset Hills industries that see more men than women are Construction (100.0%), Administrative & Support (100.0%), and Accommodation & Food Services (100.0%), whereas the industries that tend to have a higher number of women are Information (100.0%), Educational Services (81.3%), and Health Care & Social Assistance (70.2%).
| Industry | Male | Female |
| Agriculture, Fishing & Hunting | 0 (0.0%) | 0 (0.0%) |
| Mining, Quarrying, & Extraction | 0 (0.0%) | 0 (0.0%) |
| Construction | 53 (100.0%) | 0 (0.0%) |
| Manufacturing | 87 (63.5%) | 50 (36.5%) |
| Wholesale Trade | 71 (50.7%) | 69 (49.3%) |
| Retail Trade | 88 (65.2%) | 47 (34.8%) |
| Transportation & Warehousing | 30 (63.8%) | 17 (36.2%) |
| Utilities | 0 (0.0%) | 0 (0.0%) |
| Information | 0 (0.0%) | 46 (100.0%) |
| Finance & Insurance | 104 (47.9%) | 113 (52.1%) |
| Real Estate, Rental & Leasing | 75 (86.2%) | 12 (13.8%) |
| Professional & Scientific | 93 (64.6%) | 51 (35.4%) |
| Enterprise Management | 0 (0.0%) | 0 (0.0%) |
| Administrative & Support | 65 (100.0%) | 0 (0.0%) |
| Educational Services | 61 (18.7%) | 265 (81.3%) |
| Health Care & Social Assistance | 79 (29.8%) | 186 (70.2%) |
| Arts, Entertainment & Recreation | 0 (0.0%) | 0 (0.0%) |
| Accommodation & Food Services | 19 (100.0%) | 0 (0.0%) |
| Public Administration | 33 (50.0%) | 33 (50.0%) |
| Total | 874 (48.5%) | 928 (51.5%) |
Education in Manhasset Hills
School Enrollment in Manhasset Hills
The most common levels of schooling among the 981 students in Manhasset Hills are college / undergraduate (392 | 40.0%), middle school (211 | 21.5%), and elementary school (127 | 13.0%).
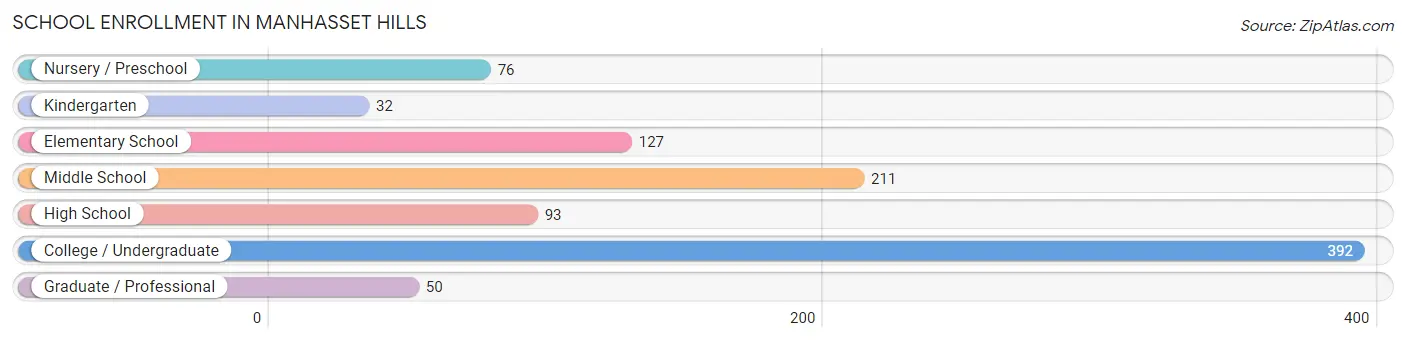
| School Level | # Students | % Students |
| Nursery / Preschool | 76 | 7.7% |
| Kindergarten | 32 | 3.3% |
| Elementary School | 127 | 13.0% |
| Middle School | 211 | 21.5% |
| High School | 93 | 9.5% |
| College / Undergraduate | 392 | 40.0% |
| Graduate / Professional | 50 | 5.1% |
| Total | 981 | 100.0% |
School Enrollment by Age by Funding Source in Manhasset Hills
Out of a total of 981 students who are enrolled in schools in Manhasset Hills, 457 (46.6%) attend a private institution, while the remaining 524 (53.4%) are enrolled in public schools. The age group of 18 to 19 year olds has the highest likelihood of being enrolled in private schools, with 164 (93.7% in the age bracket) enrolled. Conversely, the age group of 5 to 9 year old has the lowest likelihood of being enrolled in a private school, with 159 (100.0% in the age bracket) attending a public institution.
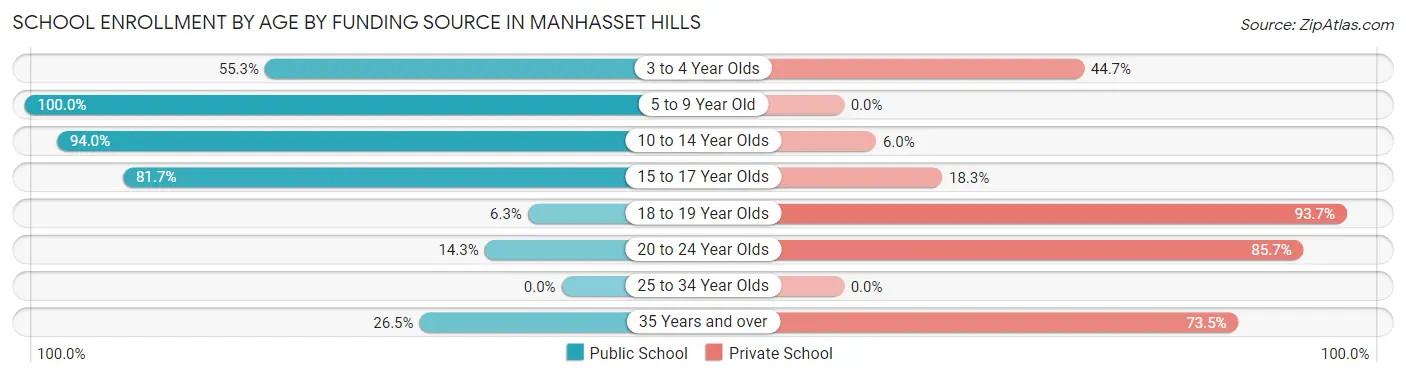
| Age Bracket | Public School | Private School |
| 3 to 4 Year Olds | 42 (55.3%) | 34 (44.7%) |
| 5 to 9 Year Old | 159 (100.0%) | 0 (0.0%) |
| 10 to 14 Year Olds | 219 (94.0%) | 14 (6.0%) |
| 15 to 17 Year Olds | 49 (81.7%) | 11 (18.3%) |
| 18 to 19 Year Olds | 11 (6.3%) | 164 (93.7%) |
| 20 to 24 Year Olds | 35 (14.3%) | 209 (85.7%) |
| 25 to 34 Year Olds | 0 (0.0%) | 0 (0.0%) |
| 35 Years and over | 9 (26.5%) | 25 (73.5%) |
| Total | 524 (53.4%) | 457 (46.6%) |
Educational Attainment by Field of Study in Manhasset Hills
Business (415 | 23.4%), science & technology (252 | 14.2%), engineering (161 | 9.1%), education (139 | 7.9%), and bio, nature & agricultural (138 | 7.8%) are the most common fields of study among 1,771 individuals in Manhasset Hills who have obtained a bachelor's degree or higher.
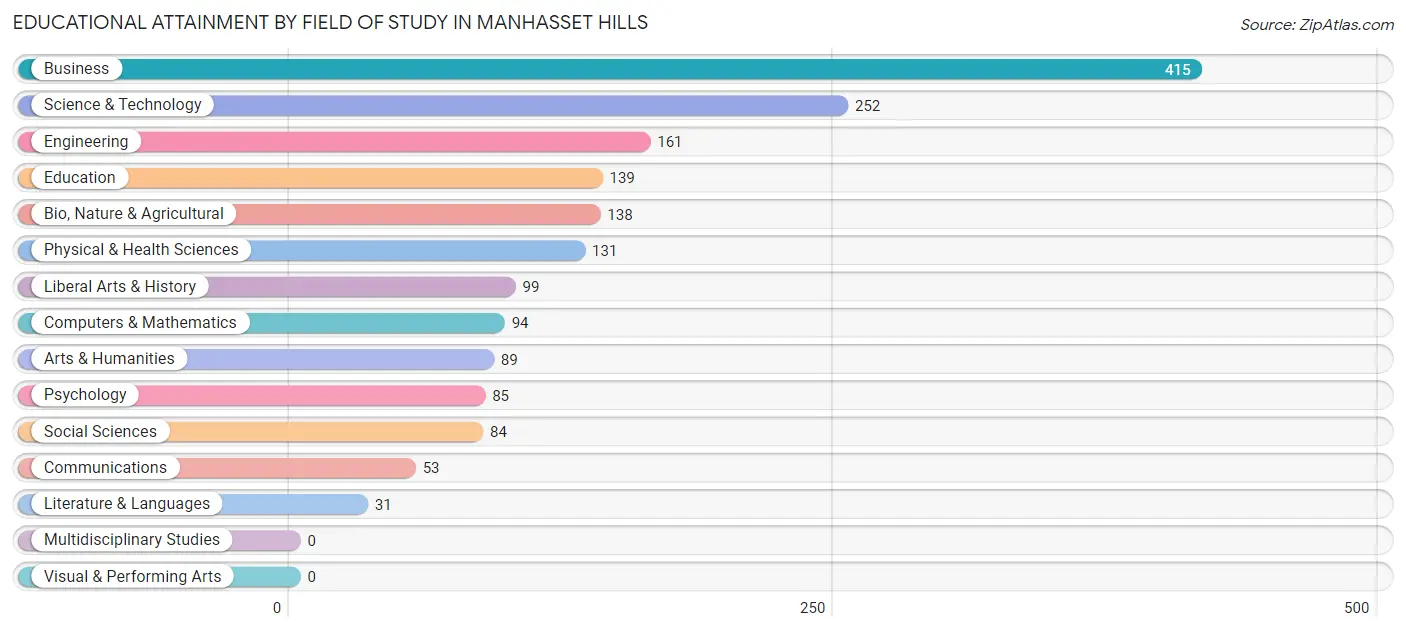
| Field of Study | # Graduates | % Graduates |
| Computers & Mathematics | 94 | 5.3% |
| Bio, Nature & Agricultural | 138 | 7.8% |
| Physical & Health Sciences | 131 | 7.4% |
| Psychology | 85 | 4.8% |
| Social Sciences | 84 | 4.7% |
| Engineering | 161 | 9.1% |
| Multidisciplinary Studies | 0 | 0.0% |
| Science & Technology | 252 | 14.2% |
| Business | 415 | 23.4% |
| Education | 139 | 7.9% |
| Literature & Languages | 31 | 1.8% |
| Liberal Arts & History | 99 | 5.6% |
| Visual & Performing Arts | 0 | 0.0% |
| Communications | 53 | 3.0% |
| Arts & Humanities | 89 | 5.0% |
| Total | 1,771 | 100.0% |
Transportation & Commute in Manhasset Hills
Vehicle Availability by Sex in Manhasset Hills
The most prevalent vehicle ownership categories in Manhasset Hills are males with 2 vehicles (424, accounting for 49.3%) and females with 2 vehicles (391, making up 45.7%).
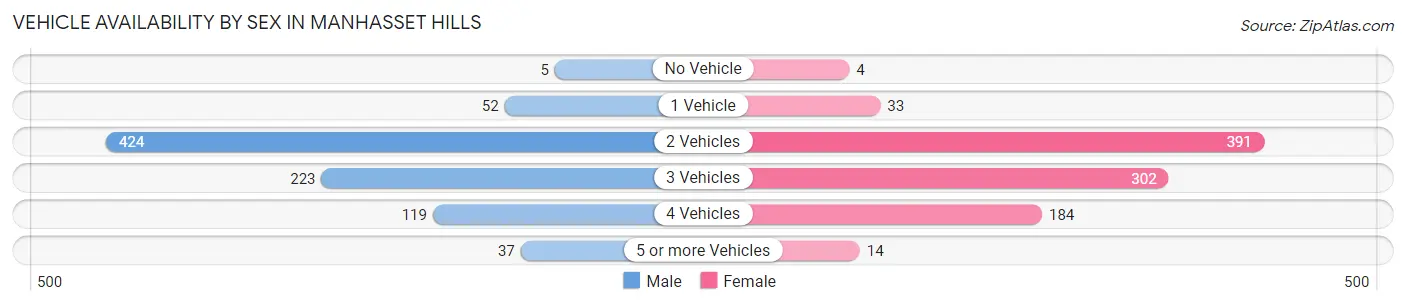
| Vehicles Available | Male | Female |
| No Vehicle | 5 (0.6%) | 4 (0.4%) |
| 1 Vehicle | 52 (6.0%) | 33 (3.6%) |
| 2 Vehicles | 424 (49.3%) | 391 (42.1%) |
| 3 Vehicles | 223 (25.9%) | 302 (32.5%) |
| 4 Vehicles | 119 (13.8%) | 184 (19.8%) |
| 5 or more Vehicles | 37 (4.3%) | 14 (1.5%) |
| Total | 860 (100.0%) | 928 (100.0%) |
Commute Time in Manhasset Hills
The most frequently occuring commute durations in Manhasset Hills are 15 to 19 minutes (391 commuters, 25.1%), 30 to 34 minutes (254 commuters, 16.3%), and 45 to 59 minutes (179 commuters, 11.5%).
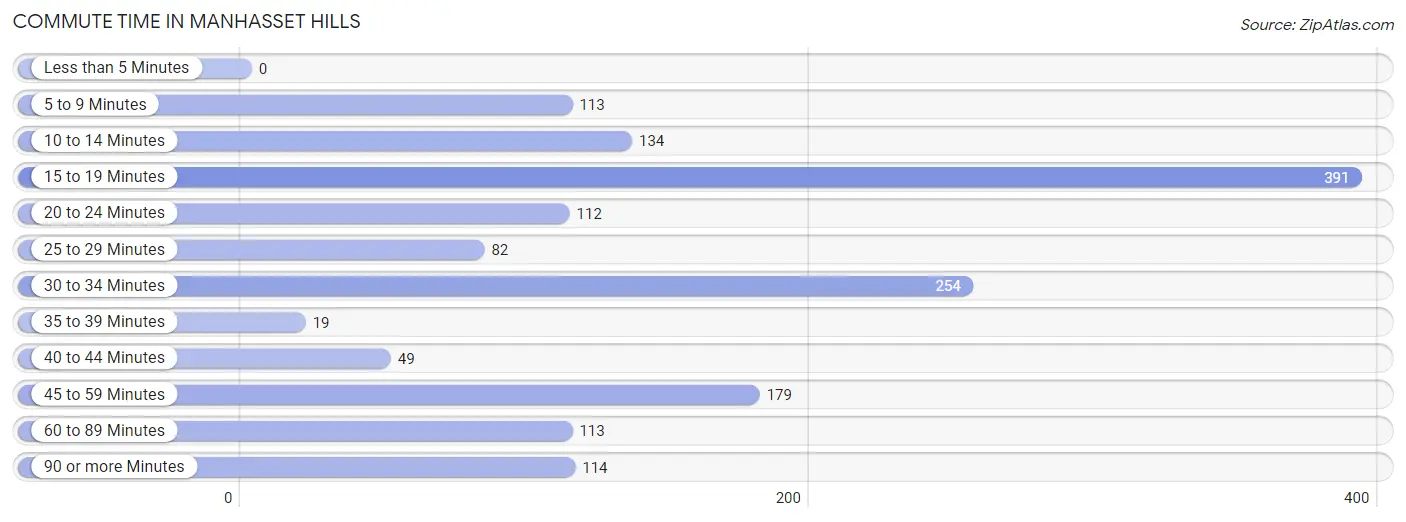
| Commute Time | # Commuters | % Commuters |
| Less than 5 Minutes | 0 | 0.0% |
| 5 to 9 Minutes | 113 | 7.2% |
| 10 to 14 Minutes | 134 | 8.6% |
| 15 to 19 Minutes | 391 | 25.1% |
| 20 to 24 Minutes | 112 | 7.2% |
| 25 to 29 Minutes | 82 | 5.3% |
| 30 to 34 Minutes | 254 | 16.3% |
| 35 to 39 Minutes | 19 | 1.2% |
| 40 to 44 Minutes | 49 | 3.1% |
| 45 to 59 Minutes | 179 | 11.5% |
| 60 to 89 Minutes | 113 | 7.2% |
| 90 or more Minutes | 114 | 7.3% |
Commute Time by Sex in Manhasset Hills
The most common commute times in Manhasset Hills are 30 to 34 minutes (184 commuters, 26.0%) for males and 15 to 19 minutes (323 commuters, 38.0%) for females.
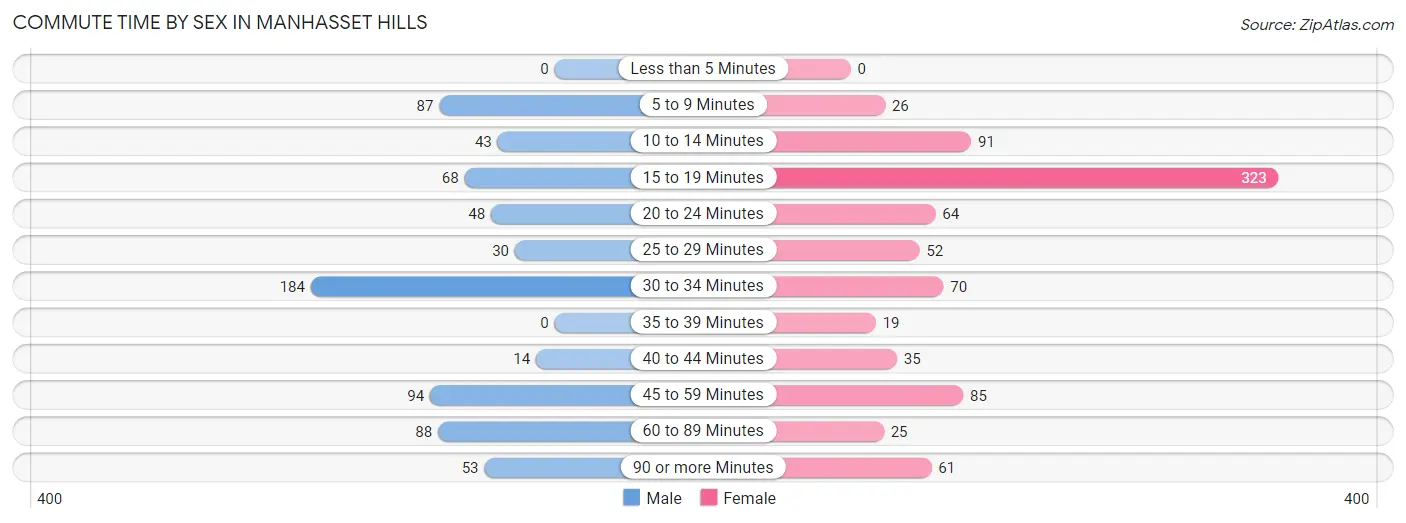
| Commute Time | Male | Female |
| Less than 5 Minutes | 0 (0.0%) | 0 (0.0%) |
| 5 to 9 Minutes | 87 (12.3%) | 26 (3.1%) |
| 10 to 14 Minutes | 43 (6.1%) | 91 (10.7%) |
| 15 to 19 Minutes | 68 (9.6%) | 323 (38.0%) |
| 20 to 24 Minutes | 48 (6.8%) | 64 (7.5%) |
| 25 to 29 Minutes | 30 (4.2%) | 52 (6.1%) |
| 30 to 34 Minutes | 184 (26.0%) | 70 (8.2%) |
| 35 to 39 Minutes | 0 (0.0%) | 19 (2.2%) |
| 40 to 44 Minutes | 14 (2.0%) | 35 (4.1%) |
| 45 to 59 Minutes | 94 (13.3%) | 85 (10.0%) |
| 60 to 89 Minutes | 88 (12.4%) | 25 (2.9%) |
| 90 or more Minutes | 53 (7.5%) | 61 (7.2%) |
Time of Departure to Work by Sex in Manhasset Hills
The most frequent times of departure to work in Manhasset Hills are 9:00 AM to 9:59 AM (176, 24.8%) for males and 9:00 AM to 9:59 AM (173, 20.3%) for females.
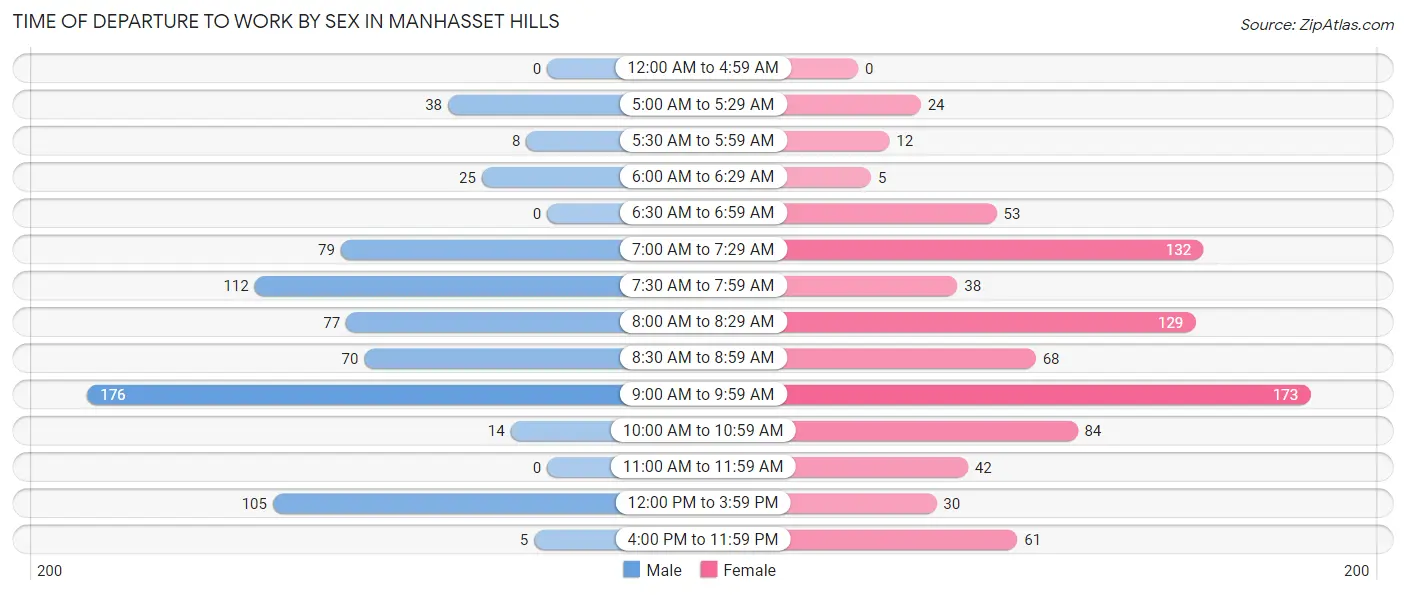
| Time of Departure | Male | Female |
| 12:00 AM to 4:59 AM | 0 (0.0%) | 0 (0.0%) |
| 5:00 AM to 5:29 AM | 38 (5.4%) | 24 (2.8%) |
| 5:30 AM to 5:59 AM | 8 (1.1%) | 12 (1.4%) |
| 6:00 AM to 6:29 AM | 25 (3.5%) | 5 (0.6%) |
| 6:30 AM to 6:59 AM | 0 (0.0%) | 53 (6.2%) |
| 7:00 AM to 7:29 AM | 79 (11.1%) | 132 (15.5%) |
| 7:30 AM to 7:59 AM | 112 (15.8%) | 38 (4.5%) |
| 8:00 AM to 8:29 AM | 77 (10.9%) | 129 (15.2%) |
| 8:30 AM to 8:59 AM | 70 (9.9%) | 68 (8.0%) |
| 9:00 AM to 9:59 AM | 176 (24.8%) | 173 (20.3%) |
| 10:00 AM to 10:59 AM | 14 (2.0%) | 84 (9.9%) |
| 11:00 AM to 11:59 AM | 0 (0.0%) | 42 (4.9%) |
| 12:00 PM to 3:59 PM | 105 (14.8%) | 30 (3.5%) |
| 4:00 PM to 11:59 PM | 5 (0.7%) | 61 (7.2%) |
| Total | 709 (100.0%) | 851 (100.0%) |
Housing Occupancy in Manhasset Hills
Occupancy by Ownership in Manhasset Hills
Of the total 1,176 dwellings in Manhasset Hills, owner-occupied units account for 1,046 (88.9%), while renter-occupied units make up 130 (11.1%).
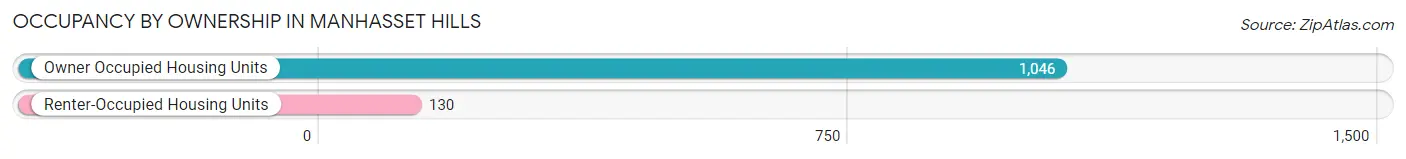
| Occupancy | # Housing Units | % Housing Units |
| Owner Occupied Housing Units | 1,046 | 88.9% |
| Renter-Occupied Housing Units | 130 | 11.1% |
| Total Occupied Housing Units | 1,176 | 100.0% |
Occupancy by Household Size in Manhasset Hills
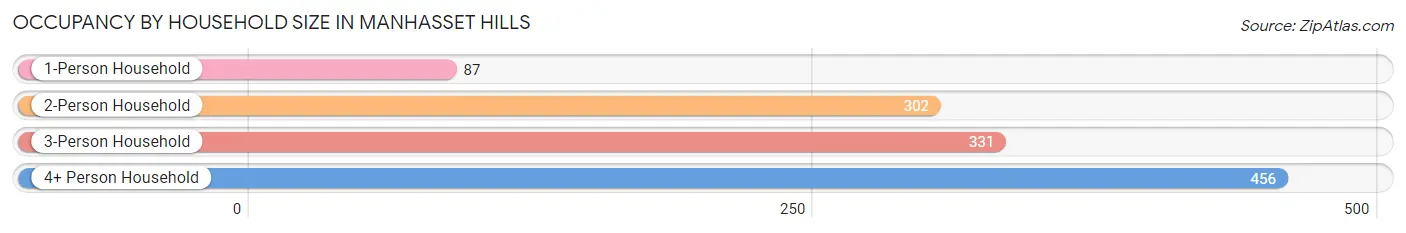
| Household Size | # Housing Units | % Housing Units |
| 1-Person Household | 87 | 7.4% |
| 2-Person Household | 302 | 25.7% |
| 3-Person Household | 331 | 28.1% |
| 4+ Person Household | 456 | 38.8% |
| Total Housing Units | 1,176 | 100.0% |
Occupancy by Ownership by Household Size in Manhasset Hills
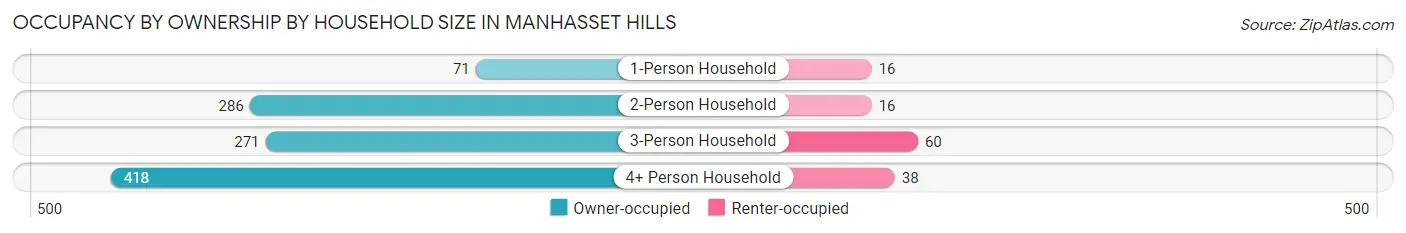
| Household Size | Owner-occupied | Renter-occupied |
| 1-Person Household | 71 (81.6%) | 16 (18.4%) |
| 2-Person Household | 286 (94.7%) | 16 (5.3%) |
| 3-Person Household | 271 (81.9%) | 60 (18.1%) |
| 4+ Person Household | 418 (91.7%) | 38 (8.3%) |
| Total Housing Units | 1,046 (88.9%) | 130 (11.1%) |
Occupancy by Educational Attainment in Manhasset Hills
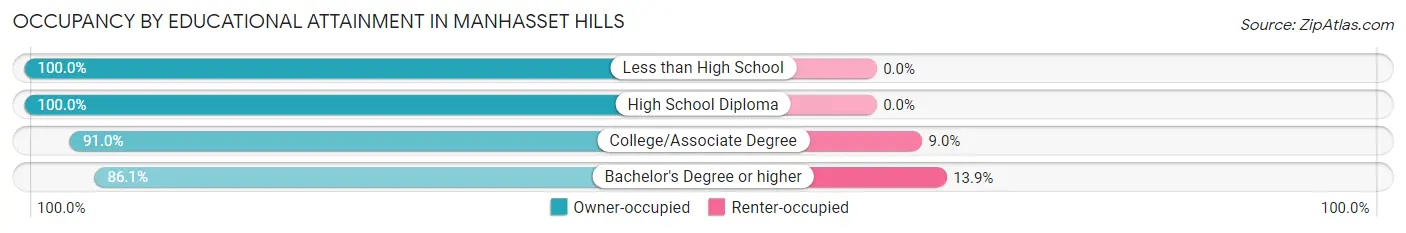
| Household Size | Owner-occupied | Renter-occupied |
| Less than High School | 4 (100.0%) | 0 (0.0%) |
| High School Diploma | 126 (100.0%) | 0 (0.0%) |
| College/Associate Degree | 283 (91.0%) | 28 (9.0%) |
| Bachelor's Degree or higher | 633 (86.1%) | 102 (13.9%) |
Occupancy by Age of Householder in Manhasset Hills
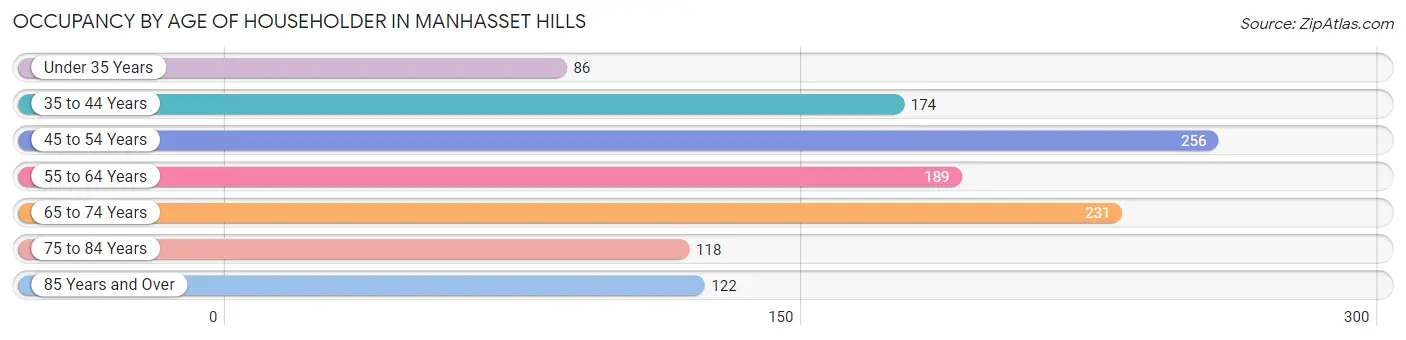
| Age Bracket | # Households | % Households |
| Under 35 Years | 86 | 7.3% |
| 35 to 44 Years | 174 | 14.8% |
| 45 to 54 Years | 256 | 21.8% |
| 55 to 64 Years | 189 | 16.1% |
| 65 to 74 Years | 231 | 19.6% |
| 75 to 84 Years | 118 | 10.0% |
| 85 Years and Over | 122 | 10.4% |
| Total | 1,176 | 100.0% |
Housing Finances in Manhasset Hills
Median Income by Occupancy in Manhasset Hills
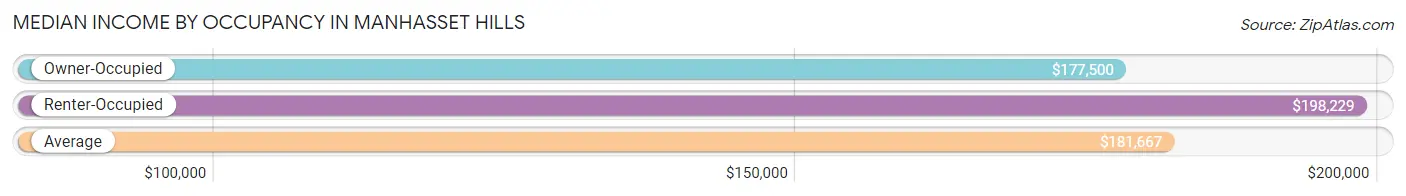
| Occupancy Type | # Households | Median Income |
| Owner-Occupied | 1,046 (88.9%) | $177,500 |
| Renter-Occupied | 130 (11.1%) | $198,229 |
| Average | 1,176 (100.0%) | $181,667 |
Occupancy by Householder Income Bracket in Manhasset Hills
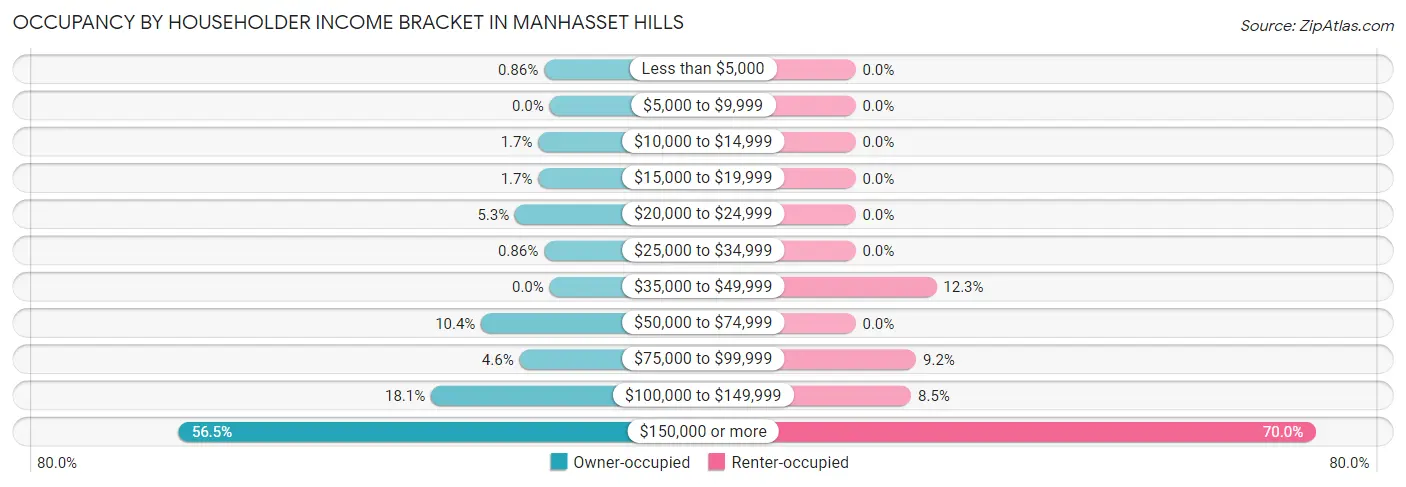
| Income Bracket | Owner-occupied | Renter-occupied |
| Less than $5,000 | 9 (0.9%) | 0 (0.0%) |
| $5,000 to $9,999 | 0 (0.0%) | 0 (0.0%) |
| $10,000 to $14,999 | 18 (1.7%) | 0 (0.0%) |
| $15,000 to $19,999 | 18 (1.7%) | 0 (0.0%) |
| $20,000 to $24,999 | 55 (5.3%) | 0 (0.0%) |
| $25,000 to $34,999 | 9 (0.9%) | 0 (0.0%) |
| $35,000 to $49,999 | 0 (0.0%) | 16 (12.3%) |
| $50,000 to $74,999 | 109 (10.4%) | 0 (0.0%) |
| $75,000 to $99,999 | 48 (4.6%) | 12 (9.2%) |
| $100,000 to $149,999 | 189 (18.1%) | 11 (8.5%) |
| $150,000 or more | 591 (56.5%) | 91 (70.0%) |
| Total | 1,046 (100.0%) | 130 (100.0%) |
Monthly Housing Cost Tiers in Manhasset Hills
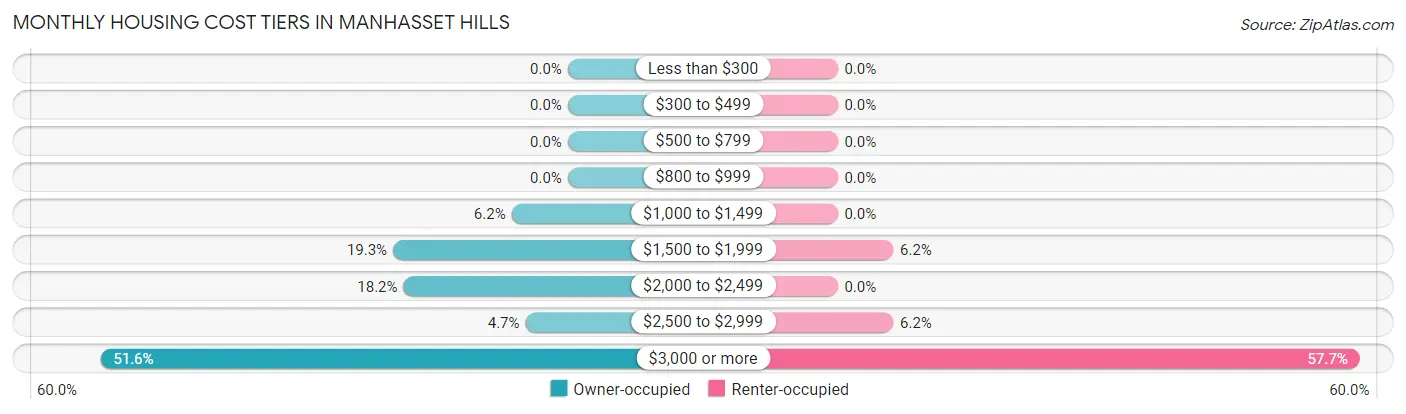
| Monthly Cost | Owner-occupied | Renter-occupied |
| Less than $300 | 0 (0.0%) | 0 (0.0%) |
| $300 to $499 | 0 (0.0%) | 0 (0.0%) |
| $500 to $799 | 0 (0.0%) | 0 (0.0%) |
| $800 to $999 | 0 (0.0%) | 0 (0.0%) |
| $1,000 to $1,499 | 65 (6.2%) | 0 (0.0%) |
| $1,500 to $1,999 | 202 (19.3%) | 8 (6.1%) |
| $2,000 to $2,499 | 190 (18.2%) | 0 (0.0%) |
| $2,500 to $2,999 | 49 (4.7%) | 8 (6.1%) |
| $3,000 or more | 540 (51.6%) | 75 (57.7%) |
| Total | 1,046 (100.0%) | 130 (100.0%) |
Physical Housing Characteristics in Manhasset Hills
Housing Structures in Manhasset Hills
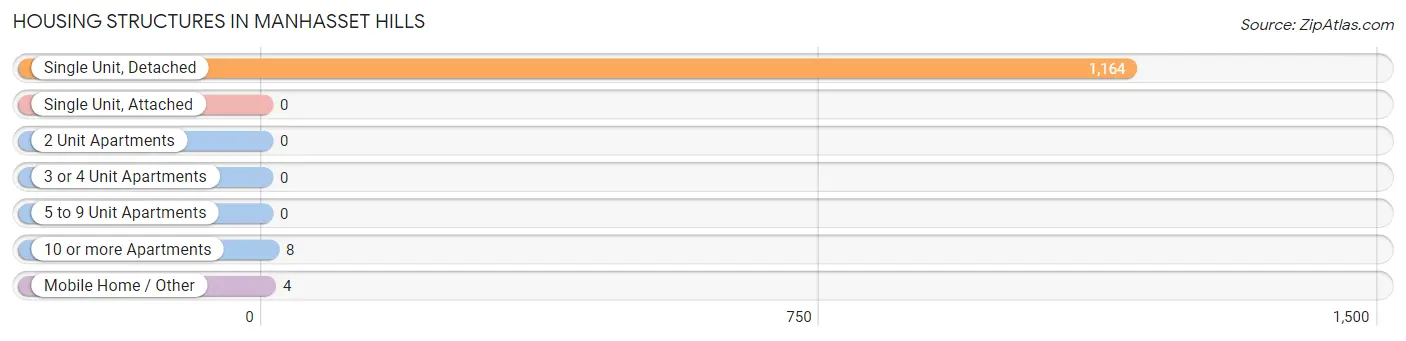
| Structure Type | # Housing Units | % Housing Units |
| Single Unit, Detached | 1,164 | 99.0% |
| Single Unit, Attached | 0 | 0.0% |
| 2 Unit Apartments | 0 | 0.0% |
| 3 or 4 Unit Apartments | 0 | 0.0% |
| 5 to 9 Unit Apartments | 0 | 0.0% |
| 10 or more Apartments | 8 | 0.7% |
| Mobile Home / Other | 4 | 0.3% |
| Total | 1,176 | 100.0% |
Housing Structures by Occupancy in Manhasset Hills
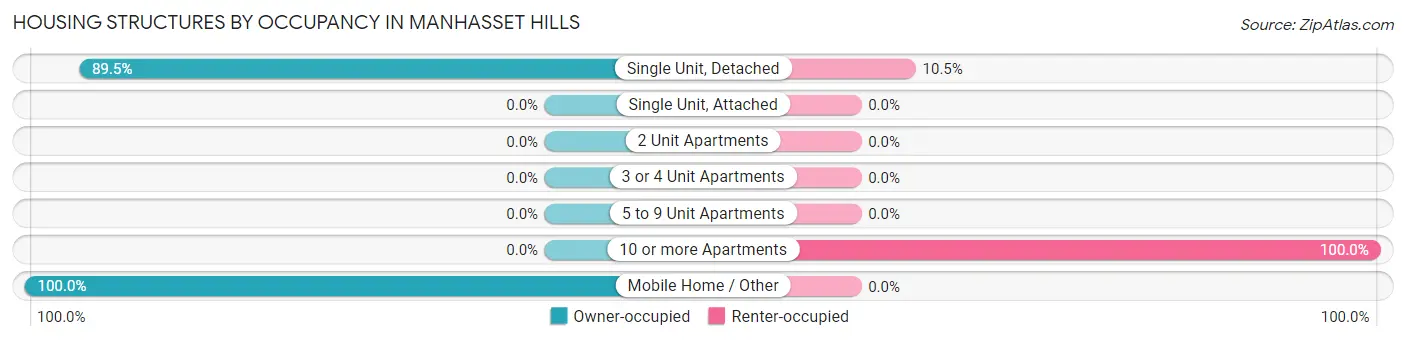
| Structure Type | Owner-occupied | Renter-occupied |
| Single Unit, Detached | 1,042 (89.5%) | 122 (10.5%) |
| Single Unit, Attached | 0 (0.0%) | 0 (0.0%) |
| 2 Unit Apartments | 0 (0.0%) | 0 (0.0%) |
| 3 or 4 Unit Apartments | 0 (0.0%) | 0 (0.0%) |
| 5 to 9 Unit Apartments | 0 (0.0%) | 0 (0.0%) |
| 10 or more Apartments | 0 (0.0%) | 8 (100.0%) |
| Mobile Home / Other | 4 (100.0%) | 0 (0.0%) |
| Total | 1,046 (88.9%) | 130 (11.1%) |
Housing Structures by Number of Rooms in Manhasset Hills
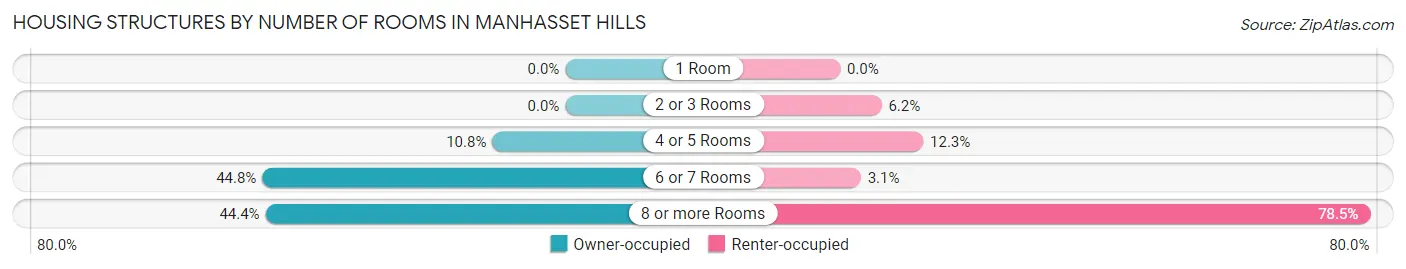
| Number of Rooms | Owner-occupied | Renter-occupied |
| 1 Room | 0 (0.0%) | 0 (0.0%) |
| 2 or 3 Rooms | 0 (0.0%) | 8 (6.1%) |
| 4 or 5 Rooms | 113 (10.8%) | 16 (12.3%) |
| 6 or 7 Rooms | 469 (44.8%) | 4 (3.1%) |
| 8 or more Rooms | 464 (44.4%) | 102 (78.5%) |
| Total | 1,046 (100.0%) | 130 (100.0%) |
Housing Structure by Heating Type in Manhasset Hills
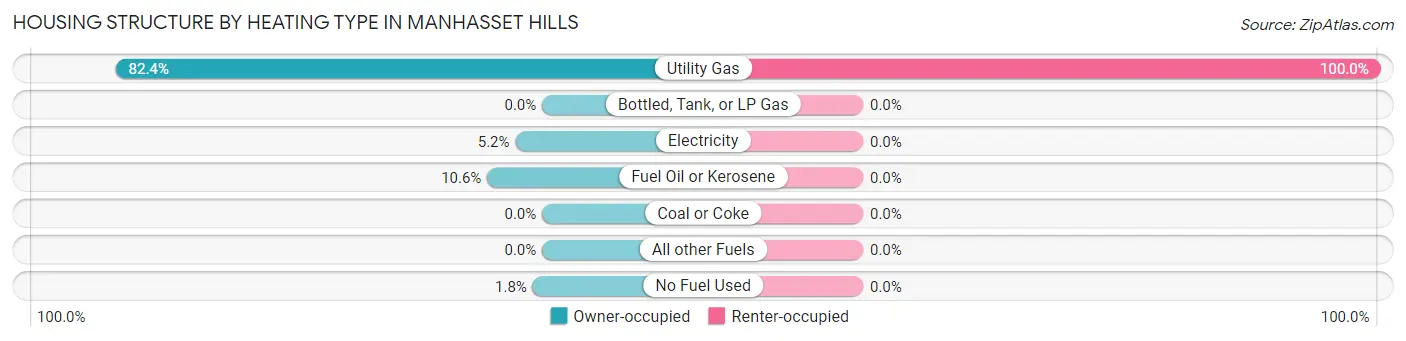
| Heating Type | Owner-occupied | Renter-occupied |
| Utility Gas | 862 (82.4%) | 130 (100.0%) |
| Bottled, Tank, or LP Gas | 0 (0.0%) | 0 (0.0%) |
| Electricity | 54 (5.2%) | 0 (0.0%) |
| Fuel Oil or Kerosene | 111 (10.6%) | 0 (0.0%) |
| Coal or Coke | 0 (0.0%) | 0 (0.0%) |
| All other Fuels | 0 (0.0%) | 0 (0.0%) |
| No Fuel Used | 19 (1.8%) | 0 (0.0%) |
| Total | 1,046 (100.0%) | 130 (100.0%) |
Household Vehicle Usage in Manhasset Hills
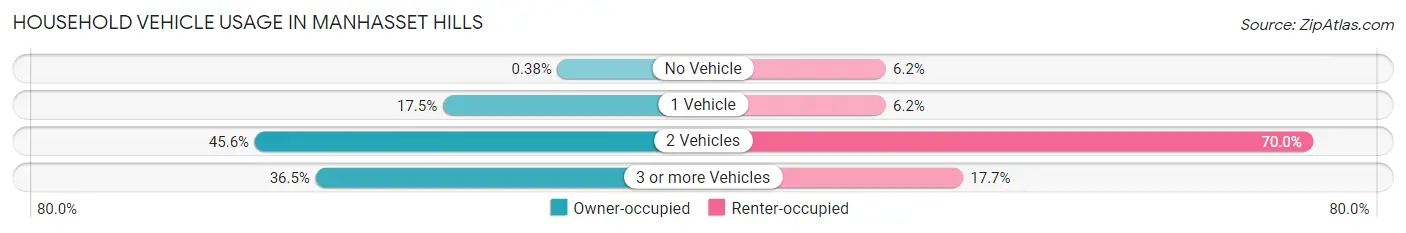
| Vehicles per Household | Owner-occupied | Renter-occupied |
| No Vehicle | 4 (0.4%) | 8 (6.1%) |
| 1 Vehicle | 183 (17.5%) | 8 (6.1%) |
| 2 Vehicles | 477 (45.6%) | 91 (70.0%) |
| 3 or more Vehicles | 382 (36.5%) | 23 (17.7%) |
| Total | 1,046 (100.0%) | 130 (100.0%) |
Real Estate & Mortgages in Manhasset Hills
Real Estate and Mortgage Overview in Manhasset Hills
| Characteristic | Without Mortgage | With Mortgage |
| Housing Units | 456 | 590 |
| Median Property Value | $924,800 | $998,900 |
| Median Household Income | $185,526 | $333 |
| Monthly Housing Costs | $1,501 | $532 |
| Real Estate Taxes | $10,001 | $0 |
Property Value by Mortgage Status in Manhasset Hills
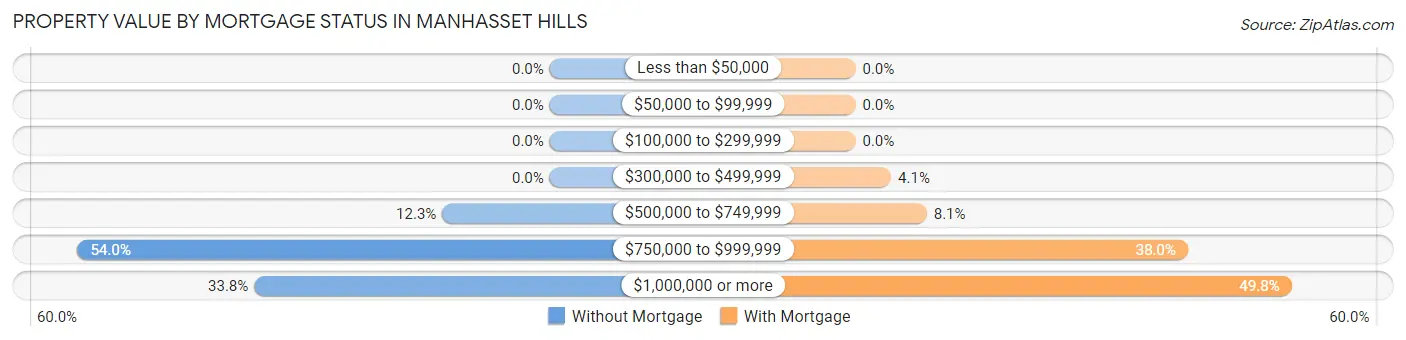
| Property Value | Without Mortgage | With Mortgage |
| Less than $50,000 | 0 (0.0%) | 0 (0.0%) |
| $50,000 to $99,999 | 0 (0.0%) | 0 (0.0%) |
| $100,000 to $299,999 | 0 (0.0%) | 0 (0.0%) |
| $300,000 to $499,999 | 0 (0.0%) | 24 (4.1%) |
| $500,000 to $749,999 | 56 (12.3%) | 48 (8.1%) |
| $750,000 to $999,999 | 246 (53.9%) | 224 (38.0%) |
| $1,000,000 or more | 154 (33.8%) | 294 (49.8%) |
| Total | 456 (100.0%) | 590 (100.0%) |
Household Income by Mortgage Status in Manhasset Hills
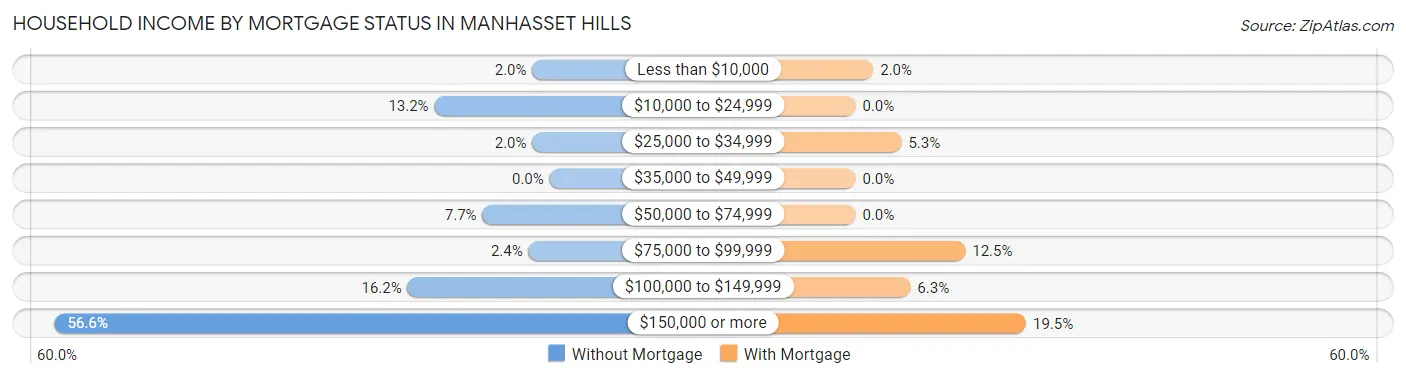
| Household Income | Without Mortgage | With Mortgage |
| Less than $10,000 | 9 (2.0%) | 12 (2.0%) |
| $10,000 to $24,999 | 60 (13.2%) | 0 (0.0%) |
| $25,000 to $34,999 | 9 (2.0%) | 31 (5.2%) |
| $35,000 to $49,999 | 0 (0.0%) | 0 (0.0%) |
| $50,000 to $74,999 | 35 (7.7%) | 0 (0.0%) |
| $75,000 to $99,999 | 11 (2.4%) | 74 (12.5%) |
| $100,000 to $149,999 | 74 (16.2%) | 37 (6.3%) |
| $150,000 or more | 258 (56.6%) | 115 (19.5%) |
| Total | 456 (100.0%) | 590 (100.0%) |
Property Value to Household Income Ratio in Manhasset Hills
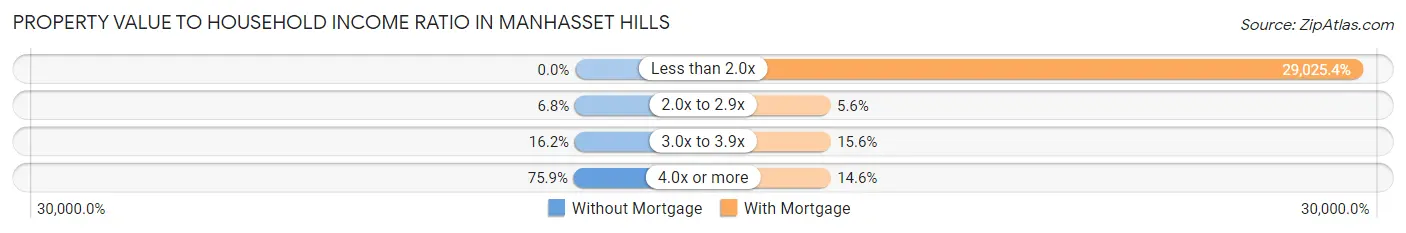
| Value-to-Income Ratio | Without Mortgage | With Mortgage |
| Less than 2.0x | 0 (0.0%) | 171,250 (29,025.4%) |
| 2.0x to 2.9x | 31 (6.8%) | 33 (5.6%) |
| 3.0x to 3.9x | 74 (16.2%) | 92 (15.6%) |
| 4.0x or more | 346 (75.9%) | 86 (14.6%) |
| Total | 456 (100.0%) | 590 (100.0%) |
Real Estate Taxes by Mortgage Status in Manhasset Hills
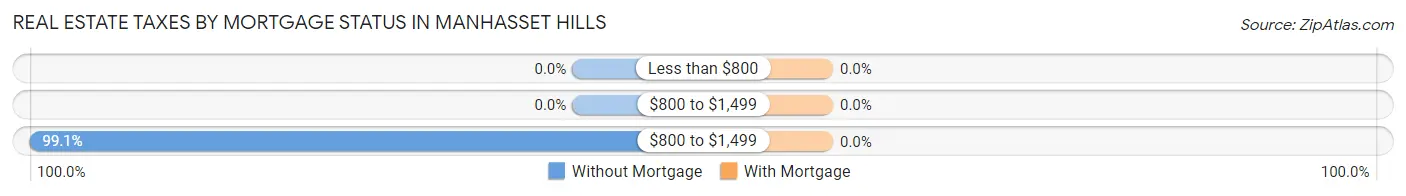
| Property Taxes | Without Mortgage | With Mortgage |
| Less than $800 | 0 (0.0%) | 0 (0.0%) |
| $800 to $1,499 | 0 (0.0%) | 0 (0.0%) |
| $800 to $1,499 | 452 (99.1%) | 0 (0.0%) |
| Total | 456 (100.0%) | 590 (100.0%) |
Health & Disability in Manhasset Hills
Health Insurance Coverage by Age in Manhasset Hills
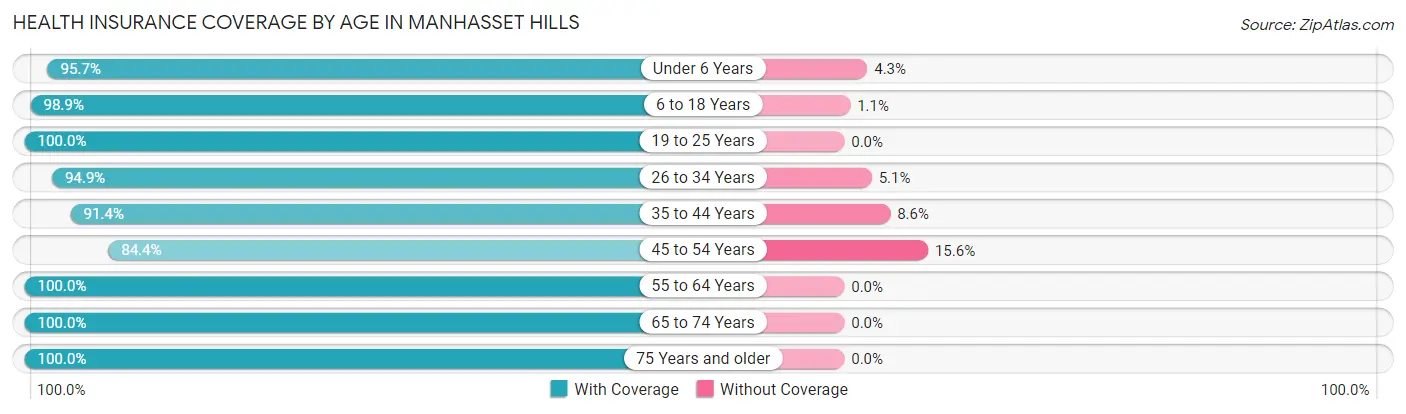
| Age Bracket | With Coverage | Without Coverage |
| Under 6 Years | 201 (95.7%) | 9 (4.3%) |
| 6 to 18 Years | 624 (98.9%) | 7 (1.1%) |
| 19 to 25 Years | 393 (100.0%) | 0 (0.0%) |
| 26 to 34 Years | 260 (94.9%) | 14 (5.1%) |
| 35 to 44 Years | 491 (91.4%) | 46 (8.6%) |
| 45 to 54 Years | 411 (84.4%) | 76 (15.6%) |
| 55 to 64 Years | 546 (100.0%) | 0 (0.0%) |
| 65 to 74 Years | 410 (100.0%) | 0 (0.0%) |
| 75 Years and older | 416 (100.0%) | 0 (0.0%) |
| Total | 3,752 (96.1%) | 152 (3.9%) |
Health Insurance Coverage by Citizenship Status in Manhasset Hills
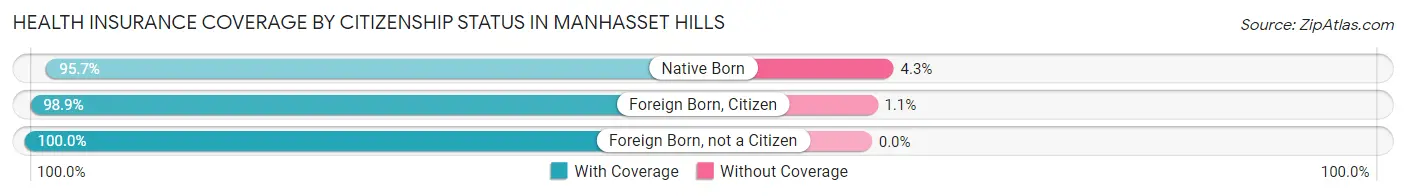
| Citizenship Status | With Coverage | Without Coverage |
| Native Born | 201 (95.7%) | 9 (4.3%) |
| Foreign Born, Citizen | 624 (98.9%) | 7 (1.1%) |
| Foreign Born, not a Citizen | 393 (100.0%) | 0 (0.0%) |
Health Insurance Coverage by Household Income in Manhasset Hills
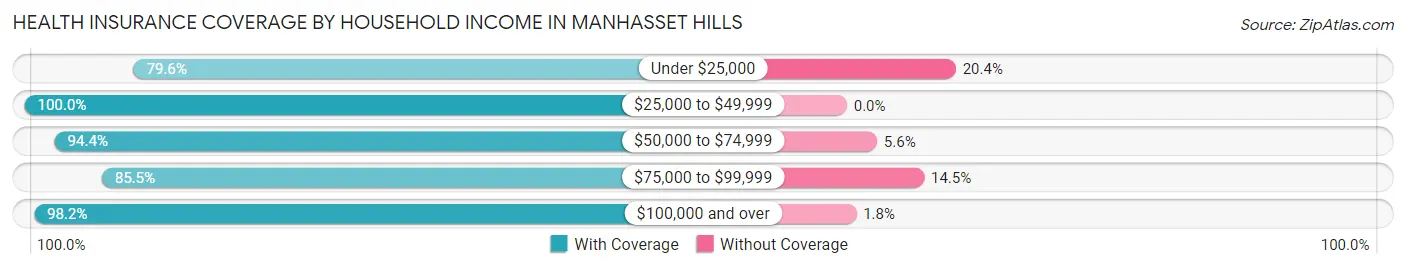
| Household Income | With Coverage | Without Coverage |
| Under $25,000 | 195 (79.6%) | 50 (20.4%) |
| $25,000 to $49,999 | 41 (100.0%) | 0 (0.0%) |
| $50,000 to $74,999 | 435 (94.4%) | 26 (5.6%) |
| $75,000 to $99,999 | 136 (85.5%) | 23 (14.5%) |
| $100,000 and over | 2,945 (98.2%) | 53 (1.8%) |
Public vs Private Health Insurance Coverage by Age in Manhasset Hills
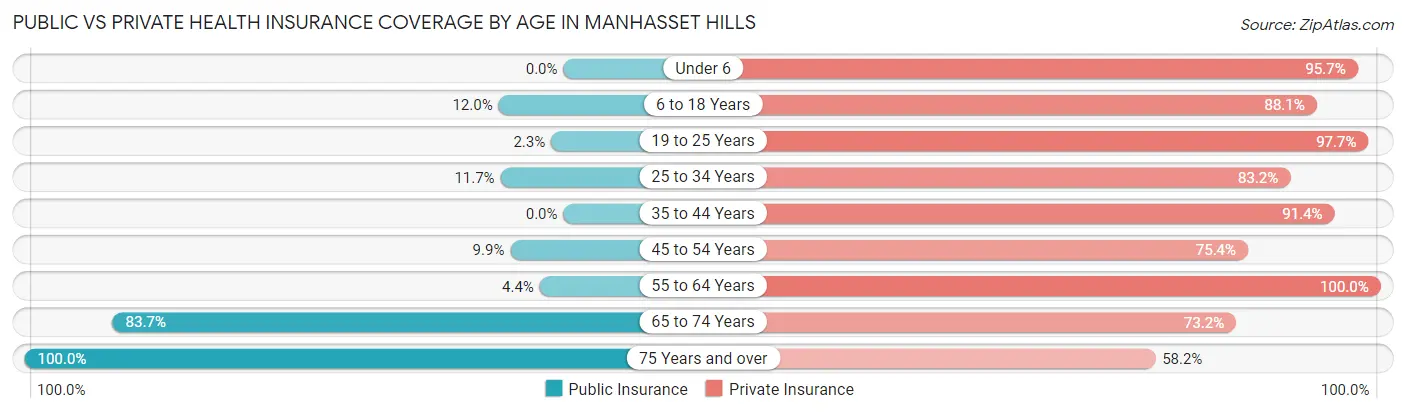
| Age Bracket | Public Insurance | Private Insurance |
| Under 6 | 0 (0.0%) | 201 (95.7%) |
| 6 to 18 Years | 76 (12.0%) | 556 (88.1%) |
| 19 to 25 Years | 9 (2.3%) | 384 (97.7%) |
| 25 to 34 Years | 32 (11.7%) | 228 (83.2%) |
| 35 to 44 Years | 0 (0.0%) | 491 (91.4%) |
| 45 to 54 Years | 48 (9.9%) | 367 (75.4%) |
| 55 to 64 Years | 24 (4.4%) | 546 (100.0%) |
| 65 to 74 Years | 343 (83.7%) | 300 (73.2%) |
| 75 Years and over | 416 (100.0%) | 242 (58.2%) |
| Total | 948 (24.3%) | 3,315 (84.9%) |
Disability Status by Sex by Age in Manhasset Hills
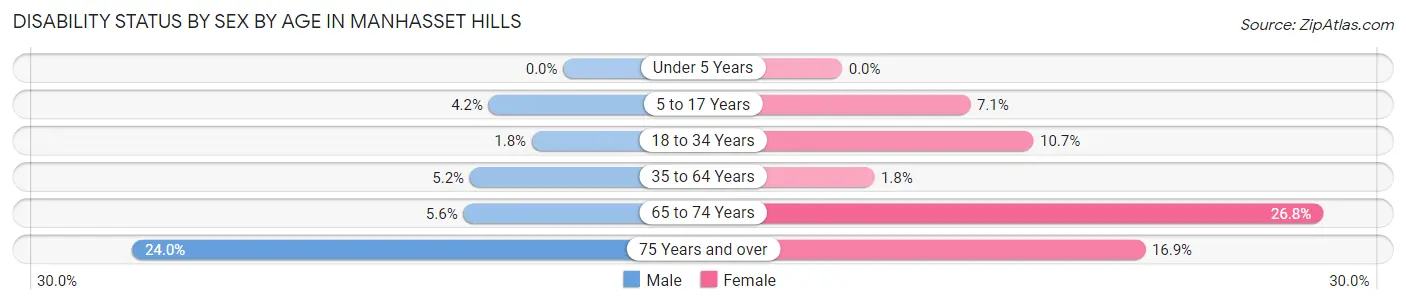
| Age Bracket | Male | Female |
| Under 5 Years | 0 (0.0%) | 0 (0.0%) |
| 5 to 17 Years | 9 (4.2%) | 19 (7.1%) |
| 18 to 34 Years | 9 (1.8%) | 33 (10.6%) |
| 35 to 64 Years | 41 (5.2%) | 14 (1.8%) |
| 65 to 74 Years | 12 (5.6%) | 52 (26.8%) |
| 75 Years and over | 43 (24.0%) | 40 (16.9%) |
Disability Class by Sex by Age in Manhasset Hills
Disability Class: Hearing Difficulty
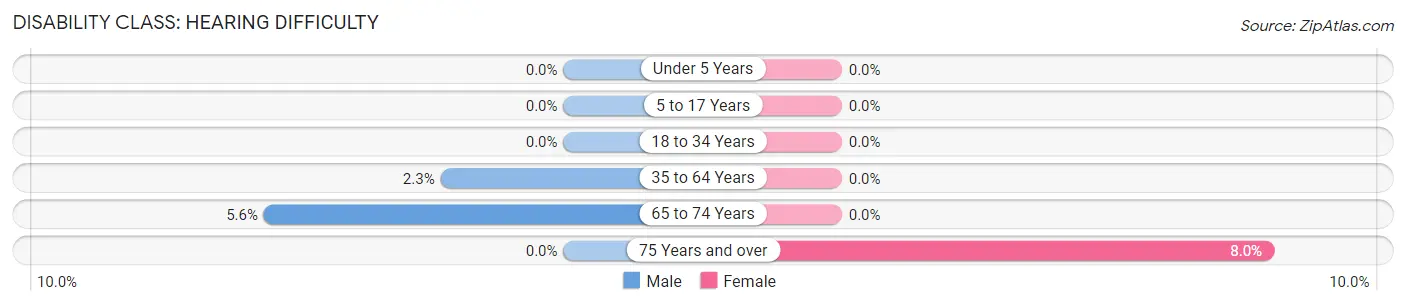
| Age Bracket | Male | Female |
| Under 5 Years | 0 (0.0%) | 0 (0.0%) |
| 5 to 17 Years | 0 (0.0%) | 0 (0.0%) |
| 18 to 34 Years | 0 (0.0%) | 0 (0.0%) |
| 35 to 64 Years | 18 (2.3%) | 0 (0.0%) |
| 65 to 74 Years | 12 (5.6%) | 0 (0.0%) |
| 75 Years and over | 0 (0.0%) | 19 (8.0%) |
Disability Class: Vision Difficulty
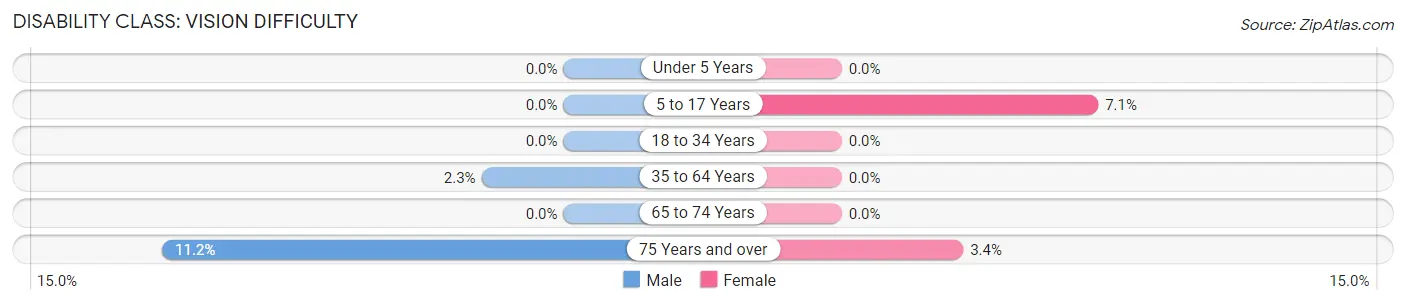
| Age Bracket | Male | Female |
| Under 5 Years | 0 (0.0%) | 0 (0.0%) |
| 5 to 17 Years | 0 (0.0%) | 19 (7.1%) |
| 18 to 34 Years | 0 (0.0%) | 0 (0.0%) |
| 35 to 64 Years | 18 (2.3%) | 0 (0.0%) |
| 65 to 74 Years | 0 (0.0%) | 0 (0.0%) |
| 75 Years and over | 20 (11.2%) | 8 (3.4%) |
Disability Class: Cognitive Difficulty
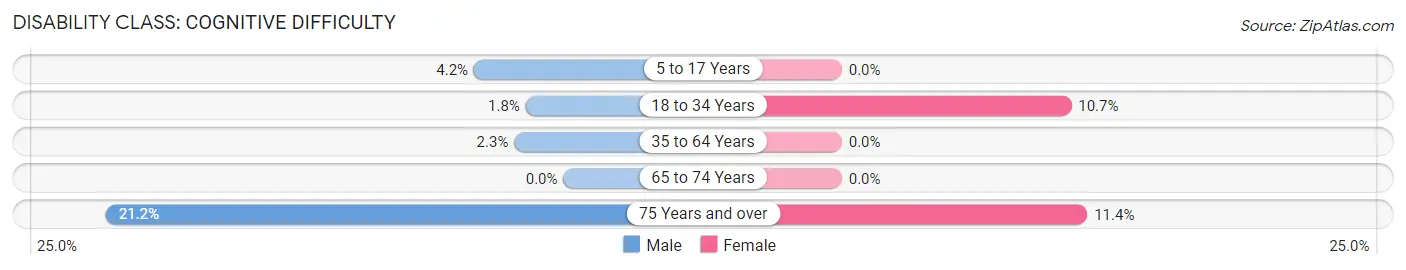
| Age Bracket | Male | Female |
| 5 to 17 Years | 9 (4.2%) | 0 (0.0%) |
| 18 to 34 Years | 9 (1.8%) | 33 (10.6%) |
| 35 to 64 Years | 18 (2.3%) | 0 (0.0%) |
| 65 to 74 Years | 0 (0.0%) | 0 (0.0%) |
| 75 Years and over | 38 (21.2%) | 27 (11.4%) |
Disability Class: Ambulatory Difficulty
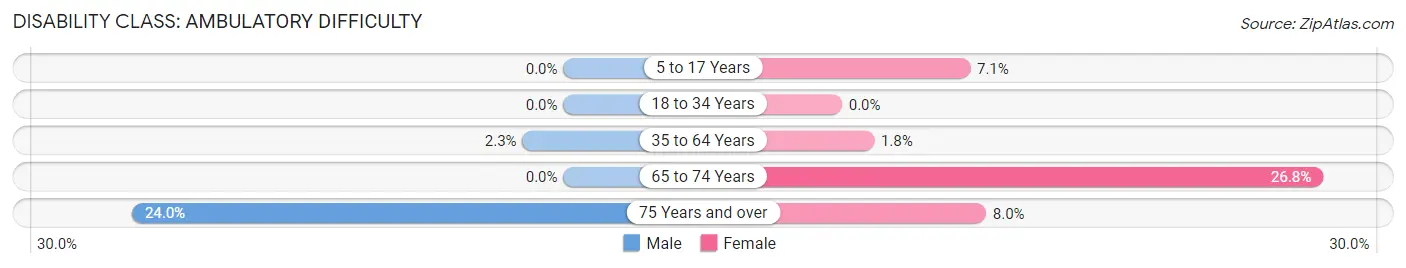
| Age Bracket | Male | Female |
| 5 to 17 Years | 0 (0.0%) | 19 (7.1%) |
| 18 to 34 Years | 0 (0.0%) | 0 (0.0%) |
| 35 to 64 Years | 18 (2.3%) | 14 (1.8%) |
| 65 to 74 Years | 0 (0.0%) | 52 (26.8%) |
| 75 Years and over | 43 (24.0%) | 19 (8.0%) |
Disability Class: Self-Care Difficulty
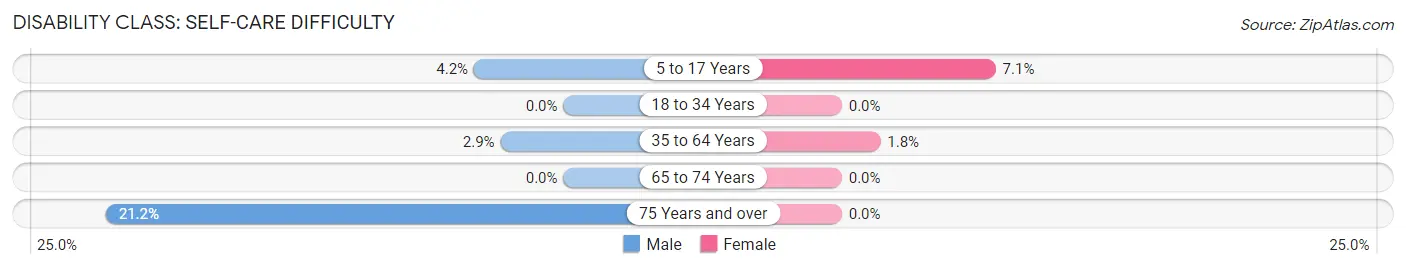
| Age Bracket | Male | Female |
| 5 to 17 Years | 9 (4.2%) | 19 (7.1%) |
| 18 to 34 Years | 0 (0.0%) | 0 (0.0%) |
| 35 to 64 Years | 23 (2.9%) | 14 (1.8%) |
| 65 to 74 Years | 0 (0.0%) | 0 (0.0%) |
| 75 Years and over | 38 (21.2%) | 0 (0.0%) |
Technology Access in Manhasset Hills
Computing Device Access in Manhasset Hills
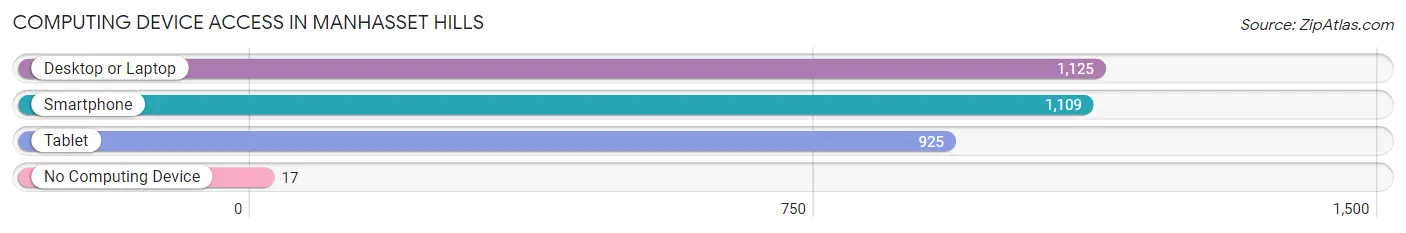
| Device Type | # Households | % Households |
| Desktop or Laptop | 1,125 | 95.7% |
| Smartphone | 1,109 | 94.3% |
| Tablet | 925 | 78.7% |
| No Computing Device | 17 | 1.5% |
| Total | 1,176 | 100.0% |
Internet Access in Manhasset Hills
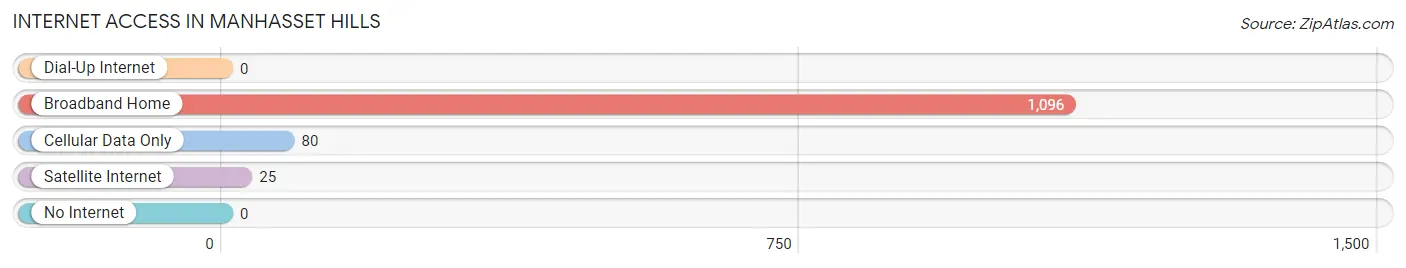
| Internet Type | # Households | % Households |
| Dial-Up Internet | 0 | 0.0% |
| Broadband Home | 1,096 | 93.2% |
| Cellular Data Only | 80 | 6.8% |
| Satellite Internet | 25 | 2.1% |
| No Internet | 0 | 0.0% |
| Total | 1,176 | 100.0% |
Manhasset Hills Summary
Manhasset Hills is a hamlet located in the Town of North Hempstead in Nassau County, New York. It is situated on the north shore of Long Island, approximately 18 miles east of Manhattan. The hamlet is bordered by the villages of Great Neck and Plandome, and the hamlet of Plandome Heights. As of the 2010 census, the population of Manhasset Hills was 5,050.
History
The area that is now Manhasset Hills was originally inhabited by the Matinecock Native American tribe. The first European settlers arrived in the area in the late 1600s, and the hamlet was officially established in 1730. The hamlet was originally known as “Cow Neck”, and was renamed “Manhasset Hills” in 1845.
The hamlet was primarily a farming community until the late 19th century, when it began to develop into a residential area. The first railroad station in Manhasset Hills was built in 1868, and the hamlet was connected to the Long Island Rail Road in 1872. This allowed for easy access to New York City, and the population of Manhasset Hills began to grow rapidly.
In the early 20th century, Manhasset Hills became a popular summer destination for wealthy New Yorkers. Many of the grand estates that were built during this time still stand today.
Geography
Manhasset Hills is located at 40°48'17" North, 73°41'17" West (40.804722, -73.688056). It is situated on the north shore of Long Island, approximately 18 miles east of Manhattan. The hamlet is bordered by the villages of Great Neck and Plandome, and the hamlet of Plandome Heights.
The total area of Manhasset Hills is 1.3 square miles, all of which is land. The hamlet is located on a ridge of hills, which gives it its name. The highest point in Manhasset Hills is the summit of Manhasset Hill, which is approximately 200 feet above sea level.
Economy
The economy of Manhasset Hills is primarily based on retail and services. The hamlet is home to several shopping centers, including the Manhasset Hills Shopping Center and the Manhasset Hills Plaza. There are also several restaurants and bars in the area.
The hamlet is also home to several corporate offices, including the headquarters of the North Shore-LIJ Health System and the North Shore-LIJ Medical Group.
Demographics
As of the 2010 census, the population of Manhasset Hills was 5,050. The racial makeup of the hamlet was 79.2% White, 8.2% Asian, 6.7% African American, and 5.9% Hispanic or Latino.
The median household income in Manhasset Hills was $117,917, and the median family income was $133,917. The per capita income was $50,917.
The population of Manhasset Hills is well-educated, with 92.2% of the population over the age of 25 having a high school diploma or higher, and 63.2% having a bachelor’s degree or higher.
Common Questions
What is Per Capita Income in Manhasset Hills?
Per Capita income in Manhasset Hills is $59,061.
What is the Median Family Income in Manhasset Hills?
Median Family Income in Manhasset Hills is $189,479.
What is the Median Household income in Manhasset Hills?
Median Household Income in Manhasset Hills is $181,667.
What is Income or Wage Gap in Manhasset Hills?
Income or Wage Gap in Manhasset Hills is 1.7%.
Women in Manhasset Hills earn 98.3 cents for every dollar earned by a man.
What is Inequality or Gini Index in Manhasset Hills?
Inequality or Gini Index in Manhasset Hills is 0.38.
What is the Total Population of Manhasset Hills?
Total Population of Manhasset Hills is 3,904.
What is the Total Male Population of Manhasset Hills?
Total Male Population of Manhasset Hills is 2,061.
What is the Total Female Population of Manhasset Hills?
Total Female Population of Manhasset Hills is 1,843.
What is the Ratio of Males per 100 Females in Manhasset Hills?
There are 111.83 Males per 100 Females in Manhasset Hills.
What is the Ratio of Females per 100 Males in Manhasset Hills?
There are 89.42 Females per 100 Males in Manhasset Hills.
What is the Median Population Age in Manhasset Hills?
Median Population Age in Manhasset Hills is 43.0 Years.
What is the Average Family Size in Manhasset Hills
Average Family Size in Manhasset Hills is 3.5 People.
What is the Average Household Size in Manhasset Hills
Average Household Size in Manhasset Hills is 3.3 People.
How Large is the Labor Force in Manhasset Hills?
There are 1,848 People in the Labor Forcein in Manhasset Hills.
What is the Percentage of People in the Labor Force in Manhasset Hills?
56.9% of People are in the Labor Force in Manhasset Hills.
What is the Unemployment Rate in Manhasset Hills?
Unemployment Rate in Manhasset Hills is 2.5%.