Hampton Manor, NY Map & Demographics
Hampton Manor Map
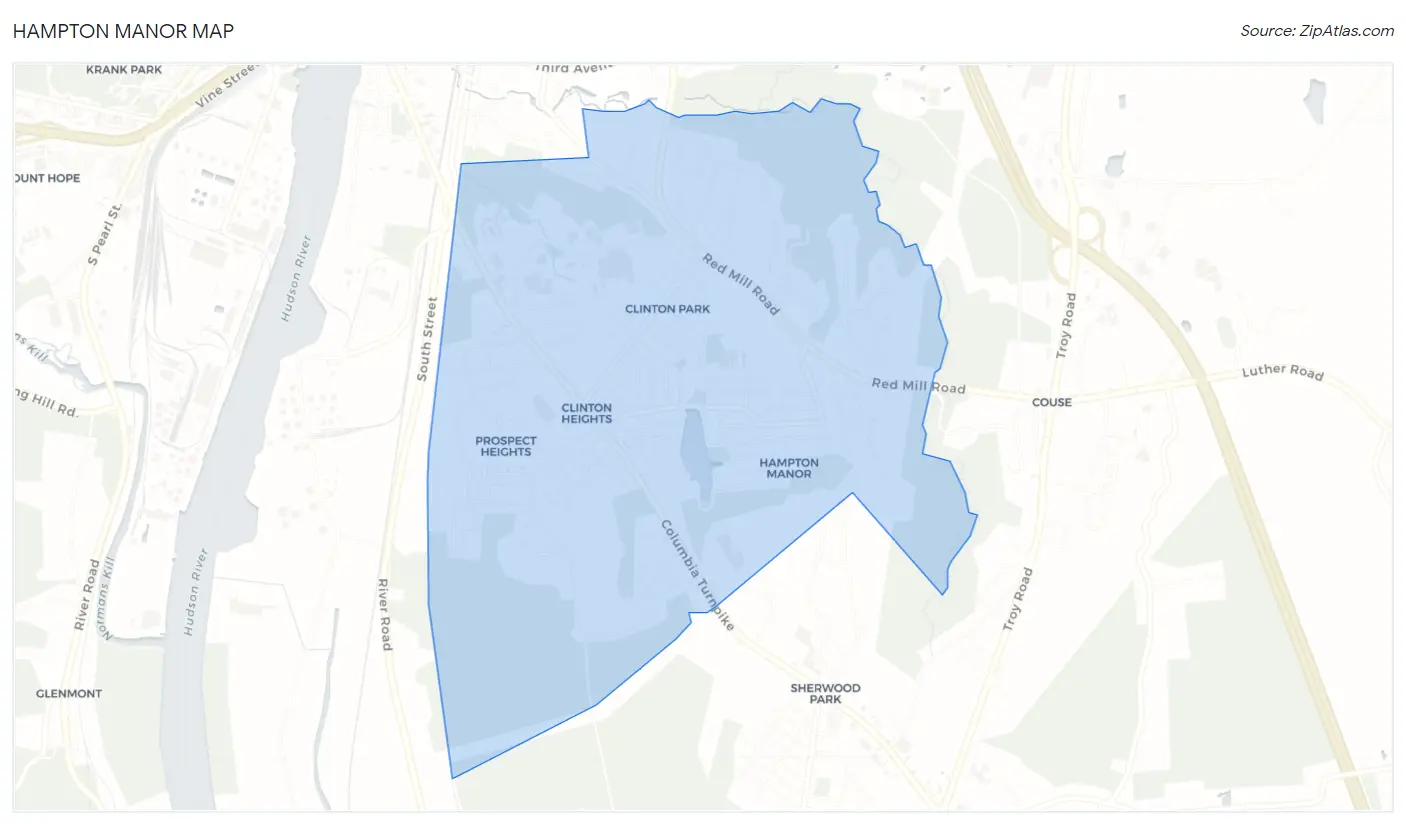
Hampton Manor Overview
$45,474
PER CAPITA INCOME
$127,798
AVG FAMILY INCOME
$104,211
AVG HOUSEHOLD INCOME
13.0%
WAGE / INCOME GAP [ % ]
87.0¢/ $1
WAGE / INCOME GAP [ $ ]
0.32
INEQUALITY / GINI INDEX
5,344
TOTAL POPULATION
2,634
MALE POPULATION
2,710
FEMALE POPULATION
97.20
MALES / 100 FEMALES
102.89
FEMALES / 100 MALES
44.8
MEDIAN AGE
3.0
AVG FAMILY SIZE
2.5
AVG HOUSEHOLD SIZE
3,321
LABOR FORCE [ PEOPLE ]
70.9%
PERCENT IN LABOR FORCE
3.2%
UNEMPLOYMENT RATE
Income in Hampton Manor
Income Overview in Hampton Manor
Per Capita Income in Hampton Manor is $45,474, while median incomes of families and households are $127,798 and $104,211 respectively.
| Characteristic | Number | Measure |
| Per Capita Income | 5,344 | $45,474 |
| Median Family Income | 1,395 | $127,798 |
| Mean Family Income | 1,395 | $126,666 |
| Median Household Income | 2,152 | $104,211 |
| Mean Household Income | 2,152 | $108,917 |
| Income Deficit | 1,395 | $0 |
| Wage / Income Gap (%) | 5,344 | 12.96% |
| Wage / Income Gap ($) | 5,344 | 87.04¢ per $1 |
| Gini / Inequality Index | 5,344 | 0.32 |
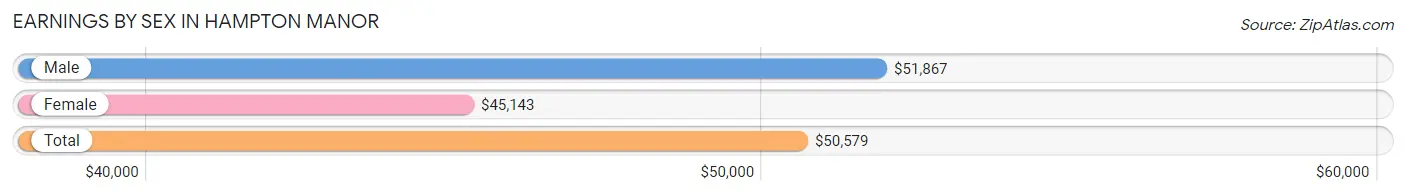
Earnings by Sex in Hampton Manor
Average Earnings in Hampton Manor are $50,579, $51,867 for men and $45,143 for women, a difference of 13.0%.
| Sex | Number | Average Earnings |
| Male | 1,628 (47.0%) | $51,867 |
| Female | 1,838 (53.0%) | $45,143 |
| Total | 3,466 (100.0%) | $50,579 |
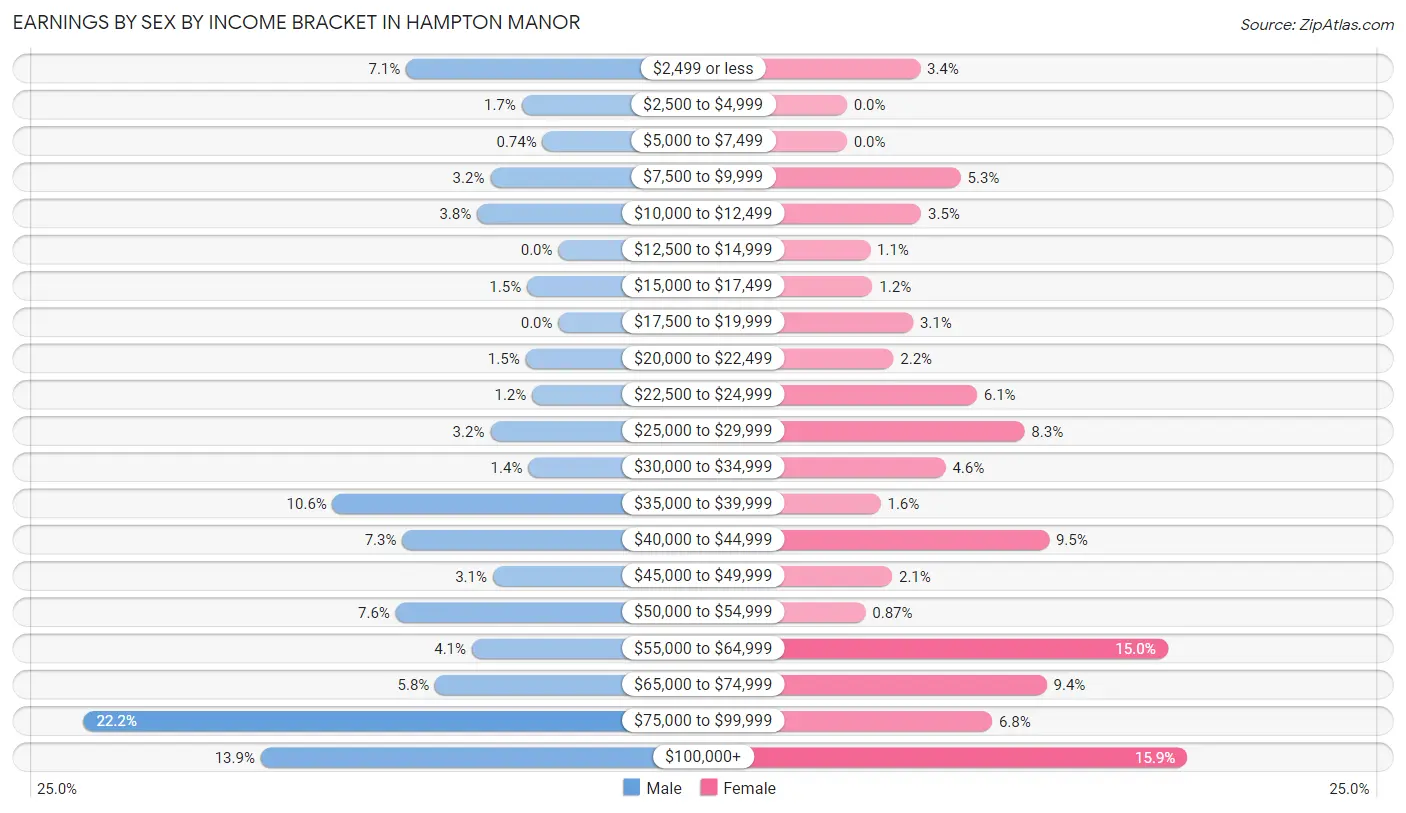
Earnings by Sex by Income Bracket in Hampton Manor
The most common earnings brackets in Hampton Manor are $75,000 to $99,999 for men (362 | 22.2%) and $100,000+ for women (293 | 15.9%).
| Income | Male | Female |
| $2,499 or less | 116 (7.1%) | 63 (3.4%) |
| $2,500 to $4,999 | 28 (1.7%) | 0 (0.0%) |
| $5,000 to $7,499 | 12 (0.7%) | 0 (0.0%) |
| $7,500 to $9,999 | 52 (3.2%) | 98 (5.3%) |
| $10,000 to $12,499 | 62 (3.8%) | 64 (3.5%) |
| $12,500 to $14,999 | 0 (0.0%) | 20 (1.1%) |
| $15,000 to $17,499 | 24 (1.5%) | 22 (1.2%) |
| $17,500 to $19,999 | 0 (0.0%) | 57 (3.1%) |
| $20,000 to $22,499 | 25 (1.5%) | 40 (2.2%) |
| $22,500 to $24,999 | 20 (1.2%) | 112 (6.1%) |
| $25,000 to $29,999 | 52 (3.2%) | 153 (8.3%) |
| $30,000 to $34,999 | 23 (1.4%) | 85 (4.6%) |
| $35,000 to $39,999 | 172 (10.6%) | 29 (1.6%) |
| $40,000 to $44,999 | 119 (7.3%) | 174 (9.5%) |
| $45,000 to $49,999 | 50 (3.1%) | 39 (2.1%) |
| $50,000 to $54,999 | 124 (7.6%) | 16 (0.9%) |
| $55,000 to $64,999 | 66 (4.1%) | 276 (15.0%) |
| $65,000 to $74,999 | 94 (5.8%) | 172 (9.4%) |
| $75,000 to $99,999 | 362 (22.2%) | 125 (6.8%) |
| $100,000+ | 227 (13.9%) | 293 (15.9%) |
| Total | 1,628 (100.0%) | 1,838 (100.0%) |
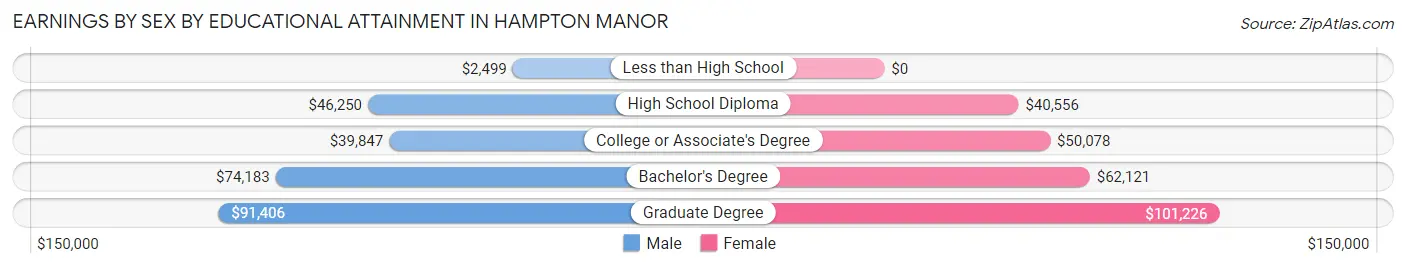
Earnings by Sex by Educational Attainment in Hampton Manor
Average earnings in Hampton Manor are $56,295 for men and $59,197 for women, a difference of 4.9%. Men with an educational attainment of graduate degree enjoy the highest average annual earnings of $91,406, while those with less than high school education earn the least with $2,499. Women with an educational attainment of graduate degree earn the most with the average annual earnings of $101,226, while those with high school diploma education have the smallest earnings of $40,556.
| Educational Attainment | Male Income | Female Income |
| Less than High School | $2,499 | $0 |
| High School Diploma | $46,250 | $40,556 |
| College or Associate's Degree | $39,847 | $50,078 |
| Bachelor's Degree | $74,183 | $62,121 |
| Graduate Degree | $91,406 | $101,226 |
| Total | $56,295 | $59,197 |
Family Income in Hampton Manor
Family Income Brackets in Hampton Manor
According to the Hampton Manor family income data, there are 460 families falling into the $100,000 to $149,999 income range, which is the most common income bracket and makes up 33.0% of all families.
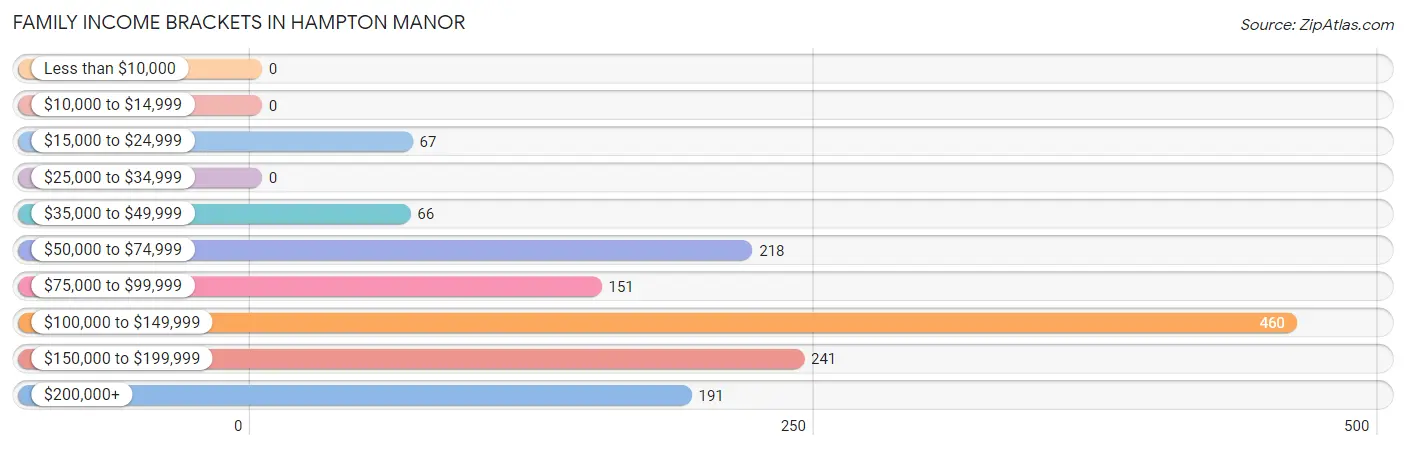
| Income Bracket | # Families | % Families |
| Less than $10,000 | 0 | 0.0% |
| $10,000 to $14,999 | 0 | 0.0% |
| $15,000 to $24,999 | 67 | 4.8% |
| $25,000 to $34,999 | 0 | 0.0% |
| $35,000 to $49,999 | 66 | 4.7% |
| $50,000 to $74,999 | 218 | 15.6% |
| $75,000 to $99,999 | 151 | 10.8% |
| $100,000 to $149,999 | 460 | 33.0% |
| $150,000 to $199,999 | 241 | 17.3% |
| $200,000+ | 191 | 13.7% |
Family Income by Famaliy Size in Hampton Manor
3-person families (551 | 39.5%) account for the highest median family income in Hampton Manor with $146,580 per family, while 2-person families (526 | 37.7%) have the highest median income of $53,834 per family member.

| Income Bracket | # Families | Median Income |
| 2-Person Families | 526 (37.7%) | $107,667 |
| 3-Person Families | 551 (39.5%) | $146,580 |
| 4-Person Families | 271 (19.4%) | $106,422 |
| 5-Person Families | 47 (3.4%) | $0 |
| 6-Person Families | 0 (0.0%) | $0 |
| 7+ Person Families | 0 (0.0%) | $0 |
| Total | 1,395 (100.0%) | $127,798 |
Family Income by Number of Earners in Hampton Manor
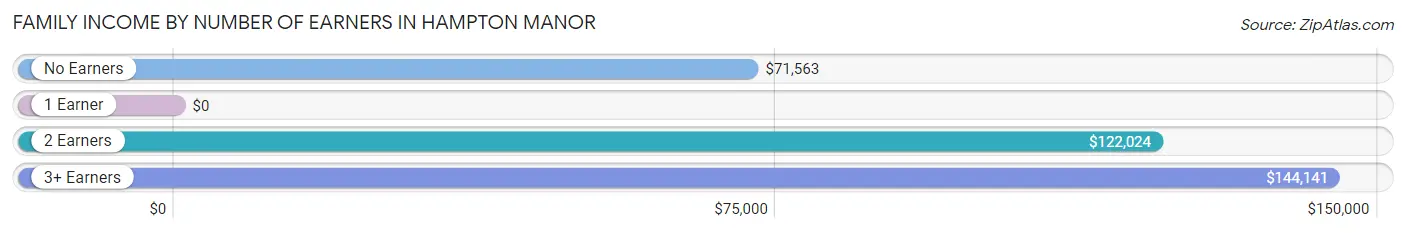
| Number of Earners | # Families | Median Income |
| No Earners | 186 (13.3%) | $71,563 |
| 1 Earner | 188 (13.5%) | $0 |
| 2 Earners | 736 (52.8%) | $122,024 |
| 3+ Earners | 285 (20.4%) | $144,141 |
| Total | 1,395 (100.0%) | $127,798 |
Household Income in Hampton Manor
Household Income Brackets in Hampton Manor
With 697 households falling in the category, the $100,000 to $149,999 income range is the most frequent in Hampton Manor, accounting for 32.4% of all households. In contrast, only 26 households (1.2%) fall into the $10,000 to $14,999 income bracket, making it the least populous group.
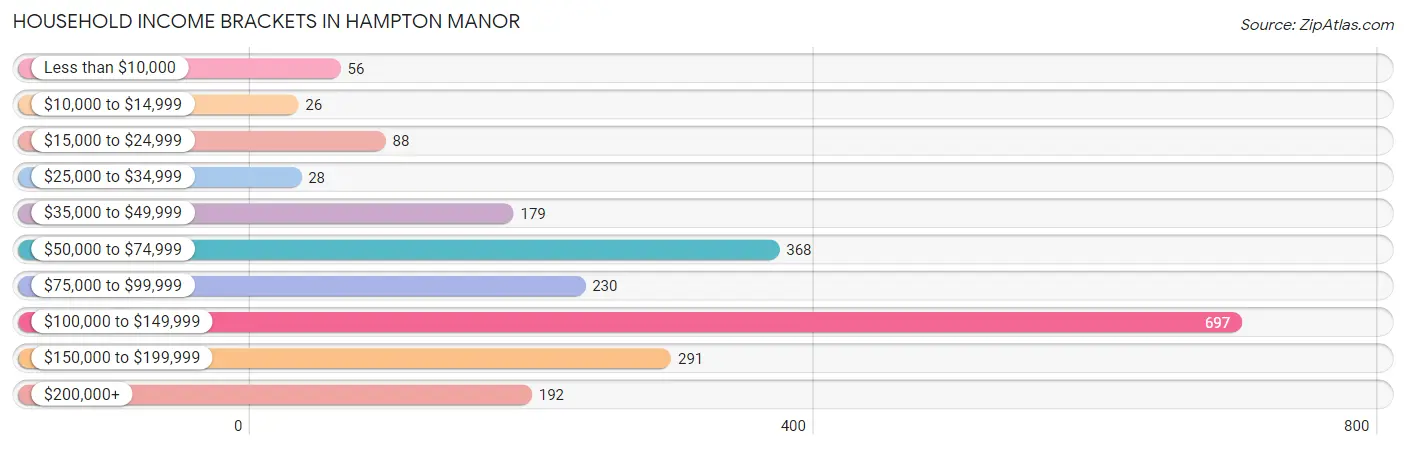
| Income Bracket | # Households | % Households |
| Less than $10,000 | 56 | 2.6% |
| $10,000 to $14,999 | 26 | 1.2% |
| $15,000 to $24,999 | 88 | 4.1% |
| $25,000 to $34,999 | 28 | 1.3% |
| $35,000 to $49,999 | 179 | 8.3% |
| $50,000 to $74,999 | 368 | 17.1% |
| $75,000 to $99,999 | 230 | 10.7% |
| $100,000 to $149,999 | 697 | 32.4% |
| $150,000 to $199,999 | 291 | 13.5% |
| $200,000+ | 192 | 8.9% |
Household Income by Householder Age in Hampton Manor
The median household income in Hampton Manor is $104,211, with the highest median household income of $130,786 found in the 45 to 64 years age bracket for the primary householder. A total of 1,084 households (50.4%) fall into this category. Meanwhile, the 15 to 24 years age bracket for the primary householder has the lowest median household income of $0, with 25 households (1.2%) in this group.
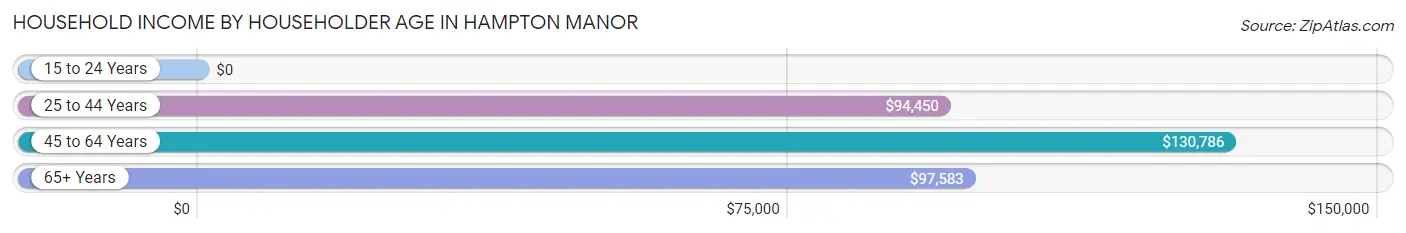
| Income Bracket | # Households | Median Income |
| 15 to 24 Years | 25 (1.2%) | $0 |
| 25 to 44 Years | 566 (26.3%) | $94,450 |
| 45 to 64 Years | 1,084 (50.4%) | $130,786 |
| 65+ Years | 477 (22.2%) | $97,583 |
| Total | 2,152 (100.0%) | $104,211 |
Poverty in Hampton Manor
Income Below Poverty by Sex and Age in Hampton Manor
With 6.7% poverty level for males and 4.1% for females among the residents of Hampton Manor, 16 and 17 year old males and 35 to 44 year old females are the most vulnerable to poverty, with 16 males (30.2%) and 68 females (16.6%) in their respective age groups living below the poverty level.
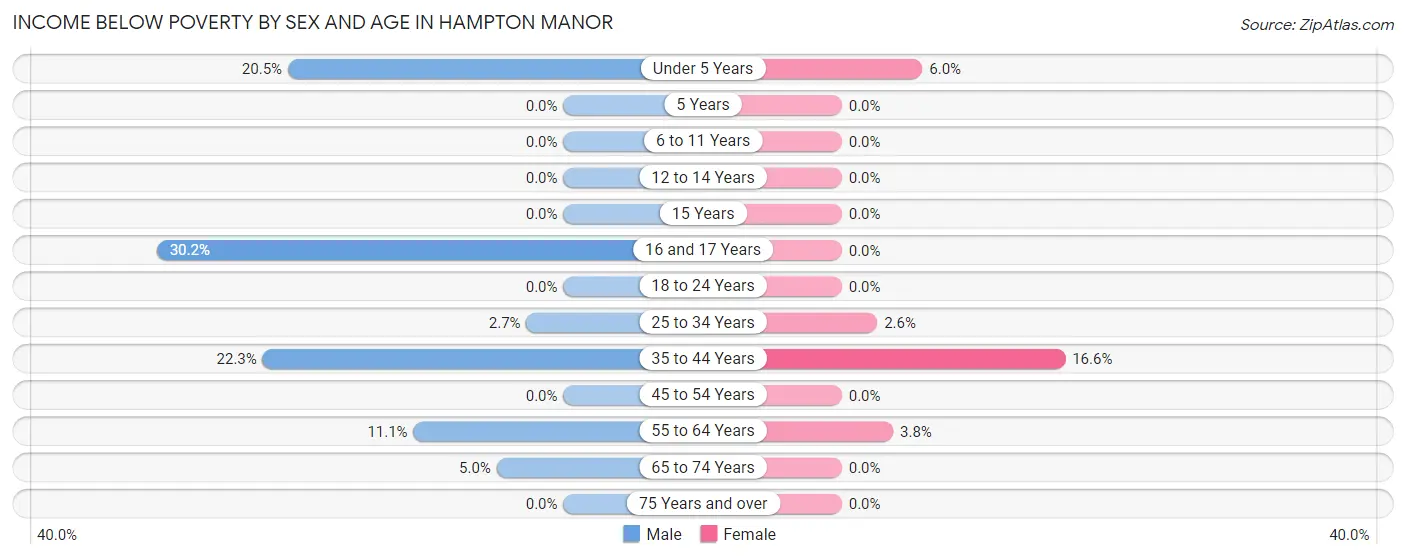
| Age Bracket | Male | Female |
| Under 5 Years | 9 (20.4%) | 11 (6.0%) |
| 5 Years | 0 (0.0%) | 0 (0.0%) |
| 6 to 11 Years | 0 (0.0%) | 0 (0.0%) |
| 12 to 14 Years | 0 (0.0%) | 0 (0.0%) |
| 15 Years | 0 (0.0%) | 0 (0.0%) |
| 16 and 17 Years | 16 (30.2%) | 0 (0.0%) |
| 18 to 24 Years | 0 (0.0%) | 0 (0.0%) |
| 25 to 34 Years | 9 (2.7%) | 11 (2.6%) |
| 35 to 44 Years | 67 (22.3%) | 68 (16.6%) |
| 45 to 54 Years | 0 (0.0%) | 0 (0.0%) |
| 55 to 64 Years | 63 (11.1%) | 21 (3.8%) |
| 65 to 74 Years | 10 (5.0%) | 0 (0.0%) |
| 75 Years and over | 0 (0.0%) | 0 (0.0%) |
| Total | 174 (6.7%) | 111 (4.1%) |
Income Above Poverty by Sex and Age in Hampton Manor
According to the poverty statistics in Hampton Manor, males aged 5 years and females aged 6 to 11 years are the age groups that are most secure financially, with 100.0% of males and 100.0% of females in these age groups living above the poverty line.
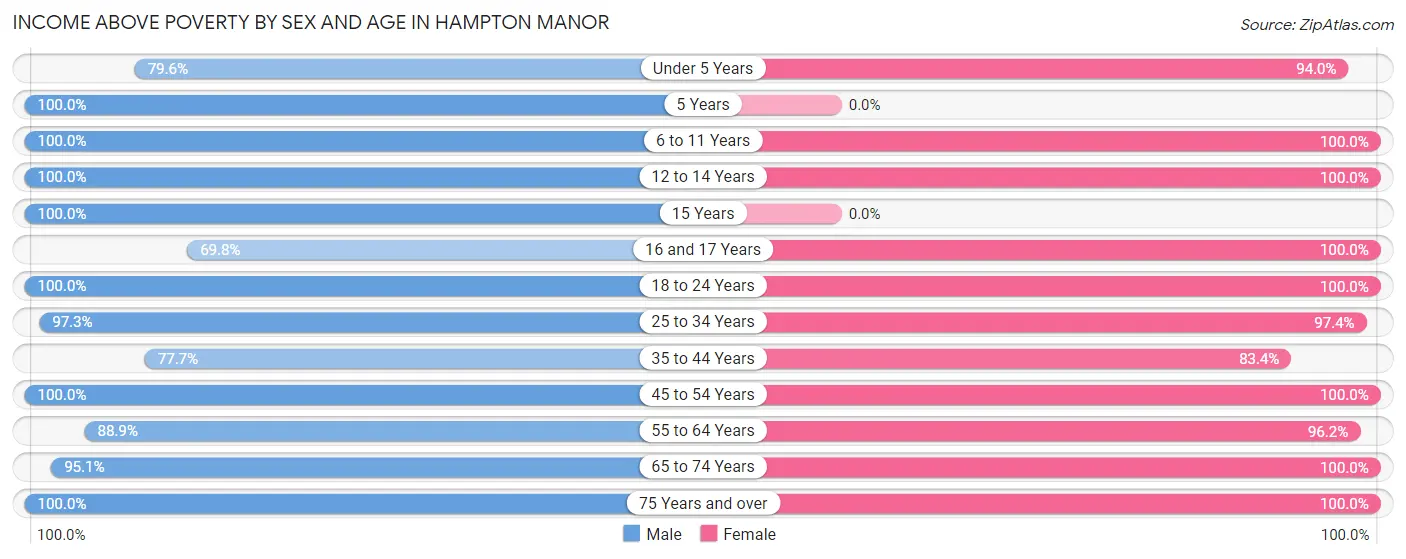
| Age Bracket | Male | Female |
| Under 5 Years | 35 (79.5%) | 173 (94.0%) |
| 5 Years | 18 (100.0%) | 0 (0.0%) |
| 6 to 11 Years | 177 (100.0%) | 23 (100.0%) |
| 12 to 14 Years | 140 (100.0%) | 23 (100.0%) |
| 15 Years | 18 (100.0%) | 0 (0.0%) |
| 16 and 17 Years | 37 (69.8%) | 102 (100.0%) |
| 18 to 24 Years | 155 (100.0%) | 253 (100.0%) |
| 25 to 34 Years | 319 (97.3%) | 408 (97.4%) |
| 35 to 44 Years | 233 (77.7%) | 342 (83.4%) |
| 45 to 54 Years | 425 (100.0%) | 326 (100.0%) |
| 55 to 64 Years | 503 (88.9%) | 530 (96.2%) |
| 65 to 74 Years | 192 (95.1%) | 173 (100.0%) |
| 75 Years and over | 177 (100.0%) | 244 (100.0%) |
| Total | 2,429 (93.3%) | 2,597 (95.9%) |
Income Below Poverty Among Married-Couple Families in Hampton Manor
The poverty statistics for married-couple families in Hampton Manor show that 3.5% or 34 of the total 965 families live below the poverty line. Families with 1 or 2 children have the highest poverty rate of 9.6%, comprising of 34 families. On the other hand, families with no children have the lowest poverty rate of 0.0%, which includes 0 families.
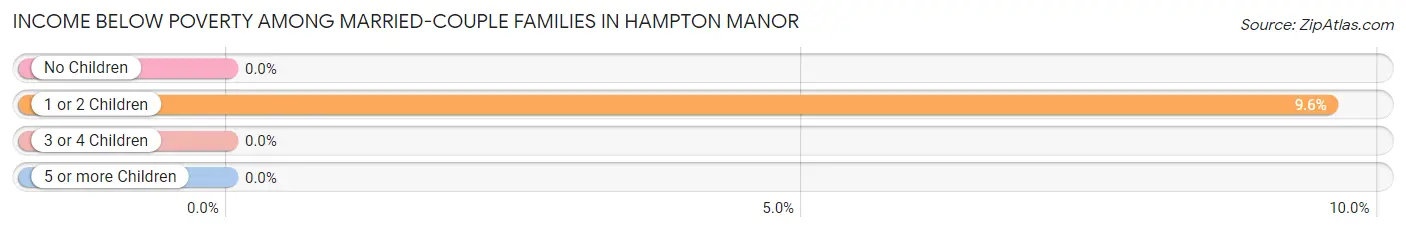
| Children | Above Poverty | Below Poverty |
| No Children | 610 (100.0%) | 0 (0.0%) |
| 1 or 2 Children | 321 (90.4%) | 34 (9.6%) |
| 3 or 4 Children | 0 (0.0%) | 0 (0.0%) |
| 5 or more Children | 0 (0.0%) | 0 (0.0%) |
| Total | 931 (96.5%) | 34 (3.5%) |
Income Below Poverty Among Single-Parent Households in Hampton Manor
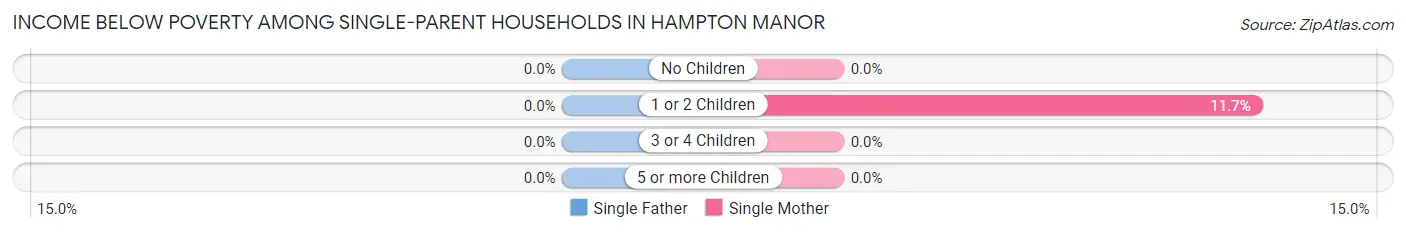
| Children | Single Father | Single Mother |
| No Children | 0 (0.0%) | 0 (0.0%) |
| 1 or 2 Children | 0 (0.0%) | 11 (11.7%) |
| 3 or 4 Children | 0 (0.0%) | 0 (0.0%) |
| 5 or more Children | 0 (0.0%) | 0 (0.0%) |
| Total | 0 (0.0%) | 11 (3.1%) |
Income Below Poverty Among Married-Couple vs Single-Parent Households in Hampton Manor
The poverty data for Hampton Manor shows that 34 of the married-couple family households (3.5%) and 11 of the single-parent households (2.6%) are living below the poverty level. Within the married-couple family households, those with 1 or 2 children have the highest poverty rate, with 34 households (9.6%) falling below the poverty line. Among the single-parent households, those with 1 or 2 children have the highest poverty rate, with 11 household (7.6%) living below poverty.
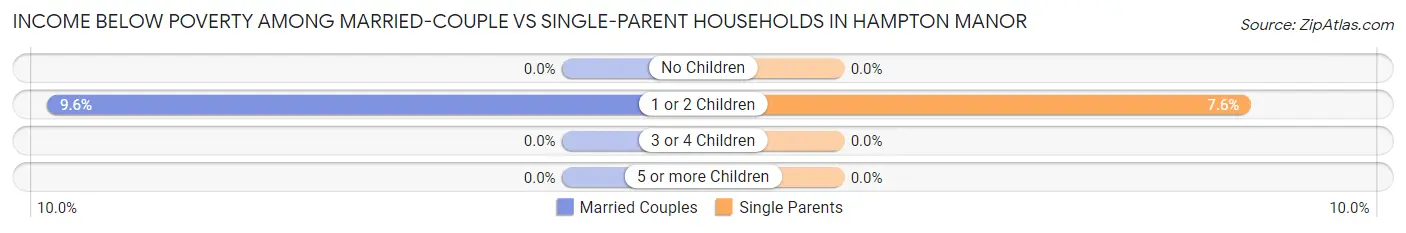
| Children | Married-Couple Families | Single-Parent Households |
| No Children | 0 (0.0%) | 0 (0.0%) |
| 1 or 2 Children | 34 (9.6%) | 11 (7.6%) |
| 3 or 4 Children | 0 (0.0%) | 0 (0.0%) |
| 5 or more Children | 0 (0.0%) | 0 (0.0%) |
| Total | 34 (3.5%) | 11 (2.6%) |
Race in Hampton Manor
The most populous races in Hampton Manor are White / Caucasian (4,574 | 85.6%), Black / African American (268 | 5.0%), and Two or more Races (240 | 4.5%).
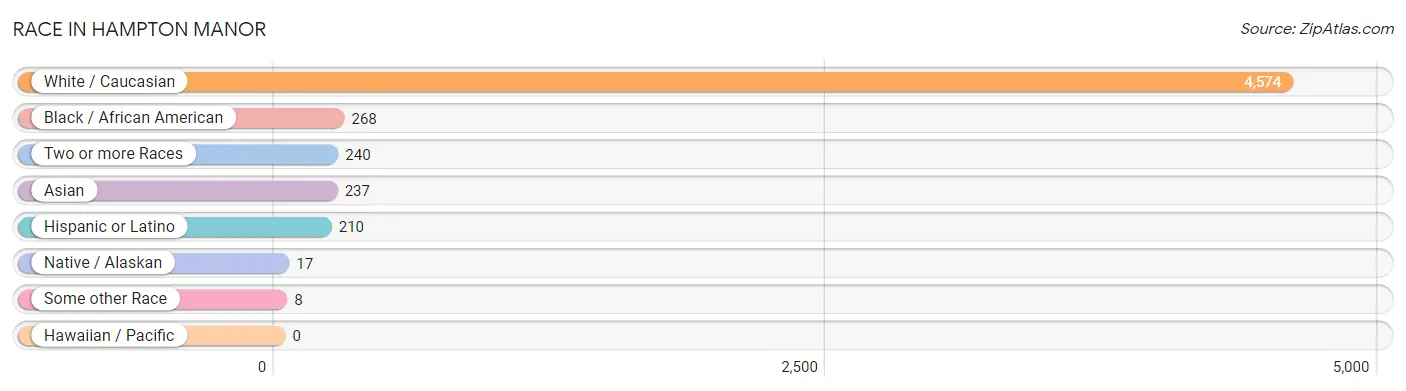
| Race | # Population | % Population |
| Asian | 237 | 4.4% |
| Black / African American | 268 | 5.0% |
| Hawaiian / Pacific | 0 | 0.0% |
| Hispanic or Latino | 210 | 3.9% |
| Native / Alaskan | 17 | 0.3% |
| White / Caucasian | 4,574 | 85.6% |
| Two or more Races | 240 | 4.5% |
| Some other Race | 8 | 0.2% |
| Total | 5,344 | 100.0% |
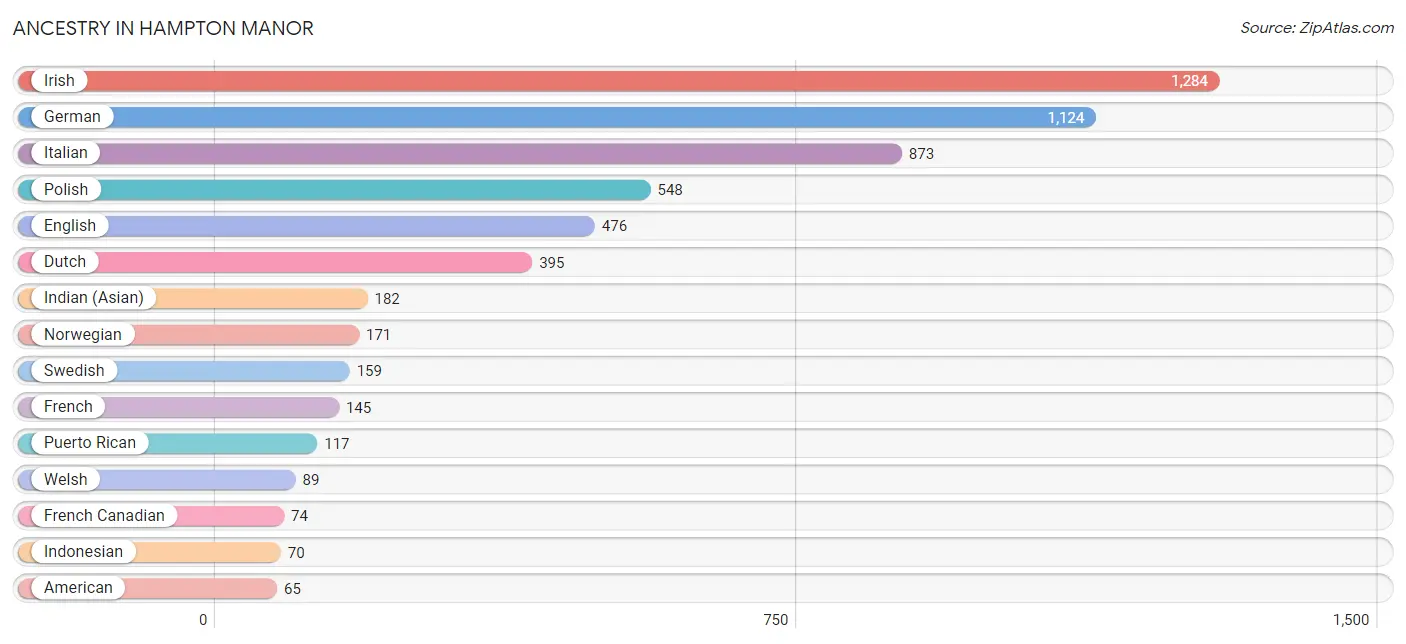
Ancestry in Hampton Manor
The most populous ancestries reported in Hampton Manor are Irish (1,284 | 24.0%), German (1,124 | 21.0%), Italian (873 | 16.3%), Polish (548 | 10.2%), and English (476 | 8.9%), together accounting for 80.6% of all Hampton Manor residents.
| Ancestry | # Population | % Population |
| American | 65 | 1.2% |
| Arab | 41 | 0.8% |
| Burmese | 12 | 0.2% |
| Cherokee | 58 | 1.1% |
| Dominican | 19 | 0.4% |
| Dutch | 395 | 7.4% |
| Eastern European | 25 | 0.5% |
| Ecuadorian | 44 | 0.8% |
| English | 476 | 8.9% |
| French | 145 | 2.7% |
| French Canadian | 74 | 1.4% |
| German | 1,124 | 21.0% |
| Haitian | 25 | 0.5% |
| Indian (Asian) | 182 | 3.4% |
| Indonesian | 70 | 1.3% |
| Irish | 1,284 | 24.0% |
| Italian | 873 | 16.3% |
| Mexican | 30 | 0.6% |
| Nigerian | 43 | 0.8% |
| Northern European | 19 | 0.4% |
| Norwegian | 171 | 3.2% |
| Polish | 548 | 10.2% |
| Puerto Rican | 117 | 2.2% |
| Russian | 8 | 0.2% |
| Scotch-Irish | 14 | 0.3% |
| Scottish | 58 | 1.1% |
| Slovak | 14 | 0.3% |
| South American | 44 | 0.8% |
| Subsaharan African | 43 | 0.8% |
| Swedish | 159 | 3.0% |
| Swiss | 1 | 0.0% |
| Thai | 21 | 0.4% |
| Ukrainian | 20 | 0.4% |
| Welsh | 89 | 1.7% | View All 34 Rows |
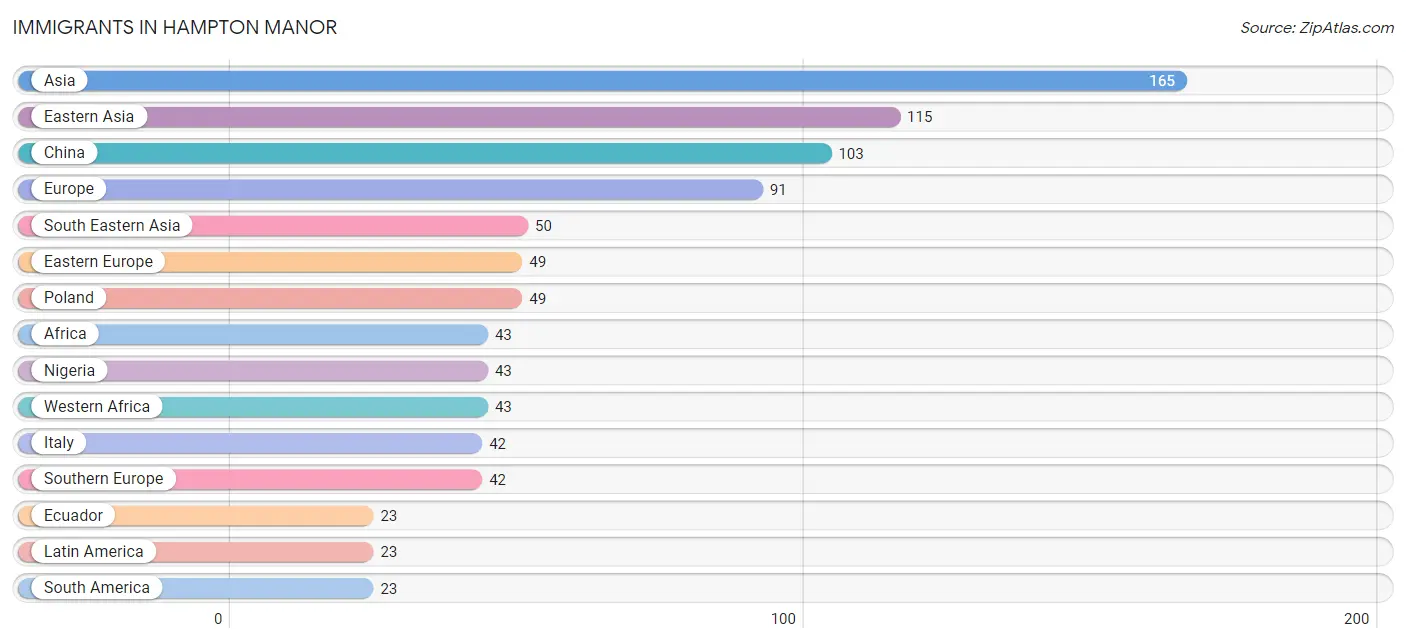
Immigrants in Hampton Manor
The most numerous immigrant groups reported in Hampton Manor came from Asia (165 | 3.1%), Eastern Asia (115 | 2.1%), China (103 | 1.9%), Europe (91 | 1.7%), and South Eastern Asia (50 | 0.9%), together accounting for 9.8% of all Hampton Manor residents.
| Immigration Origin | # Population | % Population |
| Africa | 43 | 0.8% |
| Asia | 165 | 3.1% |
| China | 103 | 1.9% |
| Eastern Asia | 115 | 2.1% |
| Eastern Europe | 49 | 0.9% |
| Ecuador | 23 | 0.4% |
| Europe | 91 | 1.7% |
| Italy | 42 | 0.8% |
| Korea | 12 | 0.2% |
| Latin America | 23 | 0.4% |
| Nigeria | 43 | 0.8% |
| Poland | 49 | 0.9% |
| South America | 23 | 0.4% |
| South Eastern Asia | 50 | 0.9% |
| Southern Europe | 42 | 0.8% |
| Western Africa | 43 | 0.8% | View All 16 Rows |
Sex and Age in Hampton Manor
Sex and Age in Hampton Manor
The most populous age groups in Hampton Manor are 60 to 64 Years (331 | 12.6%) for men and 25 to 29 Years (350 | 12.9%) for women.
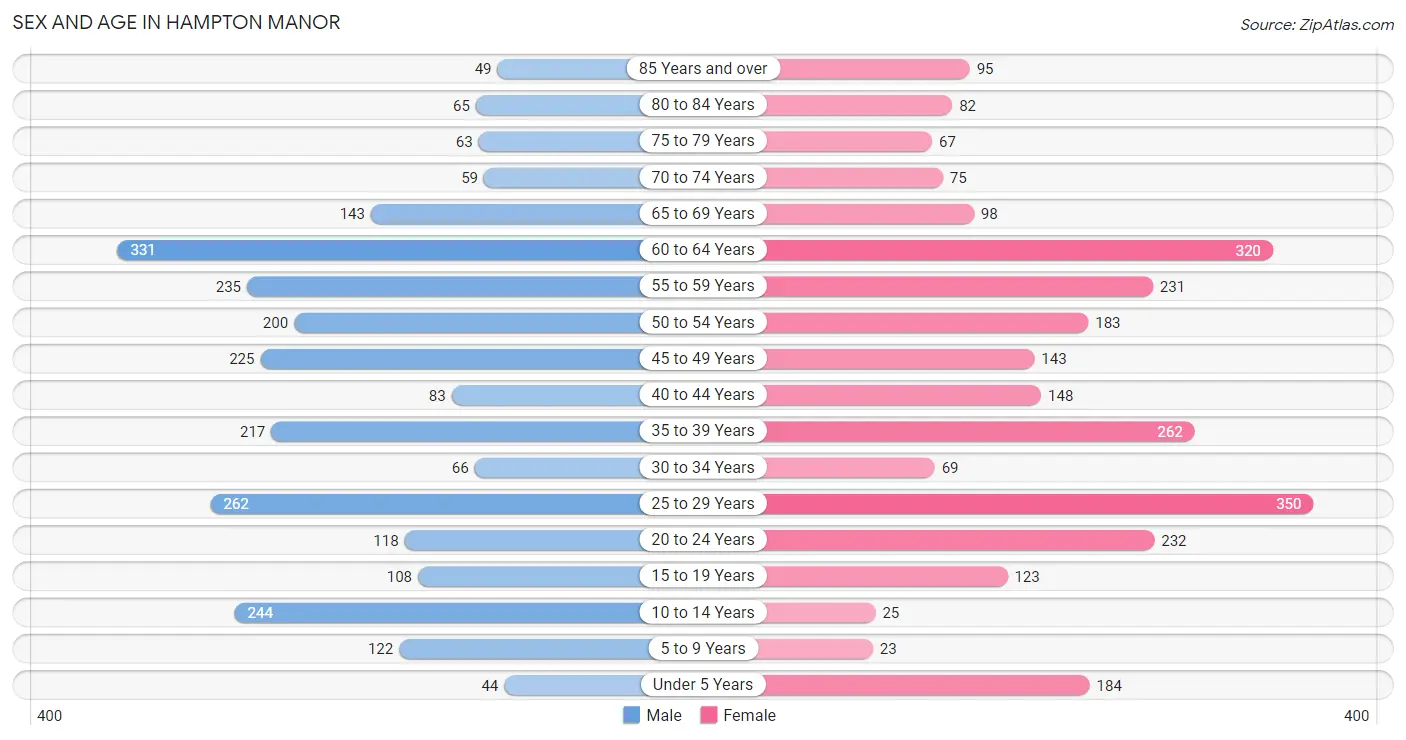
| Age Bracket | Male | Female |
| Under 5 Years | 44 (1.7%) | 184 (6.8%) |
| 5 to 9 Years | 122 (4.6%) | 23 (0.9%) |
| 10 to 14 Years | 244 (9.3%) | 25 (0.9%) |
| 15 to 19 Years | 108 (4.1%) | 123 (4.5%) |
| 20 to 24 Years | 118 (4.5%) | 232 (8.6%) |
| 25 to 29 Years | 262 (10.0%) | 350 (12.9%) |
| 30 to 34 Years | 66 (2.5%) | 69 (2.5%) |
| 35 to 39 Years | 217 (8.2%) | 262 (9.7%) |
| 40 to 44 Years | 83 (3.2%) | 148 (5.5%) |
| 45 to 49 Years | 225 (8.5%) | 143 (5.3%) |
| 50 to 54 Years | 200 (7.6%) | 183 (6.8%) |
| 55 to 59 Years | 235 (8.9%) | 231 (8.5%) |
| 60 to 64 Years | 331 (12.6%) | 320 (11.8%) |
| 65 to 69 Years | 143 (5.4%) | 98 (3.6%) |
| 70 to 74 Years | 59 (2.2%) | 75 (2.8%) |
| 75 to 79 Years | 63 (2.4%) | 67 (2.5%) |
| 80 to 84 Years | 65 (2.5%) | 82 (3.0%) |
| 85 Years and over | 49 (1.9%) | 95 (3.5%) |
| Total | 2,634 (100.0%) | 2,710 (100.0%) |
Families and Households in Hampton Manor
Median Family Size in Hampton Manor
The median family size in Hampton Manor is 3.05 persons per family, with married-couple families (965 | 69.2%) accounting for the largest median family size of 3.18 persons per family. On the other hand, single male/father families (77 | 5.5%) represent the smallest median family size with 2.30 persons per family.
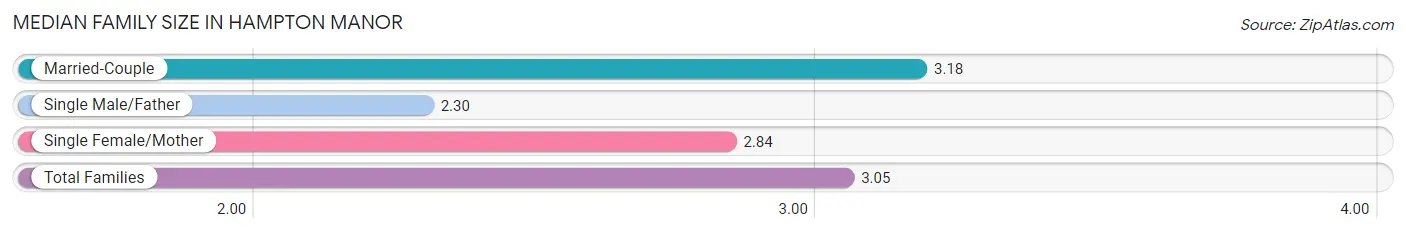
| Family Type | # Families | Family Size |
| Married-Couple | 965 (69.2%) | 3.18 |
| Single Male/Father | 77 (5.5%) | 2.30 |
| Single Female/Mother | 353 (25.3%) | 2.84 |
| Total Families | 1,395 (100.0%) | 3.05 |
Median Household Size in Hampton Manor
The median household size in Hampton Manor is 2.48 persons per household, with married-couple households (965 | 44.8%) accounting for the largest median household size of 3.26 persons per household. non-family households (757 | 35.2%) represent the smallest median household size with 1.27 persons per household.
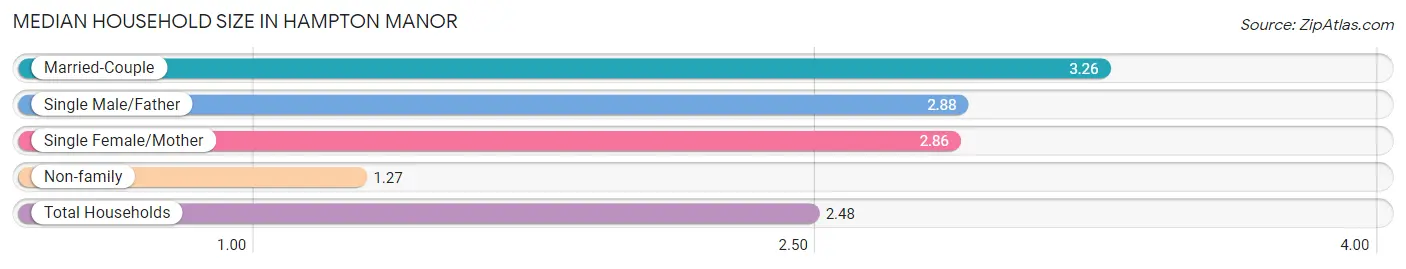
| Household Type | # Households | Household Size |
| Married-Couple | 965 (44.8%) | 3.26 |
| Single Male/Father | 77 (3.6%) | 2.88 |
| Single Female/Mother | 353 (16.4%) | 2.86 |
| Non-family | 757 (35.2%) | 1.27 |
| Total Households | 2,152 (100.0%) | 2.48 |
Household Size by Marriage Status in Hampton Manor
Out of a total of 2,152 households in Hampton Manor, 1,395 (64.8%) are family households, while 757 (35.2%) are nonfamily households. The most numerous type of family households are 2-person households, comprising 501, and the most common type of nonfamily households are 1-person households, comprising 549.
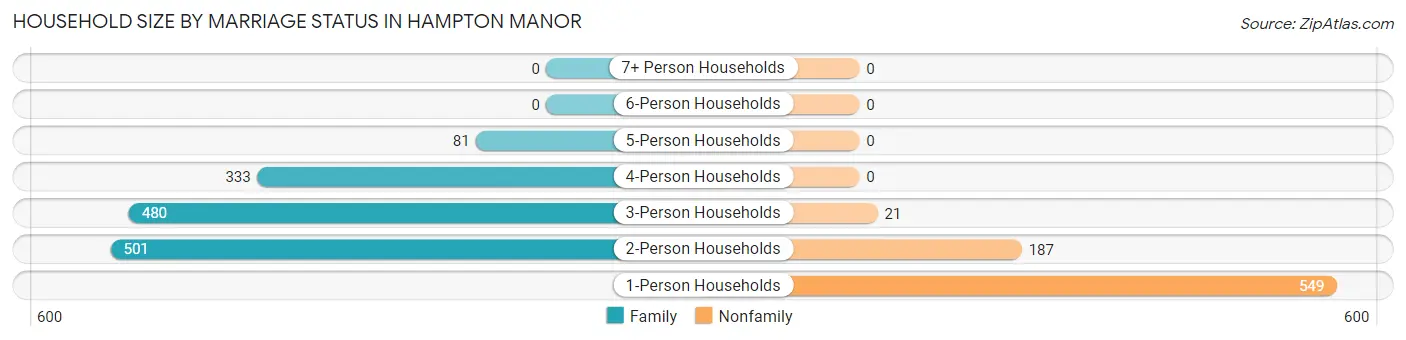
| Household Size | Family Households | Nonfamily Households |
| 1-Person Households | - | 549 (25.5%) |
| 2-Person Households | 501 (23.3%) | 187 (8.7%) |
| 3-Person Households | 480 (22.3%) | 21 (1.0%) |
| 4-Person Households | 333 (15.5%) | 0 (0.0%) |
| 5-Person Households | 81 (3.8%) | 0 (0.0%) |
| 6-Person Households | 0 (0.0%) | 0 (0.0%) |
| 7+ Person Households | 0 (0.0%) | 0 (0.0%) |
| Total | 1,395 (64.8%) | 757 (35.2%) |
Female Fertility in Hampton Manor
Fertility by Age in Hampton Manor
| Age Bracket | Women with Births | Births / 1,000 Women |
| 15 to 19 years | 0 (0.0%) | 0.0 |
| 20 to 34 years | 0 (0.0%) | 0.0 |
| 35 to 50 years | 0 (0.0%) | 0.0 |
| Total | 0 (0.0%) | 0.0 |
Fertility by Age by Marriage Status in Hampton Manor
| Age Bracket | Married | Unmarried |
| 15 to 19 years | 0 (0.0%) | 0 (0.0%) |
| 20 to 34 years | 0 (0.0%) | 0 (0.0%) |
| 35 to 50 years | 0 (0.0%) | 0 (0.0%) |
| Total | 0 (0.0%) | 0 (0.0%) |
Fertility by Education in Hampton Manor
| Educational Attainment | Women with Births | Births / 1,000 Women |
| Less than High School | 0 (0.0%) | 0.0 |
| High School Diploma | 0 (0.0%) | 0.0 |
| College or Associate's Degree | 0 (0.0%) | 0.0 |
| Bachelor's Degree | 0 (0.0%) | 0.0 |
| Graduate Degree | 0 (0.0%) | 0.0 |
| Total | 0 (0.0%) | 0.0 |
Fertility by Education by Marriage Status in Hampton Manor
| Educational Attainment | Married | Unmarried |
| Less than High School | 0 (0.0%) | 0 (0.0%) |
| High School Diploma | 0 (0.0%) | 0 (0.0%) |
| College or Associate's Degree | 0 (0.0%) | 0 (0.0%) |
| Bachelor's Degree | 0 (0.0%) | 0 (0.0%) |
| Graduate Degree | 0 (0.0%) | 0 (0.0%) |
| Total | 0 (0.0%) | 0 (0.0%) |
Employment Characteristics in Hampton Manor
Employment by Class of Employer in Hampton Manor
Among the 3,193 employed individuals in Hampton Manor, private company employees (1,747 | 54.7%), state government employees (441 | 13.8%), and not-for-profit organizations (360 | 11.3%) make up the most common classes of employment.
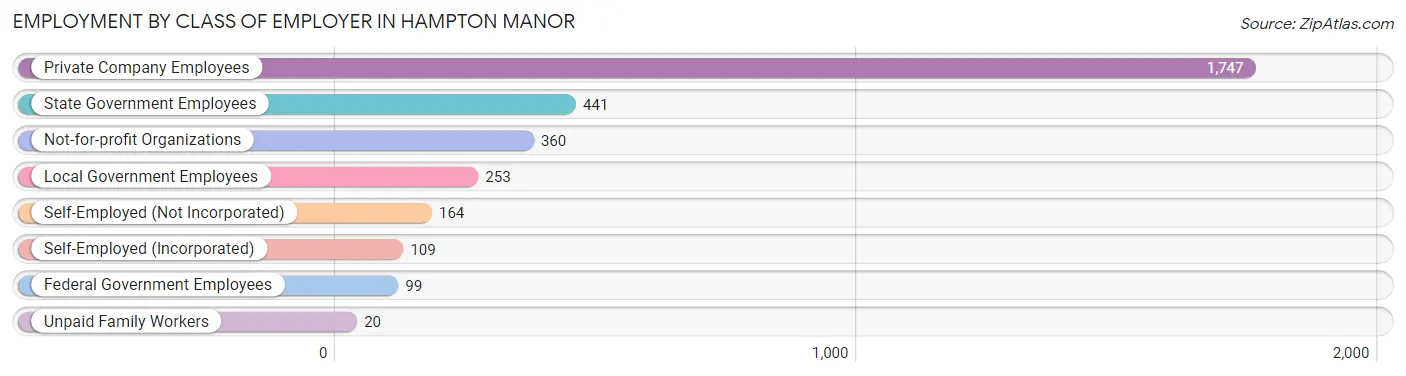
| Employer Class | # Employees | % Employees |
| Private Company Employees | 1,747 | 54.7% |
| Self-Employed (Incorporated) | 109 | 3.4% |
| Self-Employed (Not Incorporated) | 164 | 5.1% |
| Not-for-profit Organizations | 360 | 11.3% |
| Local Government Employees | 253 | 7.9% |
| State Government Employees | 441 | 13.8% |
| Federal Government Employees | 99 | 3.1% |
| Unpaid Family Workers | 20 | 0.6% |
| Total | 3,193 | 100.0% |
Employment Status by Age in Hampton Manor
According to the labor force statistics for Hampton Manor, out of the total population over 16 years of age (4,684), 70.9% or 3,321 individuals are in the labor force, with 3.2% or 106 of them unemployed. The age group with the highest labor force participation rate is 45 to 54 years, with 97.3% or 731 individuals in the labor force. Within the labor force, the 75 years and over age range has the highest percentage of unemployed individuals, with 100.0% or 17 of them being unemployed.
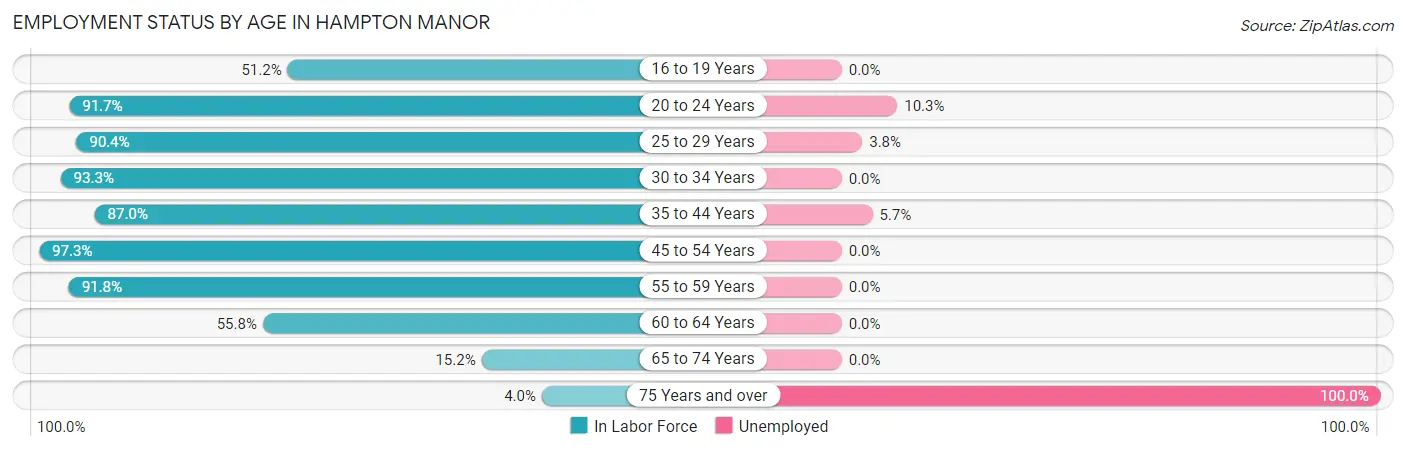
| Age Bracket | In Labor Force | Unemployed |
| 16 to 19 Years | 109 (51.2%) | 0 (0.0%) |
| 20 to 24 Years | 321 (91.7%) | 33 (10.3%) |
| 25 to 29 Years | 553 (90.4%) | 21 (3.8%) |
| 30 to 34 Years | 126 (93.3%) | 0 (0.0%) |
| 35 to 44 Years | 618 (87.0%) | 35 (5.7%) |
| 45 to 54 Years | 731 (97.3%) | 0 (0.0%) |
| 55 to 59 Years | 428 (91.8%) | 0 (0.0%) |
| 60 to 64 Years | 363 (55.8%) | 0 (0.0%) |
| 65 to 74 Years | 57 (15.2%) | 0 (0.0%) |
| 75 Years and over | 17 (4.0%) | 17 (100.0%) |
| Total | 3,321 (70.9%) | 106 (3.2%) |
Employment Status by Educational Attainment in Hampton Manor
According to labor force statistics for Hampton Manor, 84.8% of individuals (2,820) out of the total population between 25 and 64 years of age (3,325) are in the labor force, with 2.0% or 56 of them being unemployed. The group with the highest labor force participation rate are those with the educational attainment of bachelor's degree or higher, with 88.0% or 1,066 individuals in the labor force. Within the labor force, individuals with high school diploma education have the highest percentage of unemployment, with 7.4% or 56 of them being unemployed.
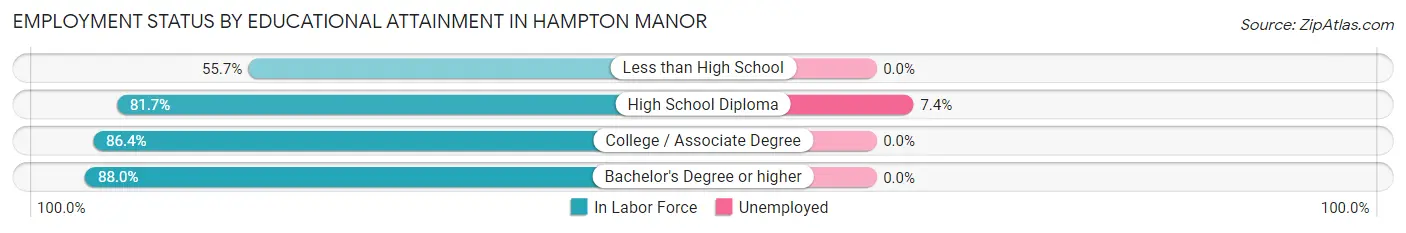
| Educational Attainment | In Labor Force | Unemployed |
| Less than High School | 54 (55.7%) | 0 (0.0%) |
| High School Diploma | 756 (81.7%) | 68 (7.4%) |
| College / Associate Degree | 943 (86.4%) | 0 (0.0%) |
| Bachelor's Degree or higher | 1,066 (88.0%) | 0 (0.0%) |
| Total | 2,820 (84.8%) | 66 (2.0%) |
Employment Occupations by Sex in Hampton Manor
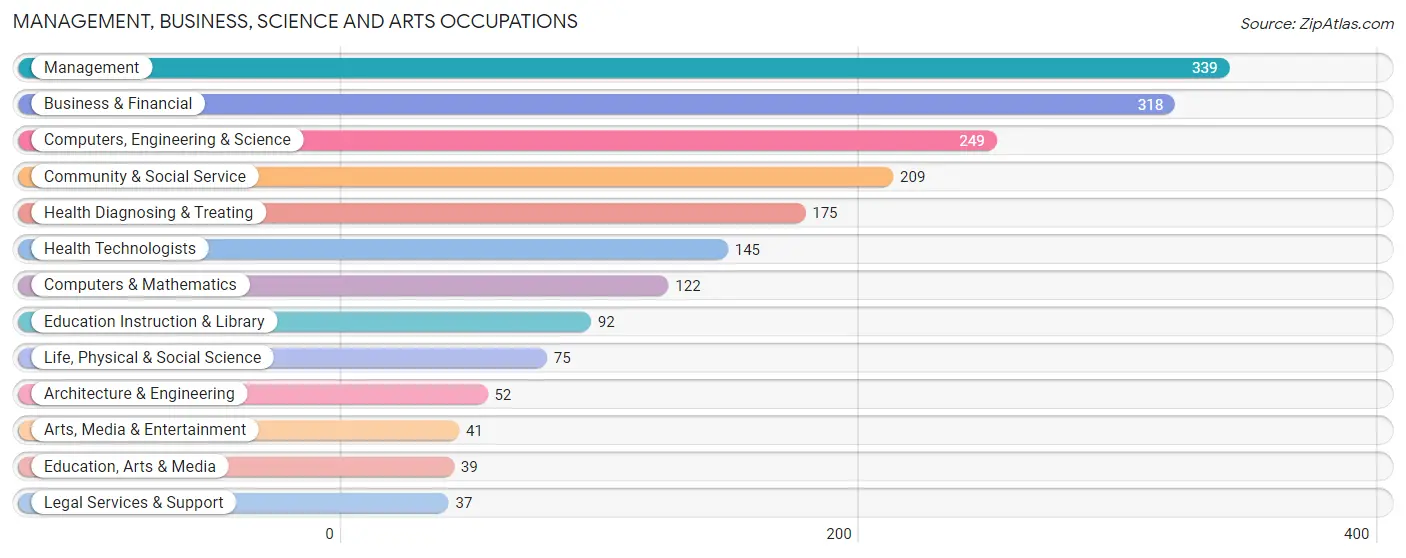
Management, Business, Science and Arts Occupations
The most common Management, Business, Science and Arts occupations in Hampton Manor are Management (339 | 10.5%), Business & Financial (318 | 9.9%), Computers, Engineering & Science (249 | 7.7%), Community & Social Service (209 | 6.5%), and Health Diagnosing & Treating (175 | 5.4%).
Management, Business, Science and Arts Occupations by Sex
Within the Management, Business, Science and Arts occupations in Hampton Manor, the most male-oriented occupations are Architecture & Engineering (100.0%), Computers & Mathematics (72.1%), and Computers, Engineering & Science (65.5%), while the most female-oriented occupations are Legal Services & Support (100.0%), Health Diagnosing & Treating (88.0%), and Health Technologists (85.5%).
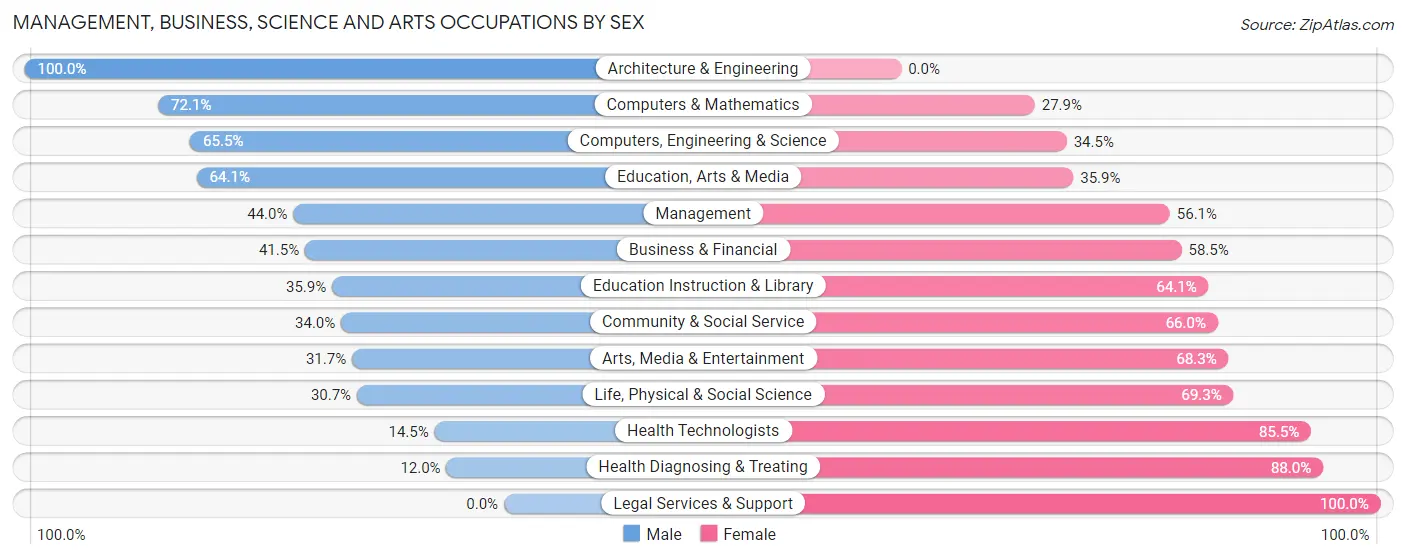
| Occupation | Male | Female |
| Management | 149 (44.0%) | 190 (56.0%) |
| Business & Financial | 132 (41.5%) | 186 (58.5%) |
| Computers, Engineering & Science | 163 (65.5%) | 86 (34.5%) |
| Computers & Mathematics | 88 (72.1%) | 34 (27.9%) |
| Architecture & Engineering | 52 (100.0%) | 0 (0.0%) |
| Life, Physical & Social Science | 23 (30.7%) | 52 (69.3%) |
| Community & Social Service | 71 (34.0%) | 138 (66.0%) |
| Education, Arts & Media | 25 (64.1%) | 14 (35.9%) |
| Legal Services & Support | 0 (0.0%) | 37 (100.0%) |
| Education Instruction & Library | 33 (35.9%) | 59 (64.1%) |
| Arts, Media & Entertainment | 13 (31.7%) | 28 (68.3%) |
| Health Diagnosing & Treating | 21 (12.0%) | 154 (88.0%) |
| Health Technologists | 21 (14.5%) | 124 (85.5%) |
| Total (Category) | 536 (41.5%) | 754 (58.5%) |
| Total (Overall) | 1,551 (48.2%) | 1,666 (51.8%) |
Services Occupations
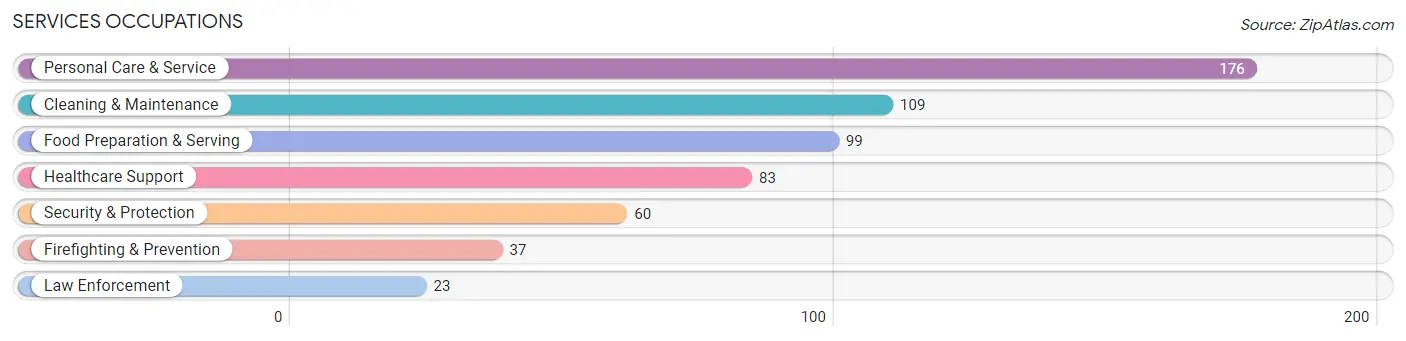
The most common Services occupations in Hampton Manor are Personal Care & Service (176 | 5.5%), Cleaning & Maintenance (109 | 3.4%), Food Preparation & Serving (99 | 3.1%), Healthcare Support (83 | 2.6%), and Security & Protection (60 | 1.9%).
Services Occupations by Sex
Within the Services occupations in Hampton Manor, the most male-oriented occupations are Firefighting & Prevention (100.0%), Security & Protection (86.7%), and Food Preparation & Serving (77.8%), while the most female-oriented occupations are Personal Care & Service (74.4%), Healthcare Support (61.5%), and Cleaning & Maintenance (56.0%).
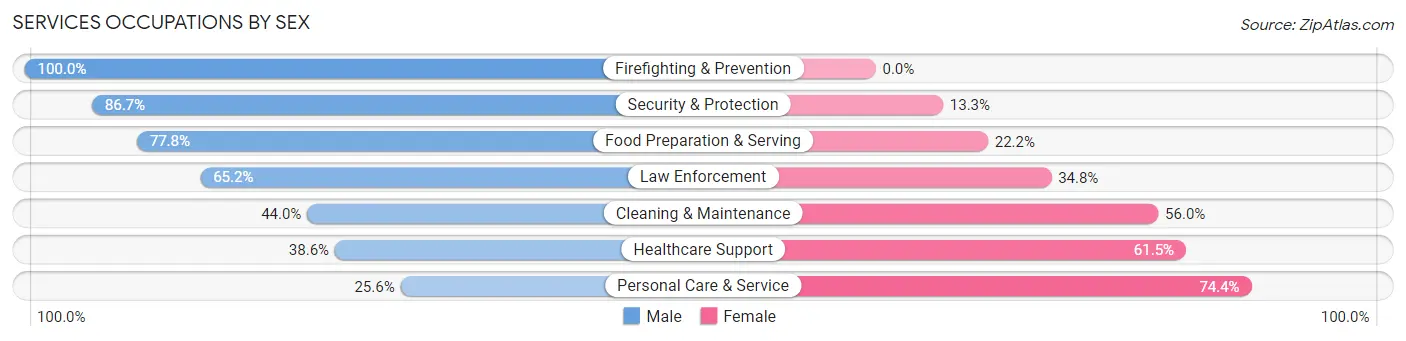
| Occupation | Male | Female |
| Healthcare Support | 32 (38.6%) | 51 (61.5%) |
| Security & Protection | 52 (86.7%) | 8 (13.3%) |
| Firefighting & Prevention | 37 (100.0%) | 0 (0.0%) |
| Law Enforcement | 15 (65.2%) | 8 (34.8%) |
| Food Preparation & Serving | 77 (77.8%) | 22 (22.2%) |
| Cleaning & Maintenance | 48 (44.0%) | 61 (56.0%) |
| Personal Care & Service | 45 (25.6%) | 131 (74.4%) |
| Total (Category) | 254 (48.2%) | 273 (51.8%) |
| Total (Overall) | 1,551 (48.2%) | 1,666 (51.8%) |
Sales and Office Occupations
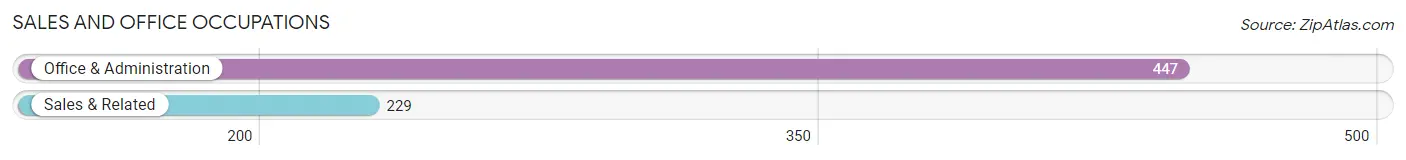
The most common Sales and Office occupations in Hampton Manor are Office & Administration (447 | 13.9%), and Sales & Related (229 | 7.1%).
Sales and Office Occupations by Sex
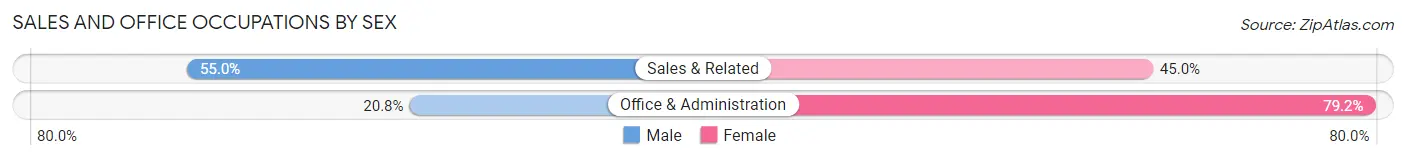
| Occupation | Male | Female |
| Sales & Related | 126 (55.0%) | 103 (45.0%) |
| Office & Administration | 93 (20.8%) | 354 (79.2%) |
| Total (Category) | 219 (32.4%) | 457 (67.6%) |
| Total (Overall) | 1,551 (48.2%) | 1,666 (51.8%) |
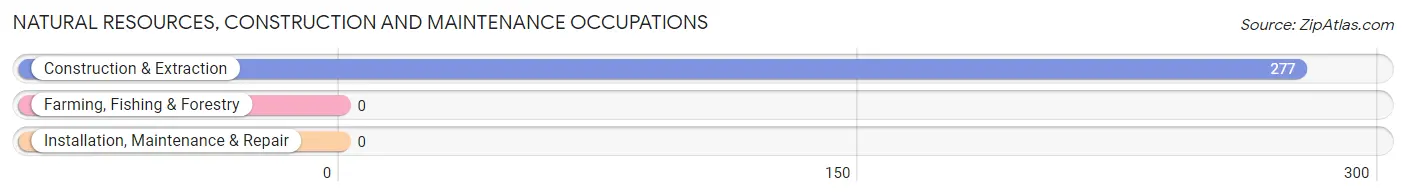
Natural Resources, Construction and Maintenance Occupations
The most common Natural Resources, Construction and Maintenance occupations in Hampton Manor are , and Construction & Extraction (277 | 8.6%).
Natural Resources, Construction and Maintenance Occupations by Sex
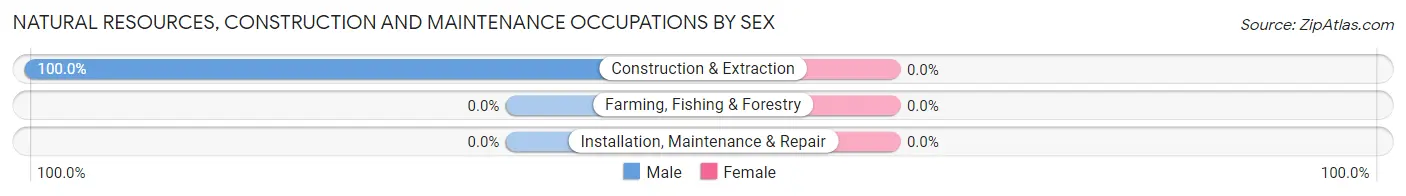
| Occupation | Male | Female |
| Farming, Fishing & Forestry | 0 (0.0%) | 0 (0.0%) |
| Construction & Extraction | 277 (100.0%) | 0 (0.0%) |
| Installation, Maintenance & Repair | 0 (0.0%) | 0 (0.0%) |
| Total (Category) | 277 (100.0%) | 0 (0.0%) |
| Total (Overall) | 1,551 (48.2%) | 1,666 (51.8%) |
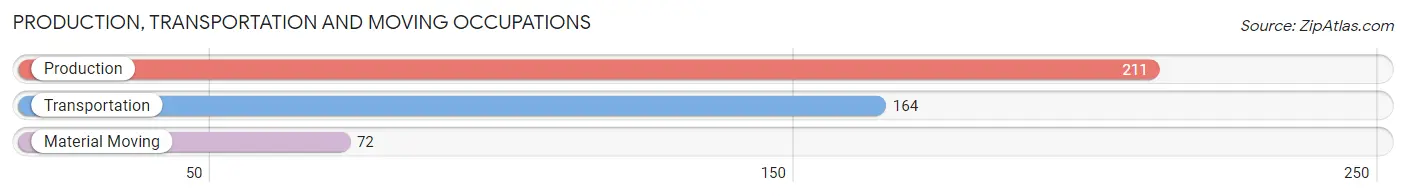
Production, Transportation and Moving Occupations
The most common Production, Transportation and Moving occupations in Hampton Manor are Production (211 | 6.6%), Transportation (164 | 5.1%), and Material Moving (72 | 2.2%).
Production, Transportation and Moving Occupations by Sex
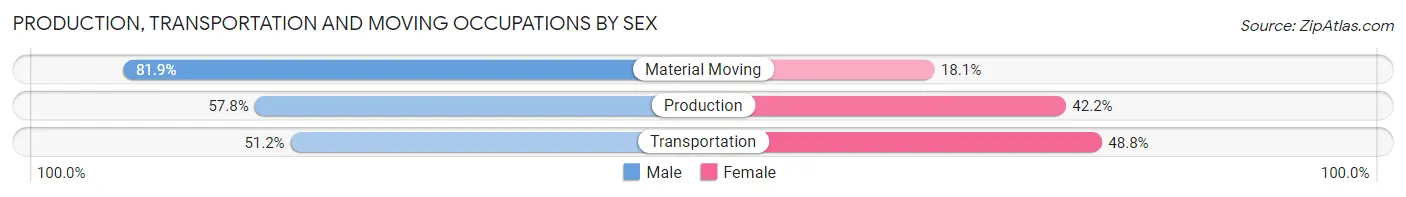
| Occupation | Male | Female |
| Production | 122 (57.8%) | 89 (42.2%) |
| Transportation | 84 (51.2%) | 80 (48.8%) |
| Material Moving | 59 (81.9%) | 13 (18.1%) |
| Total (Category) | 265 (59.3%) | 182 (40.7%) |
| Total (Overall) | 1,551 (48.2%) | 1,666 (51.8%) |
Employment Industries by Sex in Hampton Manor
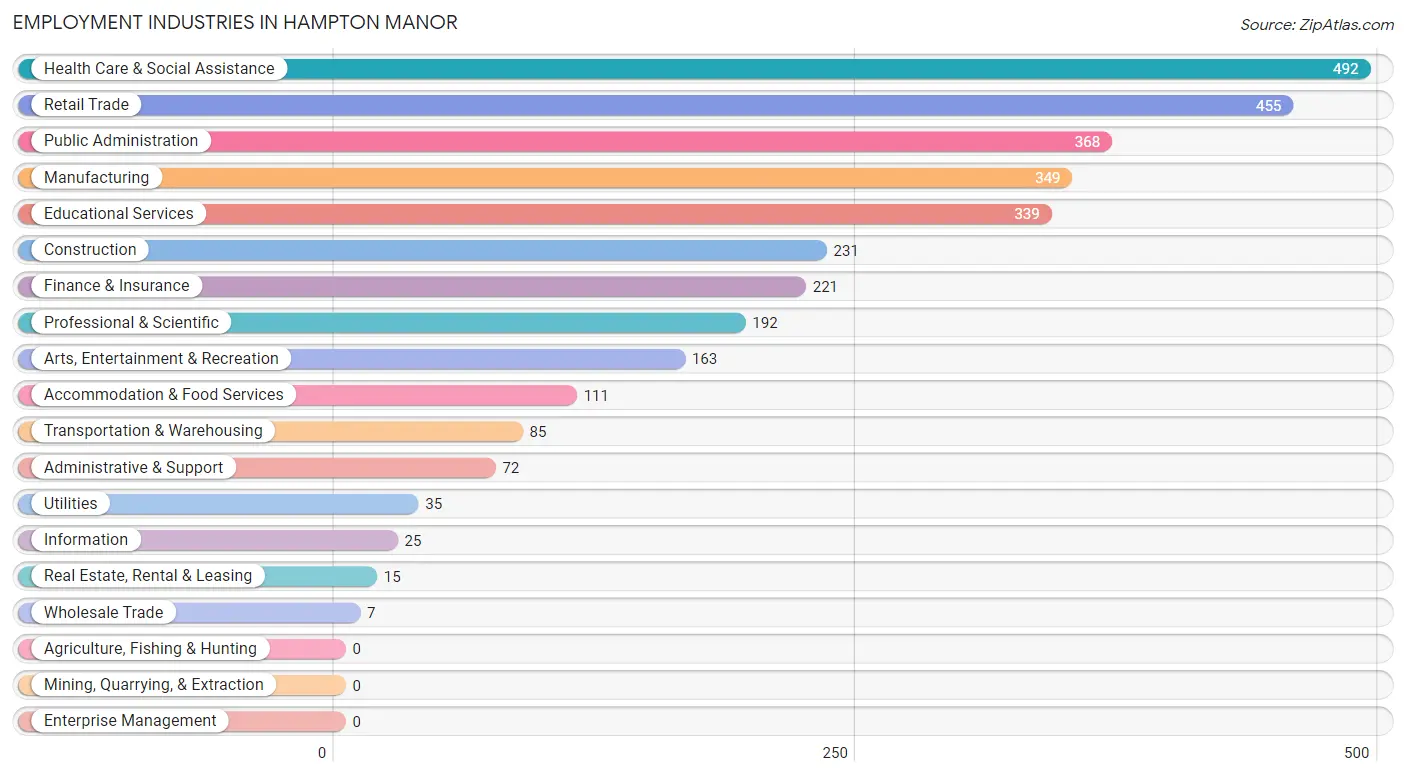
Employment Industries in Hampton Manor
The major employment industries in Hampton Manor include Health Care & Social Assistance (492 | 15.3%), Retail Trade (455 | 14.1%), Public Administration (368 | 11.4%), Manufacturing (349 | 10.8%), and Educational Services (339 | 10.5%).
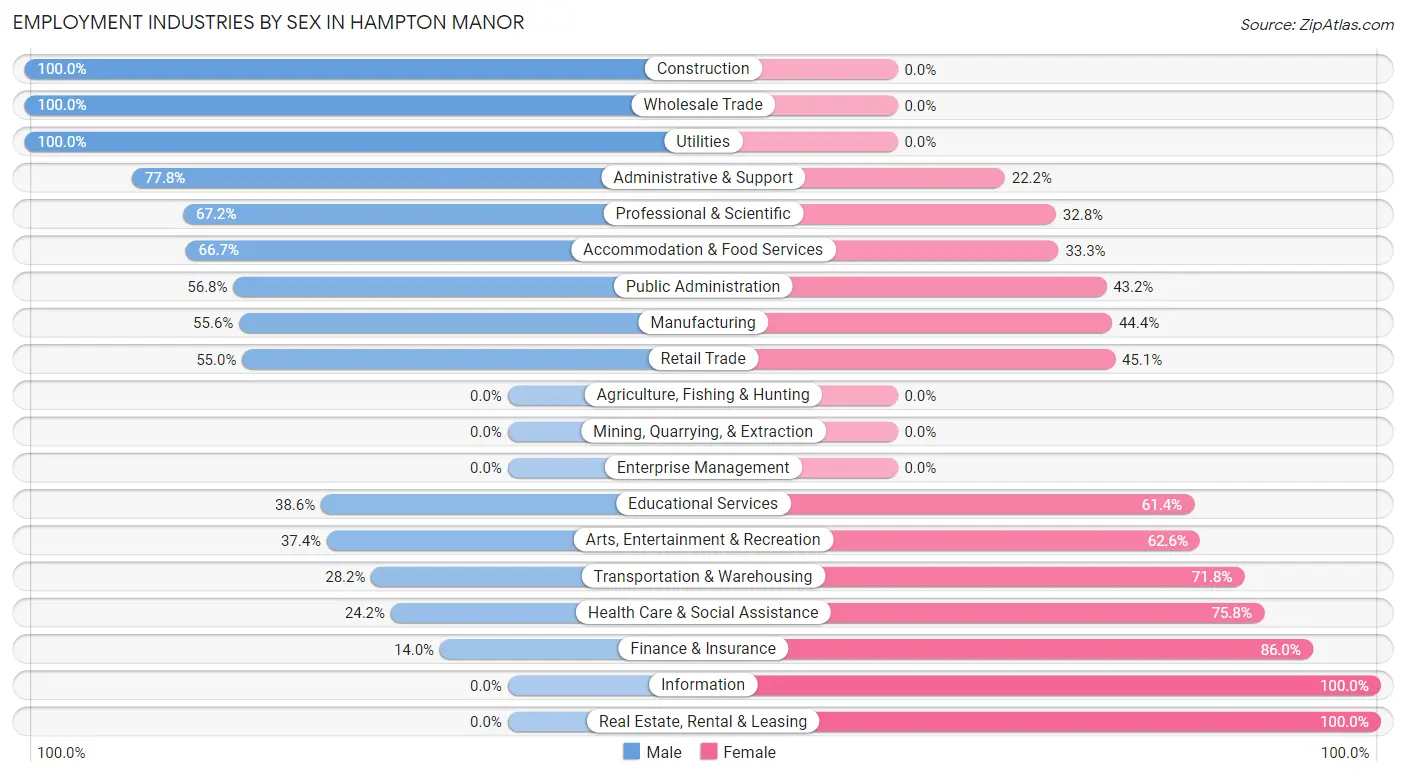
Employment Industries by Sex in Hampton Manor
The Hampton Manor industries that see more men than women are Construction (100.0%), Wholesale Trade (100.0%), and Utilities (100.0%), whereas the industries that tend to have a higher number of women are Information (100.0%), Real Estate, Rental & Leasing (100.0%), and Finance & Insurance (86.0%).
| Industry | Male | Female |
| Agriculture, Fishing & Hunting | 0 (0.0%) | 0 (0.0%) |
| Mining, Quarrying, & Extraction | 0 (0.0%) | 0 (0.0%) |
| Construction | 231 (100.0%) | 0 (0.0%) |
| Manufacturing | 194 (55.6%) | 155 (44.4%) |
| Wholesale Trade | 7 (100.0%) | 0 (0.0%) |
| Retail Trade | 250 (54.9%) | 205 (45.1%) |
| Transportation & Warehousing | 24 (28.2%) | 61 (71.8%) |
| Utilities | 35 (100.0%) | 0 (0.0%) |
| Information | 0 (0.0%) | 25 (100.0%) |
| Finance & Insurance | 31 (14.0%) | 190 (86.0%) |
| Real Estate, Rental & Leasing | 0 (0.0%) | 15 (100.0%) |
| Professional & Scientific | 129 (67.2%) | 63 (32.8%) |
| Enterprise Management | 0 (0.0%) | 0 (0.0%) |
| Administrative & Support | 56 (77.8%) | 16 (22.2%) |
| Educational Services | 131 (38.6%) | 208 (61.4%) |
| Health Care & Social Assistance | 119 (24.2%) | 373 (75.8%) |
| Arts, Entertainment & Recreation | 61 (37.4%) | 102 (62.6%) |
| Accommodation & Food Services | 74 (66.7%) | 37 (33.3%) |
| Public Administration | 209 (56.8%) | 159 (43.2%) |
| Total | 1,551 (48.2%) | 1,666 (51.8%) |
Education in Hampton Manor
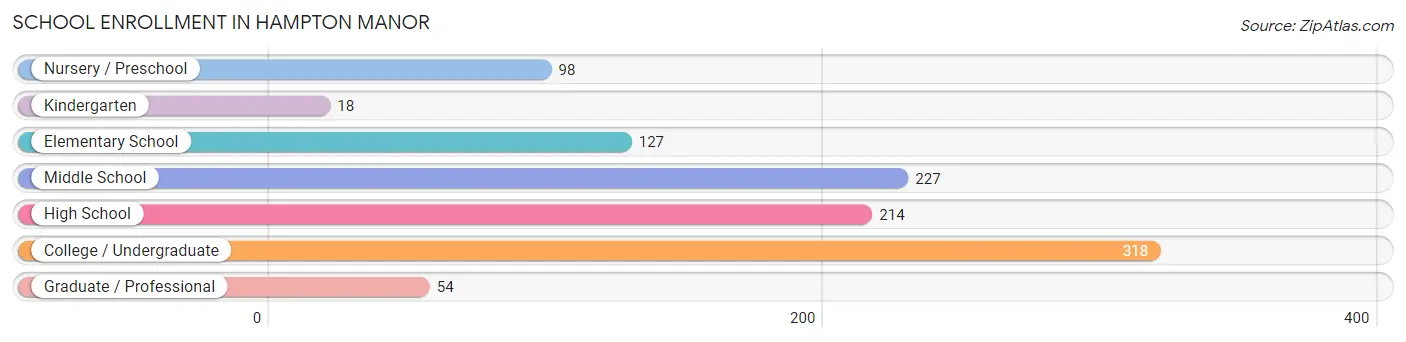
School Enrollment in Hampton Manor
The most common levels of schooling among the 1,056 students in Hampton Manor are college / undergraduate (318 | 30.1%), middle school (227 | 21.5%), and high school (214 | 20.3%).
| School Level | # Students | % Students |
| Nursery / Preschool | 98 | 9.3% |
| Kindergarten | 18 | 1.7% |
| Elementary School | 127 | 12.0% |
| Middle School | 227 | 21.5% |
| High School | 214 | 20.3% |
| College / Undergraduate | 318 | 30.1% |
| Graduate / Professional | 54 | 5.1% |
| Total | 1,056 | 100.0% |
School Enrollment by Age by Funding Source in Hampton Manor
Out of a total of 1,056 students who are enrolled in schools in Hampton Manor, 74 (7.0%) attend a private institution, while the remaining 982 (93.0%) are enrolled in public schools. The age group of 20 to 24 year olds has the highest likelihood of being enrolled in private schools, with 50 (70.4% in the age bracket) enrolled. Conversely, the age group of 3 to 4 year olds has the lowest likelihood of being enrolled in a private school, with 98 (100.0% in the age bracket) attending a public institution.
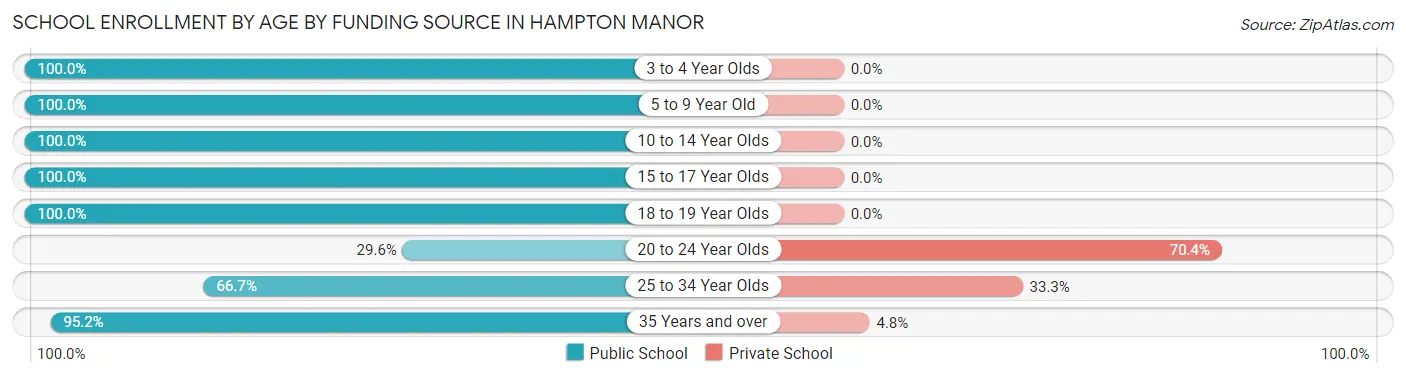
| Age Bracket | Public School | Private School |
| 3 to 4 Year Olds | 98 (100.0%) | 0 (0.0%) |
| 5 to 9 Year Old | 145 (100.0%) | 0 (0.0%) |
| 10 to 14 Year Olds | 268 (100.0%) | 0 (0.0%) |
| 15 to 17 Year Olds | 173 (100.0%) | 0 (0.0%) |
| 18 to 19 Year Olds | 34 (100.0%) | 0 (0.0%) |
| 20 to 24 Year Olds | 21 (29.6%) | 50 (70.4%) |
| 25 to 34 Year Olds | 26 (66.7%) | 13 (33.3%) |
| 35 Years and over | 217 (95.2%) | 11 (4.8%) |
| Total | 982 (93.0%) | 74 (7.0%) |
Educational Attainment by Field of Study in Hampton Manor
Business (303 | 20.4%), education (209 | 14.1%), science & technology (197 | 13.3%), bio, nature & agricultural (122 | 8.2%), and social sciences (110 | 7.4%) are the most common fields of study among 1,485 individuals in Hampton Manor who have obtained a bachelor's degree or higher.
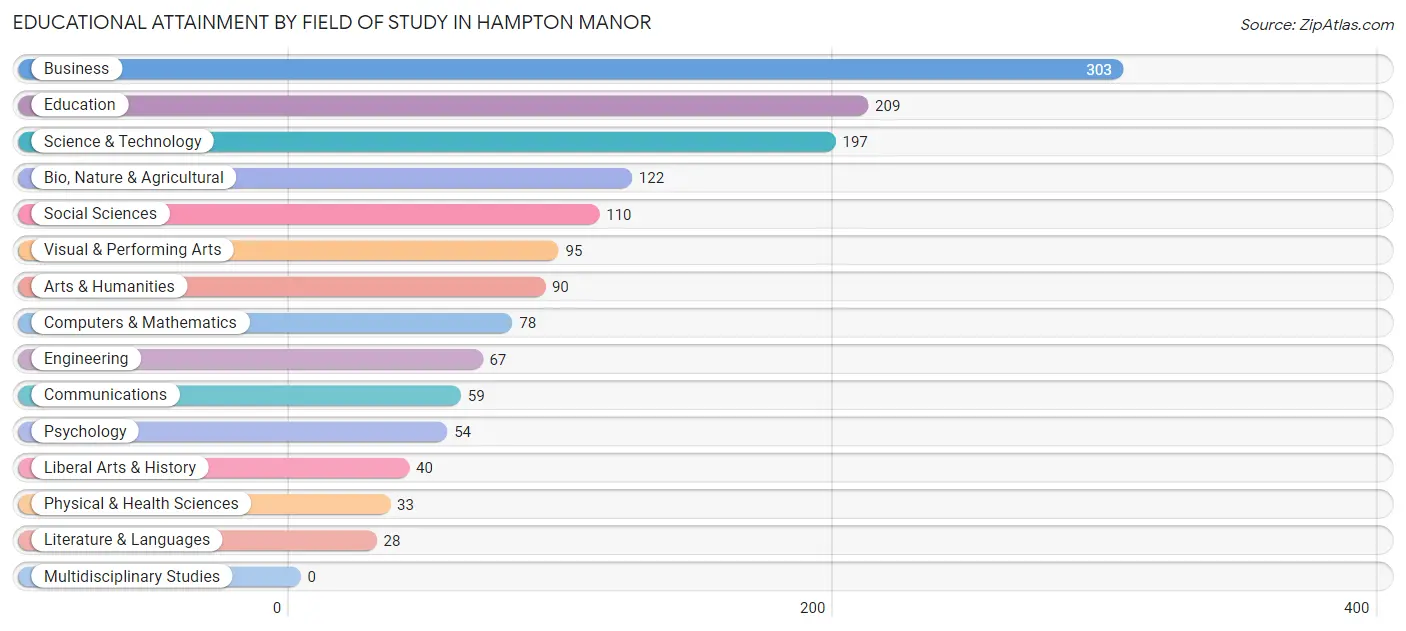
| Field of Study | # Graduates | % Graduates |
| Computers & Mathematics | 78 | 5.2% |
| Bio, Nature & Agricultural | 122 | 8.2% |
| Physical & Health Sciences | 33 | 2.2% |
| Psychology | 54 | 3.6% |
| Social Sciences | 110 | 7.4% |
| Engineering | 67 | 4.5% |
| Multidisciplinary Studies | 0 | 0.0% |
| Science & Technology | 197 | 13.3% |
| Business | 303 | 20.4% |
| Education | 209 | 14.1% |
| Literature & Languages | 28 | 1.9% |
| Liberal Arts & History | 40 | 2.7% |
| Visual & Performing Arts | 95 | 6.4% |
| Communications | 59 | 4.0% |
| Arts & Humanities | 90 | 6.1% |
| Total | 1,485 | 100.0% |
Transportation & Commute in Hampton Manor
Vehicle Availability by Sex in Hampton Manor
The most prevalent vehicle ownership categories in Hampton Manor are males with 2 vehicles (741, accounting for 48.3%) and females with 2 vehicles (813, making up 44.7%).
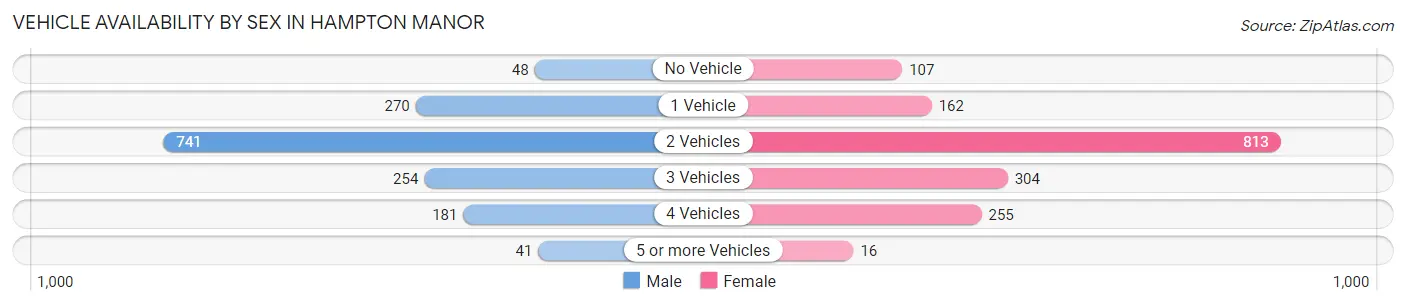
| Vehicles Available | Male | Female |
| No Vehicle | 48 (3.1%) | 107 (6.5%) |
| 1 Vehicle | 270 (17.6%) | 162 (9.8%) |
| 2 Vehicles | 741 (48.3%) | 813 (49.1%) |
| 3 Vehicles | 254 (16.6%) | 304 (18.3%) |
| 4 Vehicles | 181 (11.8%) | 255 (15.4%) |
| 5 or more Vehicles | 41 (2.7%) | 16 (1.0%) |
| Total | 1,535 (100.0%) | 1,657 (100.0%) |
Commute Time in Hampton Manor
The most frequently occuring commute durations in Hampton Manor are 10 to 14 minutes (638 commuters, 22.0%), 20 to 24 minutes (621 commuters, 21.4%), and 5 to 9 minutes (580 commuters, 20.0%).
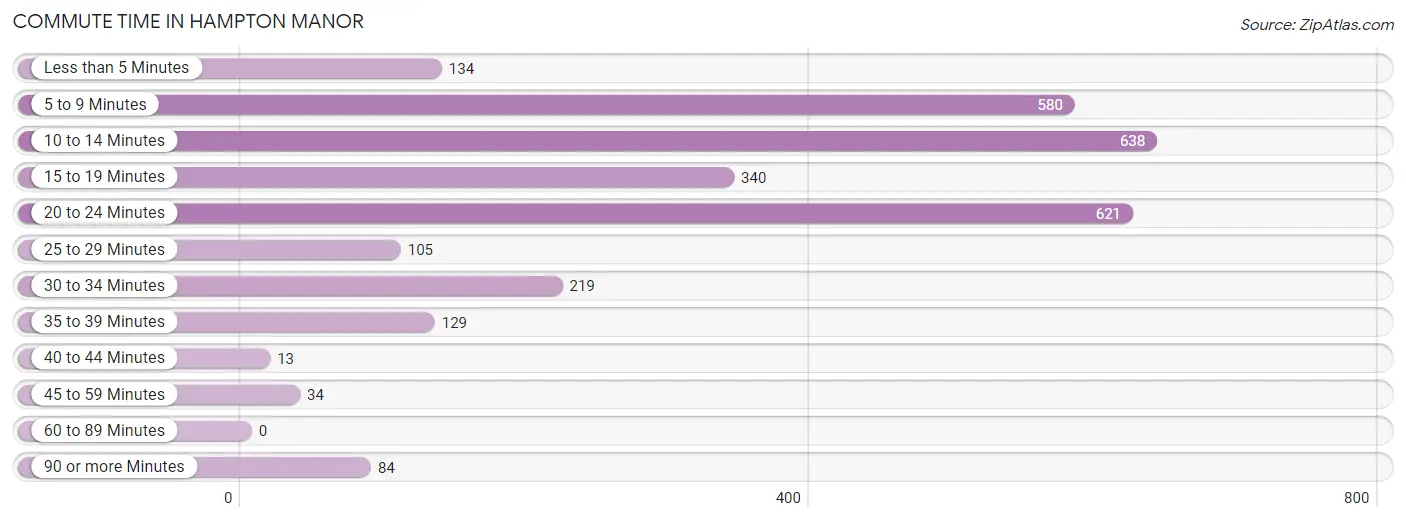
| Commute Time | # Commuters | % Commuters |
| Less than 5 Minutes | 134 | 4.6% |
| 5 to 9 Minutes | 580 | 20.0% |
| 10 to 14 Minutes | 638 | 22.0% |
| 15 to 19 Minutes | 340 | 11.7% |
| 20 to 24 Minutes | 621 | 21.4% |
| 25 to 29 Minutes | 105 | 3.6% |
| 30 to 34 Minutes | 219 | 7.6% |
| 35 to 39 Minutes | 129 | 4.4% |
| 40 to 44 Minutes | 13 | 0.4% |
| 45 to 59 Minutes | 34 | 1.2% |
| 60 to 89 Minutes | 0 | 0.0% |
| 90 or more Minutes | 84 | 2.9% |
Commute Time by Sex in Hampton Manor
The most common commute times in Hampton Manor are 20 to 24 minutes (323 commuters, 22.6%) for males and 5 to 9 minutes (374 commuters, 25.5%) for females.
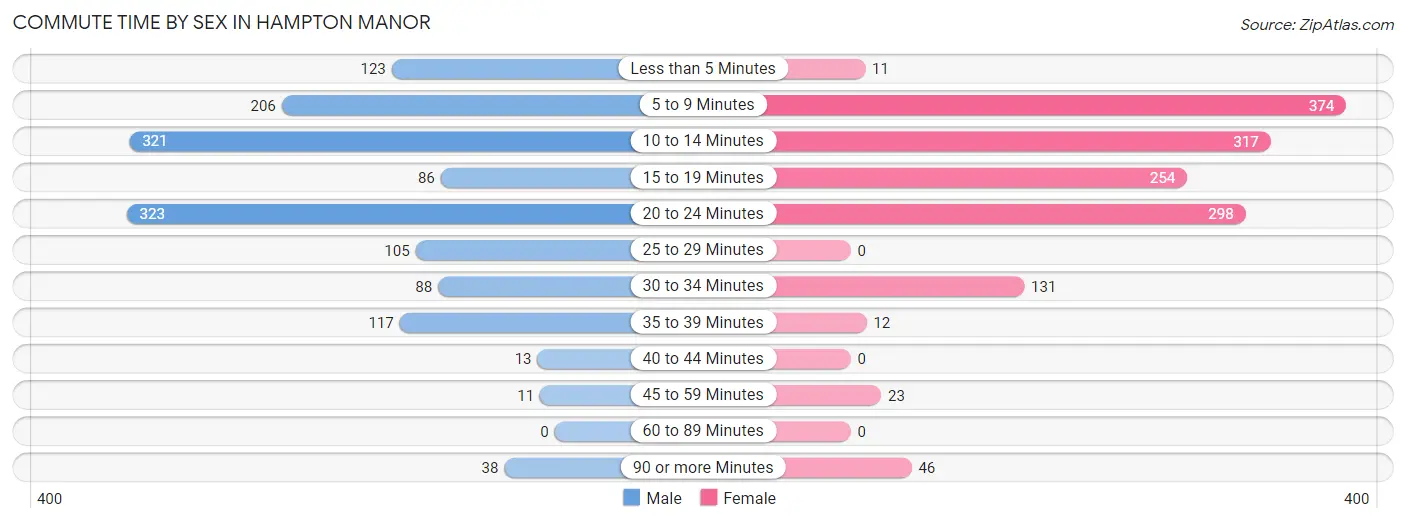
| Commute Time | Male | Female |
| Less than 5 Minutes | 123 (8.6%) | 11 (0.7%) |
| 5 to 9 Minutes | 206 (14.4%) | 374 (25.5%) |
| 10 to 14 Minutes | 321 (22.4%) | 317 (21.6%) |
| 15 to 19 Minutes | 86 (6.0%) | 254 (17.3%) |
| 20 to 24 Minutes | 323 (22.6%) | 298 (20.3%) |
| 25 to 29 Minutes | 105 (7.3%) | 0 (0.0%) |
| 30 to 34 Minutes | 88 (6.1%) | 131 (8.9%) |
| 35 to 39 Minutes | 117 (8.2%) | 12 (0.8%) |
| 40 to 44 Minutes | 13 (0.9%) | 0 (0.0%) |
| 45 to 59 Minutes | 11 (0.8%) | 23 (1.6%) |
| 60 to 89 Minutes | 0 (0.0%) | 0 (0.0%) |
| 90 or more Minutes | 38 (2.7%) | 46 (3.1%) |
Time of Departure to Work by Sex in Hampton Manor
The most frequent times of departure to work in Hampton Manor are 6:30 AM to 6:59 AM (304, 21.2%) for males and 7:30 AM to 7:59 AM (325, 22.2%) for females.
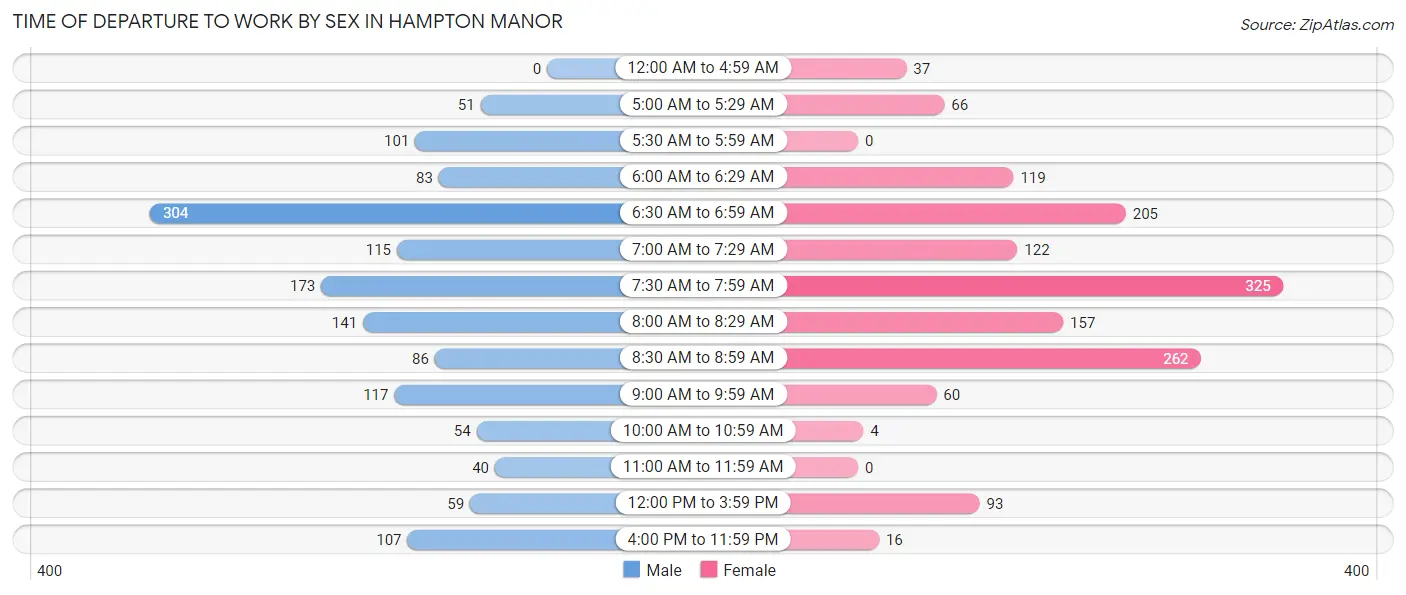
| Time of Departure | Male | Female |
| 12:00 AM to 4:59 AM | 0 (0.0%) | 37 (2.5%) |
| 5:00 AM to 5:29 AM | 51 (3.6%) | 66 (4.5%) |
| 5:30 AM to 5:59 AM | 101 (7.1%) | 0 (0.0%) |
| 6:00 AM to 6:29 AM | 83 (5.8%) | 119 (8.1%) |
| 6:30 AM to 6:59 AM | 304 (21.2%) | 205 (14.0%) |
| 7:00 AM to 7:29 AM | 115 (8.0%) | 122 (8.3%) |
| 7:30 AM to 7:59 AM | 173 (12.1%) | 325 (22.2%) |
| 8:00 AM to 8:29 AM | 141 (9.9%) | 157 (10.7%) |
| 8:30 AM to 8:59 AM | 86 (6.0%) | 262 (17.9%) |
| 9:00 AM to 9:59 AM | 117 (8.2%) | 60 (4.1%) |
| 10:00 AM to 10:59 AM | 54 (3.8%) | 4 (0.3%) |
| 11:00 AM to 11:59 AM | 40 (2.8%) | 0 (0.0%) |
| 12:00 PM to 3:59 PM | 59 (4.1%) | 93 (6.3%) |
| 4:00 PM to 11:59 PM | 107 (7.5%) | 16 (1.1%) |
| Total | 1,431 (100.0%) | 1,466 (100.0%) |
Housing Occupancy in Hampton Manor
Occupancy by Ownership in Hampton Manor
Of the total 2,152 dwellings in Hampton Manor, owner-occupied units account for 1,680 (78.1%), while renter-occupied units make up 472 (21.9%).
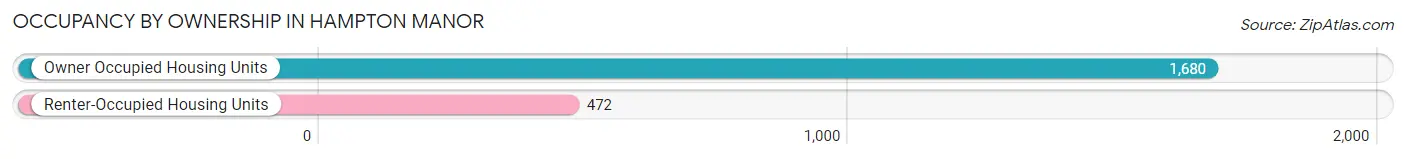
| Occupancy | # Housing Units | % Housing Units |
| Owner Occupied Housing Units | 1,680 | 78.1% |
| Renter-Occupied Housing Units | 472 | 21.9% |
| Total Occupied Housing Units | 2,152 | 100.0% |
Occupancy by Household Size in Hampton Manor
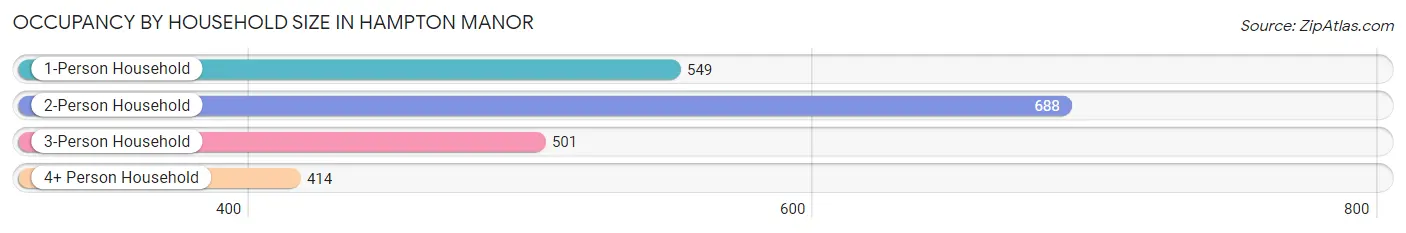
| Household Size | # Housing Units | % Housing Units |
| 1-Person Household | 549 | 25.5% |
| 2-Person Household | 688 | 32.0% |
| 3-Person Household | 501 | 23.3% |
| 4+ Person Household | 414 | 19.2% |
| Total Housing Units | 2,152 | 100.0% |
Occupancy by Ownership by Household Size in Hampton Manor
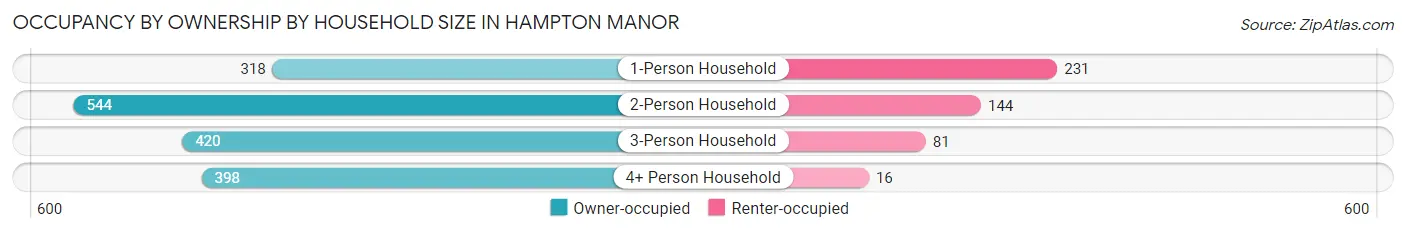
| Household Size | Owner-occupied | Renter-occupied |
| 1-Person Household | 318 (57.9%) | 231 (42.1%) |
| 2-Person Household | 544 (79.1%) | 144 (20.9%) |
| 3-Person Household | 420 (83.8%) | 81 (16.2%) |
| 4+ Person Household | 398 (96.1%) | 16 (3.9%) |
| Total Housing Units | 1,680 (78.1%) | 472 (21.9%) |
Occupancy by Educational Attainment in Hampton Manor
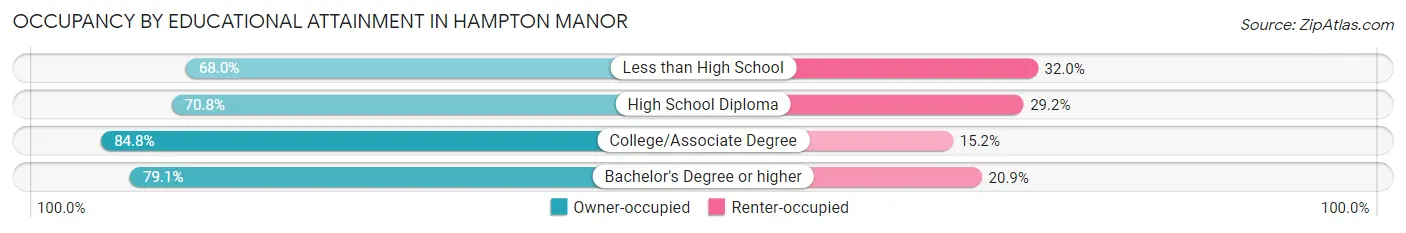
| Household Size | Owner-occupied | Renter-occupied |
| Less than High School | 51 (68.0%) | 24 (32.0%) |
| High School Diploma | 430 (70.8%) | 177 (29.2%) |
| College/Associate Degree | 541 (84.8%) | 97 (15.2%) |
| Bachelor's Degree or higher | 658 (79.1%) | 174 (20.9%) |
Occupancy by Age of Householder in Hampton Manor
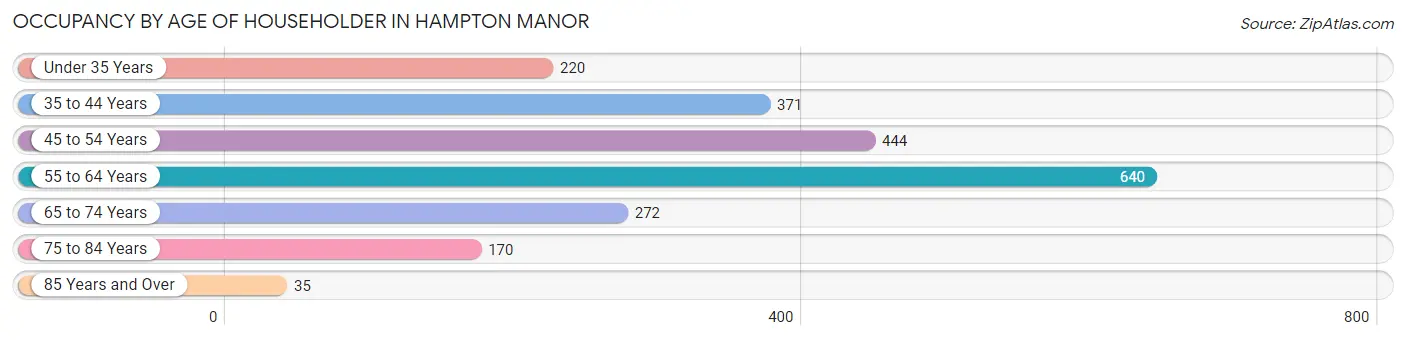
| Age Bracket | # Households | % Households |
| Under 35 Years | 220 | 10.2% |
| 35 to 44 Years | 371 | 17.2% |
| 45 to 54 Years | 444 | 20.6% |
| 55 to 64 Years | 640 | 29.7% |
| 65 to 74 Years | 272 | 12.6% |
| 75 to 84 Years | 170 | 7.9% |
| 85 Years and Over | 35 | 1.6% |
| Total | 2,152 | 100.0% |
Housing Finances in Hampton Manor
Median Income by Occupancy in Hampton Manor
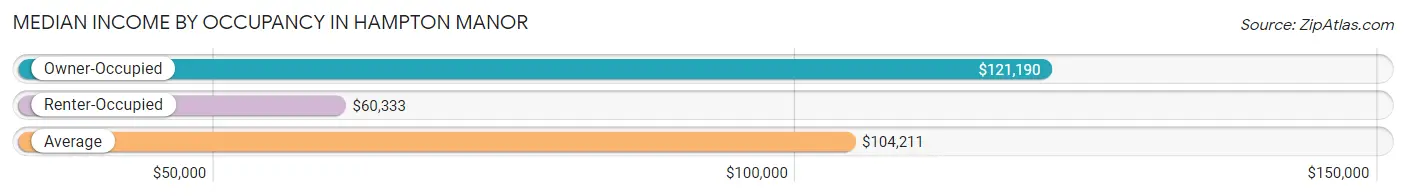
| Occupancy Type | # Households | Median Income |
| Owner-Occupied | 1,680 (78.1%) | $121,190 |
| Renter-Occupied | 472 (21.9%) | $60,333 |
| Average | 2,152 (100.0%) | $104,211 |
Occupancy by Householder Income Bracket in Hampton Manor
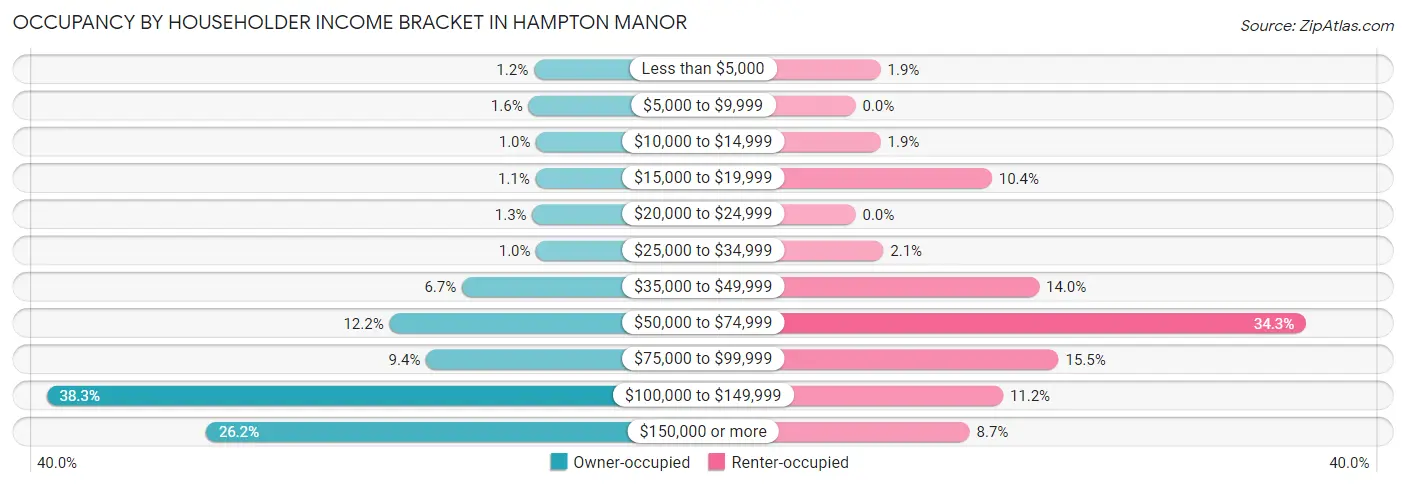
| Income Bracket | Owner-occupied | Renter-occupied |
| Less than $5,000 | 20 (1.2%) | 9 (1.9%) |
| $5,000 to $9,999 | 27 (1.6%) | 0 (0.0%) |
| $10,000 to $14,999 | 17 (1.0%) | 9 (1.9%) |
| $15,000 to $19,999 | 18 (1.1%) | 49 (10.4%) |
| $20,000 to $24,999 | 22 (1.3%) | 0 (0.0%) |
| $25,000 to $34,999 | 17 (1.0%) | 10 (2.1%) |
| $35,000 to $49,999 | 112 (6.7%) | 66 (14.0%) |
| $50,000 to $74,999 | 205 (12.2%) | 162 (34.3%) |
| $75,000 to $99,999 | 158 (9.4%) | 73 (15.5%) |
| $100,000 to $149,999 | 644 (38.3%) | 53 (11.2%) |
| $150,000 or more | 440 (26.2%) | 41 (8.7%) |
| Total | 1,680 (100.0%) | 472 (100.0%) |
Monthly Housing Cost Tiers in Hampton Manor
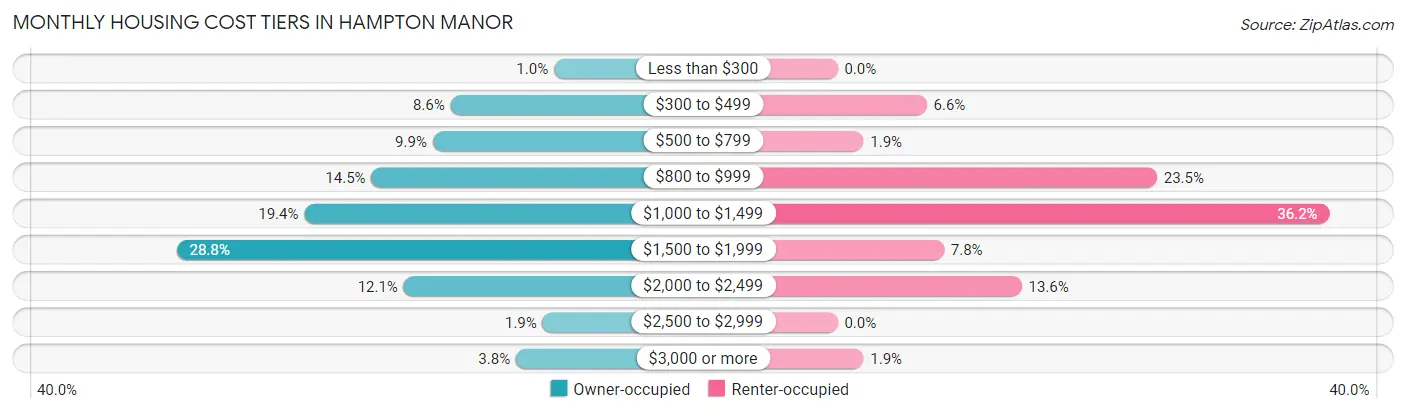
| Monthly Cost | Owner-occupied | Renter-occupied |
| Less than $300 | 17 (1.0%) | 0 (0.0%) |
| $300 to $499 | 145 (8.6%) | 31 (6.6%) |
| $500 to $799 | 167 (9.9%) | 9 (1.9%) |
| $800 to $999 | 243 (14.5%) | 111 (23.5%) |
| $1,000 to $1,499 | 326 (19.4%) | 171 (36.2%) |
| $1,500 to $1,999 | 484 (28.8%) | 37 (7.8%) |
| $2,000 to $2,499 | 203 (12.1%) | 64 (13.6%) |
| $2,500 to $2,999 | 31 (1.8%) | 0 (0.0%) |
| $3,000 or more | 64 (3.8%) | 9 (1.9%) |
| Total | 1,680 (100.0%) | 472 (100.0%) |
Physical Housing Characteristics in Hampton Manor
Housing Structures in Hampton Manor
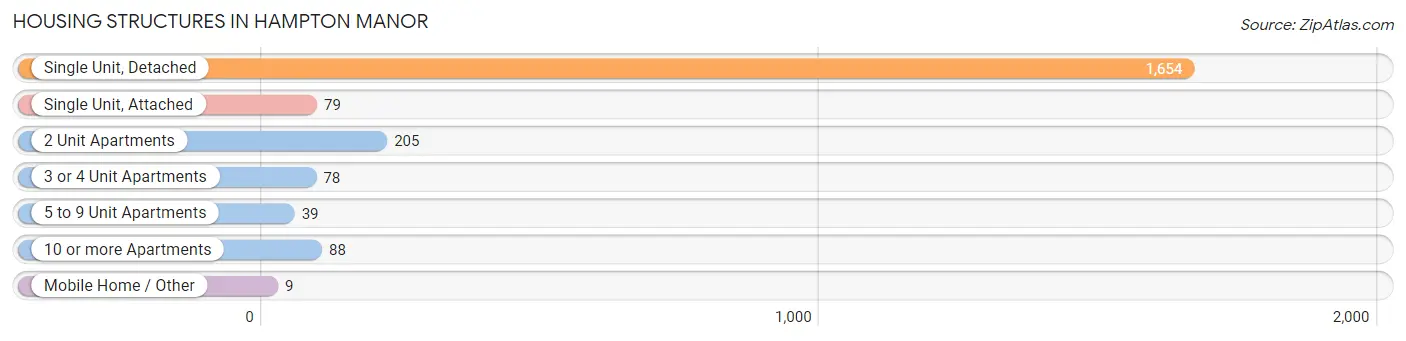
| Structure Type | # Housing Units | % Housing Units |
| Single Unit, Detached | 1,654 | 76.9% |
| Single Unit, Attached | 79 | 3.7% |
| 2 Unit Apartments | 205 | 9.5% |
| 3 or 4 Unit Apartments | 78 | 3.6% |
| 5 to 9 Unit Apartments | 39 | 1.8% |
| 10 or more Apartments | 88 | 4.1% |
| Mobile Home / Other | 9 | 0.4% |
| Total | 2,152 | 100.0% |
Housing Structures by Occupancy in Hampton Manor
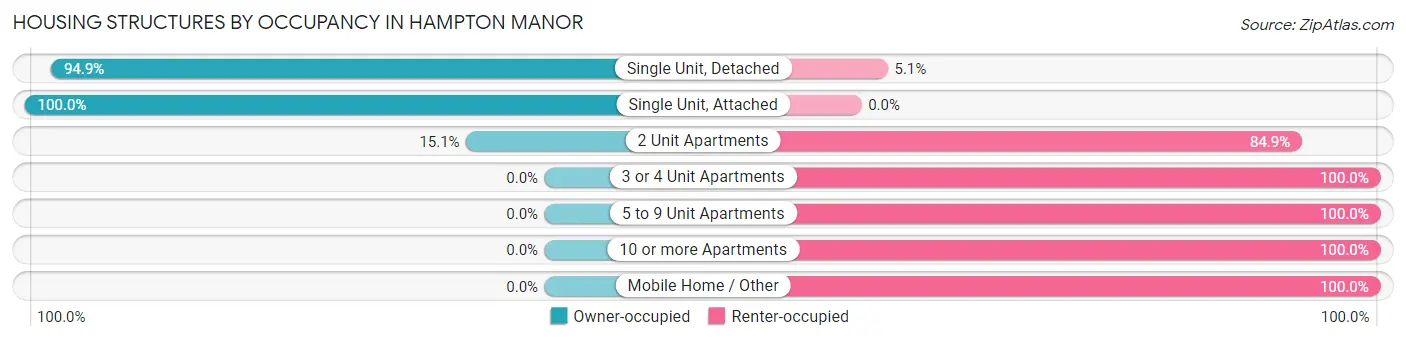
| Structure Type | Owner-occupied | Renter-occupied |
| Single Unit, Detached | 1,570 (94.9%) | 84 (5.1%) |
| Single Unit, Attached | 79 (100.0%) | 0 (0.0%) |
| 2 Unit Apartments | 31 (15.1%) | 174 (84.9%) |
| 3 or 4 Unit Apartments | 0 (0.0%) | 78 (100.0%) |
| 5 to 9 Unit Apartments | 0 (0.0%) | 39 (100.0%) |
| 10 or more Apartments | 0 (0.0%) | 88 (100.0%) |
| Mobile Home / Other | 0 (0.0%) | 9 (100.0%) |
| Total | 1,680 (78.1%) | 472 (21.9%) |
Housing Structures by Number of Rooms in Hampton Manor
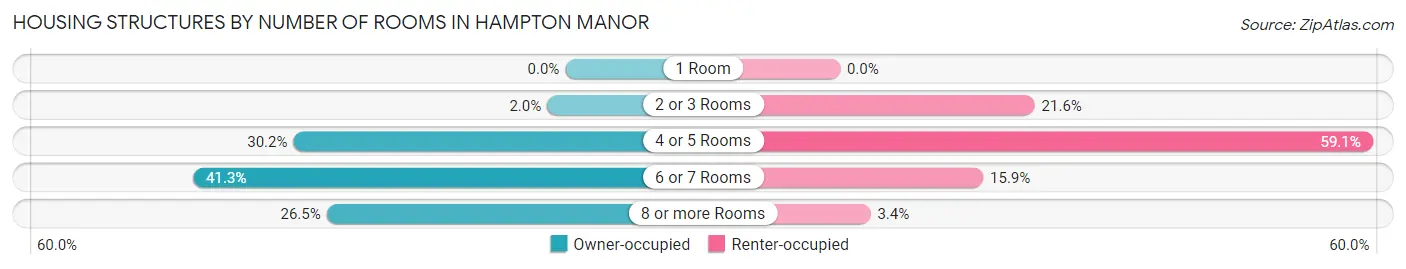
| Number of Rooms | Owner-occupied | Renter-occupied |
| 1 Room | 0 (0.0%) | 0 (0.0%) |
| 2 or 3 Rooms | 34 (2.0%) | 102 (21.6%) |
| 4 or 5 Rooms | 507 (30.2%) | 279 (59.1%) |
| 6 or 7 Rooms | 694 (41.3%) | 75 (15.9%) |
| 8 or more Rooms | 445 (26.5%) | 16 (3.4%) |
| Total | 1,680 (100.0%) | 472 (100.0%) |
Housing Structure by Heating Type in Hampton Manor
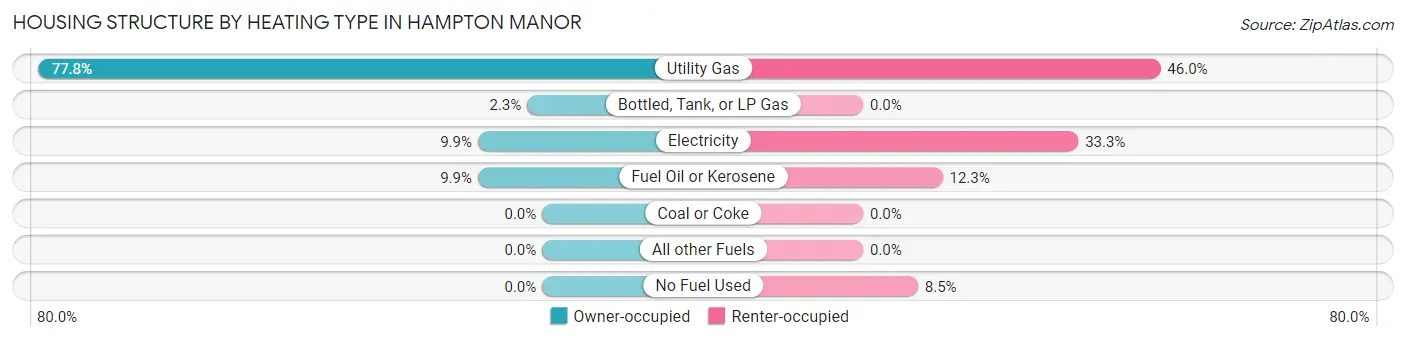
| Heating Type | Owner-occupied | Renter-occupied |
| Utility Gas | 1,307 (77.8%) | 217 (46.0%) |
| Bottled, Tank, or LP Gas | 39 (2.3%) | 0 (0.0%) |
| Electricity | 167 (9.9%) | 157 (33.3%) |
| Fuel Oil or Kerosene | 167 (9.9%) | 58 (12.3%) |
| Coal or Coke | 0 (0.0%) | 0 (0.0%) |
| All other Fuels | 0 (0.0%) | 0 (0.0%) |
| No Fuel Used | 0 (0.0%) | 40 (8.5%) |
| Total | 1,680 (100.0%) | 472 (100.0%) |
Household Vehicle Usage in Hampton Manor
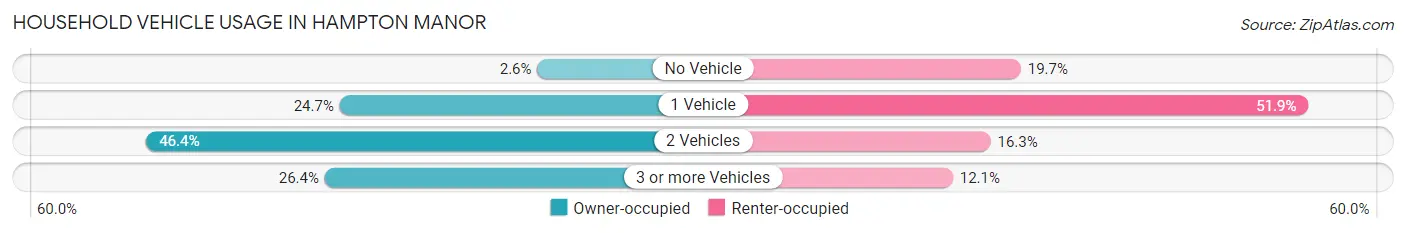
| Vehicles per Household | Owner-occupied | Renter-occupied |
| No Vehicle | 43 (2.6%) | 93 (19.7%) |
| 1 Vehicle | 415 (24.7%) | 245 (51.9%) |
| 2 Vehicles | 779 (46.4%) | 77 (16.3%) |
| 3 or more Vehicles | 443 (26.4%) | 57 (12.1%) |
| Total | 1,680 (100.0%) | 472 (100.0%) |
Real Estate & Mortgages in Hampton Manor
Real Estate and Mortgage Overview in Hampton Manor
| Characteristic | Without Mortgage | With Mortgage |
| Housing Units | 667 | 1,013 |
| Median Property Value | $216,300 | $196,900 |
| Median Household Income | $94,363 | $353 |
| Monthly Housing Costs | $803 | $64 |
| Real Estate Taxes | $4,707 | $39 |
Property Value by Mortgage Status in Hampton Manor
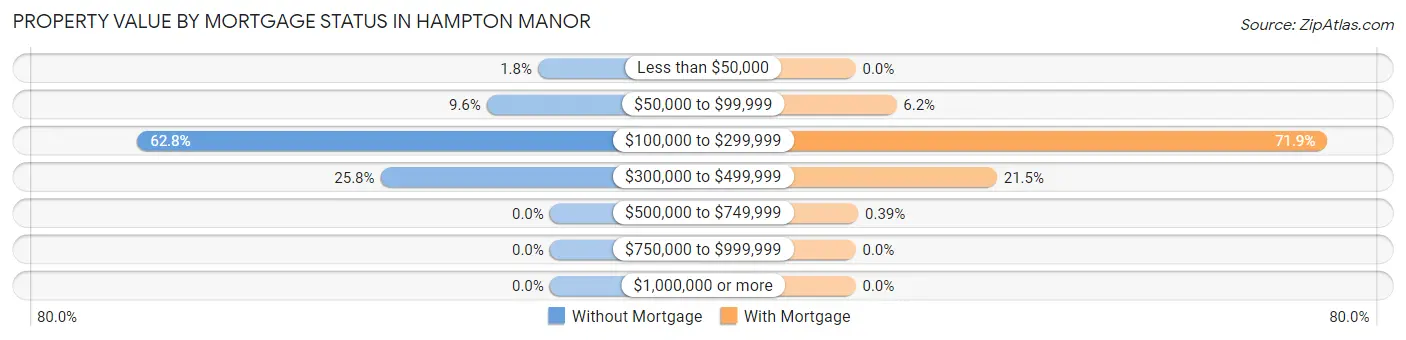
| Property Value | Without Mortgage | With Mortgage |
| Less than $50,000 | 12 (1.8%) | 0 (0.0%) |
| $50,000 to $99,999 | 64 (9.6%) | 63 (6.2%) |
| $100,000 to $299,999 | 419 (62.8%) | 728 (71.9%) |
| $300,000 to $499,999 | 172 (25.8%) | 218 (21.5%) |
| $500,000 to $749,999 | 0 (0.0%) | 4 (0.4%) |
| $750,000 to $999,999 | 0 (0.0%) | 0 (0.0%) |
| $1,000,000 or more | 0 (0.0%) | 0 (0.0%) |
| Total | 667 (100.0%) | 1,013 (100.0%) |
Household Income by Mortgage Status in Hampton Manor
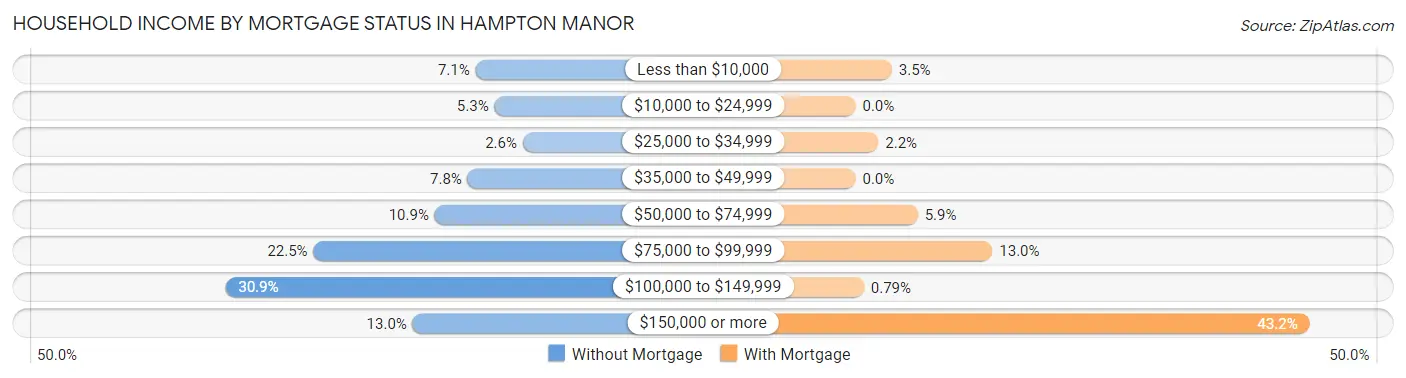
| Household Income | Without Mortgage | With Mortgage |
| Less than $10,000 | 47 (7.0%) | 35 (3.5%) |
| $10,000 to $24,999 | 35 (5.2%) | 0 (0.0%) |
| $25,000 to $34,999 | 17 (2.5%) | 22 (2.2%) |
| $35,000 to $49,999 | 52 (7.8%) | 0 (0.0%) |
| $50,000 to $74,999 | 73 (10.9%) | 60 (5.9%) |
| $75,000 to $99,999 | 150 (22.5%) | 132 (13.0%) |
| $100,000 to $149,999 | 206 (30.9%) | 8 (0.8%) |
| $150,000 or more | 87 (13.0%) | 438 (43.2%) |
| Total | 667 (100.0%) | 1,013 (100.0%) |
Property Value to Household Income Ratio in Hampton Manor
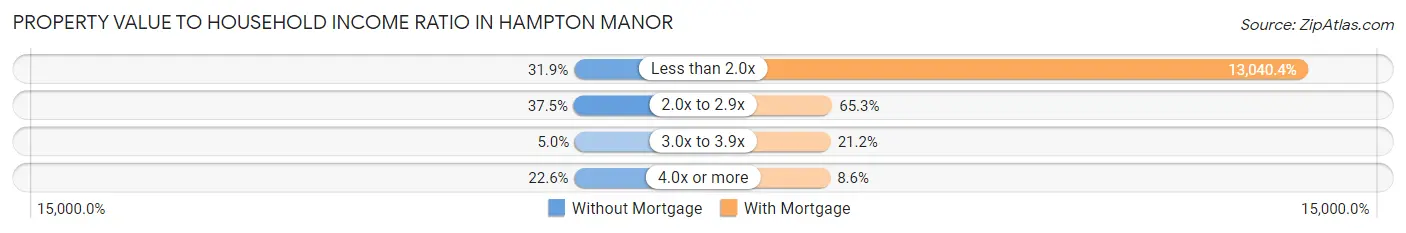
| Value-to-Income Ratio | Without Mortgage | With Mortgage |
| Less than 2.0x | 213 (31.9%) | 132,099 (13,040.4%) |
| 2.0x to 2.9x | 250 (37.5%) | 661 (65.2%) |
| 3.0x to 3.9x | 33 (5.0%) | 215 (21.2%) |
| 4.0x or more | 151 (22.6%) | 87 (8.6%) |
| Total | 667 (100.0%) | 1,013 (100.0%) |
Real Estate Taxes by Mortgage Status in Hampton Manor
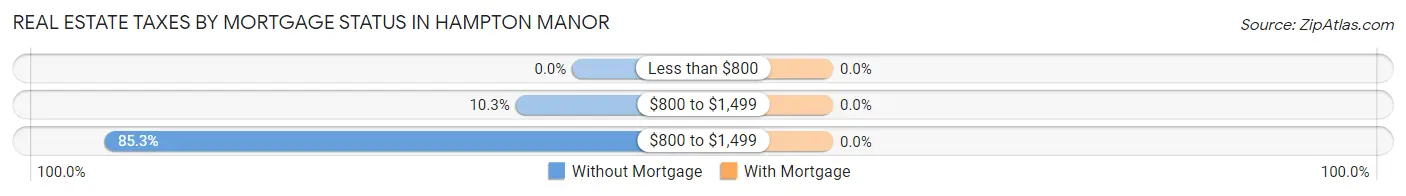
| Property Taxes | Without Mortgage | With Mortgage |
| Less than $800 | 0 (0.0%) | 0 (0.0%) |
| $800 to $1,499 | 69 (10.3%) | 0 (0.0%) |
| $800 to $1,499 | 569 (85.3%) | 0 (0.0%) |
| Total | 667 (100.0%) | 1,013 (100.0%) |
Health & Disability in Hampton Manor
Health Insurance Coverage by Age in Hampton Manor
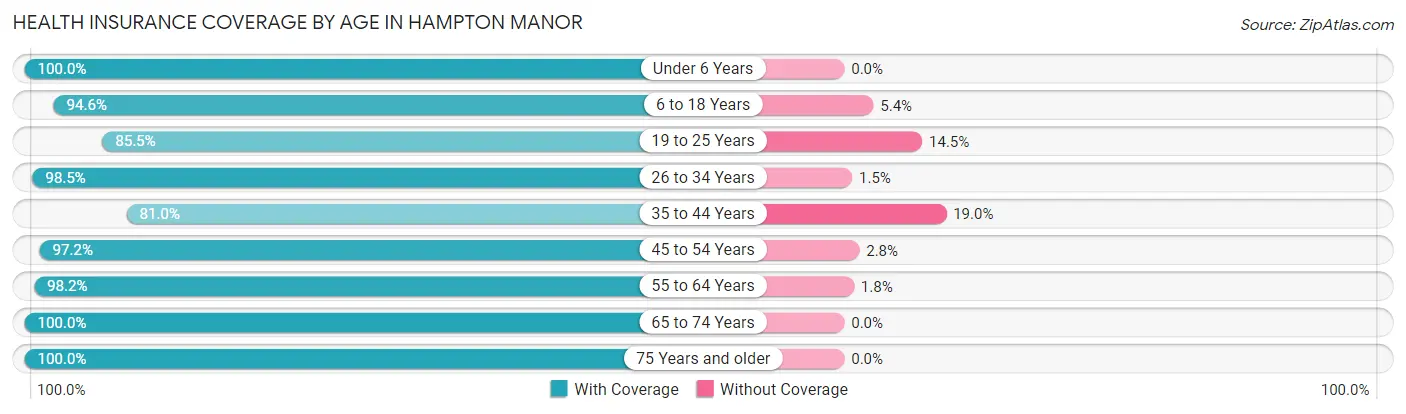
| Age Bracket | With Coverage | Without Coverage |
| Under 6 Years | 246 (100.0%) | 0 (0.0%) |
| 6 to 18 Years | 558 (94.6%) | 32 (5.4%) |
| 19 to 25 Years | 442 (85.5%) | 75 (14.5%) |
| 26 to 34 Years | 608 (98.5%) | 9 (1.5%) |
| 35 to 44 Years | 575 (81.0%) | 135 (19.0%) |
| 45 to 54 Years | 730 (97.2%) | 21 (2.8%) |
| 55 to 64 Years | 1,097 (98.2%) | 20 (1.8%) |
| 65 to 74 Years | 375 (100.0%) | 0 (0.0%) |
| 75 Years and older | 421 (100.0%) | 0 (0.0%) |
| Total | 5,052 (94.5%) | 292 (5.5%) |
Health Insurance Coverage by Citizenship Status in Hampton Manor
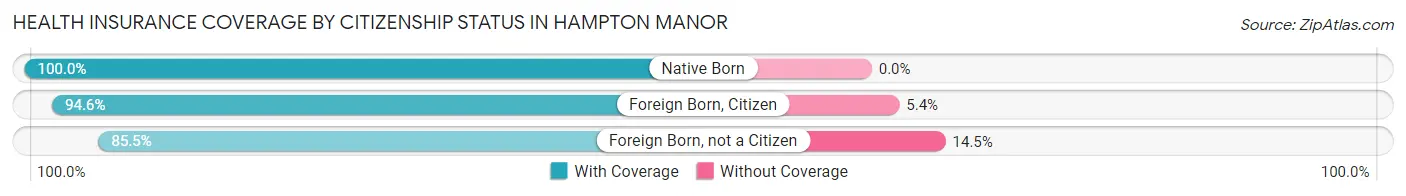
| Citizenship Status | With Coverage | Without Coverage |
| Native Born | 246 (100.0%) | 0 (0.0%) |
| Foreign Born, Citizen | 558 (94.6%) | 32 (5.4%) |
| Foreign Born, not a Citizen | 442 (85.5%) | 75 (14.5%) |
Health Insurance Coverage by Household Income in Hampton Manor
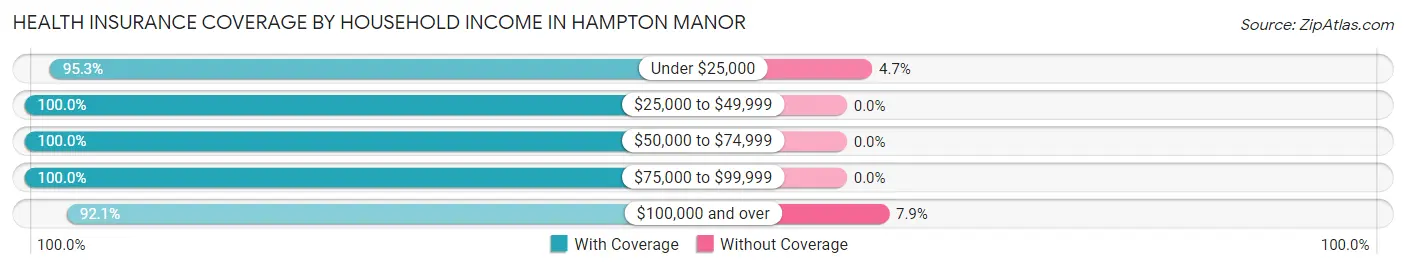
| Household Income | With Coverage | Without Coverage |
| Under $25,000 | 181 (95.3%) | 9 (4.7%) |
| $25,000 to $49,999 | 282 (100.0%) | 0 (0.0%) |
| $50,000 to $74,999 | 664 (100.0%) | 0 (0.0%) |
| $75,000 to $99,999 | 637 (100.0%) | 0 (0.0%) |
| $100,000 and over | 3,285 (92.1%) | 282 (7.9%) |
Public vs Private Health Insurance Coverage by Age in Hampton Manor
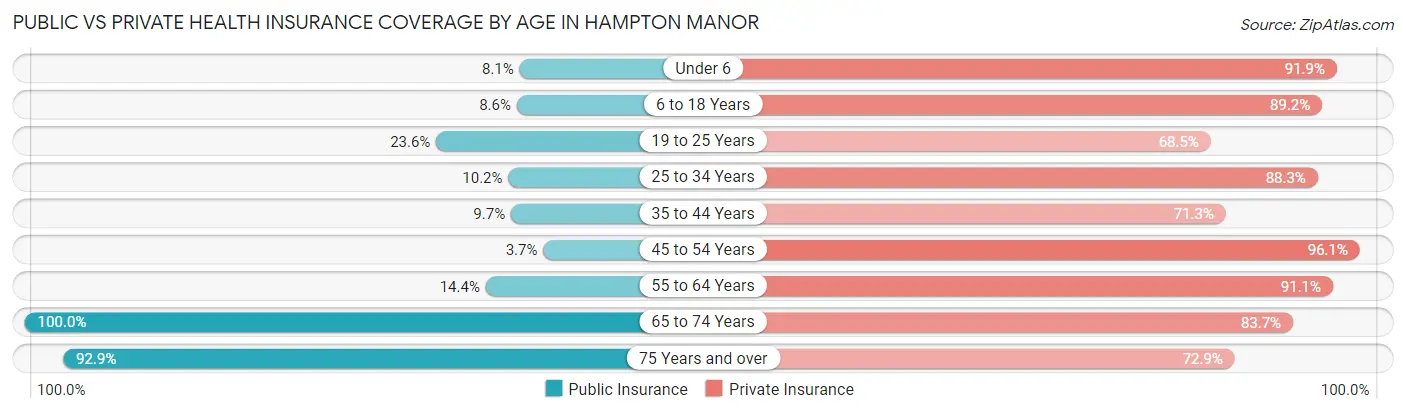
| Age Bracket | Public Insurance | Private Insurance |
| Under 6 | 20 (8.1%) | 226 (91.9%) |
| 6 to 18 Years | 51 (8.6%) | 526 (89.1%) |
| 19 to 25 Years | 122 (23.6%) | 354 (68.5%) |
| 25 to 34 Years | 63 (10.2%) | 545 (88.3%) |
| 35 to 44 Years | 69 (9.7%) | 506 (71.3%) |
| 45 to 54 Years | 28 (3.7%) | 722 (96.1%) |
| 55 to 64 Years | 161 (14.4%) | 1,018 (91.1%) |
| 65 to 74 Years | 375 (100.0%) | 314 (83.7%) |
| 75 Years and over | 391 (92.9%) | 307 (72.9%) |
| Total | 1,280 (23.9%) | 4,518 (84.5%) |
Disability Status by Sex by Age in Hampton Manor
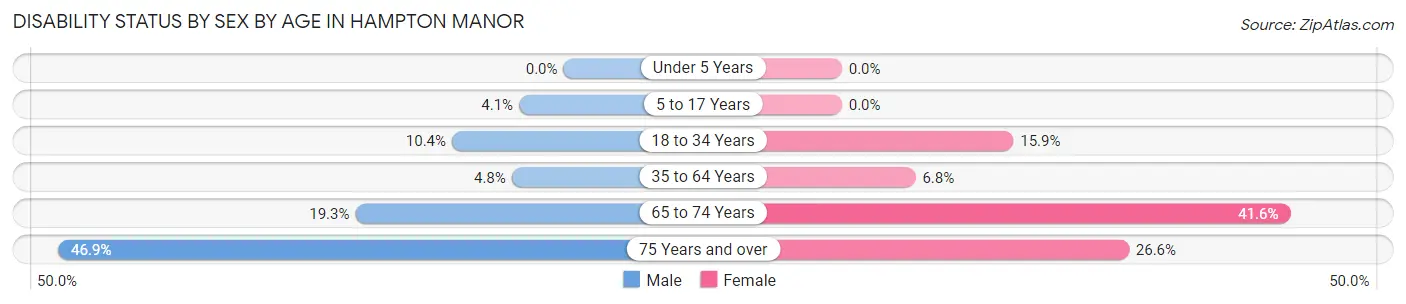
| Age Bracket | Male | Female |
| Under 5 Years | 0 (0.0%) | 0 (0.0%) |
| 5 to 17 Years | 18 (4.1%) | 0 (0.0%) |
| 18 to 34 Years | 50 (10.3%) | 107 (15.9%) |
| 35 to 64 Years | 62 (4.8%) | 88 (6.8%) |
| 65 to 74 Years | 39 (19.3%) | 72 (41.6%) |
| 75 Years and over | 83 (46.9%) | 65 (26.6%) |
Disability Class by Sex by Age in Hampton Manor
Disability Class: Hearing Difficulty
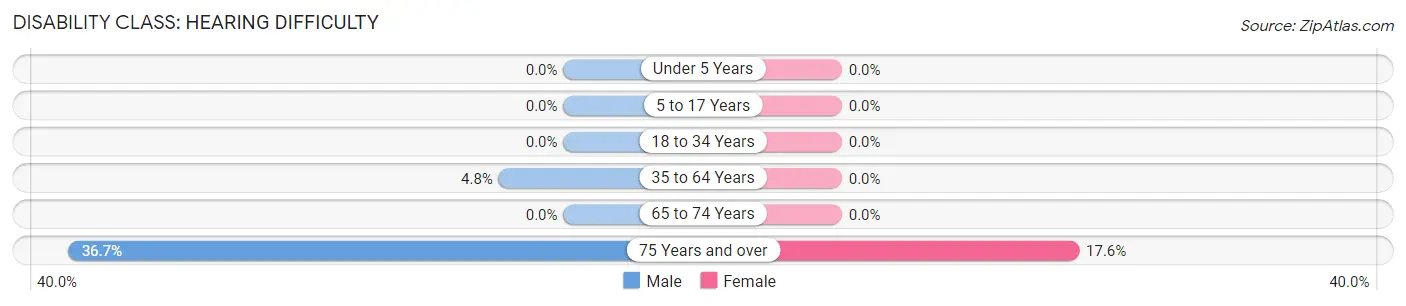
| Age Bracket | Male | Female |
| Under 5 Years | 0 (0.0%) | 0 (0.0%) |
| 5 to 17 Years | 0 (0.0%) | 0 (0.0%) |
| 18 to 34 Years | 0 (0.0%) | 0 (0.0%) |
| 35 to 64 Years | 62 (4.8%) | 0 (0.0%) |
| 65 to 74 Years | 0 (0.0%) | 0 (0.0%) |
| 75 Years and over | 65 (36.7%) | 43 (17.6%) |
Disability Class: Vision Difficulty
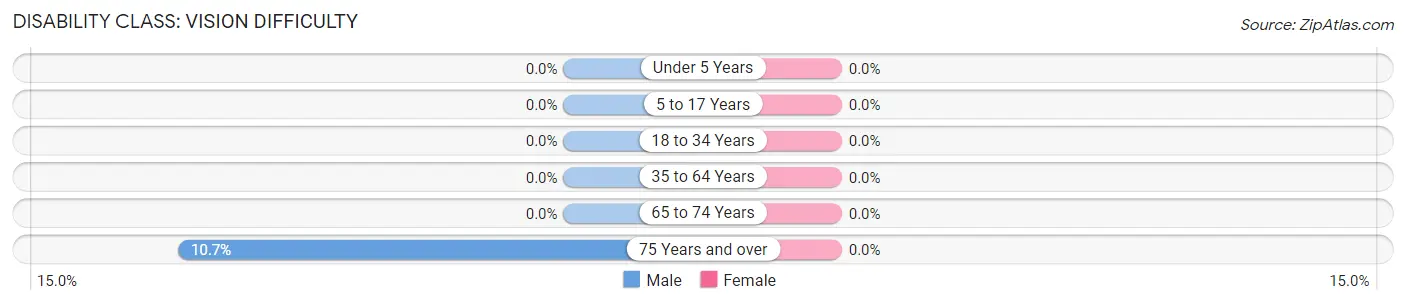
| Age Bracket | Male | Female |
| Under 5 Years | 0 (0.0%) | 0 (0.0%) |
| 5 to 17 Years | 0 (0.0%) | 0 (0.0%) |
| 18 to 34 Years | 0 (0.0%) | 0 (0.0%) |
| 35 to 64 Years | 0 (0.0%) | 0 (0.0%) |
| 65 to 74 Years | 0 (0.0%) | 0 (0.0%) |
| 75 Years and over | 19 (10.7%) | 0 (0.0%) |
Disability Class: Cognitive Difficulty
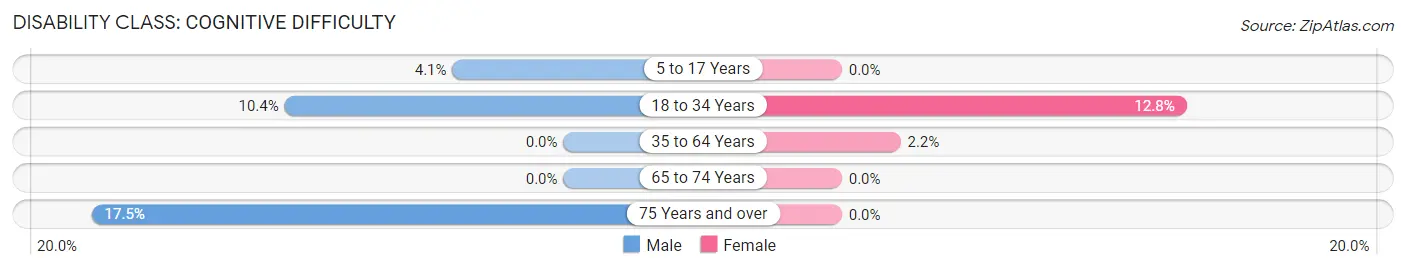
| Age Bracket | Male | Female |
| 5 to 17 Years | 18 (4.1%) | 0 (0.0%) |
| 18 to 34 Years | 50 (10.3%) | 86 (12.8%) |
| 35 to 64 Years | 0 (0.0%) | 28 (2.2%) |
| 65 to 74 Years | 0 (0.0%) | 0 (0.0%) |
| 75 Years and over | 31 (17.5%) | 0 (0.0%) |
Disability Class: Ambulatory Difficulty
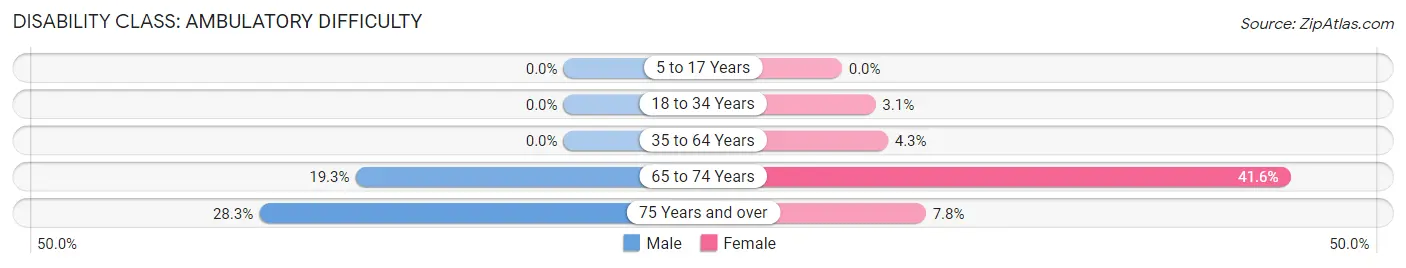
| Age Bracket | Male | Female |
| 5 to 17 Years | 0 (0.0%) | 0 (0.0%) |
| 18 to 34 Years | 0 (0.0%) | 21 (3.1%) |
| 35 to 64 Years | 0 (0.0%) | 55 (4.3%) |
| 65 to 74 Years | 39 (19.3%) | 72 (41.6%) |
| 75 Years and over | 50 (28.2%) | 19 (7.8%) |
Disability Class: Self-Care Difficulty
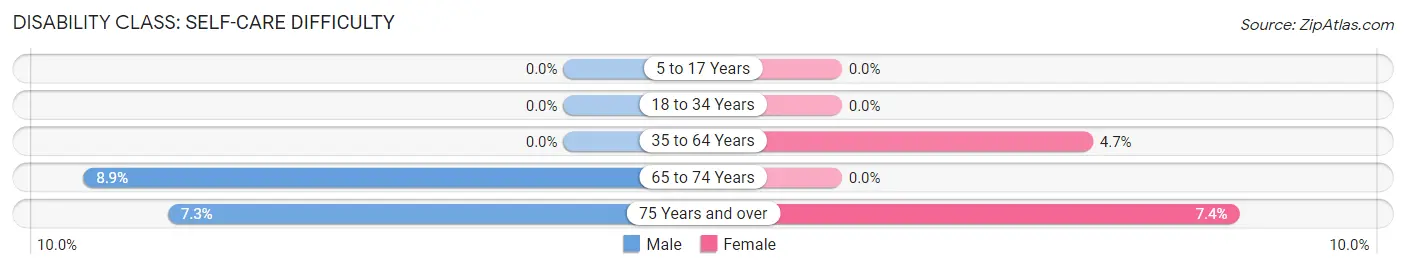
| Age Bracket | Male | Female |
| 5 to 17 Years | 0 (0.0%) | 0 (0.0%) |
| 18 to 34 Years | 0 (0.0%) | 0 (0.0%) |
| 35 to 64 Years | 0 (0.0%) | 60 (4.7%) |
| 65 to 74 Years | 18 (8.9%) | 0 (0.0%) |
| 75 Years and over | 13 (7.3%) | 18 (7.4%) |
Technology Access in Hampton Manor
Computing Device Access in Hampton Manor
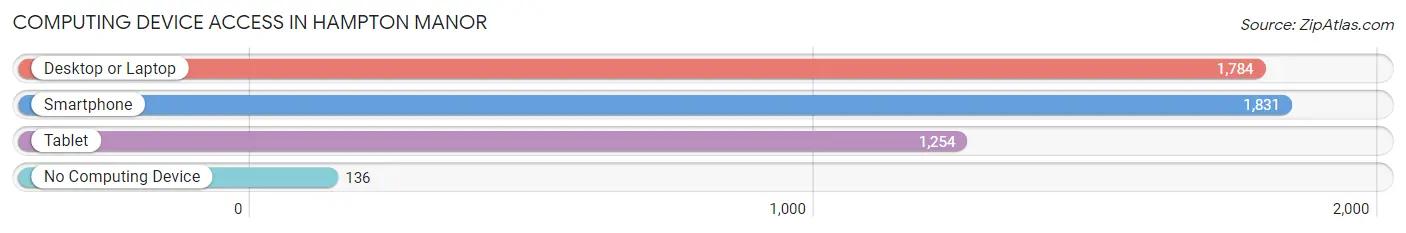
| Device Type | # Households | % Households |
| Desktop or Laptop | 1,784 | 82.9% |
| Smartphone | 1,831 | 85.1% |
| Tablet | 1,254 | 58.3% |
| No Computing Device | 136 | 6.3% |
| Total | 2,152 | 100.0% |
Internet Access in Hampton Manor
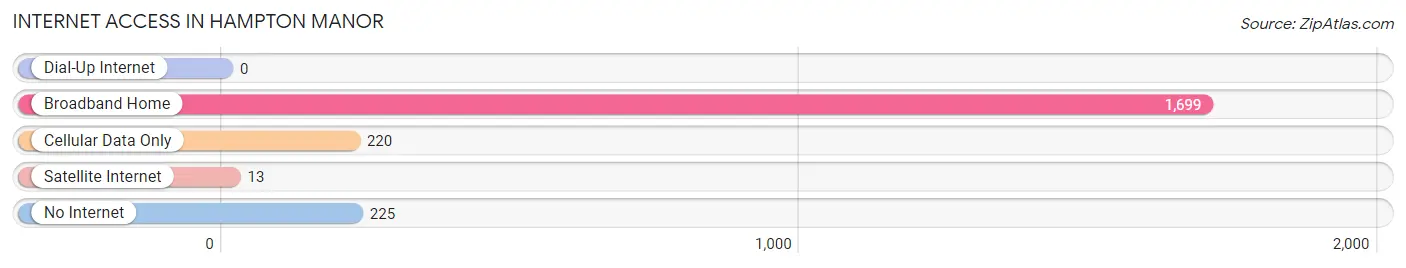
| Internet Type | # Households | % Households |
| Dial-Up Internet | 0 | 0.0% |
| Broadband Home | 1,699 | 78.9% |
| Cellular Data Only | 220 | 10.2% |
| Satellite Internet | 13 | 0.6% |
| No Internet | 225 | 10.5% |
| Total | 2,152 | 100.0% |
Hampton Manor Summary
Hampton Manor is a hamlet located in the Town of East Hampton in Suffolk County, New York. It is located on the south shore of Long Island, approximately 90 miles east of New York City. The hamlet is bordered by the hamlets of Amagansett to the west, Springs to the north, and Montauk to the east.
History
The area that is now Hampton Manor was originally inhabited by the Montaukett Native American tribe. The first European settlers arrived in the area in the late 1600s, and the hamlet was officially established in 1750. The hamlet was named after the Hampton family, who were among the first settlers in the area.
The hamlet was primarily a farming community until the late 19th century, when it began to develop into a summer resort destination. The area was popular with wealthy New Yorkers, who built large summer homes in the area. The hamlet was also home to several large hotels, including the Montauk Manor, which was built in 1926 and is still in operation today.
Geography
Hampton Manor is located on the south shore of Long Island, approximately 90 miles east of New York City. The hamlet is bordered by the hamlets of Amagansett to the west, Springs to the north, and Montauk to the east. The hamlet is located on a peninsula, with Gardiners Bay to the north and Napeague Bay to the south.
The hamlet is mostly flat, with some rolling hills in the northern part of the hamlet. The highest point in the hamlet is located at the intersection of Old Montauk Highway and Montauk Highway, which is approximately 80 feet above sea level.
Economy
The economy of Hampton Manor is largely based on tourism. The hamlet is home to several large hotels, including the Montauk Manor, which is a popular destination for tourists. The hamlet is also home to several restaurants, bars, and shops, which cater to both tourists and locals.
The hamlet is also home to several marinas, which provide services to boaters and fishermen. The hamlet is also home to several farms, which produce a variety of fruits and vegetables.
Demographics
As of the 2010 census, the population of Hampton Manor was 1,845. The population is primarily white (94.3%), with a small percentage of African Americans (2.2%) and Hispanics (2.2%). The median household income in the hamlet is $77,917, and the median home value is $845,000.
The hamlet is served by the East Hampton Union Free School District, which includes two elementary schools, one middle school, and one high school. The hamlet is also home to several private schools, including the Montauk School and the Hampton Manor School.
Common Questions
What is Per Capita Income in Hampton Manor?
Per Capita income in Hampton Manor is $45,474.
What is the Median Family Income in Hampton Manor?
Median Family Income in Hampton Manor is $127,798.
What is the Median Household income in Hampton Manor?
Median Household Income in Hampton Manor is $104,211.
What is Income or Wage Gap in Hampton Manor?
Income or Wage Gap in Hampton Manor is 13.0%.
Women in Hampton Manor earn 87.0 cents for every dollar earned by a man.
What is Inequality or Gini Index in Hampton Manor?
Inequality or Gini Index in Hampton Manor is 0.32.
What is the Total Population of Hampton Manor?
Total Population of Hampton Manor is 5,344.
What is the Total Male Population of Hampton Manor?
Total Male Population of Hampton Manor is 2,634.
What is the Total Female Population of Hampton Manor?
Total Female Population of Hampton Manor is 2,710.
What is the Ratio of Males per 100 Females in Hampton Manor?
There are 97.20 Males per 100 Females in Hampton Manor.
What is the Ratio of Females per 100 Males in Hampton Manor?
There are 102.89 Females per 100 Males in Hampton Manor.
What is the Median Population Age in Hampton Manor?
Median Population Age in Hampton Manor is 44.8 Years.
What is the Average Family Size in Hampton Manor
Average Family Size in Hampton Manor is 3.0 People.
What is the Average Household Size in Hampton Manor
Average Household Size in Hampton Manor is 2.5 People.
How Large is the Labor Force in Hampton Manor?
There are 3,321 People in the Labor Forcein in Hampton Manor.
What is the Percentage of People in the Labor Force in Hampton Manor?
70.9% of People are in the Labor Force in Hampton Manor.
What is the Unemployment Rate in Hampton Manor?
Unemployment Rate in Hampton Manor is 3.2%.