Salisbury, NY Map & Demographics
Salisbury Map
Salisbury Overview
$56,476
PER CAPITA INCOME
$161,643
AVG FAMILY INCOME
$147,056
AVG HOUSEHOLD INCOME
24.5%
WAGE / INCOME GAP [ % ]
75.5¢/ $1
WAGE / INCOME GAP [ $ ]
0.38
INEQUALITY / GINI INDEX
12,861
TOTAL POPULATION
6,381
MALE POPULATION
6,480
FEMALE POPULATION
98.47
MALES / 100 FEMALES
101.55
FEMALES / 100 MALES
43.6
MEDIAN AGE
3.4
AVG FAMILY SIZE
3.0
AVG HOUSEHOLD SIZE
6,644
LABOR FORCE [ PEOPLE ]
62.7%
PERCENT IN LABOR FORCE
3.1%
UNEMPLOYMENT RATE
Income in Salisbury
Income Overview in Salisbury
Per Capita Income in Salisbury is $56,476, while median incomes of families and households are $161,643 and $147,056 respectively.
| Characteristic | Number | Measure |
| Per Capita Income | 12,861 | $56,476 |
| Median Family Income | 3,421 | $161,643 |
| Mean Family Income | 3,421 | $184,523 |
| Median Household Income | 4,276 | $147,056 |
| Mean Household Income | 4,276 | $167,854 |
| Income Deficit | 3,421 | $0 |
| Wage / Income Gap (%) | 12,861 | 24.49% |
| Wage / Income Gap ($) | 12,861 | 75.51¢ per $1 |
| Gini / Inequality Index | 12,861 | 0.38 |
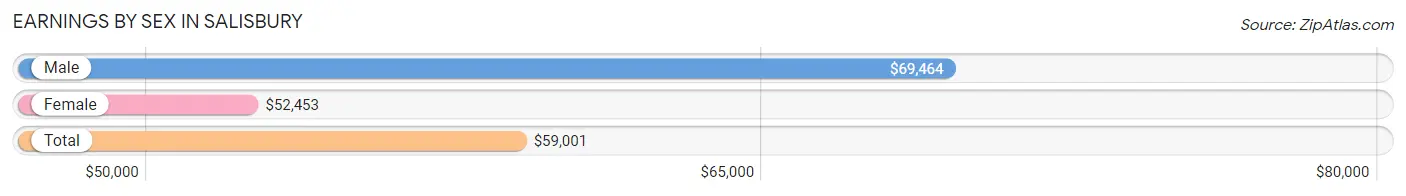
Earnings by Sex in Salisbury
Average Earnings in Salisbury are $59,001, $69,464 for men and $52,453 for women, a difference of 24.5%.
| Sex | Number | Average Earnings |
| Male | 3,894 (55.5%) | $69,464 |
| Female | 3,123 (44.5%) | $52,453 |
| Total | 7,017 (100.0%) | $59,001 |
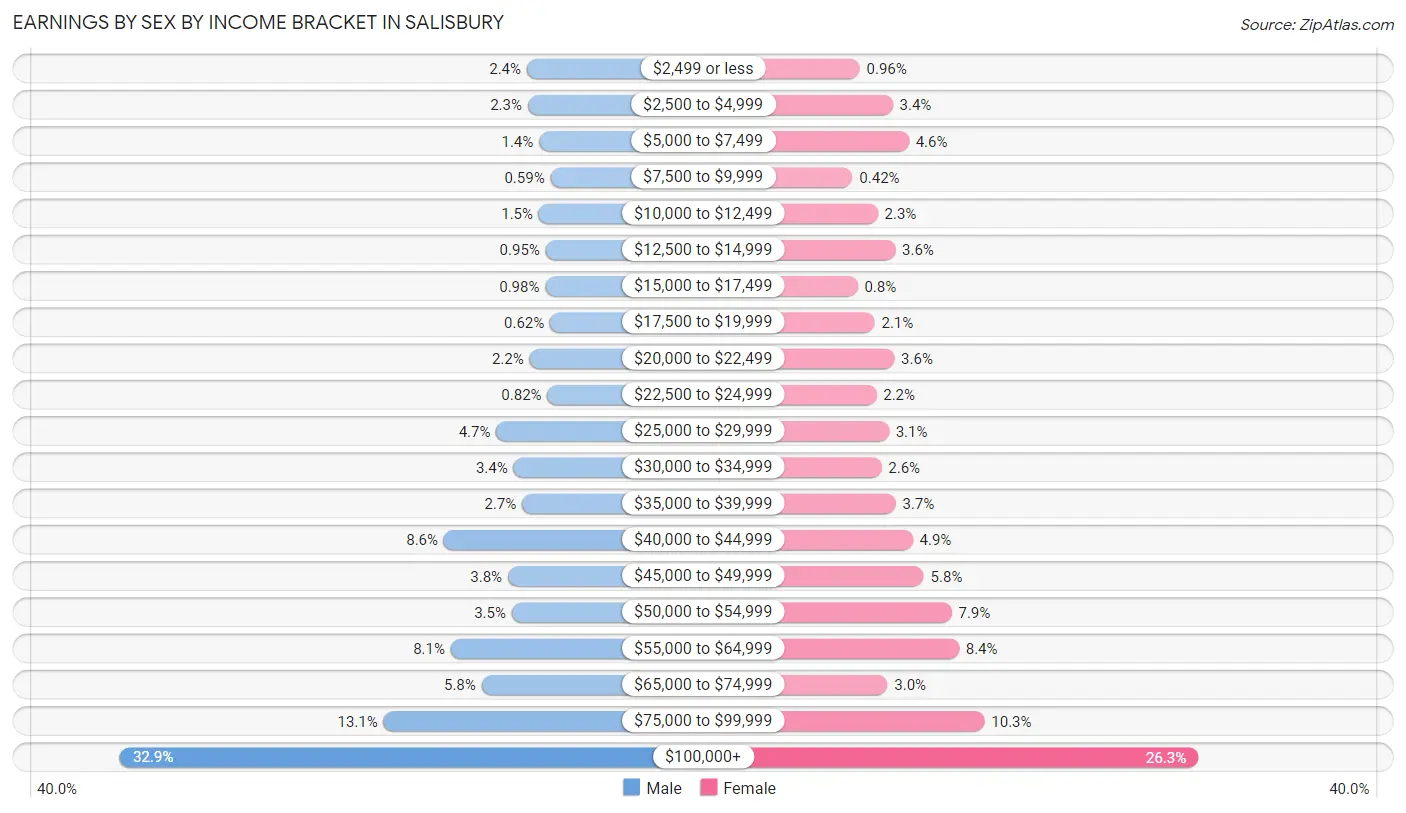
Earnings by Sex by Income Bracket in Salisbury
The most common earnings brackets in Salisbury are $100,000+ for men (1,279 | 32.9%) and $100,000+ for women (822 | 26.3%).
| Income | Male | Female |
| $2,499 or less | 92 (2.4%) | 30 (1.0%) |
| $2,500 to $4,999 | 89 (2.3%) | 107 (3.4%) |
| $5,000 to $7,499 | 56 (1.4%) | 145 (4.6%) |
| $7,500 to $9,999 | 23 (0.6%) | 13 (0.4%) |
| $10,000 to $12,499 | 57 (1.5%) | 72 (2.3%) |
| $12,500 to $14,999 | 37 (0.9%) | 113 (3.6%) |
| $15,000 to $17,499 | 38 (1.0%) | 25 (0.8%) |
| $17,500 to $19,999 | 24 (0.6%) | 65 (2.1%) |
| $20,000 to $22,499 | 84 (2.2%) | 111 (3.5%) |
| $22,500 to $24,999 | 32 (0.8%) | 69 (2.2%) |
| $25,000 to $29,999 | 181 (4.6%) | 98 (3.1%) |
| $30,000 to $34,999 | 131 (3.4%) | 81 (2.6%) |
| $35,000 to $39,999 | 106 (2.7%) | 114 (3.6%) |
| $40,000 to $44,999 | 334 (8.6%) | 154 (4.9%) |
| $45,000 to $49,999 | 147 (3.8%) | 180 (5.8%) |
| $50,000 to $54,999 | 136 (3.5%) | 245 (7.9%) |
| $55,000 to $64,999 | 314 (8.1%) | 262 (8.4%) |
| $65,000 to $74,999 | 224 (5.8%) | 95 (3.0%) |
| $75,000 to $99,999 | 510 (13.1%) | 322 (10.3%) |
| $100,000+ | 1,279 (32.9%) | 822 (26.3%) |
| Total | 3,894 (100.0%) | 3,123 (100.0%) |
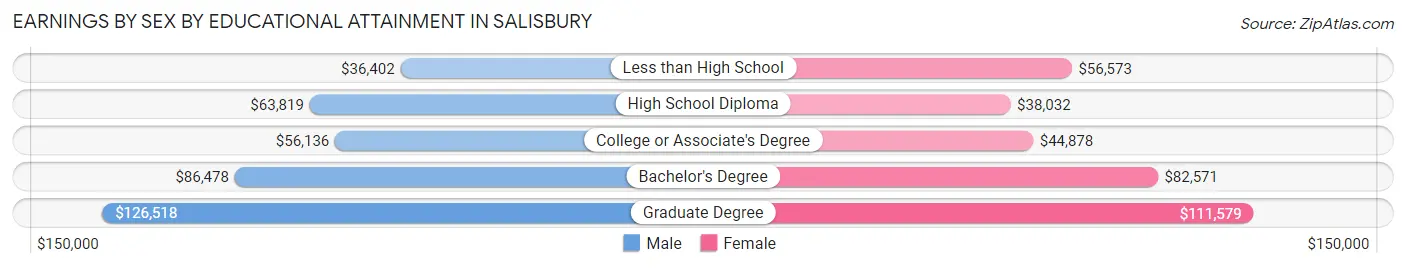
Earnings by Sex by Educational Attainment in Salisbury
Average earnings in Salisbury are $76,382 for men and $56,904 for women, a difference of 25.5%. Men with an educational attainment of graduate degree enjoy the highest average annual earnings of $126,518, while those with less than high school education earn the least with $36,402. Women with an educational attainment of graduate degree earn the most with the average annual earnings of $111,579, while those with high school diploma education have the smallest earnings of $38,032.
| Educational Attainment | Male Income | Female Income |
| Less than High School | $36,402 | $56,573 |
| High School Diploma | $63,819 | $38,032 |
| College or Associate's Degree | $56,136 | $44,878 |
| Bachelor's Degree | $86,478 | $82,571 |
| Graduate Degree | $126,518 | $111,579 |
| Total | $76,382 | $56,904 |
Family Income in Salisbury
Family Income Brackets in Salisbury
According to the Salisbury family income data, there are 1,194 families falling into the $200,000+ income range, which is the most common income bracket and makes up 34.9% of all families.
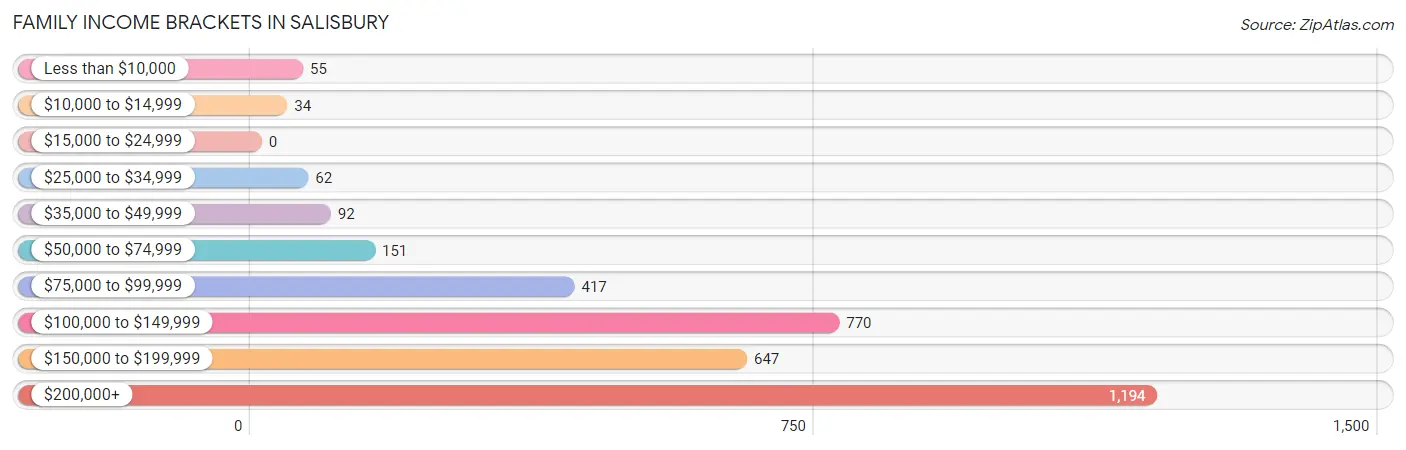
| Income Bracket | # Families | % Families |
| Less than $10,000 | 55 | 1.6% |
| $10,000 to $14,999 | 34 | 1.0% |
| $15,000 to $24,999 | 0 | 0.0% |
| $25,000 to $34,999 | 62 | 1.8% |
| $35,000 to $49,999 | 92 | 2.7% |
| $50,000 to $74,999 | 151 | 4.4% |
| $75,000 to $99,999 | 417 | 12.2% |
| $100,000 to $149,999 | 770 | 22.5% |
| $150,000 to $199,999 | 647 | 18.9% |
| $200,000+ | 1,194 | 34.9% |
Family Income by Famaliy Size in Salisbury
6-person families (174 | 5.1%) account for the highest median family income in Salisbury with $230,917 per family, while 2-person families (1,303 | 38.1%) have the highest median income of $67,824 per family member.
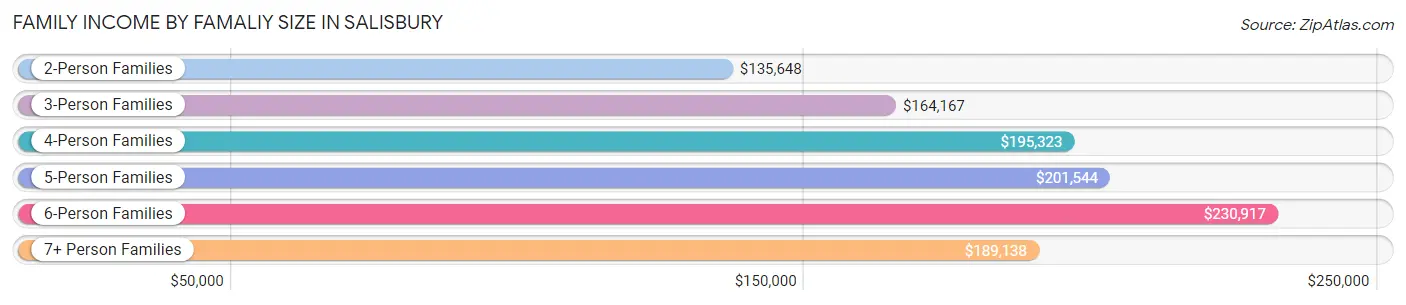
| Income Bracket | # Families | Median Income |
| 2-Person Families | 1,303 (38.1%) | $135,648 |
| 3-Person Families | 852 (24.9%) | $164,167 |
| 4-Person Families | 741 (21.7%) | $195,323 |
| 5-Person Families | 243 (7.1%) | $201,544 |
| 6-Person Families | 174 (5.1%) | $230,917 |
| 7+ Person Families | 108 (3.2%) | $189,138 |
| Total | 3,421 (100.0%) | $161,643 |
Family Income by Number of Earners in Salisbury
The median family income in Salisbury is $161,643, with families comprising 2 earners (1,626) having the highest median family income of $191,964, while families with no earners (485) have the lowest median family income of $88,250, accounting for 47.5% and 14.2% of families, respectively.
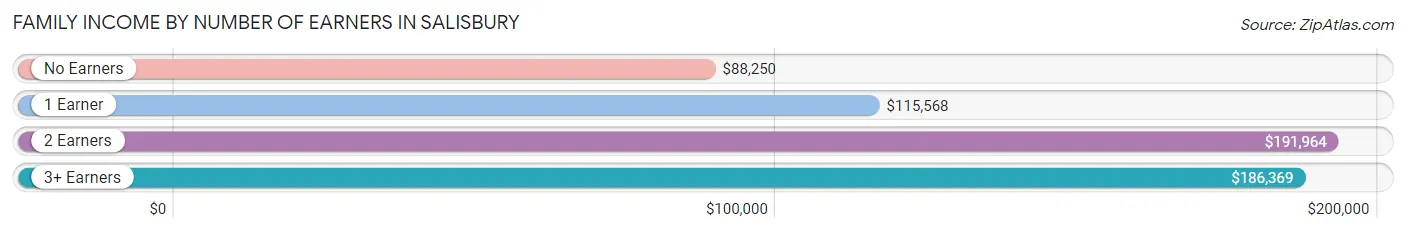
| Number of Earners | # Families | Median Income |
| No Earners | 485 (14.2%) | $88,250 |
| 1 Earner | 587 (17.2%) | $115,568 |
| 2 Earners | 1,626 (47.5%) | $191,964 |
| 3+ Earners | 723 (21.1%) | $186,369 |
| Total | 3,421 (100.0%) | $161,643 |
Household Income in Salisbury
Household Income Brackets in Salisbury
With 1,364 households falling in the category, the $200,000+ income range is the most frequent in Salisbury, accounting for 31.9% of all households. In contrast, only 94 households (2.2%) fall into the $25,000 to $34,999 income bracket, making it the least populous group.
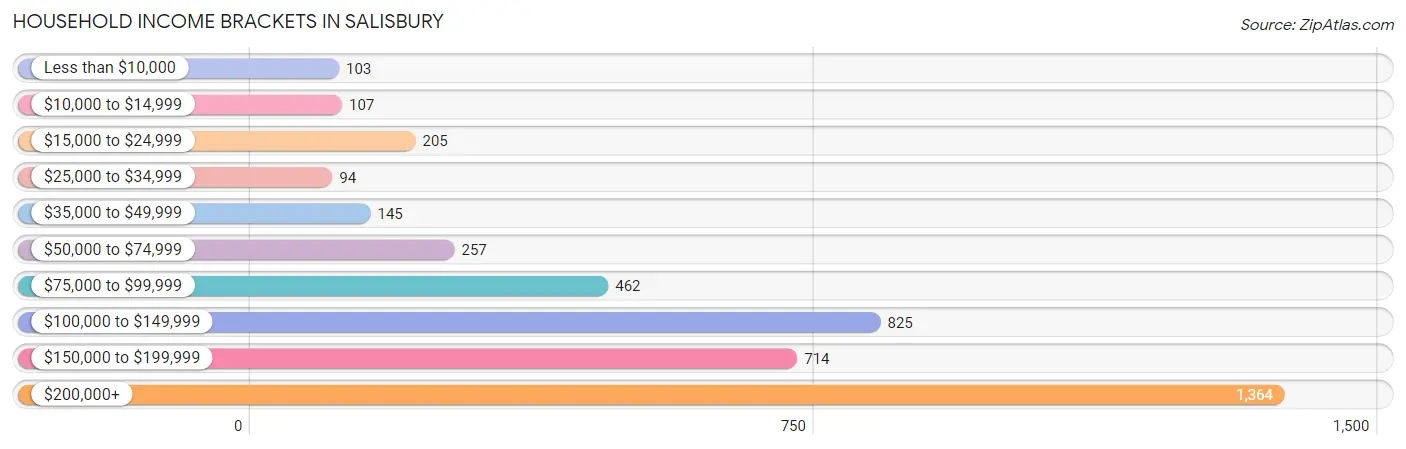
| Income Bracket | # Households | % Households |
| Less than $10,000 | 103 | 2.4% |
| $10,000 to $14,999 | 107 | 2.5% |
| $15,000 to $24,999 | 205 | 4.8% |
| $25,000 to $34,999 | 94 | 2.2% |
| $35,000 to $49,999 | 145 | 3.4% |
| $50,000 to $74,999 | 257 | 6.0% |
| $75,000 to $99,999 | 462 | 10.8% |
| $100,000 to $149,999 | 825 | 19.3% |
| $150,000 to $199,999 | 714 | 16.7% |
| $200,000+ | 1,364 | 31.9% |
Household Income by Householder Age in Salisbury
The median household income in Salisbury is $147,056, with the highest median household income of $195,214 found in the 25 to 44 years age bracket for the primary householder. A total of 829 households (19.4%) fall into this category. Meanwhile, the 15 to 24 years age bracket for the primary householder has the lowest median household income of $0, with 7 households (0.2%) in this group.
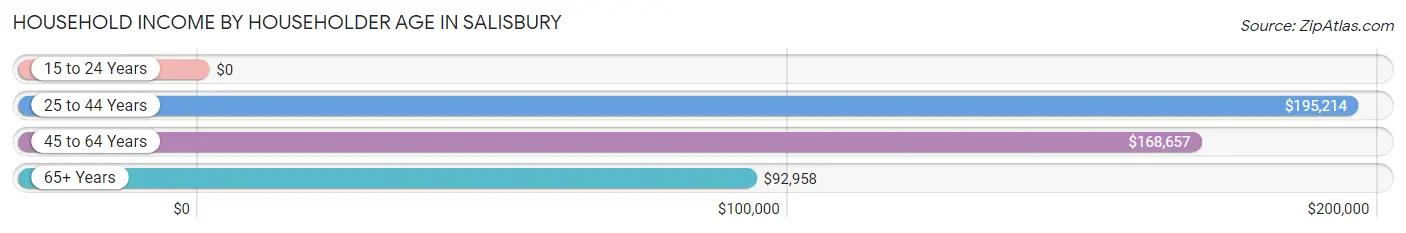
| Income Bracket | # Households | Median Income |
| 15 to 24 Years | 7 (0.2%) | $0 |
| 25 to 44 Years | 829 (19.4%) | $195,214 |
| 45 to 64 Years | 1,933 (45.2%) | $168,657 |
| 65+ Years | 1,507 (35.2%) | $92,958 |
| Total | 4,276 (100.0%) | $147,056 |
Poverty in Salisbury
Income Below Poverty by Sex and Age in Salisbury
With 3.5% poverty level for males and 4.6% for females among the residents of Salisbury, 15 year old males and 15 year old females are the most vulnerable to poverty, with 28 males (21.9%) and 9 females (20.9%) in their respective age groups living below the poverty level.
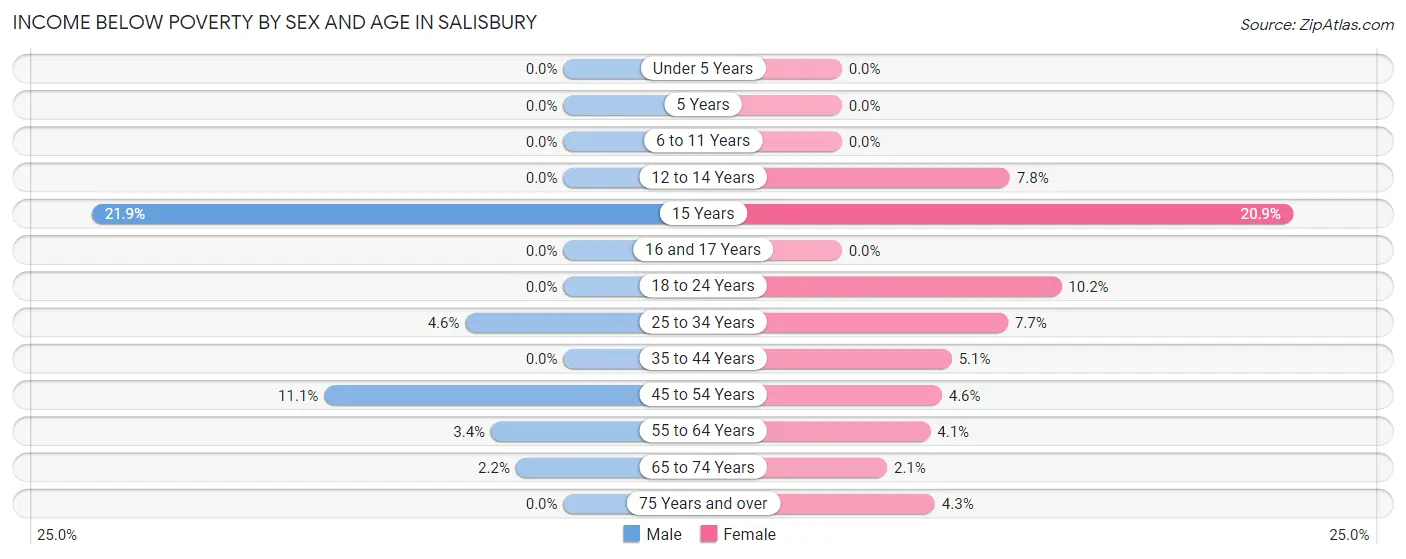
| Age Bracket | Male | Female |
| Under 5 Years | 0 (0.0%) | 0 (0.0%) |
| 5 Years | 0 (0.0%) | 0 (0.0%) |
| 6 to 11 Years | 0 (0.0%) | 0 (0.0%) |
| 12 to 14 Years | 0 (0.0%) | 27 (7.8%) |
| 15 Years | 28 (21.9%) | 9 (20.9%) |
| 16 and 17 Years | 0 (0.0%) | 0 (0.0%) |
| 18 to 24 Years | 0 (0.0%) | 48 (10.2%) |
| 25 to 34 Years | 35 (4.5%) | 45 (7.7%) |
| 35 to 44 Years | 0 (0.0%) | 43 (5.1%) |
| 45 to 54 Years | 112 (11.1%) | 43 (4.6%) |
| 55 to 64 Years | 30 (3.4%) | 41 (4.1%) |
| 65 to 74 Years | 16 (2.2%) | 14 (2.1%) |
| 75 Years and over | 0 (0.0%) | 29 (4.3%) |
| Total | 221 (3.5%) | 299 (4.6%) |
Income Above Poverty by Sex and Age in Salisbury
According to the poverty statistics in Salisbury, males aged under 5 years and females aged under 5 years are the age groups that are most secure financially, with 100.0% of males and 100.0% of females in these age groups living above the poverty line.
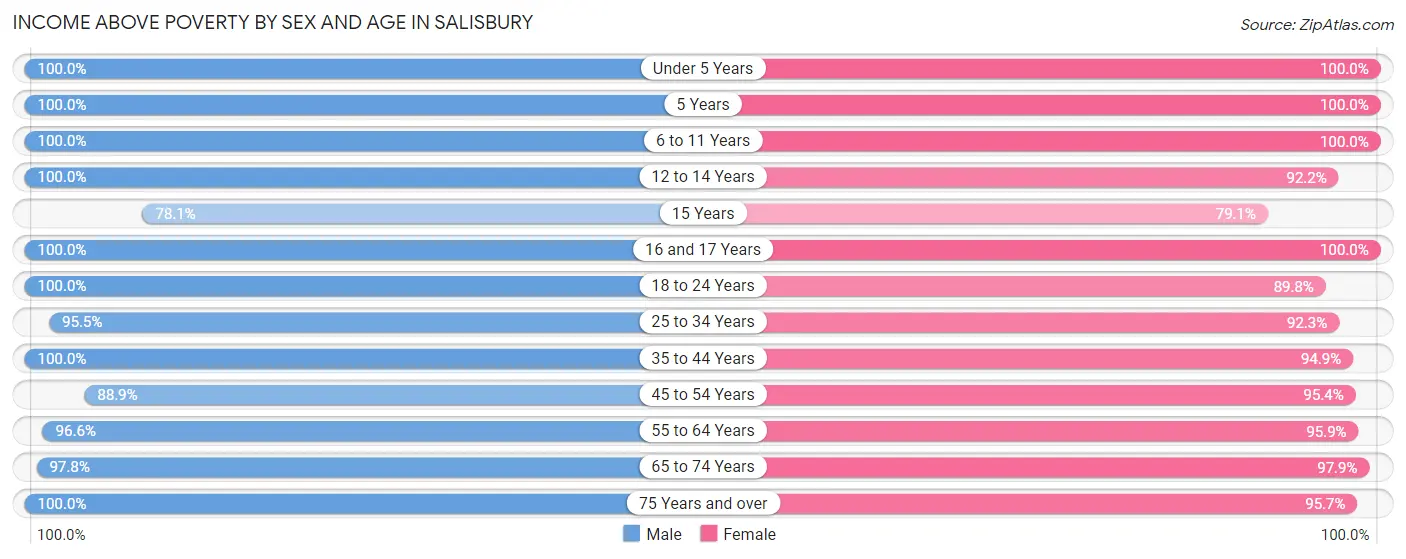
| Age Bracket | Male | Female |
| Under 5 Years | 337 (100.0%) | 262 (100.0%) |
| 5 Years | 66 (100.0%) | 62 (100.0%) |
| 6 to 11 Years | 422 (100.0%) | 429 (100.0%) |
| 12 to 14 Years | 141 (100.0%) | 319 (92.2%) |
| 15 Years | 100 (78.1%) | 34 (79.1%) |
| 16 and 17 Years | 64 (100.0%) | 166 (100.0%) |
| 18 to 24 Years | 585 (100.0%) | 423 (89.8%) |
| 25 to 34 Years | 735 (95.5%) | 539 (92.3%) |
| 35 to 44 Years | 910 (100.0%) | 800 (94.9%) |
| 45 to 54 Years | 897 (88.9%) | 884 (95.4%) |
| 55 to 64 Years | 862 (96.6%) | 957 (95.9%) |
| 65 to 74 Years | 707 (97.8%) | 653 (97.9%) |
| 75 Years and over | 315 (100.0%) | 643 (95.7%) |
| Total | 6,141 (96.5%) | 6,171 (95.4%) |
Income Below Poverty Among Married-Couple Families in Salisbury
The poverty statistics for married-couple families in Salisbury show that 1.9% or 55 of the total 2,856 families live below the poverty line. Families with 1 or 2 children have the highest poverty rate of 3.9%, comprising of 39 families. On the other hand, families with 3 or 4 children have the lowest poverty rate of 0.0%, which includes 0 families.
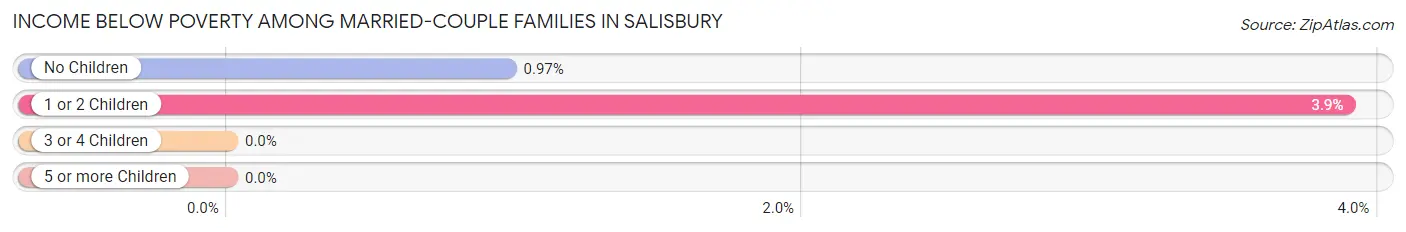
| Children | Above Poverty | Below Poverty |
| No Children | 1,640 (99.0%) | 16 (1.0%) |
| 1 or 2 Children | 964 (96.1%) | 39 (3.9%) |
| 3 or 4 Children | 168 (100.0%) | 0 (0.0%) |
| 5 or more Children | 29 (100.0%) | 0 (0.0%) |
| Total | 2,801 (98.1%) | 55 (1.9%) |
Income Below Poverty Among Single-Parent Households in Salisbury
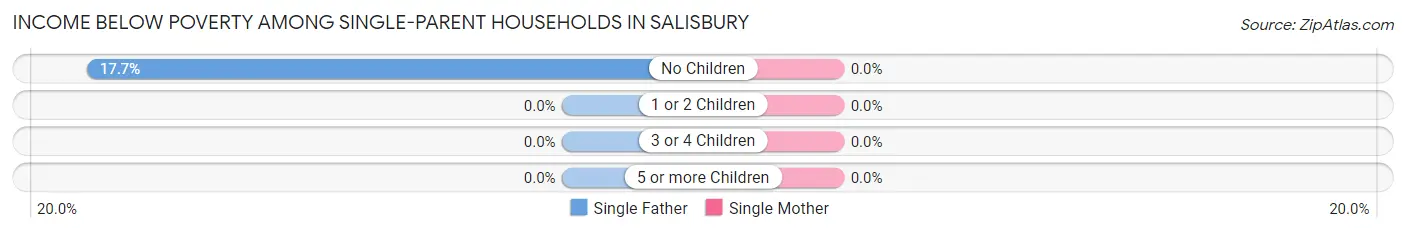
| Children | Single Father | Single Mother |
| No Children | 35 (17.7%) | 0 (0.0%) |
| 1 or 2 Children | 0 (0.0%) | 0 (0.0%) |
| 3 or 4 Children | 0 (0.0%) | 0 (0.0%) |
| 5 or more Children | 0 (0.0%) | 0 (0.0%) |
| Total | 35 (12.9%) | 0 (0.0%) |
Income Below Poverty Among Married-Couple vs Single-Parent Households in Salisbury
The poverty data for Salisbury shows that 55 of the married-couple family households (1.9%) and 35 of the single-parent households (6.2%) are living below the poverty level. Within the married-couple family households, those with 1 or 2 children have the highest poverty rate, with 39 households (3.9%) falling below the poverty line. Among the single-parent households, those with no children have the highest poverty rate, with 35 household (8.9%) living below poverty.
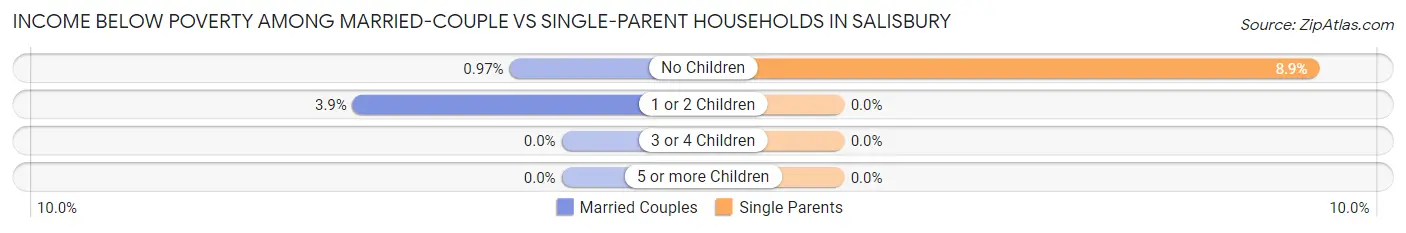
| Children | Married-Couple Families | Single-Parent Households |
| No Children | 16 (1.0%) | 35 (8.9%) |
| 1 or 2 Children | 39 (3.9%) | 0 (0.0%) |
| 3 or 4 Children | 0 (0.0%) | 0 (0.0%) |
| 5 or more Children | 0 (0.0%) | 0 (0.0%) |
| Total | 55 (1.9%) | 35 (6.2%) |
Race in Salisbury
The most populous races in Salisbury are White / Caucasian (7,621 | 59.3%), Hispanic or Latino (2,508 | 19.5%), and Asian (2,443 | 19.0%).
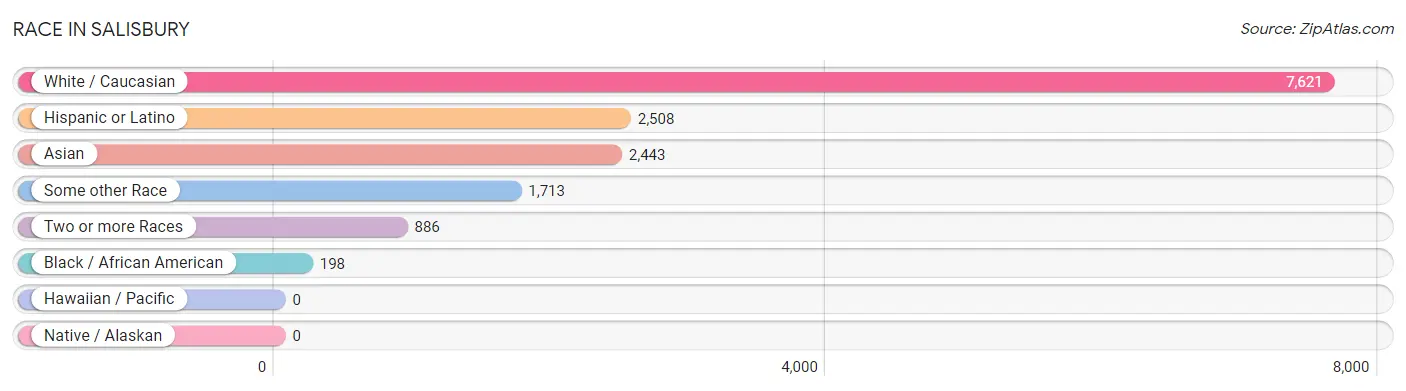
| Race | # Population | % Population |
| Asian | 2,443 | 19.0% |
| Black / African American | 198 | 1.5% |
| Hawaiian / Pacific | 0 | 0.0% |
| Hispanic or Latino | 2,508 | 19.5% |
| Native / Alaskan | 0 | 0.0% |
| White / Caucasian | 7,621 | 59.3% |
| Two or more Races | 886 | 6.9% |
| Some other Race | 1,713 | 13.3% |
| Total | 12,861 | 100.0% |
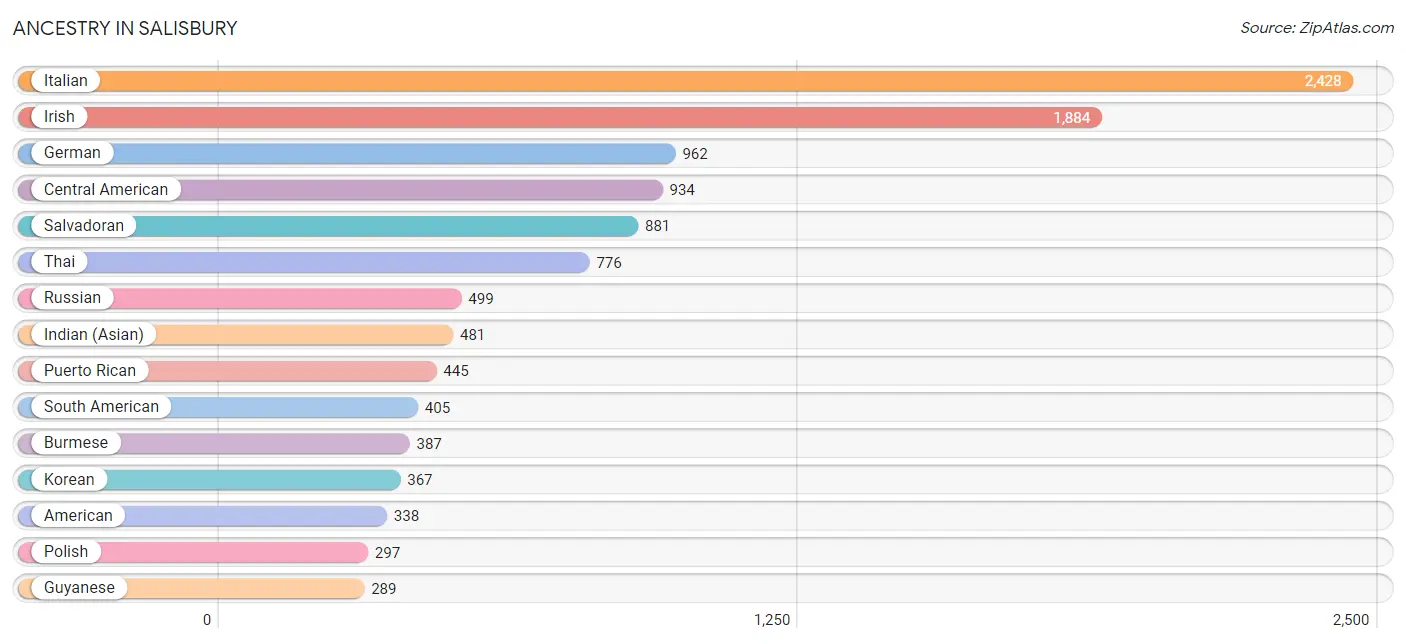
Ancestry in Salisbury
The most populous ancestries reported in Salisbury are Italian (2,428 | 18.9%), Irish (1,884 | 14.6%), German (962 | 7.5%), Central American (934 | 7.3%), and Salvadoran (881 | 6.9%), together accounting for 55.1% of all Salisbury residents.
| Ancestry | # Population | % Population |
| American | 338 | 2.6% |
| Arab | 98 | 0.8% |
| Armenian | 9 | 0.1% |
| Austrian | 18 | 0.1% |
| Bolivian | 53 | 0.4% |
| British | 37 | 0.3% |
| Burmese | 387 | 3.0% |
| Central American | 934 | 7.3% |
| Chilean | 104 | 0.8% |
| Colombian | 126 | 1.0% |
| Cuban | 42 | 0.3% |
| Czech | 62 | 0.5% |
| Czechoslovakian | 9 | 0.1% |
| Dominican | 167 | 1.3% |
| Eastern European | 30 | 0.2% |
| Ecuadorian | 43 | 0.3% |
| Egyptian | 67 | 0.5% |
| English | 277 | 2.1% |
| European | 68 | 0.5% |
| French | 53 | 0.4% |
| German | 962 | 7.5% |
| Greek | 164 | 1.3% |
| Guatemalan | 53 | 0.4% |
| Guyanese | 289 | 2.2% |
| Haitian | 23 | 0.2% |
| Hungarian | 41 | 0.3% |
| Indian (Asian) | 481 | 3.7% |
| Iranian | 19 | 0.2% |
| Irish | 1,884 | 14.6% |
| Israeli | 9 | 0.1% |
| Italian | 2,428 | 18.9% |
| Jamaican | 101 | 0.8% |
| Korean | 367 | 2.9% |
| Lebanese | 31 | 0.2% |
| Macedonian | 4 | 0.0% |
| Maltese | 19 | 0.2% |
| Mexican | 54 | 0.4% |
| Nigerian | 12 | 0.1% |
| Pakistani | 5 | 0.0% |
| Peruvian | 38 | 0.3% |
| Polish | 297 | 2.3% |
| Portuguese | 48 | 0.4% |
| Puerto Rican | 445 | 3.5% |
| Romanian | 44 | 0.3% |
| Russian | 499 | 3.9% |
| Salvadoran | 881 | 6.9% |
| Scotch-Irish | 3 | 0.0% |
| Scottish | 27 | 0.2% |
| Slavic | 11 | 0.1% |
| Slovak | 8 | 0.1% |
| South American | 405 | 3.2% |
| Spanish | 73 | 0.6% |
| Sri Lankan | 30 | 0.2% |
| Subsaharan African | 12 | 0.1% |
| Swedish | 65 | 0.5% |
| Swiss | 11 | 0.1% |
| Thai | 776 | 6.0% |
| Turkish | 10 | 0.1% |
| Ukrainian | 43 | 0.3% |
| Venezuelan | 41 | 0.3% |
| Vietnamese | 109 | 0.9% |
| Welsh | 10 | 0.1% |
| West Indian | 8 | 0.1% | View All 63 Rows |
Immigrants in Salisbury
The most numerous immigrant groups reported in Salisbury came from Latin America (1,572 | 12.2%), Asia (1,356 | 10.5%), Central America (846 | 6.6%), South America (640 | 5.0%), and South Central Asia (630 | 4.9%), together accounting for 39.2% of all Salisbury residents.

| Immigration Origin | # Population | % Population |
| Africa | 17 | 0.1% |
| Asia | 1,356 | 10.5% |
| Bangladesh | 78 | 0.6% |
| Belarus | 140 | 1.1% |
| Bolivia | 53 | 0.4% |
| Brazil | 35 | 0.3% |
| Canada | 27 | 0.2% |
| Caribbean | 86 | 0.7% |
| Central America | 846 | 6.6% |
| Chile | 57 | 0.4% |
| China | 260 | 2.0% |
| Colombia | 72 | 0.6% |
| Dominican Republic | 34 | 0.3% |
| Eastern Asia | 491 | 3.8% |
| Eastern Europe | 215 | 1.7% |
| Ecuador | 22 | 0.2% |
| Egypt | 17 | 0.1% |
| El Salvador | 569 | 4.4% |
| England | 5 | 0.0% |
| Europe | 562 | 4.4% |
| Germany | 116 | 0.9% |
| Greece | 62 | 0.5% |
| Guatemala | 53 | 0.4% |
| Guyana | 312 | 2.4% |
| Haiti | 23 | 0.2% |
| Honduras | 82 | 0.6% |
| Hong Kong | 66 | 0.5% |
| India | 325 | 2.5% |
| Iran | 26 | 0.2% |
| Ireland | 50 | 0.4% |
| Italy | 54 | 0.4% |
| Jamaica | 29 | 0.2% |
| Korea | 231 | 1.8% |
| Latin America | 1,572 | 12.2% |
| Lebanon | 31 | 0.2% |
| Mexico | 142 | 1.1% |
| Northern Africa | 17 | 0.1% |
| Northern Europe | 90 | 0.7% |
| Pakistan | 201 | 1.6% |
| Peru | 89 | 0.7% |
| Philippines | 160 | 1.2% |
| Portugal | 25 | 0.2% |
| Romania | 31 | 0.2% |
| Russia | 44 | 0.3% |
| Saudi Arabia | 11 | 0.1% |
| South America | 640 | 5.0% |
| South Central Asia | 630 | 4.9% |
| South Eastern Asia | 180 | 1.4% |
| Southern Europe | 141 | 1.1% |
| Taiwan | 21 | 0.2% |
| Turkey | 13 | 0.1% |
| Vietnam | 20 | 0.2% |
| Western Asia | 55 | 0.4% |
| Western Europe | 116 | 0.9% | View All 54 Rows |
Sex and Age in Salisbury
Sex and Age in Salisbury
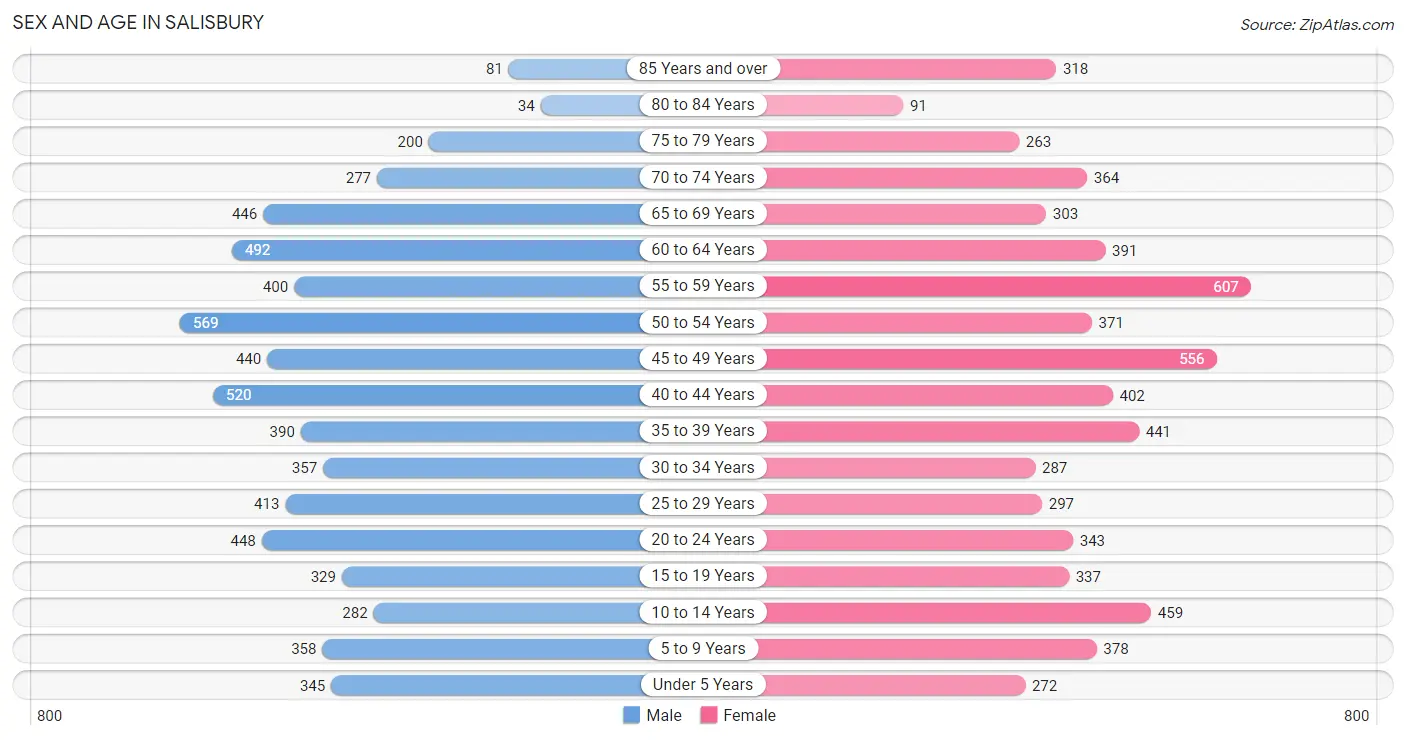
The most populous age groups in Salisbury are 50 to 54 Years (569 | 8.9%) for men and 55 to 59 Years (607 | 9.4%) for women.
| Age Bracket | Male | Female |
| Under 5 Years | 345 (5.4%) | 272 (4.2%) |
| 5 to 9 Years | 358 (5.6%) | 378 (5.8%) |
| 10 to 14 Years | 282 (4.4%) | 459 (7.1%) |
| 15 to 19 Years | 329 (5.2%) | 337 (5.2%) |
| 20 to 24 Years | 448 (7.0%) | 343 (5.3%) |
| 25 to 29 Years | 413 (6.5%) | 297 (4.6%) |
| 30 to 34 Years | 357 (5.6%) | 287 (4.4%) |
| 35 to 39 Years | 390 (6.1%) | 441 (6.8%) |
| 40 to 44 Years | 520 (8.2%) | 402 (6.2%) |
| 45 to 49 Years | 440 (6.9%) | 556 (8.6%) |
| 50 to 54 Years | 569 (8.9%) | 371 (5.7%) |
| 55 to 59 Years | 400 (6.3%) | 607 (9.4%) |
| 60 to 64 Years | 492 (7.7%) | 391 (6.0%) |
| 65 to 69 Years | 446 (7.0%) | 303 (4.7%) |
| 70 to 74 Years | 277 (4.3%) | 364 (5.6%) |
| 75 to 79 Years | 200 (3.1%) | 263 (4.1%) |
| 80 to 84 Years | 34 (0.5%) | 91 (1.4%) |
| 85 Years and over | 81 (1.3%) | 318 (4.9%) |
| Total | 6,381 (100.0%) | 6,480 (100.0%) |
Families and Households in Salisbury
Median Family Size in Salisbury
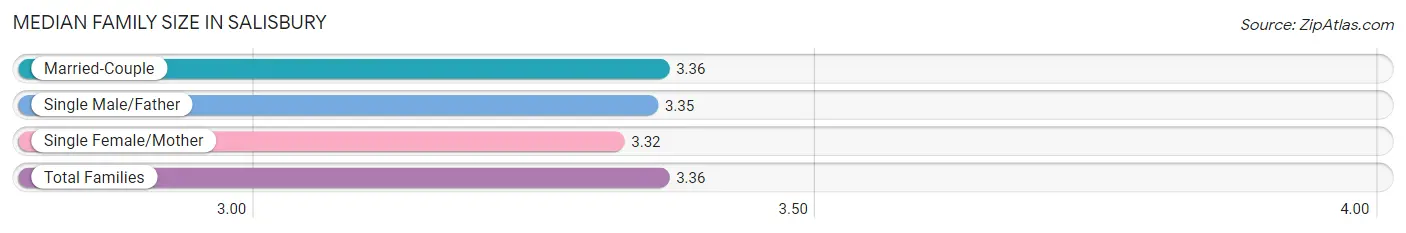
The median family size in Salisbury is 3.36 persons per family, with married-couple families (2,856 | 83.5%) accounting for the largest median family size of 3.36 persons per family. On the other hand, single female/mother families (293 | 8.6%) represent the smallest median family size with 3.32 persons per family.
| Family Type | # Families | Family Size |
| Married-Couple | 2,856 (83.5%) | 3.36 |
| Single Male/Father | 272 (8.0%) | 3.35 |
| Single Female/Mother | 293 (8.6%) | 3.32 |
| Total Families | 3,421 (100.0%) | 3.36 |
Median Household Size in Salisbury
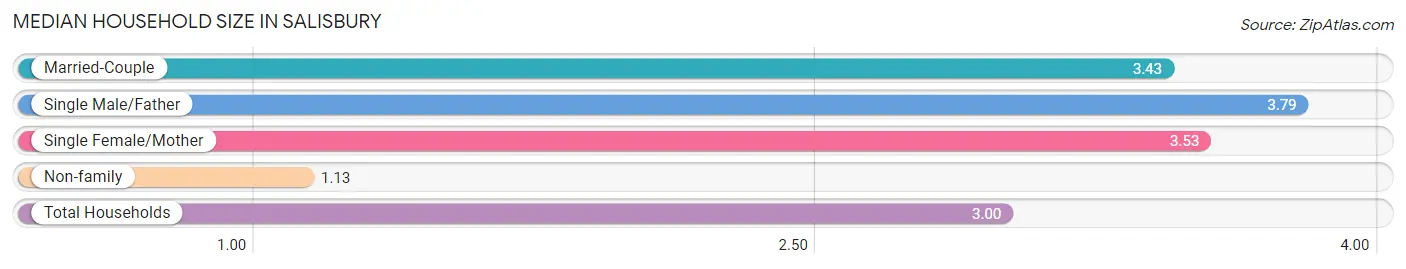
The median household size in Salisbury is 3.00 persons per household, with single male/father households (272 | 6.4%) accounting for the largest median household size of 3.79 persons per household. non-family households (855 | 20.0%) represent the smallest median household size with 1.13 persons per household.
| Household Type | # Households | Household Size |
| Married-Couple | 2,856 (66.8%) | 3.43 |
| Single Male/Father | 272 (6.4%) | 3.79 |
| Single Female/Mother | 293 (6.9%) | 3.53 |
| Non-family | 855 (20.0%) | 1.13 |
| Total Households | 4,276 (100.0%) | 3.00 |
Household Size by Marriage Status in Salisbury
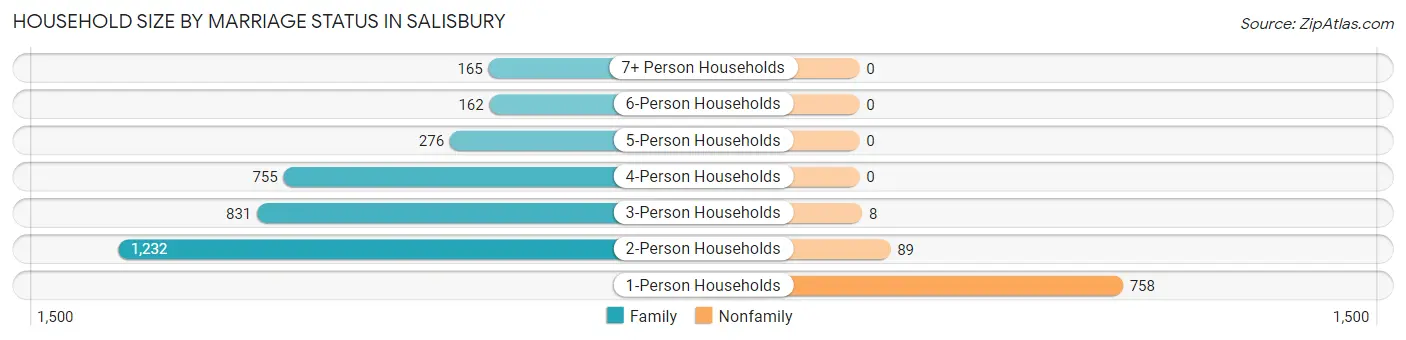
Out of a total of 4,276 households in Salisbury, 3,421 (80.0%) are family households, while 855 (20.0%) are nonfamily households. The most numerous type of family households are 2-person households, comprising 1,232, and the most common type of nonfamily households are 1-person households, comprising 758.
| Household Size | Family Households | Nonfamily Households |
| 1-Person Households | - | 758 (17.7%) |
| 2-Person Households | 1,232 (28.8%) | 89 (2.1%) |
| 3-Person Households | 831 (19.4%) | 8 (0.2%) |
| 4-Person Households | 755 (17.7%) | 0 (0.0%) |
| 5-Person Households | 276 (6.5%) | 0 (0.0%) |
| 6-Person Households | 162 (3.8%) | 0 (0.0%) |
| 7+ Person Households | 165 (3.9%) | 0 (0.0%) |
| Total | 3,421 (80.0%) | 855 (20.0%) |
Female Fertility in Salisbury
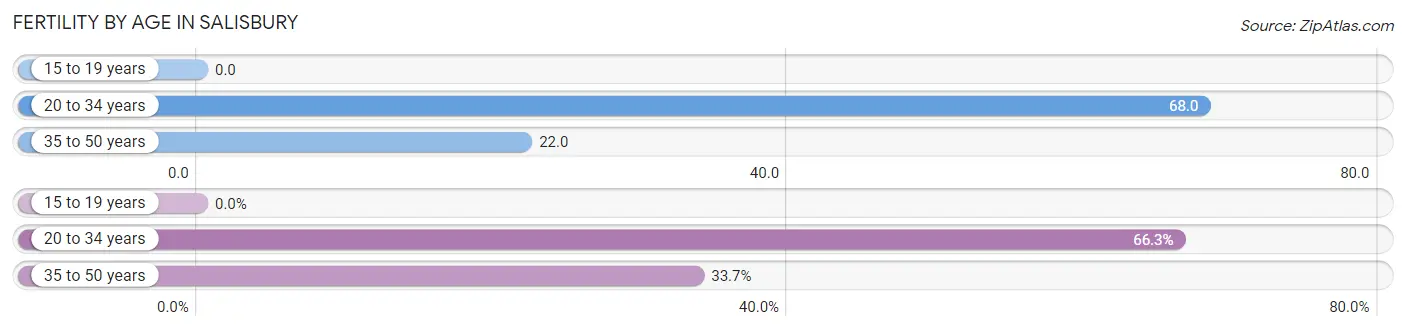
Fertility by Age in Salisbury
Average fertility rate in Salisbury is 35.0 births per 1,000 women. Women in the age bracket of 20 to 34 years have the highest fertility rate with 68.0 births per 1,000 women. Women in the age bracket of 20 to 34 years acount for 66.3% of all women with births.
| Age Bracket | Women with Births | Births / 1,000 Women |
| 15 to 19 years | 0 (0.0%) | 0.0 |
| 20 to 34 years | 63 (66.3%) | 68.0 |
| 35 to 50 years | 32 (33.7%) | 22.0 |
| Total | 95 (100.0%) | 35.0 |
Fertility by Age by Marriage Status in Salisbury
87.4% of women with births (95) in Salisbury are married. The highest percentage of unmarried women with births falls into 20 to 34 years age bracket with 19.1% of them unmarried at the time of birth, while the lowest percentage of unmarried women with births belong to 35 to 50 years age bracket with 0.0% of them unmarried.
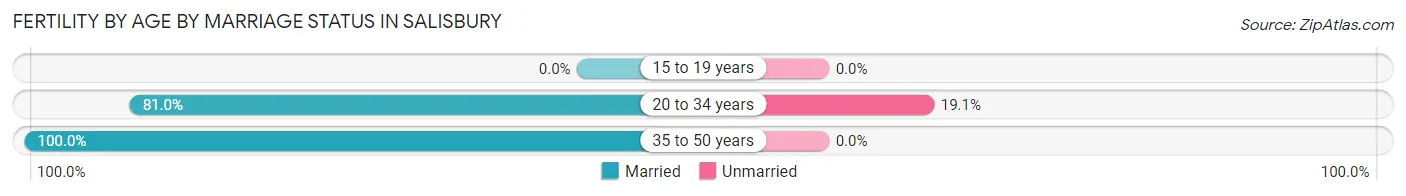
| Age Bracket | Married | Unmarried |
| 15 to 19 years | 0 (0.0%) | 0 (0.0%) |
| 20 to 34 years | 51 (80.9%) | 12 (19.1%) |
| 35 to 50 years | 32 (100.0%) | 0 (0.0%) |
| Total | 83 (87.4%) | 12 (12.6%) |
Fertility by Education in Salisbury
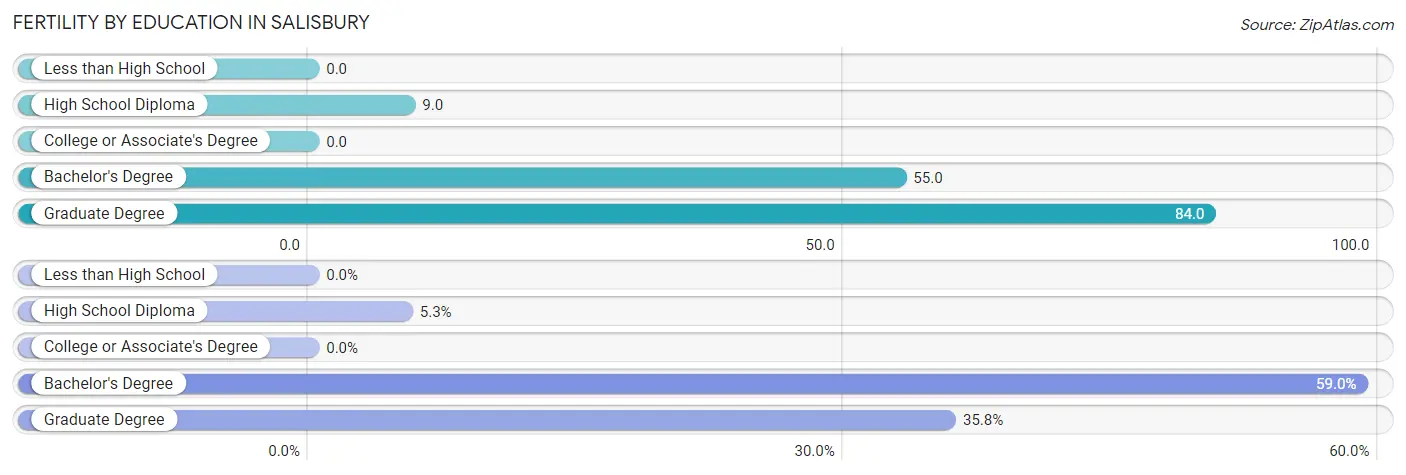
| Educational Attainment | Women with Births | Births / 1,000 Women |
| Less than High School | 0 (0.0%) | 0.0 |
| High School Diploma | 5 (5.3%) | 9.0 |
| College or Associate's Degree | 0 (0.0%) | 0.0 |
| Bachelor's Degree | 56 (59.0%) | 55.0 |
| Graduate Degree | 34 (35.8%) | 84.0 |
| Total | 95 (100.0%) | 35.0 |
Fertility by Education by Marriage Status in Salisbury
12.6% of women with births in Salisbury are unmarried. Women with the educational attainment of high school diploma are most likely to be married with 100.0% of them married at childbirth, while women with the educational attainment of bachelor's degree are least likely to be married with 21.4% of them unmarried at childbirth.
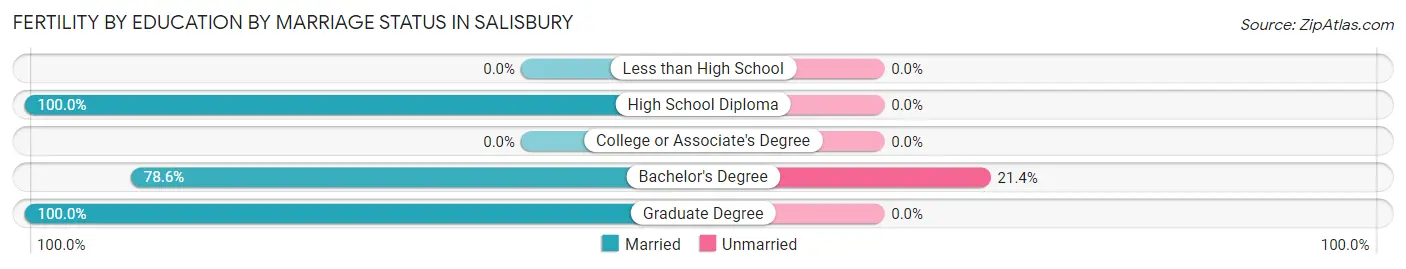
| Educational Attainment | Married | Unmarried |
| Less than High School | 0 (0.0%) | 0 (0.0%) |
| High School Diploma | 5 (100.0%) | 0 (0.0%) |
| College or Associate's Degree | 0 (0.0%) | 0 (0.0%) |
| Bachelor's Degree | 44 (78.6%) | 12 (21.4%) |
| Graduate Degree | 34 (100.0%) | 0 (0.0%) |
| Total | 83 (87.4%) | 12 (12.6%) |
Employment Characteristics in Salisbury
Employment by Class of Employer in Salisbury
Among the 6,295 employed individuals in Salisbury, private company employees (4,030 | 64.0%), local government employees (919 | 14.6%), and not-for-profit organizations (546 | 8.7%) make up the most common classes of employment.
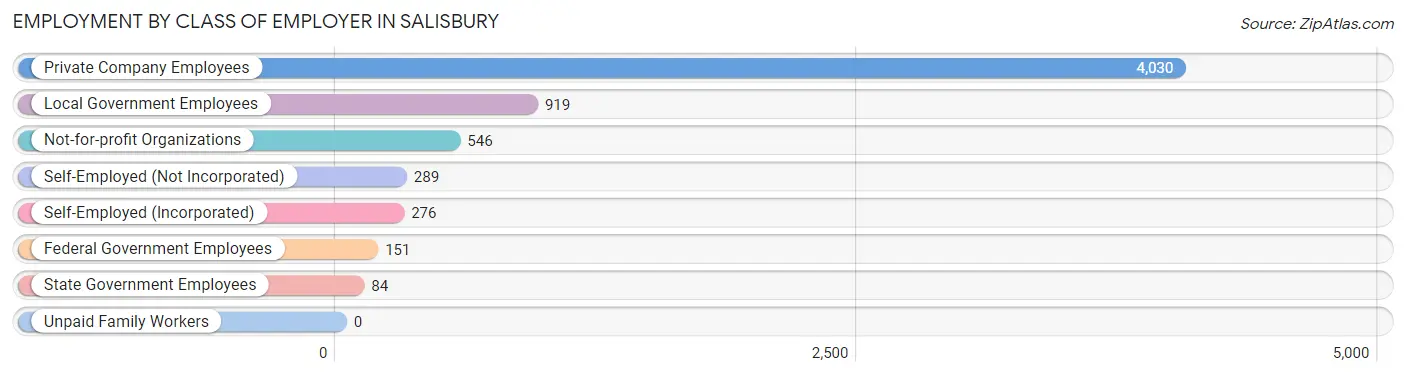
| Employer Class | # Employees | % Employees |
| Private Company Employees | 4,030 | 64.0% |
| Self-Employed (Incorporated) | 276 | 4.4% |
| Self-Employed (Not Incorporated) | 289 | 4.6% |
| Not-for-profit Organizations | 546 | 8.7% |
| Local Government Employees | 919 | 14.6% |
| State Government Employees | 84 | 1.3% |
| Federal Government Employees | 151 | 2.4% |
| Unpaid Family Workers | 0 | 0.0% |
| Total | 6,295 | 100.0% |
Employment Status by Age in Salisbury
According to the labor force statistics for Salisbury, out of the total population over 16 years of age (10,596), 62.7% or 6,644 individuals are in the labor force, with 3.1% or 206 of them unemployed. The age group with the highest labor force participation rate is 35 to 44 years, with 88.5% or 1,551 individuals in the labor force. Within the labor force, the 20 to 24 years age range has the highest percentage of unemployed individuals, with 10.9% or 56 of them being unemployed.
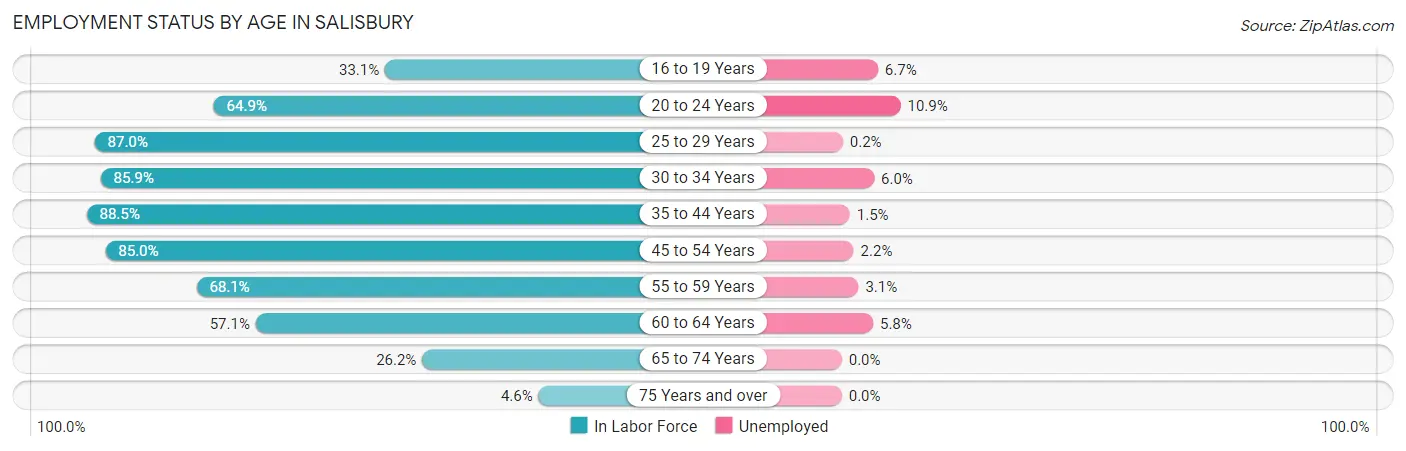
| Age Bracket | In Labor Force | Unemployed |
| 16 to 19 Years | 164 (33.1%) | 11 (6.7%) |
| 20 to 24 Years | 513 (64.9%) | 56 (10.9%) |
| 25 to 29 Years | 618 (87.0%) | 1 (0.2%) |
| 30 to 34 Years | 553 (85.9%) | 33 (6.0%) |
| 35 to 44 Years | 1,551 (88.5%) | 23 (1.5%) |
| 45 to 54 Years | 1,646 (85.0%) | 36 (2.2%) |
| 55 to 59 Years | 686 (68.1%) | 21 (3.1%) |
| 60 to 64 Years | 504 (57.1%) | 29 (5.8%) |
| 65 to 74 Years | 364 (26.2%) | 0 (0.0%) |
| 75 Years and over | 45 (4.6%) | 0 (0.0%) |
| Total | 6,644 (62.7%) | 206 (3.1%) |
Employment Status by Educational Attainment in Salisbury
According to labor force statistics for Salisbury, 80.2% of individuals (5,560) out of the total population between 25 and 64 years of age (6,933) are in the labor force, with 2.6% or 145 of them being unemployed. The group with the highest labor force participation rate are those with the educational attainment of bachelor's degree or higher, with 89.8% or 3,235 individuals in the labor force. Within the labor force, individuals with college / associate degree education have the highest percentage of unemployment, with 4.7% or 53 of them being unemployed.
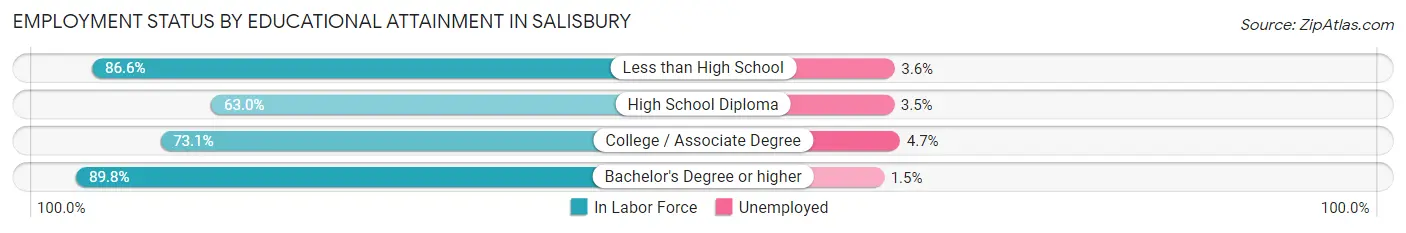
| Educational Attainment | In Labor Force | Unemployed |
| Less than High School | 252 (86.6%) | 10 (3.6%) |
| High School Diploma | 941 (63.0%) | 52 (3.5%) |
| College / Associate Degree | 1,129 (73.1%) | 73 (4.7%) |
| Bachelor's Degree or higher | 3,235 (89.8%) | 54 (1.5%) |
| Total | 5,560 (80.2%) | 180 (2.6%) |
Employment Occupations by Sex in Salisbury
Management, Business, Science and Arts Occupations
The most common Management, Business, Science and Arts occupations in Salisbury are Community & Social Service (795 | 12.4%), Health Diagnosing & Treating (693 | 10.8%), Management (679 | 10.6%), Education Instruction & Library (617 | 9.7%), and Business & Financial (580 | 9.1%).
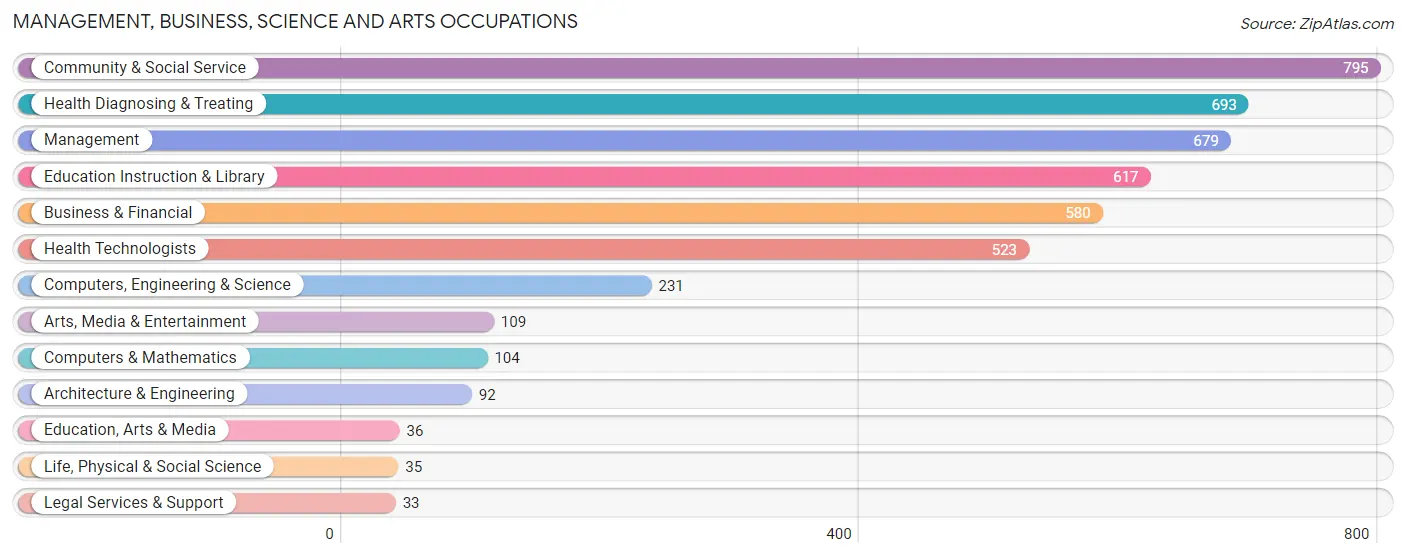
Management, Business, Science and Arts Occupations by Sex
Within the Management, Business, Science and Arts occupations in Salisbury, the most male-oriented occupations are Architecture & Engineering (100.0%), Business & Financial (65.9%), and Life, Physical & Social Science (65.7%), while the most female-oriented occupations are Education, Arts & Media (100.0%), Education Instruction & Library (79.4%), and Community & Social Service (75.3%).
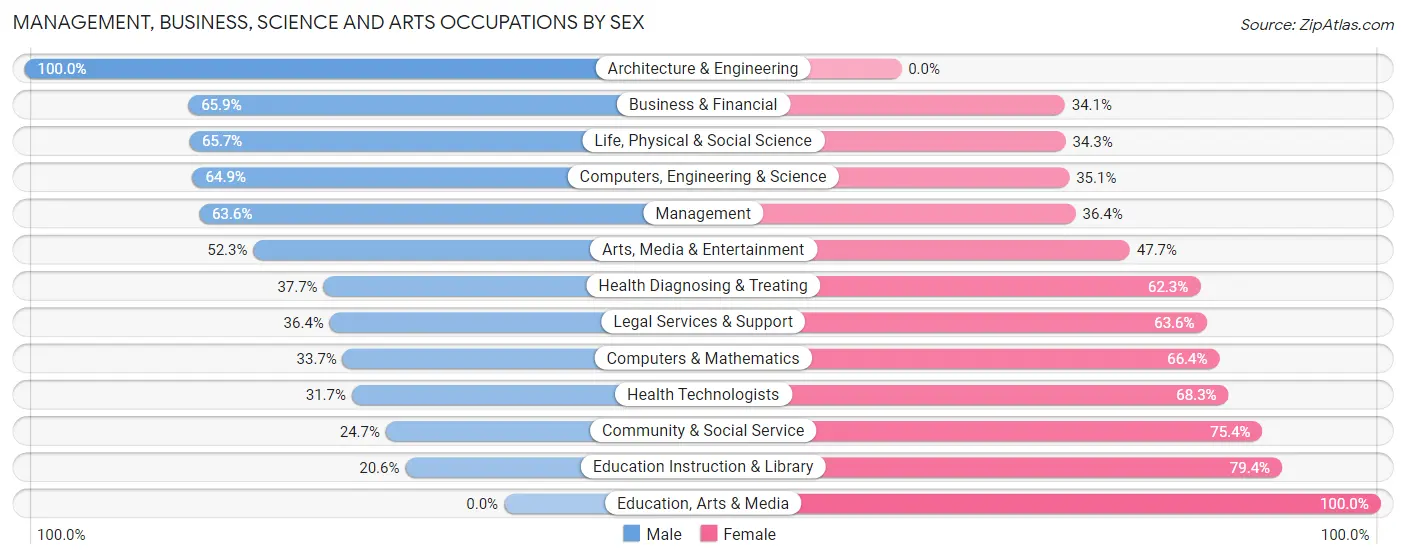
| Occupation | Male | Female |
| Management | 432 (63.6%) | 247 (36.4%) |
| Business & Financial | 382 (65.9%) | 198 (34.1%) |
| Computers, Engineering & Science | 150 (64.9%) | 81 (35.1%) |
| Computers & Mathematics | 35 (33.7%) | 69 (66.3%) |
| Architecture & Engineering | 92 (100.0%) | 0 (0.0%) |
| Life, Physical & Social Science | 23 (65.7%) | 12 (34.3%) |
| Community & Social Service | 196 (24.6%) | 599 (75.3%) |
| Education, Arts & Media | 0 (0.0%) | 36 (100.0%) |
| Legal Services & Support | 12 (36.4%) | 21 (63.6%) |
| Education Instruction & Library | 127 (20.6%) | 490 (79.4%) |
| Arts, Media & Entertainment | 57 (52.3%) | 52 (47.7%) |
| Health Diagnosing & Treating | 261 (37.7%) | 432 (62.3%) |
| Health Technologists | 166 (31.7%) | 357 (68.3%) |
| Total (Category) | 1,421 (47.7%) | 1,557 (52.3%) |
| Total (Overall) | 3,623 (56.7%) | 2,770 (43.3%) |
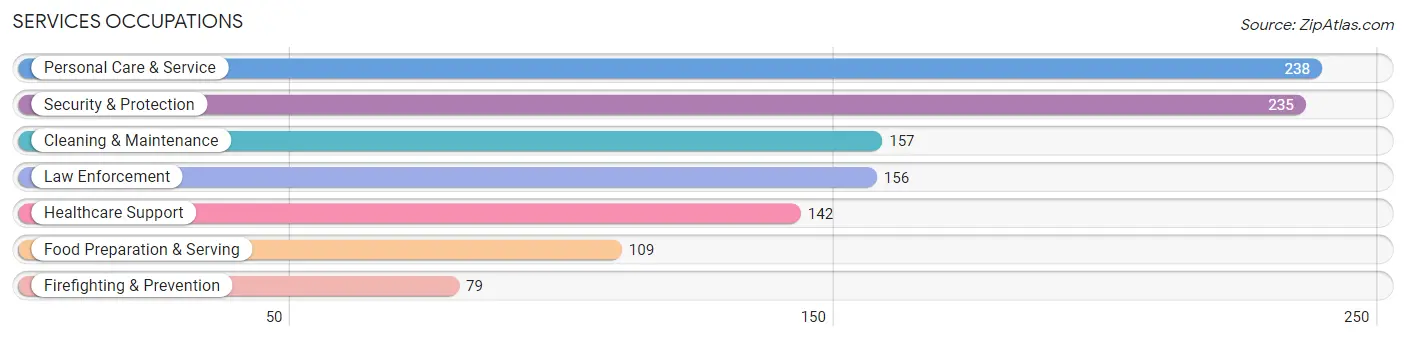
Services Occupations
The most common Services occupations in Salisbury are Personal Care & Service (238 | 3.7%), Security & Protection (235 | 3.7%), Cleaning & Maintenance (157 | 2.5%), Law Enforcement (156 | 2.4%), and Healthcare Support (142 | 2.2%).
Services Occupations by Sex
Within the Services occupations in Salisbury, the most male-oriented occupations are Law Enforcement (100.0%), Security & Protection (91.9%), and Firefighting & Prevention (75.9%), while the most female-oriented occupations are Personal Care & Service (86.6%), Healthcare Support (69.7%), and Cleaning & Maintenance (58.6%).
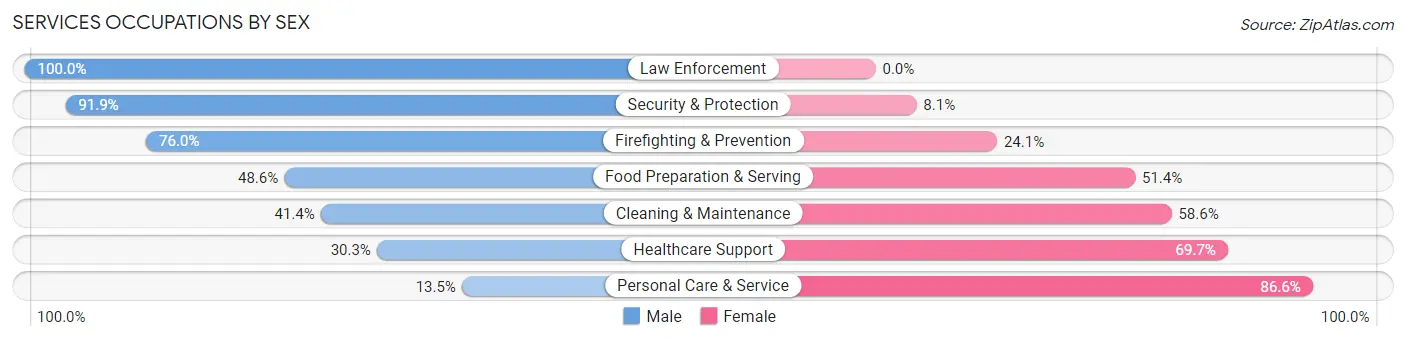
| Occupation | Male | Female |
| Healthcare Support | 43 (30.3%) | 99 (69.7%) |
| Security & Protection | 216 (91.9%) | 19 (8.1%) |
| Firefighting & Prevention | 60 (75.9%) | 19 (24.0%) |
| Law Enforcement | 156 (100.0%) | 0 (0.0%) |
| Food Preparation & Serving | 53 (48.6%) | 56 (51.4%) |
| Cleaning & Maintenance | 65 (41.4%) | 92 (58.6%) |
| Personal Care & Service | 32 (13.5%) | 206 (86.6%) |
| Total (Category) | 409 (46.4%) | 472 (53.6%) |
| Total (Overall) | 3,623 (56.7%) | 2,770 (43.3%) |
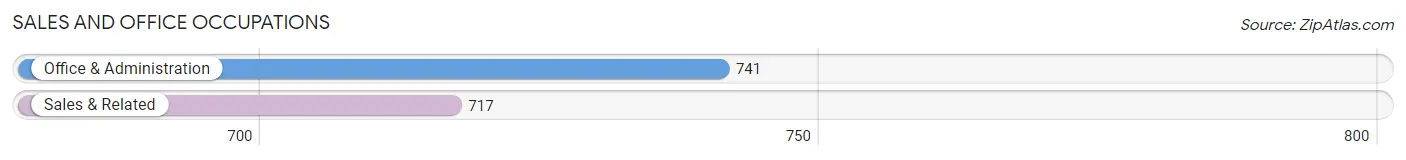
Sales and Office Occupations
The most common Sales and Office occupations in Salisbury are Office & Administration (741 | 11.6%), and Sales & Related (717 | 11.2%).
Sales and Office Occupations by Sex
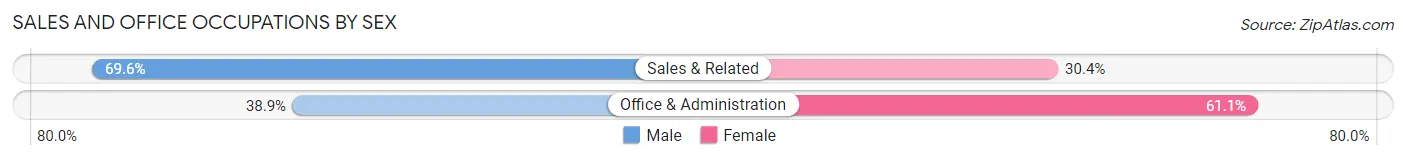
| Occupation | Male | Female |
| Sales & Related | 499 (69.6%) | 218 (30.4%) |
| Office & Administration | 288 (38.9%) | 453 (61.1%) |
| Total (Category) | 787 (54.0%) | 671 (46.0%) |
| Total (Overall) | 3,623 (56.7%) | 2,770 (43.3%) |
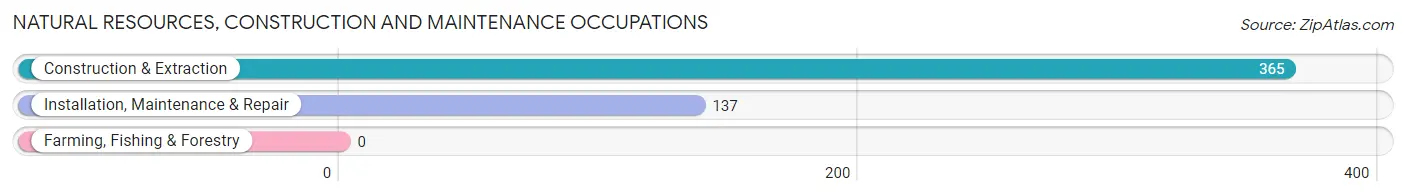
Natural Resources, Construction and Maintenance Occupations
The most common Natural Resources, Construction and Maintenance occupations in Salisbury are Construction & Extraction (365 | 5.7%), and Installation, Maintenance & Repair (137 | 2.1%).
Natural Resources, Construction and Maintenance Occupations by Sex
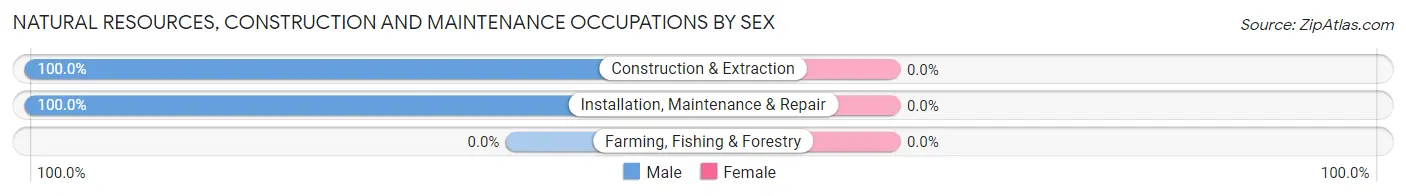
| Occupation | Male | Female |
| Farming, Fishing & Forestry | 0 (0.0%) | 0 (0.0%) |
| Construction & Extraction | 365 (100.0%) | 0 (0.0%) |
| Installation, Maintenance & Repair | 137 (100.0%) | 0 (0.0%) |
| Total (Category) | 502 (100.0%) | 0 (0.0%) |
| Total (Overall) | 3,623 (56.7%) | 2,770 (43.3%) |
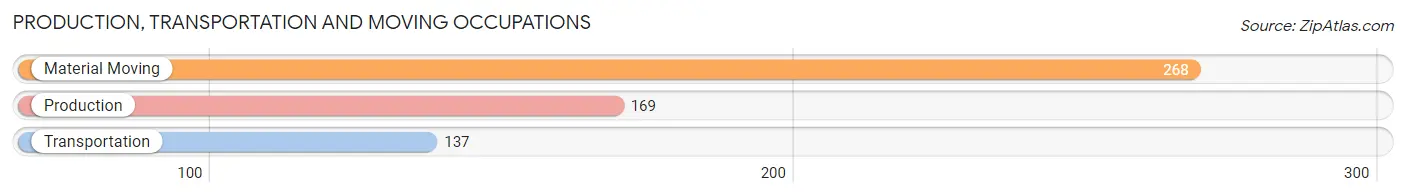
Production, Transportation and Moving Occupations
The most common Production, Transportation and Moving occupations in Salisbury are Material Moving (268 | 4.2%), Production (169 | 2.6%), and Transportation (137 | 2.1%).
Production, Transportation and Moving Occupations by Sex
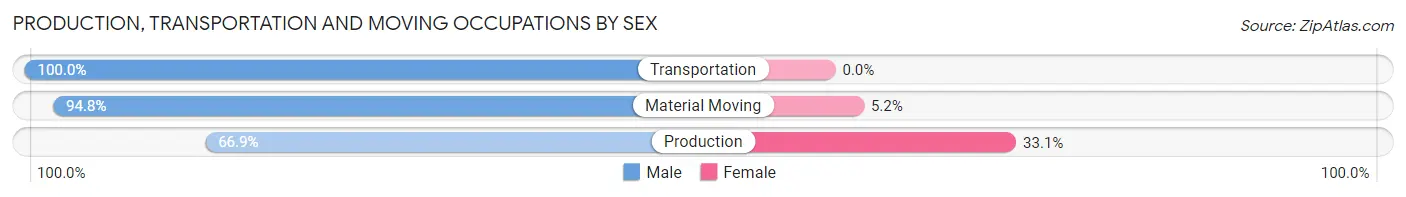
| Occupation | Male | Female |
| Production | 113 (66.9%) | 56 (33.1%) |
| Transportation | 137 (100.0%) | 0 (0.0%) |
| Material Moving | 254 (94.8%) | 14 (5.2%) |
| Total (Category) | 504 (87.8%) | 70 (12.2%) |
| Total (Overall) | 3,623 (56.7%) | 2,770 (43.3%) |
Employment Industries by Sex in Salisbury
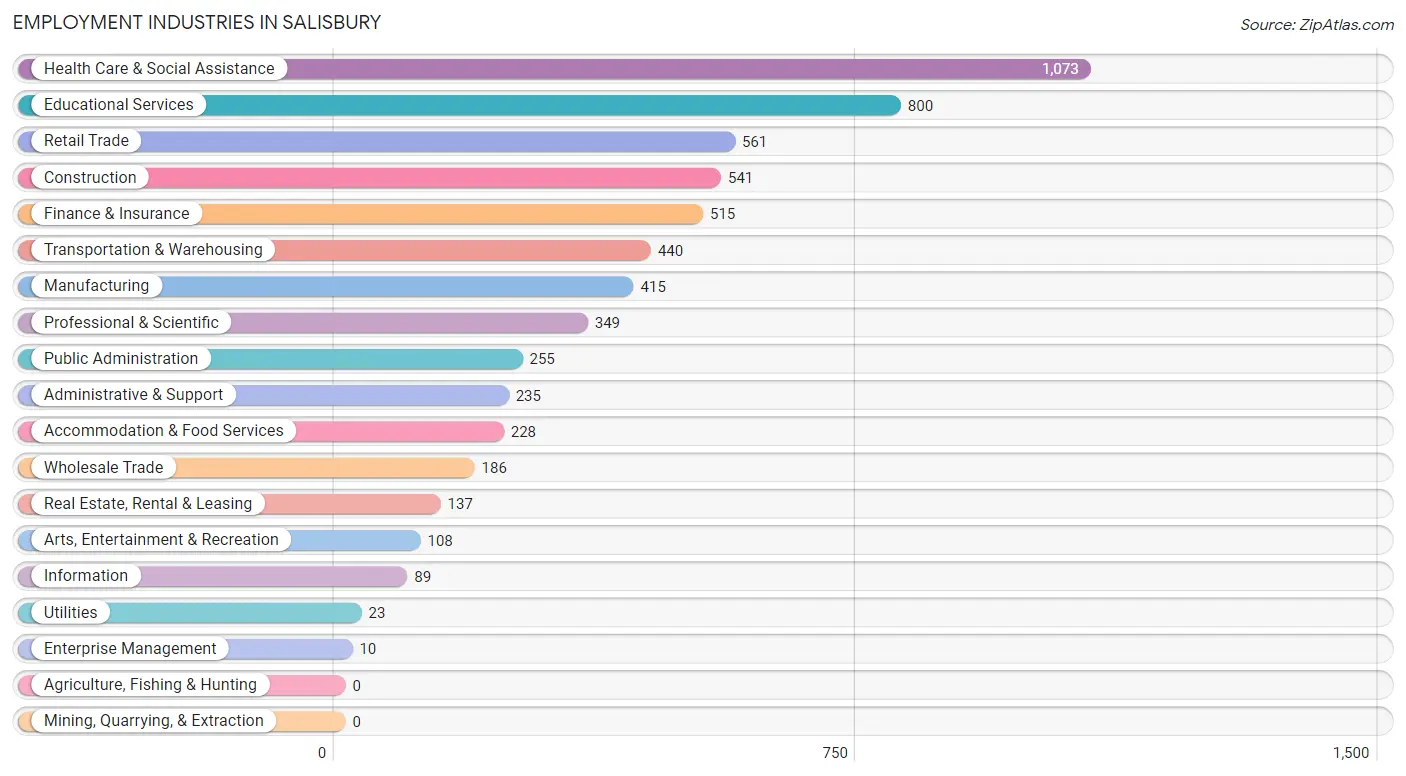
Employment Industries in Salisbury
The major employment industries in Salisbury include Health Care & Social Assistance (1,073 | 16.8%), Educational Services (800 | 12.5%), Retail Trade (561 | 8.8%), Construction (541 | 8.5%), and Finance & Insurance (515 | 8.1%).
Employment Industries by Sex in Salisbury
The Salisbury industries that see more men than women are Utilities (100.0%), Transportation & Warehousing (90.7%), and Public Administration (86.7%), whereas the industries that tend to have a higher number of women are Enterprise Management (100.0%), Educational Services (73.6%), and Health Care & Social Assistance (70.1%).
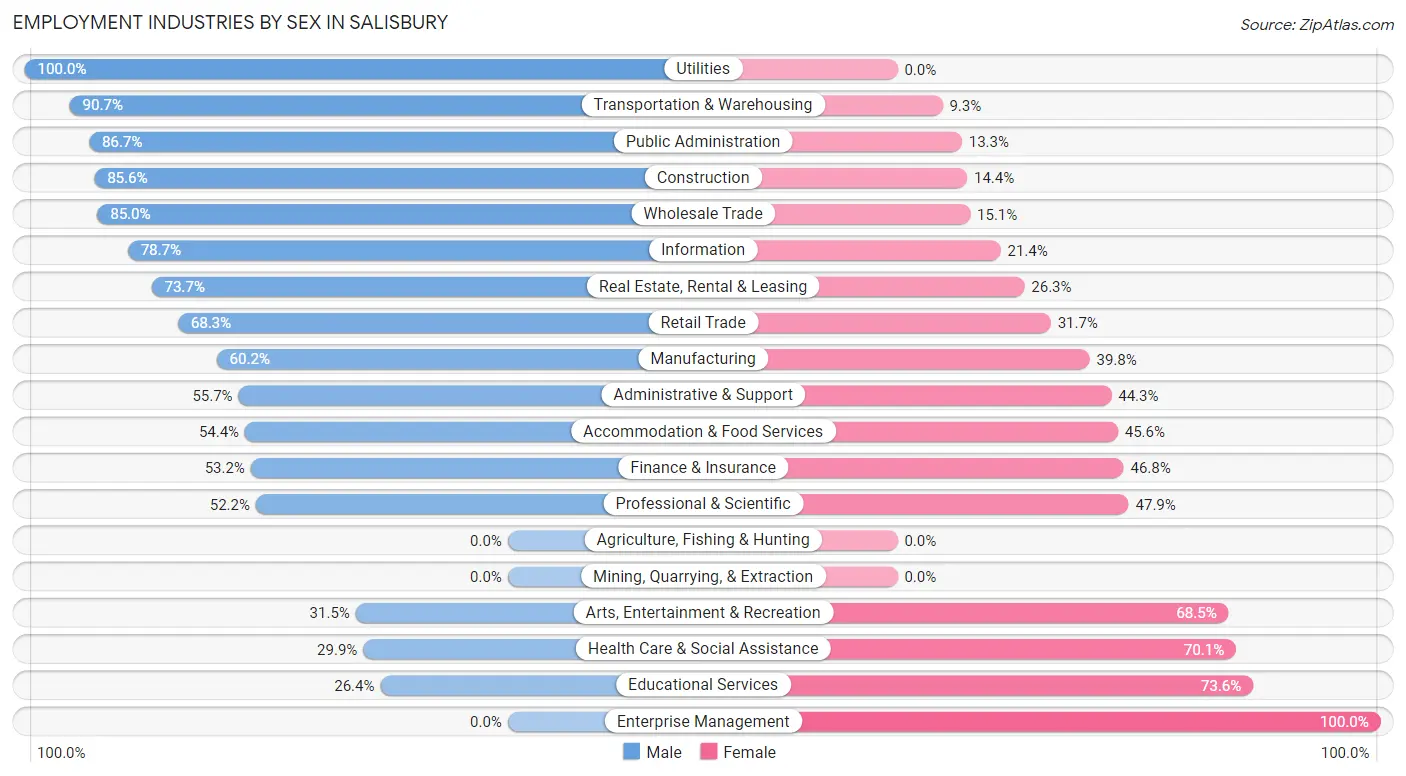
| Industry | Male | Female |
| Agriculture, Fishing & Hunting | 0 (0.0%) | 0 (0.0%) |
| Mining, Quarrying, & Extraction | 0 (0.0%) | 0 (0.0%) |
| Construction | 463 (85.6%) | 78 (14.4%) |
| Manufacturing | 250 (60.2%) | 165 (39.8%) |
| Wholesale Trade | 158 (85.0%) | 28 (15.0%) |
| Retail Trade | 383 (68.3%) | 178 (31.7%) |
| Transportation & Warehousing | 399 (90.7%) | 41 (9.3%) |
| Utilities | 23 (100.0%) | 0 (0.0%) |
| Information | 70 (78.6%) | 19 (21.3%) |
| Finance & Insurance | 274 (53.2%) | 241 (46.8%) |
| Real Estate, Rental & Leasing | 101 (73.7%) | 36 (26.3%) |
| Professional & Scientific | 182 (52.1%) | 167 (47.8%) |
| Enterprise Management | 0 (0.0%) | 10 (100.0%) |
| Administrative & Support | 131 (55.7%) | 104 (44.3%) |
| Educational Services | 211 (26.4%) | 589 (73.6%) |
| Health Care & Social Assistance | 321 (29.9%) | 752 (70.1%) |
| Arts, Entertainment & Recreation | 34 (31.5%) | 74 (68.5%) |
| Accommodation & Food Services | 124 (54.4%) | 104 (45.6%) |
| Public Administration | 221 (86.7%) | 34 (13.3%) |
| Total | 3,623 (56.7%) | 2,770 (43.3%) |
Education in Salisbury
School Enrollment in Salisbury
The most common levels of schooling among the 2,938 students in Salisbury are college / undergraduate (634 | 21.6%), middle school (591 | 20.1%), and elementary school (543 | 18.5%).
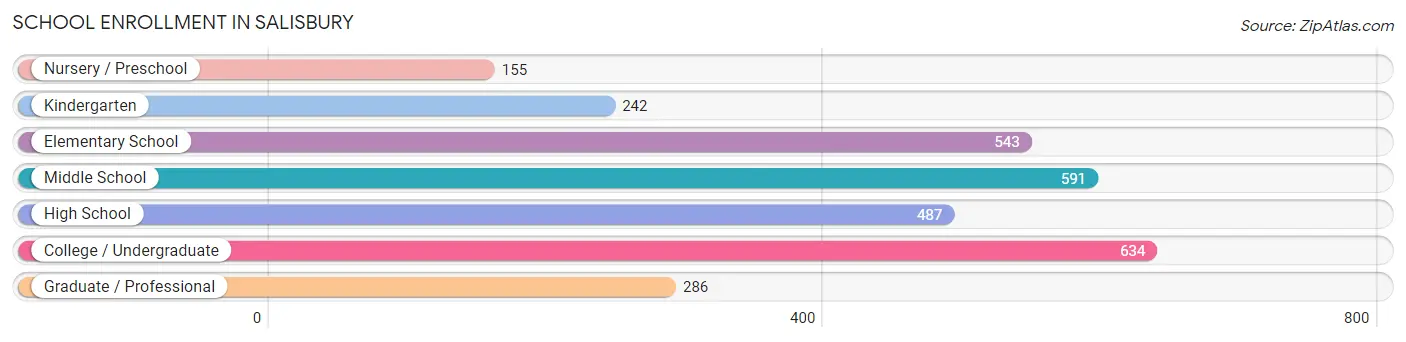
| School Level | # Students | % Students |
| Nursery / Preschool | 155 | 5.3% |
| Kindergarten | 242 | 8.2% |
| Elementary School | 543 | 18.5% |
| Middle School | 591 | 20.1% |
| High School | 487 | 16.6% |
| College / Undergraduate | 634 | 21.6% |
| Graduate / Professional | 286 | 9.7% |
| Total | 2,938 | 100.0% |
School Enrollment by Age by Funding Source in Salisbury
Out of a total of 2,938 students who are enrolled in schools in Salisbury, 658 (22.4%) attend a private institution, while the remaining 2,280 (77.6%) are enrolled in public schools. The age group of 18 to 19 year olds has the highest likelihood of being enrolled in private schools, with 121 (59.0% in the age bracket) enrolled. Conversely, the age group of 15 to 17 year olds has the lowest likelihood of being enrolled in a private school, with 375 (93.5% in the age bracket) attending a public institution.
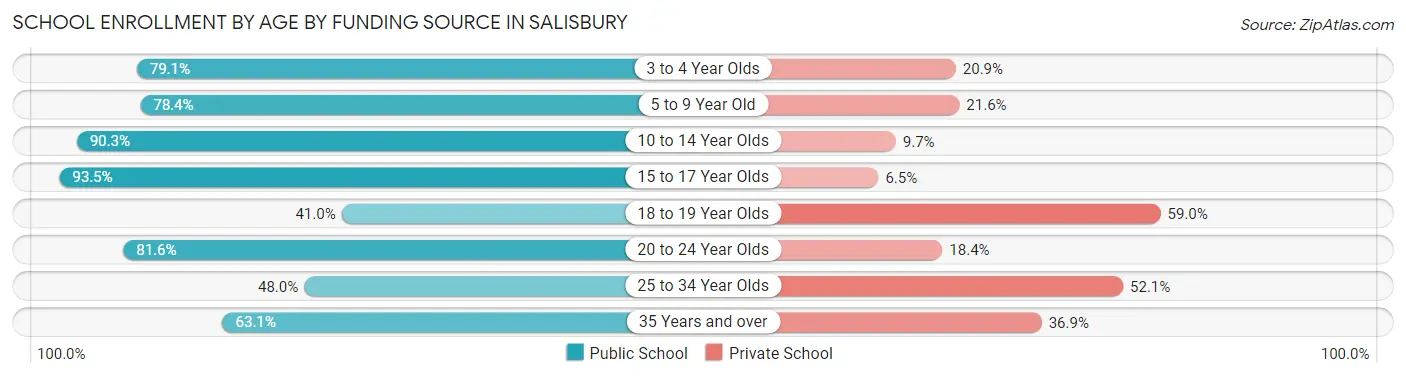
| Age Bracket | Public School | Private School |
| 3 to 4 Year Olds | 106 (79.1%) | 28 (20.9%) |
| 5 to 9 Year Old | 575 (78.4%) | 158 (21.6%) |
| 10 to 14 Year Olds | 669 (90.3%) | 72 (9.7%) |
| 15 to 17 Year Olds | 375 (93.5%) | 26 (6.5%) |
| 18 to 19 Year Olds | 84 (41.0%) | 121 (59.0%) |
| 20 to 24 Year Olds | 253 (81.6%) | 57 (18.4%) |
| 25 to 34 Year Olds | 140 (47.9%) | 152 (52.0%) |
| 35 Years and over | 77 (63.1%) | 45 (36.9%) |
| Total | 2,280 (77.6%) | 658 (22.4%) |
Educational Attainment by Field of Study in Salisbury
Business (1,267 | 27.0%), science & technology (665 | 14.2%), education (468 | 10.0%), literature & languages (328 | 7.0%), and computers & mathematics (316 | 6.7%) are the most common fields of study among 4,691 individuals in Salisbury who have obtained a bachelor's degree or higher.
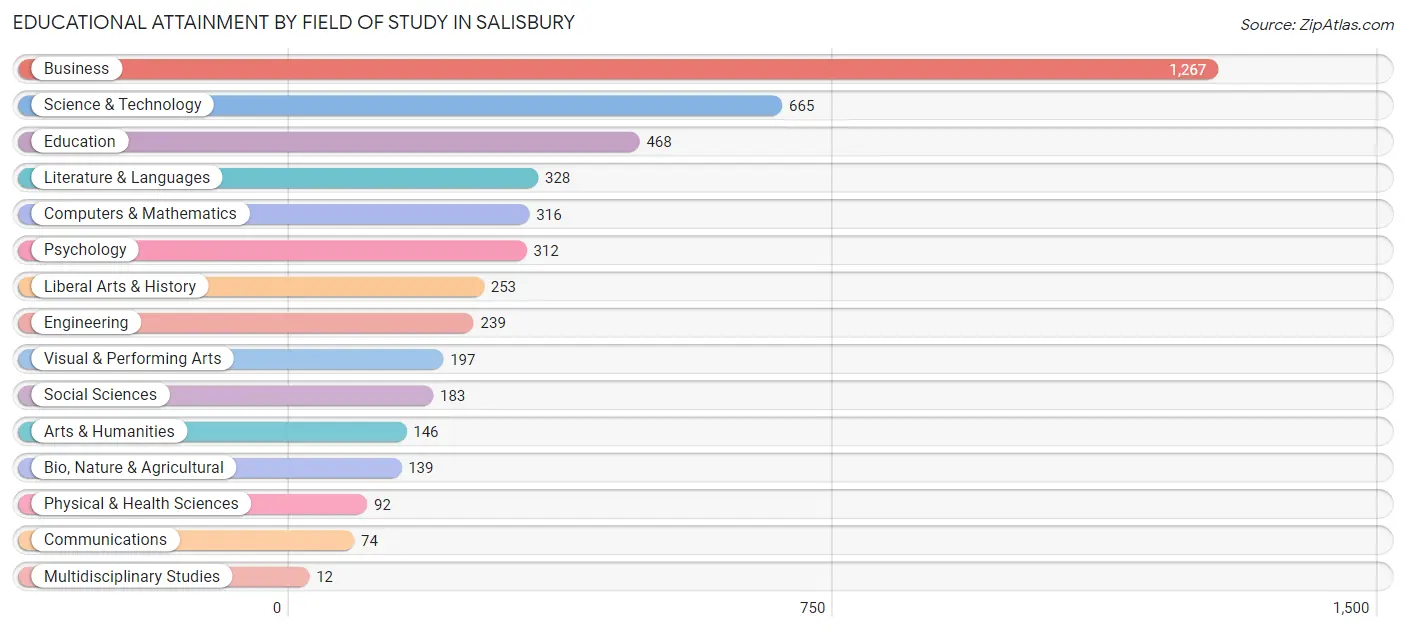
| Field of Study | # Graduates | % Graduates |
| Computers & Mathematics | 316 | 6.7% |
| Bio, Nature & Agricultural | 139 | 3.0% |
| Physical & Health Sciences | 92 | 2.0% |
| Psychology | 312 | 6.7% |
| Social Sciences | 183 | 3.9% |
| Engineering | 239 | 5.1% |
| Multidisciplinary Studies | 12 | 0.3% |
| Science & Technology | 665 | 14.2% |
| Business | 1,267 | 27.0% |
| Education | 468 | 10.0% |
| Literature & Languages | 328 | 7.0% |
| Liberal Arts & History | 253 | 5.4% |
| Visual & Performing Arts | 197 | 4.2% |
| Communications | 74 | 1.6% |
| Arts & Humanities | 146 | 3.1% |
| Total | 4,691 | 100.0% |
Transportation & Commute in Salisbury
Vehicle Availability by Sex in Salisbury
The most prevalent vehicle ownership categories in Salisbury are males with 2 vehicles (1,429, accounting for 39.7%) and females with 2 vehicles (1,105, making up 53.1%).

| Vehicles Available | Male | Female |
| No Vehicle | 155 (4.3%) | 0 (0.0%) |
| 1 Vehicle | 522 (14.5%) | 383 (14.2%) |
| 2 Vehicles | 1,429 (39.7%) | 1,105 (41.0%) |
| 3 Vehicles | 967 (26.9%) | 677 (25.1%) |
| 4 Vehicles | 348 (9.7%) | 418 (15.5%) |
| 5 or more Vehicles | 176 (4.9%) | 110 (4.1%) |
| Total | 3,597 (100.0%) | 2,693 (100.0%) |
Commute Time in Salisbury
The most frequently occuring commute durations in Salisbury are 20 to 24 minutes (895 commuters, 15.8%), 60 to 89 minutes (868 commuters, 15.3%), and 30 to 34 minutes (698 commuters, 12.3%).
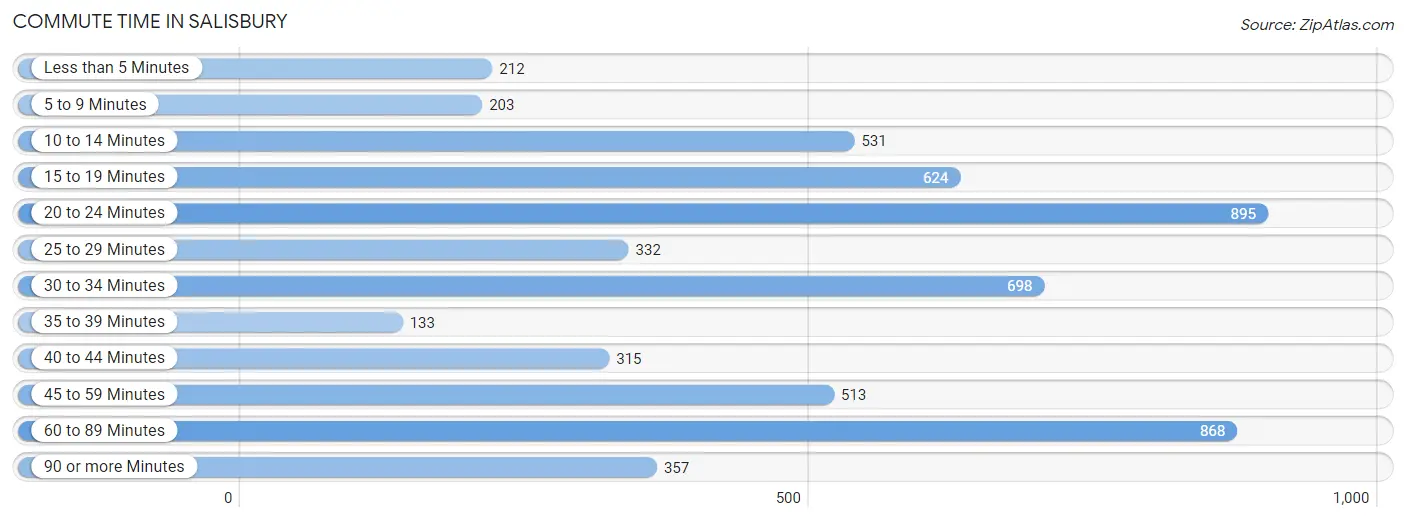
| Commute Time | # Commuters | % Commuters |
| Less than 5 Minutes | 212 | 3.7% |
| 5 to 9 Minutes | 203 | 3.6% |
| 10 to 14 Minutes | 531 | 9.3% |
| 15 to 19 Minutes | 624 | 11.0% |
| 20 to 24 Minutes | 895 | 15.8% |
| 25 to 29 Minutes | 332 | 5.8% |
| 30 to 34 Minutes | 698 | 12.3% |
| 35 to 39 Minutes | 133 | 2.3% |
| 40 to 44 Minutes | 315 | 5.5% |
| 45 to 59 Minutes | 513 | 9.0% |
| 60 to 89 Minutes | 868 | 15.3% |
| 90 or more Minutes | 357 | 6.3% |
Commute Time by Sex in Salisbury
The most common commute times in Salisbury are 60 to 89 minutes (625 commuters, 18.4%) for males and 20 to 24 minutes (373 commuters, 16.3%) for females.
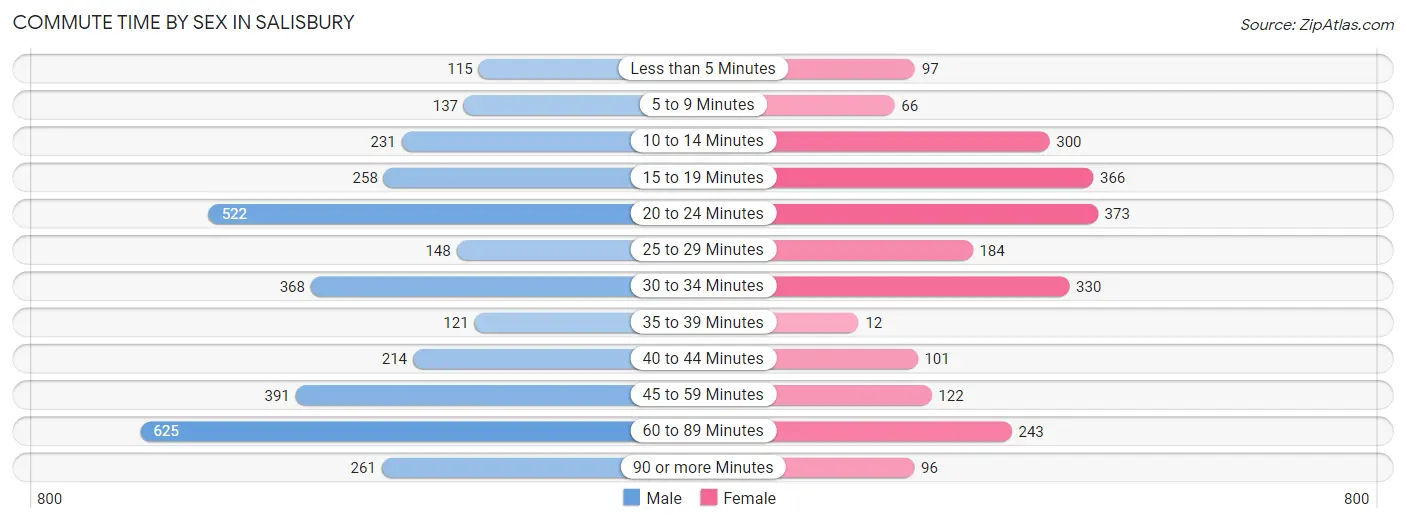
| Commute Time | Male | Female |
| Less than 5 Minutes | 115 (3.4%) | 97 (4.2%) |
| 5 to 9 Minutes | 137 (4.0%) | 66 (2.9%) |
| 10 to 14 Minutes | 231 (6.8%) | 300 (13.1%) |
| 15 to 19 Minutes | 258 (7.6%) | 366 (16.0%) |
| 20 to 24 Minutes | 522 (15.4%) | 373 (16.3%) |
| 25 to 29 Minutes | 148 (4.4%) | 184 (8.0%) |
| 30 to 34 Minutes | 368 (10.8%) | 330 (14.4%) |
| 35 to 39 Minutes | 121 (3.6%) | 12 (0.5%) |
| 40 to 44 Minutes | 214 (6.3%) | 101 (4.4%) |
| 45 to 59 Minutes | 391 (11.5%) | 122 (5.3%) |
| 60 to 89 Minutes | 625 (18.4%) | 243 (10.6%) |
| 90 or more Minutes | 261 (7.7%) | 96 (4.2%) |
Time of Departure to Work by Sex in Salisbury
The most frequent times of departure to work in Salisbury are 7:00 AM to 7:29 AM (489, 14.4%) for males and 7:30 AM to 7:59 AM (377, 16.5%) for females.
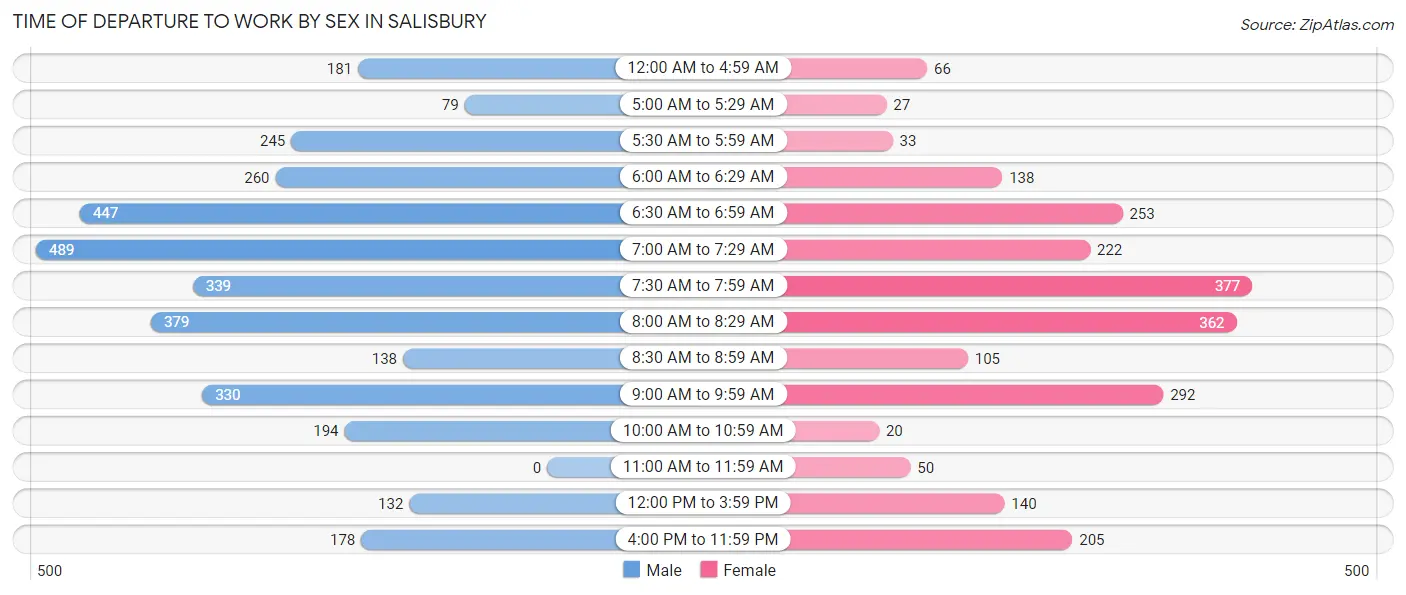
| Time of Departure | Male | Female |
| 12:00 AM to 4:59 AM | 181 (5.3%) | 66 (2.9%) |
| 5:00 AM to 5:29 AM | 79 (2.3%) | 27 (1.2%) |
| 5:30 AM to 5:59 AM | 245 (7.2%) | 33 (1.4%) |
| 6:00 AM to 6:29 AM | 260 (7.7%) | 138 (6.0%) |
| 6:30 AM to 6:59 AM | 447 (13.2%) | 253 (11.1%) |
| 7:00 AM to 7:29 AM | 489 (14.4%) | 222 (9.7%) |
| 7:30 AM to 7:59 AM | 339 (10.0%) | 377 (16.5%) |
| 8:00 AM to 8:29 AM | 379 (11.2%) | 362 (15.8%) |
| 8:30 AM to 8:59 AM | 138 (4.1%) | 105 (4.6%) |
| 9:00 AM to 9:59 AM | 330 (9.7%) | 292 (12.8%) |
| 10:00 AM to 10:59 AM | 194 (5.7%) | 20 (0.9%) |
| 11:00 AM to 11:59 AM | 0 (0.0%) | 50 (2.2%) |
| 12:00 PM to 3:59 PM | 132 (3.9%) | 140 (6.1%) |
| 4:00 PM to 11:59 PM | 178 (5.2%) | 205 (8.9%) |
| Total | 3,391 (100.0%) | 2,290 (100.0%) |
Housing Occupancy in Salisbury
Occupancy by Ownership in Salisbury
Of the total 4,276 dwellings in Salisbury, owner-occupied units account for 3,892 (91.0%), while renter-occupied units make up 384 (9.0%).
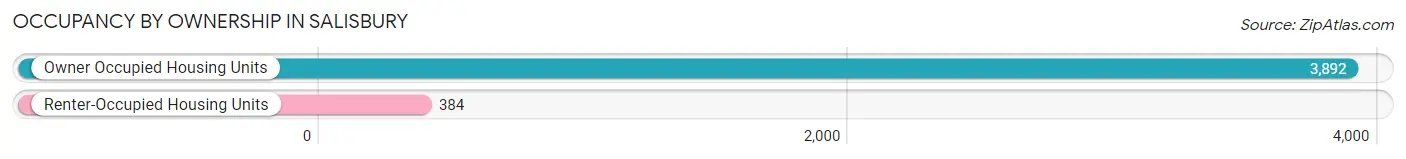
| Occupancy | # Housing Units | % Housing Units |
| Owner Occupied Housing Units | 3,892 | 91.0% |
| Renter-Occupied Housing Units | 384 | 9.0% |
| Total Occupied Housing Units | 4,276 | 100.0% |
Occupancy by Household Size in Salisbury
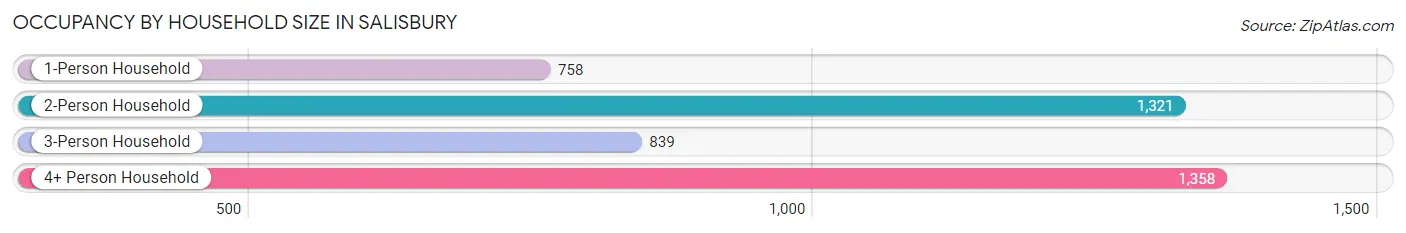
| Household Size | # Housing Units | % Housing Units |
| 1-Person Household | 758 | 17.7% |
| 2-Person Household | 1,321 | 30.9% |
| 3-Person Household | 839 | 19.6% |
| 4+ Person Household | 1,358 | 31.8% |
| Total Housing Units | 4,276 | 100.0% |
Occupancy by Ownership by Household Size in Salisbury
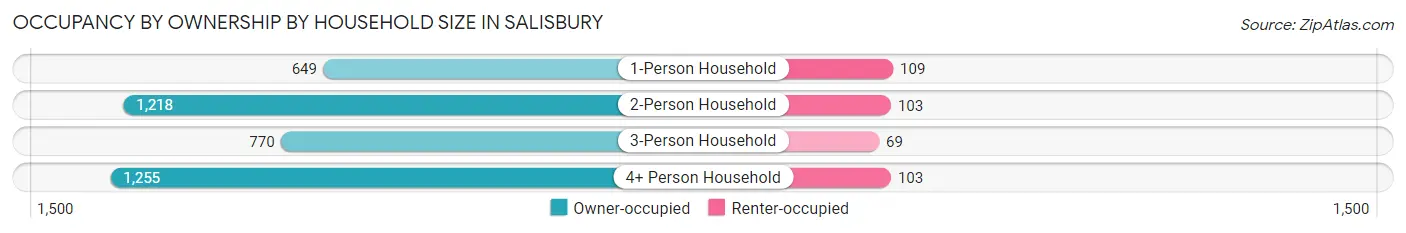
| Household Size | Owner-occupied | Renter-occupied |
| 1-Person Household | 649 (85.6%) | 109 (14.4%) |
| 2-Person Household | 1,218 (92.2%) | 103 (7.8%) |
| 3-Person Household | 770 (91.8%) | 69 (8.2%) |
| 4+ Person Household | 1,255 (92.4%) | 103 (7.6%) |
| Total Housing Units | 3,892 (91.0%) | 384 (9.0%) |
Occupancy by Educational Attainment in Salisbury
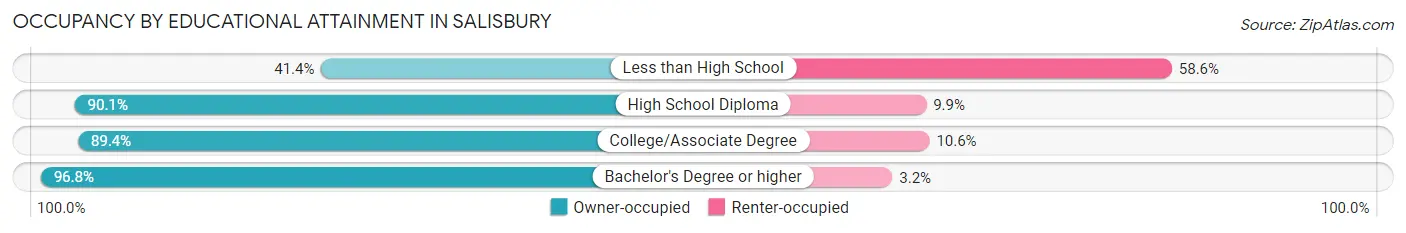
| Household Size | Owner-occupied | Renter-occupied |
| Less than High School | 84 (41.4%) | 119 (58.6%) |
| High School Diploma | 563 (90.1%) | 62 (9.9%) |
| College/Associate Degree | 1,127 (89.4%) | 133 (10.6%) |
| Bachelor's Degree or higher | 2,118 (96.8%) | 70 (3.2%) |
Occupancy by Age of Householder in Salisbury
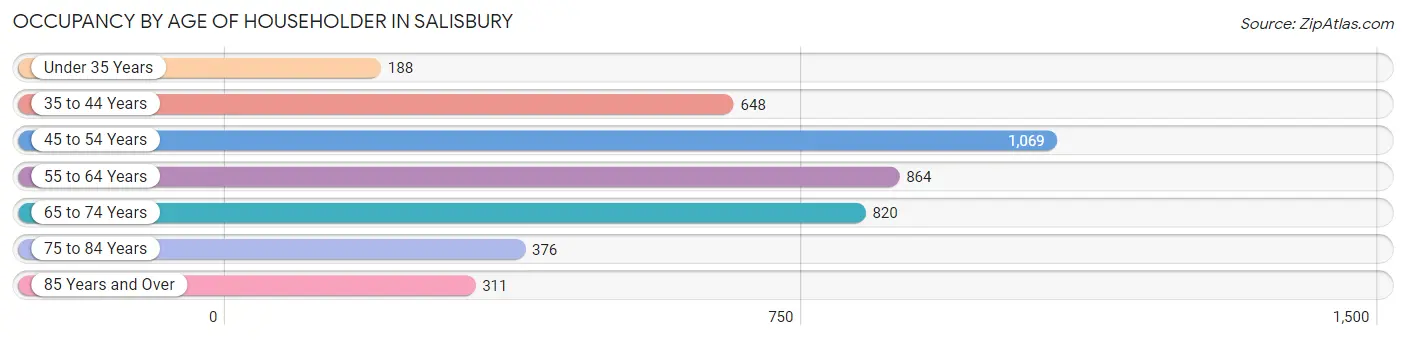
| Age Bracket | # Households | % Households |
| Under 35 Years | 188 | 4.4% |
| 35 to 44 Years | 648 | 15.1% |
| 45 to 54 Years | 1,069 | 25.0% |
| 55 to 64 Years | 864 | 20.2% |
| 65 to 74 Years | 820 | 19.2% |
| 75 to 84 Years | 376 | 8.8% |
| 85 Years and Over | 311 | 7.3% |
| Total | 4,276 | 100.0% |
Housing Finances in Salisbury
Median Income by Occupancy in Salisbury
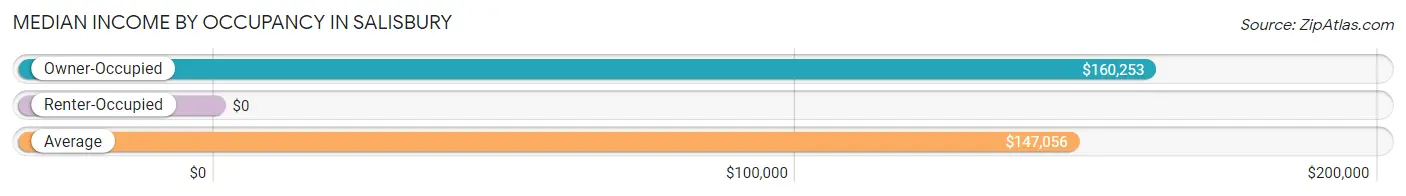
| Occupancy Type | # Households | Median Income |
| Owner-Occupied | 3,892 (91.0%) | $160,253 |
| Renter-Occupied | 384 (9.0%) | $0 |
| Average | 4,276 (100.0%) | $147,056 |
Occupancy by Householder Income Bracket in Salisbury
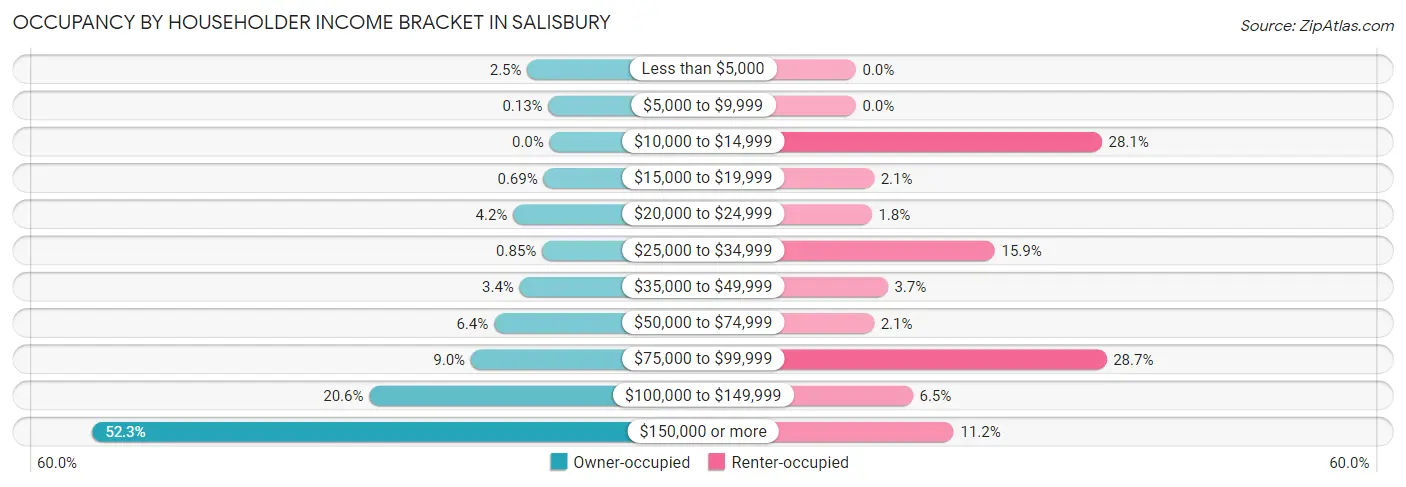
| Income Bracket | Owner-occupied | Renter-occupied |
| Less than $5,000 | 99 (2.5%) | 0 (0.0%) |
| $5,000 to $9,999 | 5 (0.1%) | 0 (0.0%) |
| $10,000 to $14,999 | 0 (0.0%) | 108 (28.1%) |
| $15,000 to $19,999 | 27 (0.7%) | 8 (2.1%) |
| $20,000 to $24,999 | 162 (4.2%) | 7 (1.8%) |
| $25,000 to $34,999 | 33 (0.9%) | 61 (15.9%) |
| $35,000 to $49,999 | 133 (3.4%) | 14 (3.6%) |
| $50,000 to $74,999 | 247 (6.4%) | 8 (2.1%) |
| $75,000 to $99,999 | 350 (9.0%) | 110 (28.6%) |
| $100,000 to $149,999 | 802 (20.6%) | 25 (6.5%) |
| $150,000 or more | 2,034 (52.3%) | 43 (11.2%) |
| Total | 3,892 (100.0%) | 384 (100.0%) |
Monthly Housing Cost Tiers in Salisbury
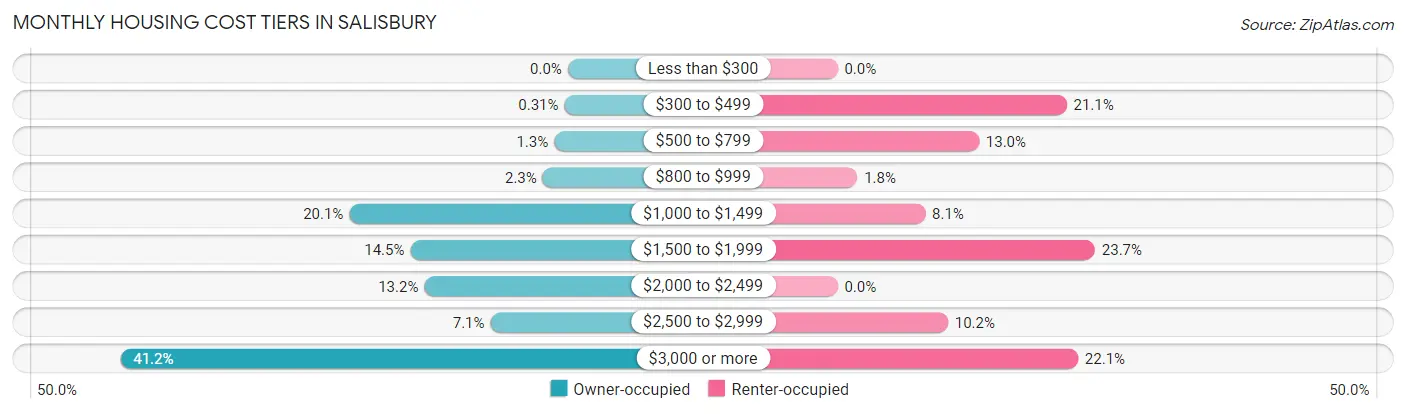
| Monthly Cost | Owner-occupied | Renter-occupied |
| Less than $300 | 0 (0.0%) | 0 (0.0%) |
| $300 to $499 | 12 (0.3%) | 81 (21.1%) |
| $500 to $799 | 49 (1.3%) | 50 (13.0%) |
| $800 to $999 | 90 (2.3%) | 7 (1.8%) |
| $1,000 to $1,499 | 783 (20.1%) | 31 (8.1%) |
| $1,500 to $1,999 | 564 (14.5%) | 91 (23.7%) |
| $2,000 to $2,499 | 514 (13.2%) | 0 (0.0%) |
| $2,500 to $2,999 | 277 (7.1%) | 39 (10.2%) |
| $3,000 or more | 1,603 (41.2%) | 85 (22.1%) |
| Total | 3,892 (100.0%) | 384 (100.0%) |
Physical Housing Characteristics in Salisbury
Housing Structures in Salisbury
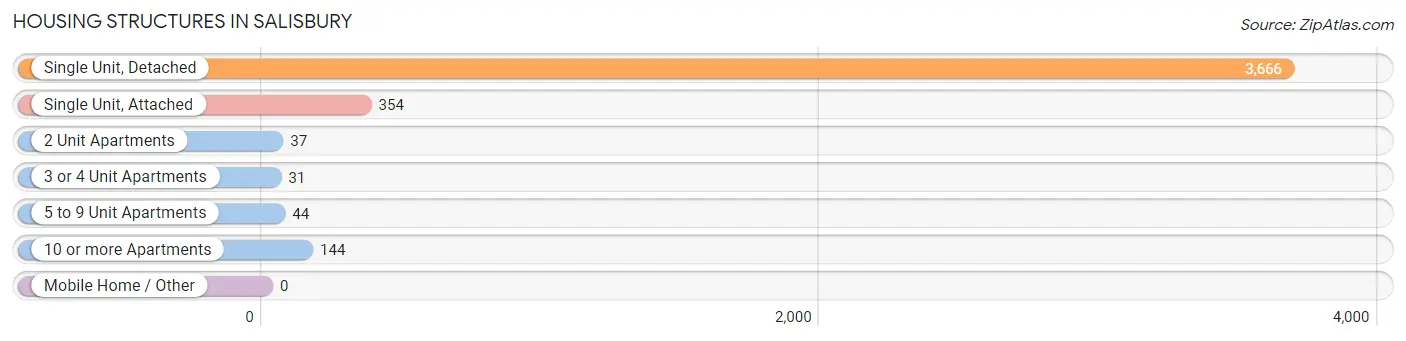
| Structure Type | # Housing Units | % Housing Units |
| Single Unit, Detached | 3,666 | 85.7% |
| Single Unit, Attached | 354 | 8.3% |
| 2 Unit Apartments | 37 | 0.9% |
| 3 or 4 Unit Apartments | 31 | 0.7% |
| 5 to 9 Unit Apartments | 44 | 1.0% |
| 10 or more Apartments | 144 | 3.4% |
| Mobile Home / Other | 0 | 0.0% |
| Total | 4,276 | 100.0% |
Housing Structures by Occupancy in Salisbury
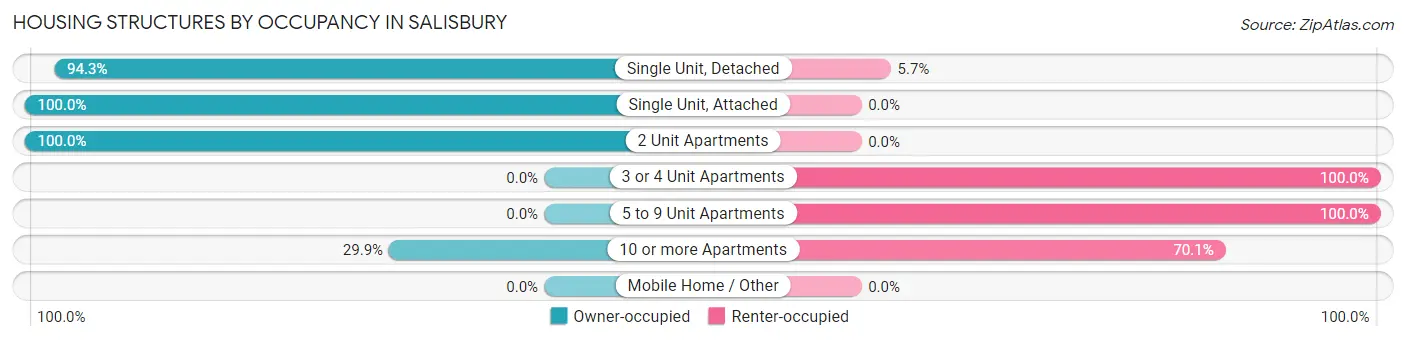
| Structure Type | Owner-occupied | Renter-occupied |
| Single Unit, Detached | 3,458 (94.3%) | 208 (5.7%) |
| Single Unit, Attached | 354 (100.0%) | 0 (0.0%) |
| 2 Unit Apartments | 37 (100.0%) | 0 (0.0%) |
| 3 or 4 Unit Apartments | 0 (0.0%) | 31 (100.0%) |
| 5 to 9 Unit Apartments | 0 (0.0%) | 44 (100.0%) |
| 10 or more Apartments | 43 (29.9%) | 101 (70.1%) |
| Mobile Home / Other | 0 (0.0%) | 0 (0.0%) |
| Total | 3,892 (91.0%) | 384 (9.0%) |
Housing Structures by Number of Rooms in Salisbury
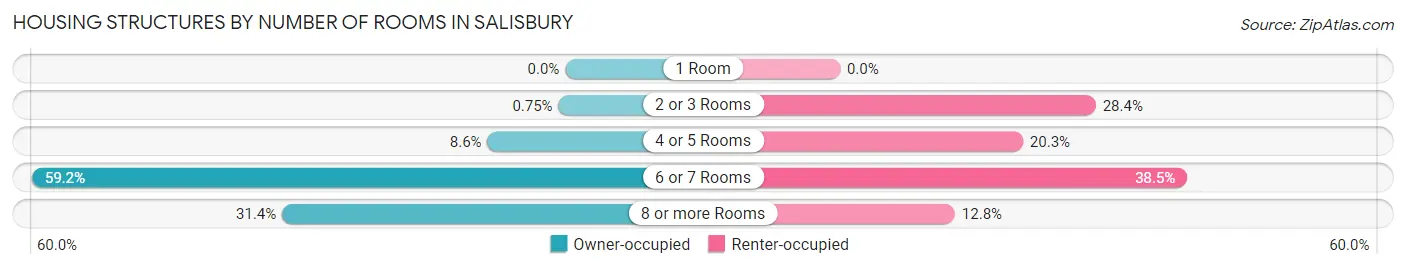
| Number of Rooms | Owner-occupied | Renter-occupied |
| 1 Room | 0 (0.0%) | 0 (0.0%) |
| 2 or 3 Rooms | 29 (0.7%) | 109 (28.4%) |
| 4 or 5 Rooms | 336 (8.6%) | 78 (20.3%) |
| 6 or 7 Rooms | 2,304 (59.2%) | 148 (38.5%) |
| 8 or more Rooms | 1,223 (31.4%) | 49 (12.8%) |
| Total | 3,892 (100.0%) | 384 (100.0%) |
Housing Structure by Heating Type in Salisbury
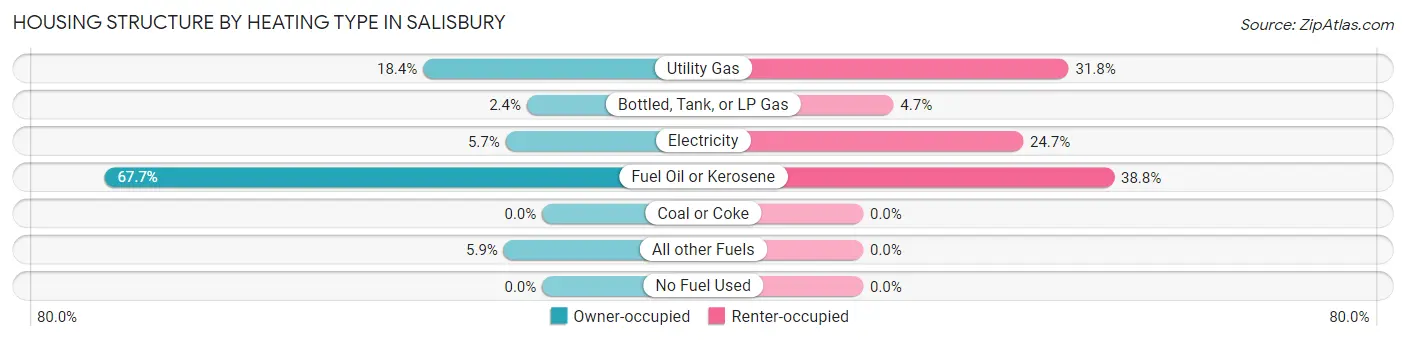
| Heating Type | Owner-occupied | Renter-occupied |
| Utility Gas | 716 (18.4%) | 122 (31.8%) |
| Bottled, Tank, or LP Gas | 92 (2.4%) | 18 (4.7%) |
| Electricity | 220 (5.7%) | 95 (24.7%) |
| Fuel Oil or Kerosene | 2,633 (67.6%) | 149 (38.8%) |
| Coal or Coke | 0 (0.0%) | 0 (0.0%) |
| All other Fuels | 231 (5.9%) | 0 (0.0%) |
| No Fuel Used | 0 (0.0%) | 0 (0.0%) |
| Total | 3,892 (100.0%) | 384 (100.0%) |
Household Vehicle Usage in Salisbury
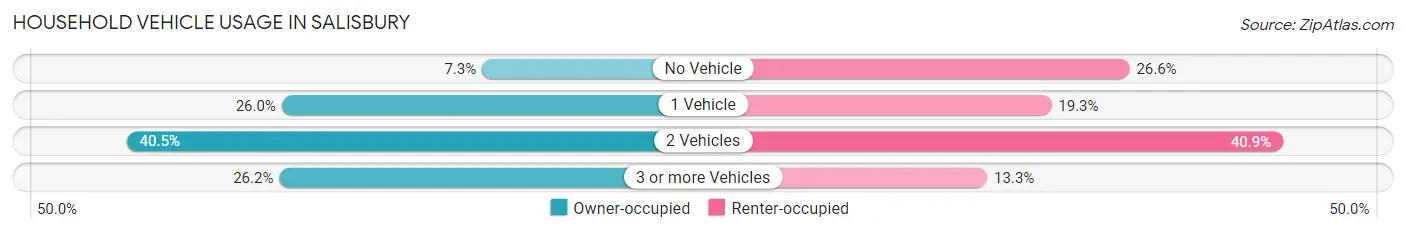
| Vehicles per Household | Owner-occupied | Renter-occupied |
| No Vehicle | 284 (7.3%) | 102 (26.6%) |
| 1 Vehicle | 1,012 (26.0%) | 74 (19.3%) |
| 2 Vehicles | 1,575 (40.5%) | 157 (40.9%) |
| 3 or more Vehicles | 1,021 (26.2%) | 51 (13.3%) |
| Total | 3,892 (100.0%) | 384 (100.0%) |
Real Estate & Mortgages in Salisbury
Real Estate and Mortgage Overview in Salisbury
| Characteristic | Without Mortgage | With Mortgage |
| Housing Units | 1,686 | 2,206 |
| Median Property Value | $612,900 | $627,400 |
| Median Household Income | $135,055 | $1,405 |
| Monthly Housing Costs | $1,489 | $1,586 |
| Real Estate Taxes | $10,001 | $20 |
Property Value by Mortgage Status in Salisbury
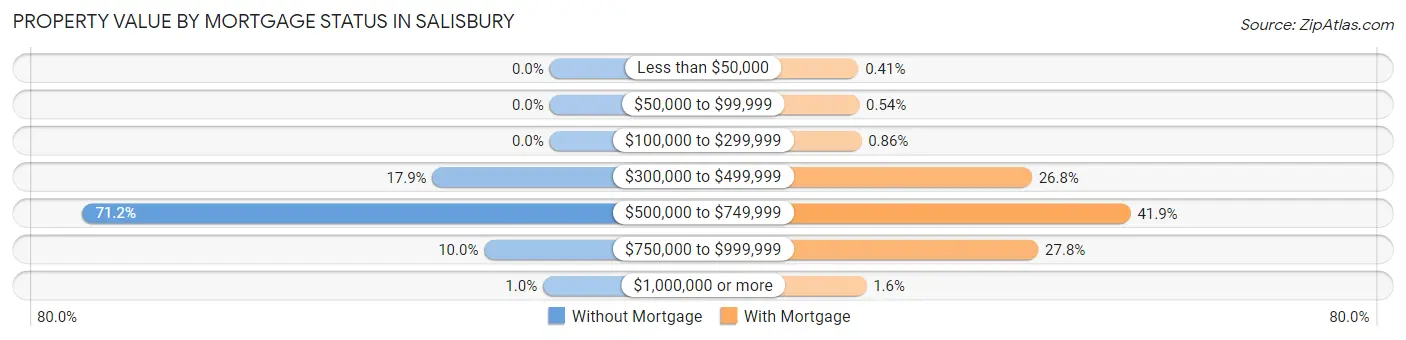
| Property Value | Without Mortgage | With Mortgage |
| Less than $50,000 | 0 (0.0%) | 9 (0.4%) |
| $50,000 to $99,999 | 0 (0.0%) | 12 (0.5%) |
| $100,000 to $299,999 | 0 (0.0%) | 19 (0.9%) |
| $300,000 to $499,999 | 301 (17.8%) | 592 (26.8%) |
| $500,000 to $749,999 | 1,200 (71.2%) | 924 (41.9%) |
| $750,000 to $999,999 | 168 (10.0%) | 614 (27.8%) |
| $1,000,000 or more | 17 (1.0%) | 36 (1.6%) |
| Total | 1,686 (100.0%) | 2,206 (100.0%) |
Household Income by Mortgage Status in Salisbury
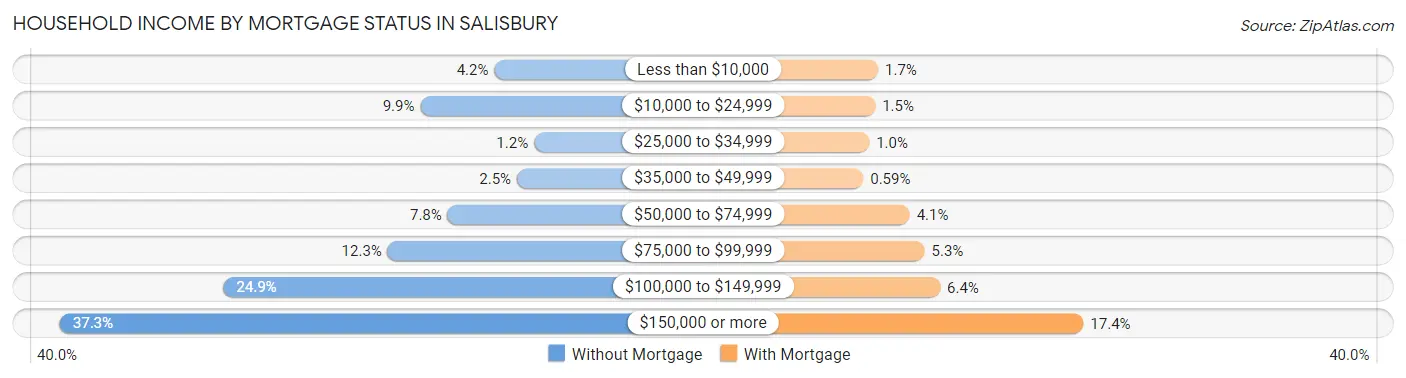
| Household Income | Without Mortgage | With Mortgage |
| Less than $10,000 | 71 (4.2%) | 38 (1.7%) |
| $10,000 to $24,999 | 166 (9.9%) | 33 (1.5%) |
| $25,000 to $34,999 | 20 (1.2%) | 23 (1.0%) |
| $35,000 to $49,999 | 42 (2.5%) | 13 (0.6%) |
| $50,000 to $74,999 | 131 (7.8%) | 91 (4.1%) |
| $75,000 to $99,999 | 208 (12.3%) | 116 (5.3%) |
| $100,000 to $149,999 | 419 (24.8%) | 142 (6.4%) |
| $150,000 or more | 629 (37.3%) | 383 (17.4%) |
| Total | 1,686 (100.0%) | 2,206 (100.0%) |
Property Value to Household Income Ratio in Salisbury
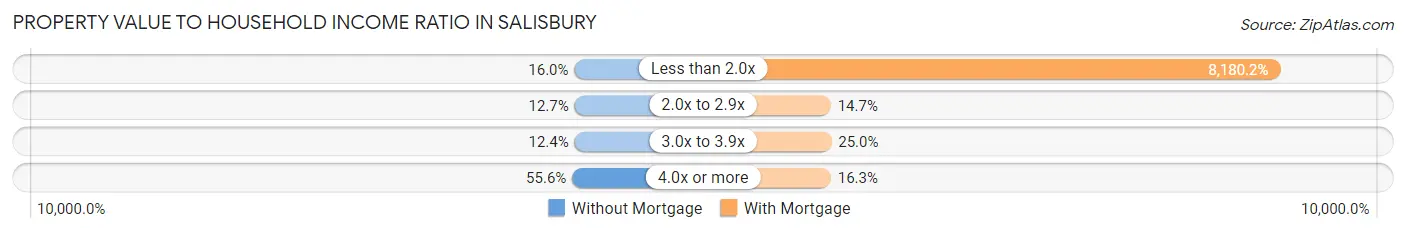
| Value-to-Income Ratio | Without Mortgage | With Mortgage |
| Less than 2.0x | 269 (16.0%) | 180,455 (8,180.2%) |
| 2.0x to 2.9x | 214 (12.7%) | 324 (14.7%) |
| 3.0x to 3.9x | 209 (12.4%) | 551 (25.0%) |
| 4.0x or more | 937 (55.6%) | 360 (16.3%) |
| Total | 1,686 (100.0%) | 2,206 (100.0%) |
Real Estate Taxes by Mortgage Status in Salisbury
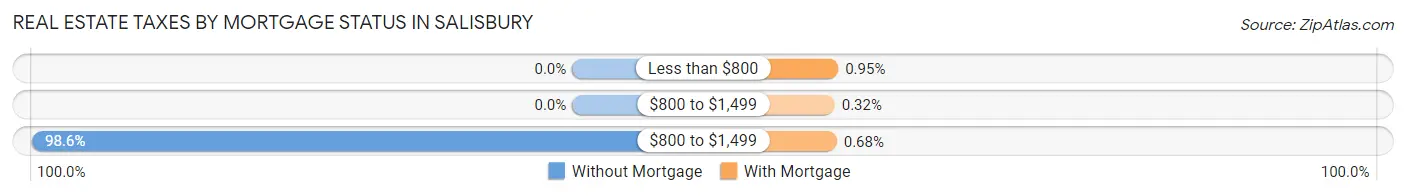
| Property Taxes | Without Mortgage | With Mortgage |
| Less than $800 | 0 (0.0%) | 21 (0.9%) |
| $800 to $1,499 | 0 (0.0%) | 7 (0.3%) |
| $800 to $1,499 | 1,663 (98.6%) | 15 (0.7%) |
| Total | 1,686 (100.0%) | 2,206 (100.0%) |
Health & Disability in Salisbury
Health Insurance Coverage by Age in Salisbury
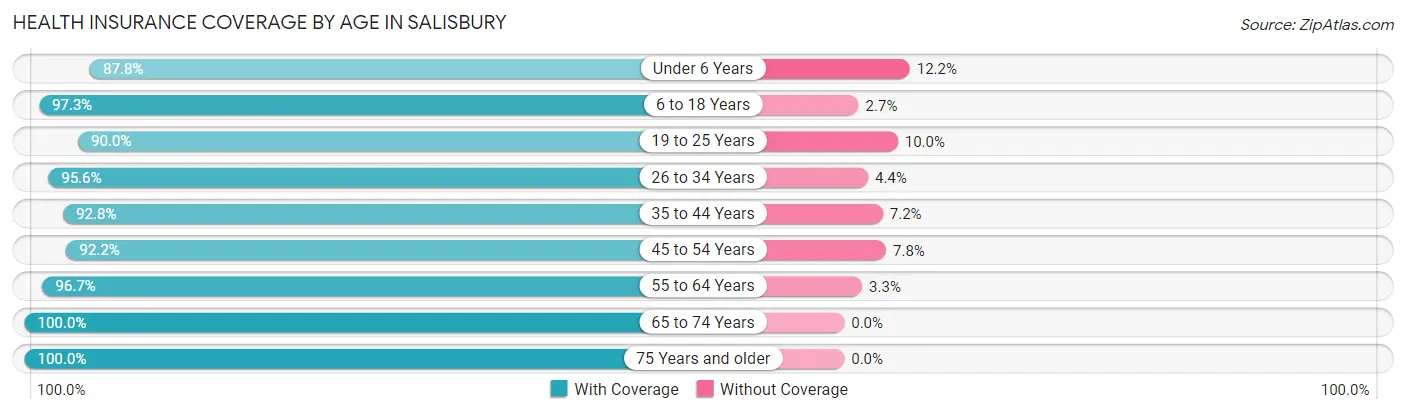
| Age Bracket | With Coverage | Without Coverage |
| Under 6 Years | 654 (87.8%) | 91 (12.2%) |
| 6 to 18 Years | 1,851 (97.3%) | 51 (2.7%) |
| 19 to 25 Years | 1,057 (90.0%) | 117 (10.0%) |
| 26 to 34 Years | 993 (95.6%) | 46 (4.4%) |
| 35 to 44 Years | 1,627 (92.8%) | 126 (7.2%) |
| 45 to 54 Years | 1,785 (92.2%) | 151 (7.8%) |
| 55 to 64 Years | 1,827 (96.7%) | 63 (3.3%) |
| 65 to 74 Years | 1,390 (100.0%) | 0 (0.0%) |
| 75 Years and older | 987 (100.0%) | 0 (0.0%) |
| Total | 12,171 (95.0%) | 645 (5.0%) |
Health Insurance Coverage by Citizenship Status in Salisbury
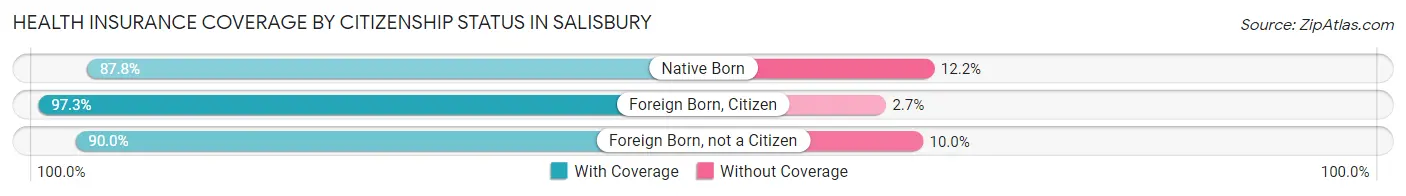
| Citizenship Status | With Coverage | Without Coverage |
| Native Born | 654 (87.8%) | 91 (12.2%) |
| Foreign Born, Citizen | 1,851 (97.3%) | 51 (2.7%) |
| Foreign Born, not a Citizen | 1,057 (90.0%) | 117 (10.0%) |
Health Insurance Coverage by Household Income in Salisbury
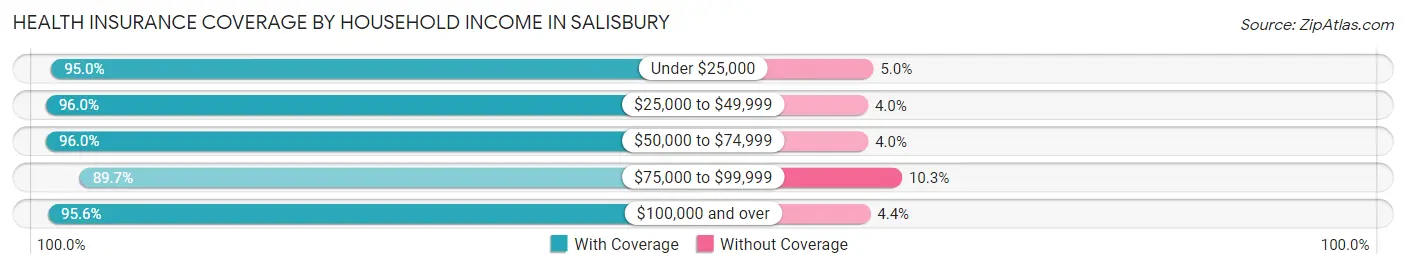
| Household Income | With Coverage | Without Coverage |
| Under $25,000 | 570 (95.0%) | 30 (5.0%) |
| $25,000 to $49,999 | 485 (96.0%) | 20 (4.0%) |
| $50,000 to $74,999 | 406 (96.0%) | 17 (4.0%) |
| $75,000 to $99,999 | 1,231 (89.7%) | 142 (10.3%) |
| $100,000 and over | 9,439 (95.6%) | 436 (4.4%) |
Public vs Private Health Insurance Coverage by Age in Salisbury
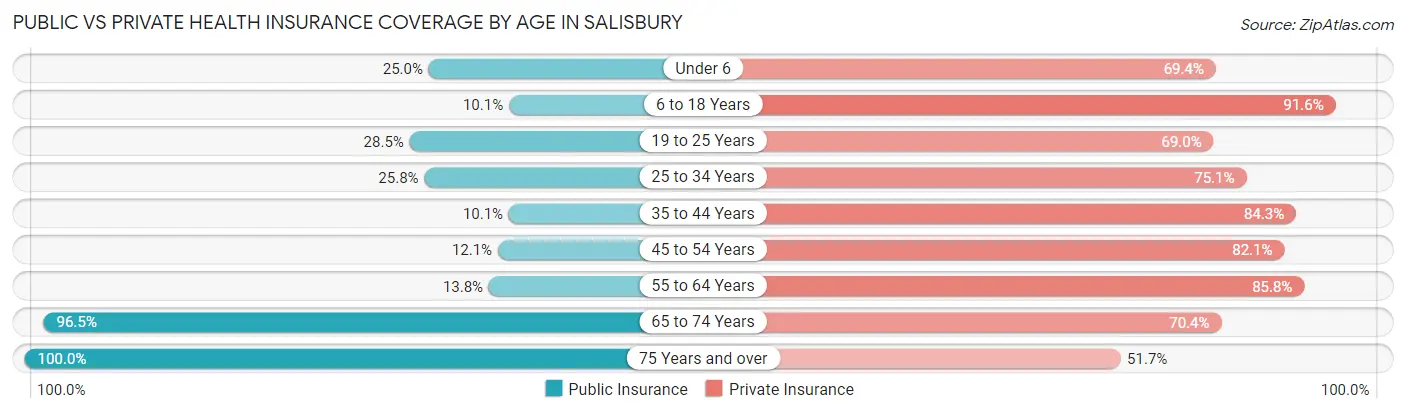
| Age Bracket | Public Insurance | Private Insurance |
| Under 6 | 186 (25.0%) | 517 (69.4%) |
| 6 to 18 Years | 192 (10.1%) | 1,743 (91.6%) |
| 19 to 25 Years | 335 (28.5%) | 810 (69.0%) |
| 25 to 34 Years | 268 (25.8%) | 780 (75.1%) |
| 35 to 44 Years | 177 (10.1%) | 1,478 (84.3%) |
| 45 to 54 Years | 235 (12.1%) | 1,590 (82.1%) |
| 55 to 64 Years | 261 (13.8%) | 1,622 (85.8%) |
| 65 to 74 Years | 1,341 (96.5%) | 979 (70.4%) |
| 75 Years and over | 987 (100.0%) | 510 (51.7%) |
| Total | 3,982 (31.1%) | 10,029 (78.2%) |
Disability Status by Sex by Age in Salisbury
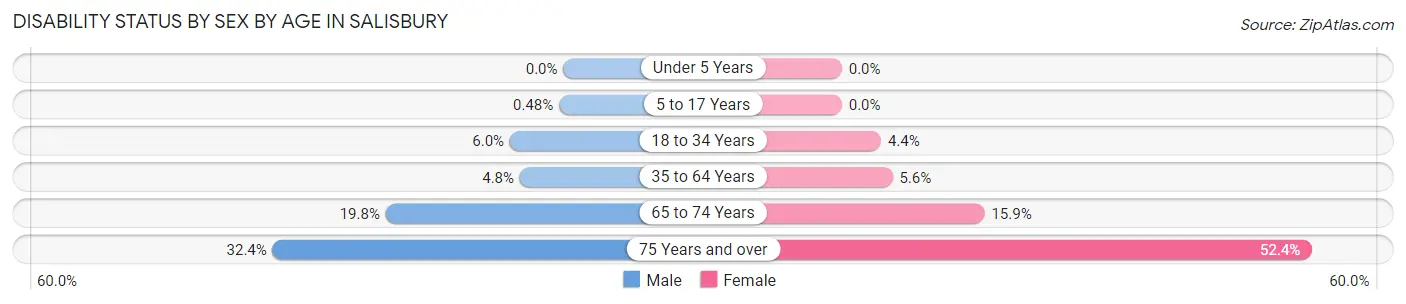
| Age Bracket | Male | Female |
| Under 5 Years | 0 (0.0%) | 0 (0.0%) |
| 5 to 17 Years | 4 (0.5%) | 0 (0.0%) |
| 18 to 34 Years | 78 (5.9%) | 46 (4.4%) |
| 35 to 64 Years | 136 (4.8%) | 156 (5.6%) |
| 65 to 74 Years | 143 (19.8%) | 106 (15.9%) |
| 75 Years and over | 102 (32.4%) | 352 (52.4%) |
Disability Class by Sex by Age in Salisbury
Disability Class: Hearing Difficulty
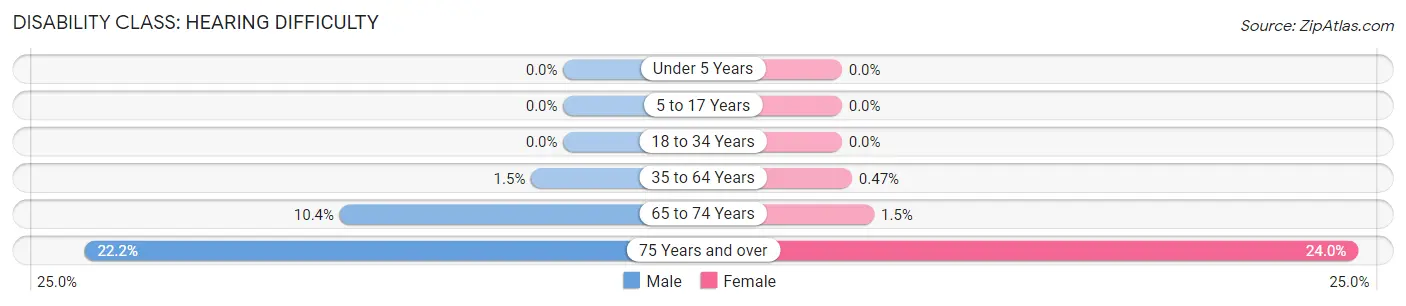
| Age Bracket | Male | Female |
| Under 5 Years | 0 (0.0%) | 0 (0.0%) |
| 5 to 17 Years | 0 (0.0%) | 0 (0.0%) |
| 18 to 34 Years | 0 (0.0%) | 0 (0.0%) |
| 35 to 64 Years | 42 (1.5%) | 13 (0.5%) |
| 65 to 74 Years | 75 (10.4%) | 10 (1.5%) |
| 75 Years and over | 70 (22.2%) | 161 (24.0%) |
Disability Class: Vision Difficulty
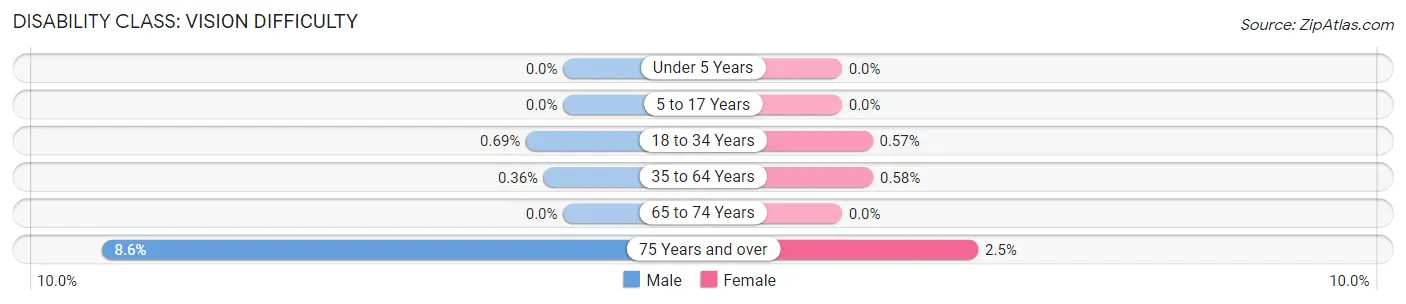
| Age Bracket | Male | Female |
| Under 5 Years | 0 (0.0%) | 0 (0.0%) |
| 5 to 17 Years | 0 (0.0%) | 0 (0.0%) |
| 18 to 34 Years | 9 (0.7%) | 6 (0.6%) |
| 35 to 64 Years | 10 (0.4%) | 16 (0.6%) |
| 65 to 74 Years | 0 (0.0%) | 0 (0.0%) |
| 75 Years and over | 27 (8.6%) | 17 (2.5%) |
Disability Class: Cognitive Difficulty
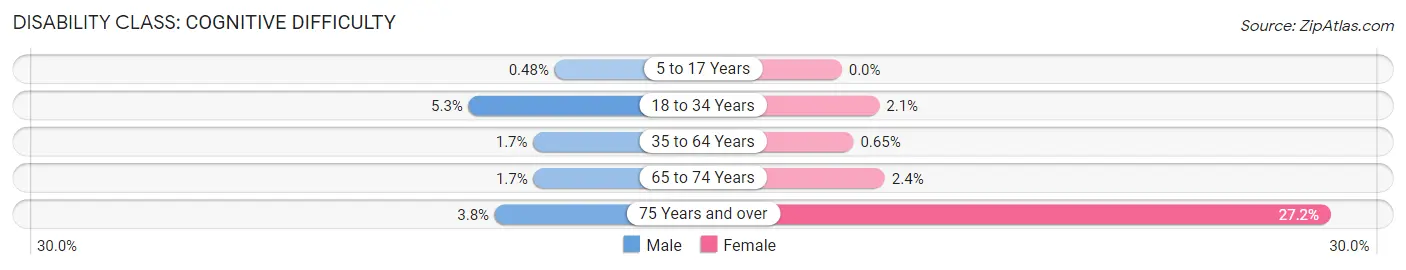
| Age Bracket | Male | Female |
| 5 to 17 Years | 4 (0.5%) | 0 (0.0%) |
| 18 to 34 Years | 69 (5.3%) | 22 (2.1%) |
| 35 to 64 Years | 47 (1.7%) | 18 (0.6%) |
| 65 to 74 Years | 12 (1.7%) | 16 (2.4%) |
| 75 Years and over | 12 (3.8%) | 183 (27.2%) |
Disability Class: Ambulatory Difficulty
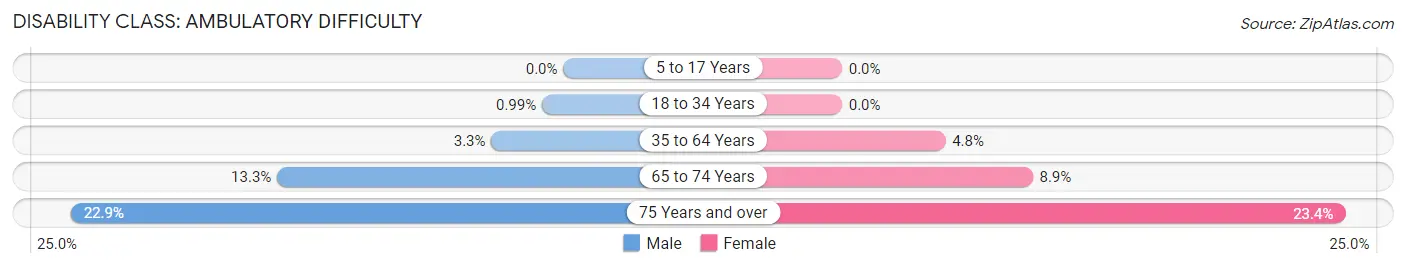
| Age Bracket | Male | Female |
| 5 to 17 Years | 0 (0.0%) | 0 (0.0%) |
| 18 to 34 Years | 13 (1.0%) | 0 (0.0%) |
| 35 to 64 Years | 94 (3.3%) | 133 (4.8%) |
| 65 to 74 Years | 96 (13.3%) | 59 (8.8%) |
| 75 Years and over | 72 (22.9%) | 157 (23.4%) |
Disability Class: Self-Care Difficulty
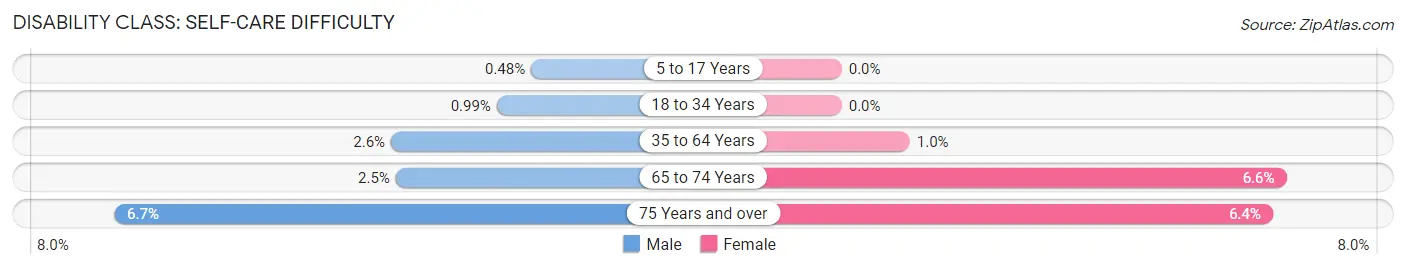
| Age Bracket | Male | Female |
| 5 to 17 Years | 4 (0.5%) | 0 (0.0%) |
| 18 to 34 Years | 13 (1.0%) | 0 (0.0%) |
| 35 to 64 Years | 72 (2.6%) | 28 (1.0%) |
| 65 to 74 Years | 18 (2.5%) | 44 (6.6%) |
| 75 Years and over | 21 (6.7%) | 43 (6.4%) |
Technology Access in Salisbury
Computing Device Access in Salisbury
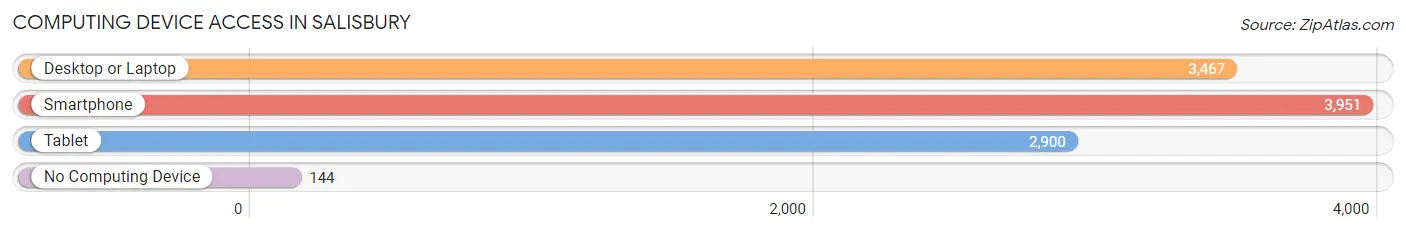
| Device Type | # Households | % Households |
| Desktop or Laptop | 3,467 | 81.1% |
| Smartphone | 3,951 | 92.4% |
| Tablet | 2,900 | 67.8% |
| No Computing Device | 144 | 3.4% |
| Total | 4,276 | 100.0% |
Internet Access in Salisbury
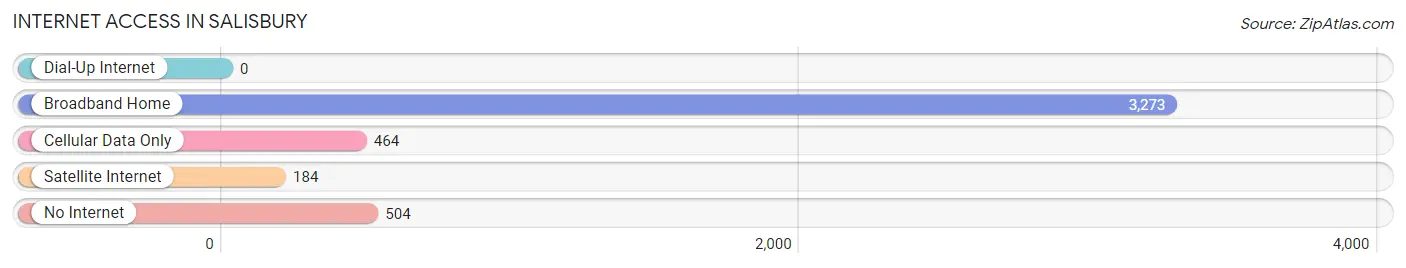
| Internet Type | # Households | % Households |
| Dial-Up Internet | 0 | 0.0% |
| Broadband Home | 3,273 | 76.5% |
| Cellular Data Only | 464 | 10.8% |
| Satellite Internet | 184 | 4.3% |
| No Internet | 504 | 11.8% |
| Total | 4,276 | 100.0% |
Salisbury Summary
Salisbury is a town located in Litchfield County, Connecticut, United States. The population was 3,977 at the 2010 census. Salisbury is the highest town in Connecticut, with an elevation of 2,370 feet (722 m) above sea level at the summit of Bear Mountain.
History
The area that is now Salisbury was originally inhabited by the Mahican Native American tribe. The first European settlers arrived in the area in 1741, and the town was officially incorporated in 1741. The town was named after Salisbury, England, and was originally part of the town of Sharon.
Geography
Salisbury is located in the northwest corner of Connecticut, bordered by Massachusetts to the north and New York to the west. The town is located in the Taconic Mountains, and is the highest town in Connecticut, with an elevation of 2,370 feet (722 m) above sea level at the summit of Bear Mountain. The town is home to several lakes, including Twin Lakes, Lake Washinee, and Lake Wononscopomuc.
Economy
The economy of Salisbury is largely based on tourism and recreation. The town is home to several ski resorts, including Ski Butternut, Catamount Ski Area, and Ski Sundown. The town is also home to several summer camps, including Camp Sloane YMCA, Camp Jewell YMCA, and Camp Washington.
Demographics
As of the 2010 census, there were 3,977 people, 1,717 households, and 1,093 families residing in the town. The population density was 57.3 people per square mile (22.1/km2). There were 1,945 housing units at an average density of 28.3 per square mile (10.9/km2). The racial makeup of the town was 97.2% White, 0.7% African American, 0.2% Native American, 0.5% Asian, 0.1% Pacific Islander, 0.4% from other races, and 0.9% from two or more races. Hispanic or Latino of any race were 1.7% of the population.
There were 1,717 households, out of which 25.3% had children under the age of 18 living with them, 51.2% were married couples living together, 8.7% had a female householder with no husband present, and 36.2% were non-families. 30.2% of all households were made up of individuals, and 11.2% had someone living alone who was 65 years of age or older. The average household size was 2.30 and the average family size was 2.86.
In the town, the population was spread out, with 21.7% under the age of 18, 5.2% from 18 to 24, 25.2% from 25 to 44, 32.2% from 45 to 64, and 15.7% who were 65 years of age or older. The median age was 43 years. For every 100 females, there were 97.2 males. For every 100 females age 18 and over, there were 94.2 males.
The median income for a household in the town was $60,938, and the median income for a family was $76,944. Males had a median income of $50,000 versus $37,500 for females. The per capita income for the town was $35,945. About 4.2% of families and 6.3% of the population were below the poverty line, including 8.2% of those under age 18 and 4.2% of those age 65 or over.
Common Questions
What is Per Capita Income in Salisbury?
Per Capita income in Salisbury is $56,476.
What is the Median Family Income in Salisbury?
Median Family Income in Salisbury is $161,643.
What is the Median Household income in Salisbury?
Median Household Income in Salisbury is $147,056.
What is Income or Wage Gap in Salisbury?
Income or Wage Gap in Salisbury is 24.5%.
Women in Salisbury earn 75.5 cents for every dollar earned by a man.
What is Inequality or Gini Index in Salisbury?
Inequality or Gini Index in Salisbury is 0.38.
What is the Total Population of Salisbury?
Total Population of Salisbury is 12,861.
What is the Total Male Population of Salisbury?
Total Male Population of Salisbury is 6,381.
What is the Total Female Population of Salisbury?
Total Female Population of Salisbury is 6,480.
What is the Ratio of Males per 100 Females in Salisbury?
There are 98.47 Males per 100 Females in Salisbury.
What is the Ratio of Females per 100 Males in Salisbury?
There are 101.55 Females per 100 Males in Salisbury.
What is the Median Population Age in Salisbury?
Median Population Age in Salisbury is 43.6 Years.
What is the Average Family Size in Salisbury
Average Family Size in Salisbury is 3.4 People.
What is the Average Household Size in Salisbury
Average Household Size in Salisbury is 3.0 People.
How Large is the Labor Force in Salisbury?
There are 6,644 People in the Labor Forcein in Salisbury.
What is the Percentage of People in the Labor Force in Salisbury?
62.7% of People are in the Labor Force in Salisbury.
What is the Unemployment Rate in Salisbury?
Unemployment Rate in Salisbury is 3.1%.