Horseheads North, NY Map & Demographics
Horseheads North Map
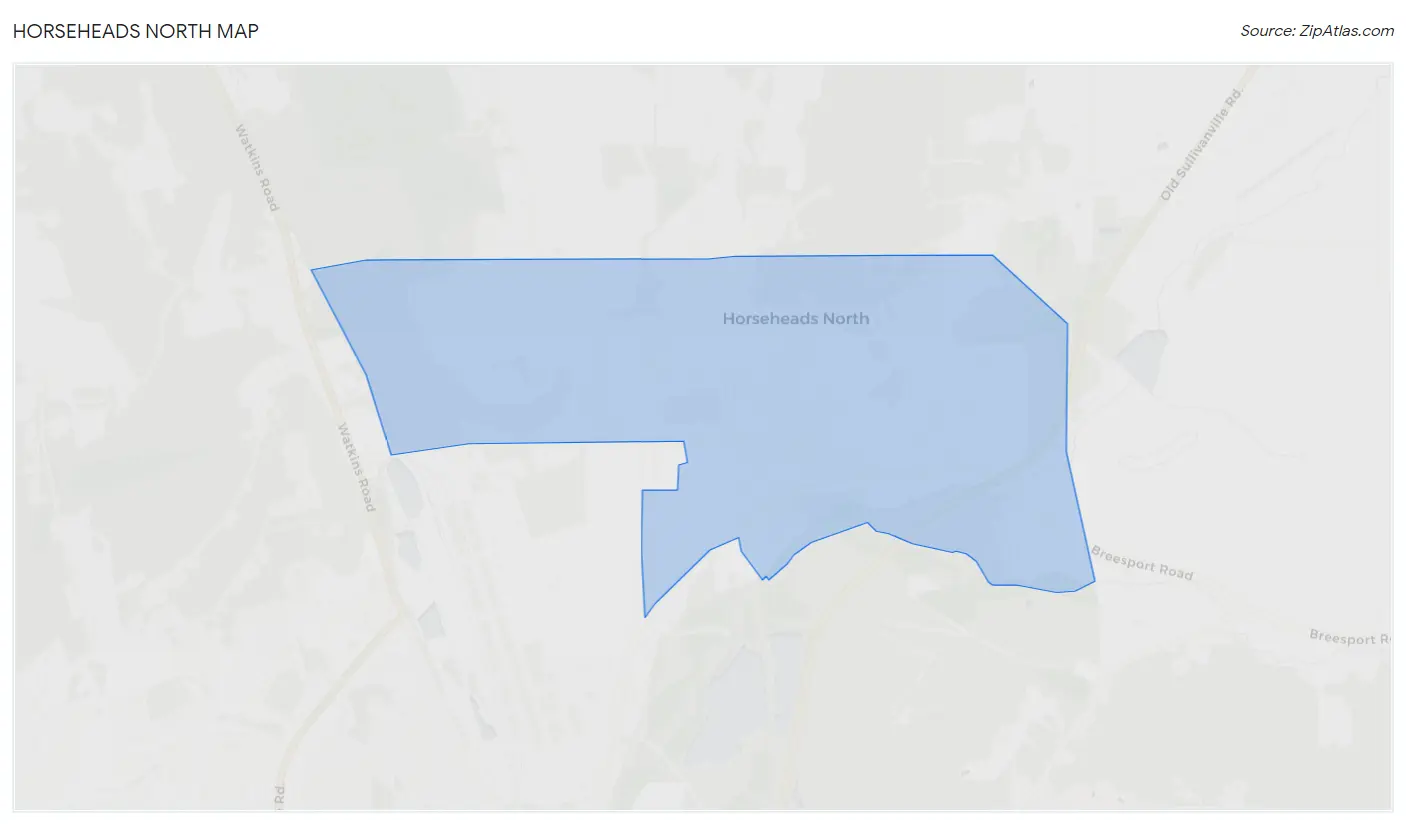
Horseheads North Overview
$34,178
PER CAPITA INCOME
$81,012
AVG FAMILY INCOME
$79,656
AVG HOUSEHOLD INCOME
1.7%
WAGE / INCOME GAP [ % ]
98.3¢/ $1
WAGE / INCOME GAP [ $ ]
0.30
INEQUALITY / GINI INDEX
2,707
TOTAL POPULATION
1,290
MALE POPULATION
1,417
FEMALE POPULATION
91.04
MALES / 100 FEMALES
109.84
FEMALES / 100 MALES
39.2
MEDIAN AGE
3.0
AVG FAMILY SIZE
2.6
AVG HOUSEHOLD SIZE
1,233
LABOR FORCE [ PEOPLE ]
60.5%
PERCENT IN LABOR FORCE
0.8%
UNEMPLOYMENT RATE
Income in Horseheads North
Income Overview in Horseheads North
Per Capita Income in Horseheads North is $34,178, while median incomes of families and households are $81,012 and $79,656 respectively.
| Characteristic | Number | Measure |
| Per Capita Income | 2,707 | $34,178 |
| Median Family Income | 802 | $81,012 |
| Mean Family Income | 802 | $95,280 |
| Median Household Income | 1,029 | $79,656 |
| Mean Household Income | 1,029 | $89,485 |
| Income Deficit | 802 | $0 |
| Wage / Income Gap (%) | 2,707 | 1.75% |
| Wage / Income Gap ($) | 2,707 | 98.25¢ per $1 |
| Gini / Inequality Index | 2,707 | 0.30 |
Earnings by Sex in Horseheads North
Average Earnings in Horseheads North are $46,883, $46,582 for men and $47,411 for women, a difference of 1.8%.
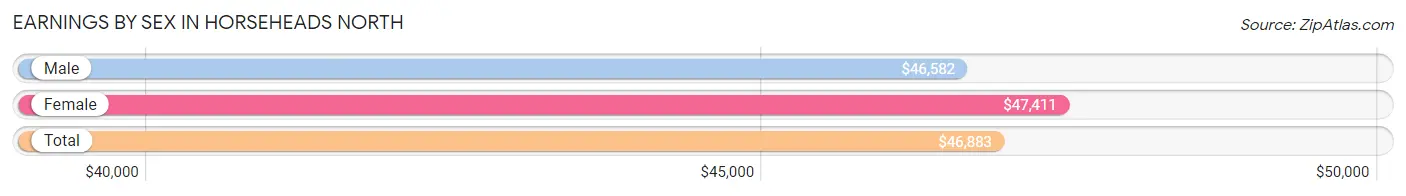
| Sex | Number | Average Earnings |
| Male | 628 (47.4%) | $46,582 |
| Female | 698 (52.6%) | $47,411 |
| Total | 1,326 (100.0%) | $46,883 |
Earnings by Sex by Income Bracket in Horseheads North
The most common earnings brackets in Horseheads North are $75,000 to $99,999 for men (130 | 20.7%) and $75,000 to $99,999 for women (104 | 14.9%).
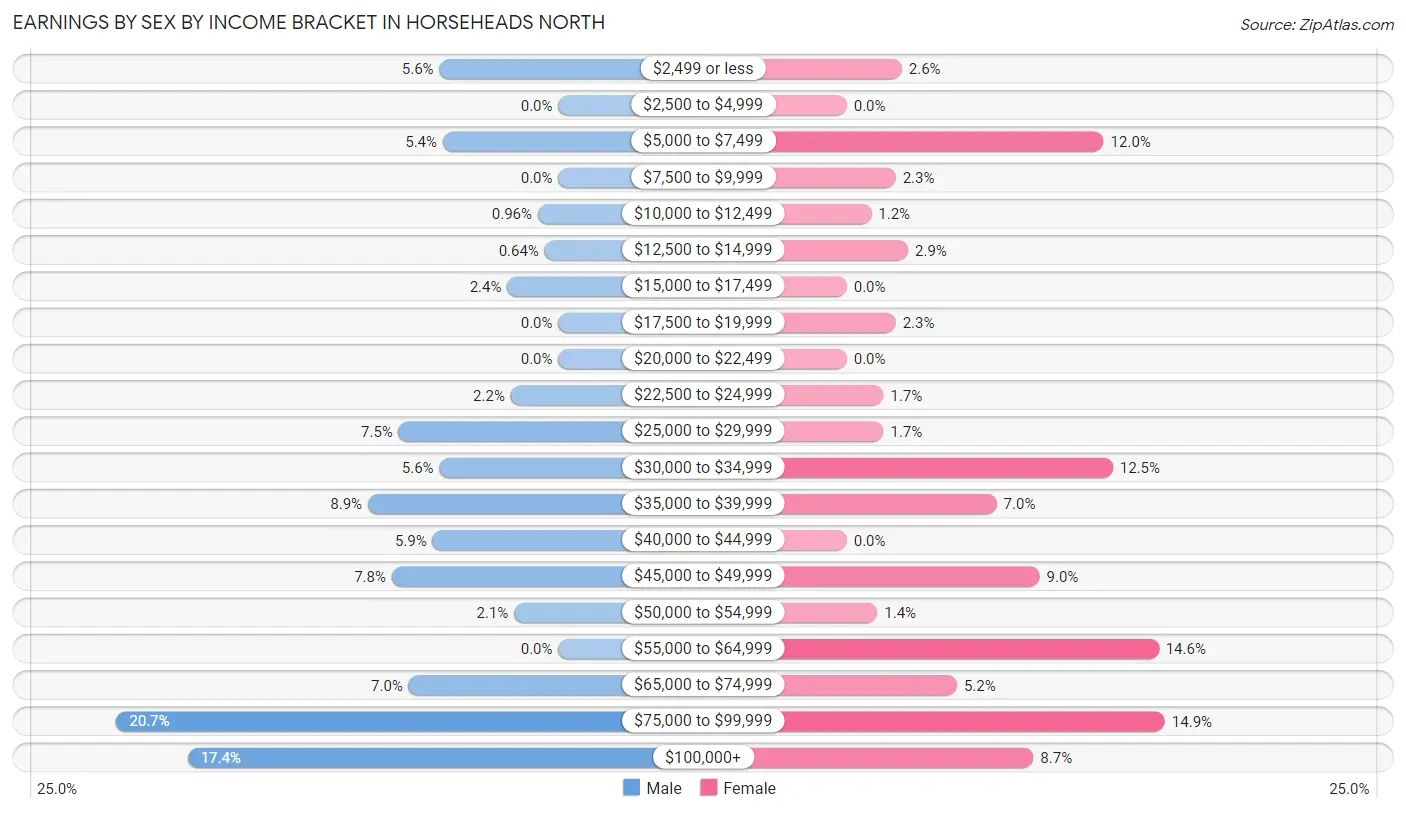
| Income | Male | Female |
| $2,499 or less | 35 (5.6%) | 18 (2.6%) |
| $2,500 to $4,999 | 0 (0.0%) | 0 (0.0%) |
| $5,000 to $7,499 | 34 (5.4%) | 84 (12.0%) |
| $7,500 to $9,999 | 0 (0.0%) | 16 (2.3%) |
| $10,000 to $12,499 | 6 (1.0%) | 8 (1.1%) |
| $12,500 to $14,999 | 4 (0.6%) | 20 (2.9%) |
| $15,000 to $17,499 | 15 (2.4%) | 0 (0.0%) |
| $17,500 to $19,999 | 0 (0.0%) | 16 (2.3%) |
| $20,000 to $22,499 | 0 (0.0%) | 0 (0.0%) |
| $22,500 to $24,999 | 14 (2.2%) | 12 (1.7%) |
| $25,000 to $29,999 | 47 (7.5%) | 12 (1.7%) |
| $30,000 to $34,999 | 35 (5.6%) | 87 (12.5%) |
| $35,000 to $39,999 | 56 (8.9%) | 49 (7.0%) |
| $40,000 to $44,999 | 37 (5.9%) | 0 (0.0%) |
| $45,000 to $49,999 | 49 (7.8%) | 63 (9.0%) |
| $50,000 to $54,999 | 13 (2.1%) | 10 (1.4%) |
| $55,000 to $64,999 | 0 (0.0%) | 102 (14.6%) |
| $65,000 to $74,999 | 44 (7.0%) | 36 (5.2%) |
| $75,000 to $99,999 | 130 (20.7%) | 104 (14.9%) |
| $100,000+ | 109 (17.4%) | 61 (8.7%) |
| Total | 628 (100.0%) | 698 (100.0%) |
Earnings by Sex by Educational Attainment in Horseheads North
Average earnings in Horseheads North are $50,769 for men and $48,643 for women, a difference of 4.2%. Men with an educational attainment of graduate degree enjoy the highest average annual earnings of $92,417, while those with high school diploma education earn the least with $40,417. Women with an educational attainment of graduate degree earn the most with the average annual earnings of $76,528, while those with high school diploma education have the smallest earnings of $33,125.
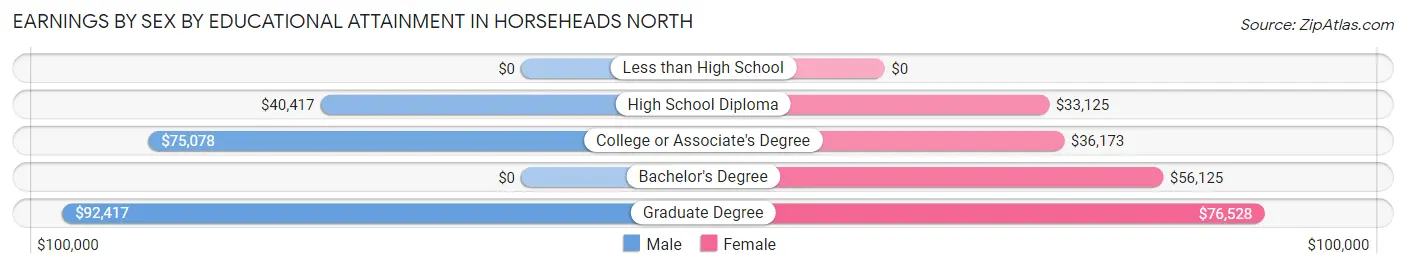
| Educational Attainment | Male Income | Female Income |
| Less than High School | - | - |
| High School Diploma | $40,417 | $33,125 |
| College or Associate's Degree | $75,078 | $36,173 |
| Bachelor's Degree | - | - |
| Graduate Degree | $92,417 | $76,528 |
| Total | $50,769 | $48,643 |
Family Income in Horseheads North
Family Income Brackets in Horseheads North
According to the Horseheads North family income data, there are 205 families falling into the $100,000 to $149,999 income range, which is the most common income bracket and makes up 25.6% of all families.
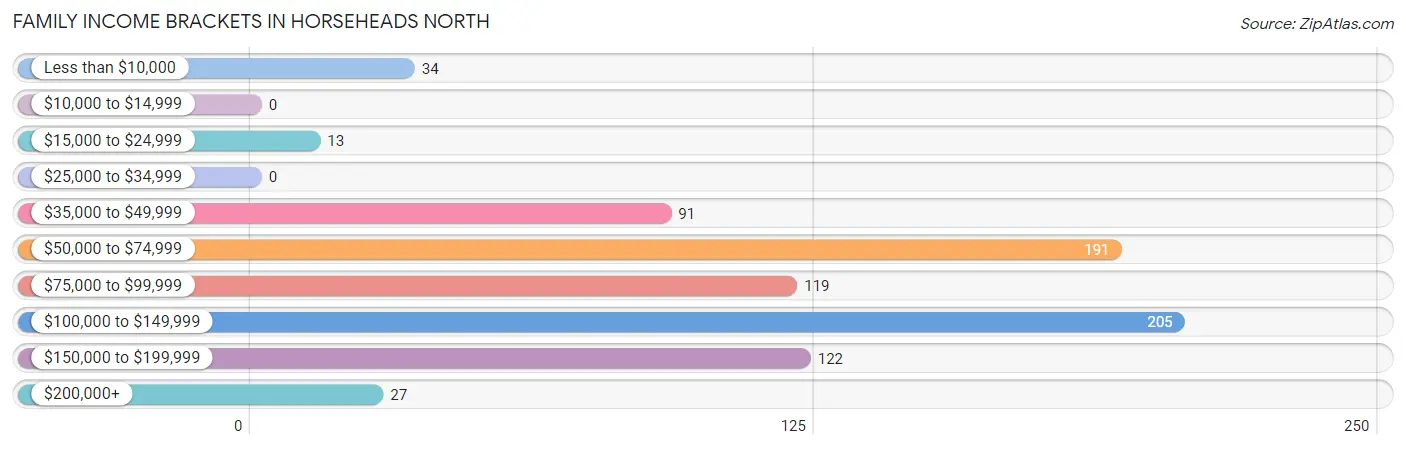
| Income Bracket | # Families | % Families |
| Less than $10,000 | 34 | 4.2% |
| $10,000 to $14,999 | 0 | 0.0% |
| $15,000 to $24,999 | 13 | 1.6% |
| $25,000 to $34,999 | 0 | 0.0% |
| $35,000 to $49,999 | 91 | 11.3% |
| $50,000 to $74,999 | 191 | 23.8% |
| $75,000 to $99,999 | 119 | 14.8% |
| $100,000 to $149,999 | 205 | 25.6% |
| $150,000 to $199,999 | 122 | 15.2% |
| $200,000+ | 27 | 3.4% |
Family Income by Famaliy Size in Horseheads North
4-person families (138 | 17.2%) account for the highest median family income in Horseheads North with $116,364 per family, while 2-person families (416 | 51.9%) have the highest median income of $37,240 per family member.
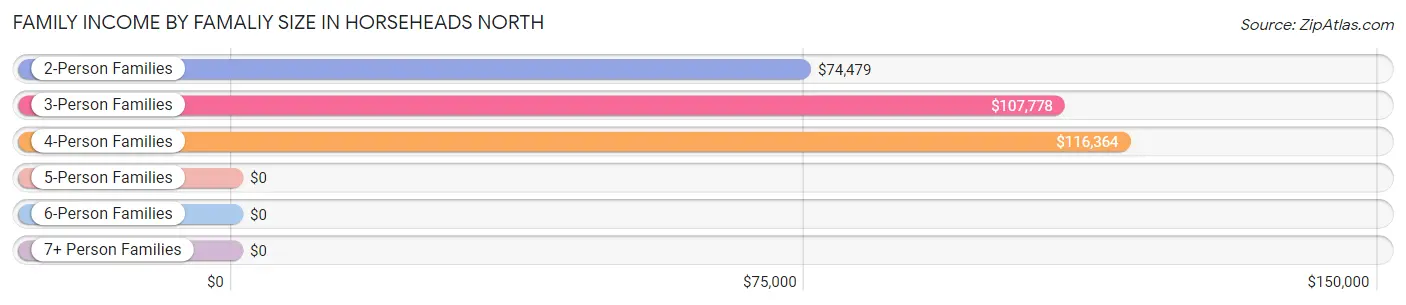
| Income Bracket | # Families | Median Income |
| 2-Person Families | 416 (51.9%) | $74,479 |
| 3-Person Families | 154 (19.2%) | $107,778 |
| 4-Person Families | 138 (17.2%) | $116,364 |
| 5-Person Families | 84 (10.5%) | $0 |
| 6-Person Families | 10 (1.3%) | $0 |
| 7+ Person Families | 0 (0.0%) | $0 |
| Total | 802 (100.0%) | $81,012 |
Family Income by Number of Earners in Horseheads North
The median family income in Horseheads North is $81,012, with families comprising 3+ earners (69) having the highest median family income of $172,552, while families with no earners (147) have the lowest median family income of $60,813, accounting for 8.6% and 18.3% of families, respectively.
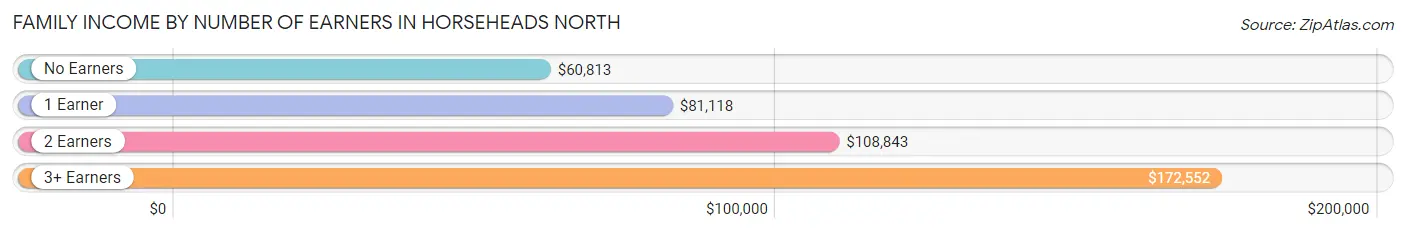
| Number of Earners | # Families | Median Income |
| No Earners | 147 (18.3%) | $60,813 |
| 1 Earner | 255 (31.8%) | $81,118 |
| 2 Earners | 331 (41.3%) | $108,843 |
| 3+ Earners | 69 (8.6%) | $172,552 |
| Total | 802 (100.0%) | $81,012 |
Household Income in Horseheads North
Household Income Brackets in Horseheads North
With 287 households falling in the category, the $100,000 to $149,999 income range is the most frequent in Horseheads North, accounting for 27.9% of all households. In contrast, only 10 households (1.0%) fall into the $25,000 to $34,999 income bracket, making it the least populous group.
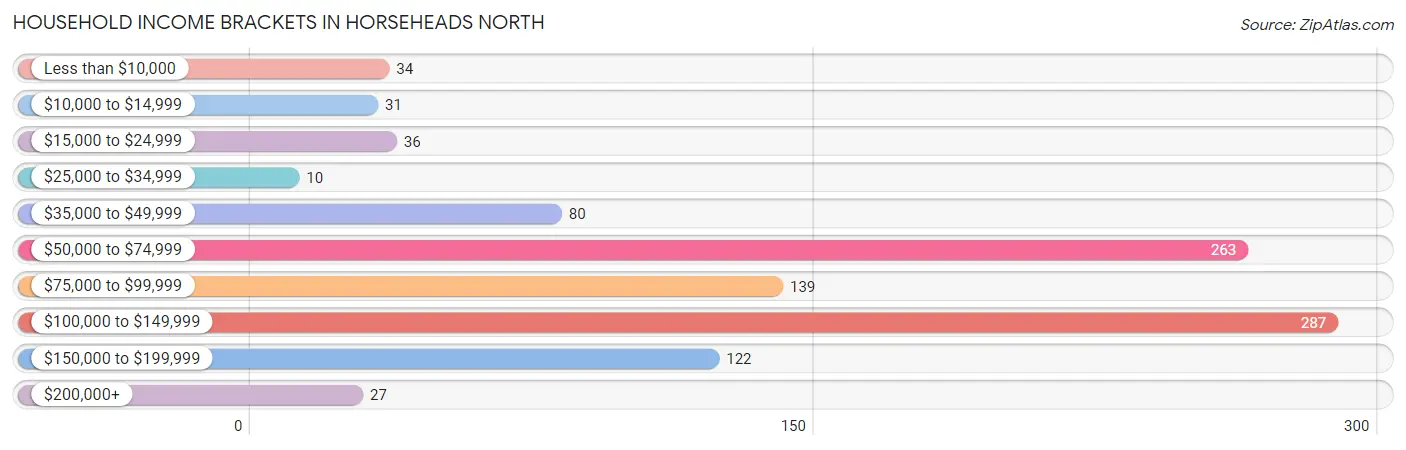
| Income Bracket | # Households | % Households |
| Less than $10,000 | 34 | 3.3% |
| $10,000 to $14,999 | 31 | 3.0% |
| $15,000 to $24,999 | 36 | 3.5% |
| $25,000 to $34,999 | 10 | 1.0% |
| $35,000 to $49,999 | 80 | 7.8% |
| $50,000 to $74,999 | 263 | 25.6% |
| $75,000 to $99,999 | 139 | 13.5% |
| $100,000 to $149,999 | 287 | 27.9% |
| $150,000 to $199,999 | 122 | 11.9% |
| $200,000+ | 27 | 2.6% |
Household Income by Householder Age in Horseheads North
The median household income in Horseheads North is $79,656, with the highest median household income of $102,059 found in the 45 to 64 years age bracket for the primary householder. A total of 426 households (41.4%) fall into this category. Meanwhile, the 15 to 24 years age bracket for the primary householder has the lowest median household income of $0, with 27 households (2.6%) in this group.
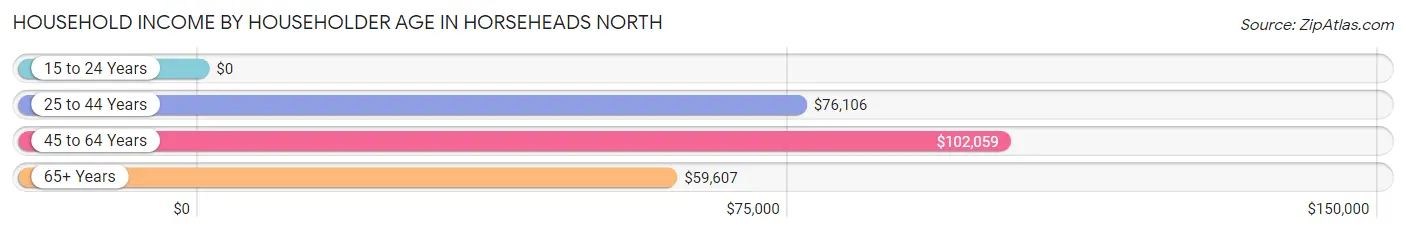
| Income Bracket | # Households | Median Income |
| 15 to 24 Years | 27 (2.6%) | $0 |
| 25 to 44 Years | 303 (29.4%) | $76,106 |
| 45 to 64 Years | 426 (41.4%) | $102,059 |
| 65+ Years | 273 (26.5%) | $59,607 |
| Total | 1,029 (100.0%) | $79,656 |
Poverty in Horseheads North
Income Below Poverty by Sex and Age in Horseheads North
With 9.4% poverty level for males and 9.2% for females among the residents of Horseheads North, under 5 year old males and 12 to 14 year old females are the most vulnerable to poverty, with 34 males (50.0%) and 35 females (83.3%) in their respective age groups living below the poverty level.
| Age Bracket | Male | Female |
| Under 5 Years | 34 (50.0%) | 0 (0.0%) |
| 5 Years | 0 (0.0%) | 0 (0.0%) |
| 6 to 11 Years | 0 (0.0%) | 0 (0.0%) |
| 12 to 14 Years | 31 (36.5%) | 35 (83.3%) |
| 15 Years | 0 (0.0%) | 0 (0.0%) |
| 16 and 17 Years | 0 (0.0%) | 0 (0.0%) |
| 18 to 24 Years | 0 (0.0%) | 0 (0.0%) |
| 25 to 34 Years | 0 (0.0%) | 49 (26.9%) |
| 35 to 44 Years | 34 (23.3%) | 37 (19.4%) |
| 45 to 54 Years | 0 (0.0%) | 0 (0.0%) |
| 55 to 64 Years | 22 (13.7%) | 0 (0.0%) |
| 65 to 74 Years | 0 (0.0%) | 0 (0.0%) |
| 75 Years and over | 0 (0.0%) | 9 (11.1%) |
| Total | 121 (9.4%) | 130 (9.2%) |
Income Above Poverty by Sex and Age in Horseheads North
According to the poverty statistics in Horseheads North, males aged 6 to 11 years and females aged under 5 years are the age groups that are most secure financially, with 100.0% of males and 100.0% of females in these age groups living above the poverty line.
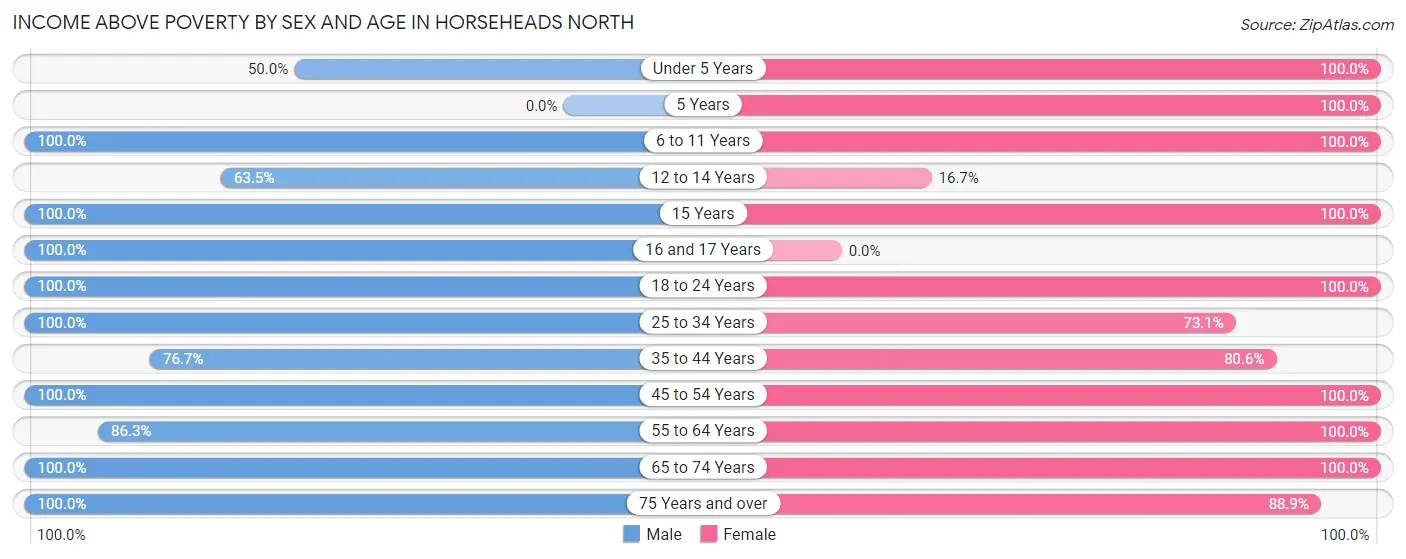
| Age Bracket | Male | Female |
| Under 5 Years | 34 (50.0%) | 143 (100.0%) |
| 5 Years | 0 (0.0%) | 50 (100.0%) |
| 6 to 11 Years | 143 (100.0%) | 79 (100.0%) |
| 12 to 14 Years | 54 (63.5%) | 7 (16.7%) |
| 15 Years | 18 (100.0%) | 33 (100.0%) |
| 16 and 17 Years | 19 (100.0%) | 0 (0.0%) |
| 18 to 24 Years | 78 (100.0%) | 100 (100.0%) |
| 25 to 34 Years | 155 (100.0%) | 133 (73.1%) |
| 35 to 44 Years | 112 (76.7%) | 154 (80.6%) |
| 45 to 54 Years | 218 (100.0%) | 175 (100.0%) |
| 55 to 64 Years | 139 (86.3%) | 164 (100.0%) |
| 65 to 74 Years | 174 (100.0%) | 169 (100.0%) |
| 75 Years and over | 25 (100.0%) | 72 (88.9%) |
| Total | 1,169 (90.6%) | 1,279 (90.8%) |
Income Below Poverty Among Married-Couple Families in Horseheads North
The poverty statistics for married-couple families in Horseheads North show that 5.1% or 34 of the total 672 families live below the poverty line. Families with 3 or 4 children have the highest poverty rate of 53.1%, comprising of 34 families. On the other hand, families with no children have the lowest poverty rate of 0.0%, which includes 0 families.
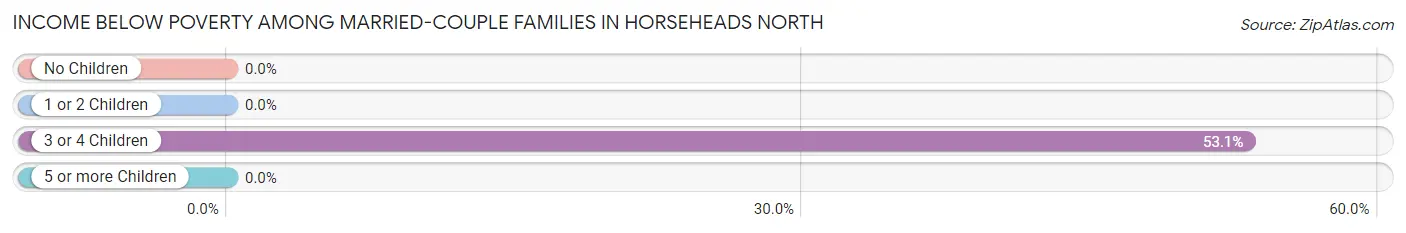
| Children | Above Poverty | Below Poverty |
| No Children | 417 (100.0%) | 0 (0.0%) |
| 1 or 2 Children | 191 (100.0%) | 0 (0.0%) |
| 3 or 4 Children | 30 (46.9%) | 34 (53.1%) |
| 5 or more Children | 0 (0.0%) | 0 (0.0%) |
| Total | 638 (94.9%) | 34 (5.1%) |
Income Below Poverty Among Single-Parent Households in Horseheads North
| Children | Single Father | Single Mother |
| No Children | 0 (0.0%) | 0 (0.0%) |
| 1 or 2 Children | 0 (0.0%) | 0 (0.0%) |
| 3 or 4 Children | 0 (0.0%) | 0 (0.0%) |
| 5 or more Children | 0 (0.0%) | 0 (0.0%) |
| Total | 0 (0.0%) | 0 (0.0%) |
Income Below Poverty Among Married-Couple vs Single-Parent Households in Horseheads North
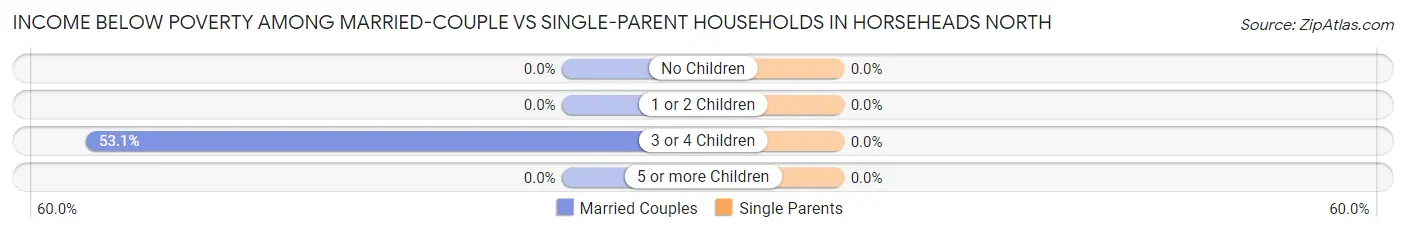
| Children | Married-Couple Families | Single-Parent Households |
| No Children | 0 (0.0%) | 0 (0.0%) |
| 1 or 2 Children | 0 (0.0%) | 0 (0.0%) |
| 3 or 4 Children | 34 (53.1%) | 0 (0.0%) |
| 5 or more Children | 0 (0.0%) | 0 (0.0%) |
| Total | 34 (5.1%) | 0 (0.0%) |
Race in Horseheads North
The most populous races in Horseheads North are White / Caucasian (2,485 | 91.8%), Black / African American (114 | 4.2%), and Asian (55 | 2.0%).
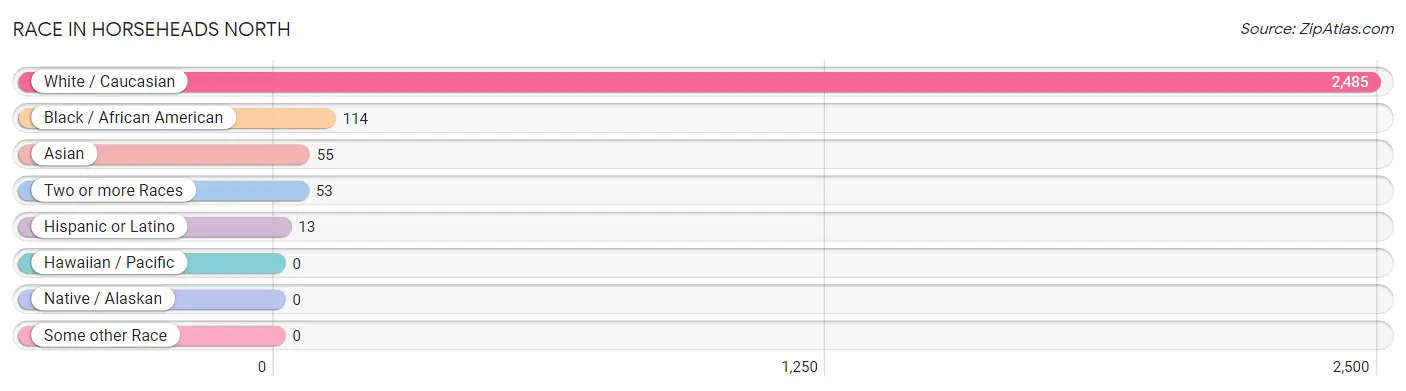
| Race | # Population | % Population |
| Asian | 55 | 2.0% |
| Black / African American | 114 | 4.2% |
| Hawaiian / Pacific | 0 | 0.0% |
| Hispanic or Latino | 13 | 0.5% |
| Native / Alaskan | 0 | 0.0% |
| White / Caucasian | 2,485 | 91.8% |
| Two or more Races | 53 | 2.0% |
| Some other Race | 0 | 0.0% |
| Total | 2,707 | 100.0% |
Ancestry in Horseheads North
The most populous ancestries reported in Horseheads North are German (840 | 31.0%), Irish (652 | 24.1%), English (589 | 21.8%), Italian (470 | 17.4%), and Polish (187 | 6.9%), together accounting for 101.2% of all Horseheads North residents.
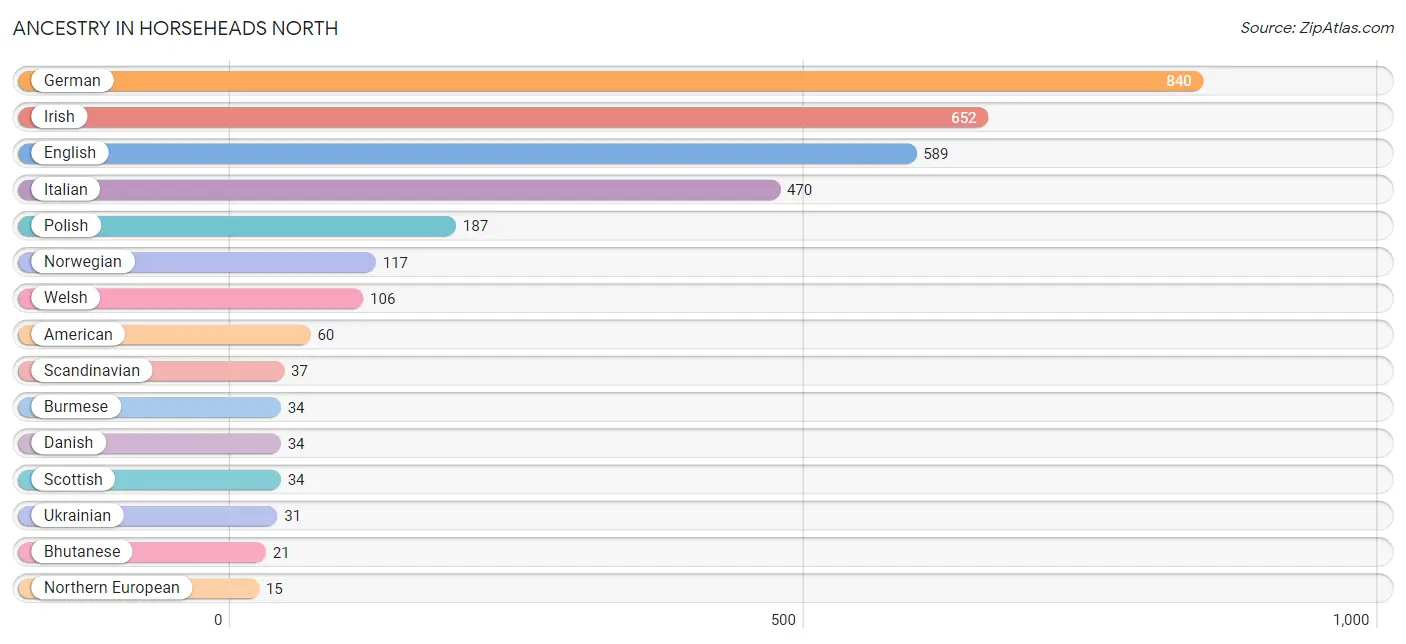
| Ancestry | # Population | % Population |
| American | 60 | 2.2% |
| Austrian | 13 | 0.5% |
| Bhutanese | 21 | 0.8% |
| Burmese | 34 | 1.3% |
| Danish | 34 | 1.3% |
| Dutch | 10 | 0.4% |
| English | 589 | 21.8% |
| European | 9 | 0.3% |
| French | 13 | 0.5% |
| German | 840 | 31.0% |
| Hungarian | 10 | 0.4% |
| Irish | 652 | 24.1% |
| Italian | 470 | 17.4% |
| Mexican | 13 | 0.5% |
| Northern European | 15 | 0.5% |
| Norwegian | 117 | 4.3% |
| Polish | 187 | 6.9% |
| Scandinavian | 37 | 1.4% |
| Scottish | 34 | 1.3% |
| Ukrainian | 31 | 1.1% |
| Welsh | 106 | 3.9% | View All 21 Rows |
Immigrants in Horseheads North
The most numerous immigrant groups reported in Horseheads North came from Asia (38 | 1.4%), Eastern Asia (38 | 1.4%), Japan (21 | 0.8%), and Korea (17 | 0.6%), together accounting for 4.2% of all Horseheads North residents.
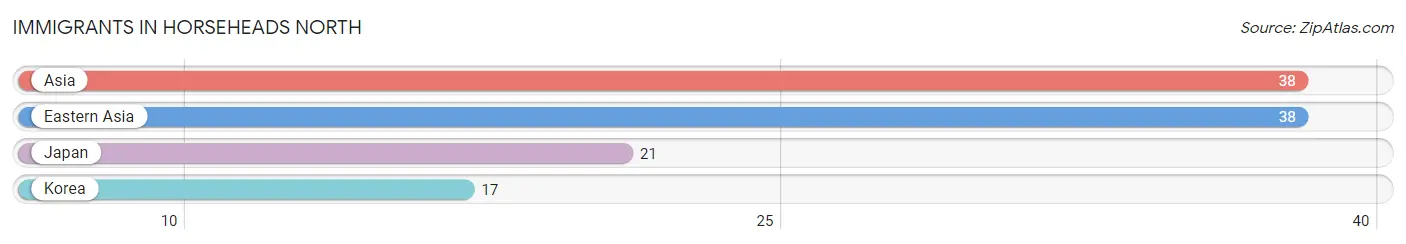
| Immigration Origin | # Population | % Population |
| Asia | 38 | 1.4% |
| Eastern Asia | 38 | 1.4% |
| Japan | 21 | 0.8% |
| Korea | 17 | 0.6% | View All 4 Rows |
Sex and Age in Horseheads North
Sex and Age in Horseheads North
The most populous age groups in Horseheads North are 50 to 54 Years (155 | 12.0%) for men and Under 5 Years (151 | 10.7%) for women.
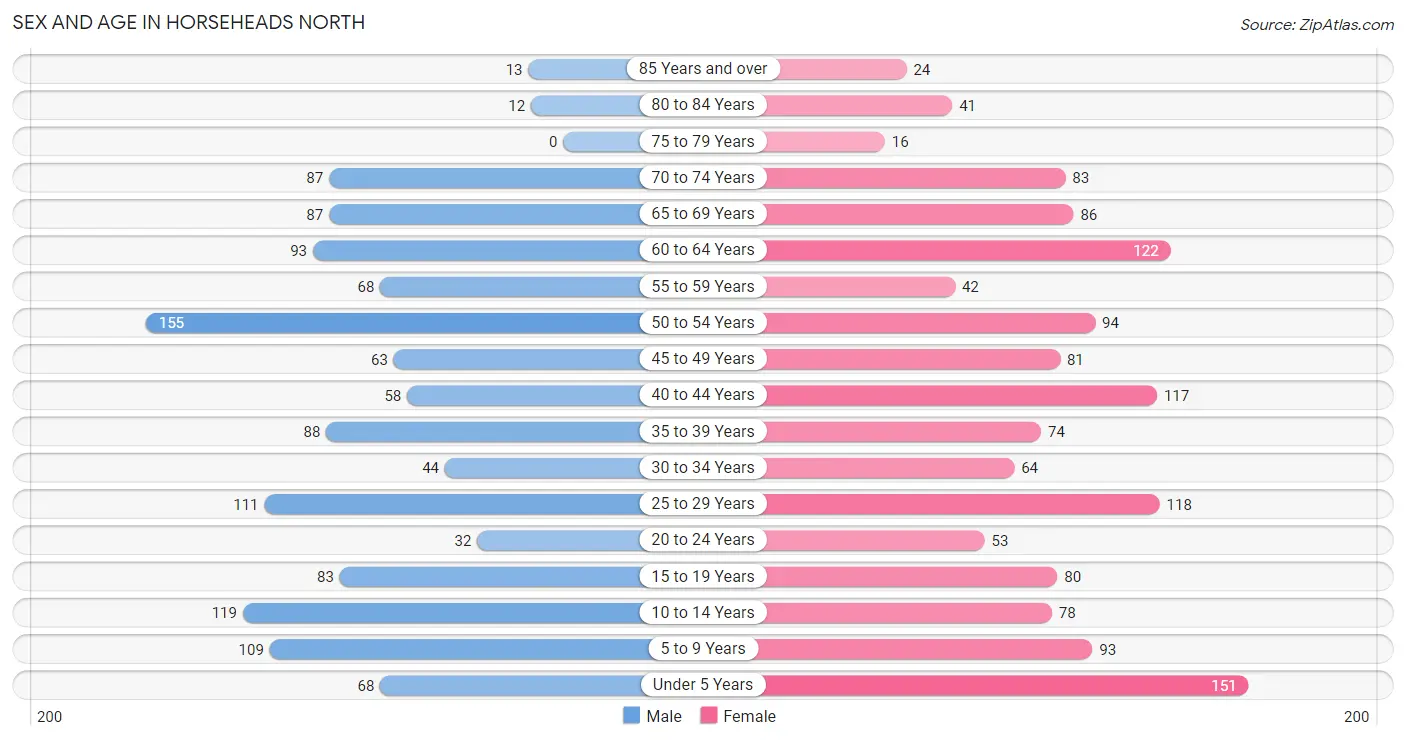
| Age Bracket | Male | Female |
| Under 5 Years | 68 (5.3%) | 151 (10.7%) |
| 5 to 9 Years | 109 (8.5%) | 93 (6.6%) |
| 10 to 14 Years | 119 (9.2%) | 78 (5.5%) |
| 15 to 19 Years | 83 (6.4%) | 80 (5.7%) |
| 20 to 24 Years | 32 (2.5%) | 53 (3.7%) |
| 25 to 29 Years | 111 (8.6%) | 118 (8.3%) |
| 30 to 34 Years | 44 (3.4%) | 64 (4.5%) |
| 35 to 39 Years | 88 (6.8%) | 74 (5.2%) |
| 40 to 44 Years | 58 (4.5%) | 117 (8.3%) |
| 45 to 49 Years | 63 (4.9%) | 81 (5.7%) |
| 50 to 54 Years | 155 (12.0%) | 94 (6.6%) |
| 55 to 59 Years | 68 (5.3%) | 42 (3.0%) |
| 60 to 64 Years | 93 (7.2%) | 122 (8.6%) |
| 65 to 69 Years | 87 (6.7%) | 86 (6.1%) |
| 70 to 74 Years | 87 (6.7%) | 83 (5.9%) |
| 75 to 79 Years | 0 (0.0%) | 16 (1.1%) |
| 80 to 84 Years | 12 (0.9%) | 41 (2.9%) |
| 85 Years and over | 13 (1.0%) | 24 (1.7%) |
| Total | 1,290 (100.0%) | 1,417 (100.0%) |
Families and Households in Horseheads North
Median Family Size in Horseheads North
The median family size in Horseheads North is 2.95 persons per family, with single female/mother families (77 | 9.6%) accounting for the largest median family size of 3.61 persons per family. On the other hand, single male/father families (53 | 6.6%) represent the smallest median family size with 2.15 persons per family.
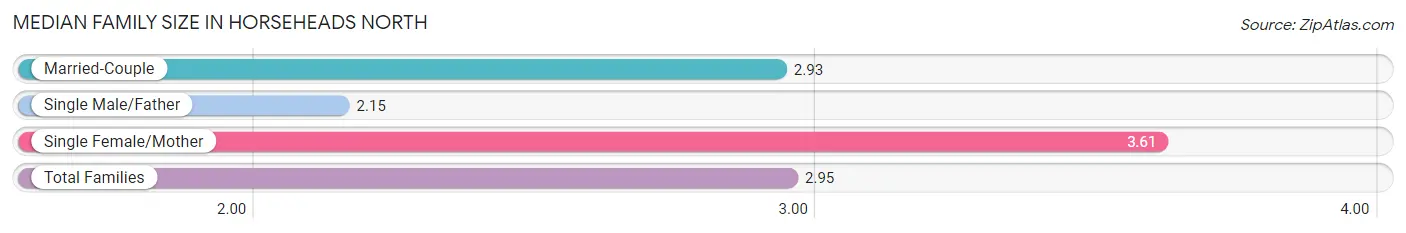
| Family Type | # Families | Family Size |
| Married-Couple | 672 (83.8%) | 2.93 |
| Single Male/Father | 53 (6.6%) | 2.15 |
| Single Female/Mother | 77 (9.6%) | 3.61 |
| Total Families | 802 (100.0%) | 2.95 |
Median Household Size in Horseheads North
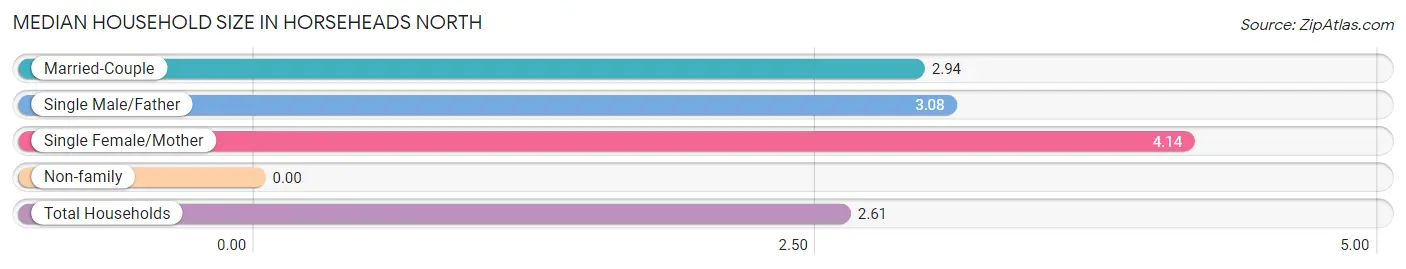
| Household Type | # Households | Household Size |
| Married-Couple | 672 (65.3%) | 2.94 |
| Single Male/Father | 53 (5.1%) | 3.08 |
| Single Female/Mother | 77 (7.5%) | 4.14 |
| Non-family | 227 (22.1%) | - |
| Total Households | 1,029 (100.0%) | 2.61 |
Household Size by Marriage Status in Horseheads North
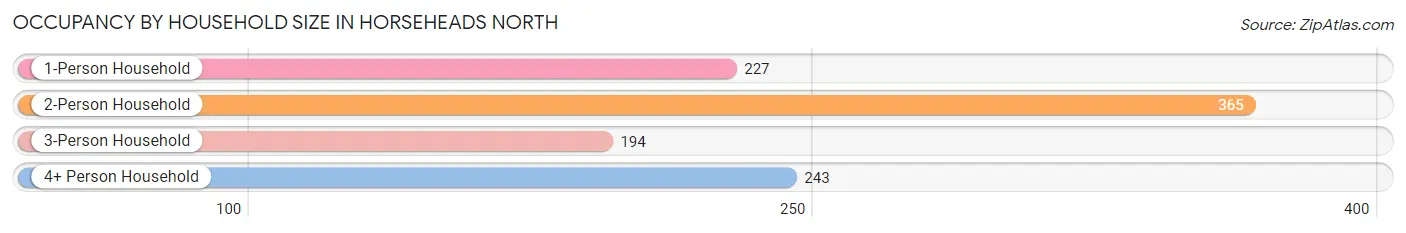
Out of a total of 1,029 households in Horseheads North, 802 (77.9%) are family households, while 227 (22.1%) are nonfamily households. The most numerous type of family households are 2-person households, comprising 365, and the most common type of nonfamily households are 1-person households, comprising 227.
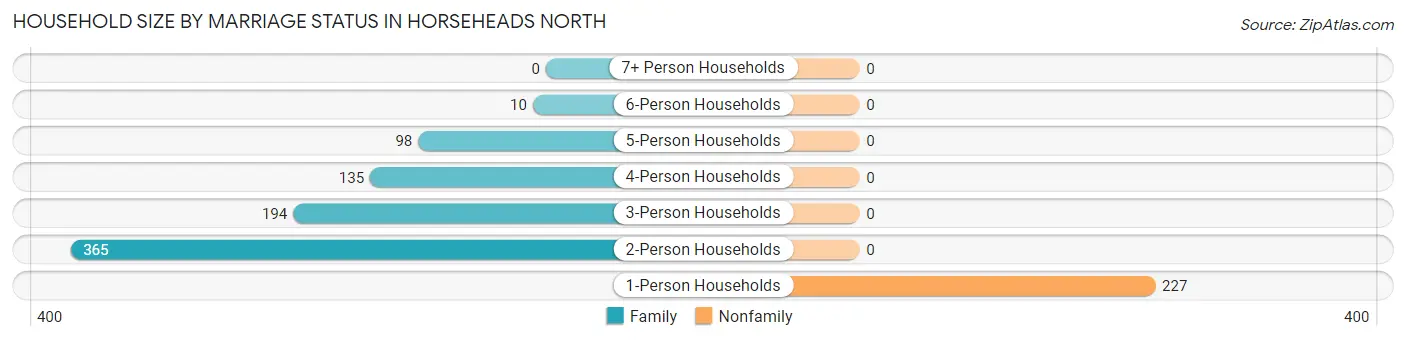
| Household Size | Family Households | Nonfamily Households |
| 1-Person Households | - | 227 (22.1%) |
| 2-Person Households | 365 (35.5%) | 0 (0.0%) |
| 3-Person Households | 194 (18.9%) | 0 (0.0%) |
| 4-Person Households | 135 (13.1%) | 0 (0.0%) |
| 5-Person Households | 98 (9.5%) | 0 (0.0%) |
| 6-Person Households | 10 (1.0%) | 0 (0.0%) |
| 7+ Person Households | 0 (0.0%) | 0 (0.0%) |
| Total | 802 (77.9%) | 227 (22.1%) |
Female Fertility in Horseheads North
Fertility by Age in Horseheads North
Average fertility rate in Horseheads North is 126.0 births per 1,000 women. Women in the age bracket of 20 to 34 years have the highest fertility rate with 323.0 births per 1,000 women. Women in the age bracket of 20 to 34 years acount for 100.0% of all women with births.
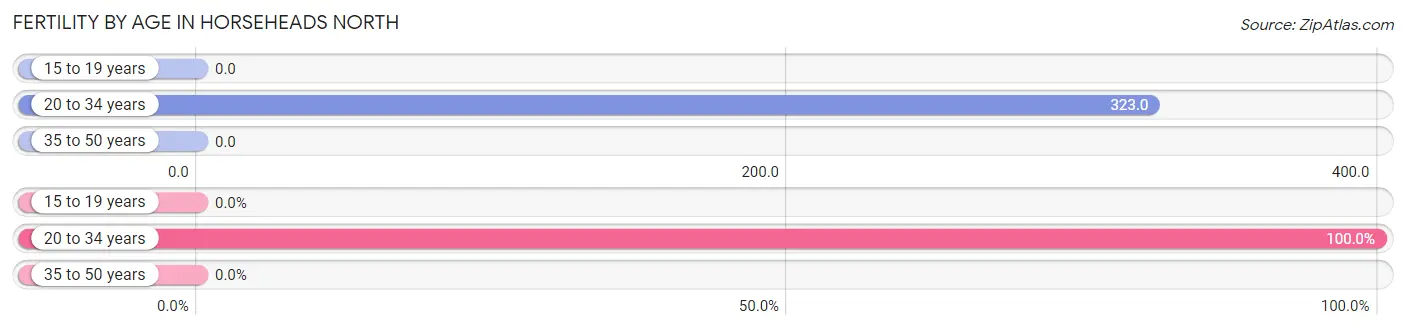
| Age Bracket | Women with Births | Births / 1,000 Women |
| 15 to 19 years | 0 (0.0%) | 0.0 |
| 20 to 34 years | 76 (100.0%) | 323.0 |
| 35 to 50 years | 0 (0.0%) | 0.0 |
| Total | 76 (100.0%) | 126.0 |
Fertility by Age by Marriage Status in Horseheads North
35.5% of women with births (76) in Horseheads North are married. The highest percentage of unmarried women with births falls into 20 to 34 years age bracket with 64.5% of them unmarried at the time of birth, while the lowest percentage of unmarried women with births belong to 20 to 34 years age bracket with 64.5% of them unmarried.
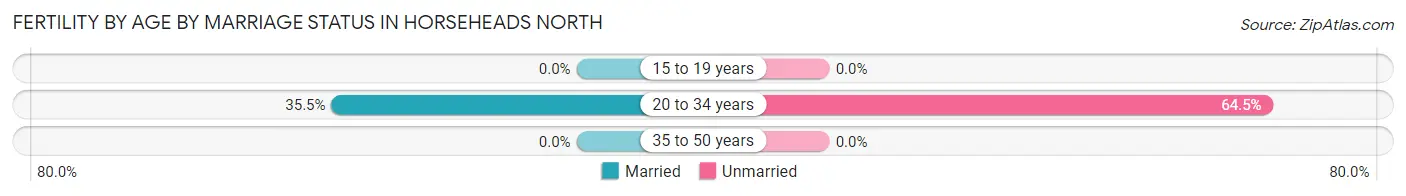
| Age Bracket | Married | Unmarried |
| 15 to 19 years | 0 (0.0%) | 0 (0.0%) |
| 20 to 34 years | 27 (35.5%) | 49 (64.5%) |
| 35 to 50 years | 0 (0.0%) | 0 (0.0%) |
| Total | 27 (35.5%) | 49 (64.5%) |
Fertility by Education in Horseheads North
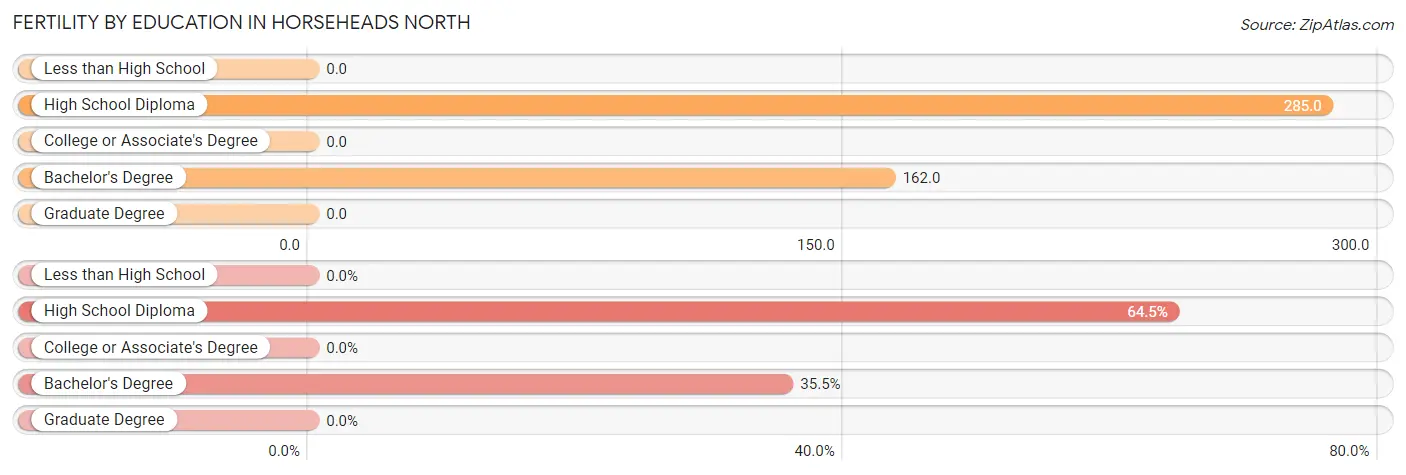
| Educational Attainment | Women with Births | Births / 1,000 Women |
| Less than High School | 0 (0.0%) | 0.0 |
| High School Diploma | 49 (64.5%) | 285.0 |
| College or Associate's Degree | 0 (0.0%) | 0.0 |
| Bachelor's Degree | 27 (35.5%) | 162.0 |
| Graduate Degree | 0 (0.0%) | 0.0 |
| Total | 76 (100.0%) | 126.0 |
Fertility by Education by Marriage Status in Horseheads North
64.5% of women with births in Horseheads North are unmarried. Women with the educational attainment of bachelor's degree are most likely to be married with 100.0% of them married at childbirth, while women with the educational attainment of high school diploma are least likely to be married with 100.0% of them unmarried at childbirth.
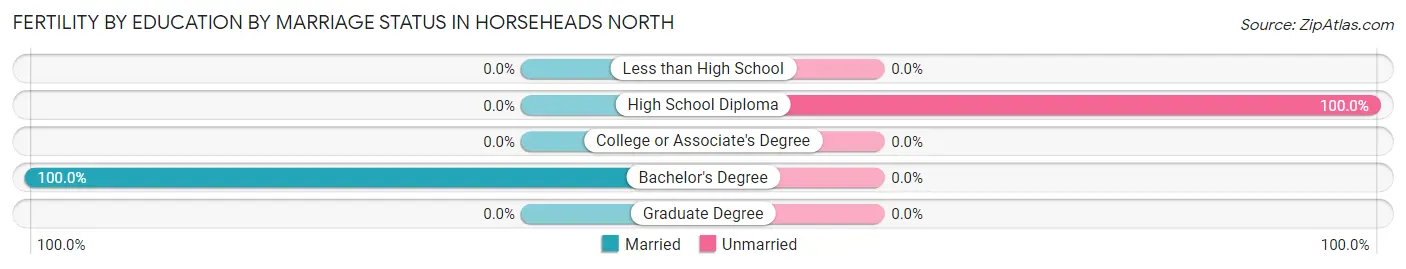
| Educational Attainment | Married | Unmarried |
| Less than High School | 0 (0.0%) | 0 (0.0%) |
| High School Diploma | 0 (0.0%) | 49 (100.0%) |
| College or Associate's Degree | 0 (0.0%) | 0 (0.0%) |
| Bachelor's Degree | 27 (100.0%) | 0 (0.0%) |
| Graduate Degree | 0 (0.0%) | 0 (0.0%) |
| Total | 27 (35.5%) | 49 (64.5%) |
Employment Characteristics in Horseheads North
Employment by Class of Employer in Horseheads North
Among the 1,188 employed individuals in Horseheads North, private company employees (514 | 43.3%), not-for-profit organizations (323 | 27.2%), and local government employees (183 | 15.4%) make up the most common classes of employment.
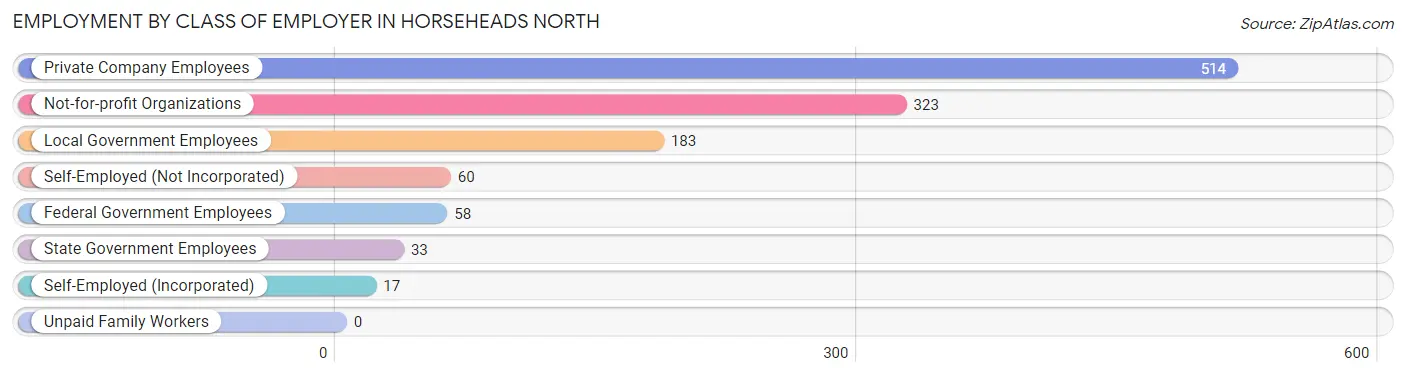
| Employer Class | # Employees | % Employees |
| Private Company Employees | 514 | 43.3% |
| Self-Employed (Incorporated) | 17 | 1.4% |
| Self-Employed (Not Incorporated) | 60 | 5.1% |
| Not-for-profit Organizations | 323 | 27.2% |
| Local Government Employees | 183 | 15.4% |
| State Government Employees | 33 | 2.8% |
| Federal Government Employees | 58 | 4.9% |
| Unpaid Family Workers | 0 | 0.0% |
| Total | 1,188 | 100.0% |
Employment Status by Age in Horseheads North
According to the labor force statistics for Horseheads North, out of the total population over 16 years of age (2,038), 60.5% or 1,233 individuals are in the labor force, with 0.8% or 10 of them unemployed. The age group with the highest labor force participation rate is 30 to 34 years, with 93.5% or 101 individuals in the labor force. Within the labor force, the 45 to 54 years age range has the highest percentage of unemployed individuals, with 3.2% or 10 of them being unemployed.
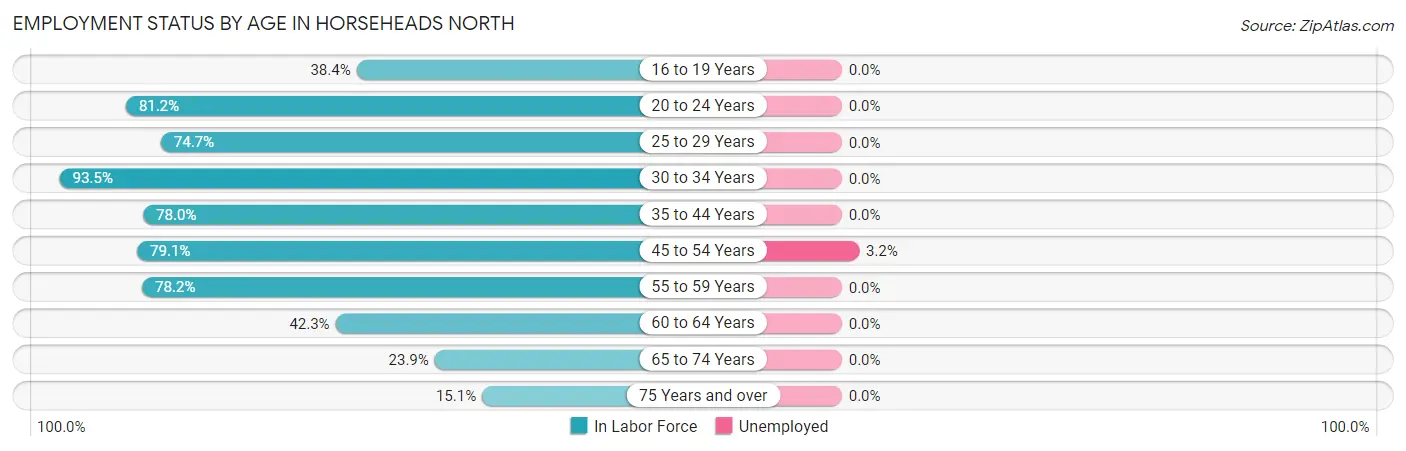
| Age Bracket | In Labor Force | Unemployed |
| 16 to 19 Years | 43 (38.4%) | 0 (0.0%) |
| 20 to 24 Years | 69 (81.2%) | 0 (0.0%) |
| 25 to 29 Years | 171 (74.7%) | 0 (0.0%) |
| 30 to 34 Years | 101 (93.5%) | 0 (0.0%) |
| 35 to 44 Years | 263 (78.0%) | 0 (0.0%) |
| 45 to 54 Years | 311 (79.1%) | 10 (3.2%) |
| 55 to 59 Years | 86 (78.2%) | 0 (0.0%) |
| 60 to 64 Years | 91 (42.3%) | 0 (0.0%) |
| 65 to 74 Years | 82 (23.9%) | 0 (0.0%) |
| 75 Years and over | 16 (15.1%) | 0 (0.0%) |
| Total | 1,233 (60.5%) | 10 (0.8%) |
Employment Status by Educational Attainment in Horseheads North
According to labor force statistics for Horseheads North, 73.5% of individuals (1,023) out of the total population between 25 and 64 years of age (1,392) are in the labor force, with 1.0% or 10 of them being unemployed. The group with the highest labor force participation rate are those with the educational attainment of bachelor's degree or higher, with 83.4% or 478 individuals in the labor force. Within the labor force, individuals with high school diploma education have the highest percentage of unemployment, with 3.5% or 10 of them being unemployed.
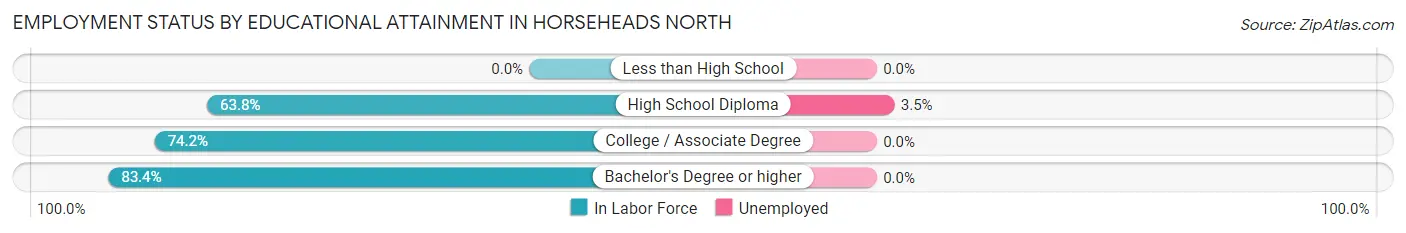
| Educational Attainment | In Labor Force | Unemployed |
| Less than High School | 0 (0.0%) | 0 (0.0%) |
| High School Diploma | 289 (63.8%) | 16 (3.5%) |
| College / Associate Degree | 256 (74.2%) | 0 (0.0%) |
| Bachelor's Degree or higher | 478 (83.4%) | 0 (0.0%) |
| Total | 1,023 (73.5%) | 14 (1.0%) |
Employment Occupations by Sex in Horseheads North
Management, Business, Science and Arts Occupations
The most common Management, Business, Science and Arts occupations in Horseheads North are Community & Social Service (186 | 15.2%), Management (152 | 12.4%), Health Diagnosing & Treating (141 | 11.5%), Education Instruction & Library (135 | 11.0%), and Health Technologists (100 | 8.2%).
Management, Business, Science and Arts Occupations by Sex
Within the Management, Business, Science and Arts occupations in Horseheads North, the most male-oriented occupations are Computers, Engineering & Science (100.0%), Computers & Mathematics (100.0%), and Architecture & Engineering (100.0%), while the most female-oriented occupations are Business & Financial (100.0%), Arts, Media & Entertainment (100.0%), and Education Instruction & Library (93.3%).
| Occupation | Male | Female |
| Management | 81 (53.3%) | 71 (46.7%) |
| Business & Financial | 0 (0.0%) | 36 (100.0%) |
| Computers, Engineering & Science | 76 (100.0%) | 0 (0.0%) |
| Computers & Mathematics | 23 (100.0%) | 0 (0.0%) |
| Architecture & Engineering | 36 (100.0%) | 0 (0.0%) |
| Life, Physical & Social Science | 17 (100.0%) | 0 (0.0%) |
| Community & Social Service | 32 (17.2%) | 154 (82.8%) |
| Education, Arts & Media | 23 (100.0%) | 0 (0.0%) |
| Legal Services & Support | 0 (0.0%) | 0 (0.0%) |
| Education Instruction & Library | 9 (6.7%) | 126 (93.3%) |
| Arts, Media & Entertainment | 0 (0.0%) | 28 (100.0%) |
| Health Diagnosing & Treating | 31 (22.0%) | 110 (78.0%) |
| Health Technologists | 18 (18.0%) | 82 (82.0%) |
| Total (Category) | 220 (37.2%) | 371 (62.8%) |
| Total (Overall) | 601 (49.1%) | 622 (50.9%) |
Services Occupations
The most common Services occupations in Horseheads North are Healthcare Support (101 | 8.3%), Security & Protection (62 | 5.1%), Law Enforcement (39 | 3.2%), Cleaning & Maintenance (25 | 2.0%), and Firefighting & Prevention (23 | 1.9%).
Services Occupations by Sex
Within the Services occupations in Horseheads North, the most male-oriented occupations are Security & Protection (100.0%), Firefighting & Prevention (100.0%), and Law Enforcement (100.0%), while the most female-oriented occupations are Personal Care & Service (100.0%), Food Preparation & Serving (73.3%), and Healthcare Support (72.3%).
| Occupation | Male | Female |
| Healthcare Support | 28 (27.7%) | 73 (72.3%) |
| Security & Protection | 62 (100.0%) | 0 (0.0%) |
| Firefighting & Prevention | 23 (100.0%) | 0 (0.0%) |
| Law Enforcement | 39 (100.0%) | 0 (0.0%) |
| Food Preparation & Serving | 4 (26.7%) | 11 (73.3%) |
| Cleaning & Maintenance | 25 (100.0%) | 0 (0.0%) |
| Personal Care & Service | 0 (0.0%) | 8 (100.0%) |
| Total (Category) | 119 (56.4%) | 92 (43.6%) |
| Total (Overall) | 601 (49.1%) | 622 (50.9%) |
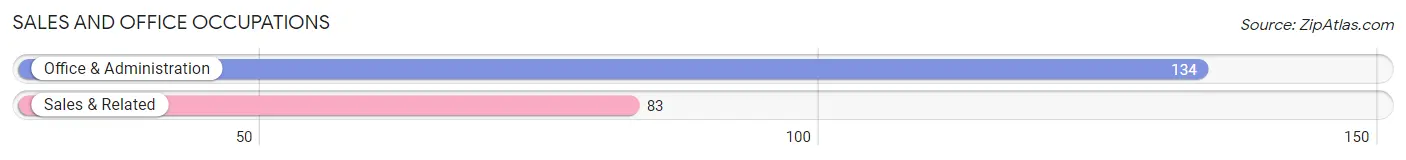
Sales and Office Occupations
The most common Sales and Office occupations in Horseheads North are Office & Administration (134 | 11.0%), and Sales & Related (83 | 6.8%).
Sales and Office Occupations by Sex
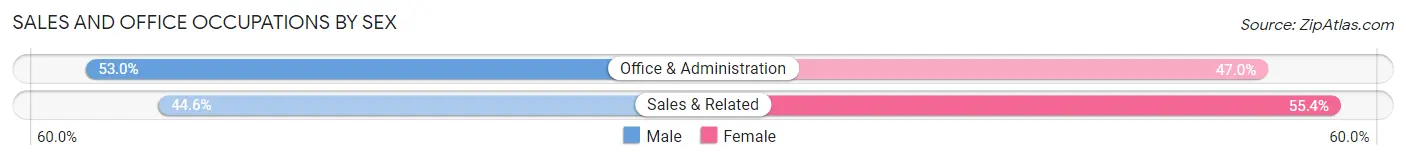
| Occupation | Male | Female |
| Sales & Related | 37 (44.6%) | 46 (55.4%) |
| Office & Administration | 71 (53.0%) | 63 (47.0%) |
| Total (Category) | 108 (49.8%) | 109 (50.2%) |
| Total (Overall) | 601 (49.1%) | 622 (50.9%) |
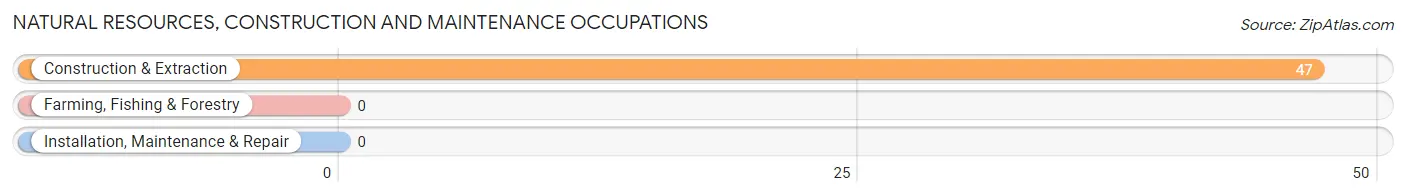
Natural Resources, Construction and Maintenance Occupations
The most common Natural Resources, Construction and Maintenance occupations in Horseheads North are , and Construction & Extraction (47 | 3.8%).
Natural Resources, Construction and Maintenance Occupations by Sex
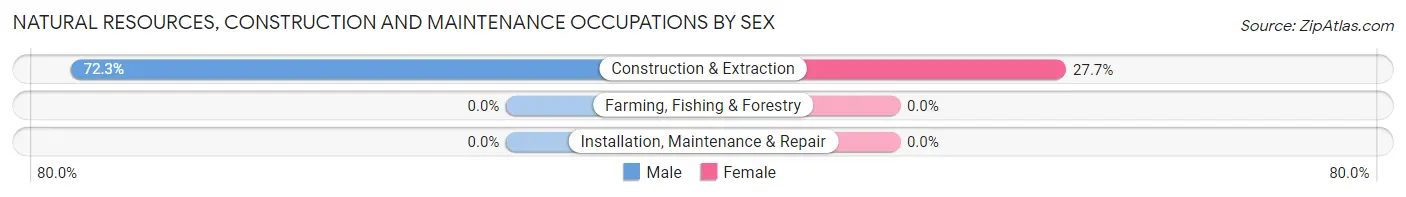
| Occupation | Male | Female |
| Farming, Fishing & Forestry | 0 (0.0%) | 0 (0.0%) |
| Construction & Extraction | 34 (72.3%) | 13 (27.7%) |
| Installation, Maintenance & Repair | 0 (0.0%) | 0 (0.0%) |
| Total (Category) | 34 (72.3%) | 13 (27.7%) |
| Total (Overall) | 601 (49.1%) | 622 (50.9%) |
Production, Transportation and Moving Occupations
The most common Production, Transportation and Moving occupations in Horseheads North are Production (92 | 7.5%), Material Moving (35 | 2.9%), and Transportation (30 | 2.5%).
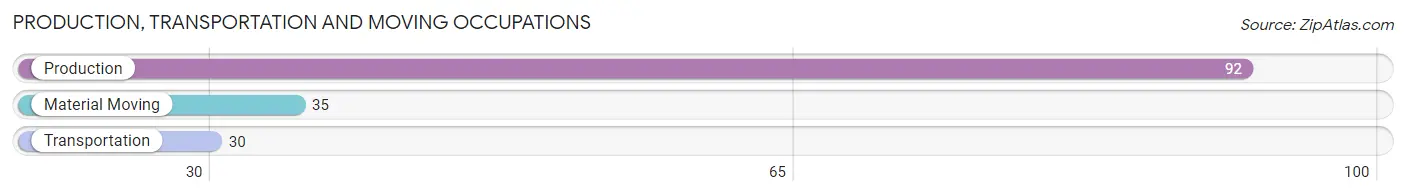
Production, Transportation and Moving Occupations by Sex
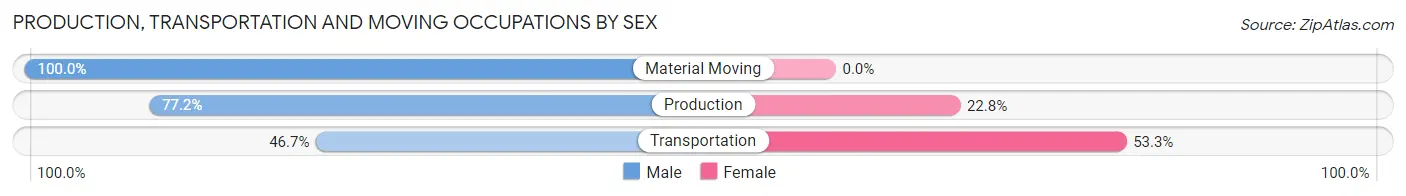
| Occupation | Male | Female |
| Production | 71 (77.2%) | 21 (22.8%) |
| Transportation | 14 (46.7%) | 16 (53.3%) |
| Material Moving | 35 (100.0%) | 0 (0.0%) |
| Total (Category) | 120 (76.4%) | 37 (23.6%) |
| Total (Overall) | 601 (49.1%) | 622 (50.9%) |
Employment Industries by Sex in Horseheads North
Employment Industries in Horseheads North
The major employment industries in Horseheads North include Health Care & Social Assistance (319 | 26.1%), Manufacturing (190 | 15.5%), Educational Services (174 | 14.2%), Professional & Scientific (80 | 6.5%), and Public Administration (79 | 6.5%).
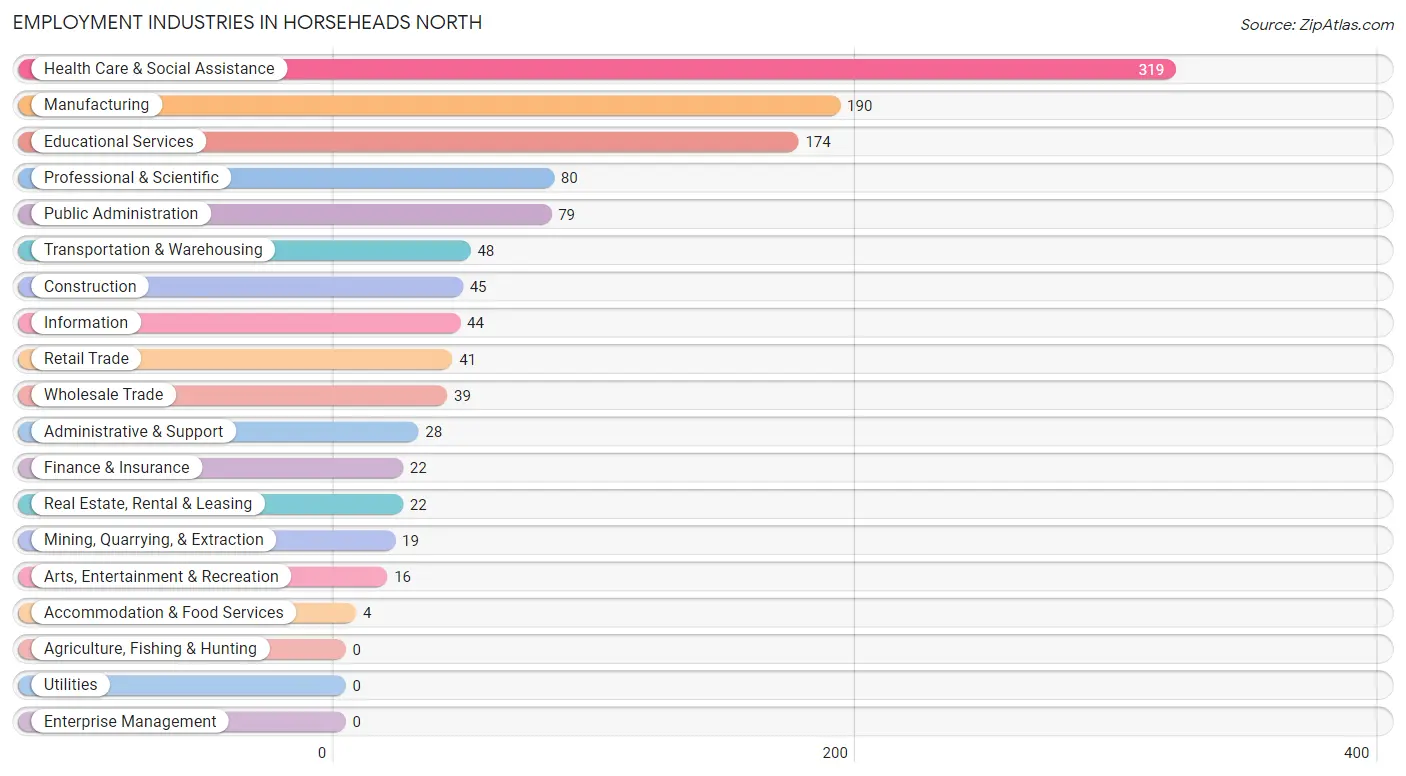
Employment Industries by Sex in Horseheads North
The Horseheads North industries that see more men than women are Mining, Quarrying, & Extraction (100.0%), Transportation & Warehousing (100.0%), and Professional & Scientific (100.0%), whereas the industries that tend to have a higher number of women are Finance & Insurance (100.0%), Educational Services (94.8%), and Retail Trade (85.4%).
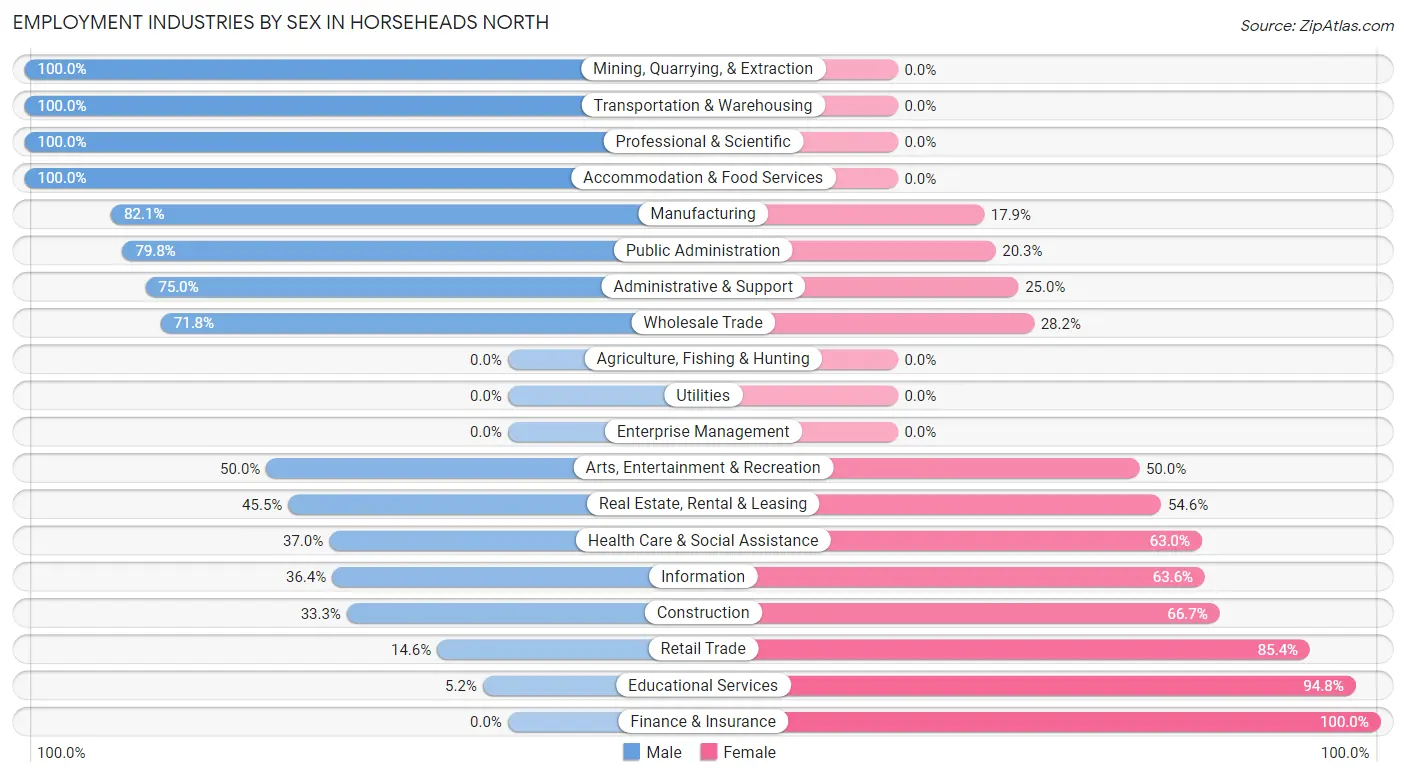
| Industry | Male | Female |
| Agriculture, Fishing & Hunting | 0 (0.0%) | 0 (0.0%) |
| Mining, Quarrying, & Extraction | 19 (100.0%) | 0 (0.0%) |
| Construction | 15 (33.3%) | 30 (66.7%) |
| Manufacturing | 156 (82.1%) | 34 (17.9%) |
| Wholesale Trade | 28 (71.8%) | 11 (28.2%) |
| Retail Trade | 6 (14.6%) | 35 (85.4%) |
| Transportation & Warehousing | 48 (100.0%) | 0 (0.0%) |
| Utilities | 0 (0.0%) | 0 (0.0%) |
| Information | 16 (36.4%) | 28 (63.6%) |
| Finance & Insurance | 0 (0.0%) | 22 (100.0%) |
| Real Estate, Rental & Leasing | 10 (45.5%) | 12 (54.5%) |
| Professional & Scientific | 80 (100.0%) | 0 (0.0%) |
| Enterprise Management | 0 (0.0%) | 0 (0.0%) |
| Administrative & Support | 21 (75.0%) | 7 (25.0%) |
| Educational Services | 9 (5.2%) | 165 (94.8%) |
| Health Care & Social Assistance | 118 (37.0%) | 201 (63.0%) |
| Arts, Entertainment & Recreation | 8 (50.0%) | 8 (50.0%) |
| Accommodation & Food Services | 4 (100.0%) | 0 (0.0%) |
| Public Administration | 63 (79.7%) | 16 (20.3%) |
| Total | 601 (49.1%) | 622 (50.9%) |
Education in Horseheads North
School Enrollment in Horseheads North
The most common levels of schooling among the 625 students in Horseheads North are high school (186 | 29.8%), elementary school (133 | 21.3%), and middle school (123 | 19.7%).
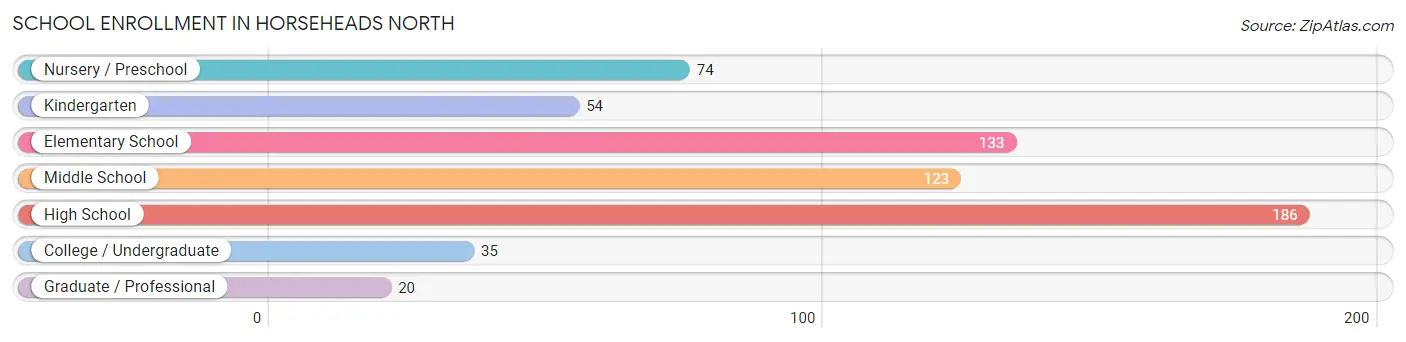
| School Level | # Students | % Students |
| Nursery / Preschool | 74 | 11.8% |
| Kindergarten | 54 | 8.6% |
| Elementary School | 133 | 21.3% |
| Middle School | 123 | 19.7% |
| High School | 186 | 29.8% |
| College / Undergraduate | 35 | 5.6% |
| Graduate / Professional | 20 | 3.2% |
| Total | 625 | 100.0% |
School Enrollment by Age by Funding Source in Horseheads North
Out of a total of 625 students who are enrolled in schools in Horseheads North, 17 (2.7%) attend a private institution, while the remaining 608 (97.3%) are enrolled in public schools. The age group of 3 to 4 year olds has the highest likelihood of being enrolled in private schools, with 17 (39.5% in the age bracket) enrolled. Conversely, the age group of 5 to 9 year old has the lowest likelihood of being enrolled in a private school, with 202 (100.0% in the age bracket) attending a public institution.
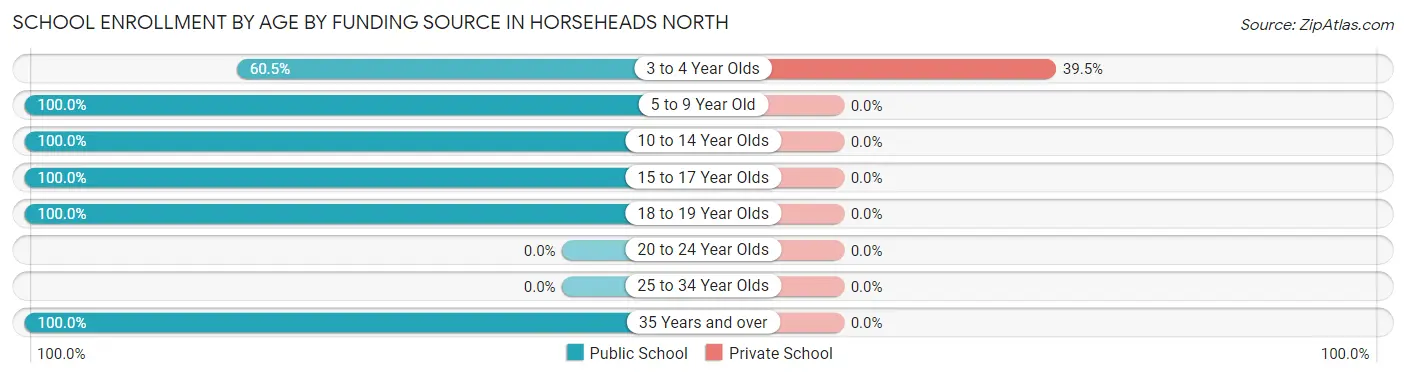
| Age Bracket | Public School | Private School |
| 3 to 4 Year Olds | 26 (60.5%) | 17 (39.5%) |
| 5 to 9 Year Old | 202 (100.0%) | 0 (0.0%) |
| 10 to 14 Year Olds | 197 (100.0%) | 0 (0.0%) |
| 15 to 17 Year Olds | 70 (100.0%) | 0 (0.0%) |
| 18 to 19 Year Olds | 93 (100.0%) | 0 (0.0%) |
| 20 to 24 Year Olds | 0 (0.0%) | 0 (0.0%) |
| 25 to 34 Year Olds | 0 (0.0%) | 0 (0.0%) |
| 35 Years and over | 20 (100.0%) | 0 (0.0%) |
| Total | 608 (97.3%) | 17 (2.7%) |
Educational Attainment by Field of Study in Horseheads North
Education (187 | 28.3%), science & technology (146 | 22.1%), business (71 | 10.8%), bio, nature & agricultural (54 | 8.2%), and liberal arts & history (47 | 7.1%) are the most common fields of study among 660 individuals in Horseheads North who have obtained a bachelor's degree or higher.
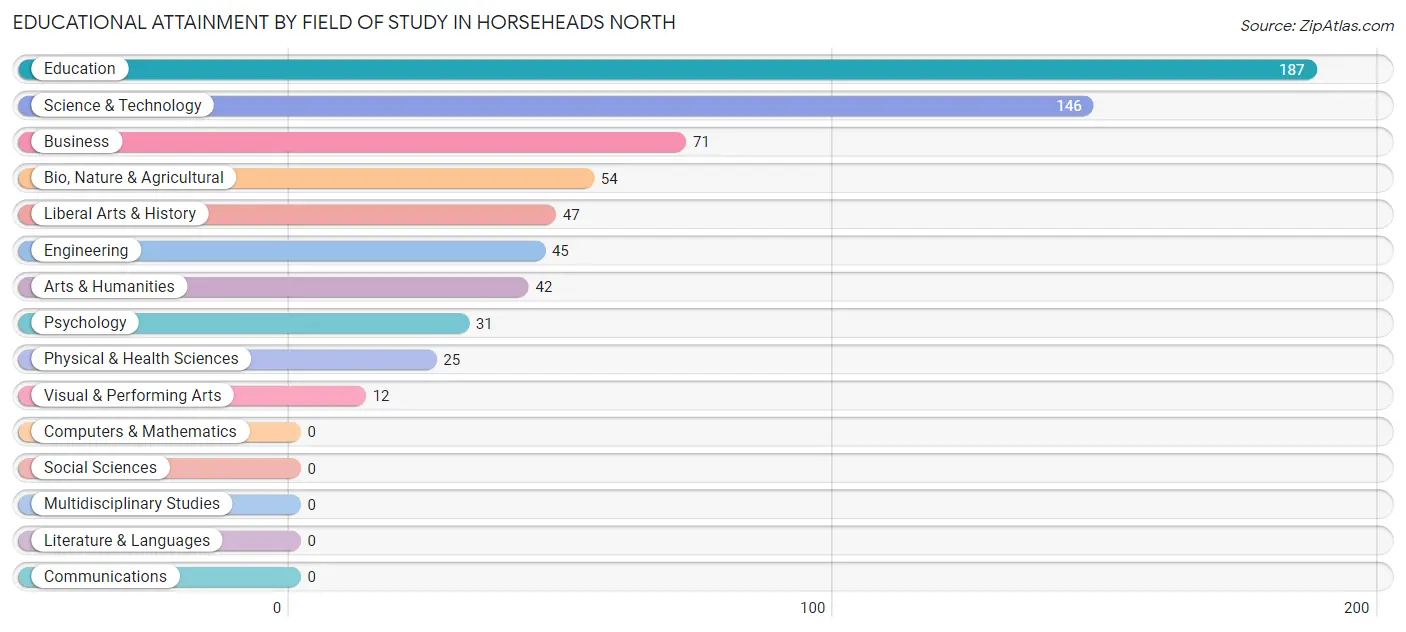
| Field of Study | # Graduates | % Graduates |
| Computers & Mathematics | 0 | 0.0% |
| Bio, Nature & Agricultural | 54 | 8.2% |
| Physical & Health Sciences | 25 | 3.8% |
| Psychology | 31 | 4.7% |
| Social Sciences | 0 | 0.0% |
| Engineering | 45 | 6.8% |
| Multidisciplinary Studies | 0 | 0.0% |
| Science & Technology | 146 | 22.1% |
| Business | 71 | 10.8% |
| Education | 187 | 28.3% |
| Literature & Languages | 0 | 0.0% |
| Liberal Arts & History | 47 | 7.1% |
| Visual & Performing Arts | 12 | 1.8% |
| Communications | 0 | 0.0% |
| Arts & Humanities | 42 | 6.4% |
| Total | 660 | 100.0% |
Transportation & Commute in Horseheads North
Vehicle Availability by Sex in Horseheads North
The most prevalent vehicle ownership categories in Horseheads North are males with 2 vehicles (323, accounting for 53.7%) and females with 2 vehicles (362, making up 55.0%).
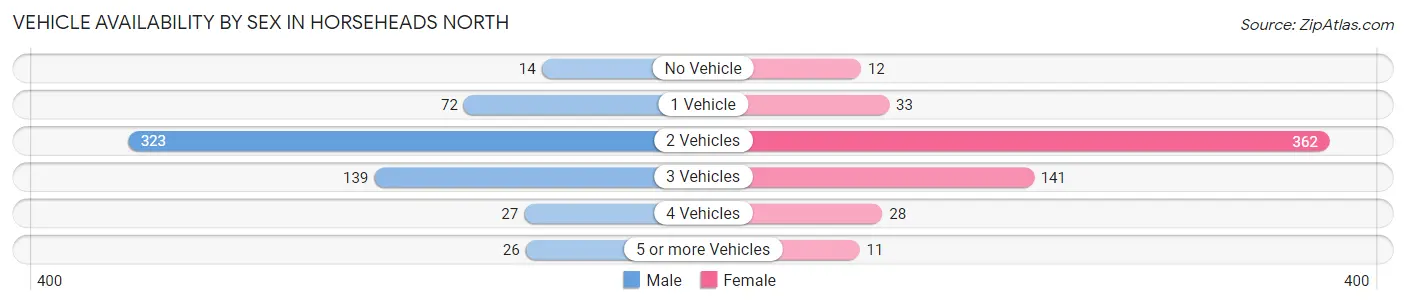
| Vehicles Available | Male | Female |
| No Vehicle | 14 (2.3%) | 12 (2.0%) |
| 1 Vehicle | 72 (12.0%) | 33 (5.6%) |
| 2 Vehicles | 323 (53.7%) | 362 (61.7%) |
| 3 Vehicles | 139 (23.1%) | 141 (24.0%) |
| 4 Vehicles | 27 (4.5%) | 28 (4.8%) |
| 5 or more Vehicles | 26 (4.3%) | 11 (1.9%) |
| Total | 601 (100.0%) | 587 (100.0%) |
Commute Time in Horseheads North
The most frequently occuring commute durations in Horseheads North are 15 to 19 minutes (291 commuters, 25.5%), 10 to 14 minutes (225 commuters, 19.7%), and 5 to 9 minutes (152 commuters, 13.3%).
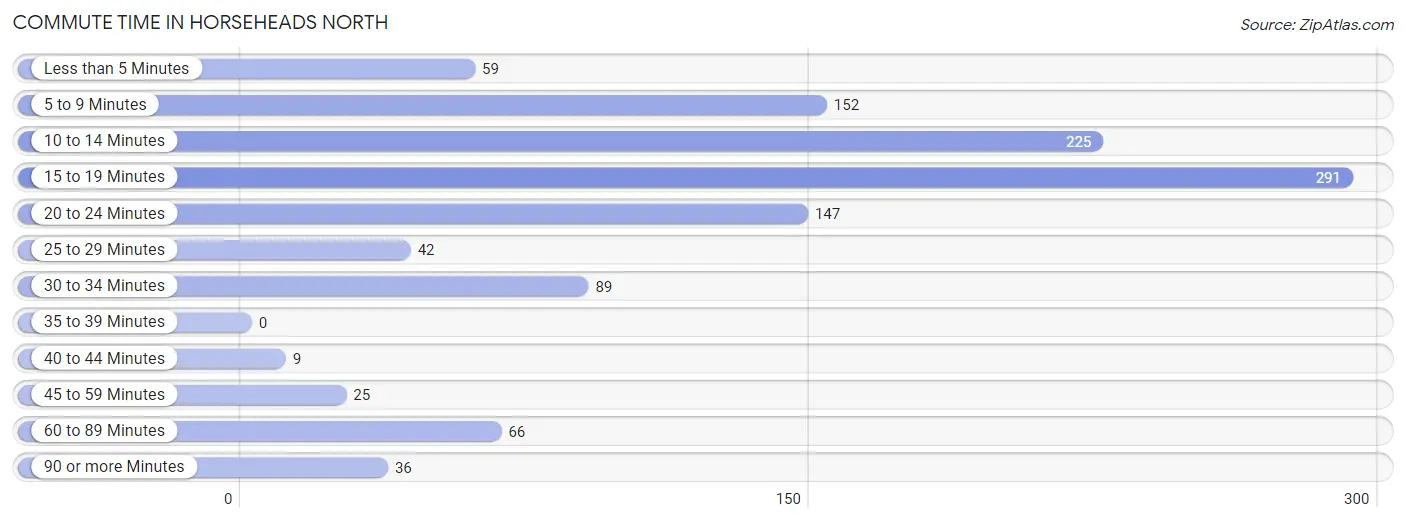
| Commute Time | # Commuters | % Commuters |
| Less than 5 Minutes | 59 | 5.2% |
| 5 to 9 Minutes | 152 | 13.3% |
| 10 to 14 Minutes | 225 | 19.7% |
| 15 to 19 Minutes | 291 | 25.5% |
| 20 to 24 Minutes | 147 | 12.9% |
| 25 to 29 Minutes | 42 | 3.7% |
| 30 to 34 Minutes | 89 | 7.8% |
| 35 to 39 Minutes | 0 | 0.0% |
| 40 to 44 Minutes | 9 | 0.8% |
| 45 to 59 Minutes | 25 | 2.2% |
| 60 to 89 Minutes | 66 | 5.8% |
| 90 or more Minutes | 36 | 3.2% |
Commute Time by Sex in Horseheads North
The most common commute times in Horseheads North are 10 to 14 minutes (120 commuters, 21.0%) for males and 15 to 19 minutes (180 commuters, 31.5%) for females.
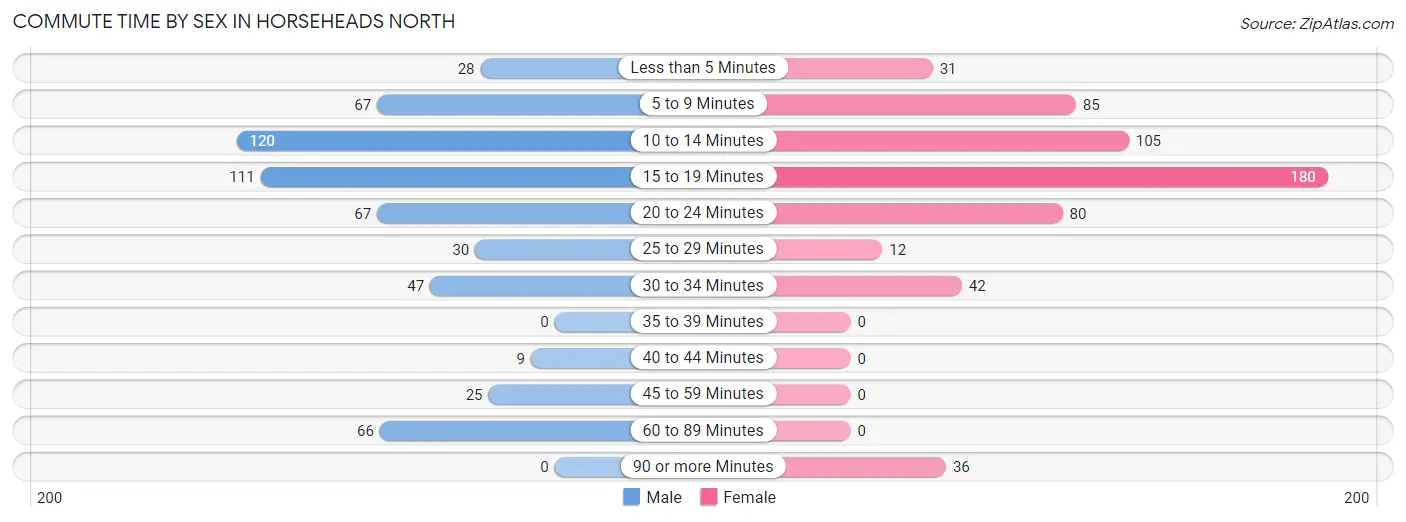
| Commute Time | Male | Female |
| Less than 5 Minutes | 28 (4.9%) | 31 (5.4%) |
| 5 to 9 Minutes | 67 (11.7%) | 85 (14.9%) |
| 10 to 14 Minutes | 120 (21.0%) | 105 (18.4%) |
| 15 to 19 Minutes | 111 (19.5%) | 180 (31.5%) |
| 20 to 24 Minutes | 67 (11.7%) | 80 (14.0%) |
| 25 to 29 Minutes | 30 (5.3%) | 12 (2.1%) |
| 30 to 34 Minutes | 47 (8.3%) | 42 (7.4%) |
| 35 to 39 Minutes | 0 (0.0%) | 0 (0.0%) |
| 40 to 44 Minutes | 9 (1.6%) | 0 (0.0%) |
| 45 to 59 Minutes | 25 (4.4%) | 0 (0.0%) |
| 60 to 89 Minutes | 66 (11.6%) | 0 (0.0%) |
| 90 or more Minutes | 0 (0.0%) | 36 (6.3%) |
Time of Departure to Work by Sex in Horseheads North
The most frequent times of departure to work in Horseheads North are 7:30 AM to 7:59 AM (123, 21.6%) for males and 7:30 AM to 7:59 AM (168, 29.4%) for females.
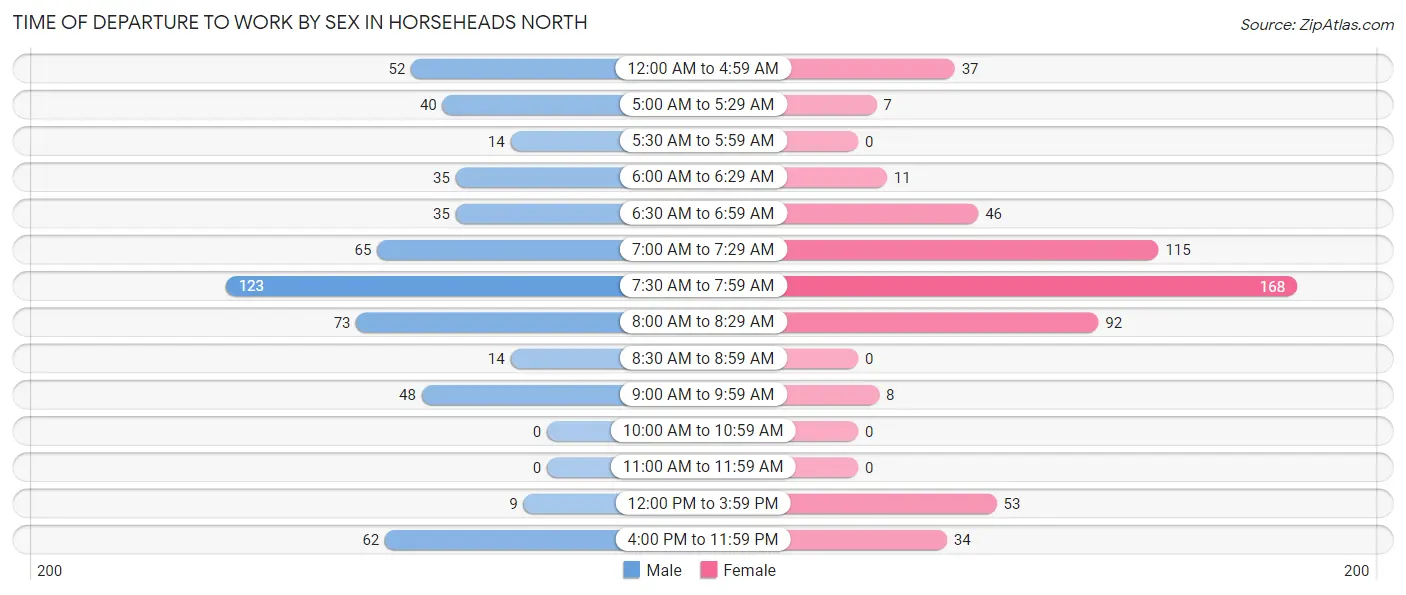
| Time of Departure | Male | Female |
| 12:00 AM to 4:59 AM | 52 (9.1%) | 37 (6.5%) |
| 5:00 AM to 5:29 AM | 40 (7.0%) | 7 (1.2%) |
| 5:30 AM to 5:59 AM | 14 (2.5%) | 0 (0.0%) |
| 6:00 AM to 6:29 AM | 35 (6.1%) | 11 (1.9%) |
| 6:30 AM to 6:59 AM | 35 (6.1%) | 46 (8.1%) |
| 7:00 AM to 7:29 AM | 65 (11.4%) | 115 (20.1%) |
| 7:30 AM to 7:59 AM | 123 (21.6%) | 168 (29.4%) |
| 8:00 AM to 8:29 AM | 73 (12.8%) | 92 (16.1%) |
| 8:30 AM to 8:59 AM | 14 (2.5%) | 0 (0.0%) |
| 9:00 AM to 9:59 AM | 48 (8.4%) | 8 (1.4%) |
| 10:00 AM to 10:59 AM | 0 (0.0%) | 0 (0.0%) |
| 11:00 AM to 11:59 AM | 0 (0.0%) | 0 (0.0%) |
| 12:00 PM to 3:59 PM | 9 (1.6%) | 53 (9.3%) |
| 4:00 PM to 11:59 PM | 62 (10.9%) | 34 (5.9%) |
| Total | 570 (100.0%) | 571 (100.0%) |
Housing Occupancy in Horseheads North
Occupancy by Ownership in Horseheads North
Of the total 1,029 dwellings in Horseheads North, owner-occupied units account for 815 (79.2%), while renter-occupied units make up 214 (20.8%).
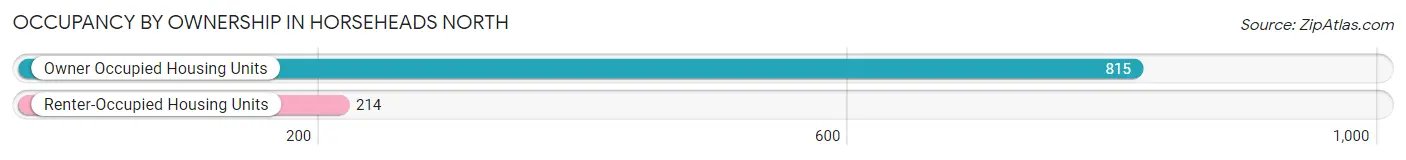
| Occupancy | # Housing Units | % Housing Units |
| Owner Occupied Housing Units | 815 | 79.2% |
| Renter-Occupied Housing Units | 214 | 20.8% |
| Total Occupied Housing Units | 1,029 | 100.0% |
Occupancy by Household Size in Horseheads North
| Household Size | # Housing Units | % Housing Units |
| 1-Person Household | 227 | 22.1% |
| 2-Person Household | 365 | 35.5% |
| 3-Person Household | 194 | 18.9% |
| 4+ Person Household | 243 | 23.6% |
| Total Housing Units | 1,029 | 100.0% |
Occupancy by Ownership by Household Size in Horseheads North
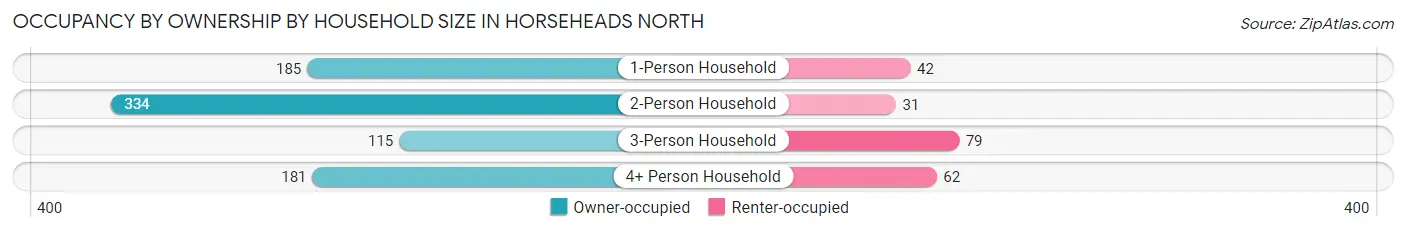
| Household Size | Owner-occupied | Renter-occupied |
| 1-Person Household | 185 (81.5%) | 42 (18.5%) |
| 2-Person Household | 334 (91.5%) | 31 (8.5%) |
| 3-Person Household | 115 (59.3%) | 79 (40.7%) |
| 4+ Person Household | 181 (74.5%) | 62 (25.5%) |
| Total Housing Units | 815 (79.2%) | 214 (20.8%) |
Occupancy by Educational Attainment in Horseheads North
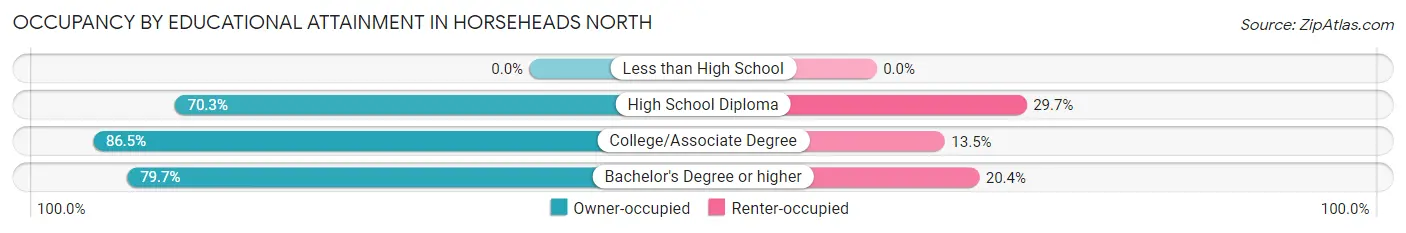
| Household Size | Owner-occupied | Renter-occupied |
| Less than High School | 0 (0.0%) | 0 (0.0%) |
| High School Diploma | 189 (70.3%) | 80 (29.7%) |
| College/Associate Degree | 262 (86.5%) | 41 (13.5%) |
| Bachelor's Degree or higher | 364 (79.6%) | 93 (20.3%) |
Occupancy by Age of Householder in Horseheads North
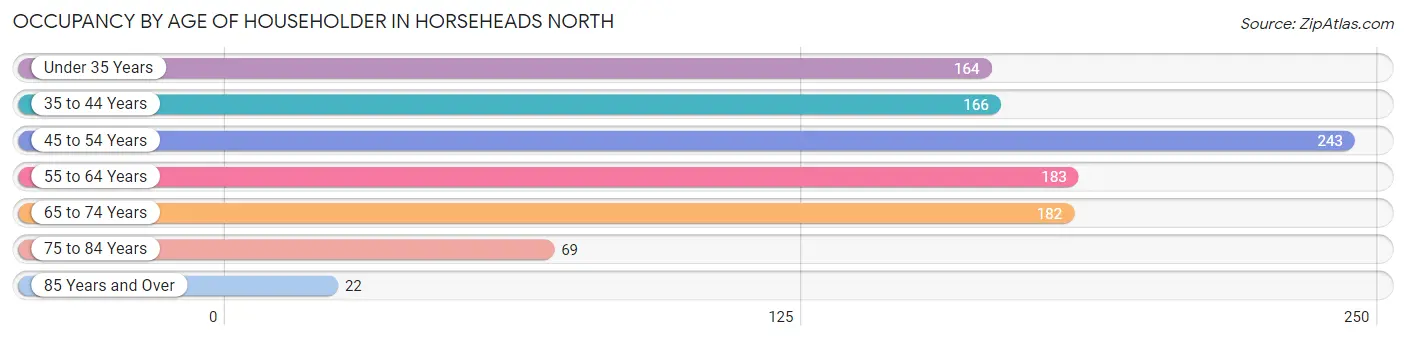
| Age Bracket | # Households | % Households |
| Under 35 Years | 164 | 15.9% |
| 35 to 44 Years | 166 | 16.1% |
| 45 to 54 Years | 243 | 23.6% |
| 55 to 64 Years | 183 | 17.8% |
| 65 to 74 Years | 182 | 17.7% |
| 75 to 84 Years | 69 | 6.7% |
| 85 Years and Over | 22 | 2.1% |
| Total | 1,029 | 100.0% |
Housing Finances in Horseheads North
Median Income by Occupancy in Horseheads North
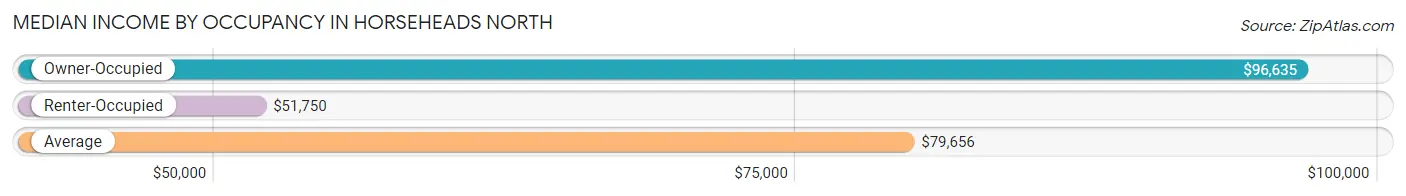
| Occupancy Type | # Households | Median Income |
| Owner-Occupied | 815 (79.2%) | $96,635 |
| Renter-Occupied | 214 (20.8%) | $51,750 |
| Average | 1,029 (100.0%) | $79,656 |
Occupancy by Householder Income Bracket in Horseheads North
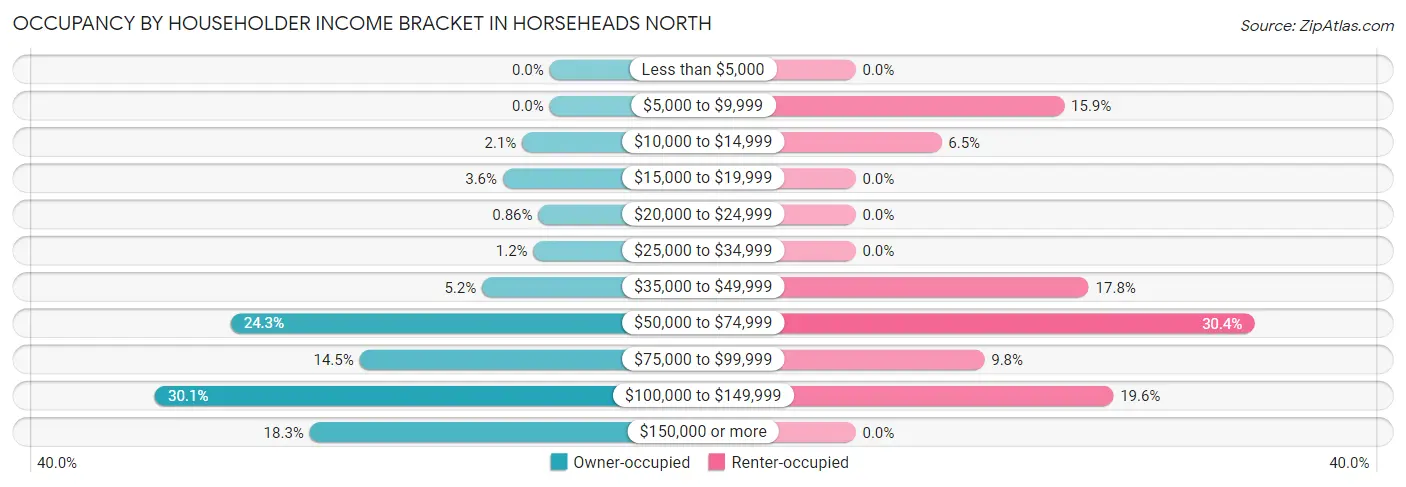
| Income Bracket | Owner-occupied | Renter-occupied |
| Less than $5,000 | 0 (0.0%) | 0 (0.0%) |
| $5,000 to $9,999 | 0 (0.0%) | 34 (15.9%) |
| $10,000 to $14,999 | 17 (2.1%) | 14 (6.5%) |
| $15,000 to $19,999 | 29 (3.6%) | 0 (0.0%) |
| $20,000 to $24,999 | 7 (0.9%) | 0 (0.0%) |
| $25,000 to $34,999 | 10 (1.2%) | 0 (0.0%) |
| $35,000 to $49,999 | 42 (5.1%) | 38 (17.8%) |
| $50,000 to $74,999 | 198 (24.3%) | 65 (30.4%) |
| $75,000 to $99,999 | 118 (14.5%) | 21 (9.8%) |
| $100,000 to $149,999 | 245 (30.1%) | 42 (19.6%) |
| $150,000 or more | 149 (18.3%) | 0 (0.0%) |
| Total | 815 (100.0%) | 214 (100.0%) |
Monthly Housing Cost Tiers in Horseheads North
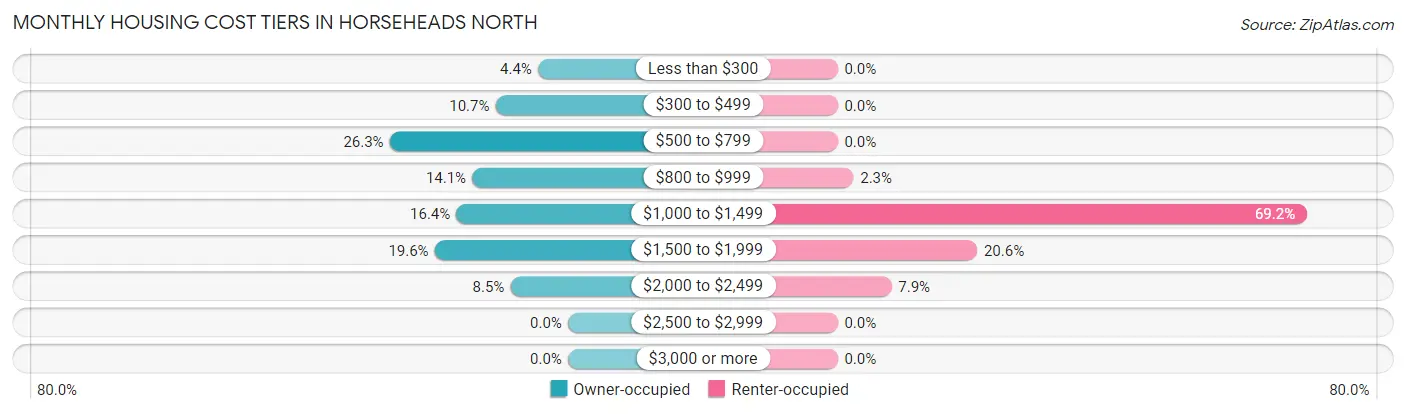
| Monthly Cost | Owner-occupied | Renter-occupied |
| Less than $300 | 36 (4.4%) | 0 (0.0%) |
| $300 to $499 | 87 (10.7%) | 0 (0.0%) |
| $500 to $799 | 214 (26.3%) | 0 (0.0%) |
| $800 to $999 | 115 (14.1%) | 5 (2.3%) |
| $1,000 to $1,499 | 134 (16.4%) | 148 (69.2%) |
| $1,500 to $1,999 | 160 (19.6%) | 44 (20.6%) |
| $2,000 to $2,499 | 69 (8.5%) | 17 (7.9%) |
| $2,500 to $2,999 | 0 (0.0%) | 0 (0.0%) |
| $3,000 or more | 0 (0.0%) | 0 (0.0%) |
| Total | 815 (100.0%) | 214 (100.0%) |
Physical Housing Characteristics in Horseheads North
Housing Structures in Horseheads North
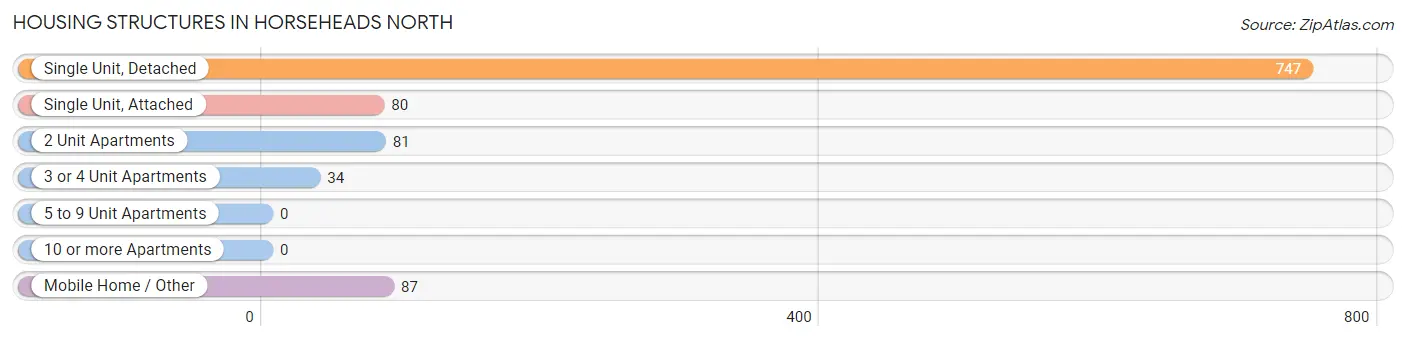
| Structure Type | # Housing Units | % Housing Units |
| Single Unit, Detached | 747 | 72.6% |
| Single Unit, Attached | 80 | 7.8% |
| 2 Unit Apartments | 81 | 7.9% |
| 3 or 4 Unit Apartments | 34 | 3.3% |
| 5 to 9 Unit Apartments | 0 | 0.0% |
| 10 or more Apartments | 0 | 0.0% |
| Mobile Home / Other | 87 | 8.5% |
| Total | 1,029 | 100.0% |
Housing Structures by Occupancy in Horseheads North
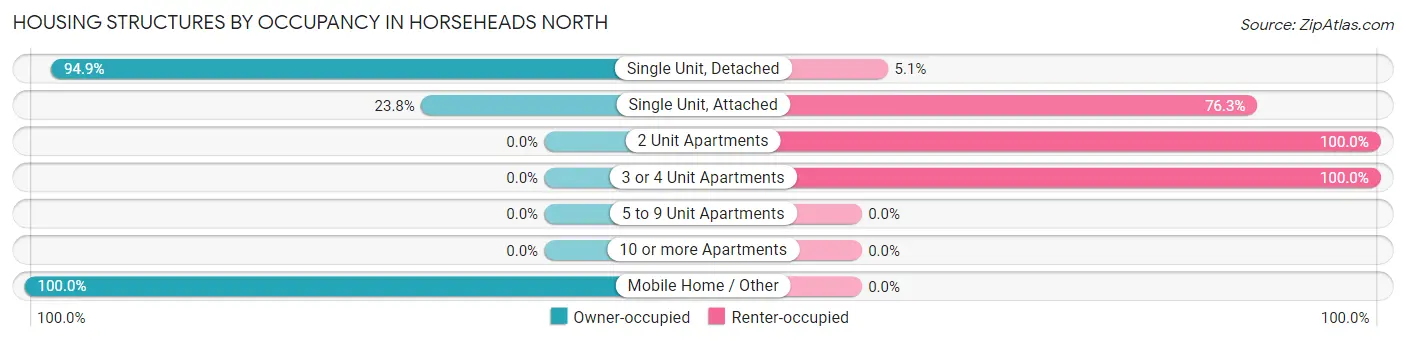
| Structure Type | Owner-occupied | Renter-occupied |
| Single Unit, Detached | 709 (94.9%) | 38 (5.1%) |
| Single Unit, Attached | 19 (23.7%) | 61 (76.2%) |
| 2 Unit Apartments | 0 (0.0%) | 81 (100.0%) |
| 3 or 4 Unit Apartments | 0 (0.0%) | 34 (100.0%) |
| 5 to 9 Unit Apartments | 0 (0.0%) | 0 (0.0%) |
| 10 or more Apartments | 0 (0.0%) | 0 (0.0%) |
| Mobile Home / Other | 87 (100.0%) | 0 (0.0%) |
| Total | 815 (79.2%) | 214 (20.8%) |
Housing Structures by Number of Rooms in Horseheads North
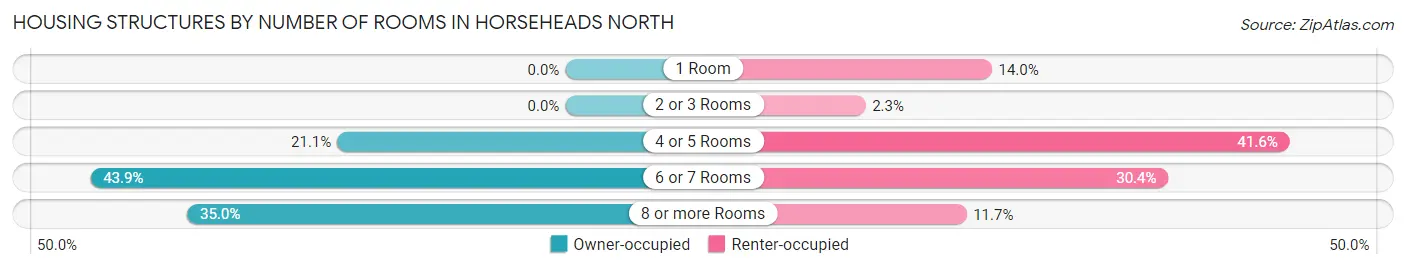
| Number of Rooms | Owner-occupied | Renter-occupied |
| 1 Room | 0 (0.0%) | 30 (14.0%) |
| 2 or 3 Rooms | 0 (0.0%) | 5 (2.3%) |
| 4 or 5 Rooms | 172 (21.1%) | 89 (41.6%) |
| 6 or 7 Rooms | 358 (43.9%) | 65 (30.4%) |
| 8 or more Rooms | 285 (35.0%) | 25 (11.7%) |
| Total | 815 (100.0%) | 214 (100.0%) |
Housing Structure by Heating Type in Horseheads North
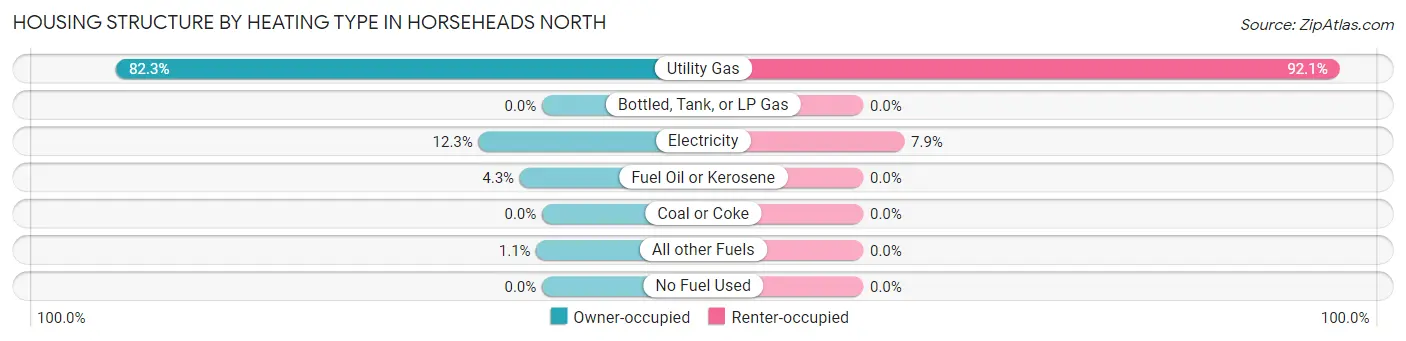
| Heating Type | Owner-occupied | Renter-occupied |
| Utility Gas | 671 (82.3%) | 197 (92.1%) |
| Bottled, Tank, or LP Gas | 0 (0.0%) | 0 (0.0%) |
| Electricity | 100 (12.3%) | 17 (7.9%) |
| Fuel Oil or Kerosene | 35 (4.3%) | 0 (0.0%) |
| Coal or Coke | 0 (0.0%) | 0 (0.0%) |
| All other Fuels | 9 (1.1%) | 0 (0.0%) |
| No Fuel Used | 0 (0.0%) | 0 (0.0%) |
| Total | 815 (100.0%) | 214 (100.0%) |
Household Vehicle Usage in Horseheads North
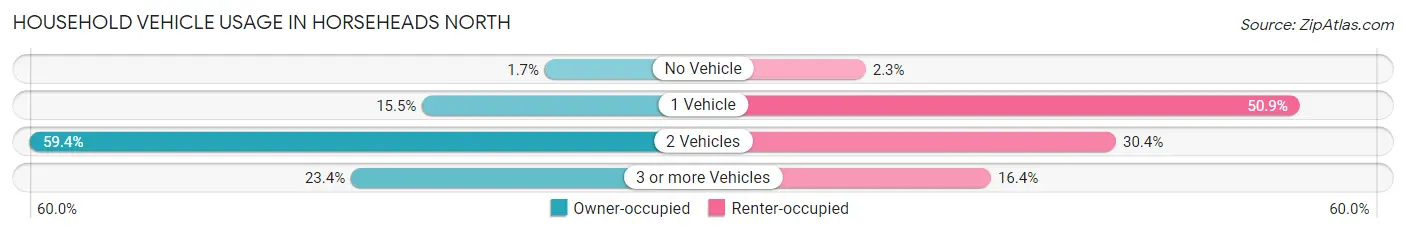
| Vehicles per Household | Owner-occupied | Renter-occupied |
| No Vehicle | 14 (1.7%) | 5 (2.3%) |
| 1 Vehicle | 126 (15.5%) | 109 (50.9%) |
| 2 Vehicles | 484 (59.4%) | 65 (30.4%) |
| 3 or more Vehicles | 191 (23.4%) | 35 (16.4%) |
| Total | 815 (100.0%) | 214 (100.0%) |
Real Estate & Mortgages in Horseheads North
Real Estate and Mortgage Overview in Horseheads North
| Characteristic | Without Mortgage | With Mortgage |
| Housing Units | 444 | 371 |
| Median Property Value | $190,600 | $191,800 |
| Median Household Income | $75,682 | $88 |
| Monthly Housing Costs | $652 | $0 |
| Real Estate Taxes | $4,891 | $17 |
Property Value by Mortgage Status in Horseheads North
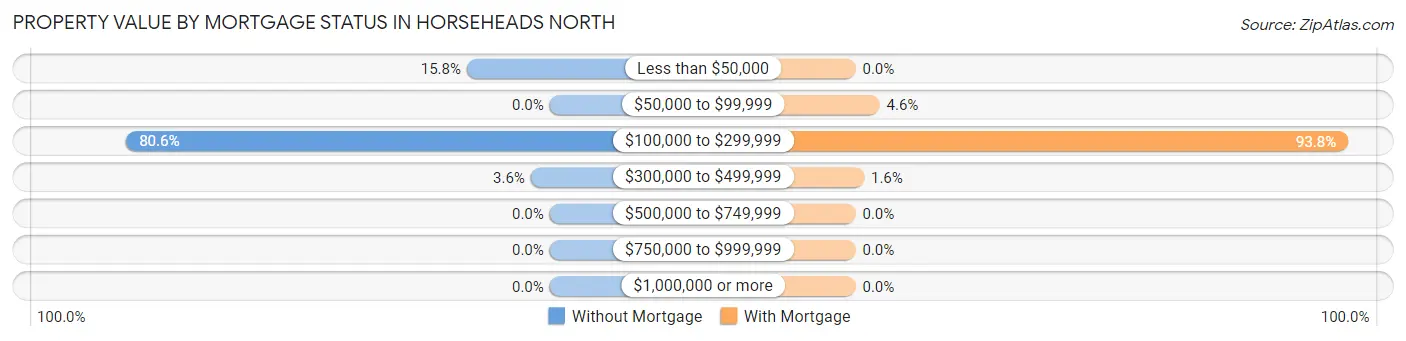
| Property Value | Without Mortgage | With Mortgage |
| Less than $50,000 | 70 (15.8%) | 0 (0.0%) |
| $50,000 to $99,999 | 0 (0.0%) | 17 (4.6%) |
| $100,000 to $299,999 | 358 (80.6%) | 348 (93.8%) |
| $300,000 to $499,999 | 16 (3.6%) | 6 (1.6%) |
| $500,000 to $749,999 | 0 (0.0%) | 0 (0.0%) |
| $750,000 to $999,999 | 0 (0.0%) | 0 (0.0%) |
| $1,000,000 or more | 0 (0.0%) | 0 (0.0%) |
| Total | 444 (100.0%) | 371 (100.0%) |
Household Income by Mortgage Status in Horseheads North
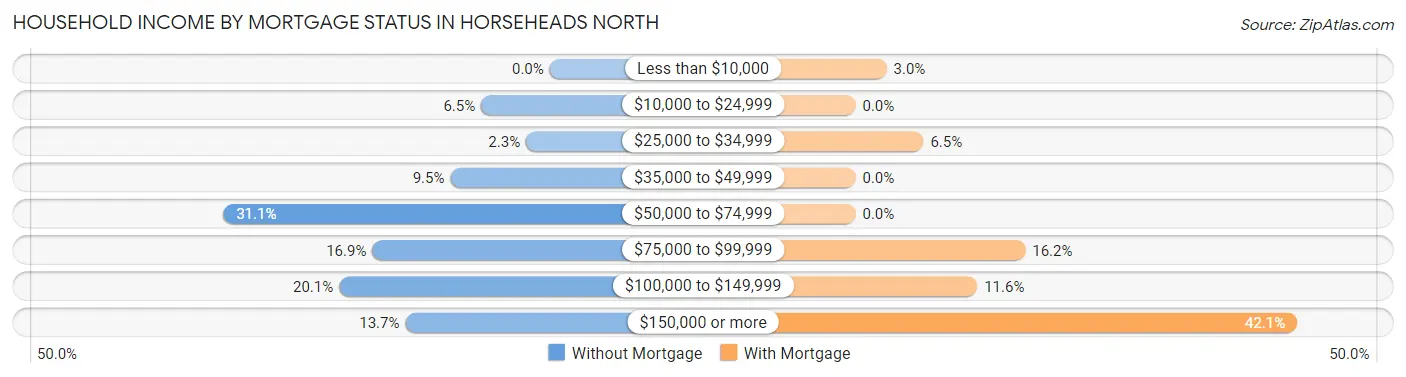
| Household Income | Without Mortgage | With Mortgage |
| Less than $10,000 | 0 (0.0%) | 11 (3.0%) |
| $10,000 to $24,999 | 29 (6.5%) | 0 (0.0%) |
| $25,000 to $34,999 | 10 (2.2%) | 24 (6.5%) |
| $35,000 to $49,999 | 42 (9.5%) | 0 (0.0%) |
| $50,000 to $74,999 | 138 (31.1%) | 0 (0.0%) |
| $75,000 to $99,999 | 75 (16.9%) | 60 (16.2%) |
| $100,000 to $149,999 | 89 (20.1%) | 43 (11.6%) |
| $150,000 or more | 61 (13.7%) | 156 (42.0%) |
| Total | 444 (100.0%) | 371 (100.0%) |
Property Value to Household Income Ratio in Horseheads North
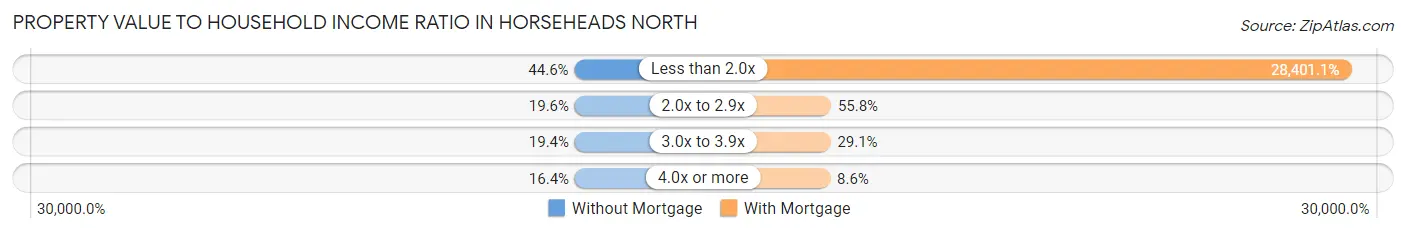
| Value-to-Income Ratio | Without Mortgage | With Mortgage |
| Less than 2.0x | 198 (44.6%) | 105,368 (28,401.1%) |
| 2.0x to 2.9x | 87 (19.6%) | 207 (55.8%) |
| 3.0x to 3.9x | 86 (19.4%) | 108 (29.1%) |
| 4.0x or more | 73 (16.4%) | 32 (8.6%) |
| Total | 444 (100.0%) | 371 (100.0%) |
Real Estate Taxes by Mortgage Status in Horseheads North
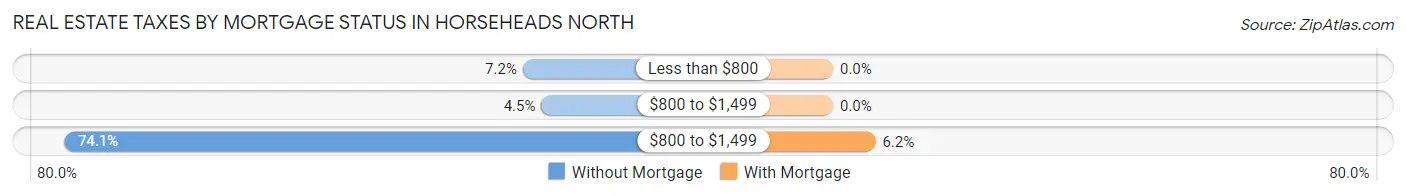
| Property Taxes | Without Mortgage | With Mortgage |
| Less than $800 | 32 (7.2%) | 0 (0.0%) |
| $800 to $1,499 | 20 (4.5%) | 0 (0.0%) |
| $800 to $1,499 | 329 (74.1%) | 23 (6.2%) |
| Total | 444 (100.0%) | 371 (100.0%) |
Health & Disability in Horseheads North
Health Insurance Coverage by Age in Horseheads North
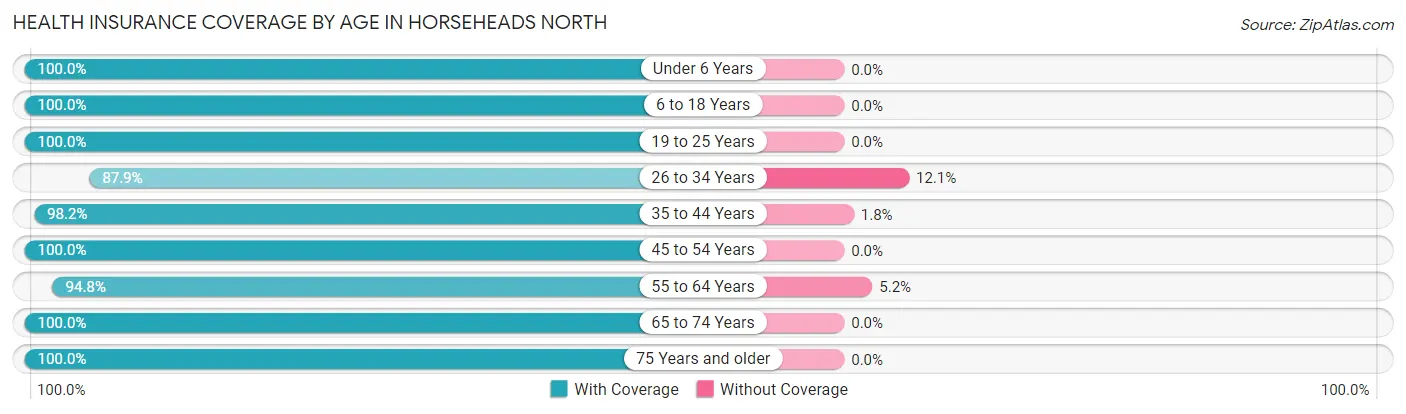
| Age Bracket | With Coverage | Without Coverage |
| Under 6 Years | 269 (100.0%) | 0 (0.0%) |
| 6 to 18 Years | 512 (100.0%) | 0 (0.0%) |
| 19 to 25 Years | 157 (100.0%) | 0 (0.0%) |
| 26 to 34 Years | 233 (87.9%) | 32 (12.1%) |
| 35 to 44 Years | 331 (98.2%) | 6 (1.8%) |
| 45 to 54 Years | 393 (100.0%) | 0 (0.0%) |
| 55 to 64 Years | 308 (94.8%) | 17 (5.2%) |
| 65 to 74 Years | 343 (100.0%) | 0 (0.0%) |
| 75 Years and older | 106 (100.0%) | 0 (0.0%) |
| Total | 2,652 (98.0%) | 55 (2.0%) |
Health Insurance Coverage by Citizenship Status in Horseheads North
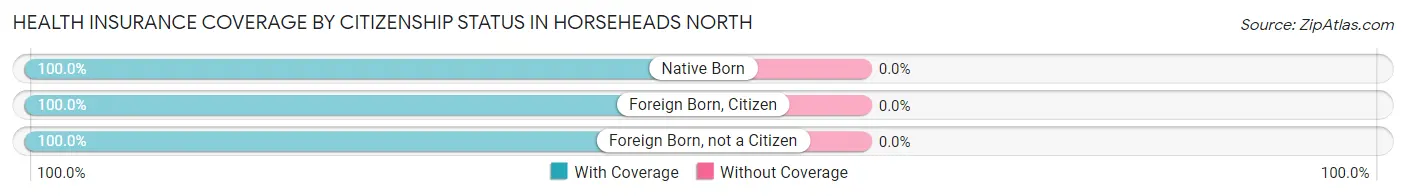
| Citizenship Status | With Coverage | Without Coverage |
| Native Born | 269 (100.0%) | 0 (0.0%) |
| Foreign Born, Citizen | 512 (100.0%) | 0 (0.0%) |
| Foreign Born, not a Citizen | 157 (100.0%) | 0 (0.0%) |
Health Insurance Coverage by Household Income in Horseheads North
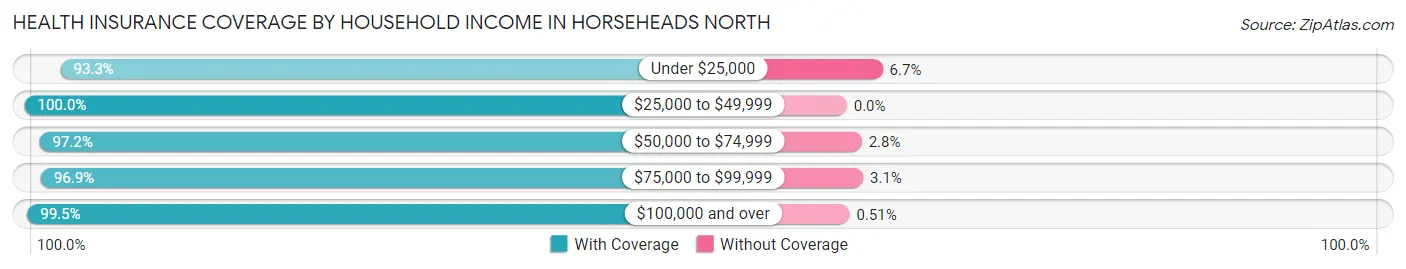
| Household Income | With Coverage | Without Coverage |
| Under $25,000 | 236 (93.3%) | 17 (6.7%) |
| $25,000 to $49,999 | 149 (100.0%) | 0 (0.0%) |
| $50,000 to $74,999 | 659 (97.2%) | 19 (2.8%) |
| $75,000 to $99,999 | 412 (96.9%) | 13 (3.1%) |
| $100,000 and over | 1,177 (99.5%) | 6 (0.5%) |
Public vs Private Health Insurance Coverage by Age in Horseheads North
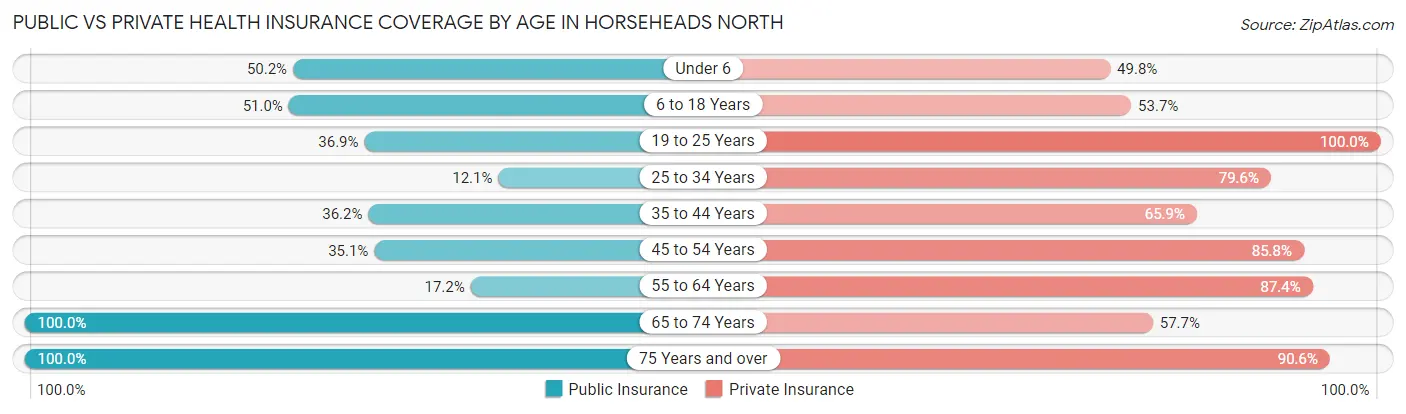
| Age Bracket | Public Insurance | Private Insurance |
| Under 6 | 135 (50.2%) | 134 (49.8%) |
| 6 to 18 Years | 261 (51.0%) | 275 (53.7%) |
| 19 to 25 Years | 58 (36.9%) | 157 (100.0%) |
| 25 to 34 Years | 32 (12.1%) | 211 (79.6%) |
| 35 to 44 Years | 122 (36.2%) | 222 (65.9%) |
| 45 to 54 Years | 138 (35.1%) | 337 (85.8%) |
| 55 to 64 Years | 56 (17.2%) | 284 (87.4%) |
| 65 to 74 Years | 343 (100.0%) | 198 (57.7%) |
| 75 Years and over | 106 (100.0%) | 96 (90.6%) |
| Total | 1,251 (46.2%) | 1,914 (70.7%) |
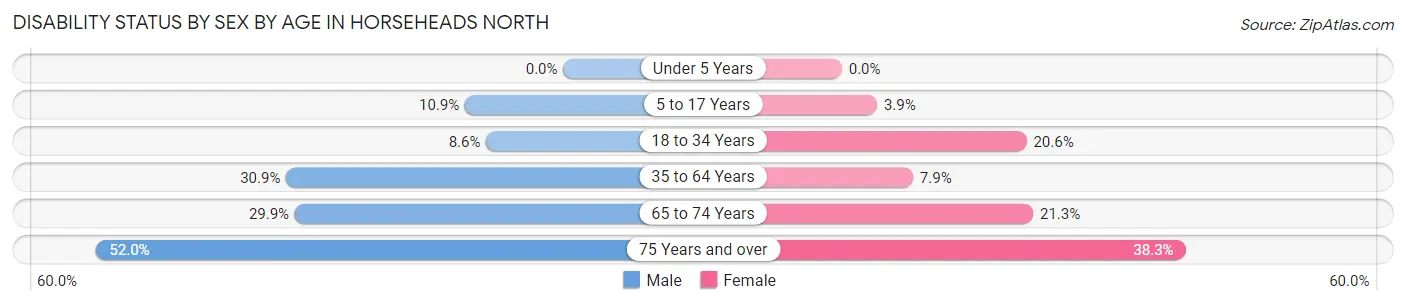
Disability Status by Sex by Age in Horseheads North
| Age Bracket | Male | Female |
| Under 5 Years | 0 (0.0%) | 0 (0.0%) |
| 5 to 17 Years | 29 (10.9%) | 8 (3.9%) |
| 18 to 34 Years | 20 (8.6%) | 58 (20.6%) |
| 35 to 64 Years | 162 (30.9%) | 42 (7.9%) |
| 65 to 74 Years | 52 (29.9%) | 36 (21.3%) |
| 75 Years and over | 13 (52.0%) | 31 (38.3%) |
Disability Class by Sex by Age in Horseheads North
Disability Class: Hearing Difficulty
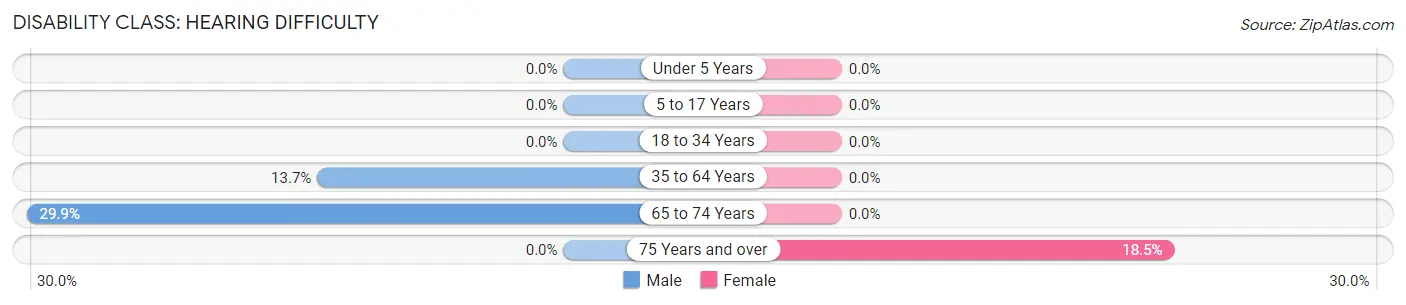
| Age Bracket | Male | Female |
| Under 5 Years | 0 (0.0%) | 0 (0.0%) |
| 5 to 17 Years | 0 (0.0%) | 0 (0.0%) |
| 18 to 34 Years | 0 (0.0%) | 0 (0.0%) |
| 35 to 64 Years | 72 (13.7%) | 0 (0.0%) |
| 65 to 74 Years | 52 (29.9%) | 0 (0.0%) |
| 75 Years and over | 0 (0.0%) | 15 (18.5%) |
Disability Class: Vision Difficulty
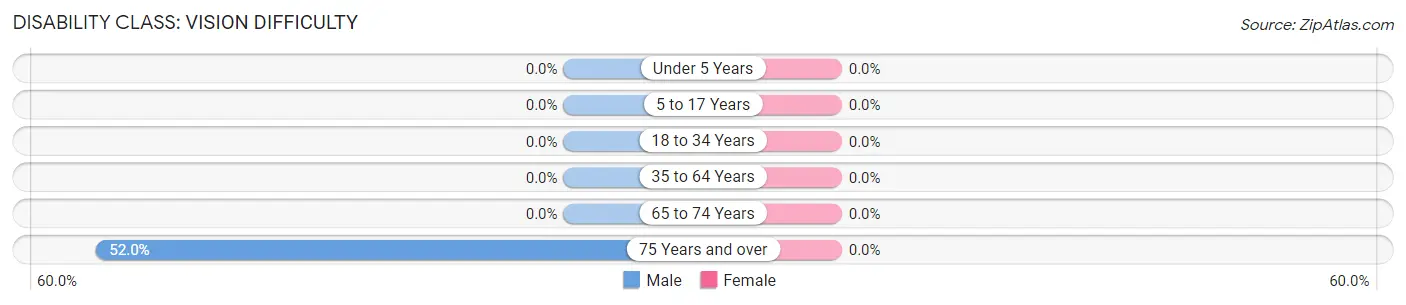
| Age Bracket | Male | Female |
| Under 5 Years | 0 (0.0%) | 0 (0.0%) |
| 5 to 17 Years | 0 (0.0%) | 0 (0.0%) |
| 18 to 34 Years | 0 (0.0%) | 0 (0.0%) |
| 35 to 64 Years | 0 (0.0%) | 0 (0.0%) |
| 65 to 74 Years | 0 (0.0%) | 0 (0.0%) |
| 75 Years and over | 13 (52.0%) | 0 (0.0%) |
Disability Class: Cognitive Difficulty
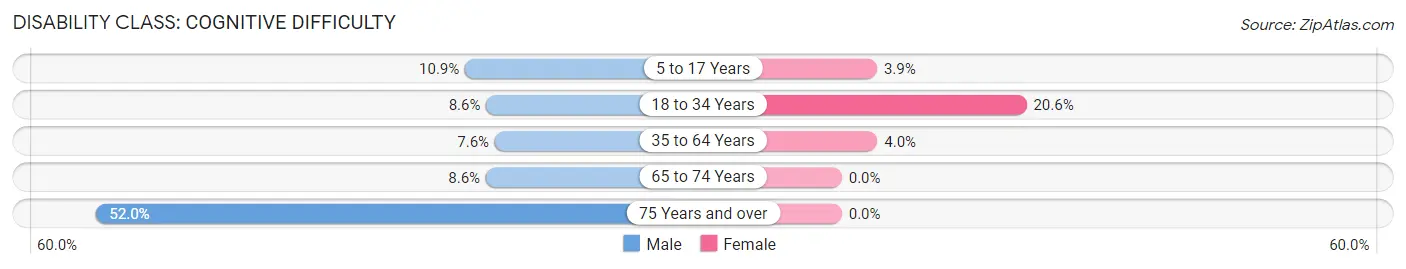
| Age Bracket | Male | Female |
| 5 to 17 Years | 29 (10.9%) | 8 (3.9%) |
| 18 to 34 Years | 20 (8.6%) | 58 (20.6%) |
| 35 to 64 Years | 40 (7.6%) | 21 (4.0%) |
| 65 to 74 Years | 15 (8.6%) | 0 (0.0%) |
| 75 Years and over | 13 (52.0%) | 0 (0.0%) |
Disability Class: Ambulatory Difficulty
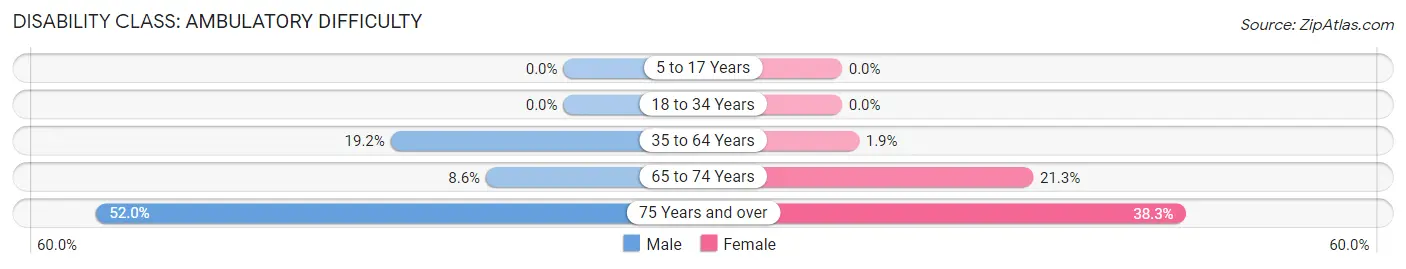
| Age Bracket | Male | Female |
| 5 to 17 Years | 0 (0.0%) | 0 (0.0%) |
| 18 to 34 Years | 0 (0.0%) | 0 (0.0%) |
| 35 to 64 Years | 101 (19.2%) | 10 (1.9%) |
| 65 to 74 Years | 15 (8.6%) | 36 (21.3%) |
| 75 Years and over | 13 (52.0%) | 31 (38.3%) |
Disability Class: Self-Care Difficulty
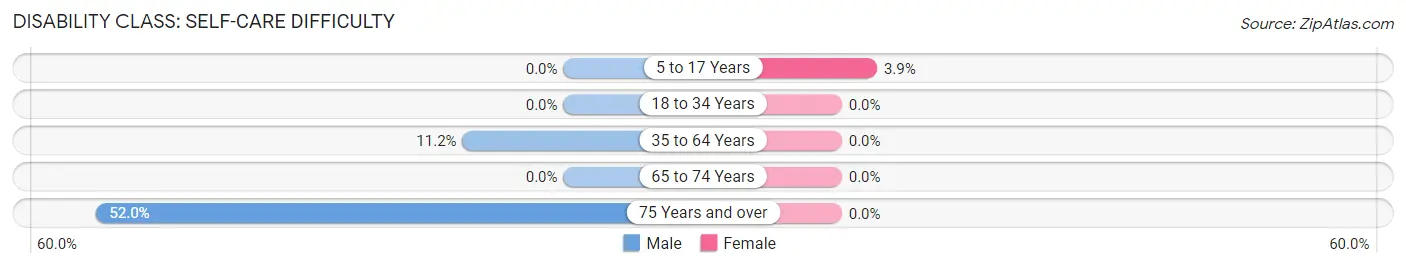
| Age Bracket | Male | Female |
| 5 to 17 Years | 0 (0.0%) | 8 (3.9%) |
| 18 to 34 Years | 0 (0.0%) | 0 (0.0%) |
| 35 to 64 Years | 59 (11.2%) | 0 (0.0%) |
| 65 to 74 Years | 0 (0.0%) | 0 (0.0%) |
| 75 Years and over | 13 (52.0%) | 0 (0.0%) |
Technology Access in Horseheads North
Computing Device Access in Horseheads North
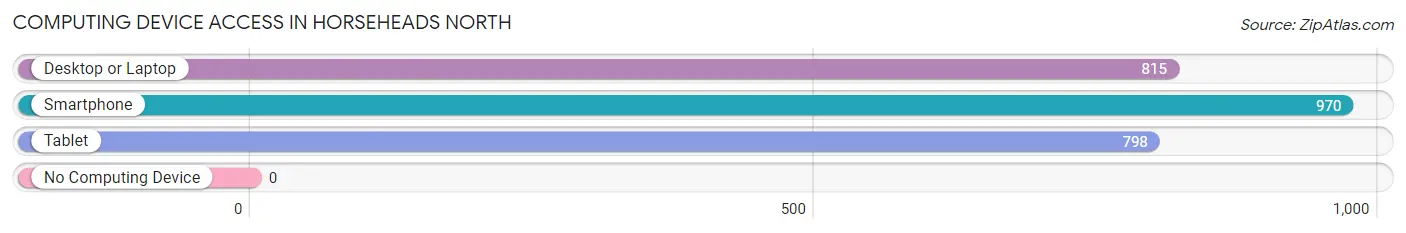
| Device Type | # Households | % Households |
| Desktop or Laptop | 815 | 79.2% |
| Smartphone | 970 | 94.3% |
| Tablet | 798 | 77.5% |
| No Computing Device | 0 | 0.0% |
| Total | 1,029 | 100.0% |
Internet Access in Horseheads North
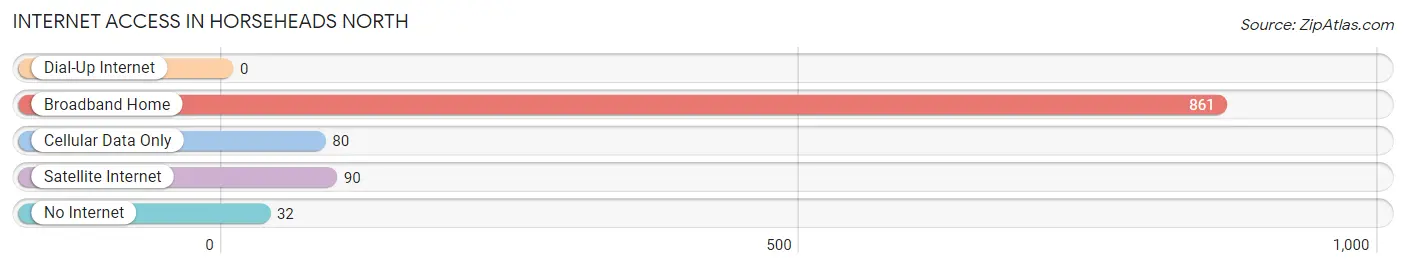
| Internet Type | # Households | % Households |
| Dial-Up Internet | 0 | 0.0% |
| Broadband Home | 861 | 83.7% |
| Cellular Data Only | 80 | 7.8% |
| Satellite Internet | 90 | 8.7% |
| No Internet | 32 | 3.1% |
| Total | 1,029 | 100.0% |
Horseheads North Summary
Horseheads North, NY is a small hamlet located in Chemung County, New York. It is part of the Elmira-Corning Metropolitan Statistical Area and is situated on the north side of the Chemung River. The hamlet is located approximately 10 miles north of the city of Elmira and is bordered by the towns of Big Flats and Veteran.
History
Horseheads North was first settled in the late 1700s by a group of settlers from Connecticut. The settlers were attracted to the area due to its fertile soil and abundant natural resources. The hamlet was originally known as “Horseheads” and was named after the large number of horses that were used to transport goods and people in the area.
In 1808, the hamlet was officially incorporated as the Town of Horseheads. The town was divided into two parts, Horseheads North and Horseheads South. The two parts were separated by the Chemung River.
In 1854, the Town of Horseheads was dissolved and the two parts were reincorporated as the Town of Big Flats and the Town of Veteran. Horseheads North was then incorporated as a village in 1872.
Geography
Horseheads North is located in the Finger Lakes region of New York State. The hamlet is situated on the north side of the Chemung River and is bordered by the towns of Big Flats and Veteran. The hamlet is located approximately 10 miles north of the city of Elmira.
The terrain of Horseheads North is mostly flat with some rolling hills. The hamlet is located in a temperate climate zone and experiences four distinct seasons. The average annual temperature is around 50 degrees Fahrenheit.
Economy
Horseheads North is a small hamlet with a population of just over 1,000 people. The hamlet is primarily a residential community with a few small businesses. The primary industries in the area are agriculture and tourism.
Agriculture is the main economic activity in Horseheads North. The hamlet is home to several farms that produce a variety of crops, including corn, soybeans, hay, and vegetables. The hamlet is also home to several wineries and breweries.
Tourism is also an important part of the local economy. The hamlet is home to several attractions, including the Chemung River, the Horseheads North Historical Society, and the Horseheads North Nature Center.
Demographics
As of the 2010 census, the population of Horseheads North was 1,072. The population is primarily white (94.3%) with a small percentage of African Americans (2.2%) and Hispanics (2.1%). The median household income is $45,000 and the median age is 43.
Horseheads North is a small hamlet with a rich history and a vibrant economy. The hamlet is home to several farms, wineries, and breweries, as well as a variety of attractions. The hamlet is also home to a diverse population with a median age of 43 and a median household income of $45,000.
Common Questions
What is Per Capita Income in Horseheads North?
Per Capita income in Horseheads North is $34,178.
What is the Median Family Income in Horseheads North?
Median Family Income in Horseheads North is $81,012.
What is the Median Household income in Horseheads North?
Median Household Income in Horseheads North is $79,656.
What is Income or Wage Gap in Horseheads North?
Income or Wage Gap in Horseheads North is 1.7%.
Women in Horseheads North earn 98.3 cents for every dollar earned by a man.
What is Inequality or Gini Index in Horseheads North?
Inequality or Gini Index in Horseheads North is 0.30.
What is the Total Population of Horseheads North?
Total Population of Horseheads North is 2,707.
What is the Total Male Population of Horseheads North?
Total Male Population of Horseheads North is 1,290.
What is the Total Female Population of Horseheads North?
Total Female Population of Horseheads North is 1,417.
What is the Ratio of Males per 100 Females in Horseheads North?
There are 91.04 Males per 100 Females in Horseheads North.
What is the Ratio of Females per 100 Males in Horseheads North?
There are 109.84 Females per 100 Males in Horseheads North.
What is the Median Population Age in Horseheads North?
Median Population Age in Horseheads North is 39.2 Years.
What is the Average Family Size in Horseheads North
Average Family Size in Horseheads North is 3.0 People.
What is the Average Household Size in Horseheads North
Average Household Size in Horseheads North is 2.6 People.
How Large is the Labor Force in Horseheads North?
There are 1,233 People in the Labor Forcein in Horseheads North.
What is the Percentage of People in the Labor Force in Horseheads North?
60.5% of People are in the Labor Force in Horseheads North.
What is the Unemployment Rate in Horseheads North?
Unemployment Rate in Horseheads North is 0.8%.