Lake Mohegan, NY Map & Demographics
Lake Mohegan Map
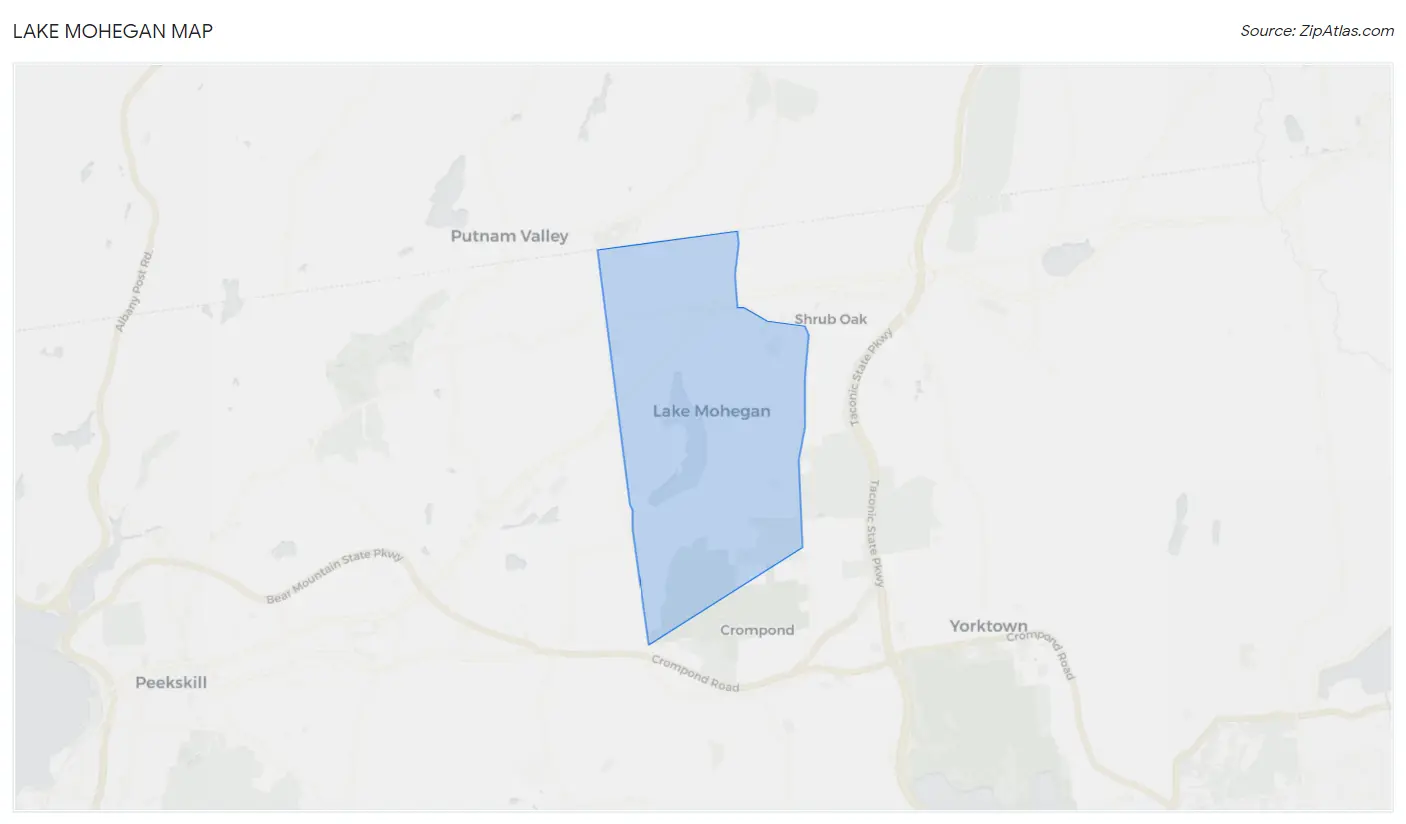
Lake Mohegan Overview
$64,936
PER CAPITA INCOME
$189,491
AVG FAMILY INCOME
$156,528
AVG HOUSEHOLD INCOME
34.9%
WAGE / INCOME GAP [ % ]
65.1¢/ $1
WAGE / INCOME GAP [ $ ]
0.39
INEQUALITY / GINI INDEX
5,938
TOTAL POPULATION
3,045
MALE POPULATION
2,893
FEMALE POPULATION
105.25
MALES / 100 FEMALES
95.01
FEMALES / 100 MALES
38.1
MEDIAN AGE
3.1
AVG FAMILY SIZE
2.7
AVG HOUSEHOLD SIZE
3,412
LABOR FORCE [ PEOPLE ]
69.2%
PERCENT IN LABOR FORCE
2.7%
UNEMPLOYMENT RATE
Income in Lake Mohegan
Income Overview in Lake Mohegan
Per Capita Income in Lake Mohegan is $64,936, while median incomes of families and households are $189,491 and $156,528 respectively.
| Characteristic | Number | Measure |
| Per Capita Income | 5,938 | $64,936 |
| Median Family Income | 1,575 | $189,491 |
| Mean Family Income | 1,575 | $187,427 |
| Median Household Income | 2,123 | $156,528 |
| Mean Household Income | 2,123 | $174,016 |
| Income Deficit | 1,575 | $0 |
| Wage / Income Gap (%) | 5,938 | 34.93% |
| Wage / Income Gap ($) | 5,938 | 65.07¢ per $1 |
| Gini / Inequality Index | 5,938 | 0.39 |
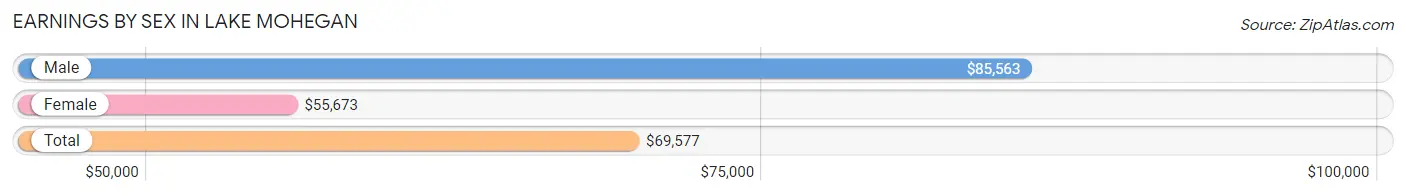
Earnings by Sex in Lake Mohegan
Average Earnings in Lake Mohegan are $69,577, $85,563 for men and $55,673 for women, a difference of 34.9%.
| Sex | Number | Average Earnings |
| Male | 1,841 (52.7%) | $85,563 |
| Female | 1,654 (47.3%) | $55,673 |
| Total | 3,495 (100.0%) | $69,577 |
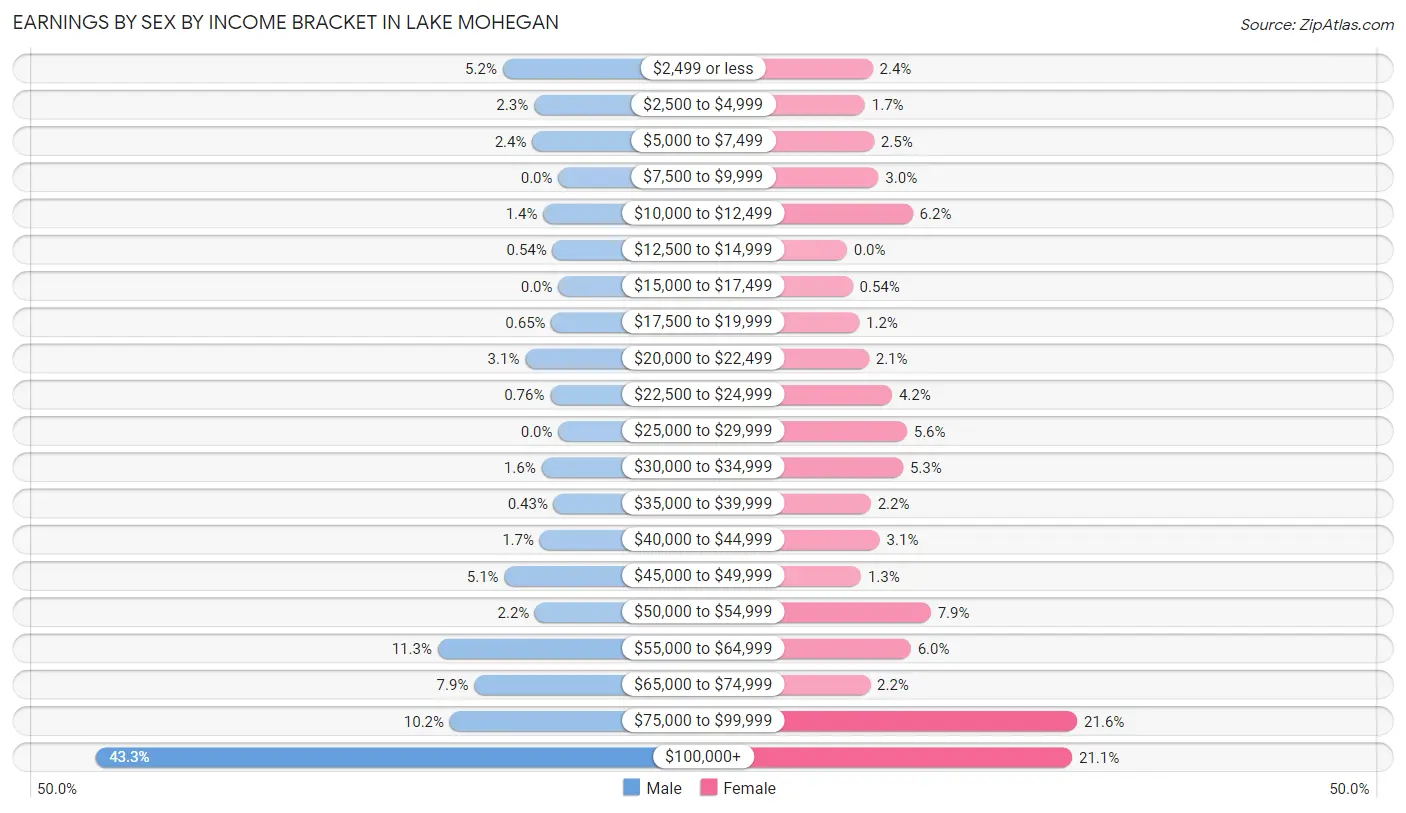
Earnings by Sex by Income Bracket in Lake Mohegan
The most common earnings brackets in Lake Mohegan are $100,000+ for men (797 | 43.3%) and $75,000 to $99,999 for women (357 | 21.6%).
| Income | Male | Female |
| $2,499 or less | 96 (5.2%) | 40 (2.4%) |
| $2,500 to $4,999 | 42 (2.3%) | 28 (1.7%) |
| $5,000 to $7,499 | 45 (2.4%) | 42 (2.5%) |
| $7,500 to $9,999 | 0 (0.0%) | 49 (3.0%) |
| $10,000 to $12,499 | 26 (1.4%) | 102 (6.2%) |
| $12,500 to $14,999 | 10 (0.5%) | 0 (0.0%) |
| $15,000 to $17,499 | 0 (0.0%) | 9 (0.5%) |
| $17,500 to $19,999 | 12 (0.6%) | 19 (1.1%) |
| $20,000 to $22,499 | 57 (3.1%) | 34 (2.1%) |
| $22,500 to $24,999 | 14 (0.8%) | 70 (4.2%) |
| $25,000 to $29,999 | 0 (0.0%) | 93 (5.6%) |
| $30,000 to $34,999 | 29 (1.6%) | 87 (5.3%) |
| $35,000 to $39,999 | 8 (0.4%) | 37 (2.2%) |
| $40,000 to $44,999 | 32 (1.7%) | 51 (3.1%) |
| $45,000 to $49,999 | 93 (5.1%) | 22 (1.3%) |
| $50,000 to $54,999 | 40 (2.2%) | 130 (7.9%) |
| $55,000 to $64,999 | 208 (11.3%) | 99 (6.0%) |
| $65,000 to $74,999 | 145 (7.9%) | 36 (2.2%) |
| $75,000 to $99,999 | 187 (10.2%) | 357 (21.6%) |
| $100,000+ | 797 (43.3%) | 349 (21.1%) |
| Total | 1,841 (100.0%) | 1,654 (100.0%) |
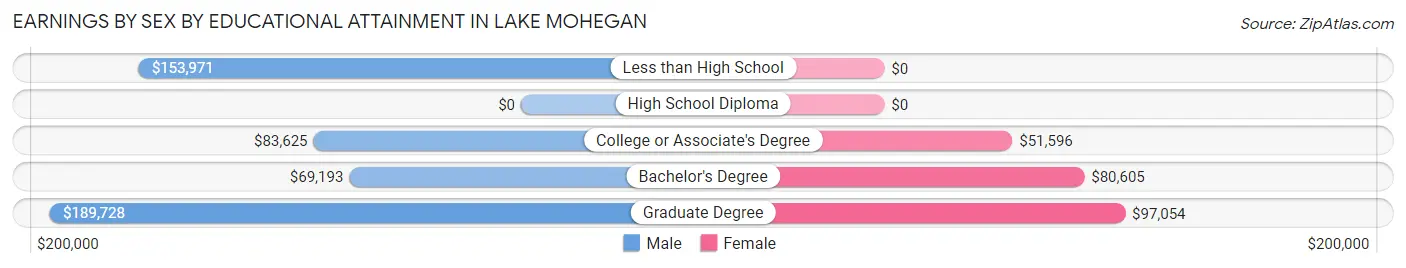
Earnings by Sex by Educational Attainment in Lake Mohegan
Average earnings in Lake Mohegan are $100,657 for men and $76,538 for women, a difference of 24.0%. Men with an educational attainment of graduate degree enjoy the highest average annual earnings of $189,728, while those with bachelor's degree education earn the least with $69,193. Women with an educational attainment of graduate degree earn the most with the average annual earnings of $97,054, while those with college or associate's degree education have the smallest earnings of $51,596.
| Educational Attainment | Male Income | Female Income |
| Less than High School | $153,971 | $0 |
| High School Diploma | - | - |
| College or Associate's Degree | $83,625 | $51,596 |
| Bachelor's Degree | $69,193 | $80,605 |
| Graduate Degree | $189,728 | $97,054 |
| Total | $100,657 | $76,538 |
Family Income in Lake Mohegan
Family Income Brackets in Lake Mohegan
According to the Lake Mohegan family income data, there are 721 families falling into the $200,000+ income range, which is the most common income bracket and makes up 45.8% of all families. Conversely, the $10,000 to $14,999 income bracket is the least frequent group with only 11 families (0.7%) belonging to this category.
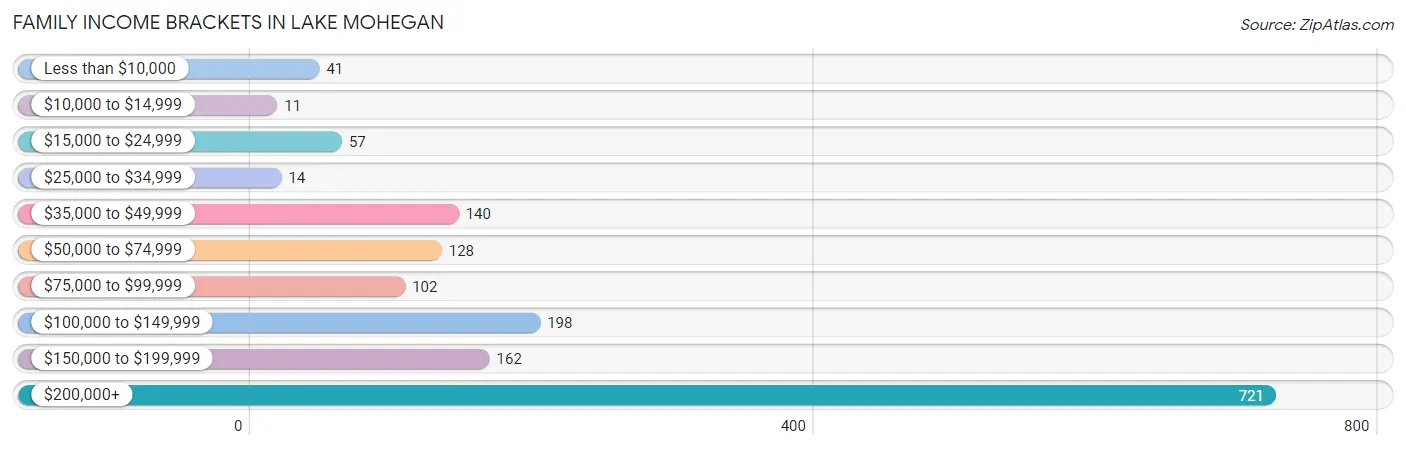
| Income Bracket | # Families | % Families |
| Less than $10,000 | 41 | 2.6% |
| $10,000 to $14,999 | 11 | 0.7% |
| $15,000 to $24,999 | 57 | 3.6% |
| $25,000 to $34,999 | 14 | 0.9% |
| $35,000 to $49,999 | 140 | 8.9% |
| $50,000 to $74,999 | 128 | 8.1% |
| $75,000 to $99,999 | 102 | 6.5% |
| $100,000 to $149,999 | 198 | 12.6% |
| $150,000 to $199,999 | 162 | 10.3% |
| $200,000+ | 721 | 45.8% |
Family Income by Famaliy Size in Lake Mohegan
4-person families (401 | 25.5%) account for the highest median family income in Lake Mohegan with $250,001 per family, while 2-person families (610 | 38.7%) have the highest median income of $62,607 per family member.
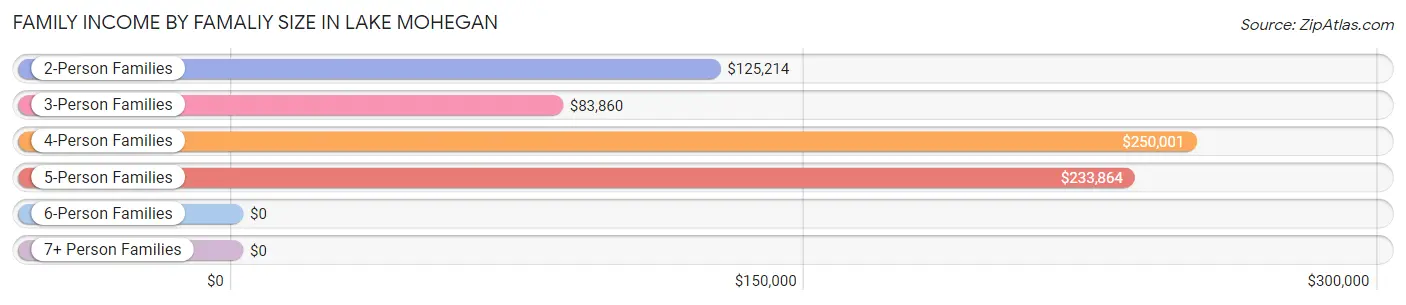
| Income Bracket | # Families | Median Income |
| 2-Person Families | 610 (38.7%) | $125,214 |
| 3-Person Families | 427 (27.1%) | $83,860 |
| 4-Person Families | 401 (25.5%) | $250,001 |
| 5-Person Families | 98 (6.2%) | $233,864 |
| 6-Person Families | 39 (2.5%) | $0 |
| 7+ Person Families | 0 (0.0%) | $0 |
| Total | 1,575 (100.0%) | $189,491 |
Family Income by Number of Earners in Lake Mohegan
The median family income in Lake Mohegan is $189,491, with families comprising 3+ earners (285) having the highest median family income of $250,001, while families with no earners (221) have the lowest median family income of $93,210, accounting for 18.1% and 14.0% of families, respectively.
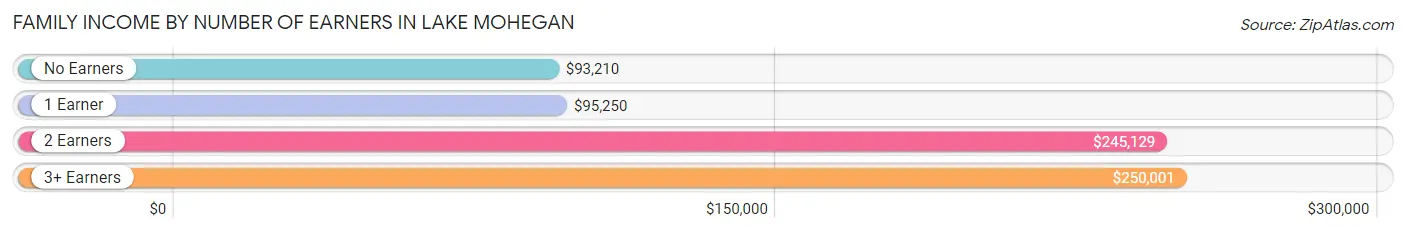
| Number of Earners | # Families | Median Income |
| No Earners | 221 (14.0%) | $93,210 |
| 1 Earner | 454 (28.8%) | $95,250 |
| 2 Earners | 615 (39.1%) | $245,129 |
| 3+ Earners | 285 (18.1%) | $250,001 |
| Total | 1,575 (100.0%) | $189,491 |
Household Income in Lake Mohegan
Household Income Brackets in Lake Mohegan
With 866 households falling in the category, the $200,000+ income range is the most frequent in Lake Mohegan, accounting for 40.8% of all households. In contrast, only 49 households (2.3%) fall into the $10,000 to $14,999 income bracket, making it the least populous group.
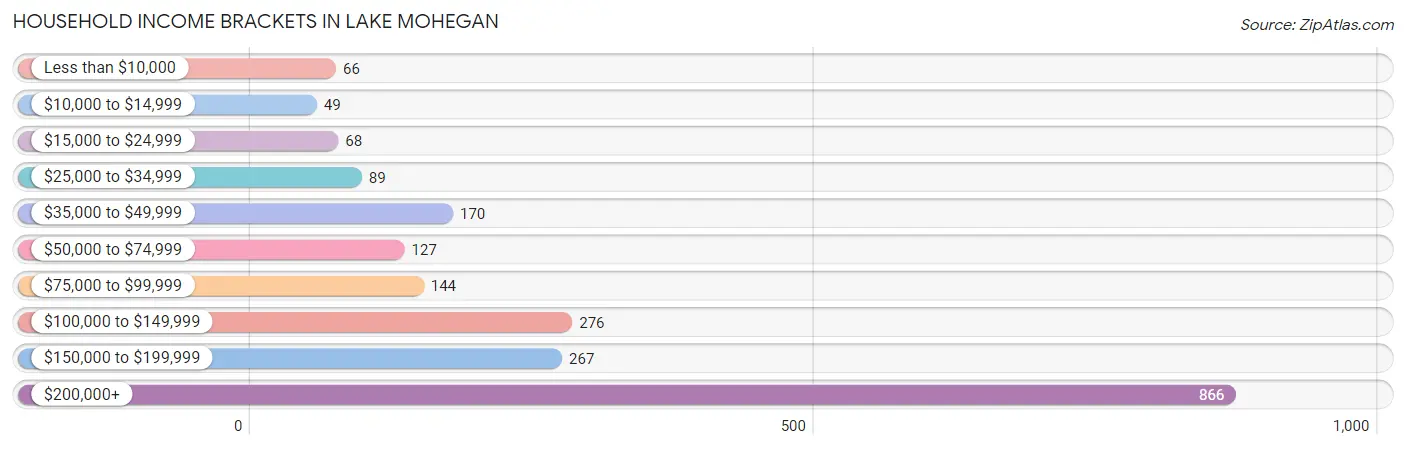
| Income Bracket | # Households | % Households |
| Less than $10,000 | 66 | 3.1% |
| $10,000 to $14,999 | 49 | 2.3% |
| $15,000 to $24,999 | 68 | 3.2% |
| $25,000 to $34,999 | 89 | 4.2% |
| $35,000 to $49,999 | 170 | 8.0% |
| $50,000 to $74,999 | 127 | 6.0% |
| $75,000 to $99,999 | 144 | 6.8% |
| $100,000 to $149,999 | 276 | 13.0% |
| $150,000 to $199,999 | 267 | 12.6% |
| $200,000+ | 866 | 40.8% |
Household Income by Householder Age in Lake Mohegan
The median household income in Lake Mohegan is $156,528, with the highest median household income of $234,063 found in the 25 to 44 years age bracket for the primary householder. A total of 705 households (33.2%) fall into this category. Meanwhile, the 15 to 24 years age bracket for the primary householder has the lowest median household income of $0, with 54 households (2.5%) in this group.
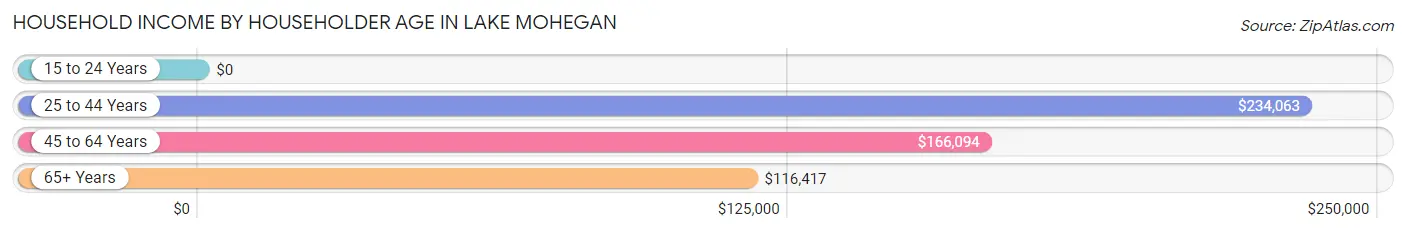
| Income Bracket | # Households | Median Income |
| 15 to 24 Years | 54 (2.5%) | $0 |
| 25 to 44 Years | 705 (33.2%) | $234,063 |
| 45 to 64 Years | 847 (39.9%) | $166,094 |
| 65+ Years | 517 (24.3%) | $116,417 |
| Total | 2,123 (100.0%) | $156,528 |
Poverty in Lake Mohegan
Income Below Poverty by Sex and Age in Lake Mohegan
With 5.1% poverty level for males and 6.3% for females among the residents of Lake Mohegan, 6 to 11 year old males and 16 and 17 year old females are the most vulnerable to poverty, with 42 males (20.9%) and 55 females (100.0%) in their respective age groups living below the poverty level.
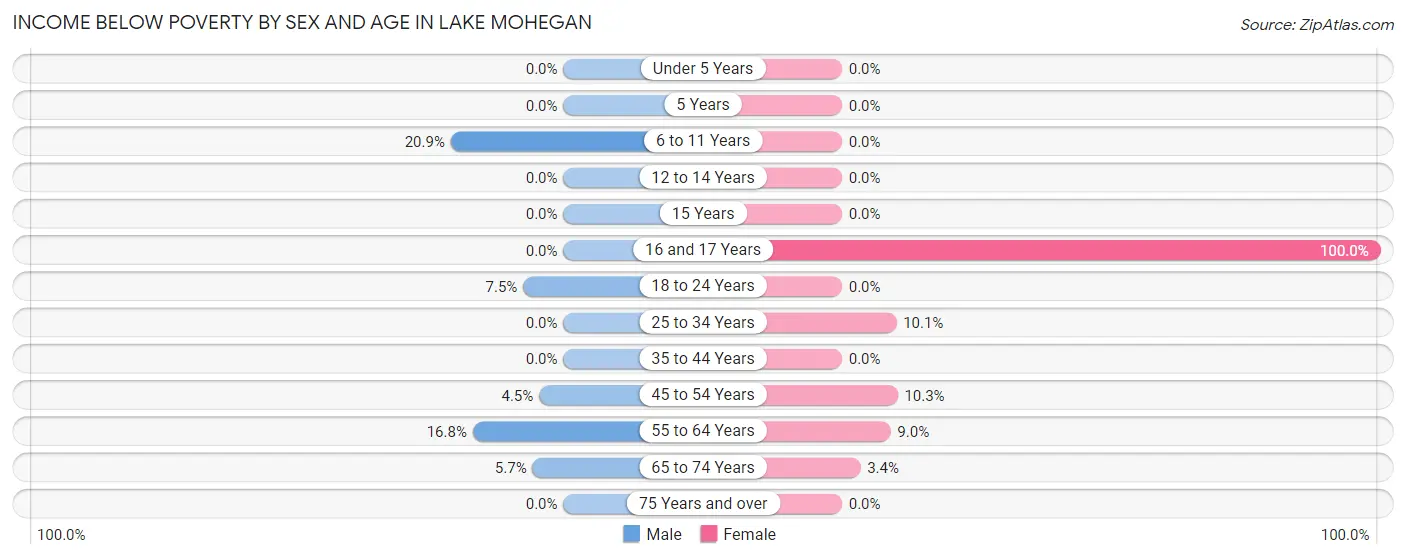
| Age Bracket | Male | Female |
| Under 5 Years | 0 (0.0%) | 0 (0.0%) |
| 5 Years | 0 (0.0%) | 0 (0.0%) |
| 6 to 11 Years | 42 (20.9%) | 0 (0.0%) |
| 12 to 14 Years | 0 (0.0%) | 0 (0.0%) |
| 15 Years | 0 (0.0%) | 0 (0.0%) |
| 16 and 17 Years | 0 (0.0%) | 55 (100.0%) |
| 18 to 24 Years | 20 (7.5%) | 0 (0.0%) |
| 25 to 34 Years | 0 (0.0%) | 41 (10.1%) |
| 35 to 44 Years | 0 (0.0%) | 0 (0.0%) |
| 45 to 54 Years | 25 (4.5%) | 38 (10.3%) |
| 55 to 64 Years | 55 (16.8%) | 33 (9.0%) |
| 65 to 74 Years | 11 (5.7%) | 10 (3.4%) |
| 75 Years and over | 0 (0.0%) | 0 (0.0%) |
| Total | 153 (5.1%) | 177 (6.3%) |
Income Above Poverty by Sex and Age in Lake Mohegan
According to the poverty statistics in Lake Mohegan, males aged under 5 years and females aged under 5 years are the age groups that are most secure financially, with 100.0% of males and 100.0% of females in these age groups living above the poverty line.
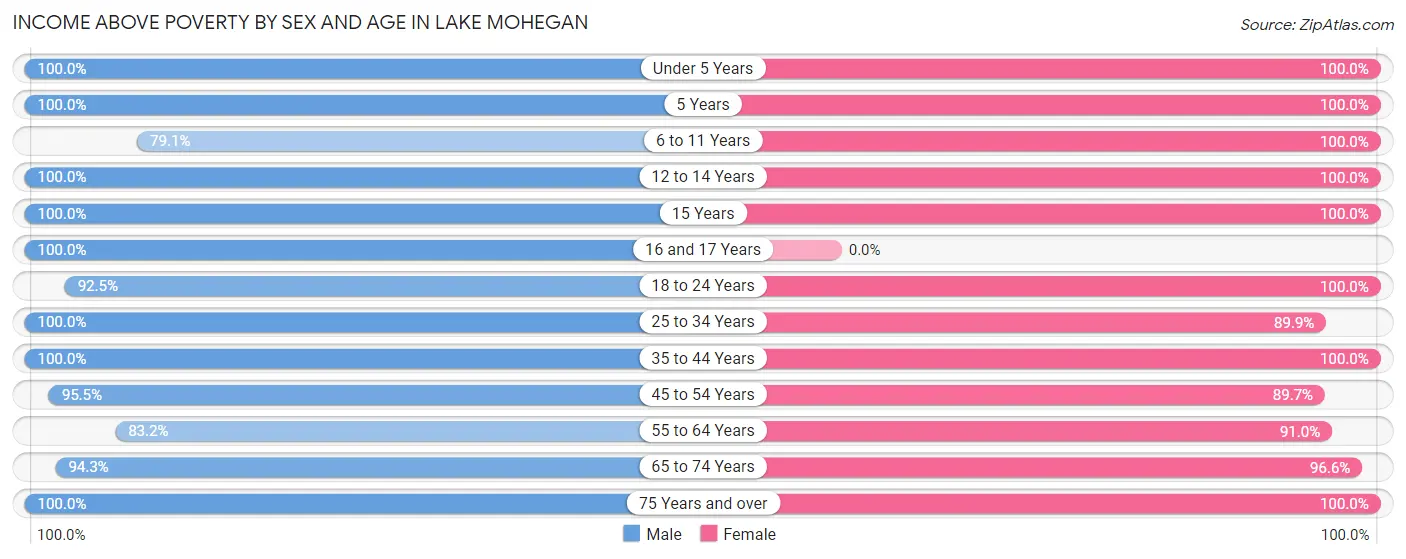
| Age Bracket | Male | Female |
| Under 5 Years | 189 (100.0%) | 147 (100.0%) |
| 5 Years | 23 (100.0%) | 9 (100.0%) |
| 6 to 11 Years | 159 (79.1%) | 83 (100.0%) |
| 12 to 14 Years | 146 (100.0%) | 68 (100.0%) |
| 15 Years | 71 (100.0%) | 70 (100.0%) |
| 16 and 17 Years | 163 (100.0%) | 0 (0.0%) |
| 18 to 24 Years | 248 (92.5%) | 258 (100.0%) |
| 25 to 34 Years | 429 (100.0%) | 365 (89.9%) |
| 35 to 44 Years | 306 (100.0%) | 409 (100.0%) |
| 45 to 54 Years | 531 (95.5%) | 330 (89.7%) |
| 55 to 64 Years | 272 (83.2%) | 333 (91.0%) |
| 65 to 74 Years | 181 (94.3%) | 282 (96.6%) |
| 75 Years and over | 142 (100.0%) | 287 (100.0%) |
| Total | 2,860 (94.9%) | 2,641 (93.7%) |
Income Below Poverty Among Married-Couple Families in Lake Mohegan
The poverty statistics for married-couple families in Lake Mohegan show that 4.4% or 49 of the total 1,118 families live below the poverty line. Families with 1 or 2 children have the highest poverty rate of 7.8%, comprising of 38 families. On the other hand, families with 3 or 4 children have the lowest poverty rate of 0.0%, which includes 0 families.
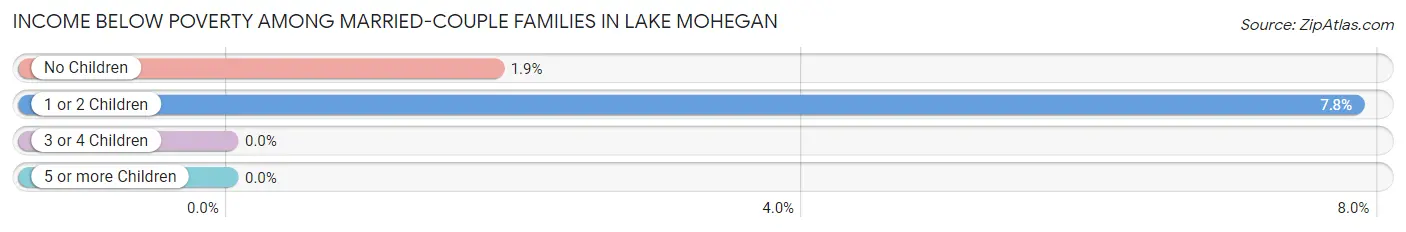
| Children | Above Poverty | Below Poverty |
| No Children | 584 (98.2%) | 11 (1.8%) |
| 1 or 2 Children | 447 (92.2%) | 38 (7.8%) |
| 3 or 4 Children | 38 (100.0%) | 0 (0.0%) |
| 5 or more Children | 0 (0.0%) | 0 (0.0%) |
| Total | 1,069 (95.6%) | 49 (4.4%) |
Income Below Poverty Among Single-Parent Households in Lake Mohegan
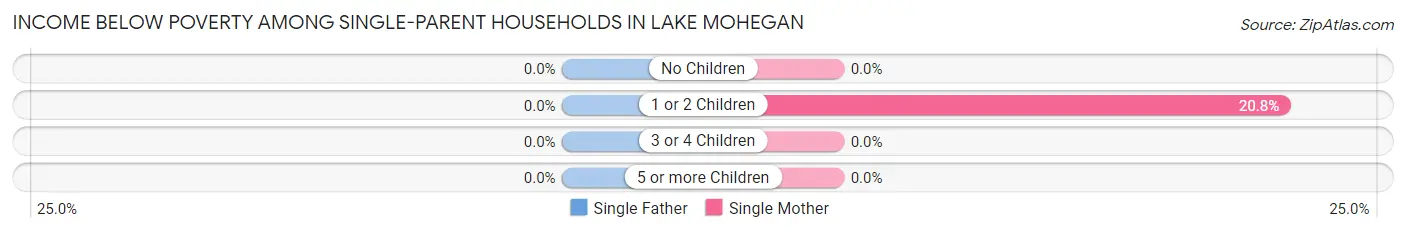
| Children | Single Father | Single Mother |
| No Children | 0 (0.0%) | 0 (0.0%) |
| 1 or 2 Children | 0 (0.0%) | 60 (20.8%) |
| 3 or 4 Children | 0 (0.0%) | 0 (0.0%) |
| 5 or more Children | 0 (0.0%) | 0 (0.0%) |
| Total | 0 (0.0%) | 60 (13.9%) |
Income Below Poverty Among Married-Couple vs Single-Parent Households in Lake Mohegan
The poverty data for Lake Mohegan shows that 49 of the married-couple family households (4.4%) and 60 of the single-parent households (13.1%) are living below the poverty level. Within the married-couple family households, those with 1 or 2 children have the highest poverty rate, with 38 households (7.8%) falling below the poverty line. Among the single-parent households, those with 1 or 2 children have the highest poverty rate, with 60 household (20.8%) living below poverty.
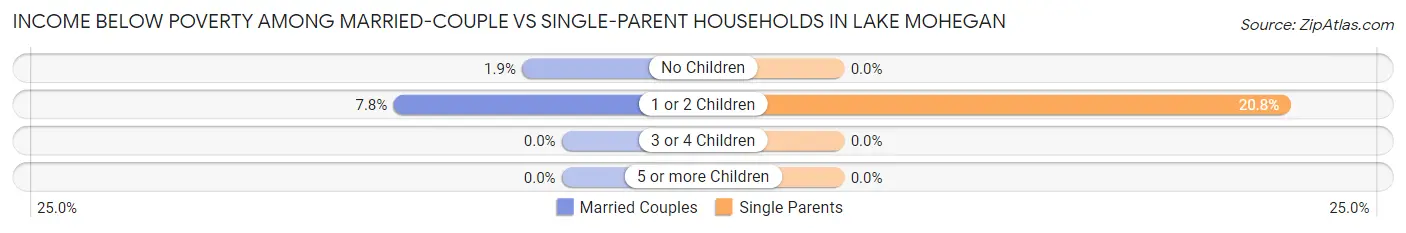
| Children | Married-Couple Families | Single-Parent Households |
| No Children | 11 (1.8%) | 0 (0.0%) |
| 1 or 2 Children | 38 (7.8%) | 60 (20.8%) |
| 3 or 4 Children | 0 (0.0%) | 0 (0.0%) |
| 5 or more Children | 0 (0.0%) | 0 (0.0%) |
| Total | 49 (4.4%) | 60 (13.1%) |
Race in Lake Mohegan
The most populous races in Lake Mohegan are White / Caucasian (4,377 | 73.7%), Hispanic or Latino (1,149 | 19.4%), and Two or more Races (564 | 9.5%).
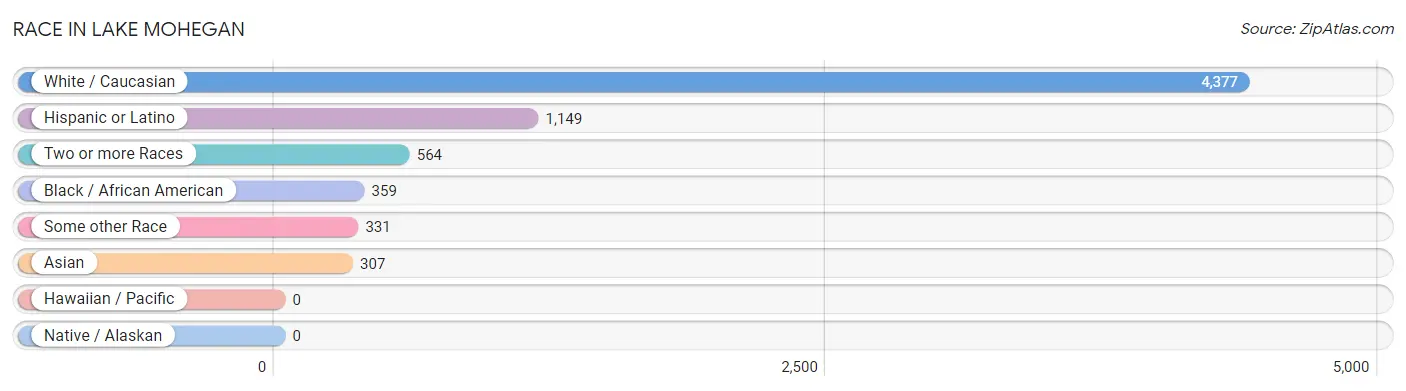
| Race | # Population | % Population |
| Asian | 307 | 5.2% |
| Black / African American | 359 | 6.0% |
| Hawaiian / Pacific | 0 | 0.0% |
| Hispanic or Latino | 1,149 | 19.4% |
| Native / Alaskan | 0 | 0.0% |
| White / Caucasian | 4,377 | 73.7% |
| Two or more Races | 564 | 9.5% |
| Some other Race | 331 | 5.6% |
| Total | 5,938 | 100.0% |
Ancestry in Lake Mohegan
The most populous ancestries reported in Lake Mohegan are Italian (1,506 | 25.4%), Irish (1,166 | 19.6%), German (658 | 11.1%), Puerto Rican (466 | 7.9%), and Dominican (413 | 7.0%), together accounting for 70.9% of all Lake Mohegan residents.
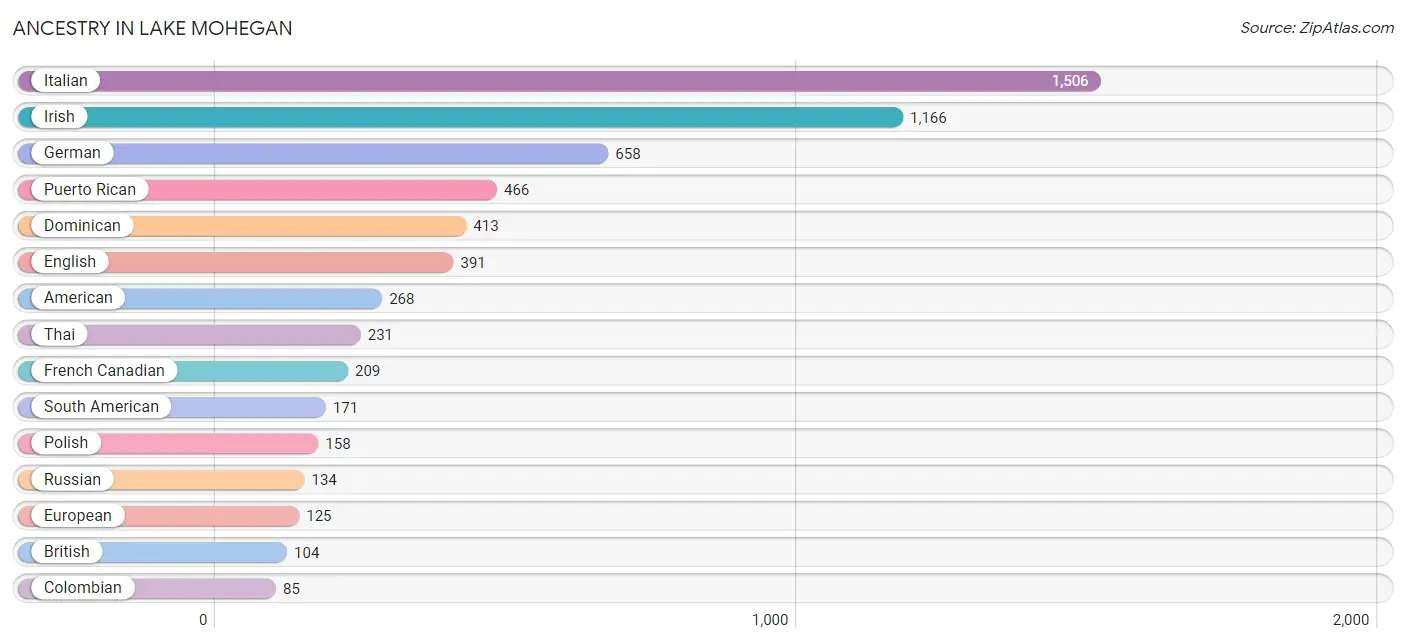
| Ancestry | # Population | % Population |
| American | 268 | 4.5% |
| Arab | 27 | 0.4% |
| Argentinean | 24 | 0.4% |
| Armenian | 12 | 0.2% |
| Australian | 11 | 0.2% |
| Belgian | 20 | 0.3% |
| Bhutanese | 30 | 0.5% |
| British | 104 | 1.8% |
| Canadian | 14 | 0.2% |
| Central American | 56 | 0.9% |
| Colombian | 85 | 1.4% |
| Croatian | 72 | 1.2% |
| Cuban | 15 | 0.3% |
| Dominican | 413 | 7.0% |
| Dutch | 11 | 0.2% |
| English | 391 | 6.6% |
| European | 125 | 2.1% |
| French | 52 | 0.9% |
| French Canadian | 209 | 3.5% |
| German | 658 | 11.1% |
| Greek | 15 | 0.3% |
| Hungarian | 17 | 0.3% |
| Irish | 1,166 | 19.6% |
| Italian | 1,506 | 25.4% |
| Korean | 34 | 0.6% |
| Lithuanian | 68 | 1.1% |
| Mexican | 16 | 0.3% |
| Nicaraguan | 1 | 0.0% |
| Nigerian | 56 | 0.9% |
| Panamanian | 55 | 0.9% |
| Peruvian | 29 | 0.5% |
| Polish | 158 | 2.7% |
| Portuguese | 15 | 0.3% |
| Puerto Rican | 466 | 7.9% |
| Russian | 134 | 2.3% |
| Scotch-Irish | 46 | 0.8% |
| Scottish | 29 | 0.5% |
| South American | 171 | 2.9% |
| Sri Lankan | 12 | 0.2% |
| Subsaharan African | 56 | 0.9% |
| Swedish | 39 | 0.7% |
| Thai | 231 | 3.9% |
| Ukrainian | 47 | 0.8% |
| Uruguayan | 33 | 0.6% | View All 44 Rows |
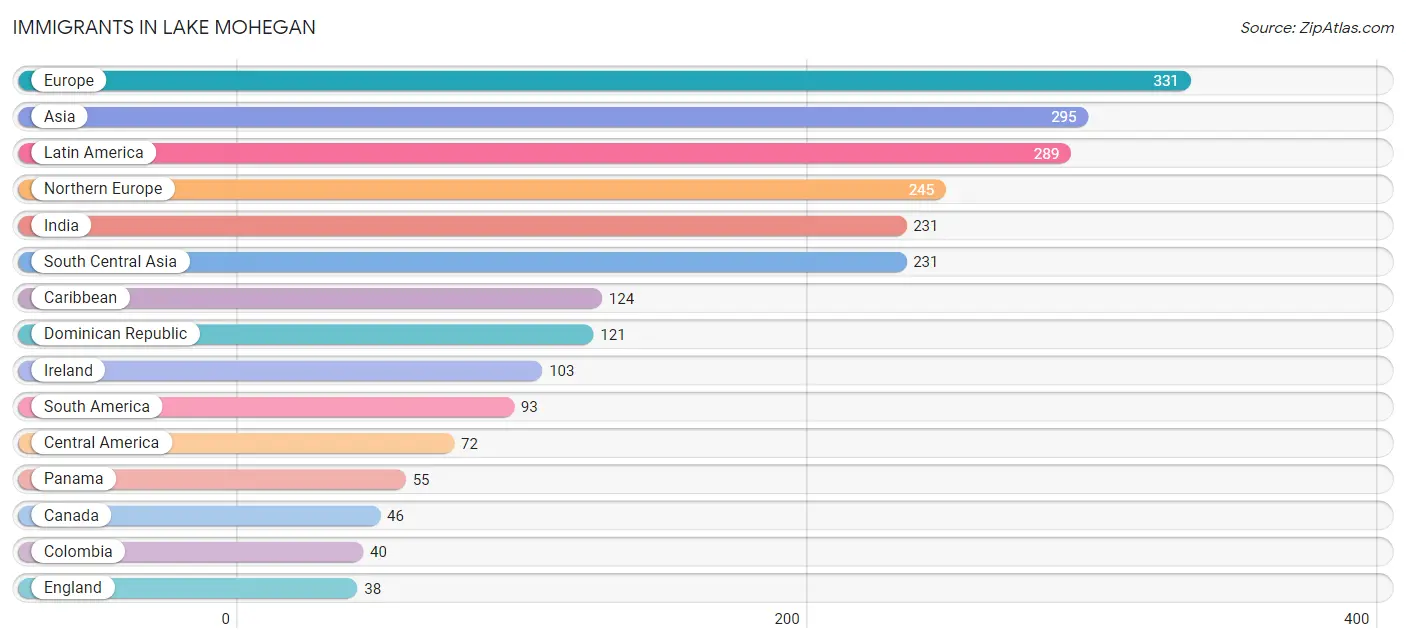
Immigrants in Lake Mohegan
The most numerous immigrant groups reported in Lake Mohegan came from Europe (331 | 5.6%), Asia (295 | 5.0%), Latin America (289 | 4.9%), Northern Europe (245 | 4.1%), and India (231 | 3.9%), together accounting for 23.4% of all Lake Mohegan residents.
| Immigration Origin | # Population | % Population |
| Africa | 26 | 0.4% |
| Argentina | 24 | 0.4% |
| Asia | 295 | 5.0% |
| Australia | 11 | 0.2% |
| Belgium | 20 | 0.3% |
| Canada | 46 | 0.8% |
| Caribbean | 124 | 2.1% |
| Central America | 72 | 1.2% |
| Colombia | 40 | 0.7% |
| Croatia | 21 | 0.4% |
| Cuba | 3 | 0.1% |
| Dominican Republic | 121 | 2.0% |
| Eastern Asia | 30 | 0.5% |
| Eastern Europe | 25 | 0.4% |
| Egypt | 7 | 0.1% |
| England | 38 | 0.6% |
| Europe | 331 | 5.6% |
| Germany | 3 | 0.1% |
| India | 231 | 3.9% |
| Ireland | 103 | 1.7% |
| Italy | 38 | 0.6% |
| Japan | 30 | 0.5% |
| Latin America | 289 | 4.9% |
| Mexico | 16 | 0.3% |
| Nicaragua | 1 | 0.0% |
| Nigeria | 19 | 0.3% |
| Northern Africa | 7 | 0.1% |
| Northern Europe | 245 | 4.1% |
| Oceania | 11 | 0.2% |
| Panama | 55 | 0.9% |
| Peru | 14 | 0.2% |
| Philippines | 10 | 0.2% |
| Poland | 1 | 0.0% |
| South America | 93 | 1.6% |
| South Central Asia | 231 | 3.9% |
| South Eastern Asia | 34 | 0.6% |
| Southern Europe | 38 | 0.6% |
| Thailand | 24 | 0.4% |
| Ukraine | 3 | 0.1% |
| Uruguay | 15 | 0.3% |
| Western Africa | 19 | 0.3% |
| Western Europe | 23 | 0.4% | View All 42 Rows |
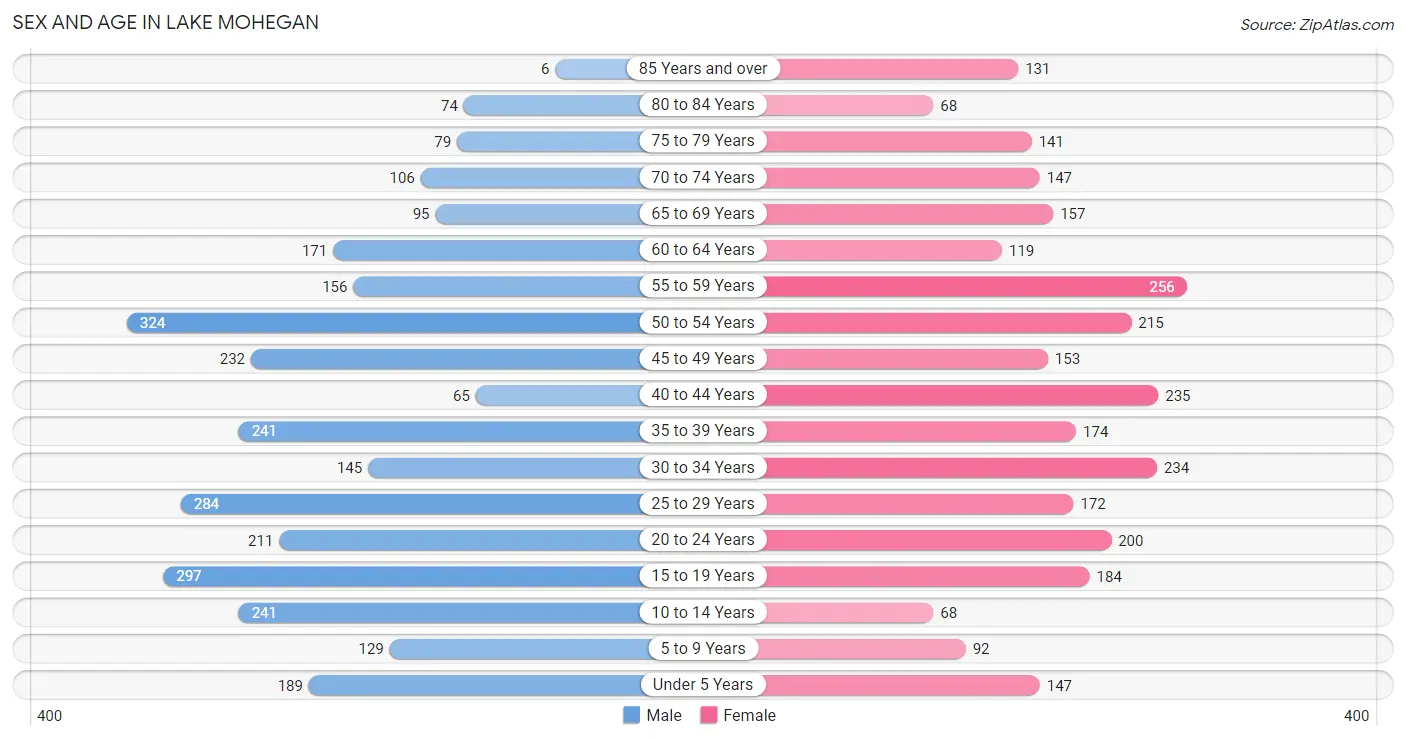
Sex and Age in Lake Mohegan
Sex and Age in Lake Mohegan
The most populous age groups in Lake Mohegan are 50 to 54 Years (324 | 10.6%) for men and 55 to 59 Years (256 | 8.8%) for women.
| Age Bracket | Male | Female |
| Under 5 Years | 189 (6.2%) | 147 (5.1%) |
| 5 to 9 Years | 129 (4.2%) | 92 (3.2%) |
| 10 to 14 Years | 241 (7.9%) | 68 (2.4%) |
| 15 to 19 Years | 297 (9.8%) | 184 (6.4%) |
| 20 to 24 Years | 211 (6.9%) | 200 (6.9%) |
| 25 to 29 Years | 284 (9.3%) | 172 (5.9%) |
| 30 to 34 Years | 145 (4.8%) | 234 (8.1%) |
| 35 to 39 Years | 241 (7.9%) | 174 (6.0%) |
| 40 to 44 Years | 65 (2.1%) | 235 (8.1%) |
| 45 to 49 Years | 232 (7.6%) | 153 (5.3%) |
| 50 to 54 Years | 324 (10.6%) | 215 (7.4%) |
| 55 to 59 Years | 156 (5.1%) | 256 (8.8%) |
| 60 to 64 Years | 171 (5.6%) | 119 (4.1%) |
| 65 to 69 Years | 95 (3.1%) | 157 (5.4%) |
| 70 to 74 Years | 106 (3.5%) | 147 (5.1%) |
| 75 to 79 Years | 79 (2.6%) | 141 (4.9%) |
| 80 to 84 Years | 74 (2.4%) | 68 (2.4%) |
| 85 Years and over | 6 (0.2%) | 131 (4.5%) |
| Total | 3,045 (100.0%) | 2,893 (100.0%) |
Families and Households in Lake Mohegan
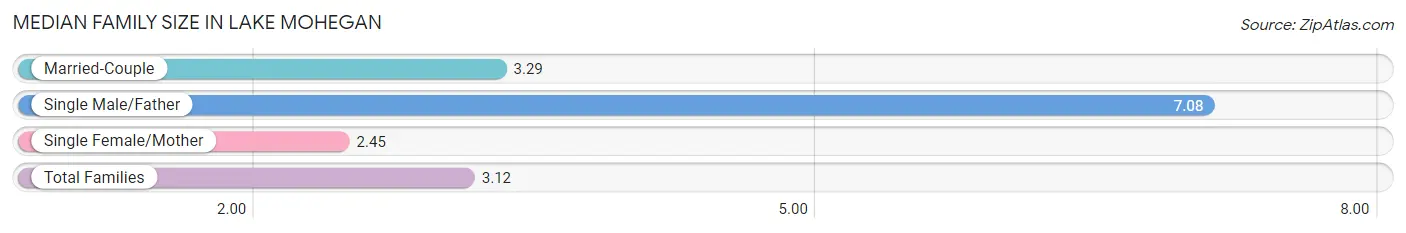
Median Family Size in Lake Mohegan
The median family size in Lake Mohegan is 3.12 persons per family, with single male/father families (24 | 1.5%) accounting for the largest median family size of 7.08 persons per family. On the other hand, single female/mother families (433 | 27.5%) represent the smallest median family size with 2.45 persons per family.
| Family Type | # Families | Family Size |
| Married-Couple | 1,118 (71.0%) | 3.29 |
| Single Male/Father | 24 (1.5%) | 7.08 |
| Single Female/Mother | 433 (27.5%) | 2.45 |
| Total Families | 1,575 (100.0%) | 3.12 |
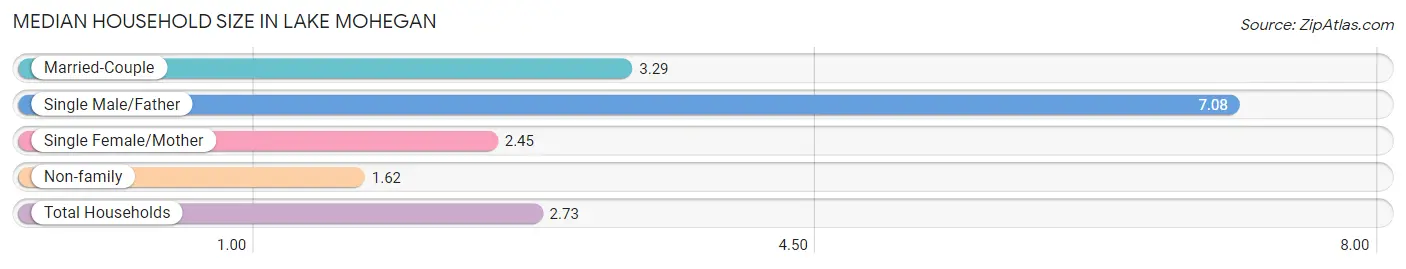
Median Household Size in Lake Mohegan
The median household size in Lake Mohegan is 2.73 persons per household, with single male/father households (24 | 1.1%) accounting for the largest median household size of 7.08 persons per household. non-family households (548 | 25.8%) represent the smallest median household size with 1.62 persons per household.
| Household Type | # Households | Household Size |
| Married-Couple | 1,118 (52.7%) | 3.29 |
| Single Male/Father | 24 (1.1%) | 7.08 |
| Single Female/Mother | 433 (20.4%) | 2.45 |
| Non-family | 548 (25.8%) | 1.62 |
| Total Households | 2,123 (100.0%) | 2.73 |
Household Size by Marriage Status in Lake Mohegan
Out of a total of 2,123 households in Lake Mohegan, 1,575 (74.2%) are family households, while 548 (25.8%) are nonfamily households. The most numerous type of family households are 2-person households, comprising 610, and the most common type of nonfamily households are 1-person households, comprising 297.
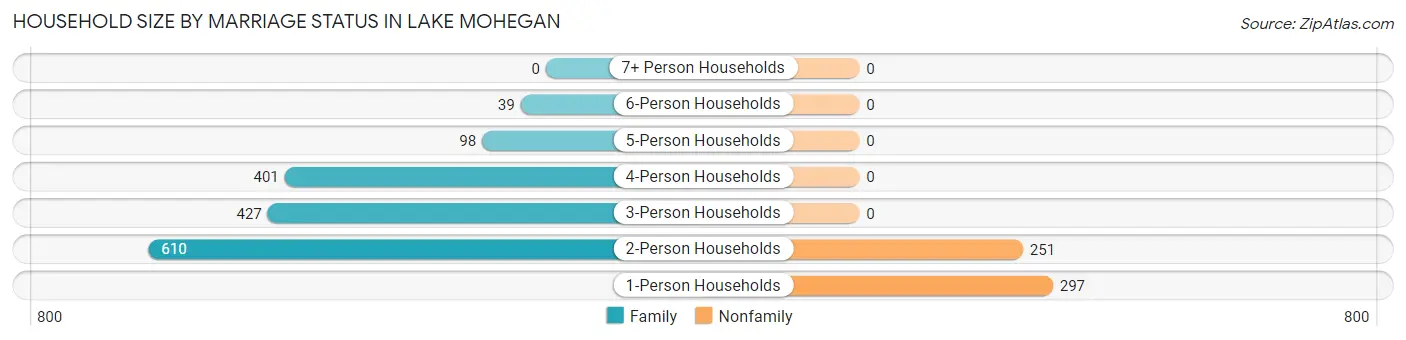
| Household Size | Family Households | Nonfamily Households |
| 1-Person Households | - | 297 (14.0%) |
| 2-Person Households | 610 (28.7%) | 251 (11.8%) |
| 3-Person Households | 427 (20.1%) | 0 (0.0%) |
| 4-Person Households | 401 (18.9%) | 0 (0.0%) |
| 5-Person Households | 98 (4.6%) | 0 (0.0%) |
| 6-Person Households | 39 (1.8%) | 0 (0.0%) |
| 7+ Person Households | 0 (0.0%) | 0 (0.0%) |
| Total | 1,575 (74.2%) | 548 (25.8%) |
Female Fertility in Lake Mohegan
Fertility by Age in Lake Mohegan
Average fertility rate in Lake Mohegan is 50.0 births per 1,000 women. Women in the age bracket of 20 to 34 years have the highest fertility rate with 97.0 births per 1,000 women. Women in the age bracket of 20 to 34 years acount for 83.1% of all women with births.
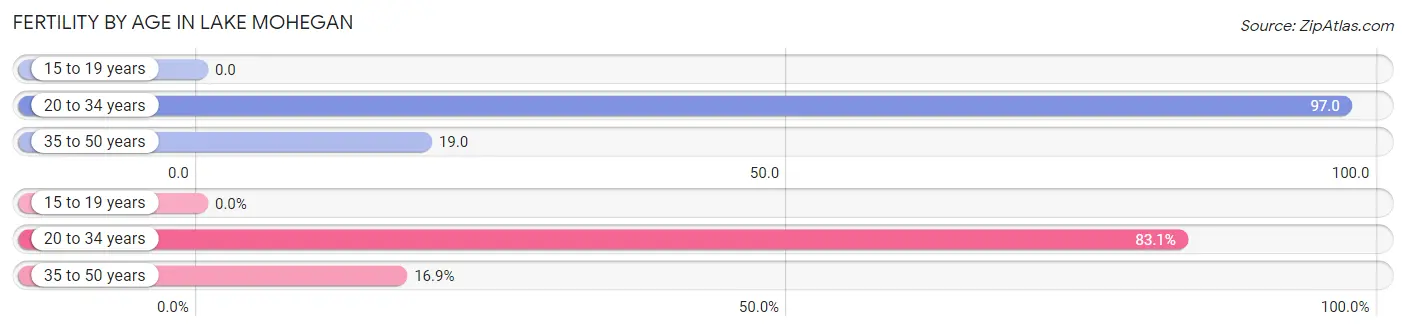
| Age Bracket | Women with Births | Births / 1,000 Women |
| 15 to 19 years | 0 (0.0%) | 0.0 |
| 20 to 34 years | 59 (83.1%) | 97.0 |
| 35 to 50 years | 12 (16.9%) | 19.0 |
| Total | 71 (100.0%) | 50.0 |
Fertility by Age by Marriage Status in Lake Mohegan
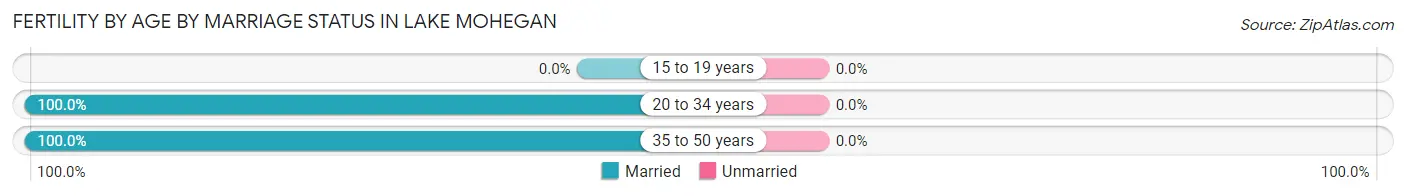
| Age Bracket | Married | Unmarried |
| 15 to 19 years | 0 (0.0%) | 0 (0.0%) |
| 20 to 34 years | 59 (100.0%) | 0 (0.0%) |
| 35 to 50 years | 12 (100.0%) | 0 (0.0%) |
| Total | 71 (100.0%) | 0 (0.0%) |
Fertility by Education in Lake Mohegan
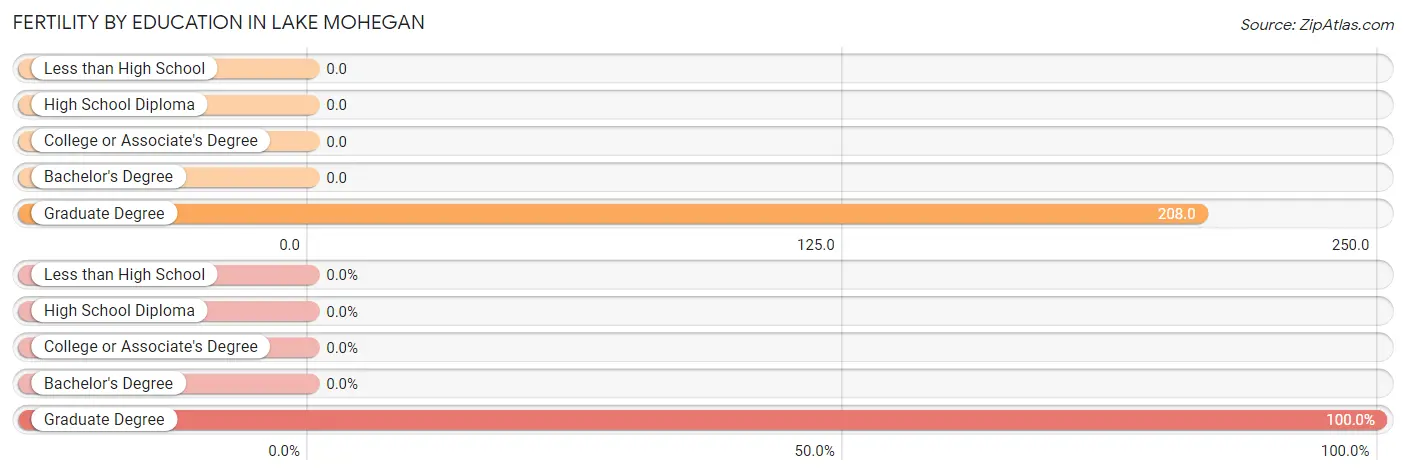
| Educational Attainment | Women with Births | Births / 1,000 Women |
| Less than High School | 0 (0.0%) | 0.0 |
| High School Diploma | 0 (0.0%) | 0.0 |
| College or Associate's Degree | 0 (0.0%) | 0.0 |
| Bachelor's Degree | 0 (0.0%) | 0.0 |
| Graduate Degree | 71 (100.0%) | 208.0 |
| Total | 71 (100.0%) | 50.0 |
Fertility by Education by Marriage Status in Lake Mohegan
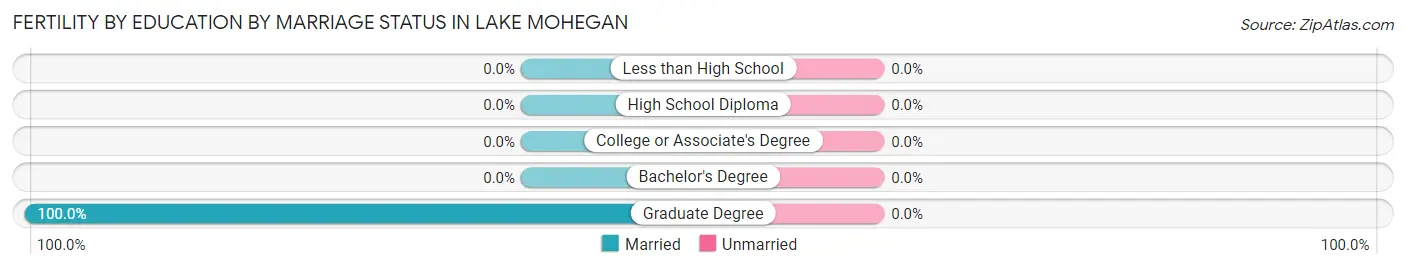
| Educational Attainment | Married | Unmarried |
| Less than High School | 0 (0.0%) | 0 (0.0%) |
| High School Diploma | 0 (0.0%) | 0 (0.0%) |
| College or Associate's Degree | 0 (0.0%) | 0 (0.0%) |
| Bachelor's Degree | 0 (0.0%) | 0 (0.0%) |
| Graduate Degree | 71 (100.0%) | 0 (0.0%) |
| Total | 71 (100.0%) | 0 (0.0%) |
Employment Characteristics in Lake Mohegan
Employment by Class of Employer in Lake Mohegan
Among the 3,250 employed individuals in Lake Mohegan, private company employees (1,800 | 55.4%), local government employees (570 | 17.5%), and state government employees (341 | 10.5%) make up the most common classes of employment.
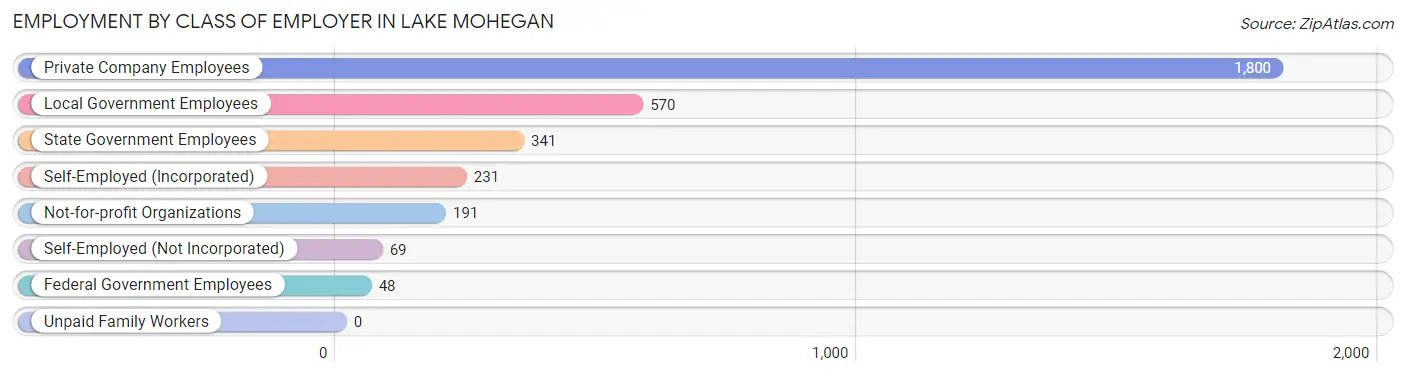
| Employer Class | # Employees | % Employees |
| Private Company Employees | 1,800 | 55.4% |
| Self-Employed (Incorporated) | 231 | 7.1% |
| Self-Employed (Not Incorporated) | 69 | 2.1% |
| Not-for-profit Organizations | 191 | 5.9% |
| Local Government Employees | 570 | 17.5% |
| State Government Employees | 341 | 10.5% |
| Federal Government Employees | 48 | 1.5% |
| Unpaid Family Workers | 0 | 0.0% |
| Total | 3,250 | 100.0% |
Employment Status by Age in Lake Mohegan
According to the labor force statistics for Lake Mohegan, out of the total population over 16 years of age (4,930), 69.2% or 3,412 individuals are in the labor force, with 2.7% or 92 of them unemployed. The age group with the highest labor force participation rate is 25 to 29 years, with 100.0% or 456 individuals in the labor force. Within the labor force, the 75 years and over age range has the highest percentage of unemployed individuals, with 26.8% or 15 of them being unemployed.
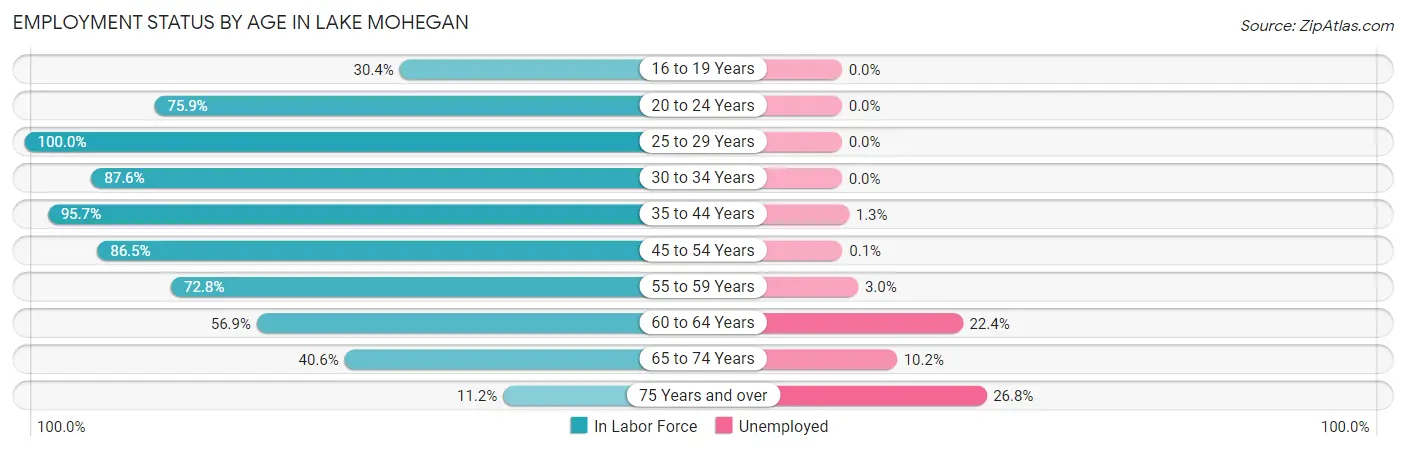
| Age Bracket | In Labor Force | Unemployed |
| 16 to 19 Years | 103 (30.4%) | 0 (0.0%) |
| 20 to 24 Years | 312 (75.9%) | 0 (0.0%) |
| 25 to 29 Years | 456 (100.0%) | 0 (0.0%) |
| 30 to 34 Years | 332 (87.6%) | 0 (0.0%) |
| 35 to 44 Years | 684 (95.7%) | 9 (1.3%) |
| 45 to 54 Years | 799 (86.5%) | 1 (0.1%) |
| 55 to 59 Years | 300 (72.8%) | 9 (3.0%) |
| 60 to 64 Years | 165 (56.9%) | 37 (22.4%) |
| 65 to 74 Years | 205 (40.6%) | 21 (10.2%) |
| 75 Years and over | 56 (11.2%) | 15 (26.8%) |
| Total | 3,412 (69.2%) | 92 (2.7%) |
Employment Status by Educational Attainment in Lake Mohegan
According to labor force statistics for Lake Mohegan, 86.1% of individuals (2,735) out of the total population between 25 and 64 years of age (3,176) are in the labor force, with 2.0% or 55 of them being unemployed. The group with the highest labor force participation rate are those with the educational attainment of bachelor's degree or higher, with 95.1% or 1,750 individuals in the labor force. Within the labor force, individuals with high school diploma education have the highest percentage of unemployment, with 6.4% or 18 of them being unemployed.
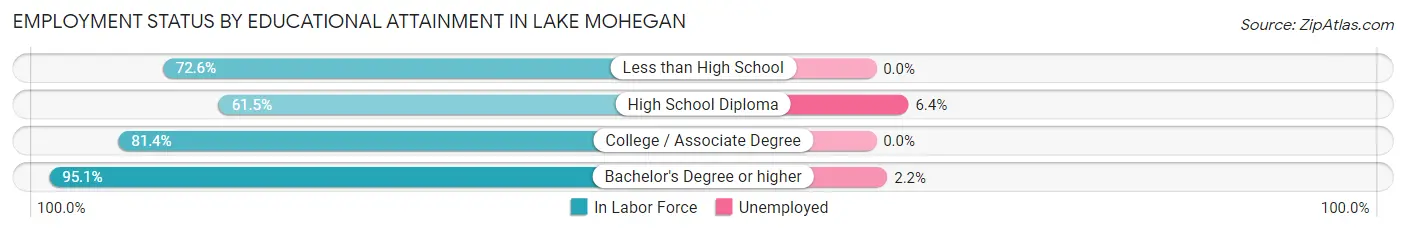
| Educational Attainment | In Labor Force | Unemployed |
| Less than High School | 85 (72.6%) | 0 (0.0%) |
| High School Diploma | 280 (61.5%) | 29 (6.4%) |
| College / Associate Degree | 622 (81.4%) | 0 (0.0%) |
| Bachelor's Degree or higher | 1,750 (95.1%) | 40 (2.2%) |
| Total | 2,735 (86.1%) | 64 (2.0%) |
Employment Occupations by Sex in Lake Mohegan
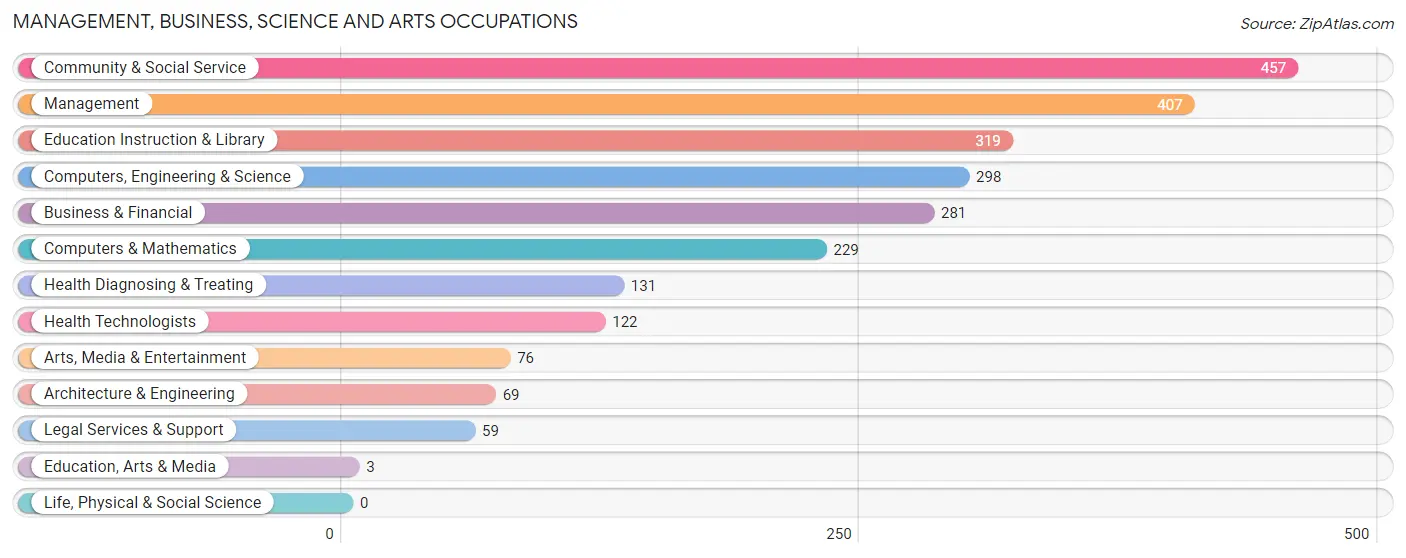
Management, Business, Science and Arts Occupations
The most common Management, Business, Science and Arts occupations in Lake Mohegan are Community & Social Service (457 | 13.8%), Management (407 | 12.3%), Education Instruction & Library (319 | 9.6%), Computers, Engineering & Science (298 | 9.0%), and Business & Financial (281 | 8.5%).
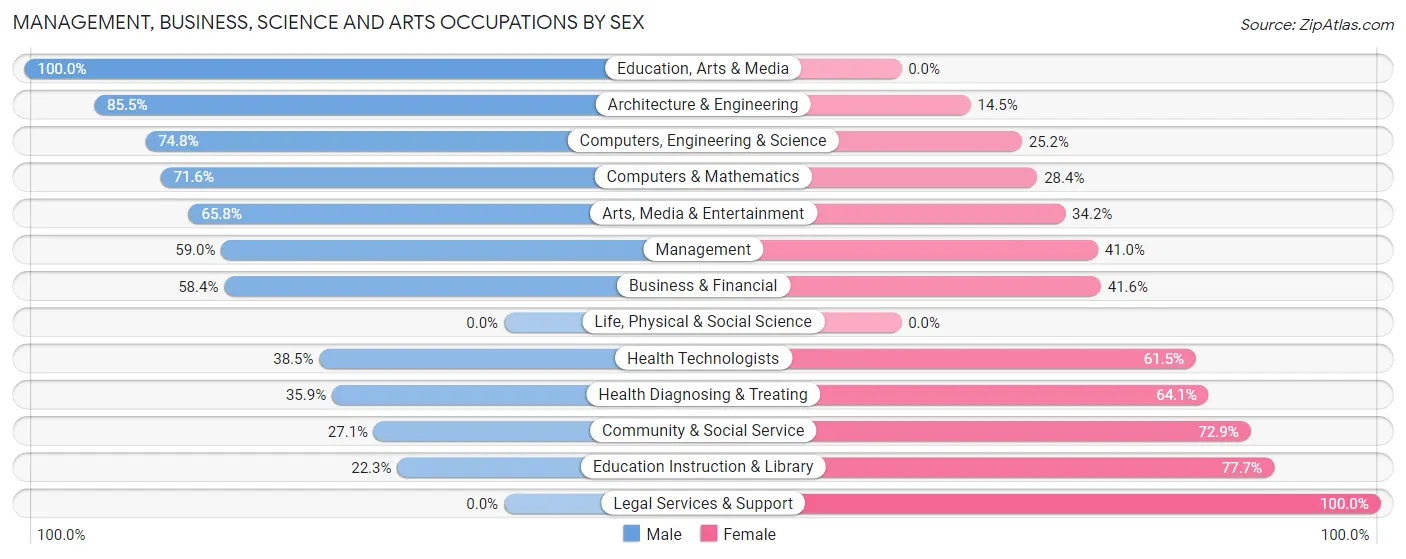
Management, Business, Science and Arts Occupations by Sex
Within the Management, Business, Science and Arts occupations in Lake Mohegan, the most male-oriented occupations are Education, Arts & Media (100.0%), Architecture & Engineering (85.5%), and Computers, Engineering & Science (74.8%), while the most female-oriented occupations are Legal Services & Support (100.0%), Education Instruction & Library (77.7%), and Community & Social Service (72.9%).
| Occupation | Male | Female |
| Management | 240 (59.0%) | 167 (41.0%) |
| Business & Financial | 164 (58.4%) | 117 (41.6%) |
| Computers, Engineering & Science | 223 (74.8%) | 75 (25.2%) |
| Computers & Mathematics | 164 (71.6%) | 65 (28.4%) |
| Architecture & Engineering | 59 (85.5%) | 10 (14.5%) |
| Life, Physical & Social Science | 0 (0.0%) | 0 (0.0%) |
| Community & Social Service | 124 (27.1%) | 333 (72.9%) |
| Education, Arts & Media | 3 (100.0%) | 0 (0.0%) |
| Legal Services & Support | 0 (0.0%) | 59 (100.0%) |
| Education Instruction & Library | 71 (22.3%) | 248 (77.7%) |
| Arts, Media & Entertainment | 50 (65.8%) | 26 (34.2%) |
| Health Diagnosing & Treating | 47 (35.9%) | 84 (64.1%) |
| Health Technologists | 47 (38.5%) | 75 (61.5%) |
| Total (Category) | 798 (50.7%) | 776 (49.3%) |
| Total (Overall) | 1,715 (51.7%) | 1,605 (48.3%) |
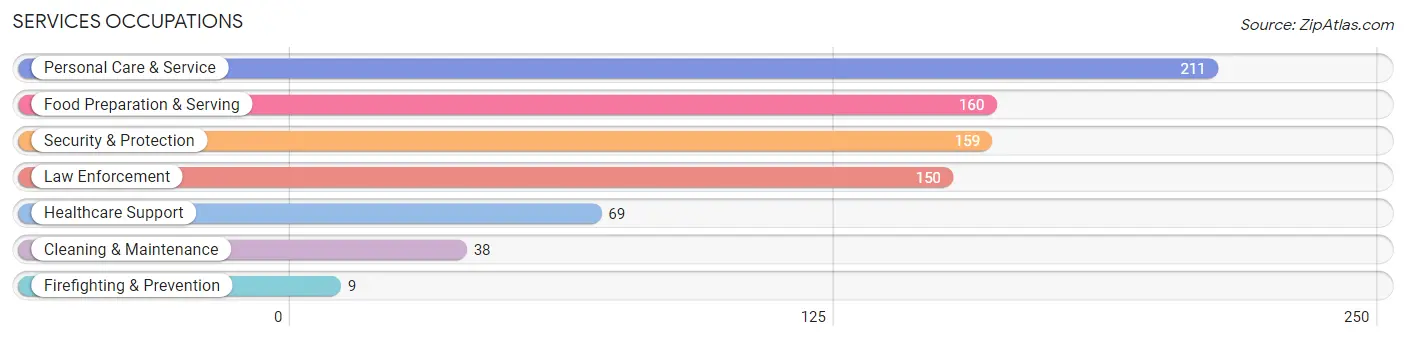
Services Occupations
The most common Services occupations in Lake Mohegan are Personal Care & Service (211 | 6.4%), Food Preparation & Serving (160 | 4.8%), Security & Protection (159 | 4.8%), Law Enforcement (150 | 4.5%), and Healthcare Support (69 | 2.1%).
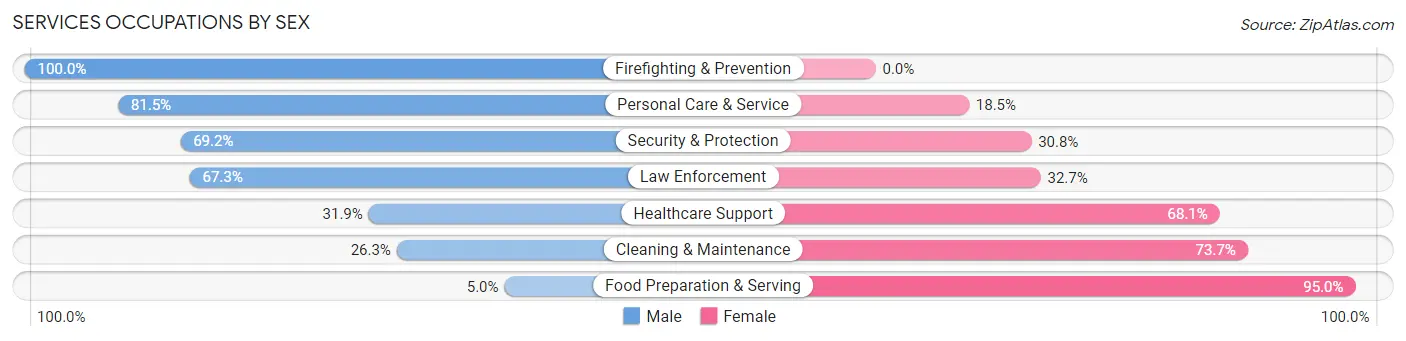
Services Occupations by Sex
Within the Services occupations in Lake Mohegan, the most male-oriented occupations are Firefighting & Prevention (100.0%), Personal Care & Service (81.5%), and Security & Protection (69.2%), while the most female-oriented occupations are Food Preparation & Serving (95.0%), Cleaning & Maintenance (73.7%), and Healthcare Support (68.1%).
| Occupation | Male | Female |
| Healthcare Support | 22 (31.9%) | 47 (68.1%) |
| Security & Protection | 110 (69.2%) | 49 (30.8%) |
| Firefighting & Prevention | 9 (100.0%) | 0 (0.0%) |
| Law Enforcement | 101 (67.3%) | 49 (32.7%) |
| Food Preparation & Serving | 8 (5.0%) | 152 (95.0%) |
| Cleaning & Maintenance | 10 (26.3%) | 28 (73.7%) |
| Personal Care & Service | 172 (81.5%) | 39 (18.5%) |
| Total (Category) | 322 (50.5%) | 315 (49.4%) |
| Total (Overall) | 1,715 (51.7%) | 1,605 (48.3%) |
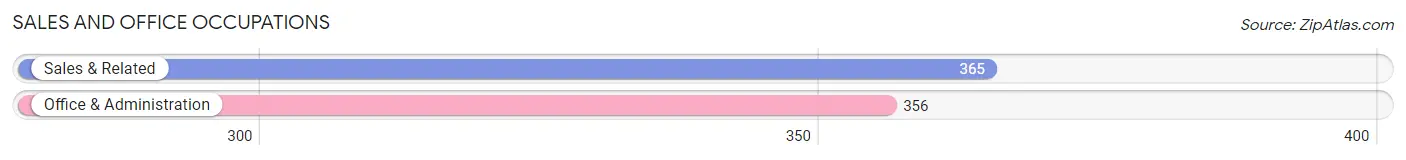
Sales and Office Occupations
The most common Sales and Office occupations in Lake Mohegan are Sales & Related (365 | 11.0%), and Office & Administration (356 | 10.7%).
Sales and Office Occupations by Sex
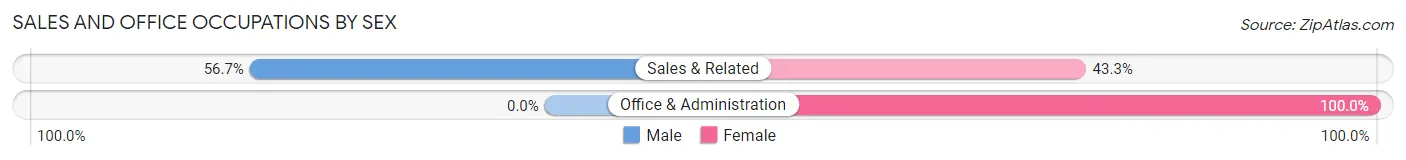
| Occupation | Male | Female |
| Sales & Related | 207 (56.7%) | 158 (43.3%) |
| Office & Administration | 0 (0.0%) | 356 (100.0%) |
| Total (Category) | 207 (28.7%) | 514 (71.3%) |
| Total (Overall) | 1,715 (51.7%) | 1,605 (48.3%) |
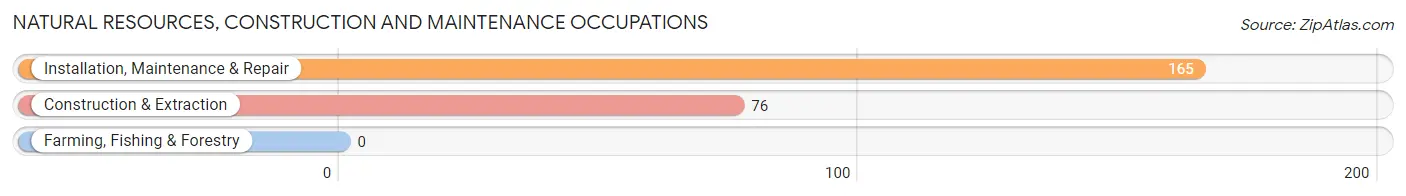
Natural Resources, Construction and Maintenance Occupations
The most common Natural Resources, Construction and Maintenance occupations in Lake Mohegan are Installation, Maintenance & Repair (165 | 5.0%), and Construction & Extraction (76 | 2.3%).
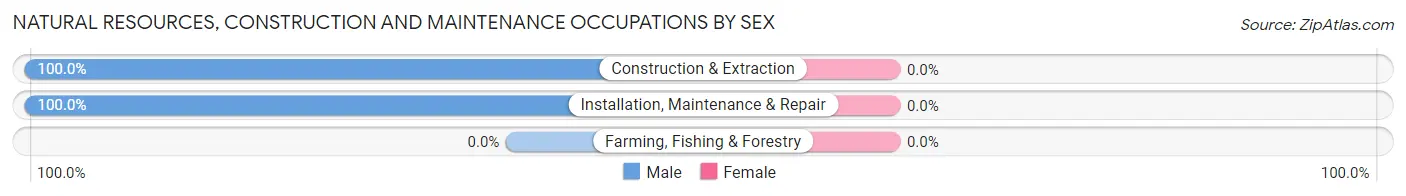
Natural Resources, Construction and Maintenance Occupations by Sex
| Occupation | Male | Female |
| Farming, Fishing & Forestry | 0 (0.0%) | 0 (0.0%) |
| Construction & Extraction | 76 (100.0%) | 0 (0.0%) |
| Installation, Maintenance & Repair | 165 (100.0%) | 0 (0.0%) |
| Total (Category) | 241 (100.0%) | 0 (0.0%) |
| Total (Overall) | 1,715 (51.7%) | 1,605 (48.3%) |
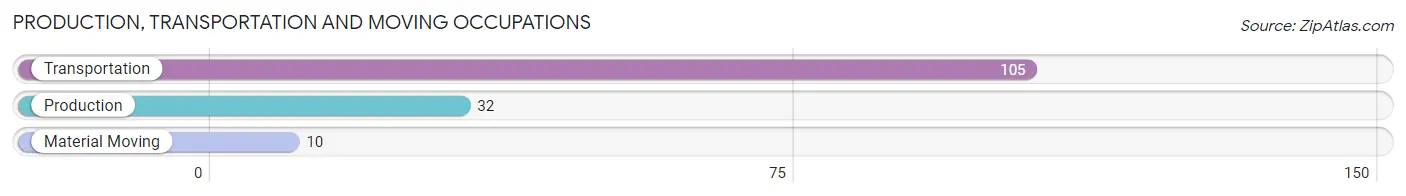
Production, Transportation and Moving Occupations
The most common Production, Transportation and Moving occupations in Lake Mohegan are Transportation (105 | 3.2%), Production (32 | 1.0%), and Material Moving (10 | 0.3%).
Production, Transportation and Moving Occupations by Sex
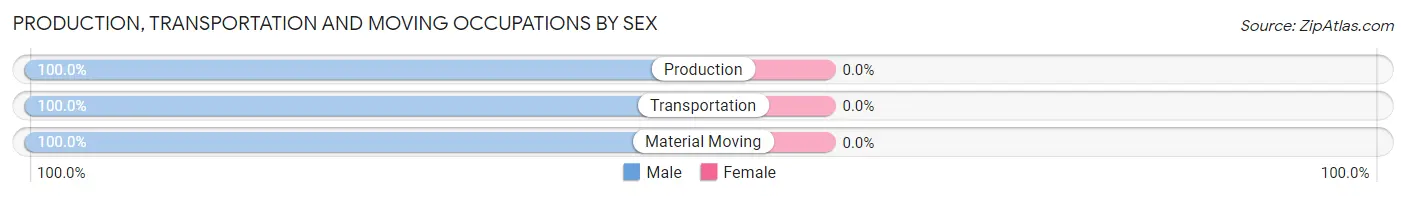
| Occupation | Male | Female |
| Production | 32 (100.0%) | 0 (0.0%) |
| Transportation | 105 (100.0%) | 0 (0.0%) |
| Material Moving | 10 (100.0%) | 0 (0.0%) |
| Total (Category) | 147 (100.0%) | 0 (0.0%) |
| Total (Overall) | 1,715 (51.7%) | 1,605 (48.3%) |
Employment Industries by Sex in Lake Mohegan
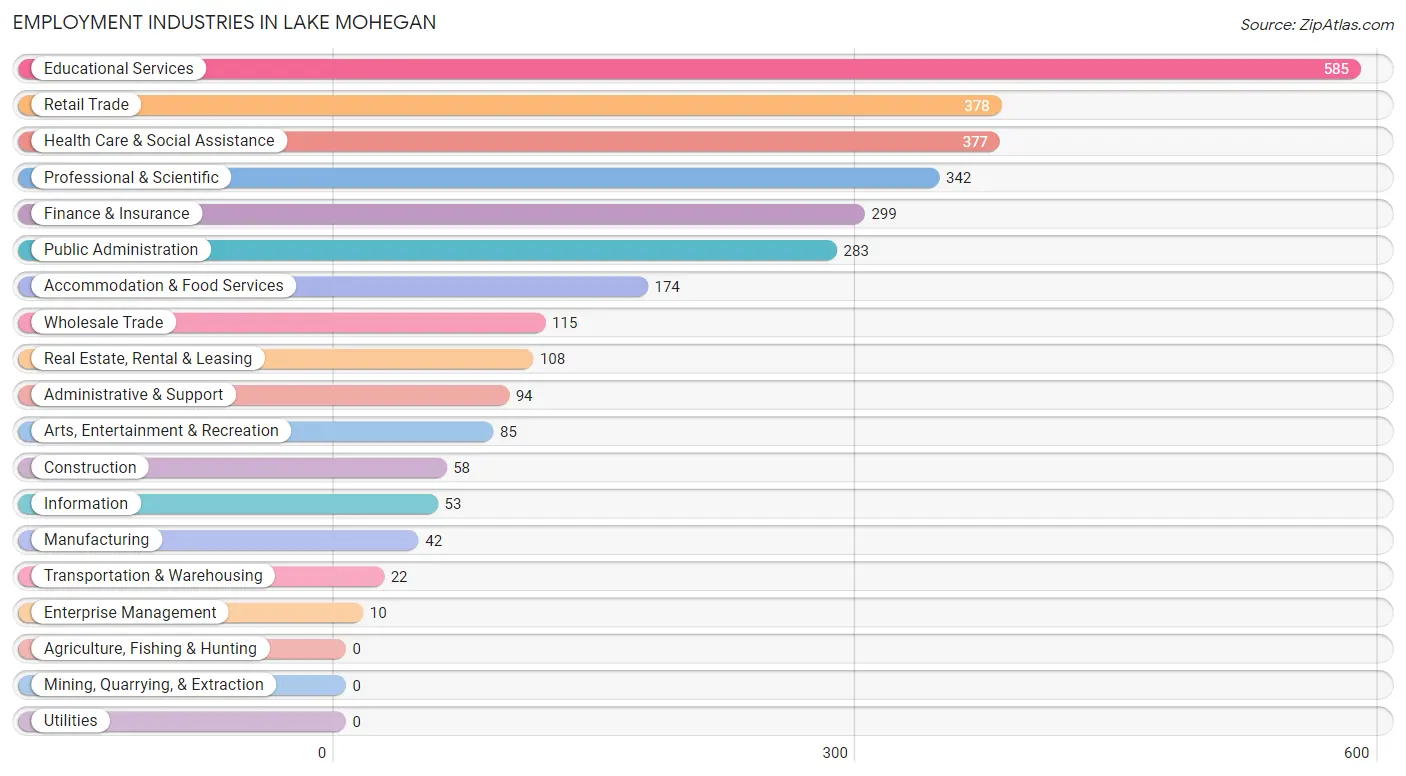
Employment Industries in Lake Mohegan
The major employment industries in Lake Mohegan include Educational Services (585 | 17.6%), Retail Trade (378 | 11.4%), Health Care & Social Assistance (377 | 11.4%), Professional & Scientific (342 | 10.3%), and Finance & Insurance (299 | 9.0%).
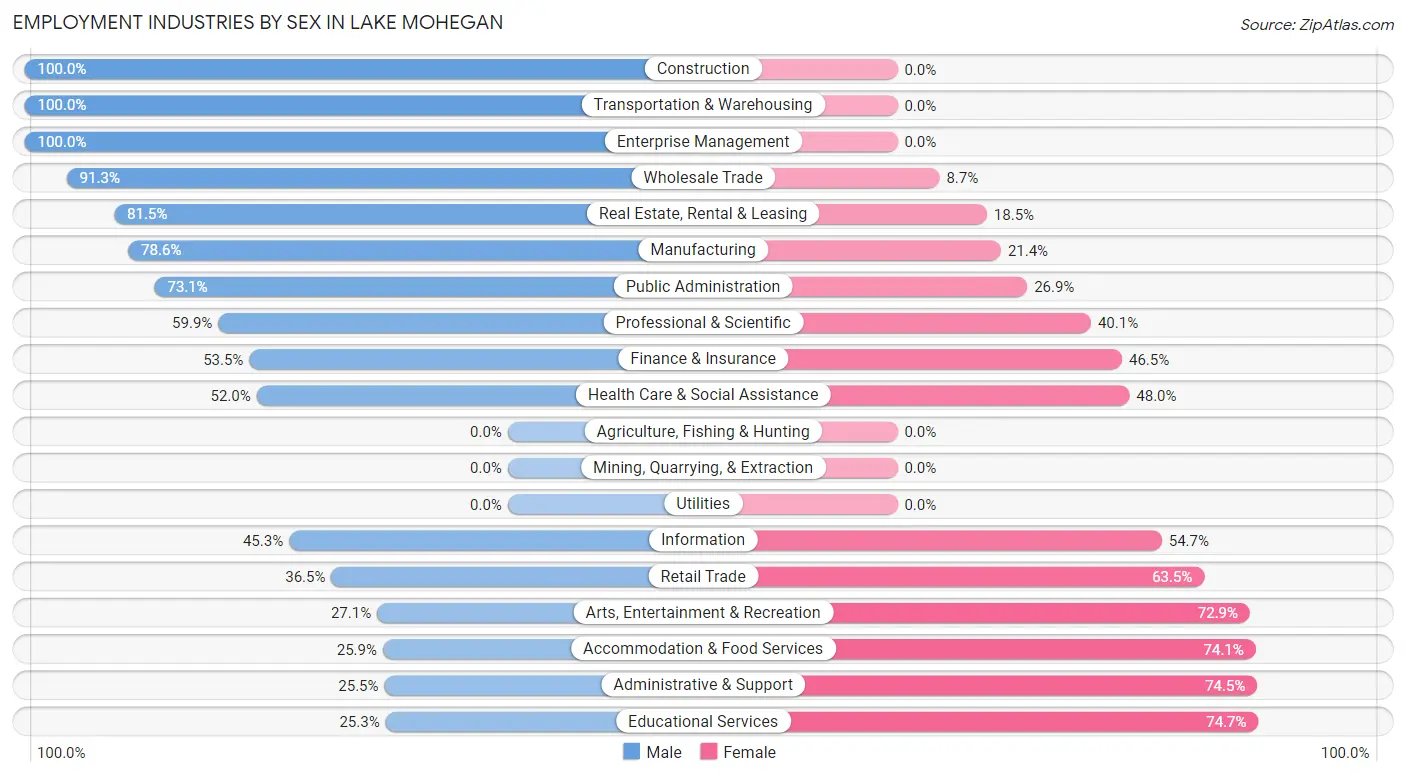
Employment Industries by Sex in Lake Mohegan
The Lake Mohegan industries that see more men than women are Construction (100.0%), Transportation & Warehousing (100.0%), and Enterprise Management (100.0%), whereas the industries that tend to have a higher number of women are Educational Services (74.7%), Administrative & Support (74.5%), and Accommodation & Food Services (74.1%).
| Industry | Male | Female |
| Agriculture, Fishing & Hunting | 0 (0.0%) | 0 (0.0%) |
| Mining, Quarrying, & Extraction | 0 (0.0%) | 0 (0.0%) |
| Construction | 58 (100.0%) | 0 (0.0%) |
| Manufacturing | 33 (78.6%) | 9 (21.4%) |
| Wholesale Trade | 105 (91.3%) | 10 (8.7%) |
| Retail Trade | 138 (36.5%) | 240 (63.5%) |
| Transportation & Warehousing | 22 (100.0%) | 0 (0.0%) |
| Utilities | 0 (0.0%) | 0 (0.0%) |
| Information | 24 (45.3%) | 29 (54.7%) |
| Finance & Insurance | 160 (53.5%) | 139 (46.5%) |
| Real Estate, Rental & Leasing | 88 (81.5%) | 20 (18.5%) |
| Professional & Scientific | 205 (59.9%) | 137 (40.1%) |
| Enterprise Management | 10 (100.0%) | 0 (0.0%) |
| Administrative & Support | 24 (25.5%) | 70 (74.5%) |
| Educational Services | 148 (25.3%) | 437 (74.7%) |
| Health Care & Social Assistance | 196 (52.0%) | 181 (48.0%) |
| Arts, Entertainment & Recreation | 23 (27.1%) | 62 (72.9%) |
| Accommodation & Food Services | 45 (25.9%) | 129 (74.1%) |
| Public Administration | 207 (73.1%) | 76 (26.9%) |
| Total | 1,715 (51.7%) | 1,605 (48.3%) |
Education in Lake Mohegan
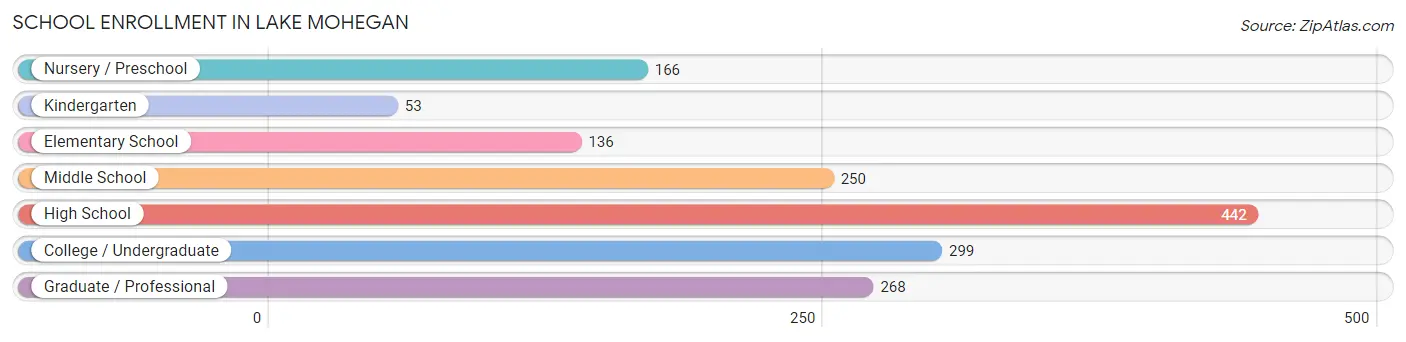
School Enrollment in Lake Mohegan
The most common levels of schooling among the 1,614 students in Lake Mohegan are high school (442 | 27.4%), college / undergraduate (299 | 18.5%), and graduate / professional (268 | 16.6%).
| School Level | # Students | % Students |
| Nursery / Preschool | 166 | 10.3% |
| Kindergarten | 53 | 3.3% |
| Elementary School | 136 | 8.4% |
| Middle School | 250 | 15.5% |
| High School | 442 | 27.4% |
| College / Undergraduate | 299 | 18.5% |
| Graduate / Professional | 268 | 16.6% |
| Total | 1,614 | 100.0% |
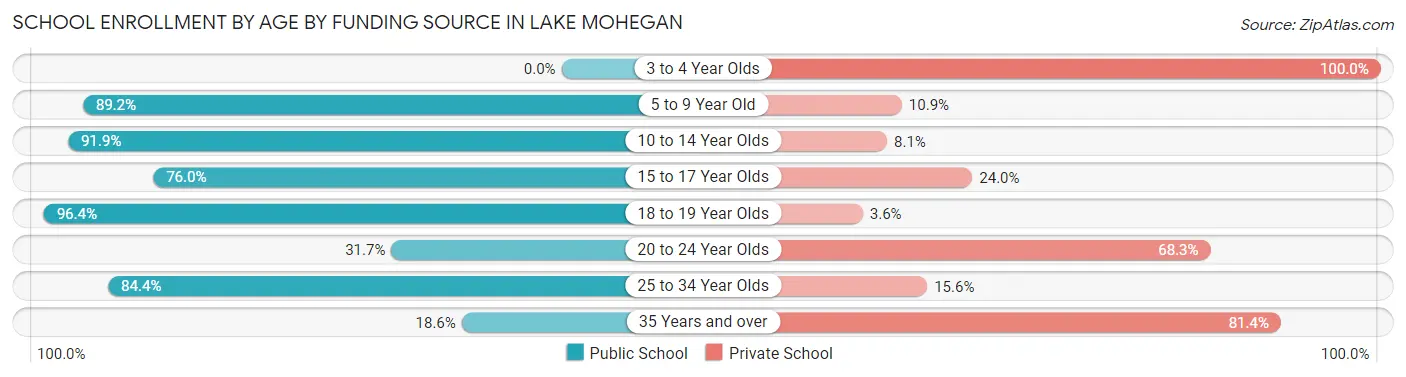
School Enrollment by Age by Funding Source in Lake Mohegan
Out of a total of 1,614 students who are enrolled in schools in Lake Mohegan, 558 (34.6%) attend a private institution, while the remaining 1,056 (65.4%) are enrolled in public schools. The age group of 3 to 4 year olds has the highest likelihood of being enrolled in private schools, with 143 (100.0% in the age bracket) enrolled. Conversely, the age group of 18 to 19 year olds has the lowest likelihood of being enrolled in a private school, with 81 (96.4% in the age bracket) attending a public institution.
| Age Bracket | Public School | Private School |
| 3 to 4 Year Olds | 0 (0.0%) | 143 (100.0%) |
| 5 to 9 Year Old | 189 (89.1%) | 23 (10.8%) |
| 10 to 14 Year Olds | 284 (91.9%) | 25 (8.1%) |
| 15 to 17 Year Olds | 276 (76.0%) | 87 (24.0%) |
| 18 to 19 Year Olds | 81 (96.4%) | 3 (3.6%) |
| 20 to 24 Year Olds | 52 (31.7%) | 112 (68.3%) |
| 25 to 34 Year Olds | 141 (84.4%) | 26 (15.6%) |
| 35 Years and over | 32 (18.6%) | 140 (81.4%) |
| Total | 1,056 (65.4%) | 558 (34.6%) |
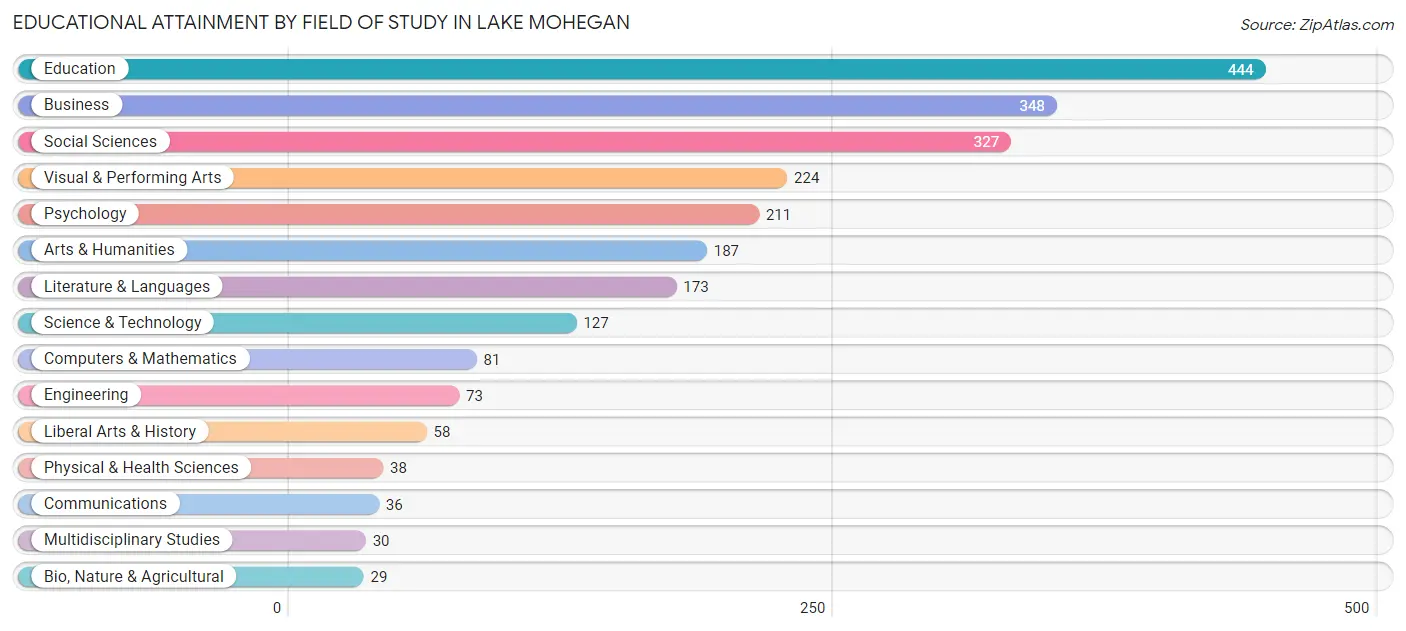
Educational Attainment by Field of Study in Lake Mohegan
Education (444 | 18.6%), business (348 | 14.6%), social sciences (327 | 13.7%), visual & performing arts (224 | 9.4%), and psychology (211 | 8.8%) are the most common fields of study among 2,386 individuals in Lake Mohegan who have obtained a bachelor's degree or higher.
| Field of Study | # Graduates | % Graduates |
| Computers & Mathematics | 81 | 3.4% |
| Bio, Nature & Agricultural | 29 | 1.2% |
| Physical & Health Sciences | 38 | 1.6% |
| Psychology | 211 | 8.8% |
| Social Sciences | 327 | 13.7% |
| Engineering | 73 | 3.1% |
| Multidisciplinary Studies | 30 | 1.3% |
| Science & Technology | 127 | 5.3% |
| Business | 348 | 14.6% |
| Education | 444 | 18.6% |
| Literature & Languages | 173 | 7.2% |
| Liberal Arts & History | 58 | 2.4% |
| Visual & Performing Arts | 224 | 9.4% |
| Communications | 36 | 1.5% |
| Arts & Humanities | 187 | 7.8% |
| Total | 2,386 | 100.0% |
Transportation & Commute in Lake Mohegan
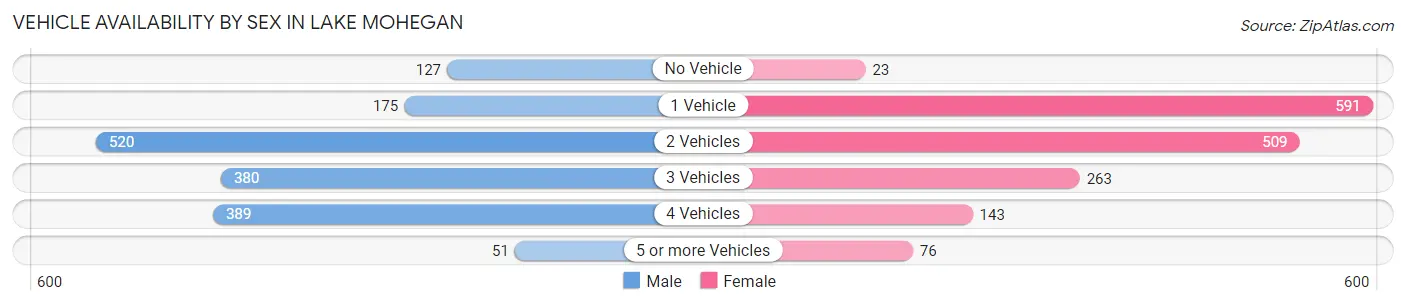
Vehicle Availability by Sex in Lake Mohegan
The most prevalent vehicle ownership categories in Lake Mohegan are males with 2 vehicles (520, accounting for 31.7%) and females with 2 vehicles (509, making up 32.4%).
| Vehicles Available | Male | Female |
| No Vehicle | 127 (7.7%) | 23 (1.4%) |
| 1 Vehicle | 175 (10.7%) | 591 (36.8%) |
| 2 Vehicles | 520 (31.7%) | 509 (31.7%) |
| 3 Vehicles | 380 (23.1%) | 263 (16.4%) |
| 4 Vehicles | 389 (23.7%) | 143 (8.9%) |
| 5 or more Vehicles | 51 (3.1%) | 76 (4.7%) |
| Total | 1,642 (100.0%) | 1,605 (100.0%) |
Commute Time in Lake Mohegan
The most frequently occuring commute durations in Lake Mohegan are 30 to 34 minutes (450 commuters, 15.4%), 10 to 14 minutes (358 commuters, 12.3%), and 60 to 89 minutes (354 commuters, 12.1%).
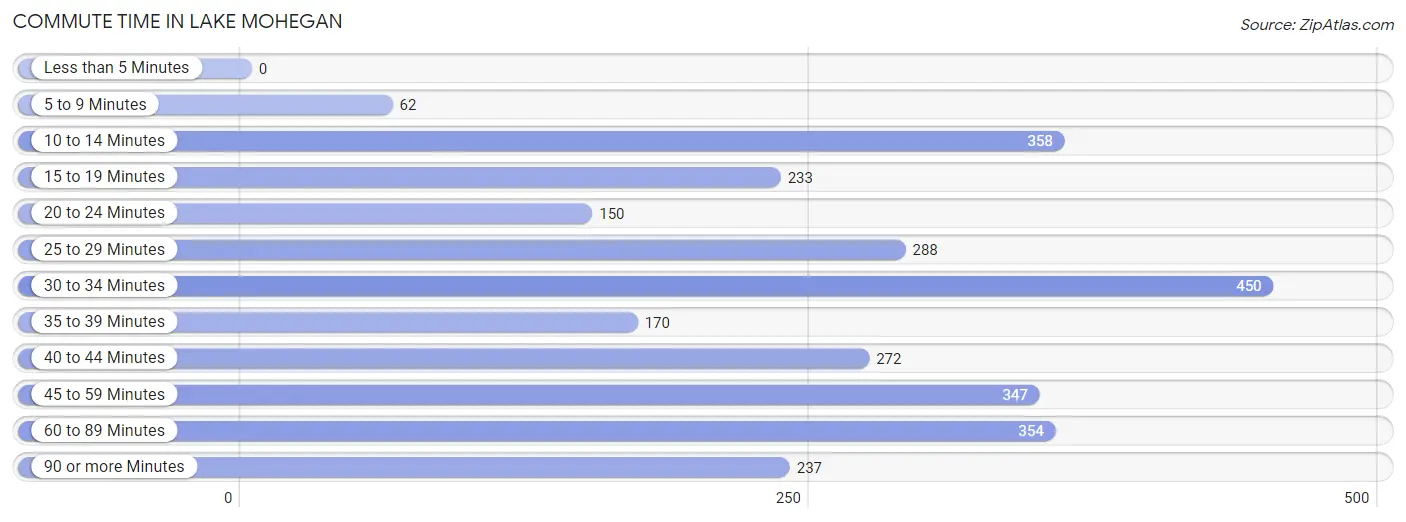
| Commute Time | # Commuters | % Commuters |
| Less than 5 Minutes | 0 | 0.0% |
| 5 to 9 Minutes | 62 | 2.1% |
| 10 to 14 Minutes | 358 | 12.3% |
| 15 to 19 Minutes | 233 | 8.0% |
| 20 to 24 Minutes | 150 | 5.1% |
| 25 to 29 Minutes | 288 | 9.9% |
| 30 to 34 Minutes | 450 | 15.4% |
| 35 to 39 Minutes | 170 | 5.8% |
| 40 to 44 Minutes | 272 | 9.3% |
| 45 to 59 Minutes | 347 | 11.9% |
| 60 to 89 Minutes | 354 | 12.1% |
| 90 or more Minutes | 237 | 8.1% |
Commute Time by Sex in Lake Mohegan
The most common commute times in Lake Mohegan are 60 to 89 minutes (278 commuters, 18.0%) for males and 25 to 29 minutes (288 commuters, 20.9%) for females.
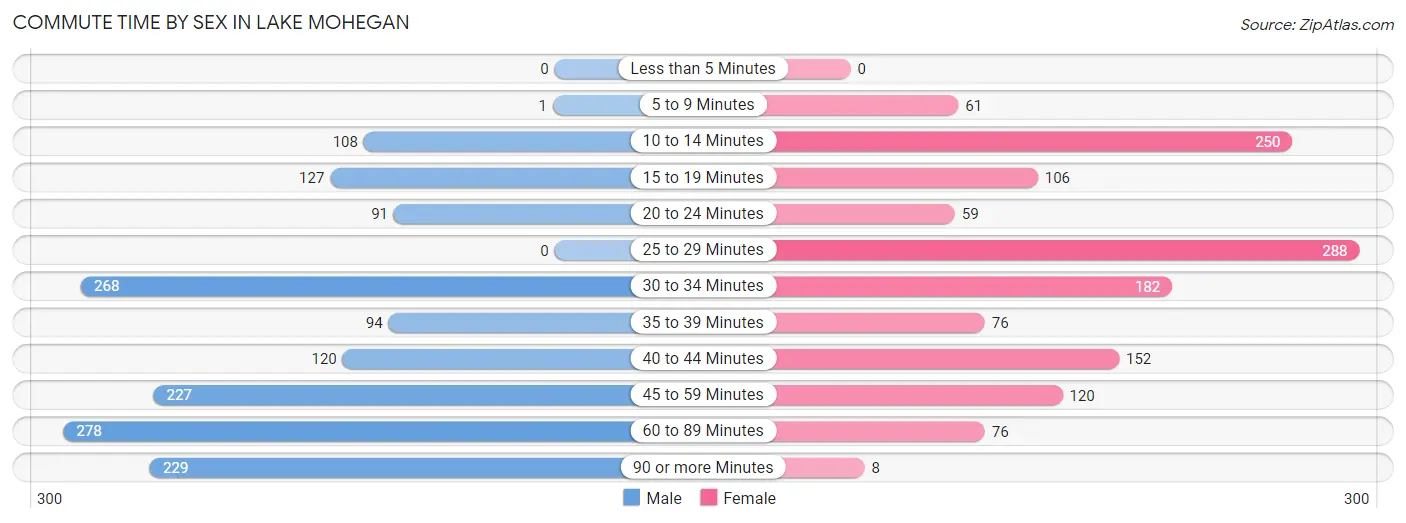
| Commute Time | Male | Female |
| Less than 5 Minutes | 0 (0.0%) | 0 (0.0%) |
| 5 to 9 Minutes | 1 (0.1%) | 61 (4.4%) |
| 10 to 14 Minutes | 108 (7.0%) | 250 (18.1%) |
| 15 to 19 Minutes | 127 (8.2%) | 106 (7.7%) |
| 20 to 24 Minutes | 91 (5.9%) | 59 (4.3%) |
| 25 to 29 Minutes | 0 (0.0%) | 288 (20.9%) |
| 30 to 34 Minutes | 268 (17.4%) | 182 (13.2%) |
| 35 to 39 Minutes | 94 (6.1%) | 76 (5.5%) |
| 40 to 44 Minutes | 120 (7.8%) | 152 (11.0%) |
| 45 to 59 Minutes | 227 (14.7%) | 120 (8.7%) |
| 60 to 89 Minutes | 278 (18.0%) | 76 (5.5%) |
| 90 or more Minutes | 229 (14.8%) | 8 (0.6%) |
Time of Departure to Work by Sex in Lake Mohegan
The most frequent times of departure to work in Lake Mohegan are 7:00 AM to 7:29 AM (351, 22.8%) for males and 8:00 AM to 8:29 AM (305, 22.1%) for females.
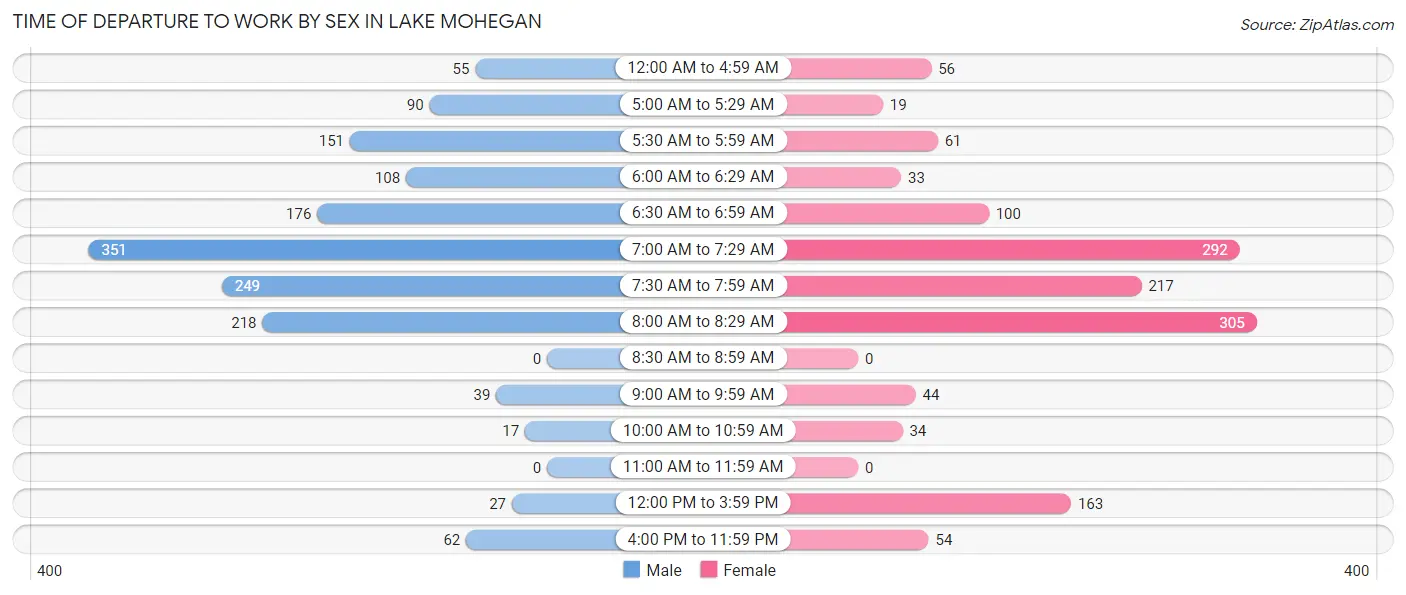
| Time of Departure | Male | Female |
| 12:00 AM to 4:59 AM | 55 (3.6%) | 56 (4.1%) |
| 5:00 AM to 5:29 AM | 90 (5.8%) | 19 (1.4%) |
| 5:30 AM to 5:59 AM | 151 (9.8%) | 61 (4.4%) |
| 6:00 AM to 6:29 AM | 108 (7.0%) | 33 (2.4%) |
| 6:30 AM to 6:59 AM | 176 (11.4%) | 100 (7.3%) |
| 7:00 AM to 7:29 AM | 351 (22.8%) | 292 (21.2%) |
| 7:30 AM to 7:59 AM | 249 (16.1%) | 217 (15.8%) |
| 8:00 AM to 8:29 AM | 218 (14.1%) | 305 (22.1%) |
| 8:30 AM to 8:59 AM | 0 (0.0%) | 0 (0.0%) |
| 9:00 AM to 9:59 AM | 39 (2.5%) | 44 (3.2%) |
| 10:00 AM to 10:59 AM | 17 (1.1%) | 34 (2.5%) |
| 11:00 AM to 11:59 AM | 0 (0.0%) | 0 (0.0%) |
| 12:00 PM to 3:59 PM | 27 (1.8%) | 163 (11.8%) |
| 4:00 PM to 11:59 PM | 62 (4.0%) | 54 (3.9%) |
| Total | 1,543 (100.0%) | 1,378 (100.0%) |
Housing Occupancy in Lake Mohegan
Occupancy by Ownership in Lake Mohegan
Of the total 2,123 dwellings in Lake Mohegan, owner-occupied units account for 1,603 (75.5%), while renter-occupied units make up 520 (24.5%).
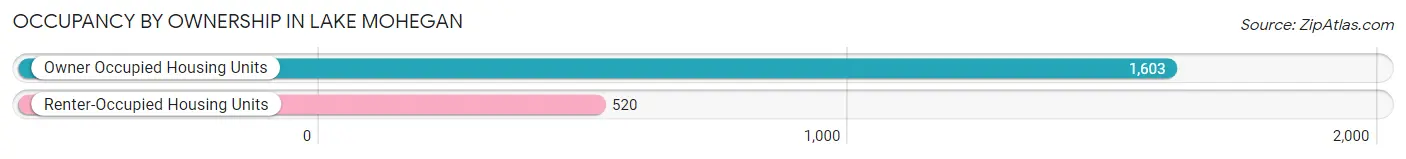
| Occupancy | # Housing Units | % Housing Units |
| Owner Occupied Housing Units | 1,603 | 75.5% |
| Renter-Occupied Housing Units | 520 | 24.5% |
| Total Occupied Housing Units | 2,123 | 100.0% |
Occupancy by Household Size in Lake Mohegan
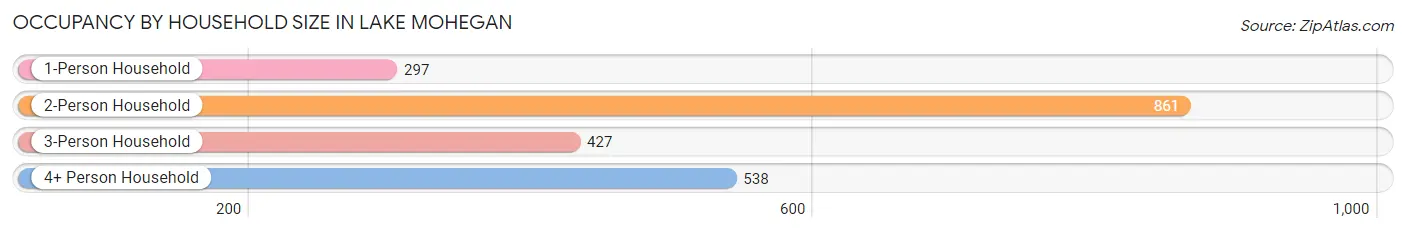
| Household Size | # Housing Units | % Housing Units |
| 1-Person Household | 297 | 14.0% |
| 2-Person Household | 861 | 40.6% |
| 3-Person Household | 427 | 20.1% |
| 4+ Person Household | 538 | 25.3% |
| Total Housing Units | 2,123 | 100.0% |
Occupancy by Ownership by Household Size in Lake Mohegan
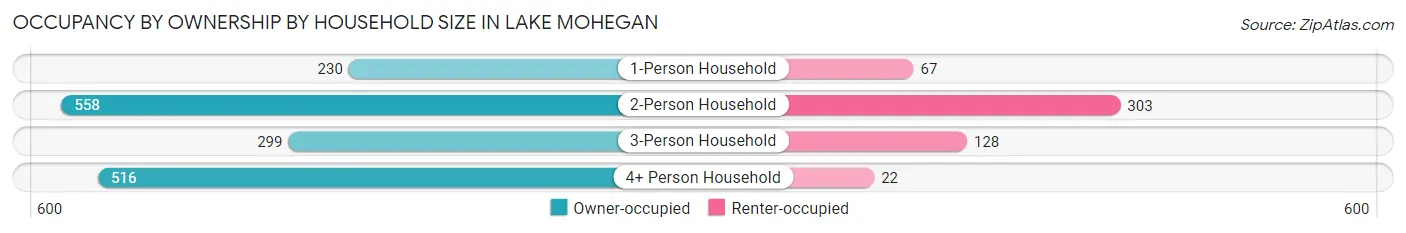
| Household Size | Owner-occupied | Renter-occupied |
| 1-Person Household | 230 (77.4%) | 67 (22.6%) |
| 2-Person Household | 558 (64.8%) | 303 (35.2%) |
| 3-Person Household | 299 (70.0%) | 128 (30.0%) |
| 4+ Person Household | 516 (95.9%) | 22 (4.1%) |
| Total Housing Units | 1,603 (75.5%) | 520 (24.5%) |
Occupancy by Educational Attainment in Lake Mohegan
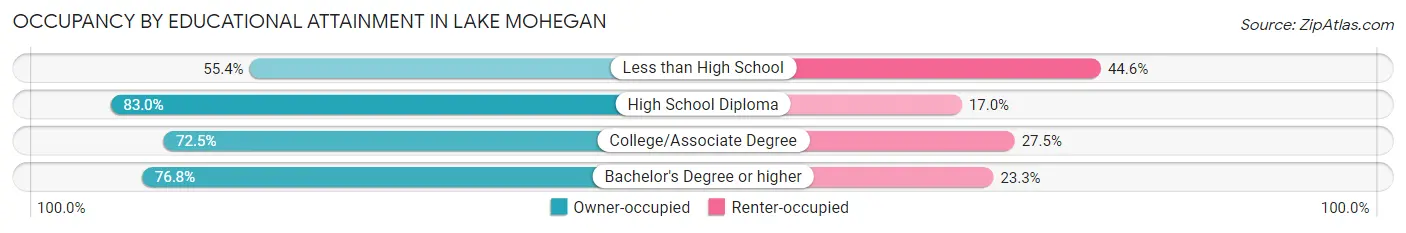
| Household Size | Owner-occupied | Renter-occupied |
| Less than High School | 51 (55.4%) | 41 (44.6%) |
| High School Diploma | 244 (83.0%) | 50 (17.0%) |
| College/Associate Degree | 433 (72.5%) | 164 (27.5%) |
| Bachelor's Degree or higher | 875 (76.7%) | 265 (23.3%) |
Occupancy by Age of Householder in Lake Mohegan
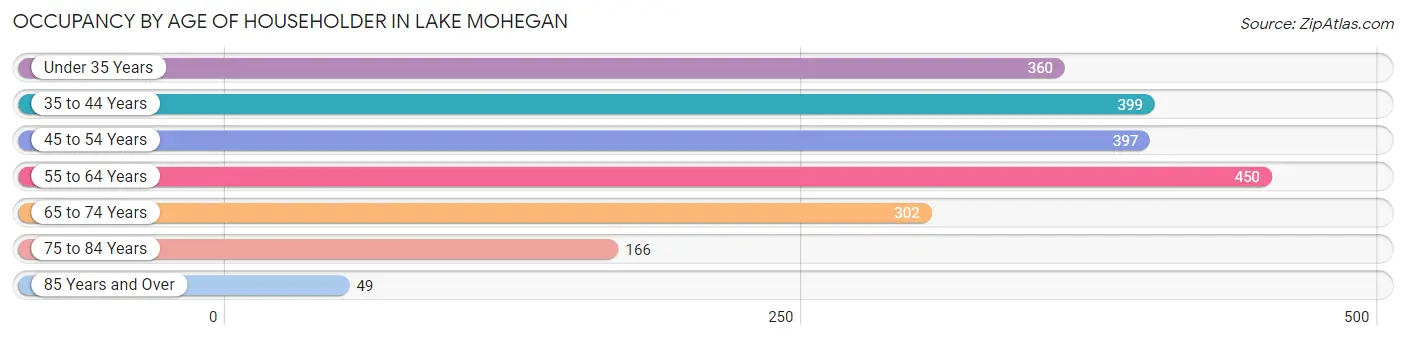
| Age Bracket | # Households | % Households |
| Under 35 Years | 360 | 17.0% |
| 35 to 44 Years | 399 | 18.8% |
| 45 to 54 Years | 397 | 18.7% |
| 55 to 64 Years | 450 | 21.2% |
| 65 to 74 Years | 302 | 14.2% |
| 75 to 84 Years | 166 | 7.8% |
| 85 Years and Over | 49 | 2.3% |
| Total | 2,123 | 100.0% |
Housing Finances in Lake Mohegan
Median Income by Occupancy in Lake Mohegan
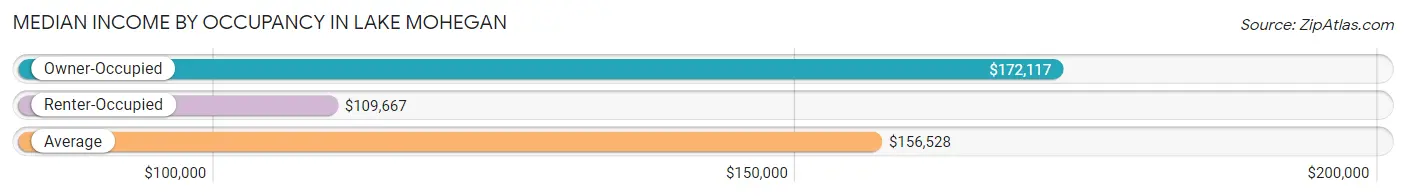
| Occupancy Type | # Households | Median Income |
| Owner-Occupied | 1,603 (75.5%) | $172,117 |
| Renter-Occupied | 520 (24.5%) | $109,667 |
| Average | 2,123 (100.0%) | $156,528 |
Occupancy by Householder Income Bracket in Lake Mohegan
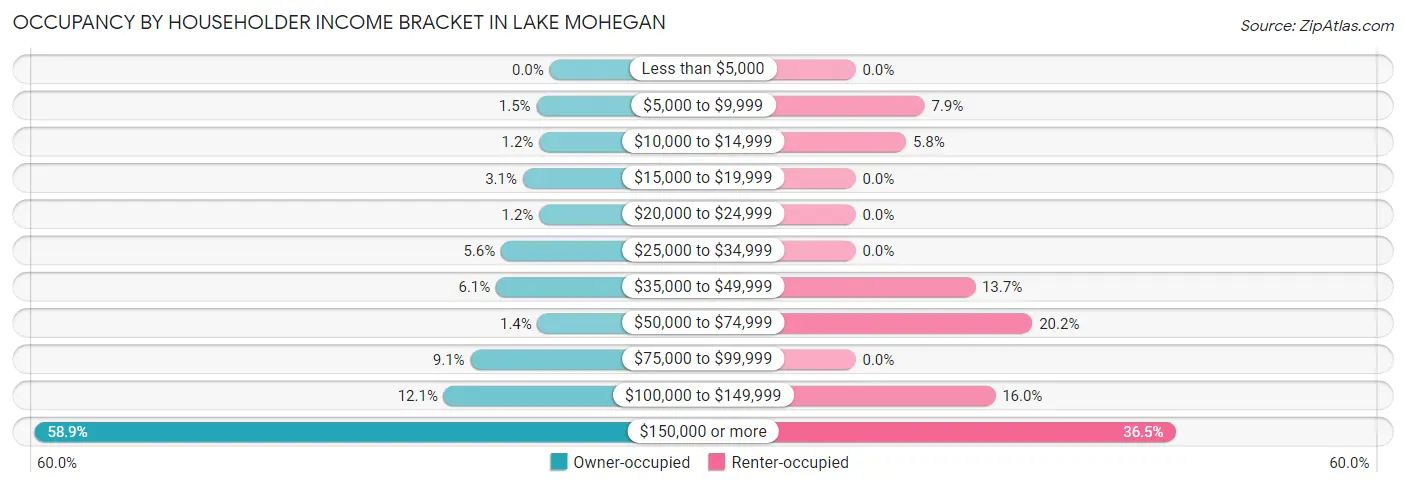
| Income Bracket | Owner-occupied | Renter-occupied |
| Less than $5,000 | 0 (0.0%) | 0 (0.0%) |
| $5,000 to $9,999 | 24 (1.5%) | 41 (7.9%) |
| $10,000 to $14,999 | 19 (1.2%) | 30 (5.8%) |
| $15,000 to $19,999 | 49 (3.1%) | 0 (0.0%) |
| $20,000 to $24,999 | 19 (1.2%) | 0 (0.0%) |
| $25,000 to $34,999 | 89 (5.6%) | 0 (0.0%) |
| $35,000 to $49,999 | 98 (6.1%) | 71 (13.7%) |
| $50,000 to $74,999 | 22 (1.4%) | 105 (20.2%) |
| $75,000 to $99,999 | 145 (9.0%) | 0 (0.0%) |
| $100,000 to $149,999 | 194 (12.1%) | 83 (16.0%) |
| $150,000 or more | 944 (58.9%) | 190 (36.5%) |
| Total | 1,603 (100.0%) | 520 (100.0%) |
Monthly Housing Cost Tiers in Lake Mohegan
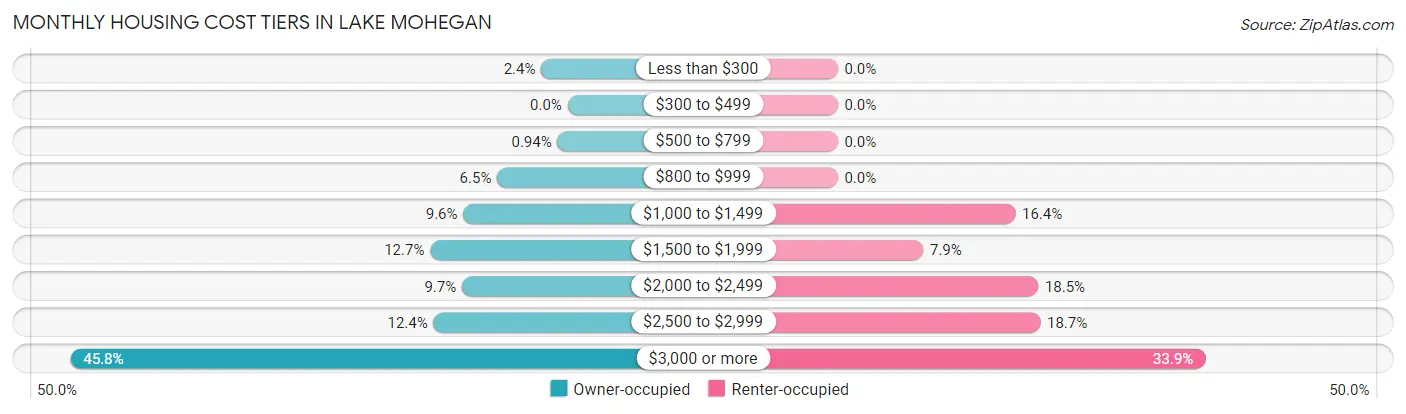
| Monthly Cost | Owner-occupied | Renter-occupied |
| Less than $300 | 39 (2.4%) | 0 (0.0%) |
| $300 to $499 | 0 (0.0%) | 0 (0.0%) |
| $500 to $799 | 15 (0.9%) | 0 (0.0%) |
| $800 to $999 | 104 (6.5%) | 0 (0.0%) |
| $1,000 to $1,499 | 154 (9.6%) | 85 (16.4%) |
| $1,500 to $1,999 | 203 (12.7%) | 41 (7.9%) |
| $2,000 to $2,499 | 156 (9.7%) | 96 (18.5%) |
| $2,500 to $2,999 | 198 (12.3%) | 97 (18.6%) |
| $3,000 or more | 734 (45.8%) | 176 (33.9%) |
| Total | 1,603 (100.0%) | 520 (100.0%) |
Physical Housing Characteristics in Lake Mohegan
Housing Structures in Lake Mohegan
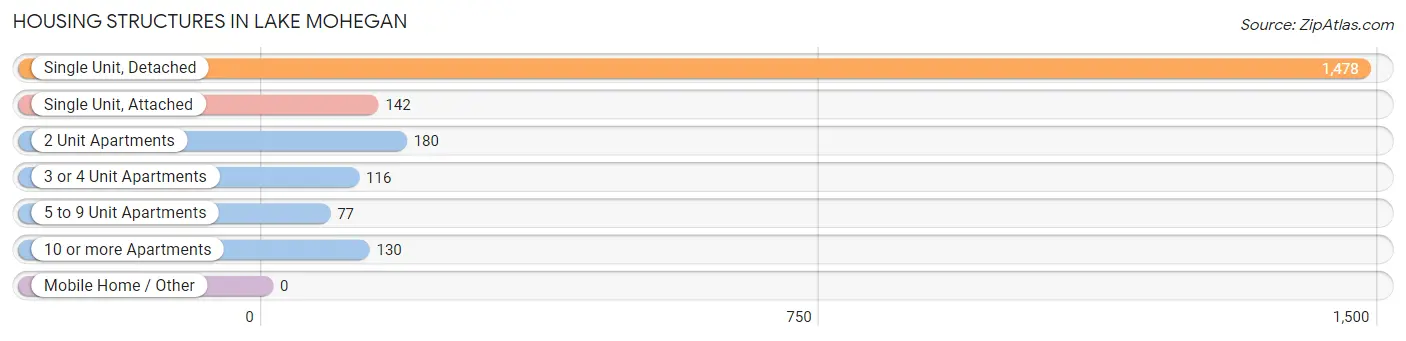
| Structure Type | # Housing Units | % Housing Units |
| Single Unit, Detached | 1,478 | 69.6% |
| Single Unit, Attached | 142 | 6.7% |
| 2 Unit Apartments | 180 | 8.5% |
| 3 or 4 Unit Apartments | 116 | 5.5% |
| 5 to 9 Unit Apartments | 77 | 3.6% |
| 10 or more Apartments | 130 | 6.1% |
| Mobile Home / Other | 0 | 0.0% |
| Total | 2,123 | 100.0% |
Housing Structures by Occupancy in Lake Mohegan
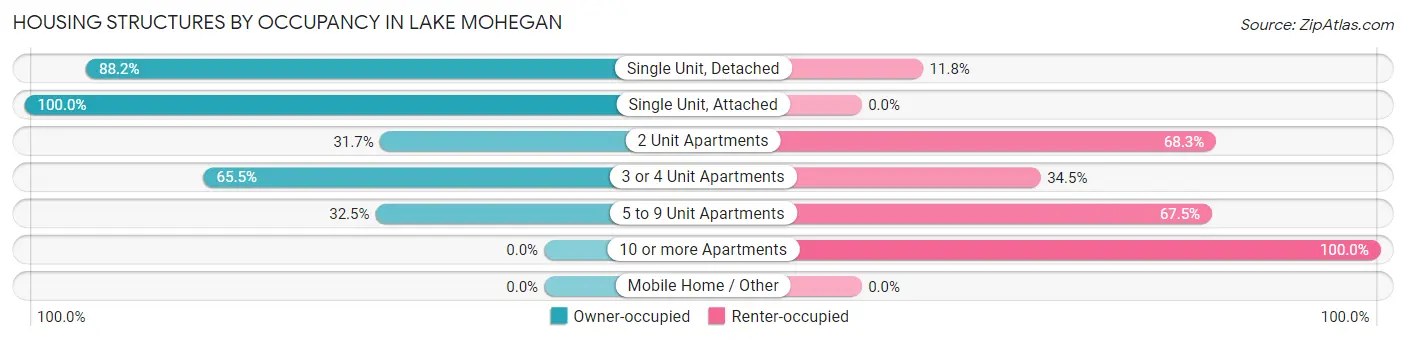
| Structure Type | Owner-occupied | Renter-occupied |
| Single Unit, Detached | 1,303 (88.2%) | 175 (11.8%) |
| Single Unit, Attached | 142 (100.0%) | 0 (0.0%) |
| 2 Unit Apartments | 57 (31.7%) | 123 (68.3%) |
| 3 or 4 Unit Apartments | 76 (65.5%) | 40 (34.5%) |
| 5 to 9 Unit Apartments | 25 (32.5%) | 52 (67.5%) |
| 10 or more Apartments | 0 (0.0%) | 130 (100.0%) |
| Mobile Home / Other | 0 (0.0%) | 0 (0.0%) |
| Total | 1,603 (75.5%) | 520 (24.5%) |
Housing Structures by Number of Rooms in Lake Mohegan
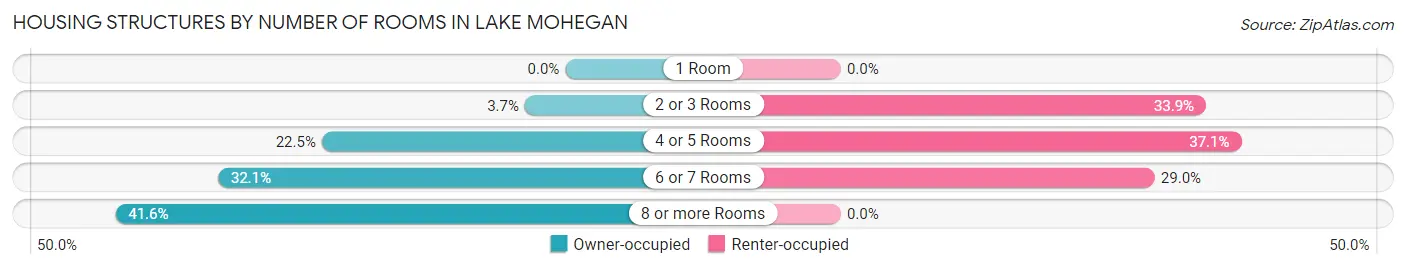
| Number of Rooms | Owner-occupied | Renter-occupied |
| 1 Room | 0 (0.0%) | 0 (0.0%) |
| 2 or 3 Rooms | 60 (3.7%) | 176 (33.9%) |
| 4 or 5 Rooms | 361 (22.5%) | 193 (37.1%) |
| 6 or 7 Rooms | 515 (32.1%) | 151 (29.0%) |
| 8 or more Rooms | 667 (41.6%) | 0 (0.0%) |
| Total | 1,603 (100.0%) | 520 (100.0%) |
Housing Structure by Heating Type in Lake Mohegan
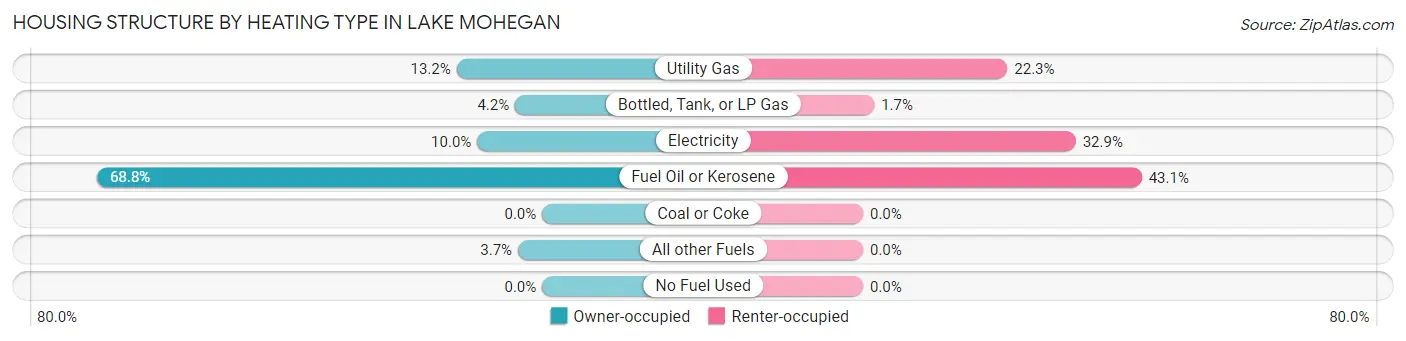
| Heating Type | Owner-occupied | Renter-occupied |
| Utility Gas | 212 (13.2%) | 116 (22.3%) |
| Bottled, Tank, or LP Gas | 67 (4.2%) | 9 (1.7%) |
| Electricity | 161 (10.0%) | 171 (32.9%) |
| Fuel Oil or Kerosene | 1,103 (68.8%) | 224 (43.1%) |
| Coal or Coke | 0 (0.0%) | 0 (0.0%) |
| All other Fuels | 60 (3.7%) | 0 (0.0%) |
| No Fuel Used | 0 (0.0%) | 0 (0.0%) |
| Total | 1,603 (100.0%) | 520 (100.0%) |
Household Vehicle Usage in Lake Mohegan
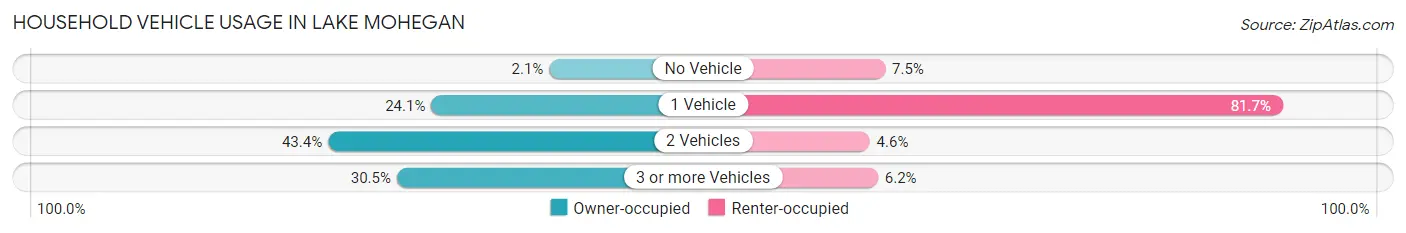
| Vehicles per Household | Owner-occupied | Renter-occupied |
| No Vehicle | 33 (2.1%) | 39 (7.5%) |
| 1 Vehicle | 386 (24.1%) | 425 (81.7%) |
| 2 Vehicles | 695 (43.4%) | 24 (4.6%) |
| 3 or more Vehicles | 489 (30.5%) | 32 (6.1%) |
| Total | 1,603 (100.0%) | 520 (100.0%) |
Real Estate & Mortgages in Lake Mohegan
Real Estate and Mortgage Overview in Lake Mohegan
| Characteristic | Without Mortgage | With Mortgage |
| Housing Units | 534 | 1,069 |
| Median Property Value | $495,900 | $483,400 |
| Median Household Income | $97,262 | $744 |
| Monthly Housing Costs | $1,501 | $725 |
| Real Estate Taxes | $10,001 | $0 |
Property Value by Mortgage Status in Lake Mohegan
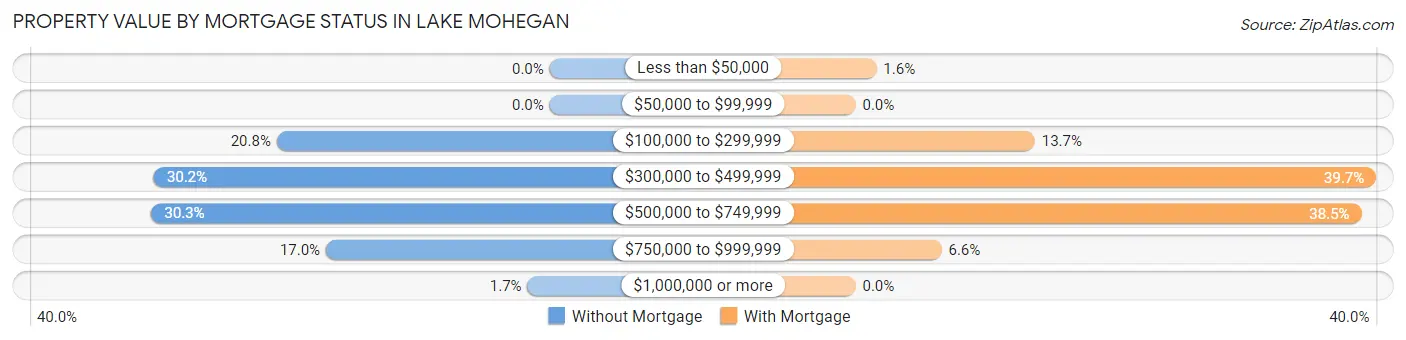
| Property Value | Without Mortgage | With Mortgage |
| Less than $50,000 | 0 (0.0%) | 17 (1.6%) |
| $50,000 to $99,999 | 0 (0.0%) | 0 (0.0%) |
| $100,000 to $299,999 | 111 (20.8%) | 146 (13.7%) |
| $300,000 to $499,999 | 161 (30.1%) | 424 (39.7%) |
| $500,000 to $749,999 | 162 (30.3%) | 412 (38.5%) |
| $750,000 to $999,999 | 91 (17.0%) | 70 (6.6%) |
| $1,000,000 or more | 9 (1.7%) | 0 (0.0%) |
| Total | 534 (100.0%) | 1,069 (100.0%) |
Household Income by Mortgage Status in Lake Mohegan
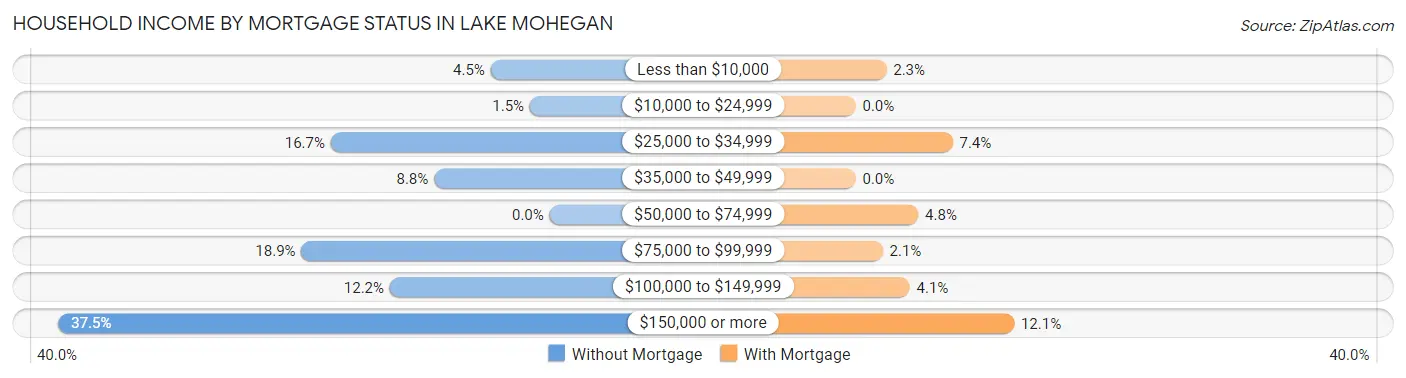
| Household Income | Without Mortgage | With Mortgage |
| Less than $10,000 | 24 (4.5%) | 25 (2.3%) |
| $10,000 to $24,999 | 8 (1.5%) | 0 (0.0%) |
| $25,000 to $34,999 | 89 (16.7%) | 79 (7.4%) |
| $35,000 to $49,999 | 47 (8.8%) | 0 (0.0%) |
| $50,000 to $74,999 | 0 (0.0%) | 51 (4.8%) |
| $75,000 to $99,999 | 101 (18.9%) | 22 (2.1%) |
| $100,000 to $149,999 | 65 (12.2%) | 44 (4.1%) |
| $150,000 or more | 200 (37.4%) | 129 (12.1%) |
| Total | 534 (100.0%) | 1,069 (100.0%) |
Property Value to Household Income Ratio in Lake Mohegan
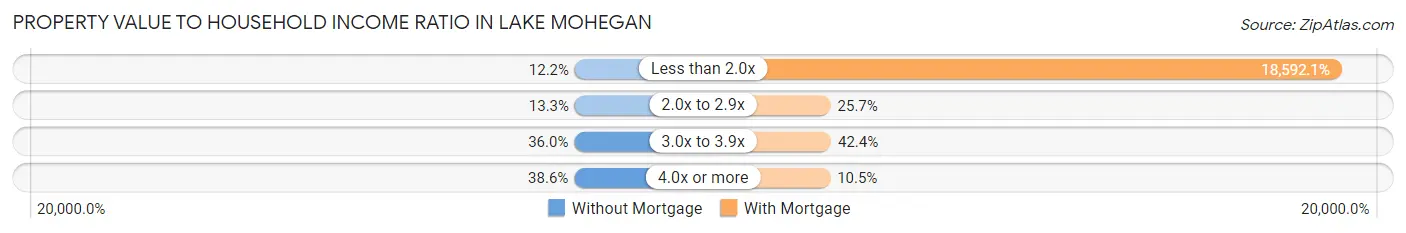
| Value-to-Income Ratio | Without Mortgage | With Mortgage |
| Less than 2.0x | 65 (12.2%) | 198,750 (18,592.1%) |
| 2.0x to 2.9x | 71 (13.3%) | 275 (25.7%) |
| 3.0x to 3.9x | 192 (36.0%) | 453 (42.4%) |
| 4.0x or more | 206 (38.6%) | 112 (10.5%) |
| Total | 534 (100.0%) | 1,069 (100.0%) |
Real Estate Taxes by Mortgage Status in Lake Mohegan
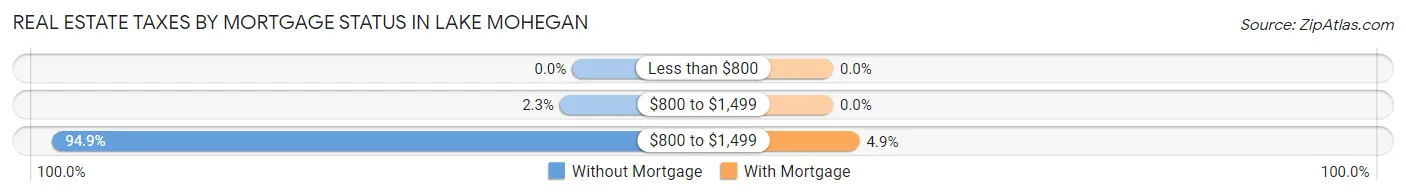
| Property Taxes | Without Mortgage | With Mortgage |
| Less than $800 | 0 (0.0%) | 0 (0.0%) |
| $800 to $1,499 | 12 (2.2%) | 0 (0.0%) |
| $800 to $1,499 | 507 (94.9%) | 52 (4.9%) |
| Total | 534 (100.0%) | 1,069 (100.0%) |
Health & Disability in Lake Mohegan
Health Insurance Coverage by Age in Lake Mohegan
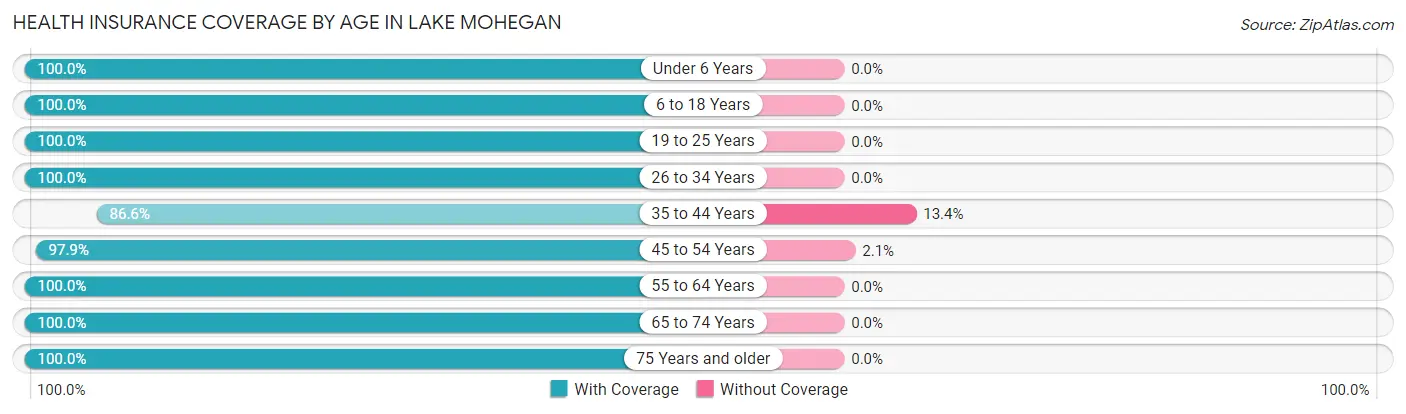
| Age Bracket | With Coverage | Without Coverage |
| Under 6 Years | 368 (100.0%) | 0 (0.0%) |
| 6 to 18 Years | 857 (100.0%) | 0 (0.0%) |
| 19 to 25 Years | 651 (100.0%) | 0 (0.0%) |
| 26 to 34 Years | 710 (100.0%) | 0 (0.0%) |
| 35 to 44 Years | 619 (86.6%) | 96 (13.4%) |
| 45 to 54 Years | 905 (97.9%) | 19 (2.1%) |
| 55 to 64 Years | 693 (100.0%) | 0 (0.0%) |
| 65 to 74 Years | 484 (100.0%) | 0 (0.0%) |
| 75 Years and older | 429 (100.0%) | 0 (0.0%) |
| Total | 5,716 (98.0%) | 115 (2.0%) |
Health Insurance Coverage by Citizenship Status in Lake Mohegan
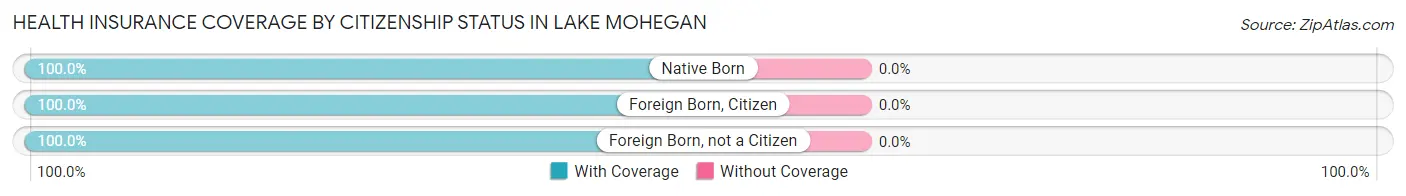
| Citizenship Status | With Coverage | Without Coverage |
| Native Born | 368 (100.0%) | 0 (0.0%) |
| Foreign Born, Citizen | 857 (100.0%) | 0 (0.0%) |
| Foreign Born, not a Citizen | 651 (100.0%) | 0 (0.0%) |
Health Insurance Coverage by Household Income in Lake Mohegan
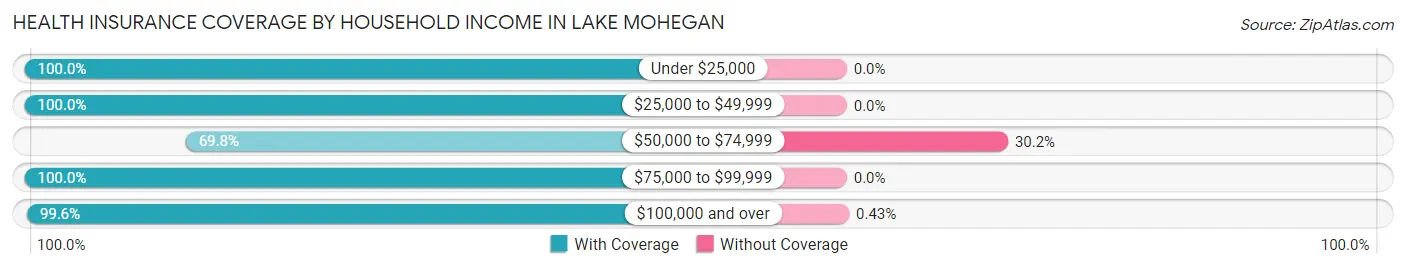
| Household Income | With Coverage | Without Coverage |
| Under $25,000 | 347 (100.0%) | 0 (0.0%) |
| $25,000 to $49,999 | 447 (100.0%) | 0 (0.0%) |
| $50,000 to $74,999 | 222 (69.8%) | 96 (30.2%) |
| $75,000 to $99,999 | 292 (100.0%) | 0 (0.0%) |
| $100,000 and over | 4,381 (99.6%) | 19 (0.4%) |
Public vs Private Health Insurance Coverage by Age in Lake Mohegan
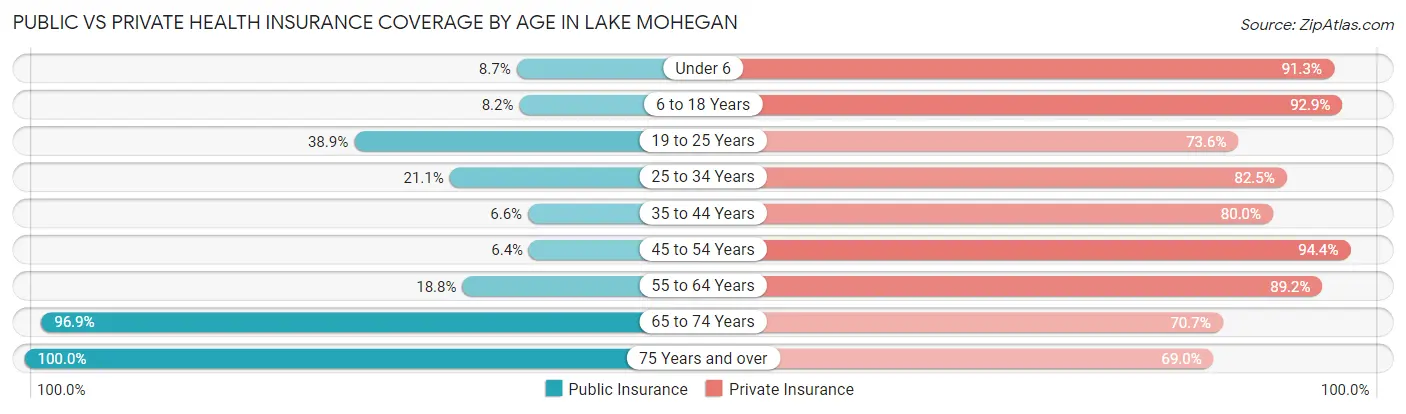
| Age Bracket | Public Insurance | Private Insurance |
| Under 6 | 32 (8.7%) | 336 (91.3%) |
| 6 to 18 Years | 70 (8.2%) | 796 (92.9%) |
| 19 to 25 Years | 253 (38.9%) | 479 (73.6%) |
| 25 to 34 Years | 150 (21.1%) | 586 (82.5%) |
| 35 to 44 Years | 47 (6.6%) | 572 (80.0%) |
| 45 to 54 Years | 59 (6.4%) | 872 (94.4%) |
| 55 to 64 Years | 130 (18.8%) | 618 (89.2%) |
| 65 to 74 Years | 469 (96.9%) | 342 (70.7%) |
| 75 Years and over | 429 (100.0%) | 296 (69.0%) |
| Total | 1,639 (28.1%) | 4,897 (84.0%) |
Disability Status by Sex by Age in Lake Mohegan
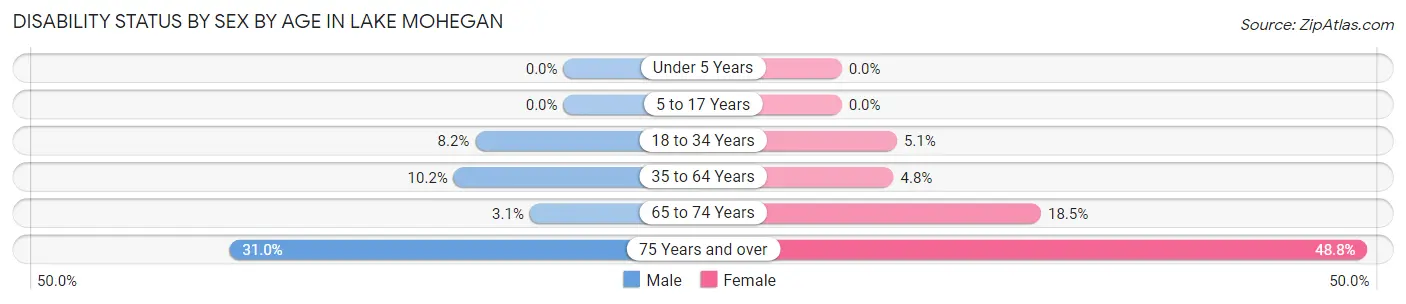
| Age Bracket | Male | Female |
| Under 5 Years | 0 (0.0%) | 0 (0.0%) |
| 5 to 17 Years | 0 (0.0%) | 0 (0.0%) |
| 18 to 34 Years | 57 (8.2%) | 34 (5.1%) |
| 35 to 64 Years | 121 (10.2%) | 55 (4.8%) |
| 65 to 74 Years | 6 (3.1%) | 54 (18.5%) |
| 75 Years and over | 44 (31.0%) | 140 (48.8%) |
Disability Class by Sex by Age in Lake Mohegan
Disability Class: Hearing Difficulty
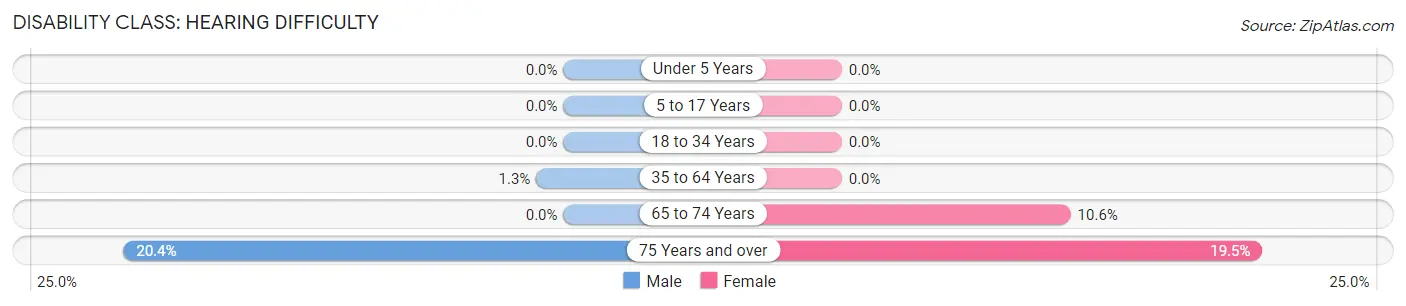
| Age Bracket | Male | Female |
| Under 5 Years | 0 (0.0%) | 0 (0.0%) |
| 5 to 17 Years | 0 (0.0%) | 0 (0.0%) |
| 18 to 34 Years | 0 (0.0%) | 0 (0.0%) |
| 35 to 64 Years | 15 (1.3%) | 0 (0.0%) |
| 65 to 74 Years | 0 (0.0%) | 31 (10.6%) |
| 75 Years and over | 29 (20.4%) | 56 (19.5%) |
Disability Class: Vision Difficulty
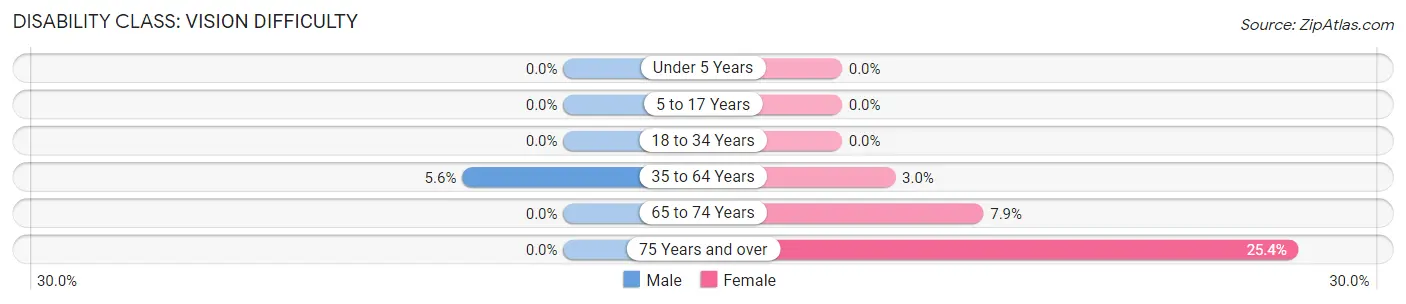
| Age Bracket | Male | Female |
| Under 5 Years | 0 (0.0%) | 0 (0.0%) |
| 5 to 17 Years | 0 (0.0%) | 0 (0.0%) |
| 18 to 34 Years | 0 (0.0%) | 0 (0.0%) |
| 35 to 64 Years | 67 (5.6%) | 34 (3.0%) |
| 65 to 74 Years | 0 (0.0%) | 23 (7.9%) |
| 75 Years and over | 0 (0.0%) | 73 (25.4%) |
Disability Class: Cognitive Difficulty
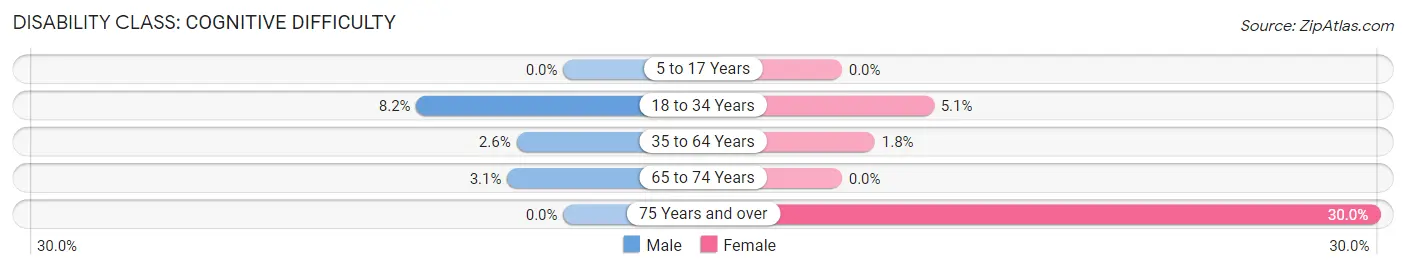
| Age Bracket | Male | Female |
| 5 to 17 Years | 0 (0.0%) | 0 (0.0%) |
| 18 to 34 Years | 57 (8.2%) | 34 (5.1%) |
| 35 to 64 Years | 31 (2.6%) | 21 (1.8%) |
| 65 to 74 Years | 6 (3.1%) | 0 (0.0%) |
| 75 Years and over | 0 (0.0%) | 86 (30.0%) |
Disability Class: Ambulatory Difficulty
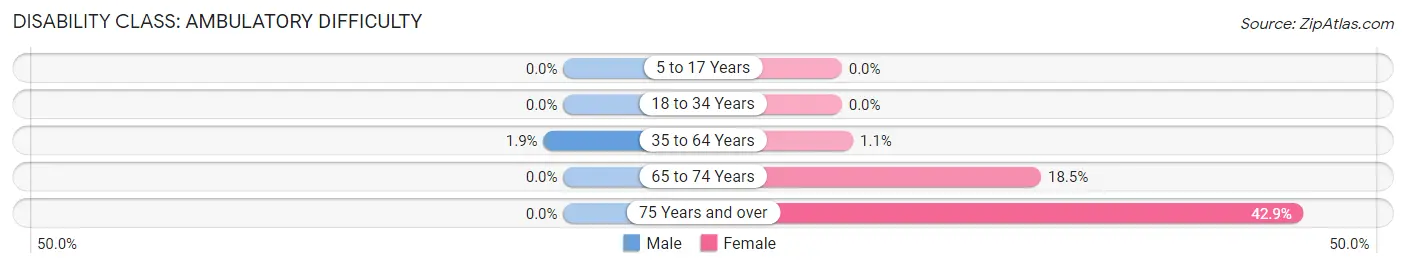
| Age Bracket | Male | Female |
| 5 to 17 Years | 0 (0.0%) | 0 (0.0%) |
| 18 to 34 Years | 0 (0.0%) | 0 (0.0%) |
| 35 to 64 Years | 22 (1.8%) | 12 (1.1%) |
| 65 to 74 Years | 0 (0.0%) | 54 (18.5%) |
| 75 Years and over | 0 (0.0%) | 123 (42.9%) |
Disability Class: Self-Care Difficulty
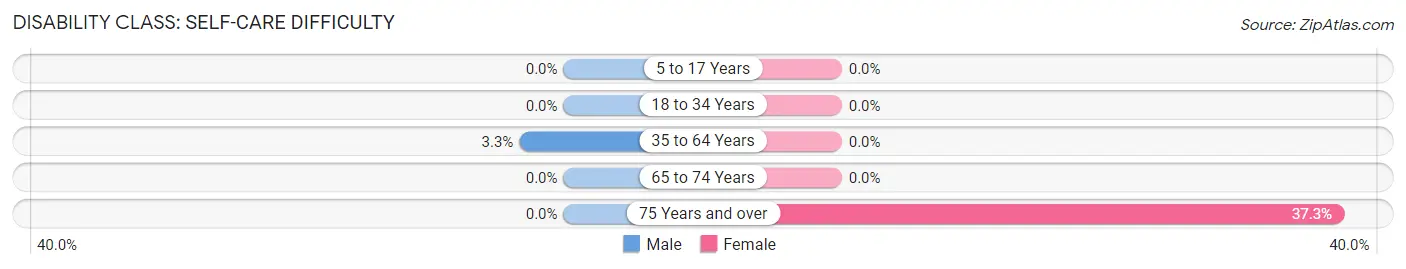
| Age Bracket | Male | Female |
| 5 to 17 Years | 0 (0.0%) | 0 (0.0%) |
| 18 to 34 Years | 0 (0.0%) | 0 (0.0%) |
| 35 to 64 Years | 39 (3.3%) | 0 (0.0%) |
| 65 to 74 Years | 0 (0.0%) | 0 (0.0%) |
| 75 Years and over | 0 (0.0%) | 107 (37.3%) |
Technology Access in Lake Mohegan
Computing Device Access in Lake Mohegan
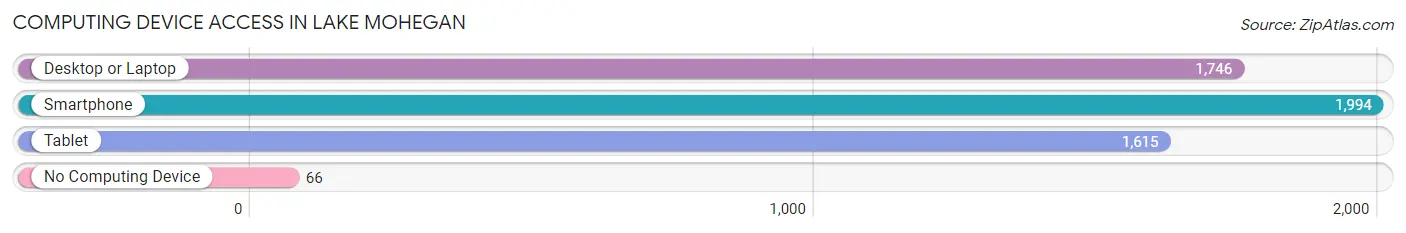
| Device Type | # Households | % Households |
| Desktop or Laptop | 1,746 | 82.2% |
| Smartphone | 1,994 | 93.9% |
| Tablet | 1,615 | 76.1% |
| No Computing Device | 66 | 3.1% |
| Total | 2,123 | 100.0% |
Internet Access in Lake Mohegan
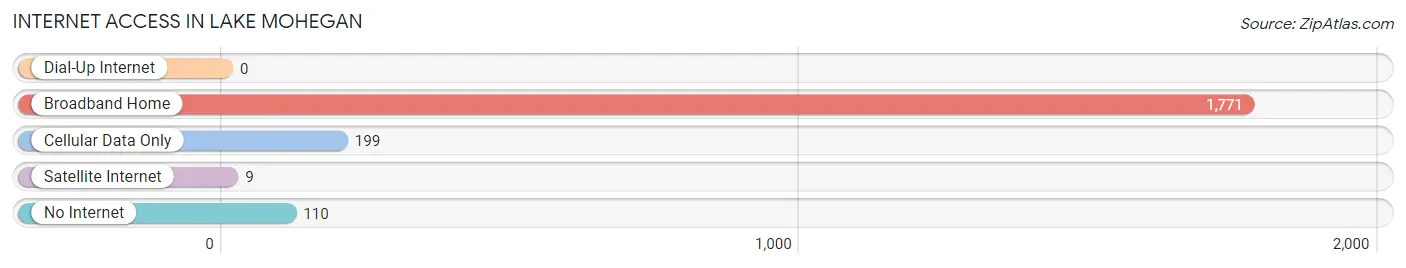
| Internet Type | # Households | % Households |
| Dial-Up Internet | 0 | 0.0% |
| Broadband Home | 1,771 | 83.4% |
| Cellular Data Only | 199 | 9.4% |
| Satellite Internet | 9 | 0.4% |
| No Internet | 110 | 5.2% |
| Total | 2,123 | 100.0% |
Lake Mohegan Summary
Introduction
Lake Mohegan is a hamlet located in the town of Yorktown in Westchester County, New York. It is situated on the east side of the Croton Reservoir, which is part of the New York City water supply system. The hamlet is home to a variety of businesses, including a golf course, a marina, and a number of restaurants. It is also home to a number of residential neighborhoods, including the Lake Mohegan Estates and the Lake Mohegan Country Club.
History
The area that is now Lake Mohegan was originally inhabited by the Mohegan Indians, who were part of the Algonquin tribe. The Mohegans were a peaceful people who lived in the area for centuries before the arrival of European settlers. The first Europeans to settle in the area were Dutch farmers, who arrived in the late 1600s. The area was then known as Mohegan Lake, and the lake itself was named after the Mohegan Indians.
In the late 1800s, the area began to develop as a summer resort destination. The Lake Mohegan Hotel was built in 1891, and the Lake Mohegan Country Club was established in 1895. The area also became a popular spot for fishing and boating.
In the early 1900s, the area began to develop as a residential community. The Lake Mohegan Estates were built in the 1920s, and the Lake Mohegan Country Club was expanded in the 1930s. The area continued to grow in the 1950s and 1960s, and the population of the hamlet reached its peak in the 1970s.
Geography
Lake Mohegan is located in the town of Yorktown in Westchester County, New York. It is situated on the east side of the Croton Reservoir, which is part of the New York City water supply system. The hamlet is bordered by the towns of Somers and Cortlandt to the north, and the towns of New Castle and Mount Pleasant to the south. The hamlet is located approximately 40 miles north of New York City.
The hamlet is situated on a plateau that is surrounded by hills and valleys. The highest point in the hamlet is the summit of Mohegan Hill, which is located at an elevation of 890 feet. The hamlet is also home to a number of lakes, including Lake Mohegan, Lake Peekskill, and Lake Oscawana.
Economy
The economy of Lake Mohegan is largely based on tourism and recreation. The hamlet is home to a variety of businesses, including a golf course, a marina, and a number of restaurants. It is also home to a number of residential neighborhoods, including the Lake Mohegan Estates and the Lake Mohegan Country Club.
The hamlet is also home to a number of manufacturing and industrial businesses. The largest employer in the hamlet is the Yorktown Cement Company, which produces cement and other building materials. The hamlet is also home to a number of small businesses, including a number of retail stores and restaurants.
Demographics
As of the 2010 census, the population of Lake Mohegan was 4,845. The population is largely white (90.3%), with a small percentage of African Americans (2.3%) and Hispanics (3.2%). The median household income in the hamlet is $90,945, and the median home value is $541,000.
Conclusion
Lake Mohegan is a hamlet located in the town of Yorktown in Westchester County, New York. It is situated on the east side of the Croton Reservoir, which is part of the New York City water supply system. The hamlet is home to a variety of businesses, including a golf course, a marina, and a number of restaurants. It is also home to a number of residential neighborhoods, including the Lake Mohegan Estates and the Lake Mohegan Country Club. The economy of the hamlet is largely based on tourism and recreation, and the population is largely white.
Common Questions
What is Per Capita Income in Lake Mohegan?
Per Capita income in Lake Mohegan is $64,936.
What is the Median Family Income in Lake Mohegan?
Median Family Income in Lake Mohegan is $189,491.
What is the Median Household income in Lake Mohegan?
Median Household Income in Lake Mohegan is $156,528.
What is Income or Wage Gap in Lake Mohegan?
Income or Wage Gap in Lake Mohegan is 34.9%.
Women in Lake Mohegan earn 65.1 cents for every dollar earned by a man.
What is Inequality or Gini Index in Lake Mohegan?
Inequality or Gini Index in Lake Mohegan is 0.39.
What is the Total Population of Lake Mohegan?
Total Population of Lake Mohegan is 5,938.
What is the Total Male Population of Lake Mohegan?
Total Male Population of Lake Mohegan is 3,045.
What is the Total Female Population of Lake Mohegan?
Total Female Population of Lake Mohegan is 2,893.
What is the Ratio of Males per 100 Females in Lake Mohegan?
There are 105.25 Males per 100 Females in Lake Mohegan.
What is the Ratio of Females per 100 Males in Lake Mohegan?
There are 95.01 Females per 100 Males in Lake Mohegan.
What is the Median Population Age in Lake Mohegan?
Median Population Age in Lake Mohegan is 38.1 Years.
What is the Average Family Size in Lake Mohegan
Average Family Size in Lake Mohegan is 3.1 People.
What is the Average Household Size in Lake Mohegan
Average Household Size in Lake Mohegan is 2.7 People.
How Large is the Labor Force in Lake Mohegan?
There are 3,412 People in the Labor Forcein in Lake Mohegan.
What is the Percentage of People in the Labor Force in Lake Mohegan?
69.2% of People are in the Labor Force in Lake Mohegan.
What is the Unemployment Rate in Lake Mohegan?
Unemployment Rate in Lake Mohegan is 2.7%.