St James, NY Map & Demographics
St James Map
St James Overview
$63,998
PER CAPITA INCOME
$174,184
AVG FAMILY INCOME
$142,448
AVG HOUSEHOLD INCOME
24.7%
WAGE / INCOME GAP [ % ]
75.3¢/ $1
WAGE / INCOME GAP [ $ ]
0.42
INEQUALITY / GINI INDEX
13,733
TOTAL POPULATION
6,615
MALE POPULATION
7,118
FEMALE POPULATION
92.93
MALES / 100 FEMALES
107.60
FEMALES / 100 MALES
46.3
MEDIAN AGE
3.3
AVG FAMILY SIZE
2.8
AVG HOUSEHOLD SIZE
7,195
LABOR FORCE [ PEOPLE ]
63.4%
PERCENT IN LABOR FORCE
4.4%
UNEMPLOYMENT RATE
Income in St James
Income Overview in St James
Per Capita Income in St James is $63,998, while median incomes of families and households are $174,184 and $142,448 respectively.
| Characteristic | Number | Measure |
| Per Capita Income | 13,733 | $63,998 |
| Median Family Income | 3,556 | $174,184 |
| Mean Family Income | 3,556 | $201,512 |
| Median Household Income | 4,826 | $142,448 |
| Mean Household Income | 4,826 | $175,553 |
| Income Deficit | 3,556 | $0 |
| Wage / Income Gap (%) | 13,733 | 24.66% |
| Wage / Income Gap ($) | 13,733 | 75.34¢ per $1 |
| Gini / Inequality Index | 13,733 | 0.42 |
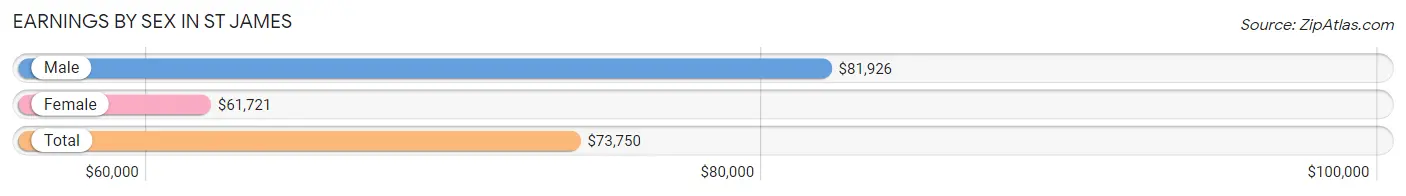
Earnings by Sex in St James
Average Earnings in St James are $73,750, $81,926 for men and $61,721 for women, a difference of 24.7%.
| Sex | Number | Average Earnings |
| Male | 3,985 (53.4%) | $81,926 |
| Female | 3,475 (46.6%) | $61,721 |
| Total | 7,460 (100.0%) | $73,750 |
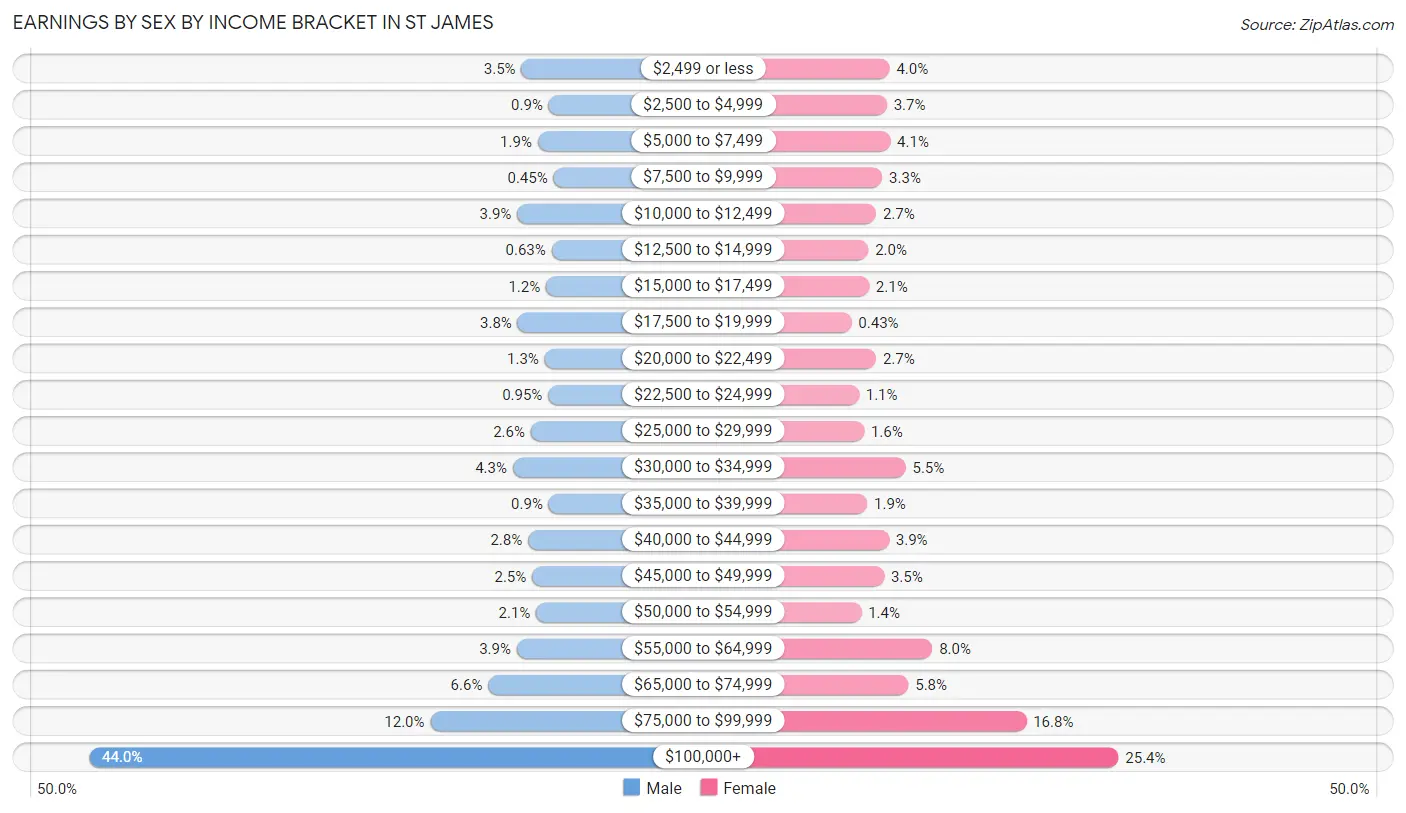
Earnings by Sex by Income Bracket in St James
The most common earnings brackets in St James are $100,000+ for men (1,752 | 44.0%) and $100,000+ for women (884 | 25.4%).
| Income | Male | Female |
| $2,499 or less | 138 (3.5%) | 139 (4.0%) |
| $2,500 to $4,999 | 36 (0.9%) | 130 (3.7%) |
| $5,000 to $7,499 | 77 (1.9%) | 141 (4.1%) |
| $7,500 to $9,999 | 18 (0.4%) | 115 (3.3%) |
| $10,000 to $12,499 | 154 (3.9%) | 95 (2.7%) |
| $12,500 to $14,999 | 25 (0.6%) | 70 (2.0%) |
| $15,000 to $17,499 | 46 (1.1%) | 72 (2.1%) |
| $17,500 to $19,999 | 152 (3.8%) | 15 (0.4%) |
| $20,000 to $22,499 | 51 (1.3%) | 95 (2.7%) |
| $22,500 to $24,999 | 38 (0.9%) | 39 (1.1%) |
| $25,000 to $29,999 | 103 (2.6%) | 56 (1.6%) |
| $30,000 to $34,999 | 170 (4.3%) | 191 (5.5%) |
| $35,000 to $39,999 | 36 (0.9%) | 66 (1.9%) |
| $40,000 to $44,999 | 113 (2.8%) | 137 (3.9%) |
| $45,000 to $49,999 | 98 (2.5%) | 121 (3.5%) |
| $50,000 to $54,999 | 83 (2.1%) | 47 (1.3%) |
| $55,000 to $64,999 | 155 (3.9%) | 278 (8.0%) |
| $65,000 to $74,999 | 262 (6.6%) | 200 (5.8%) |
| $75,000 to $99,999 | 478 (12.0%) | 584 (16.8%) |
| $100,000+ | 1,752 (44.0%) | 884 (25.4%) |
| Total | 3,985 (100.0%) | 3,475 (100.0%) |
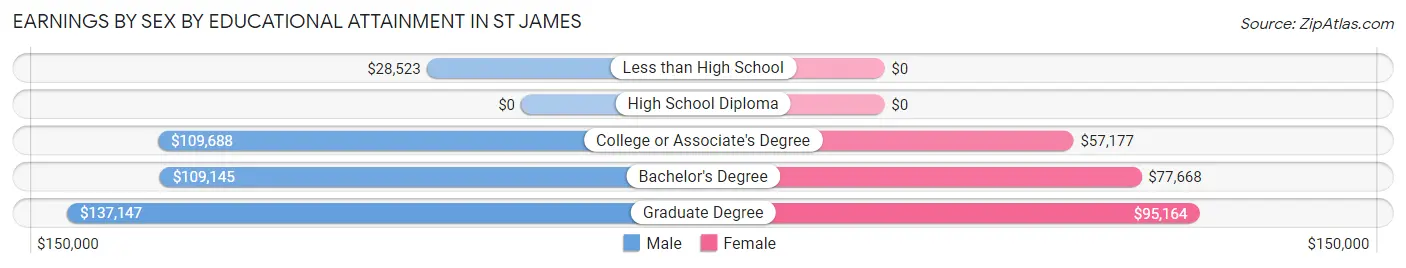
Earnings by Sex by Educational Attainment in St James
Average earnings in St James are $107,644 for men and $72,560 for women, a difference of 32.6%. Men with an educational attainment of graduate degree enjoy the highest average annual earnings of $137,147, while those with less than high school education earn the least with $28,523. Women with an educational attainment of graduate degree earn the most with the average annual earnings of $95,164, while those with college or associate's degree education have the smallest earnings of $57,177.
| Educational Attainment | Male Income | Female Income |
| Less than High School | $28,523 | $0 |
| High School Diploma | - | - |
| College or Associate's Degree | $109,688 | $57,177 |
| Bachelor's Degree | $109,145 | $77,668 |
| Graduate Degree | $137,147 | $95,164 |
| Total | $107,644 | $72,560 |
Family Income in St James
Family Income Brackets in St James
According to the St James family income data, there are 1,479 families falling into the $200,000+ income range, which is the most common income bracket and makes up 41.6% of all families. Conversely, the less than $10,000 income bracket is the least frequent group with only 7 families (0.2%) belonging to this category.
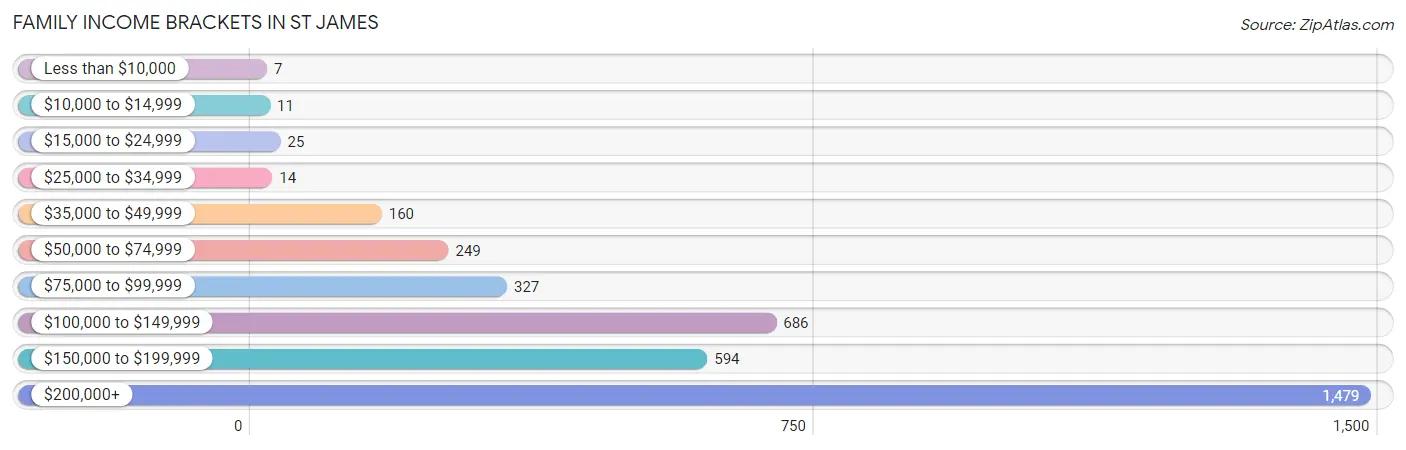
| Income Bracket | # Families | % Families |
| Less than $10,000 | 7 | 0.2% |
| $10,000 to $14,999 | 11 | 0.3% |
| $15,000 to $24,999 | 25 | 0.7% |
| $25,000 to $34,999 | 14 | 0.4% |
| $35,000 to $49,999 | 160 | 4.5% |
| $50,000 to $74,999 | 249 | 7.0% |
| $75,000 to $99,999 | 327 | 9.2% |
| $100,000 to $149,999 | 686 | 19.3% |
| $150,000 to $199,999 | 594 | 16.7% |
| $200,000+ | 1,479 | 41.6% |
Family Income by Famaliy Size in St James
5-person families (302 | 8.5%) account for the highest median family income in St James with $238,889 per family, while 3-person families (711 | 20.0%) have the highest median income of $67,580 per family member.
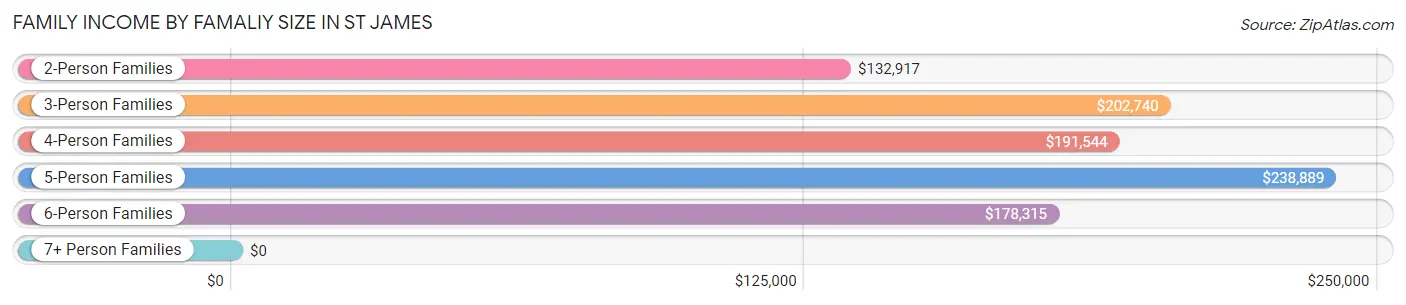
| Income Bracket | # Families | Median Income |
| 2-Person Families | 1,513 (42.5%) | $132,917 |
| 3-Person Families | 711 (20.0%) | $202,740 |
| 4-Person Families | 913 (25.7%) | $191,544 |
| 5-Person Families | 302 (8.5%) | $238,889 |
| 6-Person Families | 97 (2.7%) | $178,315 |
| 7+ Person Families | 20 (0.6%) | $0 |
| Total | 3,556 (100.0%) | $174,184 |
Family Income by Number of Earners in St James
The median family income in St James is $174,184, with families comprising 3+ earners (691) having the highest median family income of $250,001, while families with no earners (584) have the lowest median family income of $79,583, accounting for 19.4% and 16.4% of families, respectively.
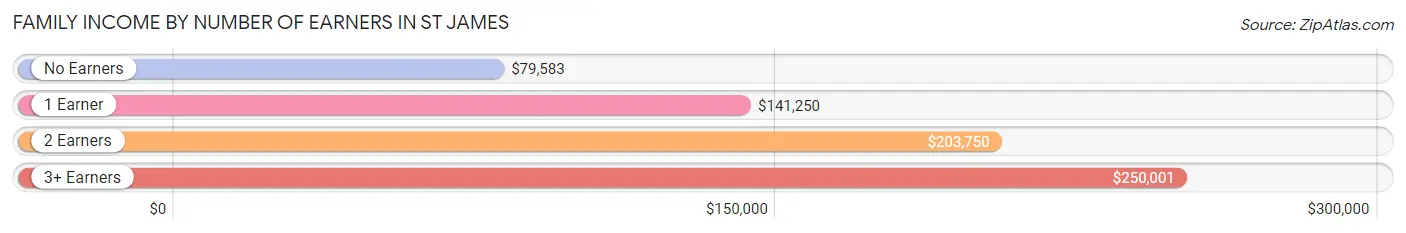
| Number of Earners | # Families | Median Income |
| No Earners | 584 (16.4%) | $79,583 |
| 1 Earner | 760 (21.4%) | $141,250 |
| 2 Earners | 1,521 (42.8%) | $203,750 |
| 3+ Earners | 691 (19.4%) | $250,001 |
| Total | 3,556 (100.0%) | $174,184 |
Household Income in St James
Household Income Brackets in St James
With 1,564 households falling in the category, the $200,000+ income range is the most frequent in St James, accounting for 32.4% of all households. In contrast, only 14 households (0.3%) fall into the $10,000 to $14,999 income bracket, making it the least populous group.
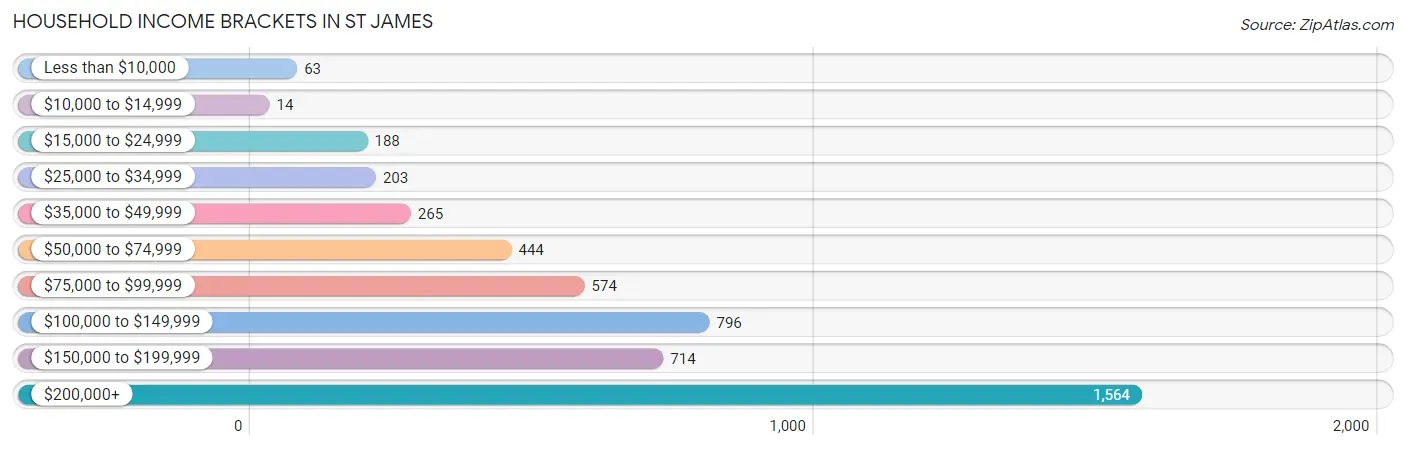
| Income Bracket | # Households | % Households |
| Less than $10,000 | 63 | 1.3% |
| $10,000 to $14,999 | 14 | 0.3% |
| $15,000 to $24,999 | 188 | 3.9% |
| $25,000 to $34,999 | 203 | 4.2% |
| $35,000 to $49,999 | 265 | 5.5% |
| $50,000 to $74,999 | 444 | 9.2% |
| $75,000 to $99,999 | 574 | 11.9% |
| $100,000 to $149,999 | 796 | 16.5% |
| $150,000 to $199,999 | 714 | 14.8% |
| $200,000+ | 1,564 | 32.4% |
Household Income by Householder Age in St James
The median household income in St James is $142,448, with the highest median household income of $190,172 found in the 45 to 64 years age bracket for the primary householder. A total of 2,292 households (47.5%) fall into this category. Meanwhile, the 15 to 24 years age bracket for the primary householder has the lowest median household income of $33,906, with 90 households (1.9%) in this group.
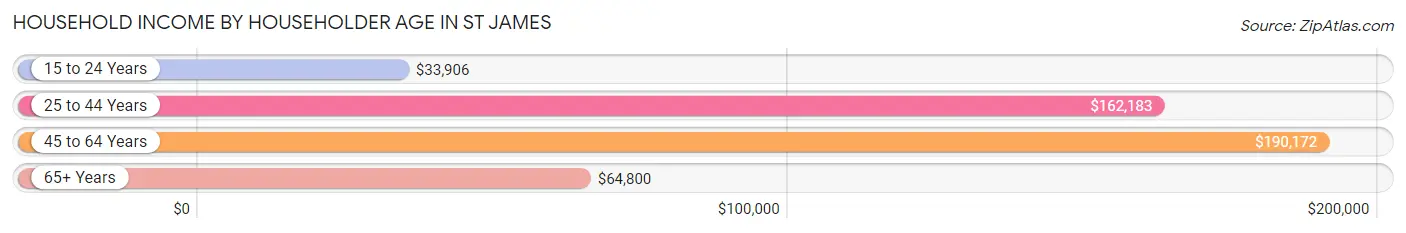
| Income Bracket | # Households | Median Income |
| 15 to 24 Years | 90 (1.9%) | $33,906 |
| 25 to 44 Years | 834 (17.3%) | $162,183 |
| 45 to 64 Years | 2,292 (47.5%) | $190,172 |
| 65+ Years | 1,610 (33.4%) | $64,800 |
| Total | 4,826 (100.0%) | $142,448 |
Poverty in St James
Income Below Poverty by Sex and Age in St James
With 1.1% poverty level for males and 2.3% for females among the residents of St James, 16 and 17 year old males and 12 to 14 year old females are the most vulnerable to poverty, with 20 males (8.7%) and 21 females (5.4%) in their respective age groups living below the poverty level.
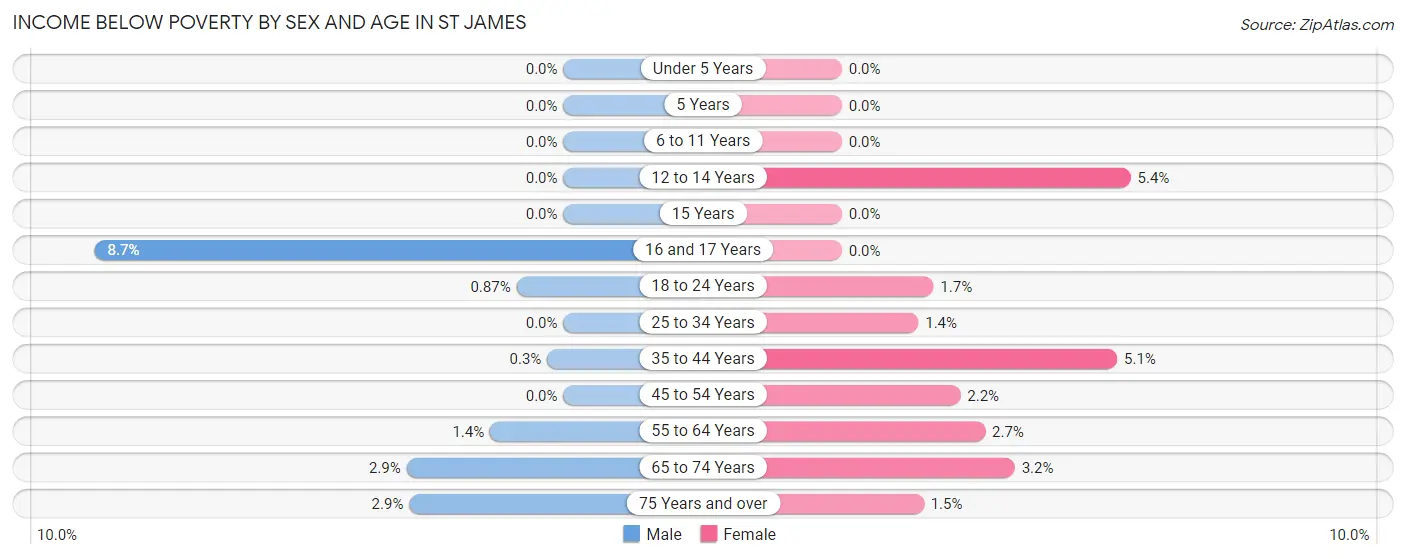
| Age Bracket | Male | Female |
| Under 5 Years | 0 (0.0%) | 0 (0.0%) |
| 5 Years | 0 (0.0%) | 0 (0.0%) |
| 6 to 11 Years | 0 (0.0%) | 0 (0.0%) |
| 12 to 14 Years | 0 (0.0%) | 21 (5.4%) |
| 15 Years | 0 (0.0%) | 0 (0.0%) |
| 16 and 17 Years | 20 (8.7%) | 0 (0.0%) |
| 18 to 24 Years | 8 (0.9%) | 8 (1.7%) |
| 25 to 34 Years | 0 (0.0%) | 11 (1.4%) |
| 35 to 44 Years | 2 (0.3%) | 29 (5.1%) |
| 45 to 54 Years | 0 (0.0%) | 20 (2.2%) |
| 55 to 64 Years | 15 (1.4%) | 32 (2.7%) |
| 65 to 74 Years | 16 (2.9%) | 25 (3.2%) |
| 75 Years and over | 11 (2.9%) | 12 (1.5%) |
| Total | 72 (1.1%) | 158 (2.3%) |
Income Above Poverty by Sex and Age in St James
According to the poverty statistics in St James, males aged under 5 years and females aged under 5 years are the age groups that are most secure financially, with 100.0% of males and 100.0% of females in these age groups living above the poverty line.
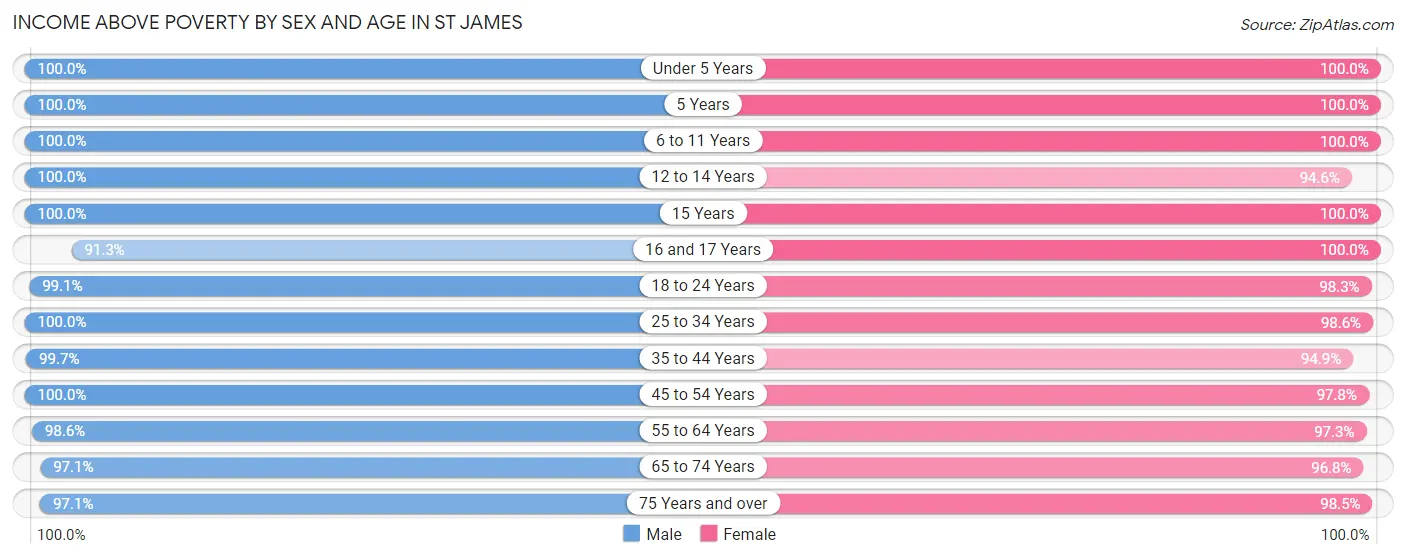
| Age Bracket | Male | Female |
| Under 5 Years | 228 (100.0%) | 264 (100.0%) |
| 5 Years | 43 (100.0%) | 24 (100.0%) |
| 6 to 11 Years | 443 (100.0%) | 361 (100.0%) |
| 12 to 14 Years | 279 (100.0%) | 371 (94.6%) |
| 15 Years | 163 (100.0%) | 187 (100.0%) |
| 16 and 17 Years | 210 (91.3%) | 128 (100.0%) |
| 18 to 24 Years | 907 (99.1%) | 463 (98.3%) |
| 25 to 34 Years | 600 (100.0%) | 765 (98.6%) |
| 35 to 44 Years | 654 (99.7%) | 538 (94.9%) |
| 45 to 54 Years | 931 (100.0%) | 888 (97.8%) |
| 55 to 64 Years | 1,087 (98.6%) | 1,173 (97.3%) |
| 65 to 74 Years | 533 (97.1%) | 753 (96.8%) |
| 75 Years and over | 373 (97.1%) | 778 (98.5%) |
| Total | 6,451 (98.9%) | 6,693 (97.7%) |
Income Below Poverty Among Married-Couple Families in St James
The poverty statistics for married-couple families in St James show that 0.2% or 6 of the total 2,910 families live below the poverty line. Families with no children have the highest poverty rate of 0.4%, comprising of 6 families. On the other hand, families with 1 or 2 children have the lowest poverty rate of 0.0%, which includes 0 families.
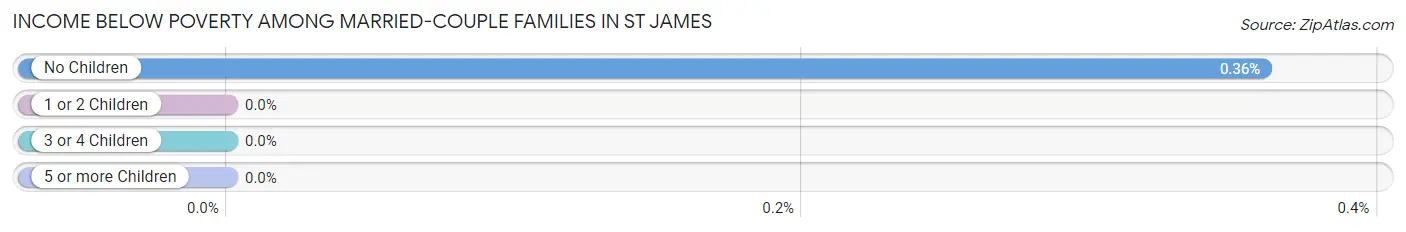
| Children | Above Poverty | Below Poverty |
| No Children | 1,665 (99.6%) | 6 (0.4%) |
| 1 or 2 Children | 981 (100.0%) | 0 (0.0%) |
| 3 or 4 Children | 258 (100.0%) | 0 (0.0%) |
| 5 or more Children | 0 (0.0%) | 0 (0.0%) |
| Total | 2,904 (99.8%) | 6 (0.2%) |
Income Below Poverty Among Single-Parent Households in St James
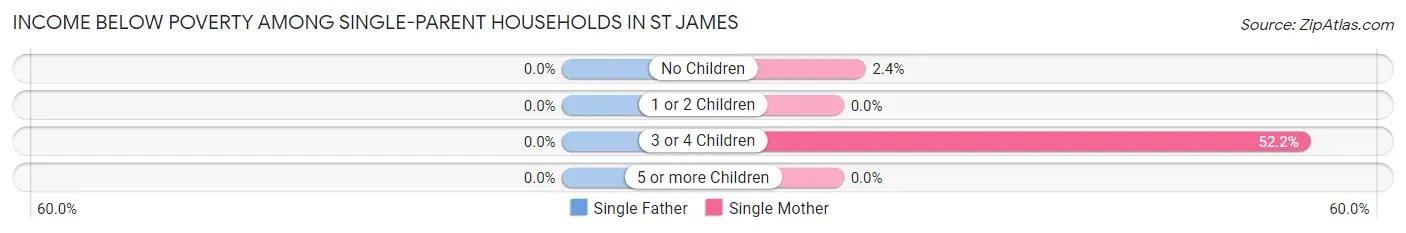
| Children | Single Father | Single Mother |
| No Children | 0 (0.0%) | 8 (2.4%) |
| 1 or 2 Children | 0 (0.0%) | 0 (0.0%) |
| 3 or 4 Children | 0 (0.0%) | 12 (52.2%) |
| 5 or more Children | 0 (0.0%) | 0 (0.0%) |
| Total | 0 (0.0%) | 20 (3.9%) |
Income Below Poverty Among Married-Couple vs Single-Parent Households in St James
The poverty data for St James shows that 6 of the married-couple family households (0.2%) and 20 of the single-parent households (3.1%) are living below the poverty level. Within the married-couple family households, those with no children have the highest poverty rate, with 6 households (0.4%) falling below the poverty line. Among the single-parent households, those with 3 or 4 children have the highest poverty rate, with 12 household (52.2%) living below poverty.
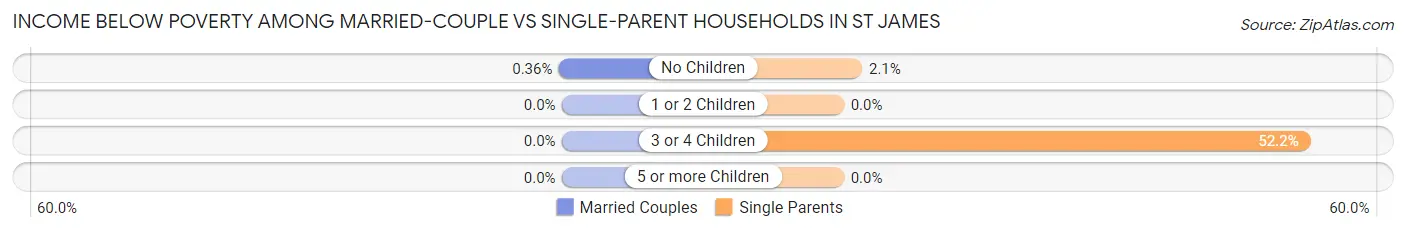
| Children | Married-Couple Families | Single-Parent Households |
| No Children | 6 (0.4%) | 8 (2.1%) |
| 1 or 2 Children | 0 (0.0%) | 0 (0.0%) |
| 3 or 4 Children | 0 (0.0%) | 12 (52.2%) |
| 5 or more Children | 0 (0.0%) | 0 (0.0%) |
| Total | 6 (0.2%) | 20 (3.1%) |
Race in St James
The most populous races in St James are White / Caucasian (12,080 | 88.0%), Hispanic or Latino (1,289 | 9.4%), and Asian (648 | 4.7%).
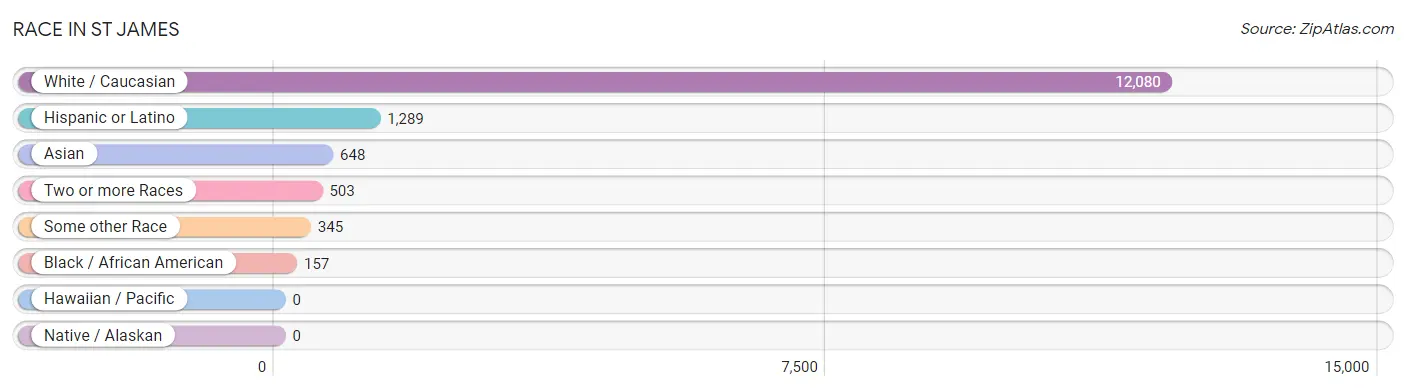
| Race | # Population | % Population |
| Asian | 648 | 4.7% |
| Black / African American | 157 | 1.1% |
| Hawaiian / Pacific | 0 | 0.0% |
| Hispanic or Latino | 1,289 | 9.4% |
| Native / Alaskan | 0 | 0.0% |
| White / Caucasian | 12,080 | 88.0% |
| Two or more Races | 503 | 3.7% |
| Some other Race | 345 | 2.5% |
| Total | 13,733 | 100.0% |
Ancestry in St James
The most populous ancestries reported in St James are Italian (3,891 | 28.3%), Irish (3,064 | 22.3%), German (2,264 | 16.5%), Polish (904 | 6.6%), and American (746 | 5.4%), together accounting for 79.1% of all St James residents.
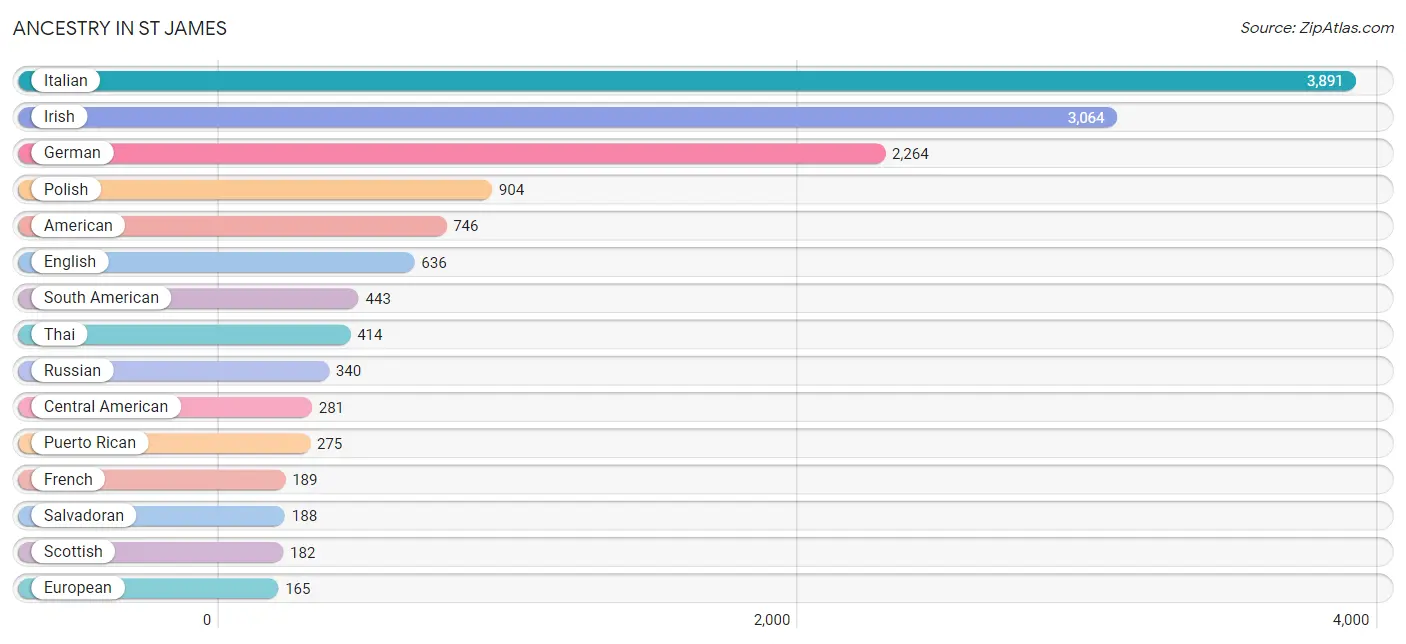
| Ancestry | # Population | % Population |
| American | 746 | 5.4% |
| Arab | 30 | 0.2% |
| Austrian | 62 | 0.4% |
| Belgian | 13 | 0.1% |
| British | 13 | 0.1% |
| British West Indian | 1 | 0.0% |
| Burmese | 115 | 0.8% |
| Canadian | 12 | 0.1% |
| Central American | 281 | 2.1% |
| Cherokee | 6 | 0.0% |
| Colombian | 126 | 0.9% |
| Costa Rican | 6 | 0.0% |
| Croatian | 89 | 0.6% |
| Cuban | 71 | 0.5% |
| Cypriot | 7 | 0.1% |
| Czech | 78 | 0.6% |
| Czechoslovakian | 29 | 0.2% |
| Danish | 27 | 0.2% |
| Dominican | 56 | 0.4% |
| Dutch | 76 | 0.5% |
| Eastern European | 50 | 0.4% |
| Ecuadorian | 94 | 0.7% |
| Egyptian | 10 | 0.1% |
| English | 636 | 4.6% |
| European | 165 | 1.2% |
| French | 189 | 1.4% |
| French Canadian | 16 | 0.1% |
| German | 2,264 | 16.5% |
| Greek | 54 | 0.4% |
| Guatemalan | 27 | 0.2% |
| Guyanese | 29 | 0.2% |
| Haitian | 6 | 0.0% |
| Hungarian | 122 | 0.9% |
| Indian (Asian) | 165 | 1.2% |
| Iranian | 4 | 0.0% |
| Irish | 3,064 | 22.3% |
| Israeli | 9 | 0.1% |
| Italian | 3,891 | 28.3% |
| Korean | 45 | 0.3% |
| Mexican | 117 | 0.9% |
| Moroccan | 20 | 0.2% |
| Nigerian | 1 | 0.0% |
| Norwegian | 156 | 1.1% |
| Panamanian | 60 | 0.4% |
| Paraguayan | 130 | 0.9% |
| Peruvian | 93 | 0.7% |
| Polish | 904 | 6.6% |
| Portuguese | 126 | 0.9% |
| Puerto Rican | 275 | 2.0% |
| Russian | 340 | 2.5% |
| Salvadoran | 188 | 1.4% |
| Scotch-Irish | 25 | 0.2% |
| Scottish | 182 | 1.3% |
| Serbian | 8 | 0.1% |
| Slavic | 29 | 0.2% |
| Slovak | 10 | 0.1% |
| South American | 443 | 3.2% |
| Spaniard | 11 | 0.1% |
| Spanish | 22 | 0.2% |
| Subsaharan African | 1 | 0.0% |
| Swedish | 77 | 0.6% |
| Swiss | 9 | 0.1% |
| Thai | 414 | 3.0% |
| Ukrainian | 71 | 0.5% |
| Welsh | 43 | 0.3% |
| Yugoslavian | 16 | 0.1% | View All 66 Rows |
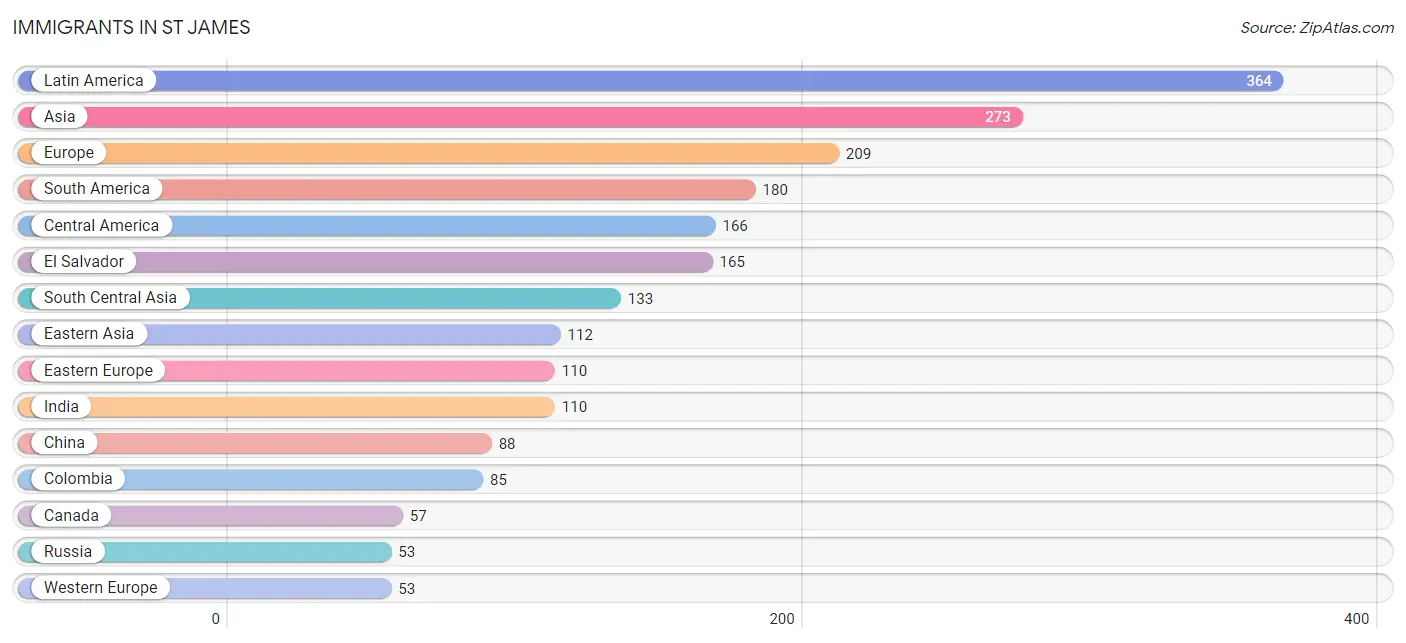
Immigrants in St James
The most numerous immigrant groups reported in St James came from Latin America (364 | 2.6%), Asia (273 | 2.0%), Europe (209 | 1.5%), South America (180 | 1.3%), and Central America (166 | 1.2%), together accounting for 8.7% of all St James residents.
| Immigration Origin | # Population | % Population |
| Africa | 32 | 0.2% |
| Argentina | 9 | 0.1% |
| Asia | 273 | 2.0% |
| Austria | 7 | 0.1% |
| Bosnia and Herzegovina | 10 | 0.1% |
| Canada | 57 | 0.4% |
| Caribbean | 18 | 0.1% |
| Central America | 166 | 1.2% |
| China | 88 | 0.6% |
| Colombia | 85 | 0.6% |
| Croatia | 22 | 0.2% |
| Czechoslovakia | 10 | 0.1% |
| Dominican Republic | 11 | 0.1% |
| Eastern Africa | 6 | 0.0% |
| Eastern Asia | 112 | 0.8% |
| Eastern Europe | 110 | 0.8% |
| Ecuador | 5 | 0.0% |
| Egypt | 18 | 0.1% |
| El Salvador | 165 | 1.2% |
| England | 7 | 0.1% |
| Europe | 209 | 1.5% |
| Germany | 46 | 0.3% |
| Grenada | 1 | 0.0% |
| Guyana | 19 | 0.1% |
| Haiti | 6 | 0.0% |
| Hong Kong | 14 | 0.1% |
| India | 110 | 0.8% |
| Israel | 9 | 0.1% |
| Italy | 29 | 0.2% |
| Kazakhstan | 8 | 0.1% |
| Korea | 24 | 0.2% |
| Latin America | 364 | 2.6% |
| Mexico | 1 | 0.0% |
| Morocco | 7 | 0.1% |
| Nigeria | 1 | 0.0% |
| Northern Africa | 25 | 0.2% |
| Northern Europe | 17 | 0.1% |
| Norway | 10 | 0.1% |
| Philippines | 19 | 0.1% |
| Poland | 7 | 0.1% |
| Russia | 53 | 0.4% |
| Serbia | 8 | 0.1% |
| South America | 180 | 1.3% |
| South Central Asia | 133 | 1.0% |
| South Eastern Asia | 19 | 0.1% |
| Southern Europe | 29 | 0.2% |
| Sri Lanka | 15 | 0.1% |
| Western Africa | 1 | 0.0% |
| Western Asia | 9 | 0.1% |
| Western Europe | 53 | 0.4% | View All 50 Rows |
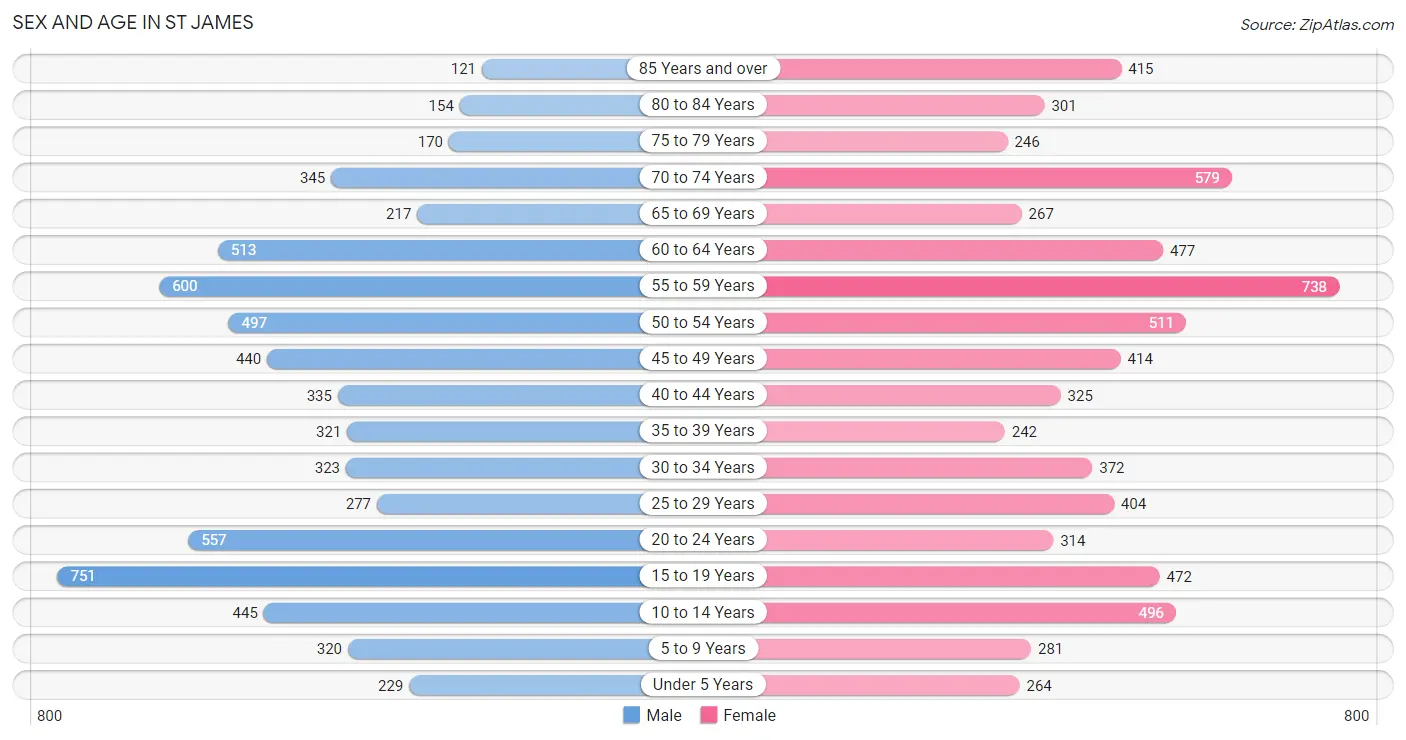
Sex and Age in St James
Sex and Age in St James
The most populous age groups in St James are 15 to 19 Years (751 | 11.4%) for men and 55 to 59 Years (738 | 10.4%) for women.
| Age Bracket | Male | Female |
| Under 5 Years | 229 (3.5%) | 264 (3.7%) |
| 5 to 9 Years | 320 (4.8%) | 281 (4.0%) |
| 10 to 14 Years | 445 (6.7%) | 496 (7.0%) |
| 15 to 19 Years | 751 (11.4%) | 472 (6.6%) |
| 20 to 24 Years | 557 (8.4%) | 314 (4.4%) |
| 25 to 29 Years | 277 (4.2%) | 404 (5.7%) |
| 30 to 34 Years | 323 (4.9%) | 372 (5.2%) |
| 35 to 39 Years | 321 (4.9%) | 242 (3.4%) |
| 40 to 44 Years | 335 (5.1%) | 325 (4.6%) |
| 45 to 49 Years | 440 (6.7%) | 414 (5.8%) |
| 50 to 54 Years | 497 (7.5%) | 511 (7.2%) |
| 55 to 59 Years | 600 (9.1%) | 738 (10.4%) |
| 60 to 64 Years | 513 (7.8%) | 477 (6.7%) |
| 65 to 69 Years | 217 (3.3%) | 267 (3.7%) |
| 70 to 74 Years | 345 (5.2%) | 579 (8.1%) |
| 75 to 79 Years | 170 (2.6%) | 246 (3.5%) |
| 80 to 84 Years | 154 (2.3%) | 301 (4.2%) |
| 85 Years and over | 121 (1.8%) | 415 (5.8%) |
| Total | 6,615 (100.0%) | 7,118 (100.0%) |
Families and Households in St James
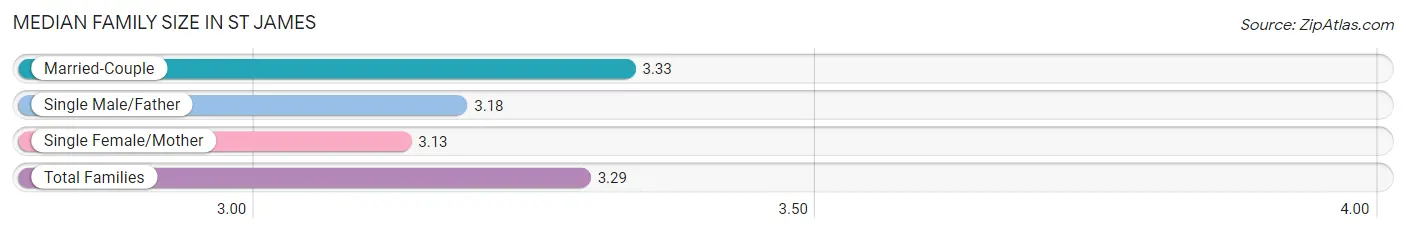
Median Family Size in St James
The median family size in St James is 3.29 persons per family, with married-couple families (2,910 | 81.8%) accounting for the largest median family size of 3.33 persons per family. On the other hand, single female/mother families (511 | 14.4%) represent the smallest median family size with 3.13 persons per family.
| Family Type | # Families | Family Size |
| Married-Couple | 2,910 (81.8%) | 3.33 |
| Single Male/Father | 135 (3.8%) | 3.18 |
| Single Female/Mother | 511 (14.4%) | 3.13 |
| Total Families | 3,556 (100.0%) | 3.29 |
Median Household Size in St James
The median household size in St James is 2.76 persons per household, with single male/father households (135 | 2.8%) accounting for the largest median household size of 3.58 persons per household. non-family households (1,270 | 26.3%) represent the smallest median household size with 1.14 persons per household.

| Household Type | # Households | Household Size |
| Married-Couple | 2,910 (60.3%) | 3.36 |
| Single Male/Father | 135 (2.8%) | 3.58 |
| Single Female/Mother | 511 (10.6%) | 3.16 |
| Non-family | 1,270 (26.3%) | 1.14 |
| Total Households | 4,826 (100.0%) | 2.76 |
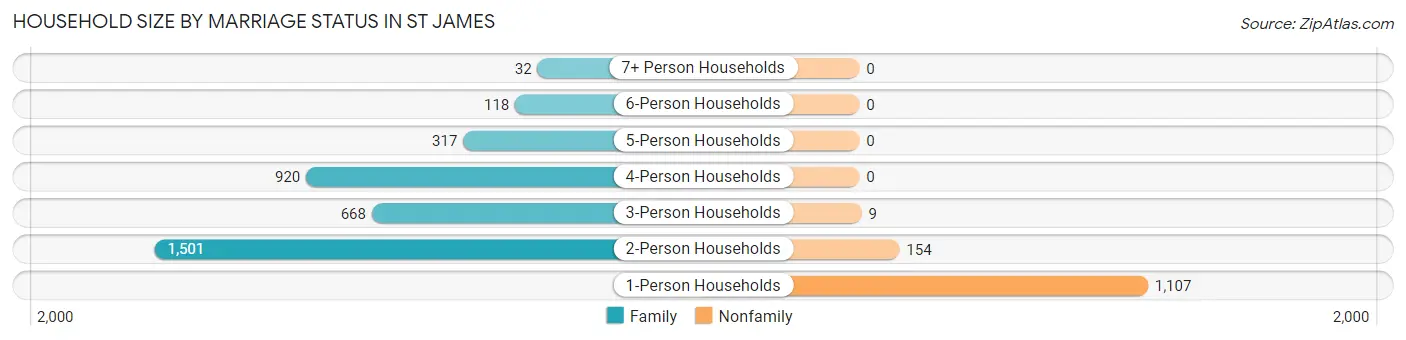
Household Size by Marriage Status in St James
Out of a total of 4,826 households in St James, 3,556 (73.7%) are family households, while 1,270 (26.3%) are nonfamily households. The most numerous type of family households are 2-person households, comprising 1,501, and the most common type of nonfamily households are 1-person households, comprising 1,107.
| Household Size | Family Households | Nonfamily Households |
| 1-Person Households | - | 1,107 (22.9%) |
| 2-Person Households | 1,501 (31.1%) | 154 (3.2%) |
| 3-Person Households | 668 (13.8%) | 9 (0.2%) |
| 4-Person Households | 920 (19.1%) | 0 (0.0%) |
| 5-Person Households | 317 (6.6%) | 0 (0.0%) |
| 6-Person Households | 118 (2.5%) | 0 (0.0%) |
| 7+ Person Households | 32 (0.7%) | 0 (0.0%) |
| Total | 3,556 (73.7%) | 1,270 (26.3%) |
Female Fertility in St James
Fertility by Age in St James
Average fertility rate in St James is 58.0 births per 1,000 women. Women in the age bracket of 20 to 34 years have the highest fertility rate with 119.0 births per 1,000 women. Women in the age bracket of 20 to 34 years acount for 82.8% of all women with births.
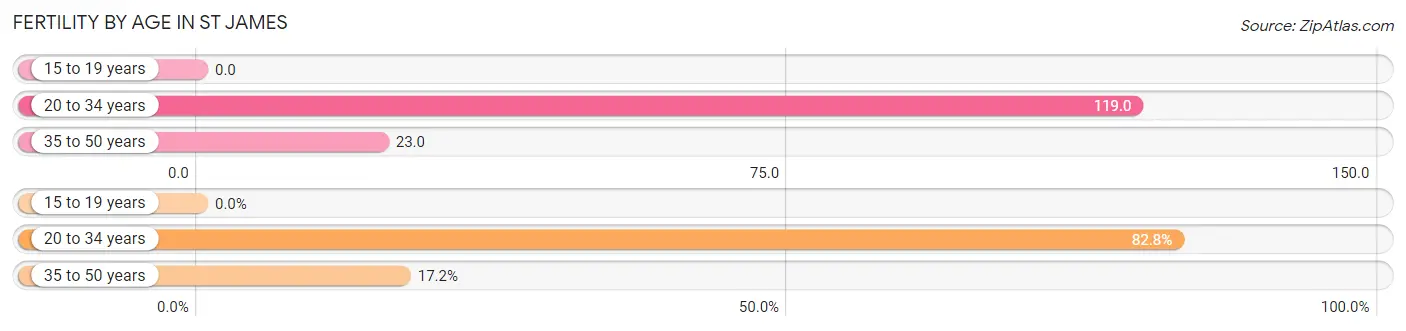
| Age Bracket | Women with Births | Births / 1,000 Women |
| 15 to 19 years | 0 (0.0%) | 0.0 |
| 20 to 34 years | 130 (82.8%) | 119.0 |
| 35 to 50 years | 27 (17.2%) | 23.0 |
| Total | 157 (100.0%) | 58.0 |
Fertility by Age by Marriage Status in St James
91.7% of women with births (157) in St James are married. The highest percentage of unmarried women with births falls into 20 to 34 years age bracket with 10.0% of them unmarried at the time of birth, while the lowest percentage of unmarried women with births belong to 35 to 50 years age bracket with 0.0% of them unmarried.
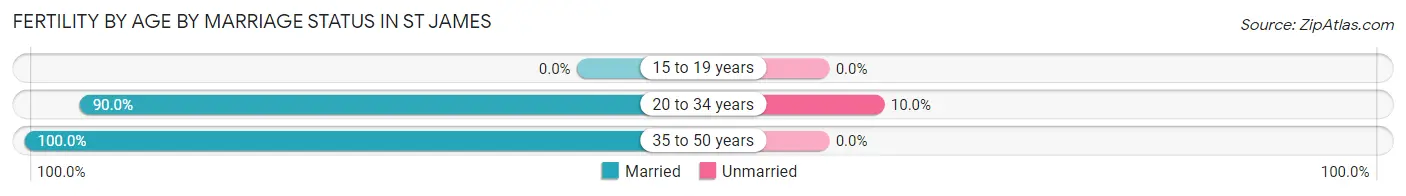
| Age Bracket | Married | Unmarried |
| 15 to 19 years | 0 (0.0%) | 0 (0.0%) |
| 20 to 34 years | 117 (90.0%) | 13 (10.0%) |
| 35 to 50 years | 27 (100.0%) | 0 (0.0%) |
| Total | 144 (91.7%) | 13 (8.3%) |
Fertility by Education in St James
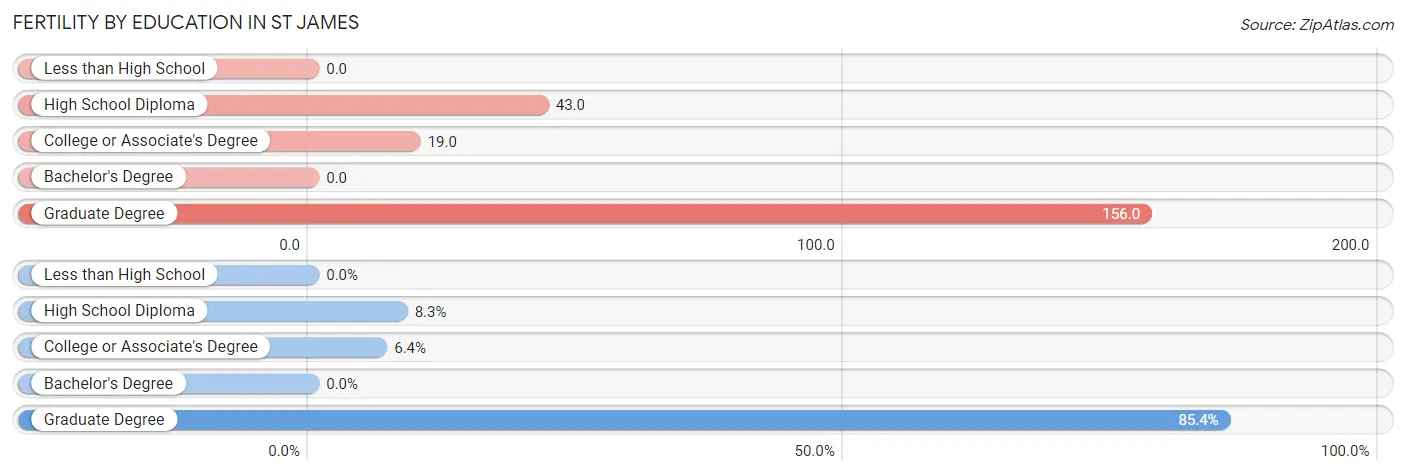
| Educational Attainment | Women with Births | Births / 1,000 Women |
| Less than High School | 0 (0.0%) | 0.0 |
| High School Diploma | 13 (8.3%) | 43.0 |
| College or Associate's Degree | 10 (6.4%) | 19.0 |
| Bachelor's Degree | 0 (0.0%) | 0.0 |
| Graduate Degree | 134 (85.4%) | 156.0 |
| Total | 157 (100.0%) | 58.0 |
Fertility by Education by Marriage Status in St James
8.3% of women with births in St James are unmarried. Women with the educational attainment of college or associate's degree are most likely to be married with 100.0% of them married at childbirth, while women with the educational attainment of high school diploma are least likely to be married with 100.0% of them unmarried at childbirth.
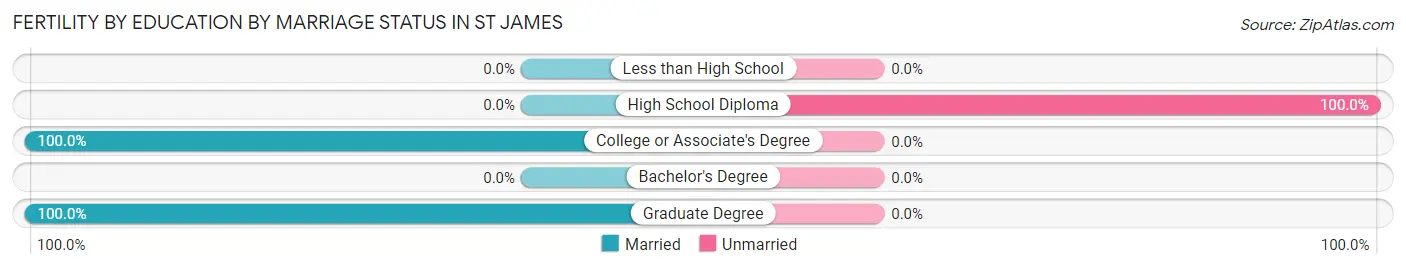
| Educational Attainment | Married | Unmarried |
| Less than High School | 0 (0.0%) | 0 (0.0%) |
| High School Diploma | 0 (0.0%) | 13 (100.0%) |
| College or Associate's Degree | 10 (100.0%) | 0 (0.0%) |
| Bachelor's Degree | 0 (0.0%) | 0 (0.0%) |
| Graduate Degree | 134 (100.0%) | 0 (0.0%) |
| Total | 144 (91.7%) | 13 (8.3%) |
Employment Characteristics in St James
Employment by Class of Employer in St James
Among the 6,562 employed individuals in St James, private company employees (4,247 | 64.7%), local government employees (813 | 12.4%), and state government employees (459 | 7.0%) make up the most common classes of employment.
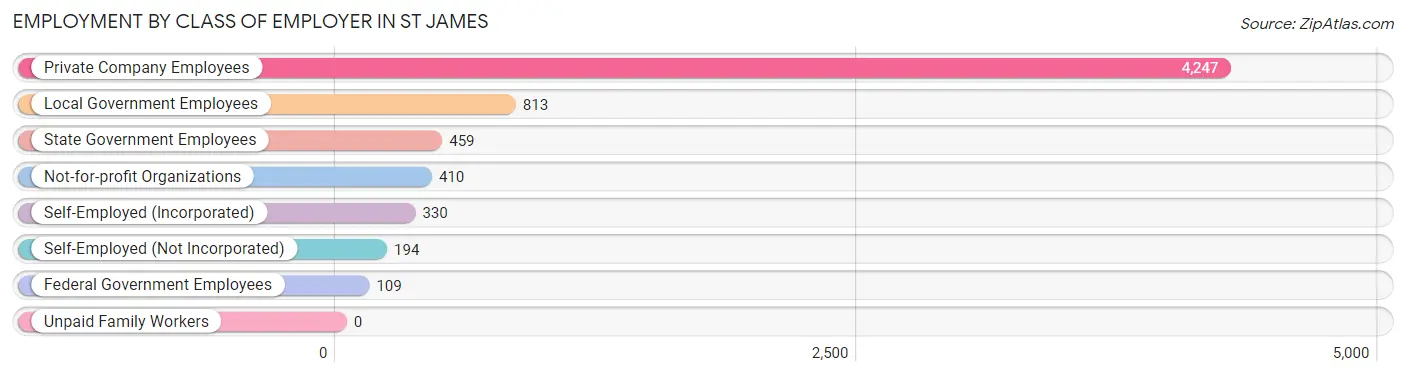
| Employer Class | # Employees | % Employees |
| Private Company Employees | 4,247 | 64.7% |
| Self-Employed (Incorporated) | 330 | 5.0% |
| Self-Employed (Not Incorporated) | 194 | 3.0% |
| Not-for-profit Organizations | 410 | 6.2% |
| Local Government Employees | 813 | 12.4% |
| State Government Employees | 459 | 7.0% |
| Federal Government Employees | 109 | 1.7% |
| Unpaid Family Workers | 0 | 0.0% |
| Total | 6,562 | 100.0% |
Employment Status by Age in St James
According to the labor force statistics for St James, out of the total population over 16 years of age (11,348), 63.4% or 7,195 individuals are in the labor force, with 4.4% or 317 of them unemployed. The age group with the highest labor force participation rate is 30 to 34 years, with 96.3% or 669 individuals in the labor force. Within the labor force, the 25 to 29 years age range has the highest percentage of unemployed individuals, with 19.6% or 125 of them being unemployed.
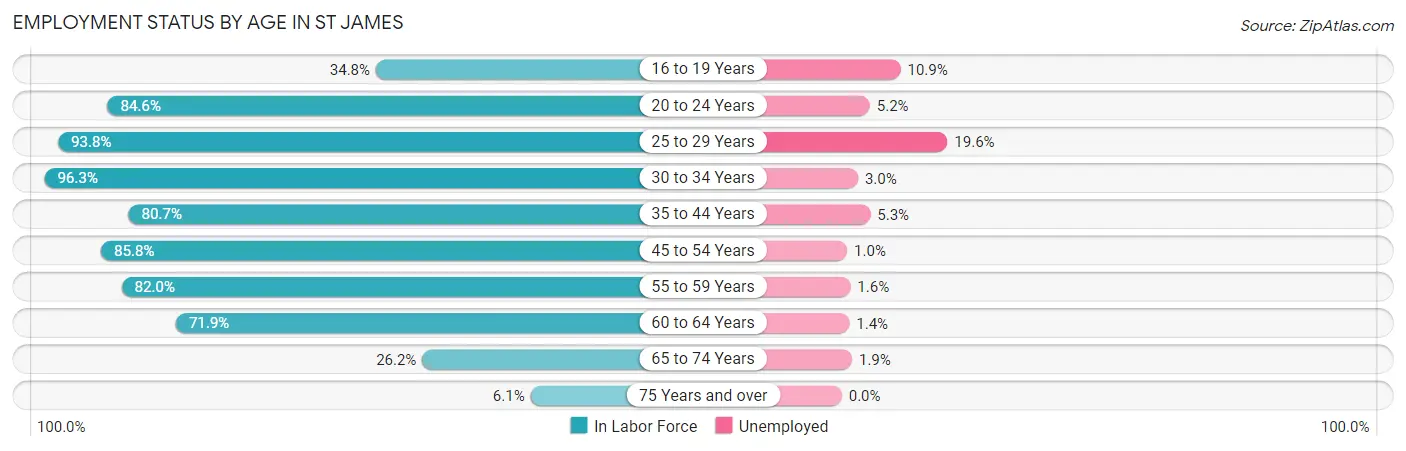
| Age Bracket | In Labor Force | Unemployed |
| 16 to 19 Years | 304 (34.8%) | 33 (10.9%) |
| 20 to 24 Years | 737 (84.6%) | 38 (5.2%) |
| 25 to 29 Years | 639 (93.8%) | 125 (19.6%) |
| 30 to 34 Years | 669 (96.3%) | 20 (3.0%) |
| 35 to 44 Years | 987 (80.7%) | 52 (5.3%) |
| 45 to 54 Years | 1,598 (85.8%) | 16 (1.0%) |
| 55 to 59 Years | 1,097 (82.0%) | 18 (1.6%) |
| 60 to 64 Years | 712 (71.9%) | 10 (1.4%) |
| 65 to 74 Years | 369 (26.2%) | 7 (1.9%) |
| 75 Years and over | 86 (6.1%) | 0 (0.0%) |
| Total | 7,195 (63.4%) | 317 (4.4%) |
Employment Status by Educational Attainment in St James
According to labor force statistics for St James, 84.0% of individuals (5,703) out of the total population between 25 and 64 years of age (6,789) are in the labor force, with 4.2% or 240 of them being unemployed. The group with the highest labor force participation rate are those with the educational attainment of bachelor's degree or higher, with 88.9% or 3,688 individuals in the labor force. Within the labor force, individuals with bachelor's degree or higher education have the highest percentage of unemployment, with 6.0% or 221 of them being unemployed.
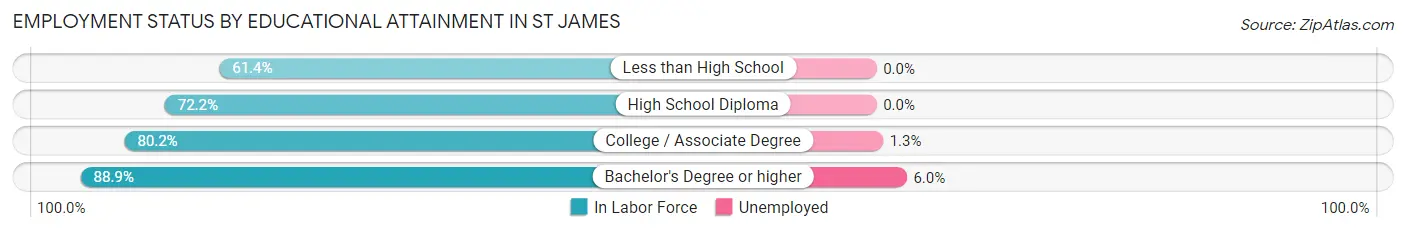
| Educational Attainment | In Labor Force | Unemployed |
| Less than High School | 154 (61.4%) | 0 (0.0%) |
| High School Diploma | 493 (72.2%) | 0 (0.0%) |
| College / Associate Degree | 1,368 (80.2%) | 22 (1.3%) |
| Bachelor's Degree or higher | 3,688 (88.9%) | 249 (6.0%) |
| Total | 5,703 (84.0%) | 285 (4.2%) |
Employment Occupations by Sex in St James
Management, Business, Science and Arts Occupations
The most common Management, Business, Science and Arts occupations in St James are Community & Social Service (1,194 | 17.4%), Health Diagnosing & Treating (903 | 13.1%), Management (817 | 11.9%), Education Instruction & Library (751 | 10.9%), and Health Technologists (734 | 10.7%).
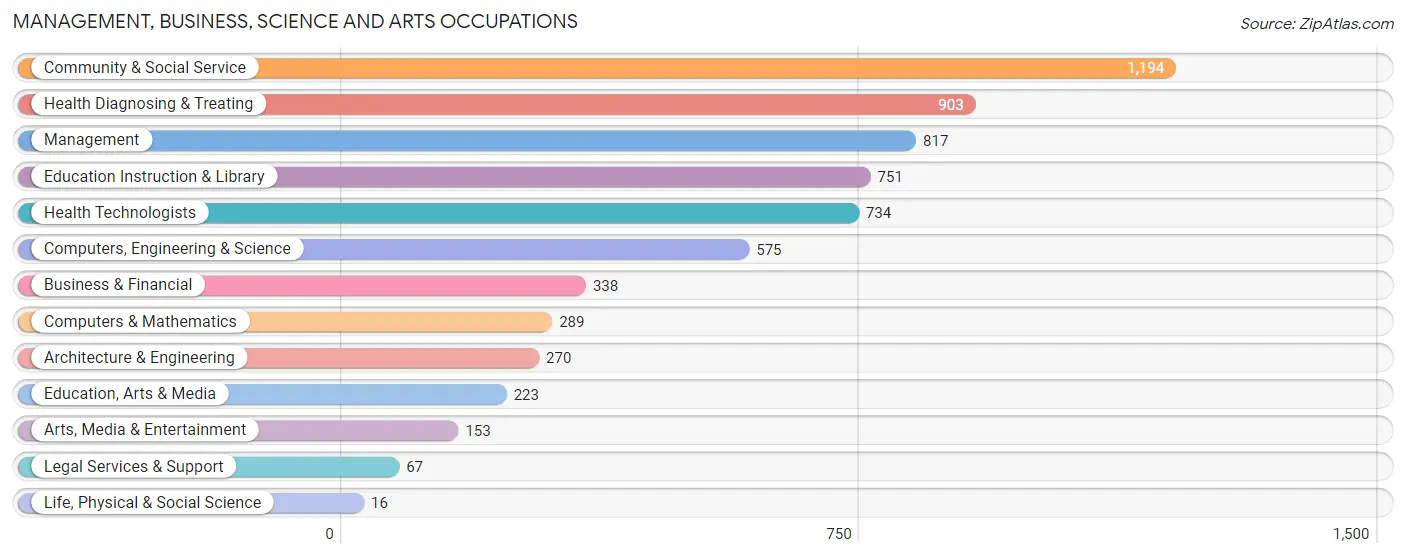
Management, Business, Science and Arts Occupations by Sex
Within the Management, Business, Science and Arts occupations in St James, the most male-oriented occupations are Life, Physical & Social Science (100.0%), Architecture & Engineering (93.0%), and Computers, Engineering & Science (81.9%), while the most female-oriented occupations are Education, Arts & Media (91.9%), Arts, Media & Entertainment (81.0%), and Community & Social Service (79.9%).
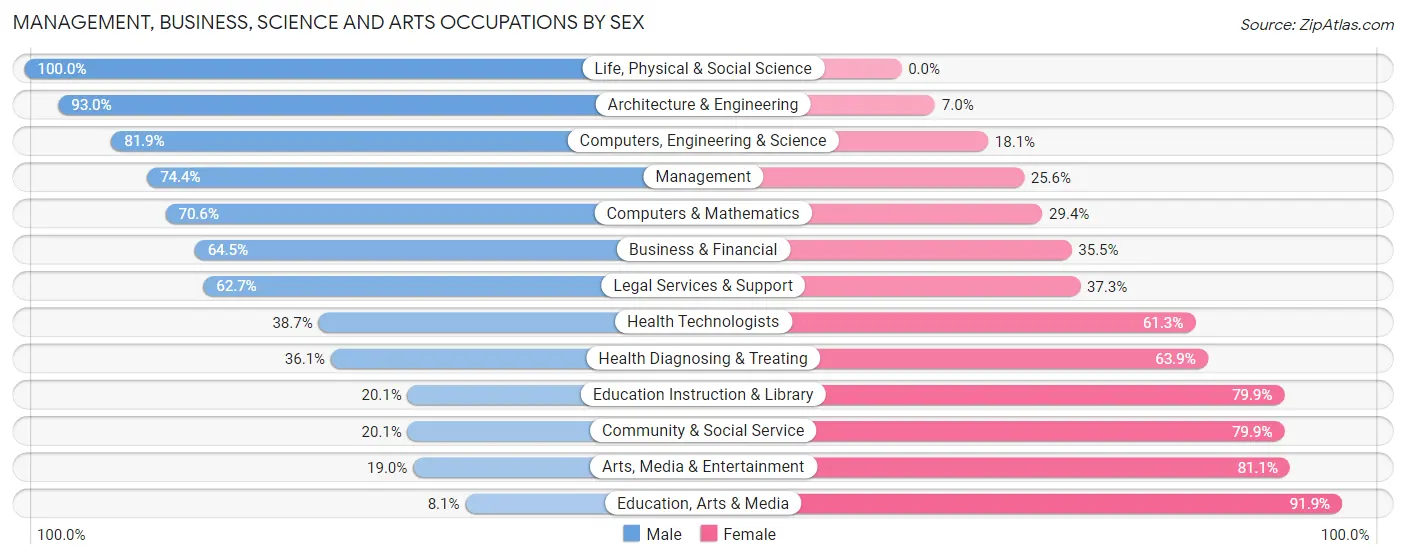
| Occupation | Male | Female |
| Management | 608 (74.4%) | 209 (25.6%) |
| Business & Financial | 218 (64.5%) | 120 (35.5%) |
| Computers, Engineering & Science | 471 (81.9%) | 104 (18.1%) |
| Computers & Mathematics | 204 (70.6%) | 85 (29.4%) |
| Architecture & Engineering | 251 (93.0%) | 19 (7.0%) |
| Life, Physical & Social Science | 16 (100.0%) | 0 (0.0%) |
| Community & Social Service | 240 (20.1%) | 954 (79.9%) |
| Education, Arts & Media | 18 (8.1%) | 205 (91.9%) |
| Legal Services & Support | 42 (62.7%) | 25 (37.3%) |
| Education Instruction & Library | 151 (20.1%) | 600 (79.9%) |
| Arts, Media & Entertainment | 29 (19.0%) | 124 (81.0%) |
| Health Diagnosing & Treating | 326 (36.1%) | 577 (63.9%) |
| Health Technologists | 284 (38.7%) | 450 (61.3%) |
| Total (Category) | 1,863 (48.7%) | 1,964 (51.3%) |
| Total (Overall) | 3,745 (54.4%) | 3,134 (45.6%) |
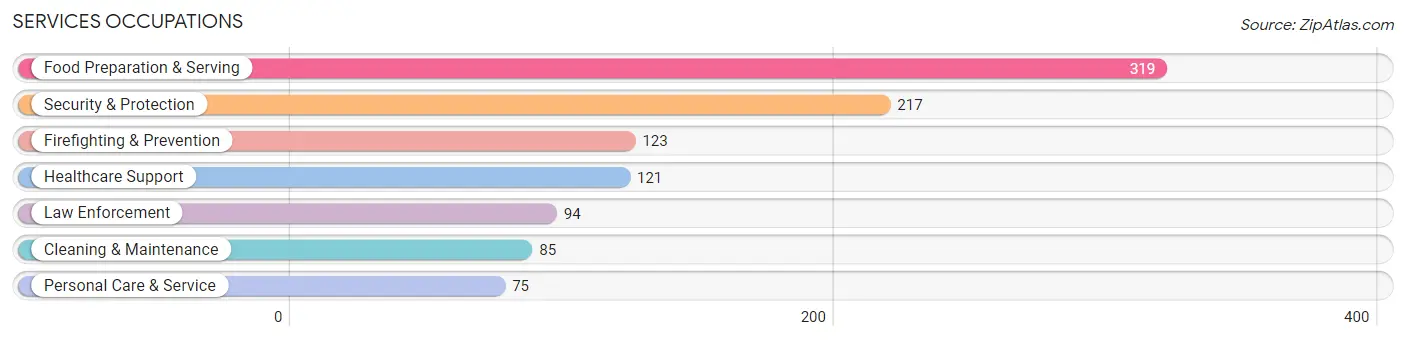
Services Occupations
The most common Services occupations in St James are Food Preparation & Serving (319 | 4.6%), Security & Protection (217 | 3.2%), Firefighting & Prevention (123 | 1.8%), Healthcare Support (121 | 1.8%), and Law Enforcement (94 | 1.4%).
Services Occupations by Sex
Within the Services occupations in St James, the most male-oriented occupations are Firefighting & Prevention (100.0%), Security & Protection (95.4%), and Law Enforcement (89.4%), while the most female-oriented occupations are Healthcare Support (84.3%), Food Preparation & Serving (62.1%), and Personal Care & Service (46.7%).
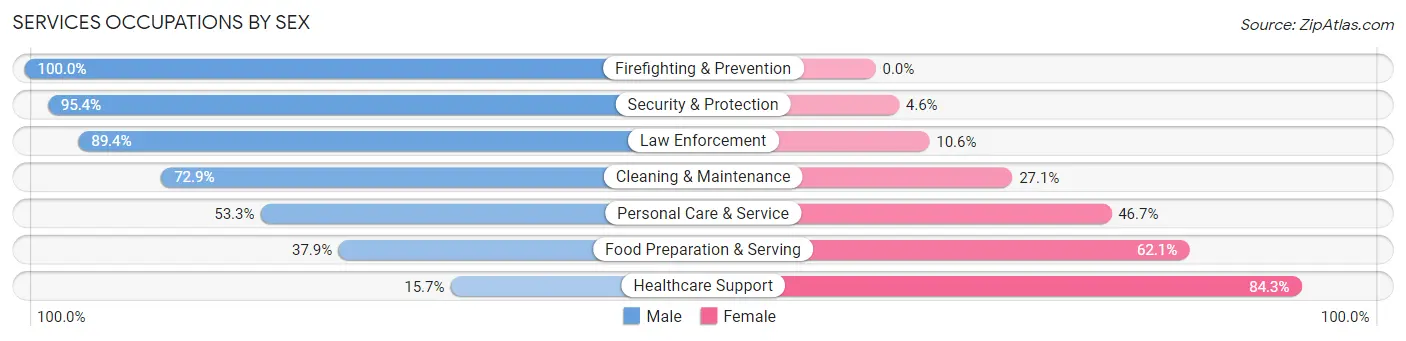
| Occupation | Male | Female |
| Healthcare Support | 19 (15.7%) | 102 (84.3%) |
| Security & Protection | 207 (95.4%) | 10 (4.6%) |
| Firefighting & Prevention | 123 (100.0%) | 0 (0.0%) |
| Law Enforcement | 84 (89.4%) | 10 (10.6%) |
| Food Preparation & Serving | 121 (37.9%) | 198 (62.1%) |
| Cleaning & Maintenance | 62 (72.9%) | 23 (27.1%) |
| Personal Care & Service | 40 (53.3%) | 35 (46.7%) |
| Total (Category) | 449 (55.0%) | 368 (45.0%) |
| Total (Overall) | 3,745 (54.4%) | 3,134 (45.6%) |
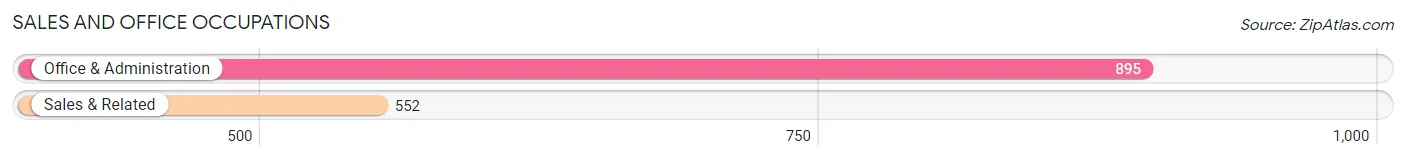
Sales and Office Occupations
The most common Sales and Office occupations in St James are Office & Administration (895 | 13.0%), and Sales & Related (552 | 8.0%).
Sales and Office Occupations by Sex
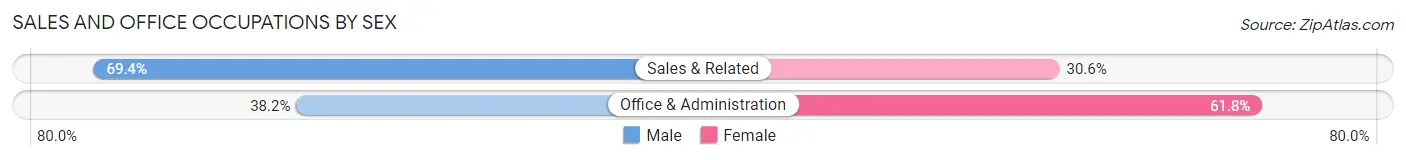
| Occupation | Male | Female |
| Sales & Related | 383 (69.4%) | 169 (30.6%) |
| Office & Administration | 342 (38.2%) | 553 (61.8%) |
| Total (Category) | 725 (50.1%) | 722 (49.9%) |
| Total (Overall) | 3,745 (54.4%) | 3,134 (45.6%) |
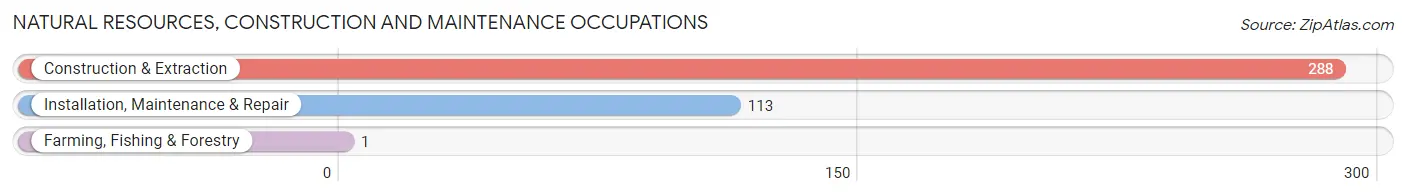
Natural Resources, Construction and Maintenance Occupations
The most common Natural Resources, Construction and Maintenance occupations in St James are Construction & Extraction (288 | 4.2%), Installation, Maintenance & Repair (113 | 1.6%), and Farming, Fishing & Forestry (1 | 0.0%).
Natural Resources, Construction and Maintenance Occupations by Sex
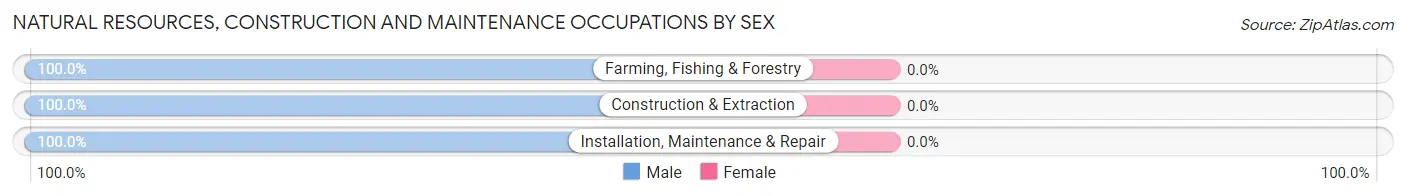
| Occupation | Male | Female |
| Farming, Fishing & Forestry | 1 (100.0%) | 0 (0.0%) |
| Construction & Extraction | 288 (100.0%) | 0 (0.0%) |
| Installation, Maintenance & Repair | 113 (100.0%) | 0 (0.0%) |
| Total (Category) | 402 (100.0%) | 0 (0.0%) |
| Total (Overall) | 3,745 (54.4%) | 3,134 (45.6%) |
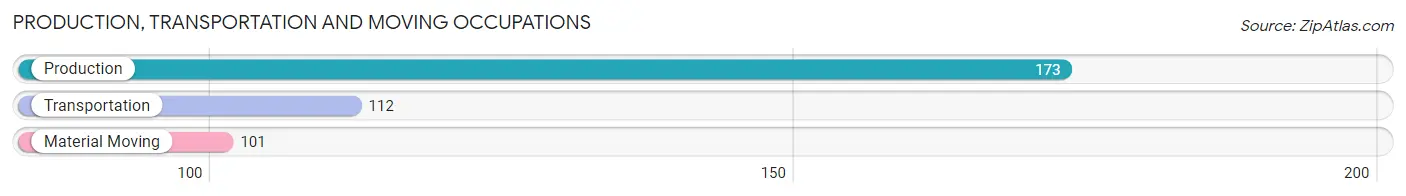
Production, Transportation and Moving Occupations
The most common Production, Transportation and Moving occupations in St James are Production (173 | 2.5%), Transportation (112 | 1.6%), and Material Moving (101 | 1.5%).
Production, Transportation and Moving Occupations by Sex
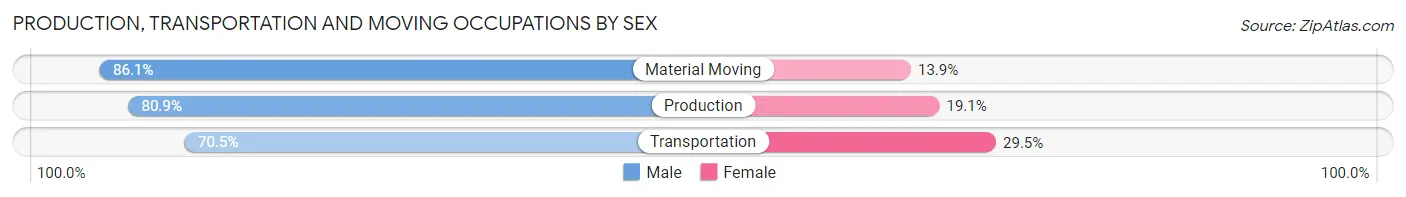
| Occupation | Male | Female |
| Production | 140 (80.9%) | 33 (19.1%) |
| Transportation | 79 (70.5%) | 33 (29.5%) |
| Material Moving | 87 (86.1%) | 14 (13.9%) |
| Total (Category) | 306 (79.3%) | 80 (20.7%) |
| Total (Overall) | 3,745 (54.4%) | 3,134 (45.6%) |
Employment Industries by Sex in St James
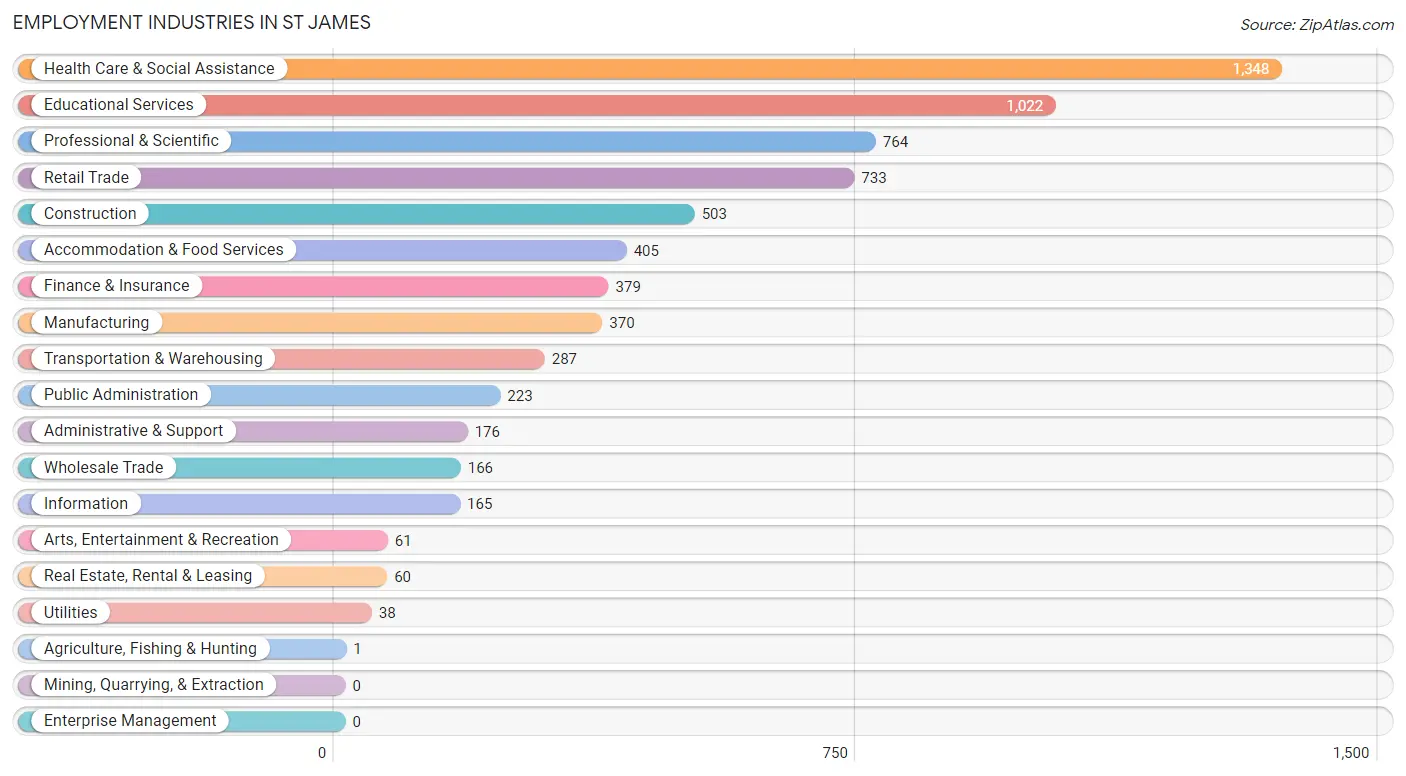
Employment Industries in St James
The major employment industries in St James include Health Care & Social Assistance (1,348 | 19.6%), Educational Services (1,022 | 14.9%), Professional & Scientific (764 | 11.1%), Retail Trade (733 | 10.7%), and Construction (503 | 7.3%).
Employment Industries by Sex in St James
The St James industries that see more men than women are Agriculture, Fishing & Hunting (100.0%), Utilities (100.0%), and Arts, Entertainment & Recreation (100.0%), whereas the industries that tend to have a higher number of women are Educational Services (75.5%), Health Care & Social Assistance (73.2%), and Accommodation & Food Services (57.0%).
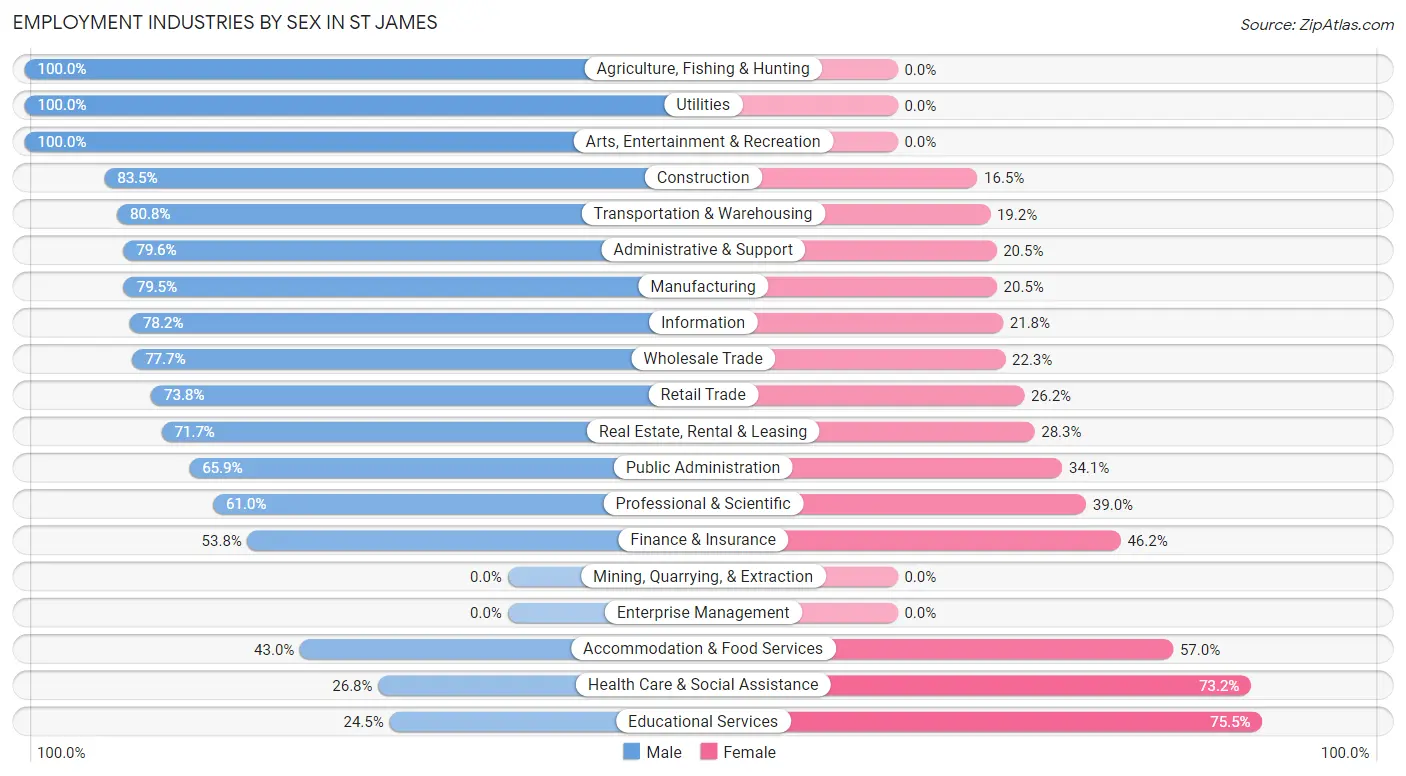
| Industry | Male | Female |
| Agriculture, Fishing & Hunting | 1 (100.0%) | 0 (0.0%) |
| Mining, Quarrying, & Extraction | 0 (0.0%) | 0 (0.0%) |
| Construction | 420 (83.5%) | 83 (16.5%) |
| Manufacturing | 294 (79.5%) | 76 (20.5%) |
| Wholesale Trade | 129 (77.7%) | 37 (22.3%) |
| Retail Trade | 541 (73.8%) | 192 (26.2%) |
| Transportation & Warehousing | 232 (80.8%) | 55 (19.2%) |
| Utilities | 38 (100.0%) | 0 (0.0%) |
| Information | 129 (78.2%) | 36 (21.8%) |
| Finance & Insurance | 204 (53.8%) | 175 (46.2%) |
| Real Estate, Rental & Leasing | 43 (71.7%) | 17 (28.3%) |
| Professional & Scientific | 466 (61.0%) | 298 (39.0%) |
| Enterprise Management | 0 (0.0%) | 0 (0.0%) |
| Administrative & Support | 140 (79.5%) | 36 (20.4%) |
| Educational Services | 250 (24.5%) | 772 (75.5%) |
| Health Care & Social Assistance | 361 (26.8%) | 987 (73.2%) |
| Arts, Entertainment & Recreation | 61 (100.0%) | 0 (0.0%) |
| Accommodation & Food Services | 174 (43.0%) | 231 (57.0%) |
| Public Administration | 147 (65.9%) | 76 (34.1%) |
| Total | 3,745 (54.4%) | 3,134 (45.6%) |
Education in St James
School Enrollment in St James
The most common levels of schooling among the 3,406 students in St James are high school (1,151 | 33.8%), middle school (731 | 21.5%), and college / undergraduate (662 | 19.4%).
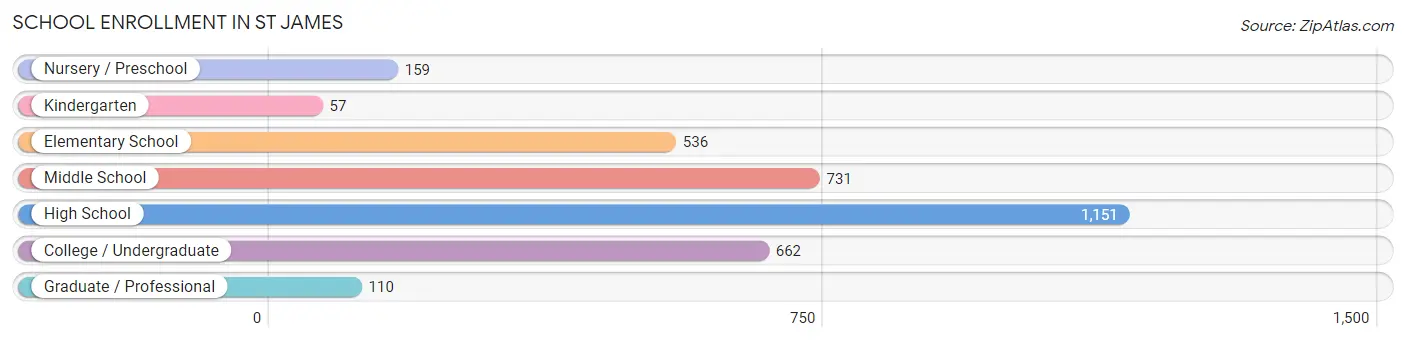
| School Level | # Students | % Students |
| Nursery / Preschool | 159 | 4.7% |
| Kindergarten | 57 | 1.7% |
| Elementary School | 536 | 15.7% |
| Middle School | 731 | 21.5% |
| High School | 1,151 | 33.8% |
| College / Undergraduate | 662 | 19.4% |
| Graduate / Professional | 110 | 3.2% |
| Total | 3,406 | 100.0% |
School Enrollment by Age by Funding Source in St James
Out of a total of 3,406 students who are enrolled in schools in St James, 484 (14.2%) attend a private institution, while the remaining 2,922 (85.8%) are enrolled in public schools. The age group of 3 to 4 year olds has the highest likelihood of being enrolled in private schools, with 65 (57.0% in the age bracket) enrolled. Conversely, the age group of 10 to 14 year olds has the lowest likelihood of being enrolled in a private school, with 903 (96.0% in the age bracket) attending a public institution.
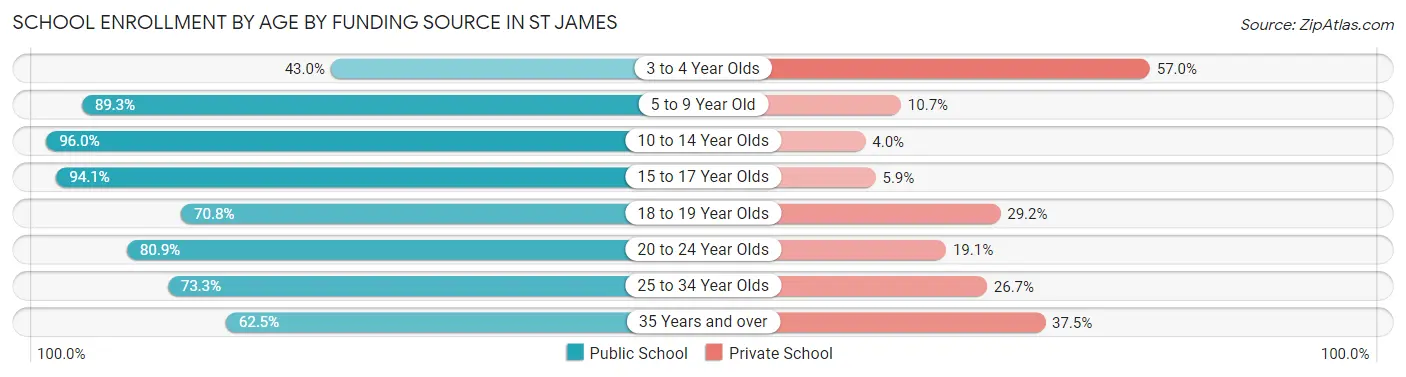
| Age Bracket | Public School | Private School |
| 3 to 4 Year Olds | 49 (43.0%) | 65 (57.0%) |
| 5 to 9 Year Old | 528 (89.3%) | 63 (10.7%) |
| 10 to 14 Year Olds | 903 (96.0%) | 38 (4.0%) |
| 15 to 17 Year Olds | 666 (94.1%) | 42 (5.9%) |
| 18 to 19 Year Olds | 357 (70.8%) | 147 (29.2%) |
| 20 to 24 Year Olds | 310 (80.9%) | 73 (19.1%) |
| 25 to 34 Year Olds | 33 (73.3%) | 12 (26.7%) |
| 35 Years and over | 75 (62.5%) | 45 (37.5%) |
| Total | 2,922 (85.8%) | 484 (14.2%) |
Educational Attainment by Field of Study in St James
Business (932 | 17.0%), science & technology (882 | 16.1%), education (718 | 13.1%), social sciences (421 | 7.7%), and engineering (341 | 6.2%) are the most common fields of study among 5,497 individuals in St James who have obtained a bachelor's degree or higher.
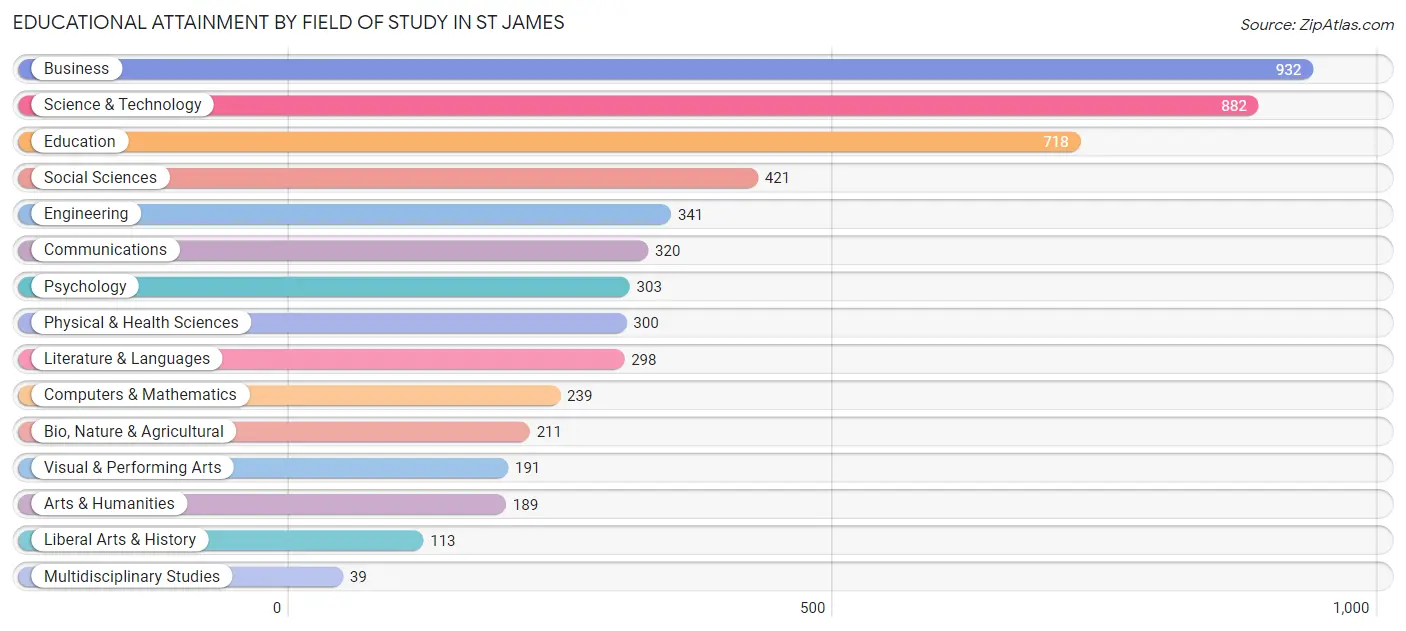
| Field of Study | # Graduates | % Graduates |
| Computers & Mathematics | 239 | 4.3% |
| Bio, Nature & Agricultural | 211 | 3.8% |
| Physical & Health Sciences | 300 | 5.5% |
| Psychology | 303 | 5.5% |
| Social Sciences | 421 | 7.7% |
| Engineering | 341 | 6.2% |
| Multidisciplinary Studies | 39 | 0.7% |
| Science & Technology | 882 | 16.1% |
| Business | 932 | 17.0% |
| Education | 718 | 13.1% |
| Literature & Languages | 298 | 5.4% |
| Liberal Arts & History | 113 | 2.1% |
| Visual & Performing Arts | 191 | 3.5% |
| Communications | 320 | 5.8% |
| Arts & Humanities | 189 | 3.4% |
| Total | 5,497 | 100.0% |
Transportation & Commute in St James
Vehicle Availability by Sex in St James
The most prevalent vehicle ownership categories in St James are males with 2 vehicles (1,651, accounting for 45.0%) and females with 2 vehicles (1,336, making up 57.2%).
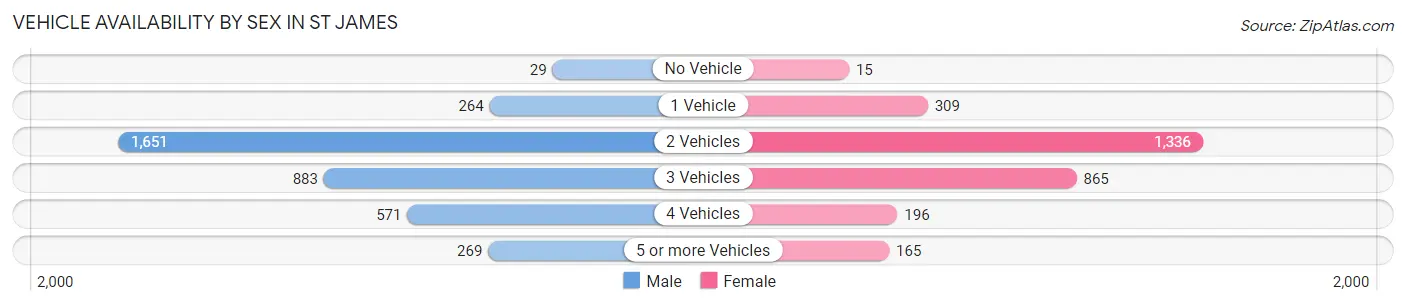
| Vehicles Available | Male | Female |
| No Vehicle | 29 (0.8%) | 15 (0.5%) |
| 1 Vehicle | 264 (7.2%) | 309 (10.7%) |
| 2 Vehicles | 1,651 (45.0%) | 1,336 (46.3%) |
| 3 Vehicles | 883 (24.1%) | 865 (30.0%) |
| 4 Vehicles | 571 (15.6%) | 196 (6.8%) |
| 5 or more Vehicles | 269 (7.3%) | 165 (5.7%) |
| Total | 3,667 (100.0%) | 2,886 (100.0%) |
Commute Time in St James
The most frequently occuring commute durations in St James are 30 to 34 minutes (898 commuters, 15.0%), 10 to 14 minutes (895 commuters, 15.0%), and 20 to 24 minutes (670 commuters, 11.2%).
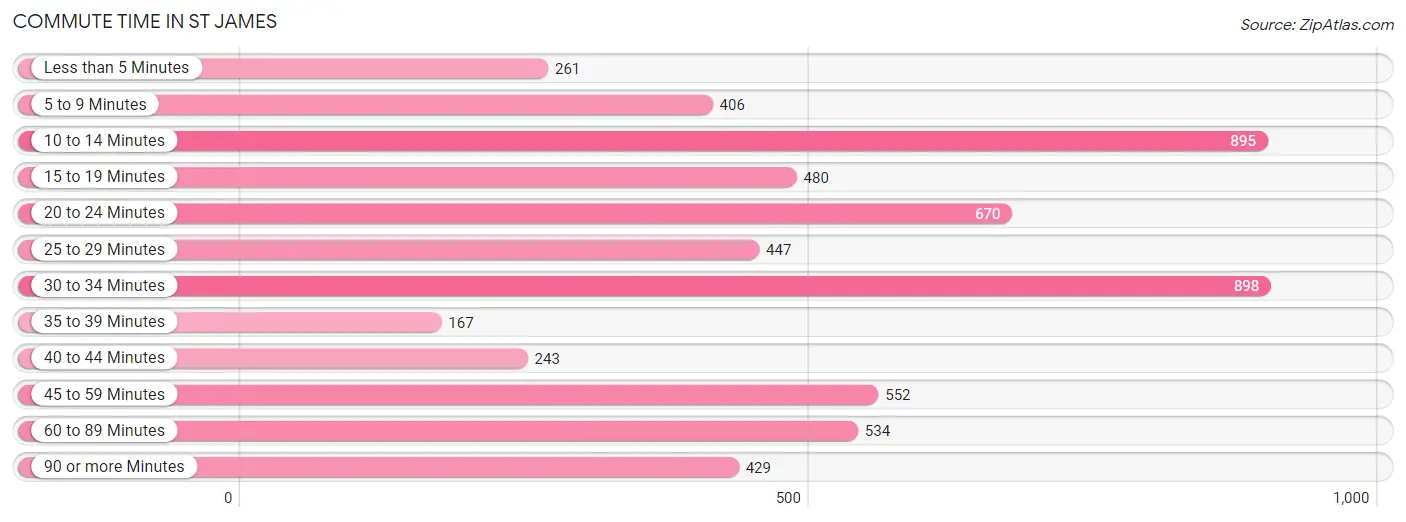
| Commute Time | # Commuters | % Commuters |
| Less than 5 Minutes | 261 | 4.4% |
| 5 to 9 Minutes | 406 | 6.8% |
| 10 to 14 Minutes | 895 | 15.0% |
| 15 to 19 Minutes | 480 | 8.0% |
| 20 to 24 Minutes | 670 | 11.2% |
| 25 to 29 Minutes | 447 | 7.5% |
| 30 to 34 Minutes | 898 | 15.0% |
| 35 to 39 Minutes | 167 | 2.8% |
| 40 to 44 Minutes | 243 | 4.1% |
| 45 to 59 Minutes | 552 | 9.2% |
| 60 to 89 Minutes | 534 | 8.9% |
| 90 or more Minutes | 429 | 7.2% |
Commute Time by Sex in St James
The most common commute times in St James are 30 to 34 minutes (531 commuters, 16.0%) for males and 10 to 14 minutes (465 commuters, 17.5%) for females.
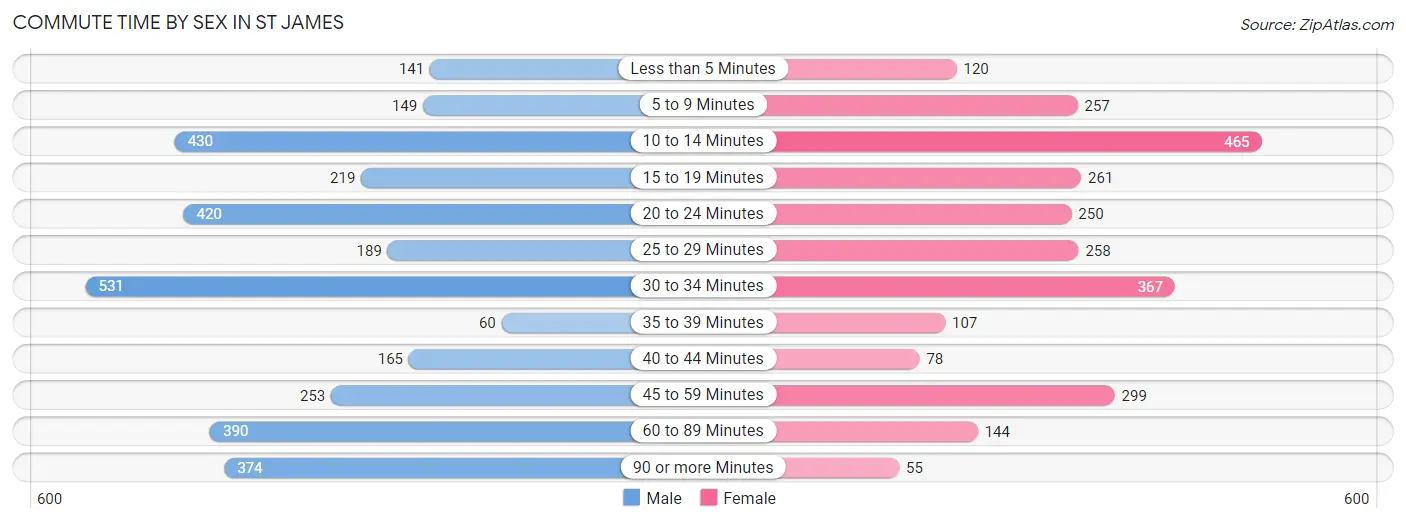
| Commute Time | Male | Female |
| Less than 5 Minutes | 141 (4.3%) | 120 (4.5%) |
| 5 to 9 Minutes | 149 (4.5%) | 257 (9.7%) |
| 10 to 14 Minutes | 430 (13.0%) | 465 (17.5%) |
| 15 to 19 Minutes | 219 (6.6%) | 261 (9.8%) |
| 20 to 24 Minutes | 420 (12.7%) | 250 (9.4%) |
| 25 to 29 Minutes | 189 (5.7%) | 258 (9.7%) |
| 30 to 34 Minutes | 531 (16.0%) | 367 (13.8%) |
| 35 to 39 Minutes | 60 (1.8%) | 107 (4.0%) |
| 40 to 44 Minutes | 165 (5.0%) | 78 (2.9%) |
| 45 to 59 Minutes | 253 (7.6%) | 299 (11.2%) |
| 60 to 89 Minutes | 390 (11.7%) | 144 (5.4%) |
| 90 or more Minutes | 374 (11.3%) | 55 (2.1%) |
Time of Departure to Work by Sex in St James
The most frequent times of departure to work in St James are 6:00 AM to 6:29 AM (590, 17.8%) for males and 8:00 AM to 8:29 AM (488, 18.3%) for females.
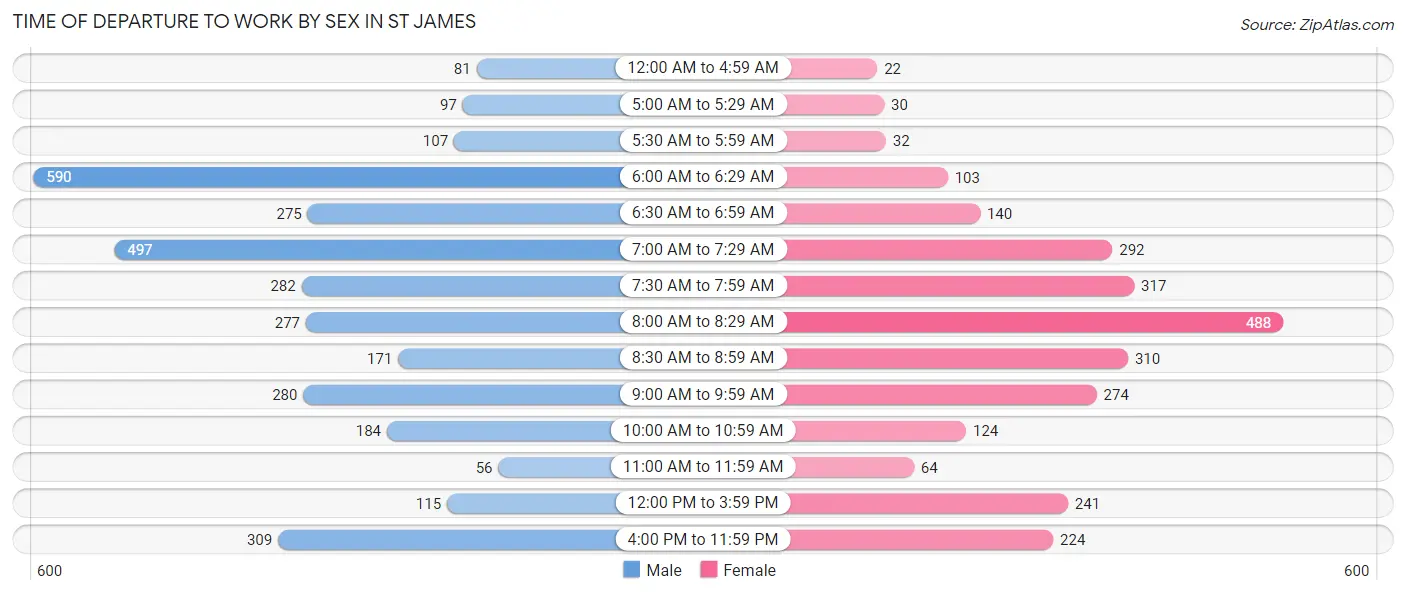
| Time of Departure | Male | Female |
| 12:00 AM to 4:59 AM | 81 (2.4%) | 22 (0.8%) |
| 5:00 AM to 5:29 AM | 97 (2.9%) | 30 (1.1%) |
| 5:30 AM to 5:59 AM | 107 (3.2%) | 32 (1.2%) |
| 6:00 AM to 6:29 AM | 590 (17.8%) | 103 (3.9%) |
| 6:30 AM to 6:59 AM | 275 (8.3%) | 140 (5.3%) |
| 7:00 AM to 7:29 AM | 497 (15.0%) | 292 (11.0%) |
| 7:30 AM to 7:59 AM | 282 (8.5%) | 317 (11.9%) |
| 8:00 AM to 8:29 AM | 277 (8.3%) | 488 (18.3%) |
| 8:30 AM to 8:59 AM | 171 (5.1%) | 310 (11.7%) |
| 9:00 AM to 9:59 AM | 280 (8.4%) | 274 (10.3%) |
| 10:00 AM to 10:59 AM | 184 (5.5%) | 124 (4.7%) |
| 11:00 AM to 11:59 AM | 56 (1.7%) | 64 (2.4%) |
| 12:00 PM to 3:59 PM | 115 (3.5%) | 241 (9.1%) |
| 4:00 PM to 11:59 PM | 309 (9.3%) | 224 (8.4%) |
| Total | 3,321 (100.0%) | 2,661 (100.0%) |
Housing Occupancy in St James
Occupancy by Ownership in St James
Of the total 4,826 dwellings in St James, owner-occupied units account for 4,316 (89.4%), while renter-occupied units make up 510 (10.6%).
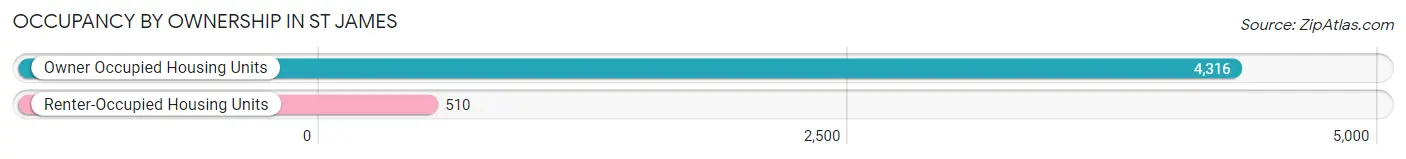
| Occupancy | # Housing Units | % Housing Units |
| Owner Occupied Housing Units | 4,316 | 89.4% |
| Renter-Occupied Housing Units | 510 | 10.6% |
| Total Occupied Housing Units | 4,826 | 100.0% |
Occupancy by Household Size in St James
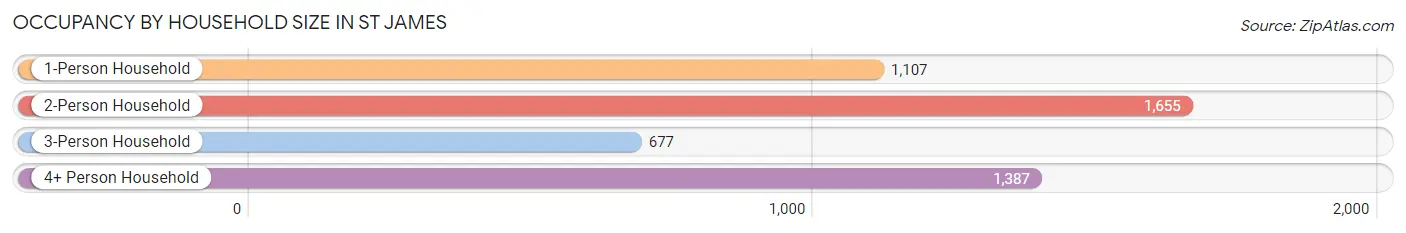
| Household Size | # Housing Units | % Housing Units |
| 1-Person Household | 1,107 | 22.9% |
| 2-Person Household | 1,655 | 34.3% |
| 3-Person Household | 677 | 14.0% |
| 4+ Person Household | 1,387 | 28.7% |
| Total Housing Units | 4,826 | 100.0% |
Occupancy by Ownership by Household Size in St James
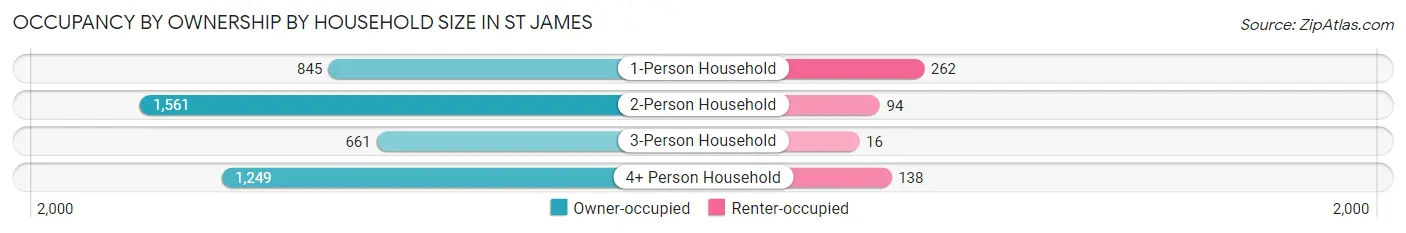
| Household Size | Owner-occupied | Renter-occupied |
| 1-Person Household | 845 (76.3%) | 262 (23.7%) |
| 2-Person Household | 1,561 (94.3%) | 94 (5.7%) |
| 3-Person Household | 661 (97.6%) | 16 (2.4%) |
| 4+ Person Household | 1,249 (90.0%) | 138 (10.0%) |
| Total Housing Units | 4,316 (89.4%) | 510 (10.6%) |
Occupancy by Educational Attainment in St James
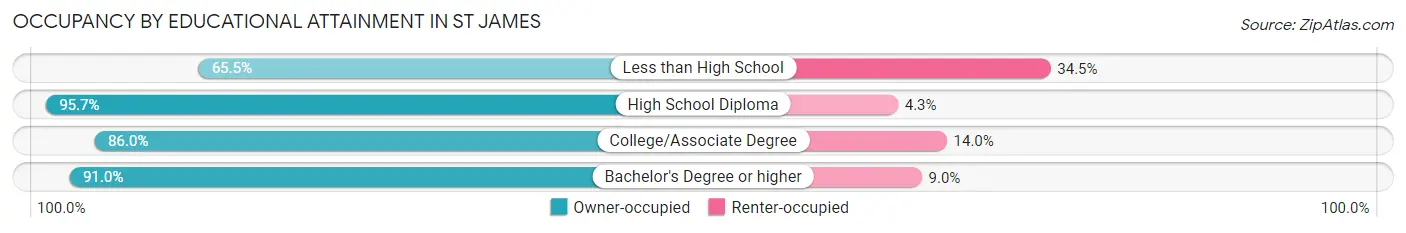
| Household Size | Owner-occupied | Renter-occupied |
| Less than High School | 91 (65.5%) | 48 (34.5%) |
| High School Diploma | 647 (95.7%) | 29 (4.3%) |
| College/Associate Degree | 1,245 (86.0%) | 202 (14.0%) |
| Bachelor's Degree or higher | 2,333 (91.0%) | 231 (9.0%) |
Occupancy by Age of Householder in St James
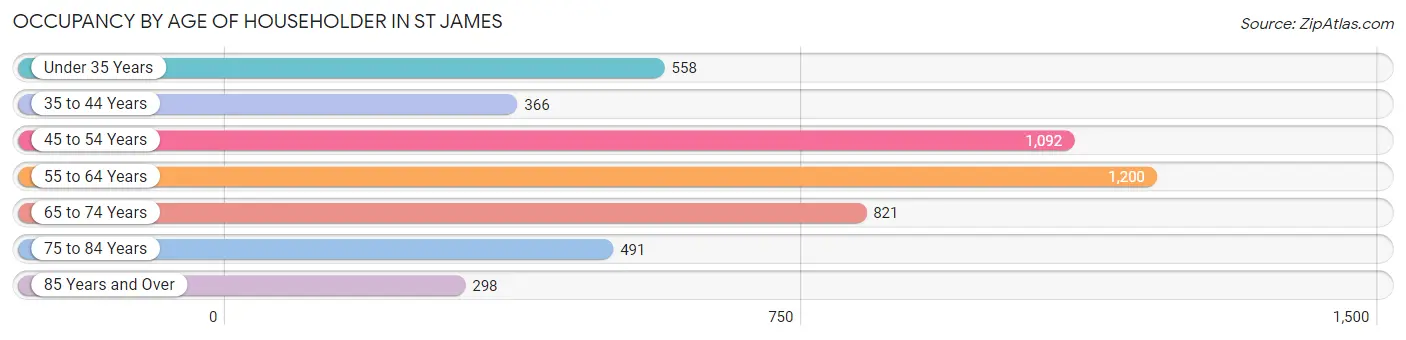
| Age Bracket | # Households | % Households |
| Under 35 Years | 558 | 11.6% |
| 35 to 44 Years | 366 | 7.6% |
| 45 to 54 Years | 1,092 | 22.6% |
| 55 to 64 Years | 1,200 | 24.9% |
| 65 to 74 Years | 821 | 17.0% |
| 75 to 84 Years | 491 | 10.2% |
| 85 Years and Over | 298 | 6.2% |
| Total | 4,826 | 100.0% |
Housing Finances in St James
Median Income by Occupancy in St James
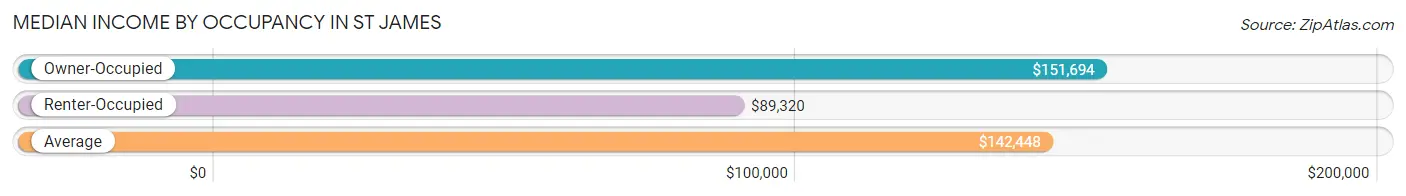
| Occupancy Type | # Households | Median Income |
| Owner-Occupied | 4,316 (89.4%) | $151,694 |
| Renter-Occupied | 510 (10.6%) | $89,320 |
| Average | 4,826 (100.0%) | $142,448 |
Occupancy by Householder Income Bracket in St James
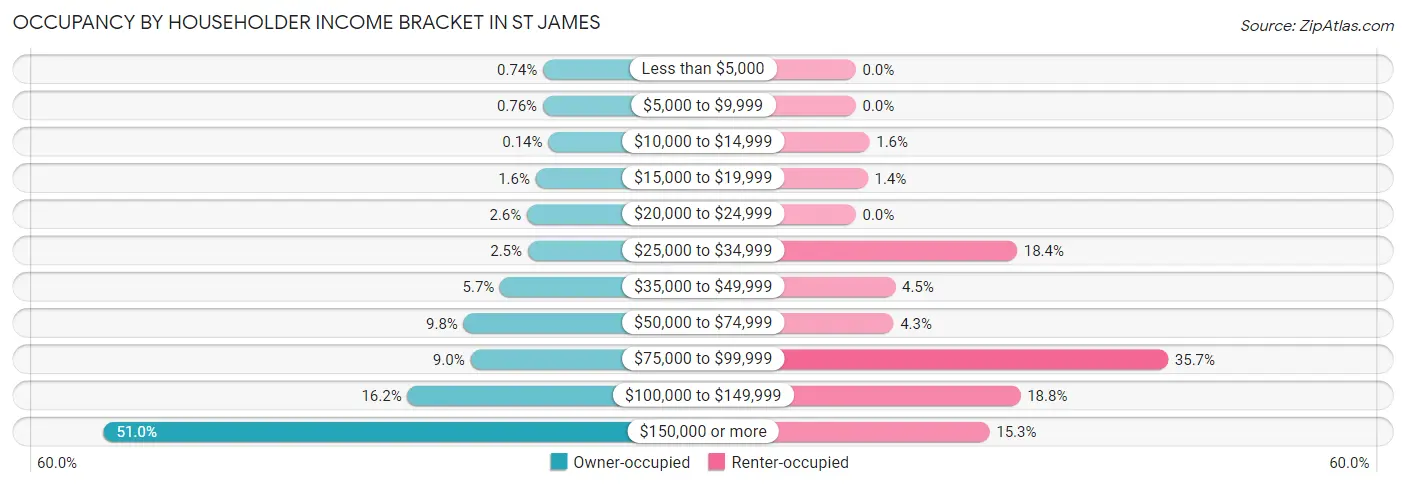
| Income Bracket | Owner-occupied | Renter-occupied |
| Less than $5,000 | 32 (0.7%) | 0 (0.0%) |
| $5,000 to $9,999 | 33 (0.8%) | 0 (0.0%) |
| $10,000 to $14,999 | 6 (0.1%) | 8 (1.6%) |
| $15,000 to $19,999 | 68 (1.6%) | 7 (1.4%) |
| $20,000 to $24,999 | 111 (2.6%) | 0 (0.0%) |
| $25,000 to $34,999 | 107 (2.5%) | 94 (18.4%) |
| $35,000 to $49,999 | 244 (5.7%) | 23 (4.5%) |
| $50,000 to $74,999 | 424 (9.8%) | 22 (4.3%) |
| $75,000 to $99,999 | 390 (9.0%) | 182 (35.7%) |
| $100,000 to $149,999 | 701 (16.2%) | 96 (18.8%) |
| $150,000 or more | 2,200 (51.0%) | 78 (15.3%) |
| Total | 4,316 (100.0%) | 510 (100.0%) |
Monthly Housing Cost Tiers in St James
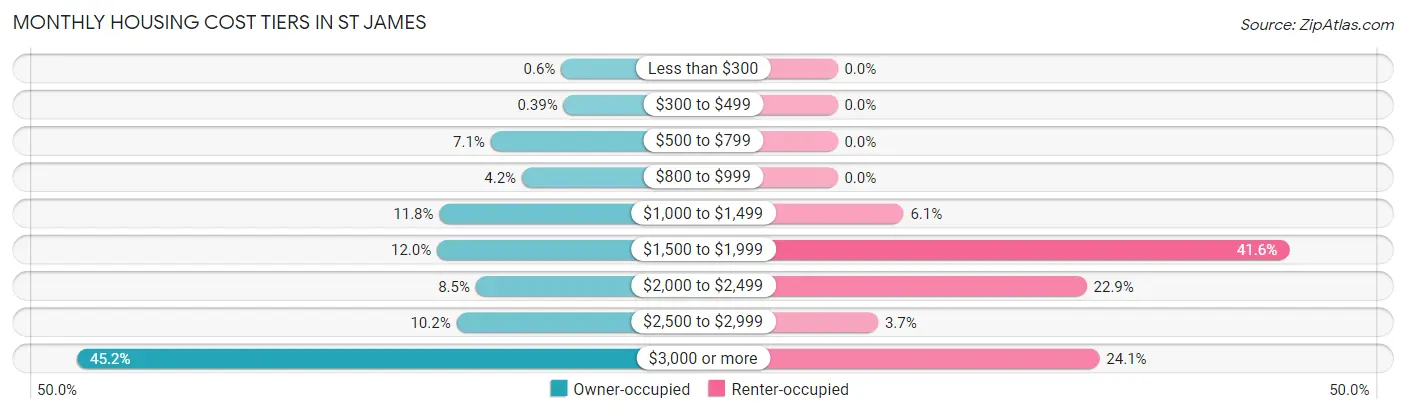
| Monthly Cost | Owner-occupied | Renter-occupied |
| Less than $300 | 26 (0.6%) | 0 (0.0%) |
| $300 to $499 | 17 (0.4%) | 0 (0.0%) |
| $500 to $799 | 306 (7.1%) | 0 (0.0%) |
| $800 to $999 | 182 (4.2%) | 0 (0.0%) |
| $1,000 to $1,499 | 510 (11.8%) | 31 (6.1%) |
| $1,500 to $1,999 | 519 (12.0%) | 212 (41.6%) |
| $2,000 to $2,499 | 365 (8.5%) | 117 (22.9%) |
| $2,500 to $2,999 | 442 (10.2%) | 19 (3.7%) |
| $3,000 or more | 1,949 (45.2%) | 123 (24.1%) |
| Total | 4,316 (100.0%) | 510 (100.0%) |
Physical Housing Characteristics in St James
Housing Structures in St James
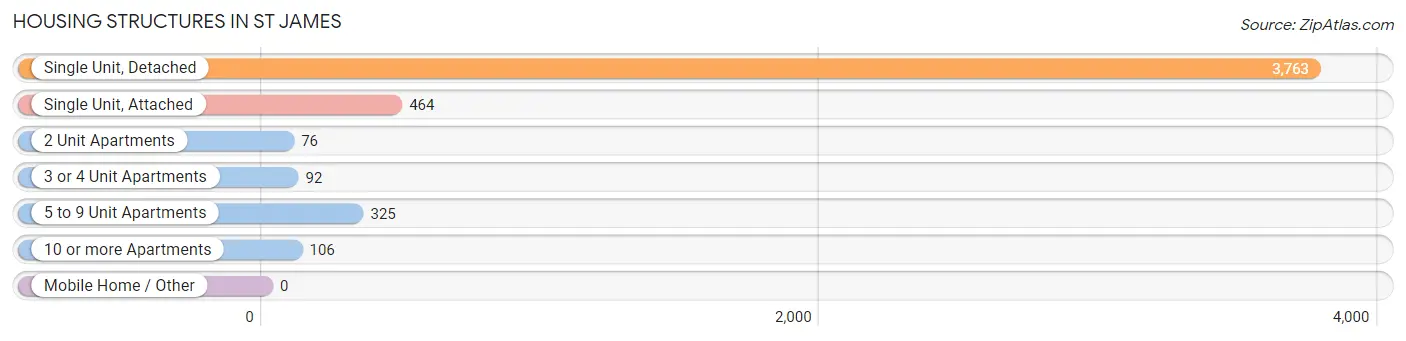
| Structure Type | # Housing Units | % Housing Units |
| Single Unit, Detached | 3,763 | 78.0% |
| Single Unit, Attached | 464 | 9.6% |
| 2 Unit Apartments | 76 | 1.6% |
| 3 or 4 Unit Apartments | 92 | 1.9% |
| 5 to 9 Unit Apartments | 325 | 6.7% |
| 10 or more Apartments | 106 | 2.2% |
| Mobile Home / Other | 0 | 0.0% |
| Total | 4,826 | 100.0% |
Housing Structures by Occupancy in St James
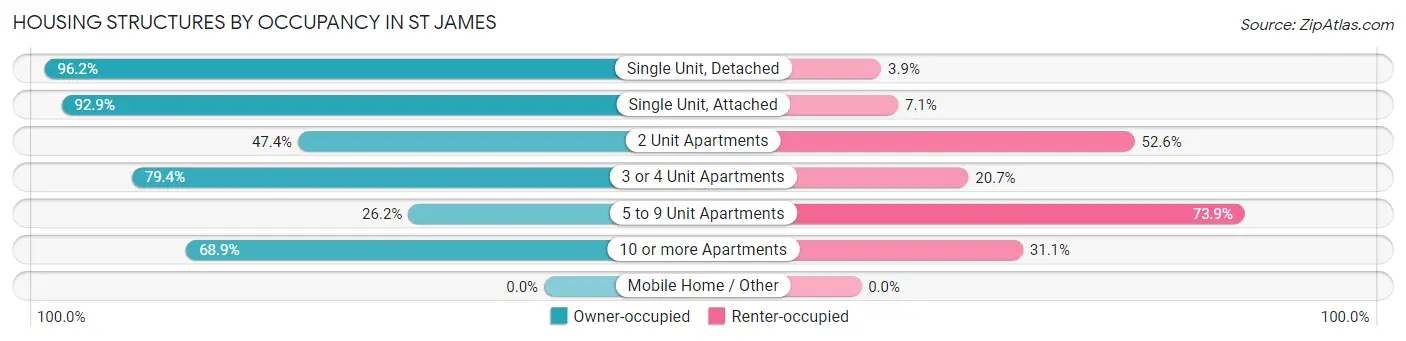
| Structure Type | Owner-occupied | Renter-occupied |
| Single Unit, Detached | 3,618 (96.2%) | 145 (3.8%) |
| Single Unit, Attached | 431 (92.9%) | 33 (7.1%) |
| 2 Unit Apartments | 36 (47.4%) | 40 (52.6%) |
| 3 or 4 Unit Apartments | 73 (79.3%) | 19 (20.6%) |
| 5 to 9 Unit Apartments | 85 (26.2%) | 240 (73.9%) |
| 10 or more Apartments | 73 (68.9%) | 33 (31.1%) |
| Mobile Home / Other | 0 (0.0%) | 0 (0.0%) |
| Total | 4,316 (89.4%) | 510 (10.6%) |
Housing Structures by Number of Rooms in St James
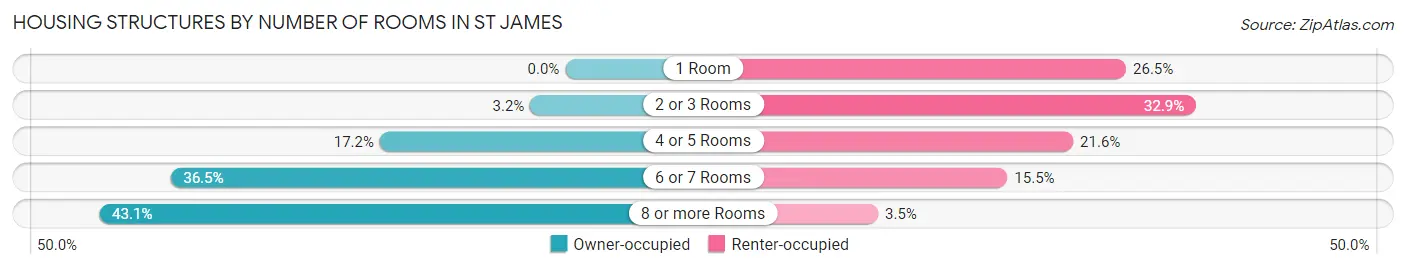
| Number of Rooms | Owner-occupied | Renter-occupied |
| 1 Room | 0 (0.0%) | 135 (26.5%) |
| 2 or 3 Rooms | 140 (3.2%) | 168 (32.9%) |
| 4 or 5 Rooms | 740 (17.2%) | 110 (21.6%) |
| 6 or 7 Rooms | 1,576 (36.5%) | 79 (15.5%) |
| 8 or more Rooms | 1,860 (43.1%) | 18 (3.5%) |
| Total | 4,316 (100.0%) | 510 (100.0%) |
Housing Structure by Heating Type in St James
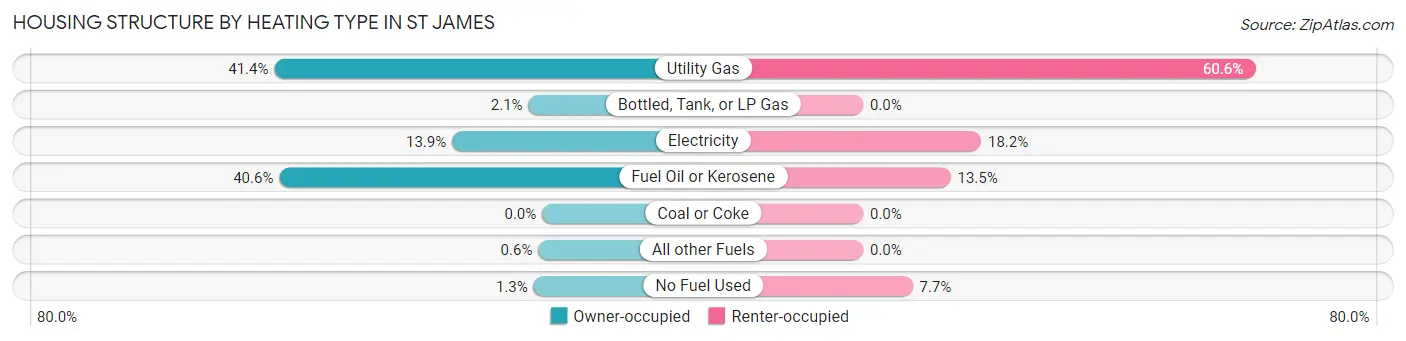
| Heating Type | Owner-occupied | Renter-occupied |
| Utility Gas | 1,787 (41.4%) | 309 (60.6%) |
| Bottled, Tank, or LP Gas | 91 (2.1%) | 0 (0.0%) |
| Electricity | 601 (13.9%) | 93 (18.2%) |
| Fuel Oil or Kerosene | 1,754 (40.6%) | 69 (13.5%) |
| Coal or Coke | 0 (0.0%) | 0 (0.0%) |
| All other Fuels | 26 (0.6%) | 0 (0.0%) |
| No Fuel Used | 57 (1.3%) | 39 (7.6%) |
| Total | 4,316 (100.0%) | 510 (100.0%) |
Household Vehicle Usage in St James
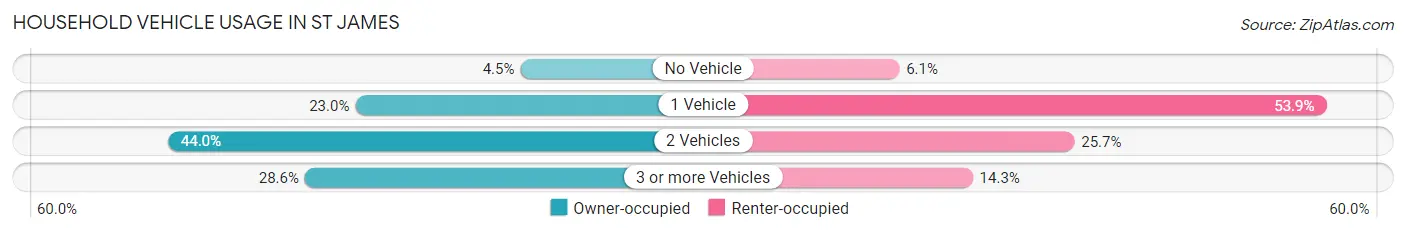
| Vehicles per Household | Owner-occupied | Renter-occupied |
| No Vehicle | 193 (4.5%) | 31 (6.1%) |
| 1 Vehicle | 991 (23.0%) | 275 (53.9%) |
| 2 Vehicles | 1,897 (44.0%) | 131 (25.7%) |
| 3 or more Vehicles | 1,235 (28.6%) | 73 (14.3%) |
| Total | 4,316 (100.0%) | 510 (100.0%) |
Real Estate & Mortgages in St James
Real Estate and Mortgage Overview in St James
| Characteristic | Without Mortgage | With Mortgage |
| Housing Units | 1,764 | 2,552 |
| Median Property Value | $536,500 | $625,300 |
| Median Household Income | $96,303 | $1,582 |
| Monthly Housing Costs | $1,411 | $1,819 |
| Real Estate Taxes | $10,001 | $0 |
Property Value by Mortgage Status in St James
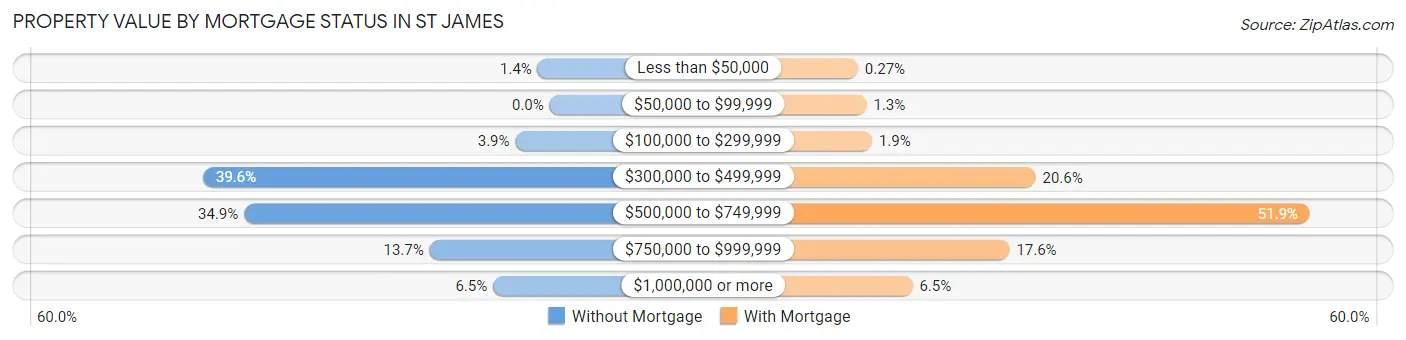
| Property Value | Without Mortgage | With Mortgage |
| Less than $50,000 | 24 (1.4%) | 7 (0.3%) |
| $50,000 to $99,999 | 0 (0.0%) | 32 (1.3%) |
| $100,000 to $299,999 | 69 (3.9%) | 48 (1.9%) |
| $300,000 to $499,999 | 699 (39.6%) | 525 (20.6%) |
| $500,000 to $749,999 | 616 (34.9%) | 1,325 (51.9%) |
| $750,000 to $999,999 | 242 (13.7%) | 449 (17.6%) |
| $1,000,000 or more | 114 (6.5%) | 166 (6.5%) |
| Total | 1,764 (100.0%) | 2,552 (100.0%) |
Household Income by Mortgage Status in St James
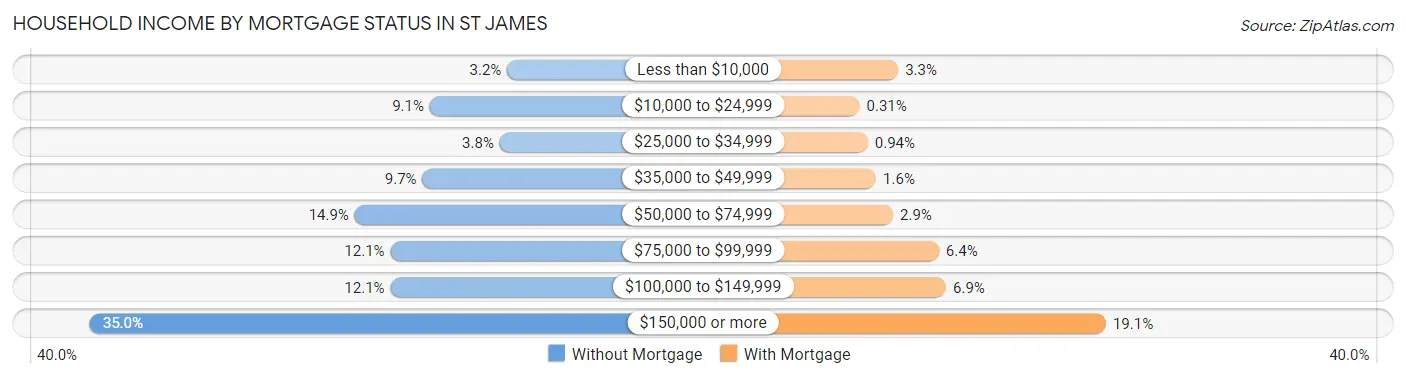
| Household Income | Without Mortgage | With Mortgage |
| Less than $10,000 | 57 (3.2%) | 83 (3.3%) |
| $10,000 to $24,999 | 161 (9.1%) | 8 (0.3%) |
| $25,000 to $34,999 | 67 (3.8%) | 24 (0.9%) |
| $35,000 to $49,999 | 171 (9.7%) | 40 (1.6%) |
| $50,000 to $74,999 | 262 (14.8%) | 73 (2.9%) |
| $75,000 to $99,999 | 214 (12.1%) | 162 (6.4%) |
| $100,000 to $149,999 | 214 (12.1%) | 176 (6.9%) |
| $150,000 or more | 618 (35.0%) | 487 (19.1%) |
| Total | 1,764 (100.0%) | 2,552 (100.0%) |
Property Value to Household Income Ratio in St James
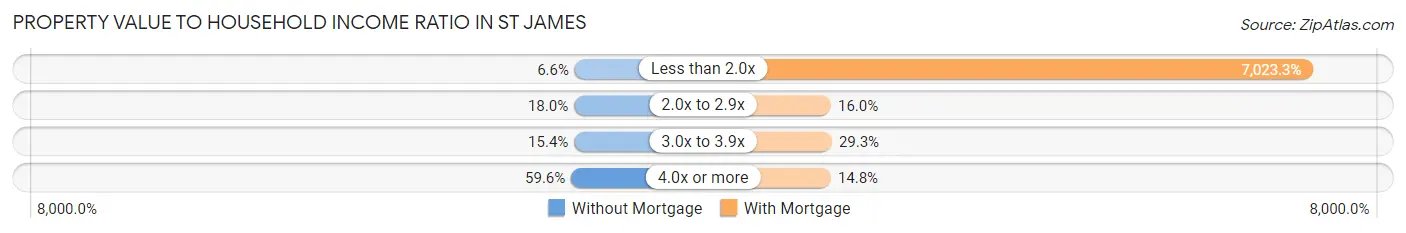
| Value-to-Income Ratio | Without Mortgage | With Mortgage |
| Less than 2.0x | 116 (6.6%) | 179,235 (7,023.3%) |
| 2.0x to 2.9x | 317 (18.0%) | 407 (16.0%) |
| 3.0x to 3.9x | 272 (15.4%) | 747 (29.3%) |
| 4.0x or more | 1,052 (59.6%) | 378 (14.8%) |
| Total | 1,764 (100.0%) | 2,552 (100.0%) |
Real Estate Taxes by Mortgage Status in St James
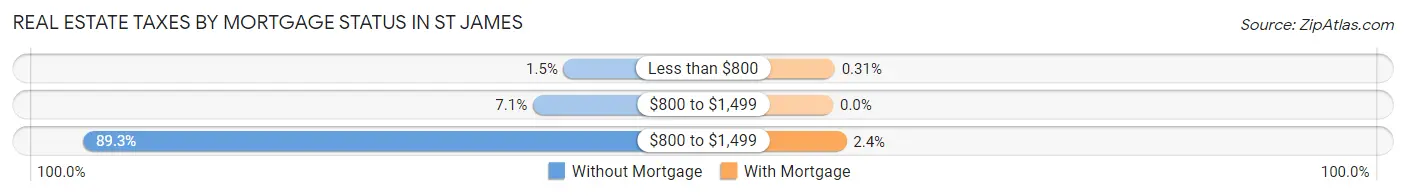
| Property Taxes | Without Mortgage | With Mortgage |
| Less than $800 | 27 (1.5%) | 8 (0.3%) |
| $800 to $1,499 | 126 (7.1%) | 0 (0.0%) |
| $800 to $1,499 | 1,576 (89.3%) | 62 (2.4%) |
| Total | 1,764 (100.0%) | 2,552 (100.0%) |
Health & Disability in St James
Health Insurance Coverage by Age in St James
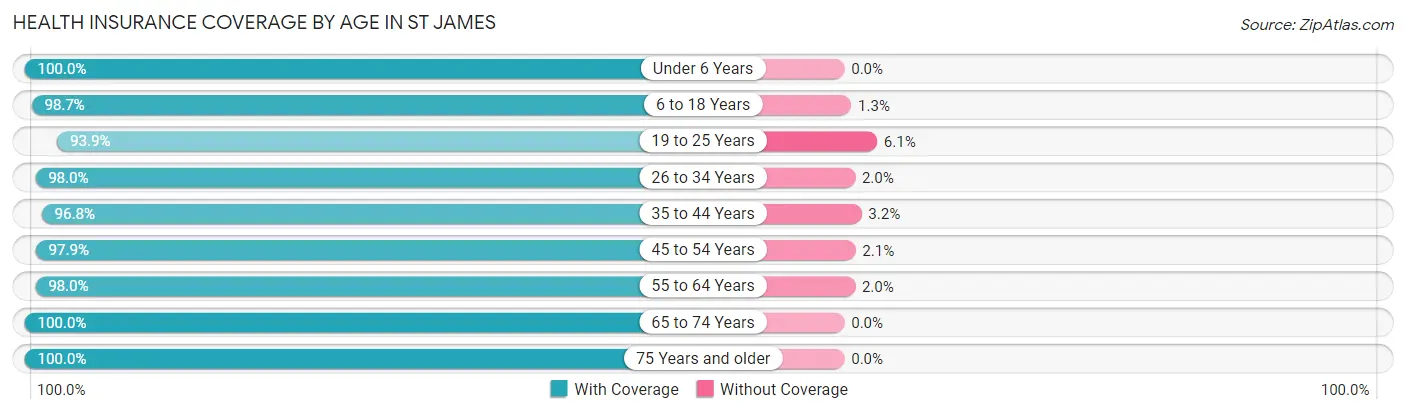
| Age Bracket | With Coverage | Without Coverage |
| Under 6 Years | 560 (100.0%) | 0 (0.0%) |
| 6 to 18 Years | 2,469 (98.7%) | 32 (1.3%) |
| 19 to 25 Years | 1,066 (93.9%) | 69 (6.1%) |
| 26 to 34 Years | 1,283 (98.0%) | 26 (2.0%) |
| 35 to 44 Years | 1,184 (96.8%) | 39 (3.2%) |
| 45 to 54 Years | 1,801 (97.9%) | 38 (2.1%) |
| 55 to 64 Years | 2,261 (98.0%) | 46 (2.0%) |
| 65 to 74 Years | 1,327 (100.0%) | 0 (0.0%) |
| 75 Years and older | 1,174 (100.0%) | 0 (0.0%) |
| Total | 13,125 (98.1%) | 250 (1.9%) |
Health Insurance Coverage by Citizenship Status in St James
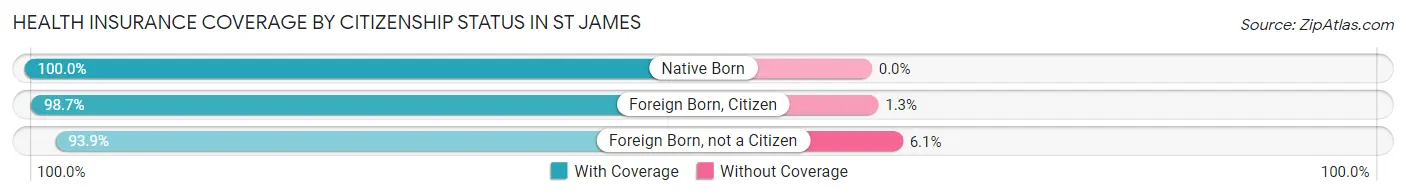
| Citizenship Status | With Coverage | Without Coverage |
| Native Born | 560 (100.0%) | 0 (0.0%) |
| Foreign Born, Citizen | 2,469 (98.7%) | 32 (1.3%) |
| Foreign Born, not a Citizen | 1,066 (93.9%) | 69 (6.1%) |
Health Insurance Coverage by Household Income in St James
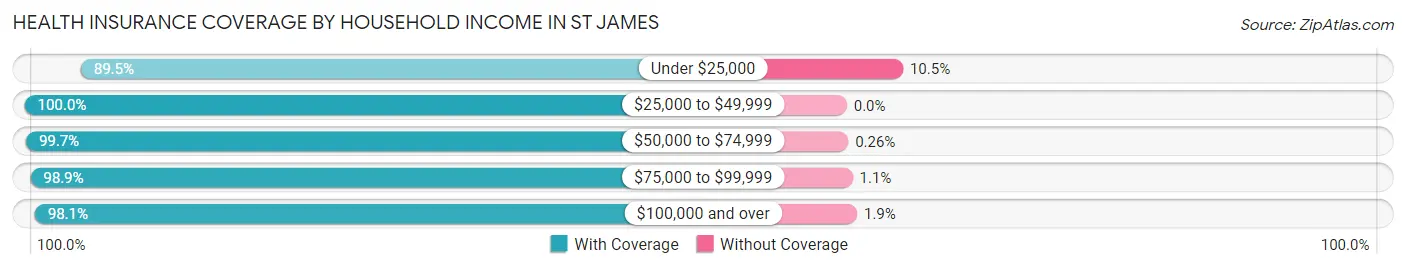
| Household Income | With Coverage | Without Coverage |
| Under $25,000 | 272 (89.5%) | 32 (10.5%) |
| $25,000 to $49,999 | 853 (100.0%) | 0 (0.0%) |
| $50,000 to $74,999 | 768 (99.7%) | 2 (0.3%) |
| $75,000 to $99,999 | 1,103 (98.9%) | 12 (1.1%) |
| $100,000 and over | 10,096 (98.1%) | 198 (1.9%) |
Public vs Private Health Insurance Coverage by Age in St James
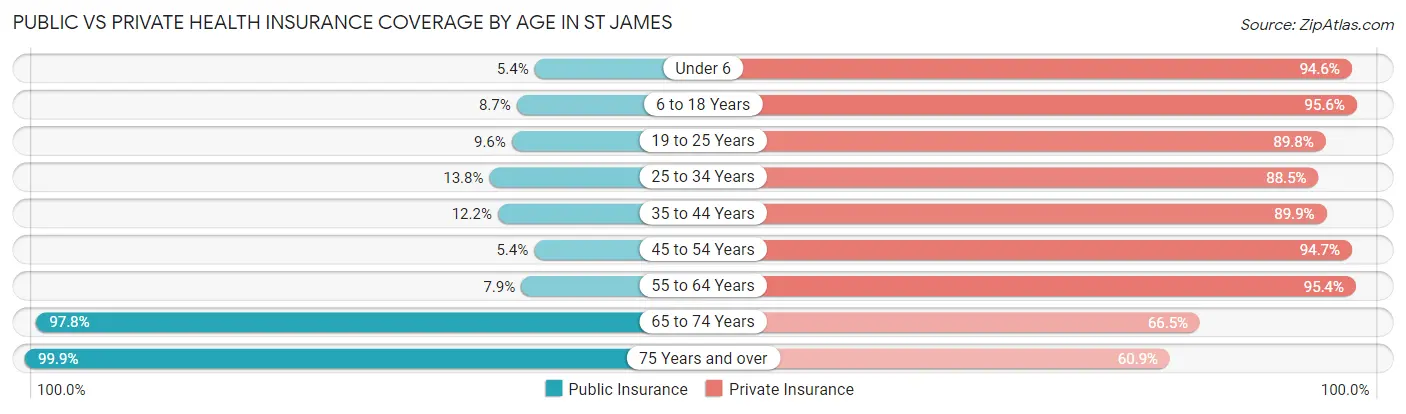
| Age Bracket | Public Insurance | Private Insurance |
| Under 6 | 30 (5.4%) | 530 (94.6%) |
| 6 to 18 Years | 217 (8.7%) | 2,390 (95.6%) |
| 19 to 25 Years | 109 (9.6%) | 1,019 (89.8%) |
| 25 to 34 Years | 180 (13.8%) | 1,158 (88.5%) |
| 35 to 44 Years | 149 (12.2%) | 1,100 (89.9%) |
| 45 to 54 Years | 100 (5.4%) | 1,741 (94.7%) |
| 55 to 64 Years | 181 (7.9%) | 2,201 (95.4%) |
| 65 to 74 Years | 1,298 (97.8%) | 882 (66.5%) |
| 75 Years and over | 1,173 (99.9%) | 715 (60.9%) |
| Total | 3,437 (25.7%) | 11,736 (87.7%) |
Disability Status by Sex by Age in St James
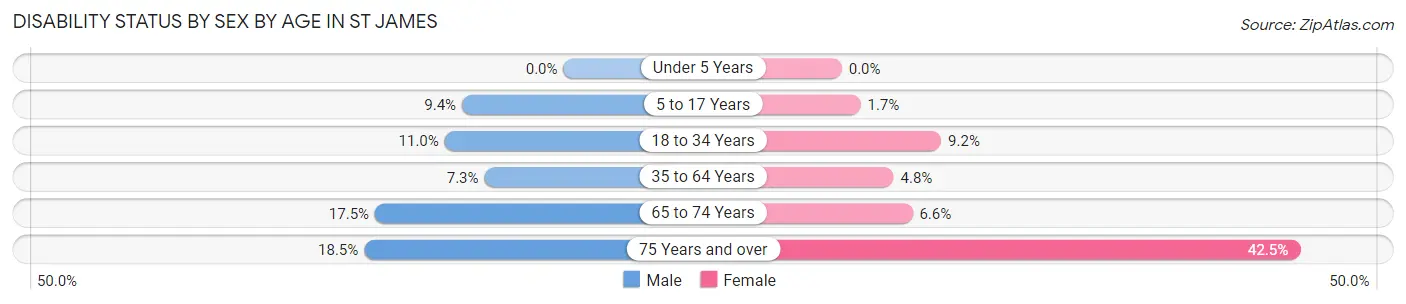
| Age Bracket | Male | Female |
| Under 5 Years | 0 (0.0%) | 0 (0.0%) |
| 5 to 17 Years | 109 (9.4%) | 19 (1.7%) |
| 18 to 34 Years | 167 (11.0%) | 115 (9.2%) |
| 35 to 64 Years | 197 (7.3%) | 129 (4.8%) |
| 65 to 74 Years | 96 (17.5%) | 51 (6.6%) |
| 75 Years and over | 71 (18.5%) | 336 (42.5%) |
Disability Class by Sex by Age in St James
Disability Class: Hearing Difficulty
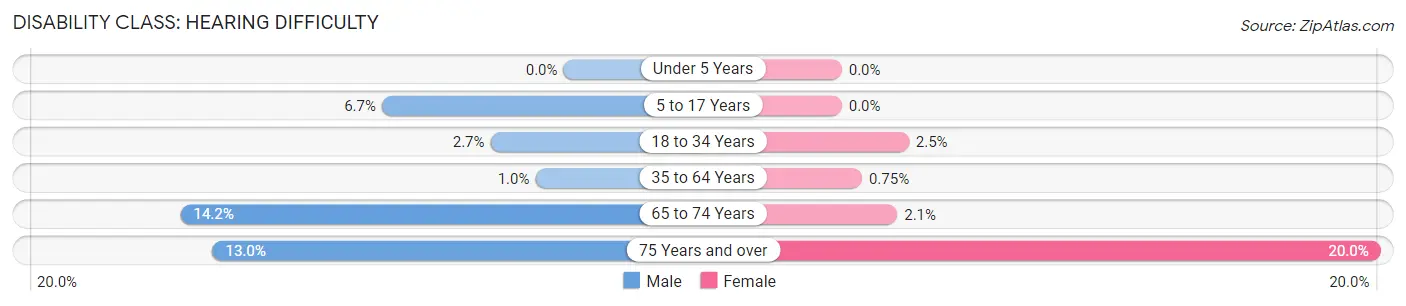
| Age Bracket | Male | Female |
| Under 5 Years | 0 (0.0%) | 0 (0.0%) |
| 5 to 17 Years | 78 (6.7%) | 0 (0.0%) |
| 18 to 34 Years | 41 (2.7%) | 31 (2.5%) |
| 35 to 64 Years | 28 (1.0%) | 20 (0.7%) |
| 65 to 74 Years | 78 (14.2%) | 16 (2.1%) |
| 75 Years and over | 50 (13.0%) | 158 (20.0%) |
Disability Class: Vision Difficulty
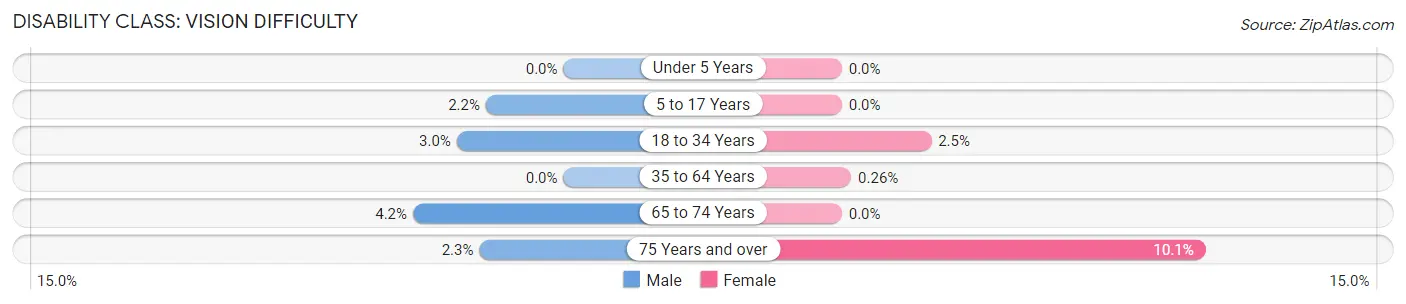
| Age Bracket | Male | Female |
| Under 5 Years | 0 (0.0%) | 0 (0.0%) |
| 5 to 17 Years | 25 (2.2%) | 0 (0.0%) |
| 18 to 34 Years | 45 (3.0%) | 31 (2.5%) |
| 35 to 64 Years | 0 (0.0%) | 7 (0.3%) |
| 65 to 74 Years | 23 (4.2%) | 0 (0.0%) |
| 75 Years and over | 9 (2.3%) | 80 (10.1%) |
Disability Class: Cognitive Difficulty
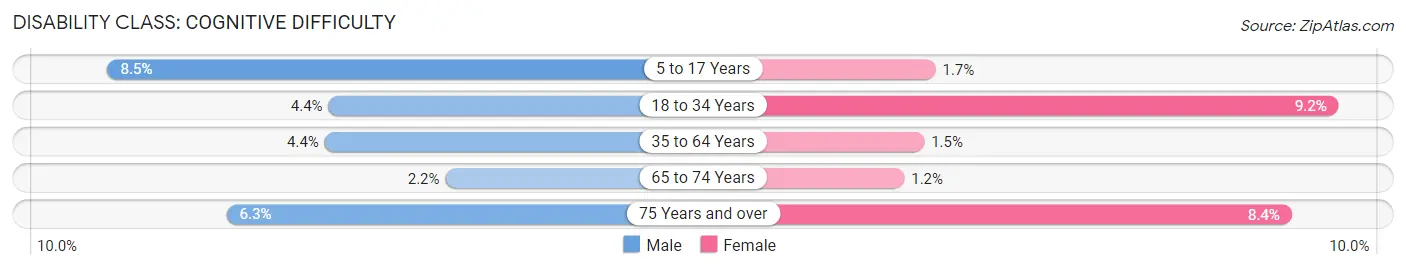
| Age Bracket | Male | Female |
| 5 to 17 Years | 98 (8.5%) | 19 (1.7%) |
| 18 to 34 Years | 66 (4.4%) | 115 (9.2%) |
| 35 to 64 Years | 119 (4.4%) | 41 (1.5%) |
| 65 to 74 Years | 12 (2.2%) | 9 (1.2%) |
| 75 Years and over | 24 (6.2%) | 66 (8.4%) |
Disability Class: Ambulatory Difficulty
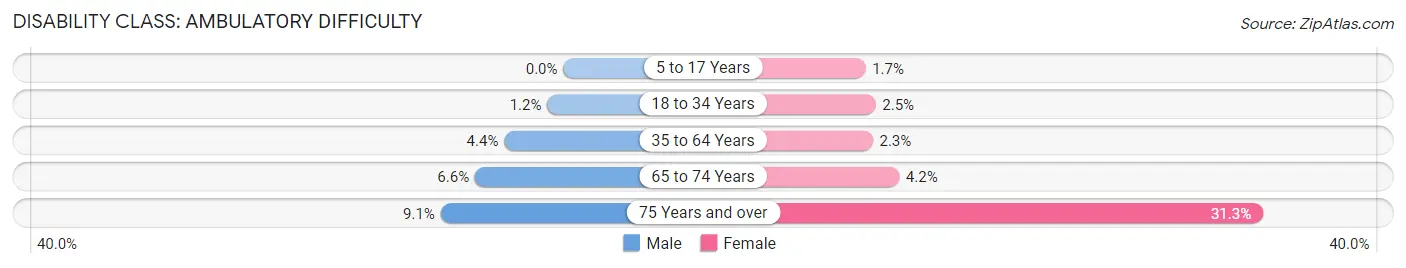
| Age Bracket | Male | Female |
| 5 to 17 Years | 0 (0.0%) | 19 (1.7%) |
| 18 to 34 Years | 18 (1.2%) | 31 (2.5%) |
| 35 to 64 Years | 118 (4.4%) | 61 (2.3%) |
| 65 to 74 Years | 36 (6.6%) | 33 (4.2%) |
| 75 Years and over | 35 (9.1%) | 247 (31.3%) |
Disability Class: Self-Care Difficulty
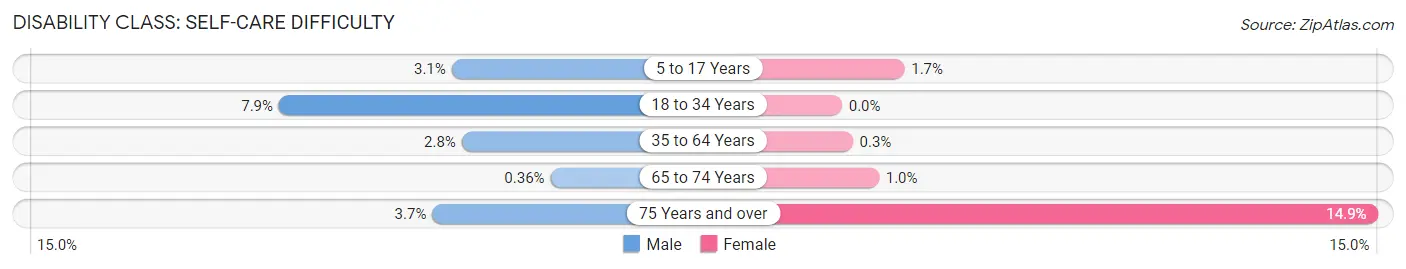
| Age Bracket | Male | Female |
| 5 to 17 Years | 36 (3.1%) | 19 (1.7%) |
| 18 to 34 Years | 120 (7.9%) | 0 (0.0%) |
| 35 to 64 Years | 76 (2.8%) | 8 (0.3%) |
| 65 to 74 Years | 2 (0.4%) | 8 (1.0%) |
| 75 Years and over | 14 (3.6%) | 118 (14.9%) |
Technology Access in St James
Computing Device Access in St James
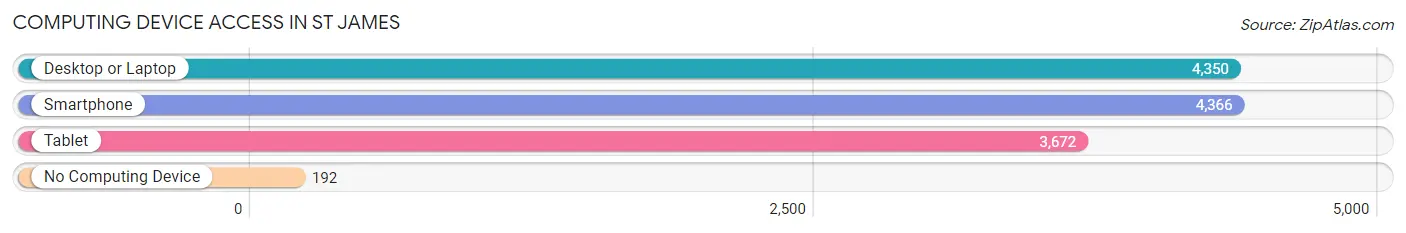
| Device Type | # Households | % Households |
| Desktop or Laptop | 4,350 | 90.1% |
| Smartphone | 4,366 | 90.5% |
| Tablet | 3,672 | 76.1% |
| No Computing Device | 192 | 4.0% |
| Total | 4,826 | 100.0% |
Internet Access in St James
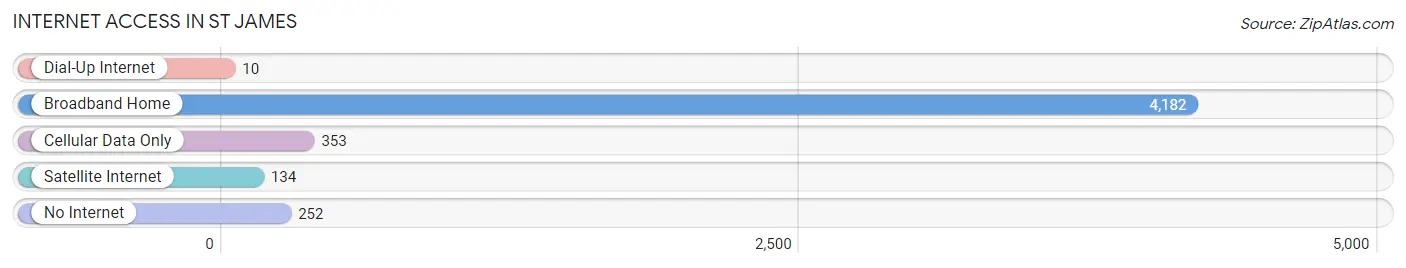
| Internet Type | # Households | % Households |
| Dial-Up Internet | 10 | 0.2% |
| Broadband Home | 4,182 | 86.7% |
| Cellular Data Only | 353 | 7.3% |
| Satellite Internet | 134 | 2.8% |
| No Internet | 252 | 5.2% |
| Total | 4,826 | 100.0% |
St James Summary
St James is a hamlet located in the Town of Smithtown in Suffolk County, New York. It is situated on the north shore of Long Island, approximately 60 miles east of New York City. The hamlet is bordered by the hamlets of Nissequogue to the east, Stony Brook to the south, and Head of the Harbor to the west. St James is home to a population of approximately 10,000 people.
History
The area that is now St James was originally inhabited by the Secatogue Native American tribe. The first European settlers arrived in the area in the late 1600s, and the hamlet was officially established in 1703. The hamlet was named after James Smith, who was the first settler in the area.
In the late 1700s, St James became a popular destination for wealthy New Yorkers who wanted to escape the hustle and bustle of the city. The hamlet was known for its beautiful scenery and its proximity to the beach.
In the early 1900s, St James began to experience a population boom as more and more people moved to the area. The hamlet was incorporated in 1921, and the population continued to grow throughout the 20th century.
Geography
St James is located on the north shore of Long Island, approximately 60 miles east of New York City. The hamlet is bordered by the hamlets of Nissequogue to the east, Stony Brook to the south, and Head of the Harbor to the west.
The hamlet is situated on a peninsula that juts out into the Long Island Sound. The peninsula is surrounded by several bodies of water, including Stony Brook Harbor, Nissequogue River, and Head of the Harbor.
The terrain of St James is mostly flat, with some rolling hills. The hamlet is home to several parks, including St James Park, which is located on the waterfront.
Economy
The economy of St James is largely based on tourism and retail. The hamlet is home to several popular restaurants, shops, and attractions, including the St James General Store, the St James Theater, and the St James Golf Course.
The hamlet is also home to several corporate headquarters, including the headquarters of the Long Island Power Authority and the St James Chamber of Commerce.
Demographics
As of the 2010 census, the population of St James was 10,068. The racial makeup of the hamlet was 87.3% White, 5.2% African American, 0.7% Native American, 2.2% Asian, and 4.6% from other races.
The median household income in St James was $90,845, and the median family income was $103,945. The per capita income was $41,945.
Conclusion
St James is a hamlet located in the Town of Smithtown in Suffolk County, New York. It is situated on the north shore of Long Island, approximately 60 miles east of New York City. The hamlet was originally inhabited by the Secatogue Native American tribe and was officially established in 1703. The economy of St James is largely based on tourism and retail, and the hamlet is home to a population of approximately 10,000 people. The racial makeup of the hamlet is 87.3% White, 5.2% African American, 0.7% Native American, 2.2% Asian, and 4.6% from other races. The median household income in St James was $90,845, and the median family income was $103,945.
Common Questions
What is Per Capita Income in St James?
Per Capita income in St James is $63,998.
What is the Median Family Income in St James?
Median Family Income in St James is $174,184.
What is the Median Household income in St James?
Median Household Income in St James is $142,448.
What is Income or Wage Gap in St James?
Income or Wage Gap in St James is 24.7%.
Women in St James earn 75.3 cents for every dollar earned by a man.
What is Inequality or Gini Index in St James?
Inequality or Gini Index in St James is 0.42.
What is the Total Population of St James?
Total Population of St James is 13,733.
What is the Total Male Population of St James?
Total Male Population of St James is 6,615.
What is the Total Female Population of St James?
Total Female Population of St James is 7,118.
What is the Ratio of Males per 100 Females in St James?
There are 92.93 Males per 100 Females in St James.
What is the Ratio of Females per 100 Males in St James?
There are 107.60 Females per 100 Males in St James.
What is the Median Population Age in St James?
Median Population Age in St James is 46.3 Years.
What is the Average Family Size in St James
Average Family Size in St James is 3.3 People.
What is the Average Household Size in St James
Average Household Size in St James is 2.8 People.
How Large is the Labor Force in St James?
There are 7,195 People in the Labor Forcein in St James.
What is the Percentage of People in the Labor Force in St James?
63.4% of People are in the Labor Force in St James.
What is the Unemployment Rate in St James?
Unemployment Rate in St James is 4.4%.