Stony Point, NY Map & Demographics
Stony Point Map
Stony Point Overview
$49,448
PER CAPITA INCOME
$157,842
AVG FAMILY INCOME
$124,881
AVG HOUSEHOLD INCOME
21.8%
WAGE / INCOME GAP [ % ]
78.2¢/ $1
WAGE / INCOME GAP [ $ ]
0.38
INEQUALITY / GINI INDEX
12,533
TOTAL POPULATION
6,381
MALE POPULATION
6,152
FEMALE POPULATION
103.72
MALES / 100 FEMALES
96.41
FEMALES / 100 MALES
45.4
MEDIAN AGE
3.4
AVG FAMILY SIZE
2.9
AVG HOUSEHOLD SIZE
6,588
LABOR FORCE [ PEOPLE ]
63.7%
PERCENT IN LABOR FORCE
6.2%
UNEMPLOYMENT RATE
Stony Point Zip Codes
Stony Point Area Codes
Income in Stony Point
Income Overview in Stony Point
Per Capita Income in Stony Point is $49,448, while median incomes of families and households are $157,842 and $124,881 respectively.
| Characteristic | Number | Measure |
| Per Capita Income | 12,533 | $49,448 |
| Median Family Income | 3,296 | $157,842 |
| Mean Family Income | 3,296 | $162,037 |
| Median Household Income | 4,364 | $124,881 |
| Mean Household Income | 4,364 | $139,688 |
| Income Deficit | 3,296 | $0 |
| Wage / Income Gap (%) | 12,533 | 21.76% |
| Wage / Income Gap ($) | 12,533 | 78.24¢ per $1 |
| Gini / Inequality Index | 12,533 | 0.38 |
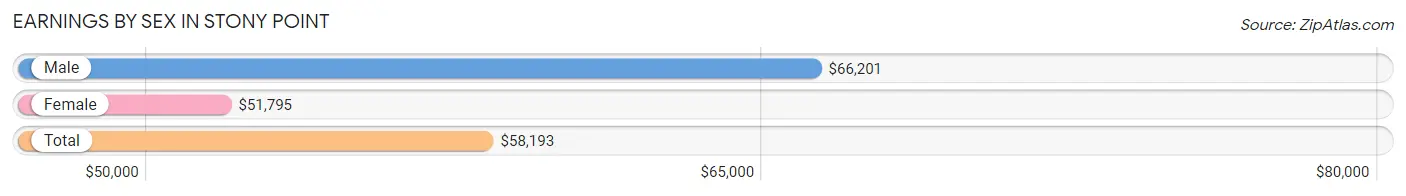
Earnings by Sex in Stony Point
Average Earnings in Stony Point are $58,193, $66,201 for men and $51,795 for women, a difference of 21.8%.
| Sex | Number | Average Earnings |
| Male | 3,469 (50.9%) | $66,201 |
| Female | 3,340 (49.0%) | $51,795 |
| Total | 6,809 (100.0%) | $58,193 |
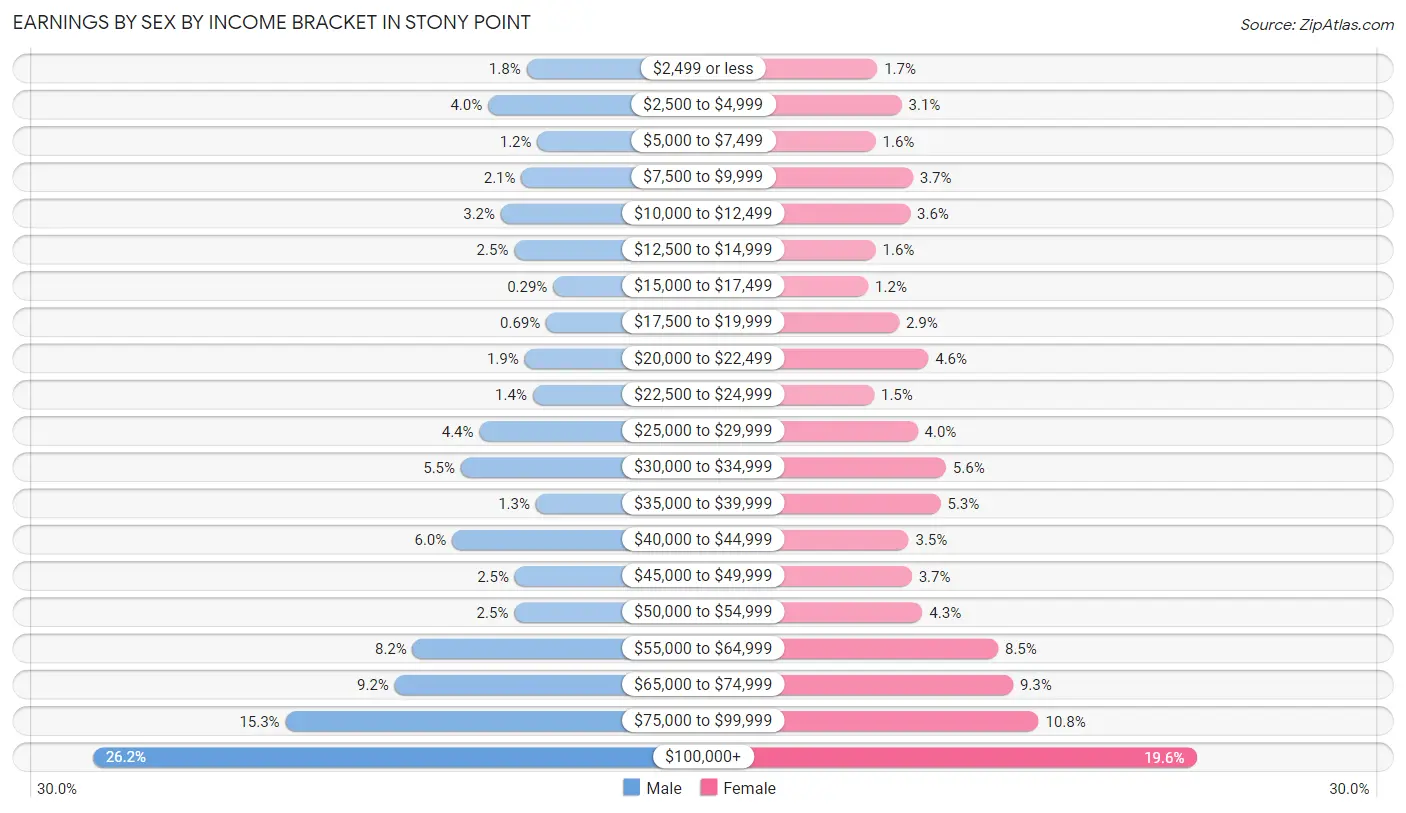
Earnings by Sex by Income Bracket in Stony Point
The most common earnings brackets in Stony Point are $100,000+ for men (908 | 26.2%) and $100,000+ for women (656 | 19.6%).
| Income | Male | Female |
| $2,499 or less | 62 (1.8%) | 57 (1.7%) |
| $2,500 to $4,999 | 137 (4.0%) | 103 (3.1%) |
| $5,000 to $7,499 | 41 (1.2%) | 54 (1.6%) |
| $7,500 to $9,999 | 72 (2.1%) | 124 (3.7%) |
| $10,000 to $12,499 | 112 (3.2%) | 119 (3.6%) |
| $12,500 to $14,999 | 86 (2.5%) | 54 (1.6%) |
| $15,000 to $17,499 | 10 (0.3%) | 40 (1.2%) |
| $17,500 to $19,999 | 24 (0.7%) | 98 (2.9%) |
| $20,000 to $22,499 | 66 (1.9%) | 153 (4.6%) |
| $22,500 to $24,999 | 50 (1.4%) | 51 (1.5%) |
| $25,000 to $29,999 | 154 (4.4%) | 133 (4.0%) |
| $30,000 to $34,999 | 190 (5.5%) | 186 (5.6%) |
| $35,000 to $39,999 | 44 (1.3%) | 176 (5.3%) |
| $40,000 to $44,999 | 207 (6.0%) | 116 (3.5%) |
| $45,000 to $49,999 | 85 (2.5%) | 122 (3.6%) |
| $50,000 to $54,999 | 86 (2.5%) | 142 (4.3%) |
| $55,000 to $64,999 | 284 (8.2%) | 284 (8.5%) |
| $65,000 to $74,999 | 319 (9.2%) | 312 (9.3%) |
| $75,000 to $99,999 | 532 (15.3%) | 360 (10.8%) |
| $100,000+ | 908 (26.2%) | 656 (19.6%) |
| Total | 3,469 (100.0%) | 3,340 (100.0%) |
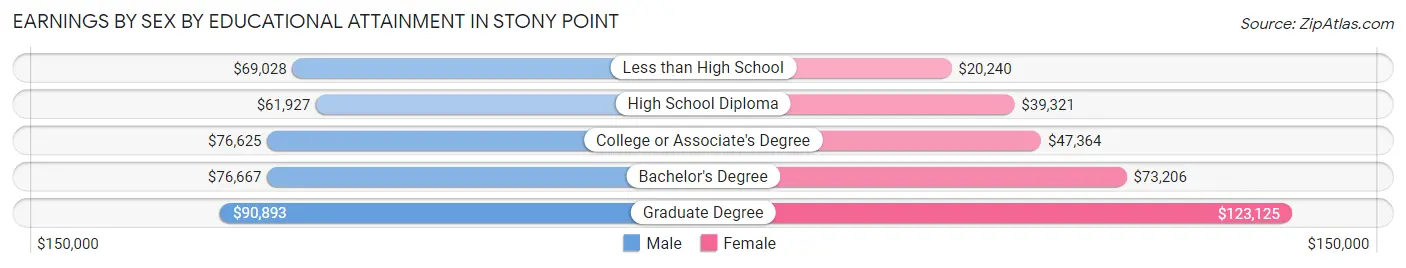
Earnings by Sex by Educational Attainment in Stony Point
Average earnings in Stony Point are $75,033 for men and $59,237 for women, a difference of 21.0%. Men with an educational attainment of graduate degree enjoy the highest average annual earnings of $90,893, while those with high school diploma education earn the least with $61,927. Women with an educational attainment of graduate degree earn the most with the average annual earnings of $123,125, while those with less than high school education have the smallest earnings of $20,240.
| Educational Attainment | Male Income | Female Income |
| Less than High School | $69,028 | $20,240 |
| High School Diploma | $61,927 | $39,321 |
| College or Associate's Degree | $76,625 | $47,364 |
| Bachelor's Degree | $76,667 | $73,206 |
| Graduate Degree | $90,893 | $123,125 |
| Total | $75,033 | $59,237 |
Family Income in Stony Point
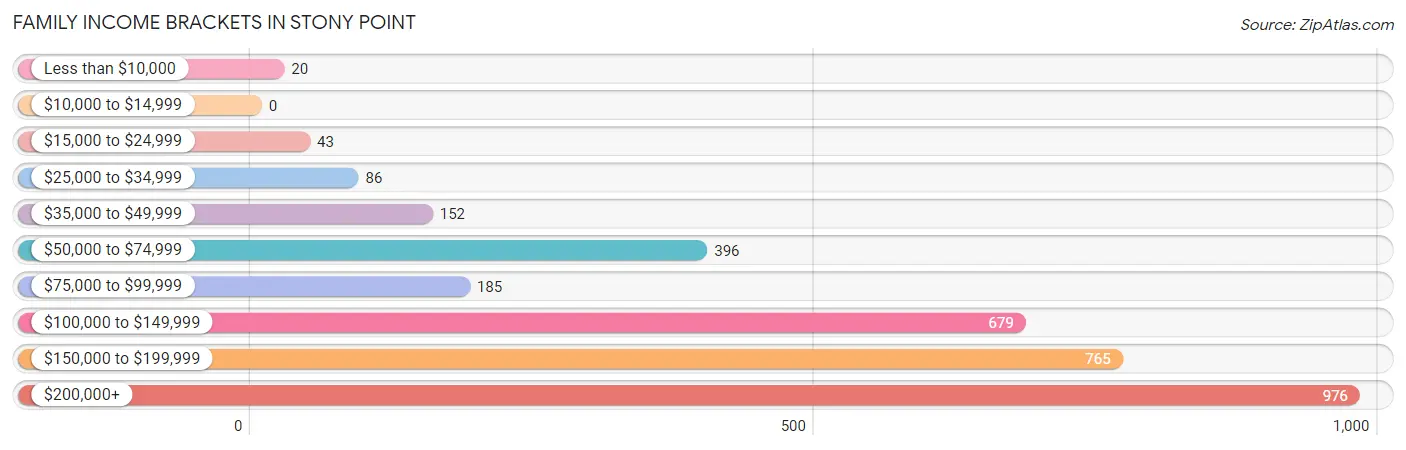
Family Income Brackets in Stony Point
According to the Stony Point family income data, there are 976 families falling into the $200,000+ income range, which is the most common income bracket and makes up 29.6% of all families.
| Income Bracket | # Families | % Families |
| Less than $10,000 | 20 | 0.6% |
| $10,000 to $14,999 | 0 | 0.0% |
| $15,000 to $24,999 | 43 | 1.3% |
| $25,000 to $34,999 | 86 | 2.6% |
| $35,000 to $49,999 | 152 | 4.6% |
| $50,000 to $74,999 | 396 | 12.0% |
| $75,000 to $99,999 | 185 | 5.6% |
| $100,000 to $149,999 | 679 | 20.6% |
| $150,000 to $199,999 | 765 | 23.2% |
| $200,000+ | 976 | 29.6% |
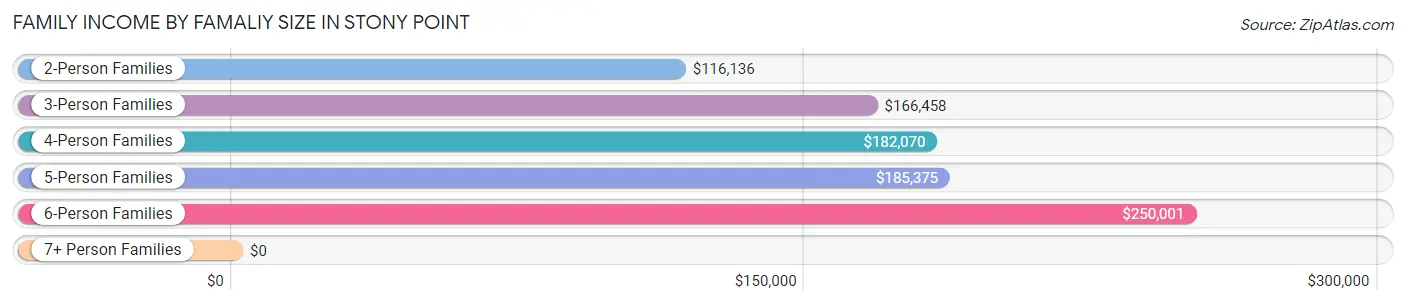
Family Income by Famaliy Size in Stony Point
6-person families (120 | 3.6%) account for the highest median family income in Stony Point with $250,001 per family, while 2-person families (1,308 | 39.7%) have the highest median income of $58,068 per family member.
| Income Bracket | # Families | Median Income |
| 2-Person Families | 1,308 (39.7%) | $116,136 |
| 3-Person Families | 640 (19.4%) | $166,458 |
| 4-Person Families | 777 (23.6%) | $182,070 |
| 5-Person Families | 441 (13.4%) | $185,375 |
| 6-Person Families | 120 (3.6%) | $250,001 |
| 7+ Person Families | 10 (0.3%) | $0 |
| Total | 3,296 (100.0%) | $157,842 |
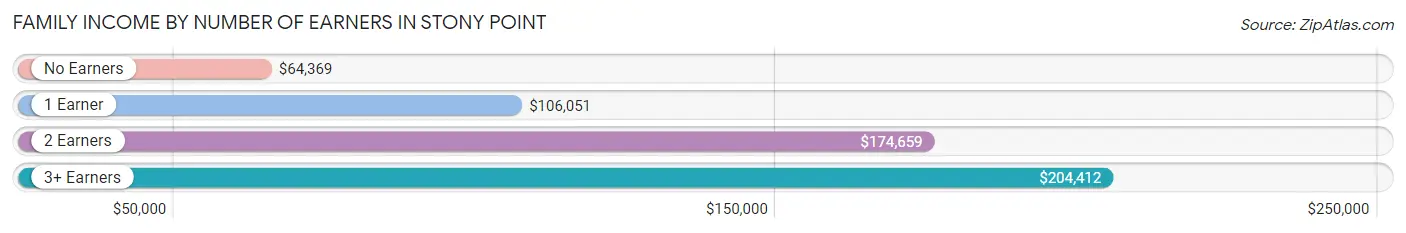
Family Income by Number of Earners in Stony Point
The median family income in Stony Point is $157,842, with families comprising 3+ earners (746) having the highest median family income of $204,412, while families with no earners (463) have the lowest median family income of $64,369, accounting for 22.6% and 14.1% of families, respectively.
| Number of Earners | # Families | Median Income |
| No Earners | 463 (14.1%) | $64,369 |
| 1 Earner | 767 (23.3%) | $106,051 |
| 2 Earners | 1,320 (40.1%) | $174,659 |
| 3+ Earners | 746 (22.6%) | $204,412 |
| Total | 3,296 (100.0%) | $157,842 |
Household Income in Stony Point
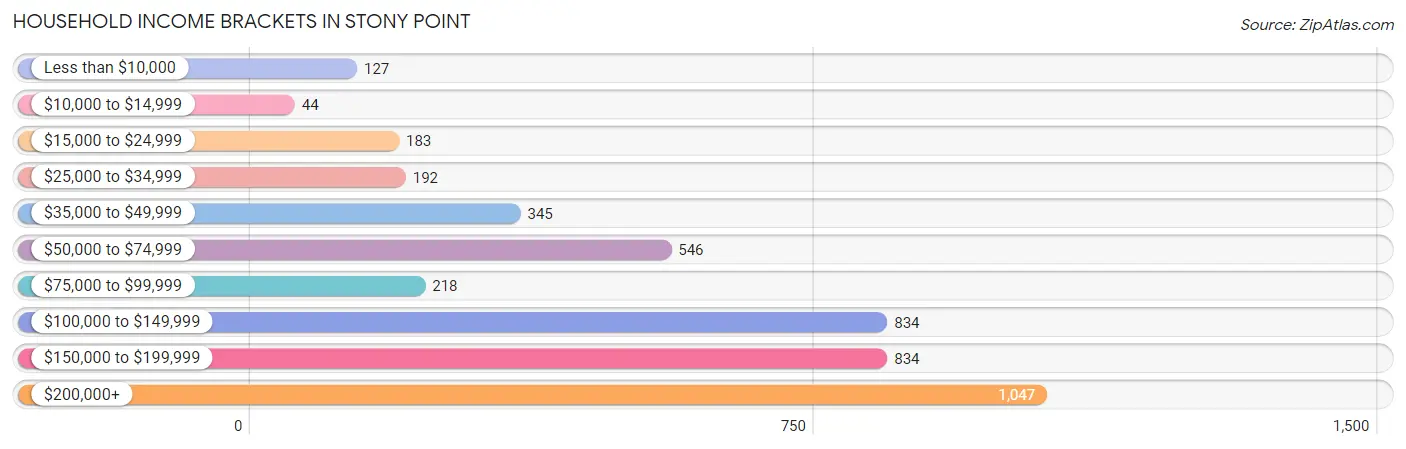
Household Income Brackets in Stony Point
With 1,047 households falling in the category, the $200,000+ income range is the most frequent in Stony Point, accounting for 24.0% of all households. In contrast, only 44 households (1.0%) fall into the $10,000 to $14,999 income bracket, making it the least populous group.
| Income Bracket | # Households | % Households |
| Less than $10,000 | 127 | 2.9% |
| $10,000 to $14,999 | 44 | 1.0% |
| $15,000 to $24,999 | 183 | 4.2% |
| $25,000 to $34,999 | 192 | 4.4% |
| $35,000 to $49,999 | 345 | 7.9% |
| $50,000 to $74,999 | 546 | 12.5% |
| $75,000 to $99,999 | 218 | 5.0% |
| $100,000 to $149,999 | 834 | 19.1% |
| $150,000 to $199,999 | 834 | 19.1% |
| $200,000+ | 1,047 | 24.0% |
Household Income by Householder Age in Stony Point
The median household income in Stony Point is $124,881, with the highest median household income of $177,115 found in the 25 to 44 years age bracket for the primary householder. A total of 888 households (20.3%) fall into this category.
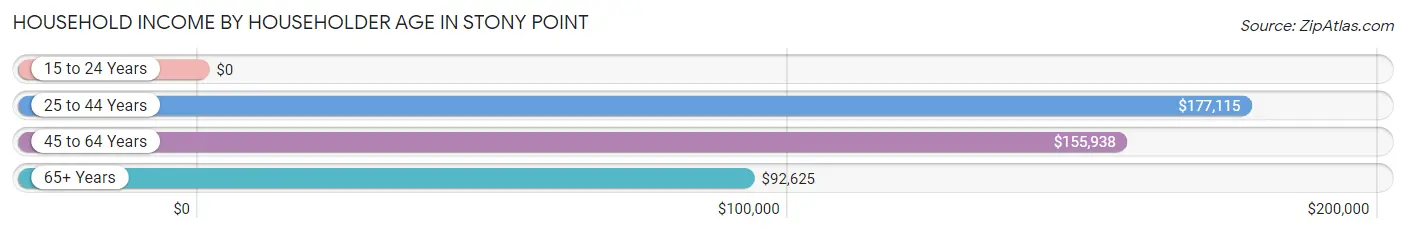
| Income Bracket | # Households | Median Income |
| 15 to 24 Years | 0 (0.0%) | $0 |
| 25 to 44 Years | 888 (20.3%) | $177,115 |
| 45 to 64 Years | 2,020 (46.3%) | $155,938 |
| 65+ Years | 1,456 (33.4%) | $92,625 |
| Total | 4,364 (100.0%) | $124,881 |
Poverty in Stony Point
Income Below Poverty by Sex and Age in Stony Point
With 2.3% poverty level for males and 3.9% for females among the residents of Stony Point, 12 to 14 year old males and under 5 year old females are the most vulnerable to poverty, with 43 males (15.9%) and 56 females (17.1%) in their respective age groups living below the poverty level.
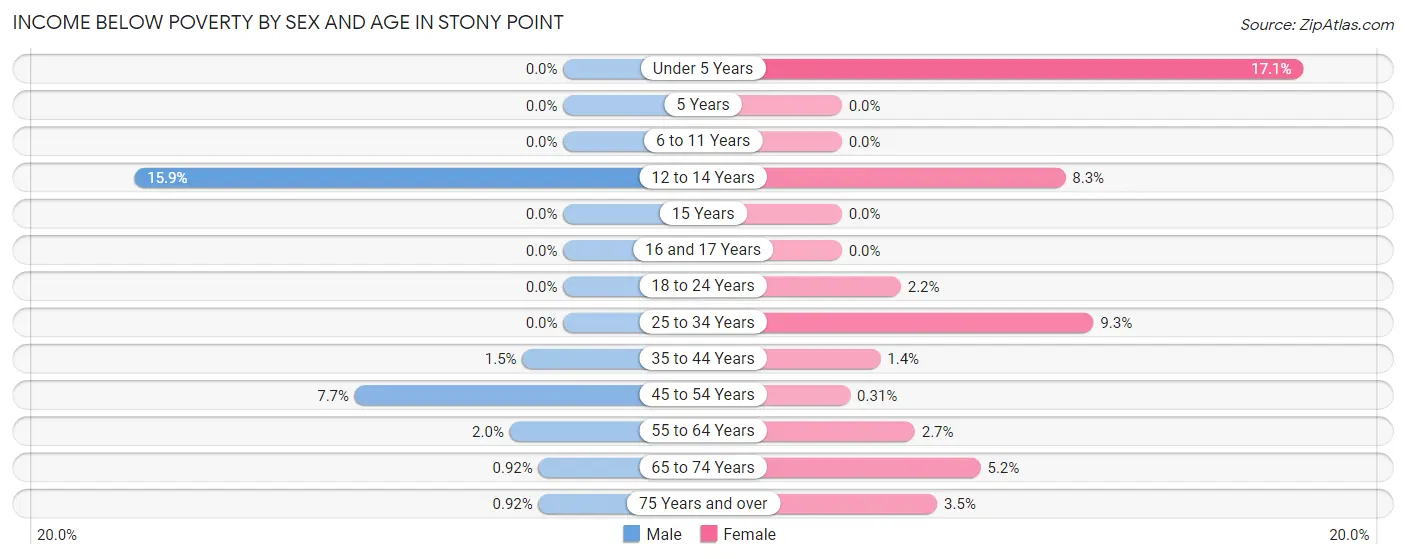
| Age Bracket | Male | Female |
| Under 5 Years | 0 (0.0%) | 56 (17.1%) |
| 5 Years | 0 (0.0%) | 0 (0.0%) |
| 6 to 11 Years | 0 (0.0%) | 0 (0.0%) |
| 12 to 14 Years | 43 (15.9%) | 23 (8.3%) |
| 15 Years | 0 (0.0%) | 0 (0.0%) |
| 16 and 17 Years | 0 (0.0%) | 0 (0.0%) |
| 18 to 24 Years | 0 (0.0%) | 8 (2.2%) |
| 25 to 34 Years | 0 (0.0%) | 55 (9.3%) |
| 35 to 44 Years | 10 (1.5%) | 9 (1.4%) |
| 45 to 54 Years | 62 (7.7%) | 3 (0.3%) |
| 55 to 64 Years | 21 (2.0%) | 29 (2.7%) |
| 65 to 74 Years | 5 (0.9%) | 28 (5.1%) |
| 75 Years and over | 5 (0.9%) | 29 (3.5%) |
| Total | 146 (2.3%) | 240 (3.9%) |
Income Above Poverty by Sex and Age in Stony Point
According to the poverty statistics in Stony Point, males aged under 5 years and females aged 5 years are the age groups that are most secure financially, with 100.0% of males and 100.0% of females in these age groups living above the poverty line.
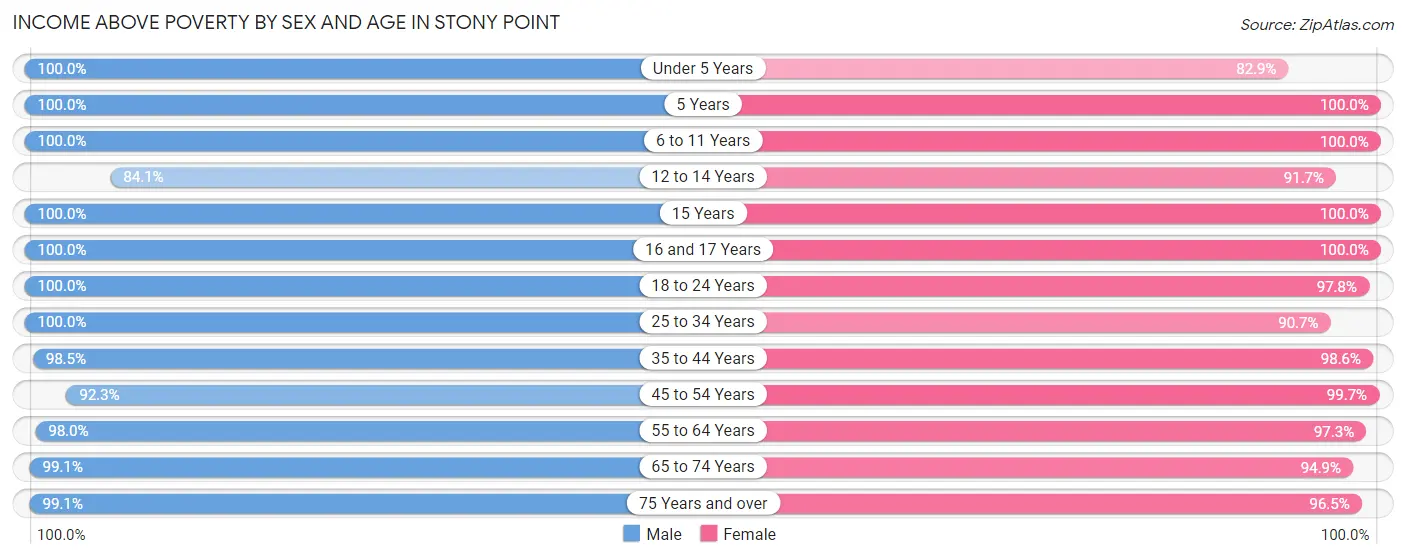
| Age Bracket | Male | Female |
| Under 5 Years | 331 (100.0%) | 271 (82.9%) |
| 5 Years | 86 (100.0%) | 64 (100.0%) |
| 6 to 11 Years | 451 (100.0%) | 278 (100.0%) |
| 12 to 14 Years | 227 (84.1%) | 254 (91.7%) |
| 15 Years | 25 (100.0%) | 82 (100.0%) |
| 16 and 17 Years | 266 (100.0%) | 130 (100.0%) |
| 18 to 24 Years | 717 (100.0%) | 357 (97.8%) |
| 25 to 34 Years | 635 (100.0%) | 534 (90.7%) |
| 35 to 44 Years | 650 (98.5%) | 622 (98.6%) |
| 45 to 54 Years | 739 (92.3%) | 972 (99.7%) |
| 55 to 64 Years | 1,033 (98.0%) | 1,042 (97.3%) |
| 65 to 74 Years | 539 (99.1%) | 516 (94.9%) |
| 75 Years and over | 536 (99.1%) | 790 (96.5%) |
| Total | 6,235 (97.7%) | 5,912 (96.1%) |
Income Below Poverty Among Married-Couple Families in Stony Point
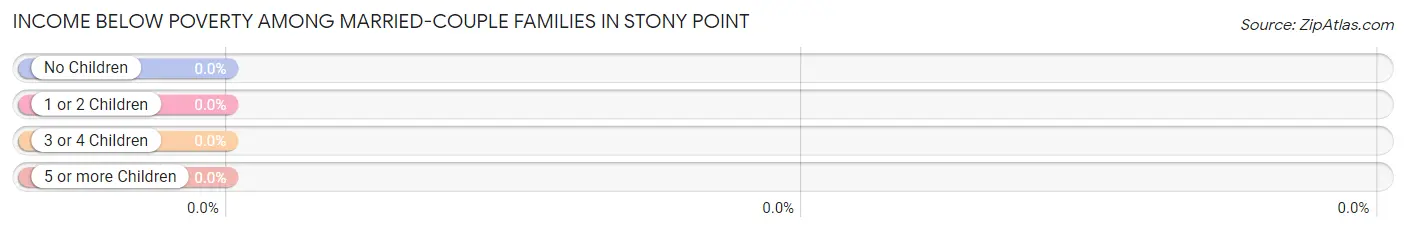
| Children | Above Poverty | Below Poverty |
| No Children | 1,547 (100.0%) | 0 (0.0%) |
| 1 or 2 Children | 813 (100.0%) | 0 (0.0%) |
| 3 or 4 Children | 233 (100.0%) | 0 (0.0%) |
| 5 or more Children | 10 (100.0%) | 0 (0.0%) |
| Total | 2,603 (100.0%) | 0 (0.0%) |
Income Below Poverty Among Single-Parent Households in Stony Point
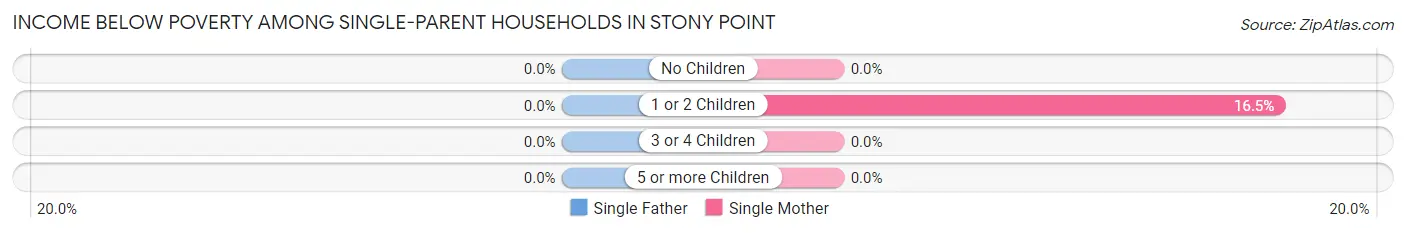
| Children | Single Father | Single Mother |
| No Children | 0 (0.0%) | 0 (0.0%) |
| 1 or 2 Children | 0 (0.0%) | 45 (16.5%) |
| 3 or 4 Children | 0 (0.0%) | 0 (0.0%) |
| 5 or more Children | 0 (0.0%) | 0 (0.0%) |
| Total | 0 (0.0%) | 45 (7.4%) |
Income Below Poverty Among Married-Couple vs Single-Parent Households in Stony Point
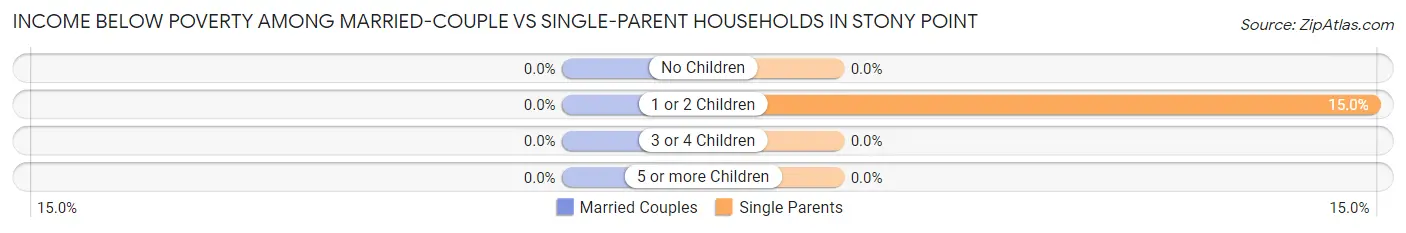
| Children | Married-Couple Families | Single-Parent Households |
| No Children | 0 (0.0%) | 0 (0.0%) |
| 1 or 2 Children | 0 (0.0%) | 45 (15.0%) |
| 3 or 4 Children | 0 (0.0%) | 0 (0.0%) |
| 5 or more Children | 0 (0.0%) | 0 (0.0%) |
| Total | 0 (0.0%) | 45 (6.5%) |
Race in Stony Point
The most populous races in Stony Point are White / Caucasian (9,397 | 75.0%), Hispanic or Latino (2,626 | 20.9%), and Black / African American (1,450 | 11.6%).
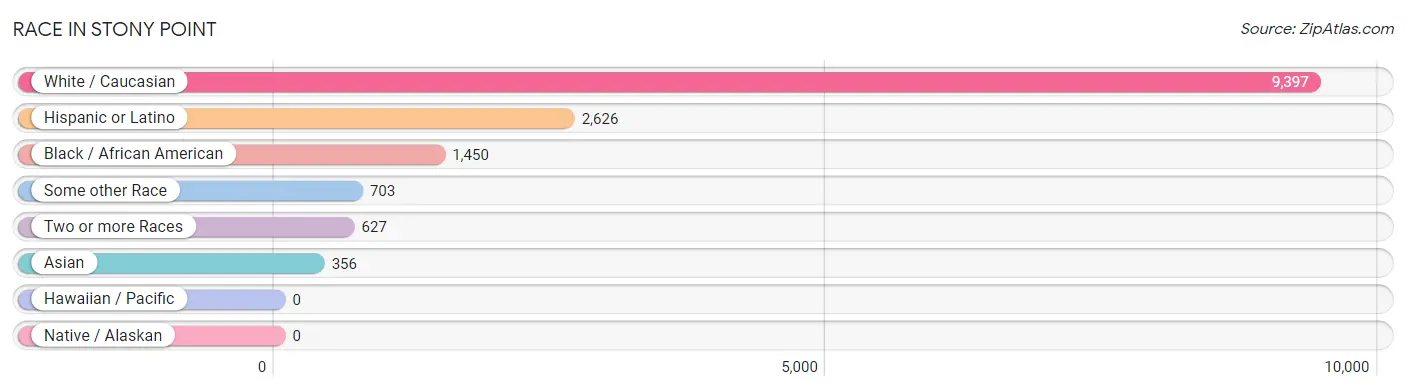
| Race | # Population | % Population |
| Asian | 356 | 2.8% |
| Black / African American | 1,450 | 11.6% |
| Hawaiian / Pacific | 0 | 0.0% |
| Hispanic or Latino | 2,626 | 20.9% |
| Native / Alaskan | 0 | 0.0% |
| White / Caucasian | 9,397 | 75.0% |
| Two or more Races | 627 | 5.0% |
| Some other Race | 703 | 5.6% |
| Total | 12,533 | 100.0% |
Ancestry in Stony Point
The most populous ancestries reported in Stony Point are Italian (2,916 | 23.3%), Irish (2,664 | 21.3%), German (1,680 | 13.4%), Puerto Rican (1,158 | 9.2%), and Dominican (639 | 5.1%), together accounting for 72.3% of all Stony Point residents.
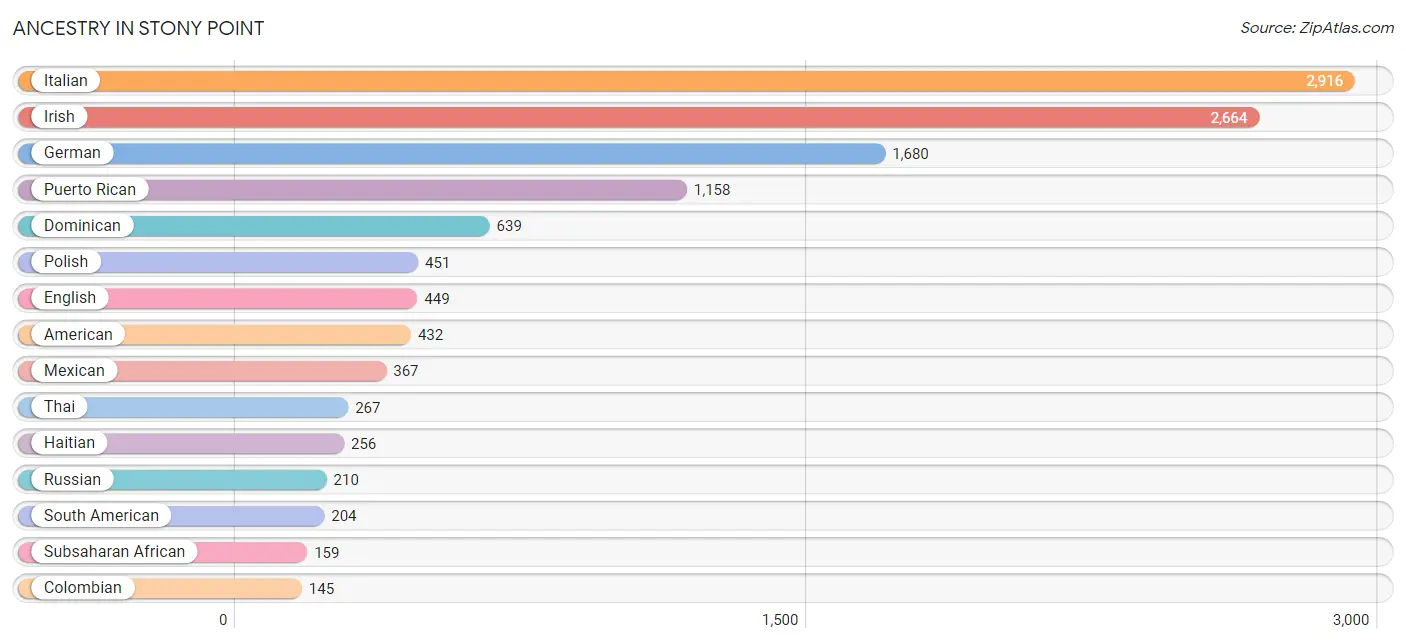
| Ancestry | # Population | % Population |
| American | 432 | 3.5% |
| Arab | 51 | 0.4% |
| Australian | 39 | 0.3% |
| Austrian | 88 | 0.7% |
| Belgian | 18 | 0.1% |
| Bhutanese | 9 | 0.1% |
| Blackfeet | 47 | 0.4% |
| Bolivian | 1 | 0.0% |
| British | 46 | 0.4% |
| Burmese | 22 | 0.2% |
| Canadian | 81 | 0.6% |
| Central American | 70 | 0.6% |
| Colombian | 145 | 1.2% |
| Cuban | 74 | 0.6% |
| Czech | 96 | 0.8% |
| Czechoslovakian | 8 | 0.1% |
| Danish | 20 | 0.2% |
| Dominican | 639 | 5.1% |
| Dutch | 113 | 0.9% |
| Eastern European | 40 | 0.3% |
| Ecuadorian | 54 | 0.4% |
| English | 449 | 3.6% |
| European | 51 | 0.4% |
| French | 108 | 0.9% |
| French Canadian | 8 | 0.1% |
| German | 1,680 | 13.4% |
| Ghanaian | 82 | 0.6% |
| Greek | 101 | 0.8% |
| Guatemalan | 32 | 0.3% |
| Haitian | 256 | 2.0% |
| Hungarian | 74 | 0.6% |
| Indian (Asian) | 33 | 0.3% |
| Irish | 2,664 | 21.3% |
| Israeli | 12 | 0.1% |
| Italian | 2,916 | 23.3% |
| Jamaican | 85 | 0.7% |
| Lebanese | 29 | 0.2% |
| Lithuanian | 17 | 0.1% |
| Mexican | 367 | 2.9% |
| Nicaraguan | 11 | 0.1% |
| Northern European | 9 | 0.1% |
| Norwegian | 23 | 0.2% |
| Peruvian | 4 | 0.0% |
| Polish | 451 | 3.6% |
| Portuguese | 58 | 0.5% |
| Puerto Rican | 1,158 | 9.2% |
| Russian | 210 | 1.7% |
| Salvadoran | 27 | 0.2% |
| Scandinavian | 16 | 0.1% |
| Scotch-Irish | 12 | 0.1% |
| Scottish | 46 | 0.4% |
| Seminole | 5 | 0.0% |
| Slovak | 18 | 0.1% |
| South American | 204 | 1.6% |
| Spaniard | 18 | 0.1% |
| Subsaharan African | 159 | 1.3% |
| Swedish | 56 | 0.4% |
| Syrian | 13 | 0.1% |
| Thai | 267 | 2.1% |
| Ukrainian | 50 | 0.4% |
| Welsh | 44 | 0.4% | View All 61 Rows |
Immigrants in Stony Point
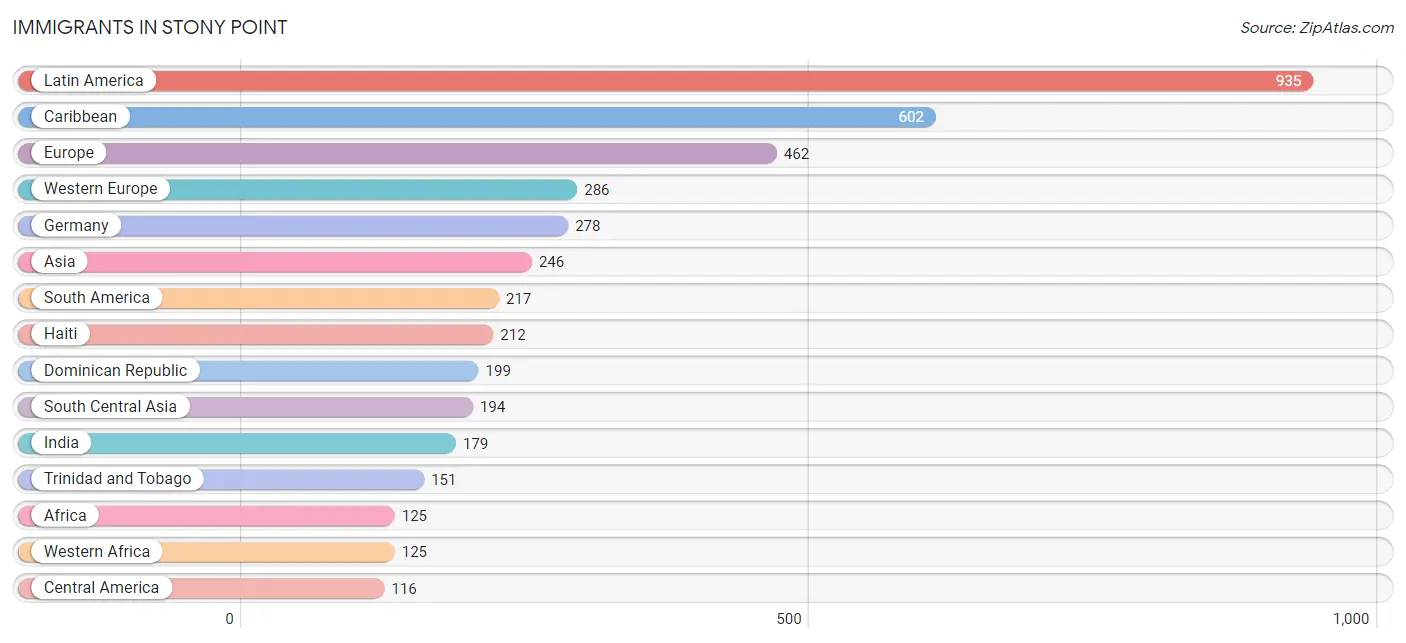
The most numerous immigrant groups reported in Stony Point came from Latin America (935 | 7.5%), Caribbean (602 | 4.8%), Europe (462 | 3.7%), Western Europe (286 | 2.3%), and Germany (278 | 2.2%), together accounting for 20.5% of all Stony Point residents.
| Immigration Origin | # Population | % Population |
| Africa | 125 | 1.0% |
| Asia | 246 | 2.0% |
| Australia | 39 | 0.3% |
| Belgium | 8 | 0.1% |
| Bolivia | 1 | 0.0% |
| Caribbean | 602 | 4.8% |
| Central America | 116 | 0.9% |
| China | 19 | 0.2% |
| Colombia | 101 | 0.8% |
| Czechoslovakia | 5 | 0.0% |
| Dominican Republic | 199 | 1.6% |
| Eastern Asia | 52 | 0.4% |
| Eastern Europe | 37 | 0.3% |
| Ecuador | 54 | 0.4% |
| Europe | 462 | 3.7% |
| Germany | 278 | 2.2% |
| Ghana | 82 | 0.6% |
| Guyana | 26 | 0.2% |
| Haiti | 212 | 1.7% |
| India | 179 | 1.4% |
| Ireland | 25 | 0.2% |
| Italy | 81 | 0.6% |
| Jamaica | 40 | 0.3% |
| Korea | 33 | 0.3% |
| Latin America | 935 | 7.5% |
| Mexico | 105 | 0.8% |
| Nicaragua | 11 | 0.1% |
| Northern Europe | 57 | 0.4% |
| Oceania | 39 | 0.3% |
| Pakistan | 15 | 0.1% |
| Peru | 4 | 0.0% |
| Poland | 32 | 0.3% |
| South America | 217 | 1.7% |
| South Central Asia | 194 | 1.5% |
| Southern Europe | 82 | 0.6% |
| Spain | 1 | 0.0% |
| Trinidad and Tobago | 151 | 1.2% |
| Uruguay | 31 | 0.3% |
| Western Africa | 125 | 1.0% |
| Western Europe | 286 | 2.3% | View All 40 Rows |
Sex and Age in Stony Point
Sex and Age in Stony Point
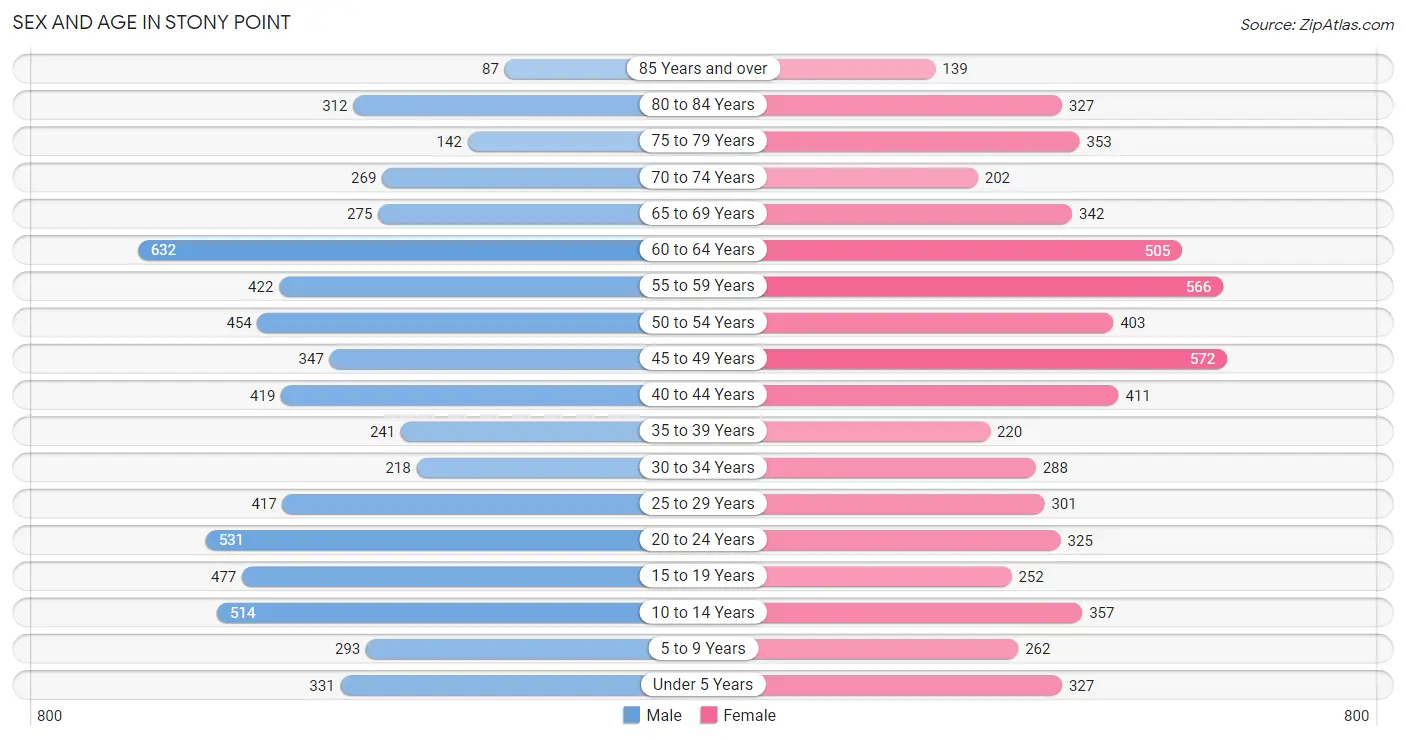
The most populous age groups in Stony Point are 60 to 64 Years (632 | 9.9%) for men and 45 to 49 Years (572 | 9.3%) for women.
| Age Bracket | Male | Female |
| Under 5 Years | 331 (5.2%) | 327 (5.3%) |
| 5 to 9 Years | 293 (4.6%) | 262 (4.3%) |
| 10 to 14 Years | 514 (8.1%) | 357 (5.8%) |
| 15 to 19 Years | 477 (7.5%) | 252 (4.1%) |
| 20 to 24 Years | 531 (8.3%) | 325 (5.3%) |
| 25 to 29 Years | 417 (6.5%) | 301 (4.9%) |
| 30 to 34 Years | 218 (3.4%) | 288 (4.7%) |
| 35 to 39 Years | 241 (3.8%) | 220 (3.6%) |
| 40 to 44 Years | 419 (6.6%) | 411 (6.7%) |
| 45 to 49 Years | 347 (5.4%) | 572 (9.3%) |
| 50 to 54 Years | 454 (7.1%) | 403 (6.6%) |
| 55 to 59 Years | 422 (6.6%) | 566 (9.2%) |
| 60 to 64 Years | 632 (9.9%) | 505 (8.2%) |
| 65 to 69 Years | 275 (4.3%) | 342 (5.6%) |
| 70 to 74 Years | 269 (4.2%) | 202 (3.3%) |
| 75 to 79 Years | 142 (2.2%) | 353 (5.7%) |
| 80 to 84 Years | 312 (4.9%) | 327 (5.3%) |
| 85 Years and over | 87 (1.4%) | 139 (2.3%) |
| Total | 6,381 (100.0%) | 6,152 (100.0%) |
Families and Households in Stony Point
Median Family Size in Stony Point
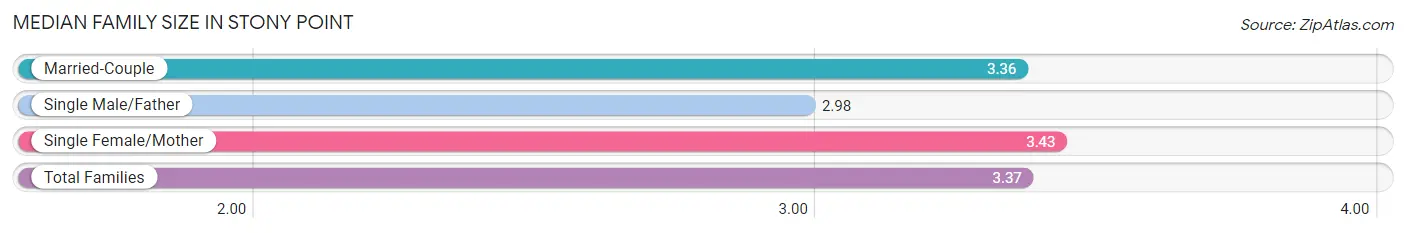
The median family size in Stony Point is 3.37 persons per family, with single female/mother families (607 | 18.4%) accounting for the largest median family size of 3.43 persons per family. On the other hand, single male/father families (86 | 2.6%) represent the smallest median family size with 2.98 persons per family.
| Family Type | # Families | Family Size |
| Married-Couple | 2,603 (79.0%) | 3.36 |
| Single Male/Father | 86 (2.6%) | 2.98 |
| Single Female/Mother | 607 (18.4%) | 3.43 |
| Total Families | 3,296 (100.0%) | 3.37 |
Median Household Size in Stony Point
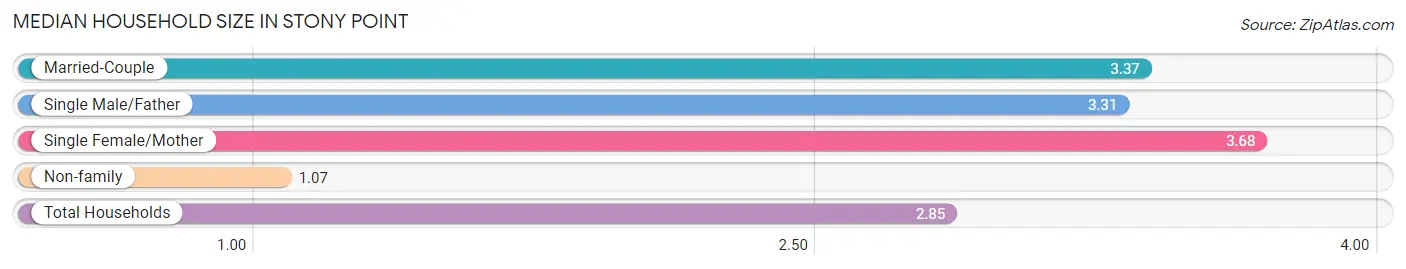
The median household size in Stony Point is 2.85 persons per household, with single female/mother households (607 | 13.9%) accounting for the largest median household size of 3.68 persons per household. non-family households (1,068 | 24.5%) represent the smallest median household size with 1.07 persons per household.
| Household Type | # Households | Household Size |
| Married-Couple | 2,603 (59.7%) | 3.37 |
| Single Male/Father | 86 (2.0%) | 3.31 |
| Single Female/Mother | 607 (13.9%) | 3.68 |
| Non-family | 1,068 (24.5%) | 1.07 |
| Total Households | 4,364 (100.0%) | 2.85 |
Household Size by Marriage Status in Stony Point
Out of a total of 4,364 households in Stony Point, 3,296 (75.5%) are family households, while 1,068 (24.5%) are nonfamily households. The most numerous type of family households are 2-person households, comprising 1,260, and the most common type of nonfamily households are 1-person households, comprising 998.
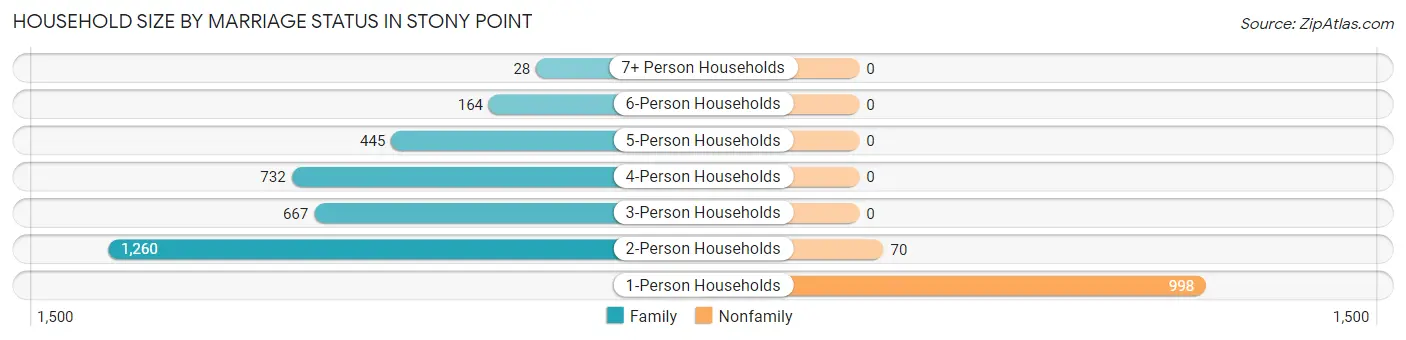
| Household Size | Family Households | Nonfamily Households |
| 1-Person Households | - | 998 (22.9%) |
| 2-Person Households | 1,260 (28.9%) | 70 (1.6%) |
| 3-Person Households | 667 (15.3%) | 0 (0.0%) |
| 4-Person Households | 732 (16.8%) | 0 (0.0%) |
| 5-Person Households | 445 (10.2%) | 0 (0.0%) |
| 6-Person Households | 164 (3.8%) | 0 (0.0%) |
| 7+ Person Households | 28 (0.6%) | 0 (0.0%) |
| Total | 3,296 (75.5%) | 1,068 (24.5%) |
Female Fertility in Stony Point
Fertility by Age in Stony Point
Average fertility rate in Stony Point is 53.0 births per 1,000 women. Women in the age bracket of 20 to 34 years have the highest fertility rate with 101.0 births per 1,000 women. Women in the age bracket of 20 to 34 years acount for 69.7% of all women with births.
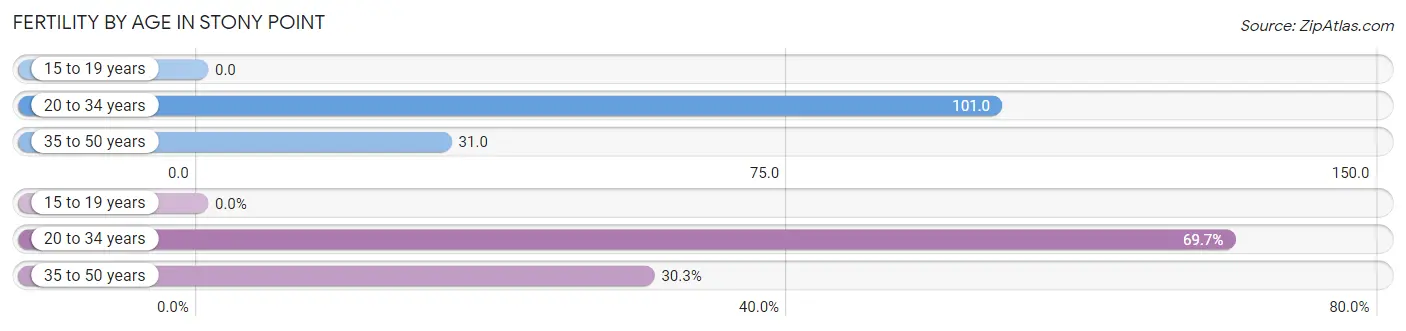
| Age Bracket | Women with Births | Births / 1,000 Women |
| 15 to 19 years | 0 (0.0%) | 0.0 |
| 20 to 34 years | 92 (69.7%) | 101.0 |
| 35 to 50 years | 40 (30.3%) | 31.0 |
| Total | 132 (100.0%) | 53.0 |
Fertility by Age by Marriage Status in Stony Point
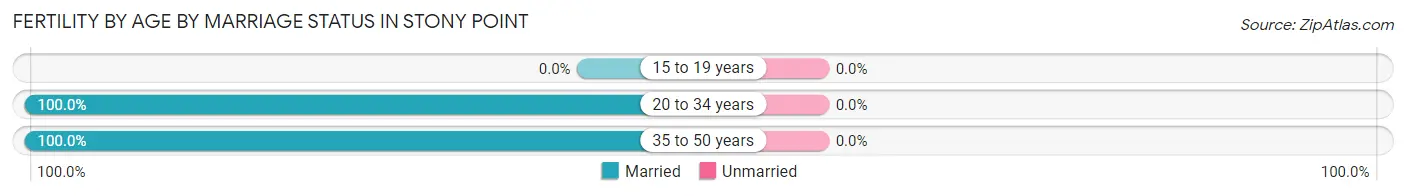
| Age Bracket | Married | Unmarried |
| 15 to 19 years | 0 (0.0%) | 0 (0.0%) |
| 20 to 34 years | 92 (100.0%) | 0 (0.0%) |
| 35 to 50 years | 40 (100.0%) | 0 (0.0%) |
| Total | 132 (100.0%) | 0 (0.0%) |
Fertility by Education in Stony Point
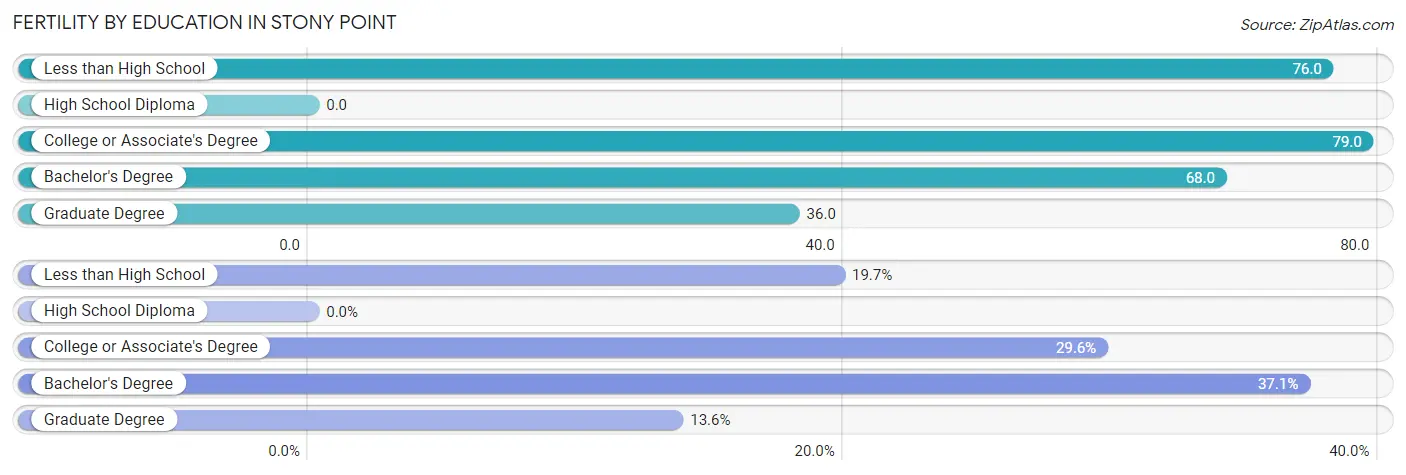
| Educational Attainment | Women with Births | Births / 1,000 Women |
| Less than High School | 26 (19.7%) | 76.0 |
| High School Diploma | 0 (0.0%) | 0.0 |
| College or Associate's Degree | 39 (29.5%) | 79.0 |
| Bachelor's Degree | 49 (37.1%) | 68.0 |
| Graduate Degree | 18 (13.6%) | 36.0 |
| Total | 132 (100.0%) | 53.0 |
Fertility by Education by Marriage Status in Stony Point
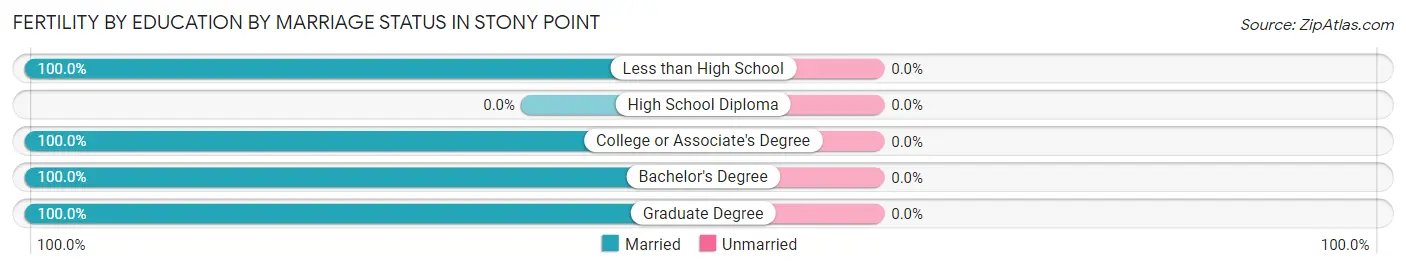
| Educational Attainment | Married | Unmarried |
| Less than High School | 26 (100.0%) | 0 (0.0%) |
| High School Diploma | 0 (0.0%) | 0 (0.0%) |
| College or Associate's Degree | 39 (100.0%) | 0 (0.0%) |
| Bachelor's Degree | 49 (100.0%) | 0 (0.0%) |
| Graduate Degree | 18 (100.0%) | 0 (0.0%) |
| Total | 132 (100.0%) | 0 (0.0%) |
Employment Characteristics in Stony Point
Employment by Class of Employer in Stony Point
Among the 5,910 employed individuals in Stony Point, private company employees (3,573 | 60.5%), local government employees (1,061 | 17.9%), and not-for-profit organizations (469 | 7.9%) make up the most common classes of employment.
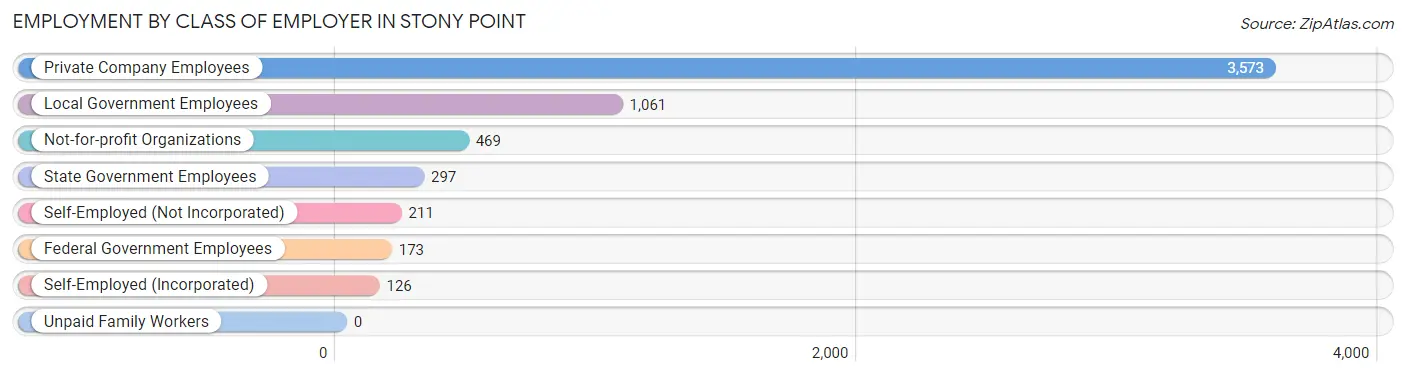
| Employer Class | # Employees | % Employees |
| Private Company Employees | 3,573 | 60.5% |
| Self-Employed (Incorporated) | 126 | 2.1% |
| Self-Employed (Not Incorporated) | 211 | 3.6% |
| Not-for-profit Organizations | 469 | 7.9% |
| Local Government Employees | 1,061 | 17.9% |
| State Government Employees | 297 | 5.0% |
| Federal Government Employees | 173 | 2.9% |
| Unpaid Family Workers | 0 | 0.0% |
| Total | 5,910 | 100.0% |
Employment Status by Age in Stony Point
According to the labor force statistics for Stony Point, out of the total population over 16 years of age (10,342), 63.7% or 6,588 individuals are in the labor force, with 6.2% or 408 of them unemployed. The age group with the highest labor force participation rate is 35 to 44 years, with 91.2% or 1,177 individuals in the labor force. Within the labor force, the 16 to 19 years age range has the highest percentage of unemployed individuals, with 13.6% or 27 of them being unemployed.
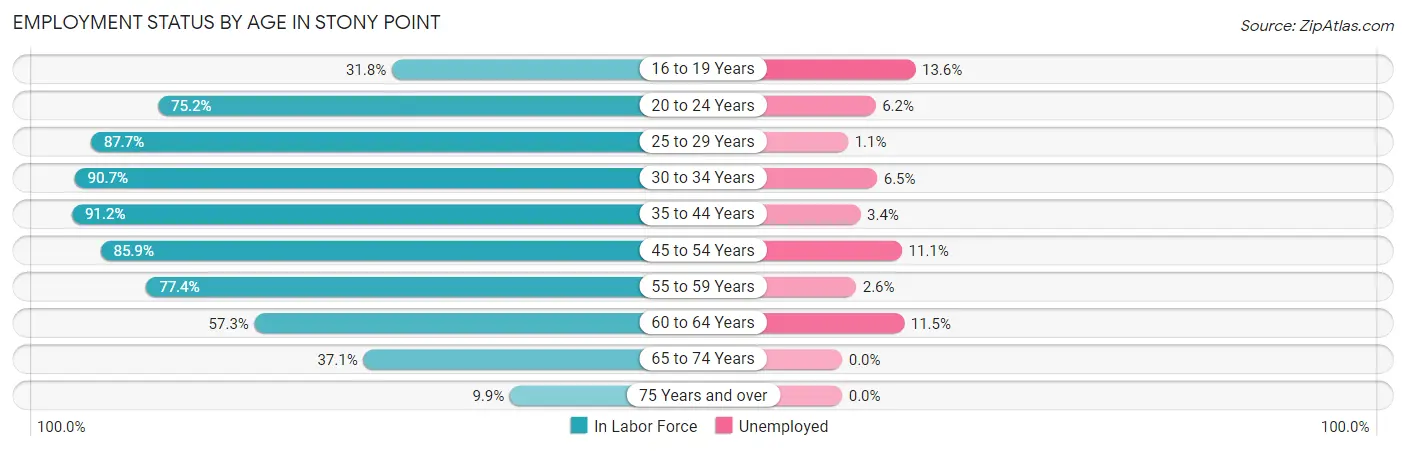
| Age Bracket | In Labor Force | Unemployed |
| 16 to 19 Years | 198 (31.8%) | 27 (13.6%) |
| 20 to 24 Years | 644 (75.2%) | 40 (6.2%) |
| 25 to 29 Years | 630 (87.7%) | 7 (1.1%) |
| 30 to 34 Years | 459 (90.7%) | 30 (6.5%) |
| 35 to 44 Years | 1,177 (91.2%) | 40 (3.4%) |
| 45 to 54 Years | 1,526 (85.9%) | 169 (11.1%) |
| 55 to 59 Years | 765 (77.4%) | 20 (2.6%) |
| 60 to 64 Years | 652 (57.3%) | 75 (11.5%) |
| 65 to 74 Years | 404 (37.1%) | 0 (0.0%) |
| 75 Years and over | 135 (9.9%) | 0 (0.0%) |
| Total | 6,588 (63.7%) | 408 (6.2%) |
Employment Status by Educational Attainment in Stony Point
According to labor force statistics for Stony Point, 81.2% of individuals (5,210) out of the total population between 25 and 64 years of age (6,416) are in the labor force, with 6.6% or 344 of them being unemployed. The group with the highest labor force participation rate are those with the educational attainment of bachelor's degree or higher, with 88.7% or 2,327 individuals in the labor force. Within the labor force, individuals with less than high school education have the highest percentage of unemployment, with 12.8% or 31 of them being unemployed.
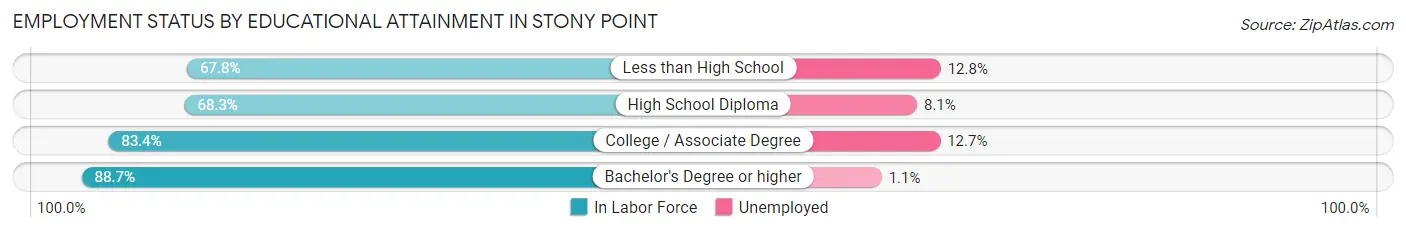
| Educational Attainment | In Labor Force | Unemployed |
| Less than High School | 242 (67.8%) | 46 (12.8%) |
| High School Diploma | 1,018 (68.3%) | 121 (8.1%) |
| College / Associate Degree | 1,621 (83.4%) | 247 (12.7%) |
| Bachelor's Degree or higher | 2,327 (88.7%) | 29 (1.1%) |
| Total | 5,210 (81.2%) | 423 (6.6%) |
Employment Occupations by Sex in Stony Point
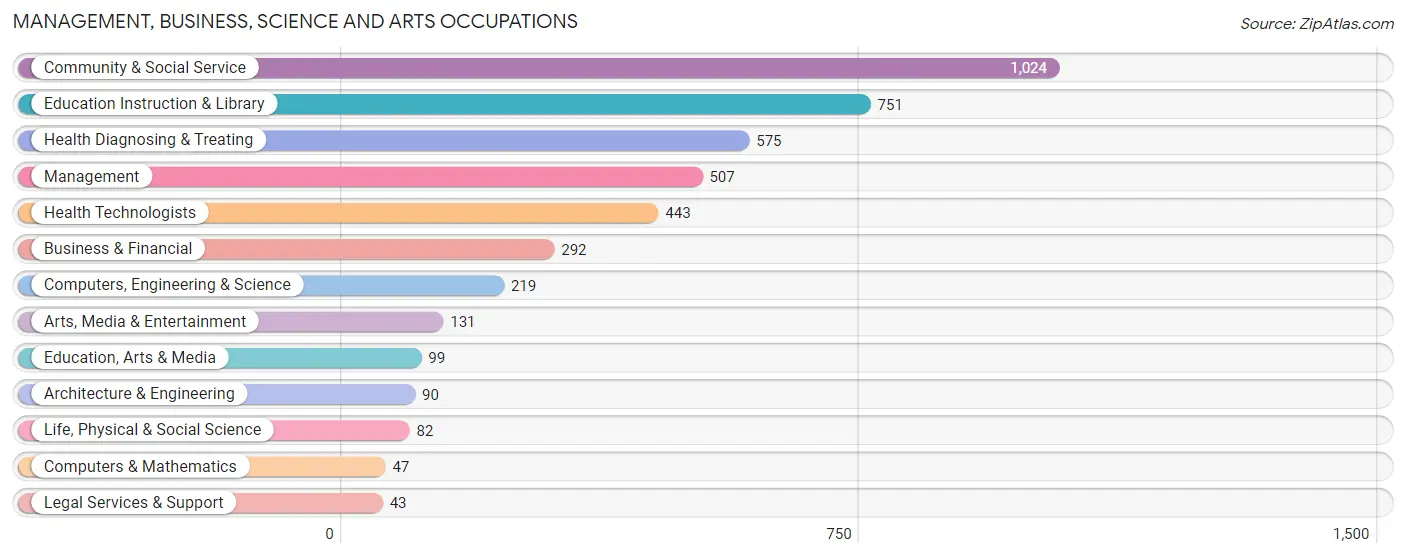
Management, Business, Science and Arts Occupations
The most common Management, Business, Science and Arts occupations in Stony Point are Community & Social Service (1,024 | 16.6%), Education Instruction & Library (751 | 12.2%), Health Diagnosing & Treating (575 | 9.3%), Management (507 | 8.2%), and Health Technologists (443 | 7.2%).
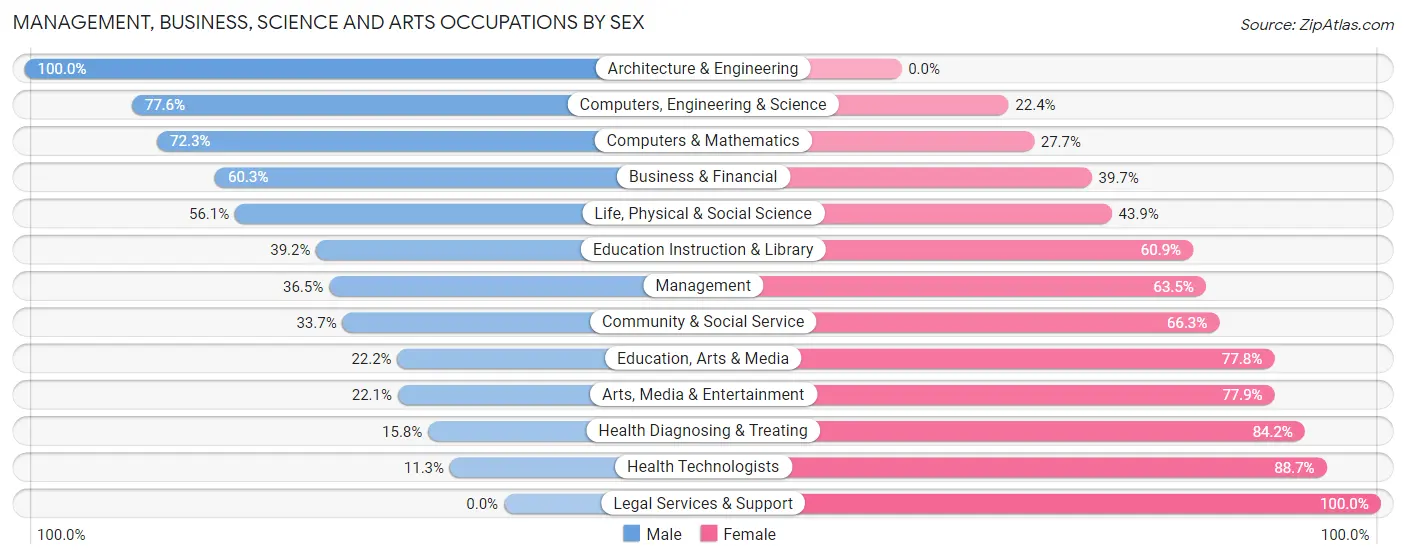
Management, Business, Science and Arts Occupations by Sex
Within the Management, Business, Science and Arts occupations in Stony Point, the most male-oriented occupations are Architecture & Engineering (100.0%), Computers, Engineering & Science (77.6%), and Computers & Mathematics (72.3%), while the most female-oriented occupations are Legal Services & Support (100.0%), Health Technologists (88.7%), and Health Diagnosing & Treating (84.2%).
| Occupation | Male | Female |
| Management | 185 (36.5%) | 322 (63.5%) |
| Business & Financial | 176 (60.3%) | 116 (39.7%) |
| Computers, Engineering & Science | 170 (77.6%) | 49 (22.4%) |
| Computers & Mathematics | 34 (72.3%) | 13 (27.7%) |
| Architecture & Engineering | 90 (100.0%) | 0 (0.0%) |
| Life, Physical & Social Science | 46 (56.1%) | 36 (43.9%) |
| Community & Social Service | 345 (33.7%) | 679 (66.3%) |
| Education, Arts & Media | 22 (22.2%) | 77 (77.8%) |
| Legal Services & Support | 0 (0.0%) | 43 (100.0%) |
| Education Instruction & Library | 294 (39.2%) | 457 (60.9%) |
| Arts, Media & Entertainment | 29 (22.1%) | 102 (77.9%) |
| Health Diagnosing & Treating | 91 (15.8%) | 484 (84.2%) |
| Health Technologists | 50 (11.3%) | 393 (88.7%) |
| Total (Category) | 967 (36.9%) | 1,650 (63.0%) |
| Total (Overall) | 3,006 (48.8%) | 3,159 (51.2%) |
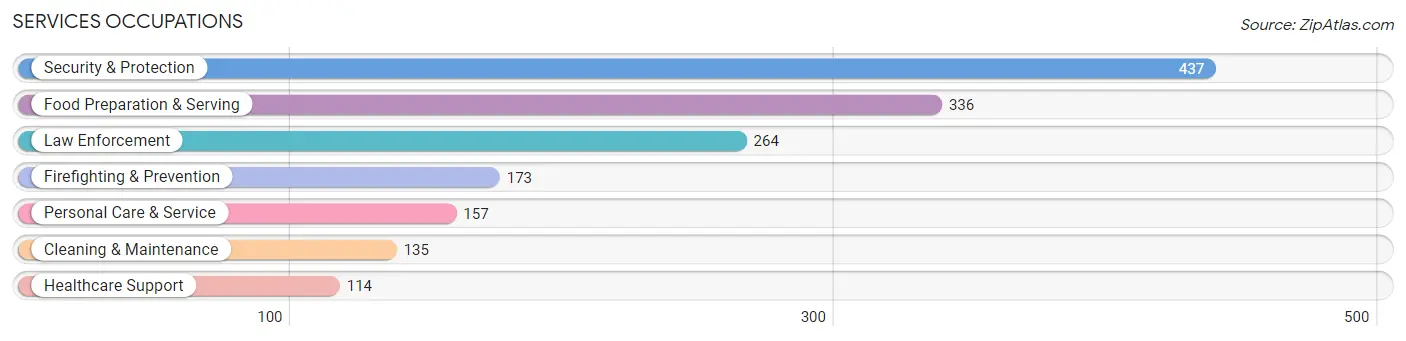
Services Occupations
The most common Services occupations in Stony Point are Security & Protection (437 | 7.1%), Food Preparation & Serving (336 | 5.4%), Law Enforcement (264 | 4.3%), Firefighting & Prevention (173 | 2.8%), and Personal Care & Service (157 | 2.5%).
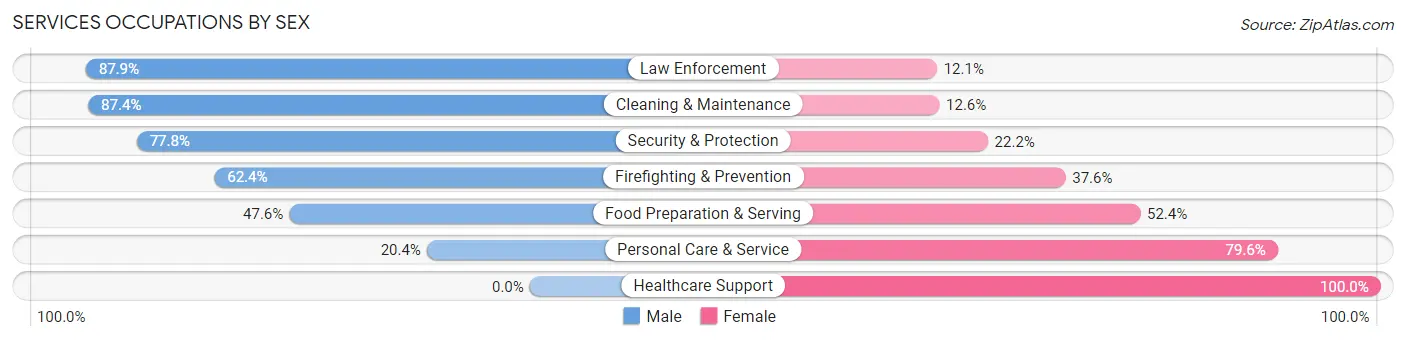
Services Occupations by Sex
Within the Services occupations in Stony Point, the most male-oriented occupations are Law Enforcement (87.9%), Cleaning & Maintenance (87.4%), and Security & Protection (77.8%), while the most female-oriented occupations are Healthcare Support (100.0%), Personal Care & Service (79.6%), and Food Preparation & Serving (52.4%).
| Occupation | Male | Female |
| Healthcare Support | 0 (0.0%) | 114 (100.0%) |
| Security & Protection | 340 (77.8%) | 97 (22.2%) |
| Firefighting & Prevention | 108 (62.4%) | 65 (37.6%) |
| Law Enforcement | 232 (87.9%) | 32 (12.1%) |
| Food Preparation & Serving | 160 (47.6%) | 176 (52.4%) |
| Cleaning & Maintenance | 118 (87.4%) | 17 (12.6%) |
| Personal Care & Service | 32 (20.4%) | 125 (79.6%) |
| Total (Category) | 650 (55.1%) | 529 (44.9%) |
| Total (Overall) | 3,006 (48.8%) | 3,159 (51.2%) |
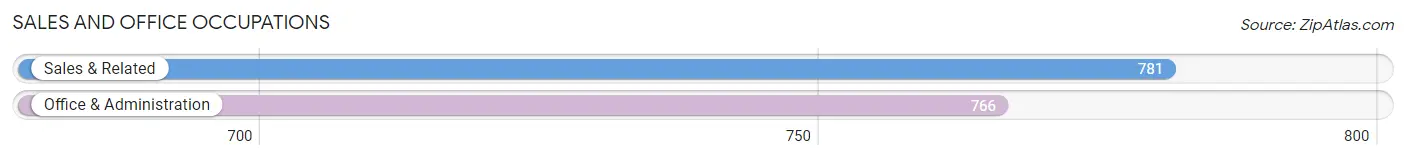
Sales and Office Occupations
The most common Sales and Office occupations in Stony Point are Sales & Related (781 | 12.7%), and Office & Administration (766 | 12.4%).
Sales and Office Occupations by Sex
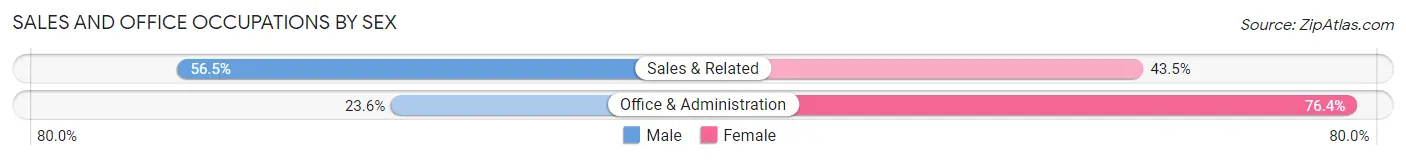
| Occupation | Male | Female |
| Sales & Related | 441 (56.5%) | 340 (43.5%) |
| Office & Administration | 181 (23.6%) | 585 (76.4%) |
| Total (Category) | 622 (40.2%) | 925 (59.8%) |
| Total (Overall) | 3,006 (48.8%) | 3,159 (51.2%) |
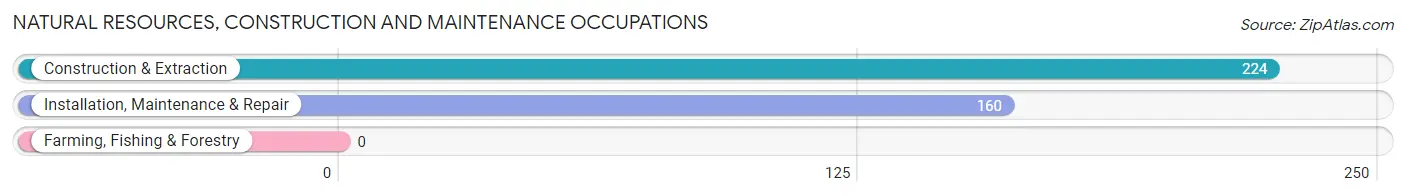
Natural Resources, Construction and Maintenance Occupations
The most common Natural Resources, Construction and Maintenance occupations in Stony Point are Construction & Extraction (224 | 3.6%), and Installation, Maintenance & Repair (160 | 2.6%).
Natural Resources, Construction and Maintenance Occupations by Sex
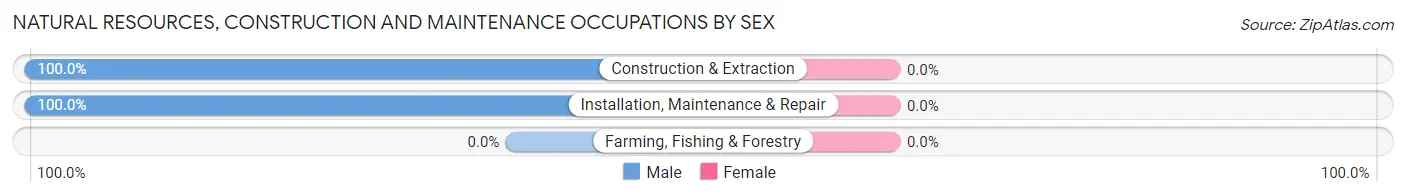
| Occupation | Male | Female |
| Farming, Fishing & Forestry | 0 (0.0%) | 0 (0.0%) |
| Construction & Extraction | 224 (100.0%) | 0 (0.0%) |
| Installation, Maintenance & Repair | 160 (100.0%) | 0 (0.0%) |
| Total (Category) | 384 (100.0%) | 0 (0.0%) |
| Total (Overall) | 3,006 (48.8%) | 3,159 (51.2%) |
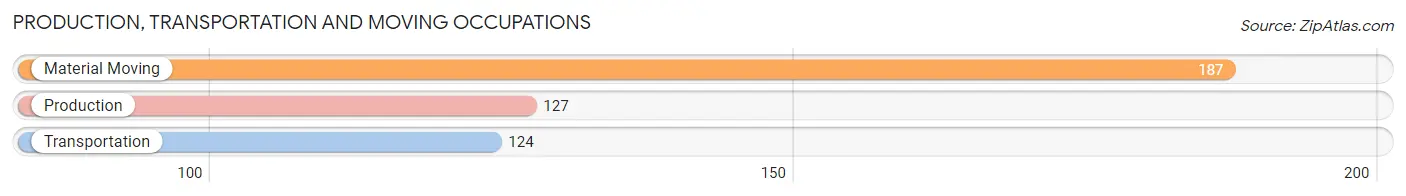
Production, Transportation and Moving Occupations
The most common Production, Transportation and Moving occupations in Stony Point are Material Moving (187 | 3.0%), Production (127 | 2.1%), and Transportation (124 | 2.0%).
Production, Transportation and Moving Occupations by Sex
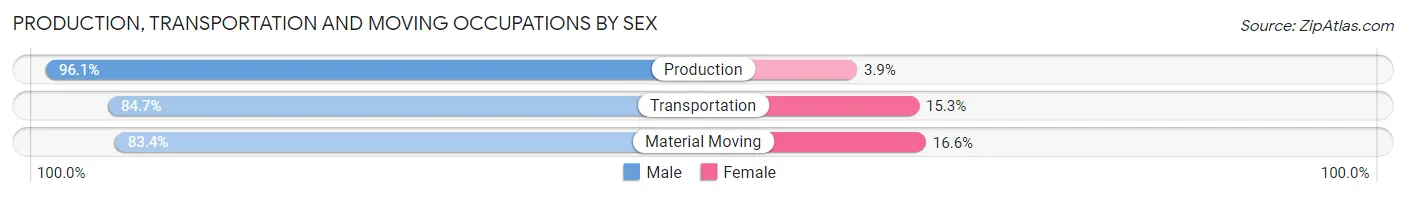
| Occupation | Male | Female |
| Production | 122 (96.1%) | 5 (3.9%) |
| Transportation | 105 (84.7%) | 19 (15.3%) |
| Material Moving | 156 (83.4%) | 31 (16.6%) |
| Total (Category) | 383 (87.4%) | 55 (12.6%) |
| Total (Overall) | 3,006 (48.8%) | 3,159 (51.2%) |
Employment Industries by Sex in Stony Point
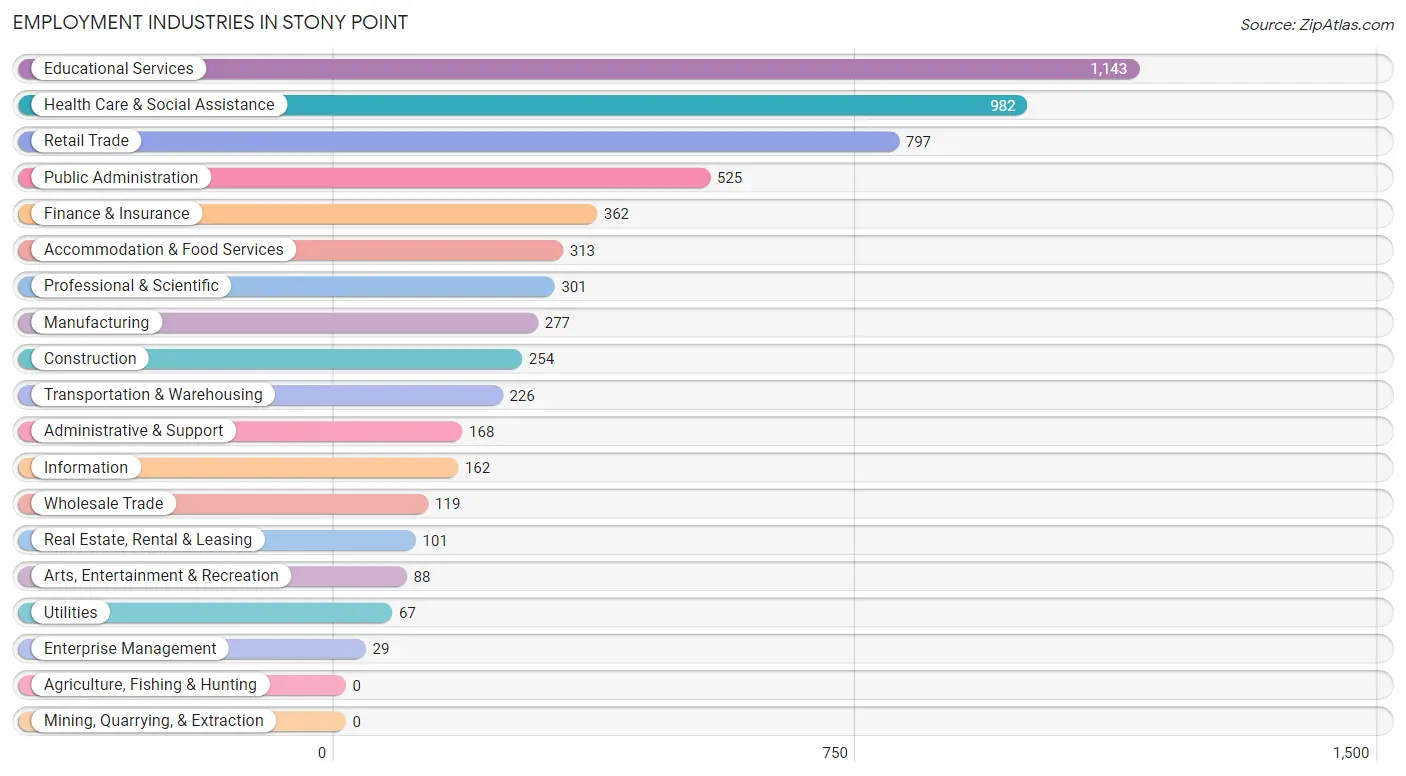
Employment Industries in Stony Point
The major employment industries in Stony Point include Educational Services (1,143 | 18.5%), Health Care & Social Assistance (982 | 15.9%), Retail Trade (797 | 12.9%), Public Administration (525 | 8.5%), and Finance & Insurance (362 | 5.9%).
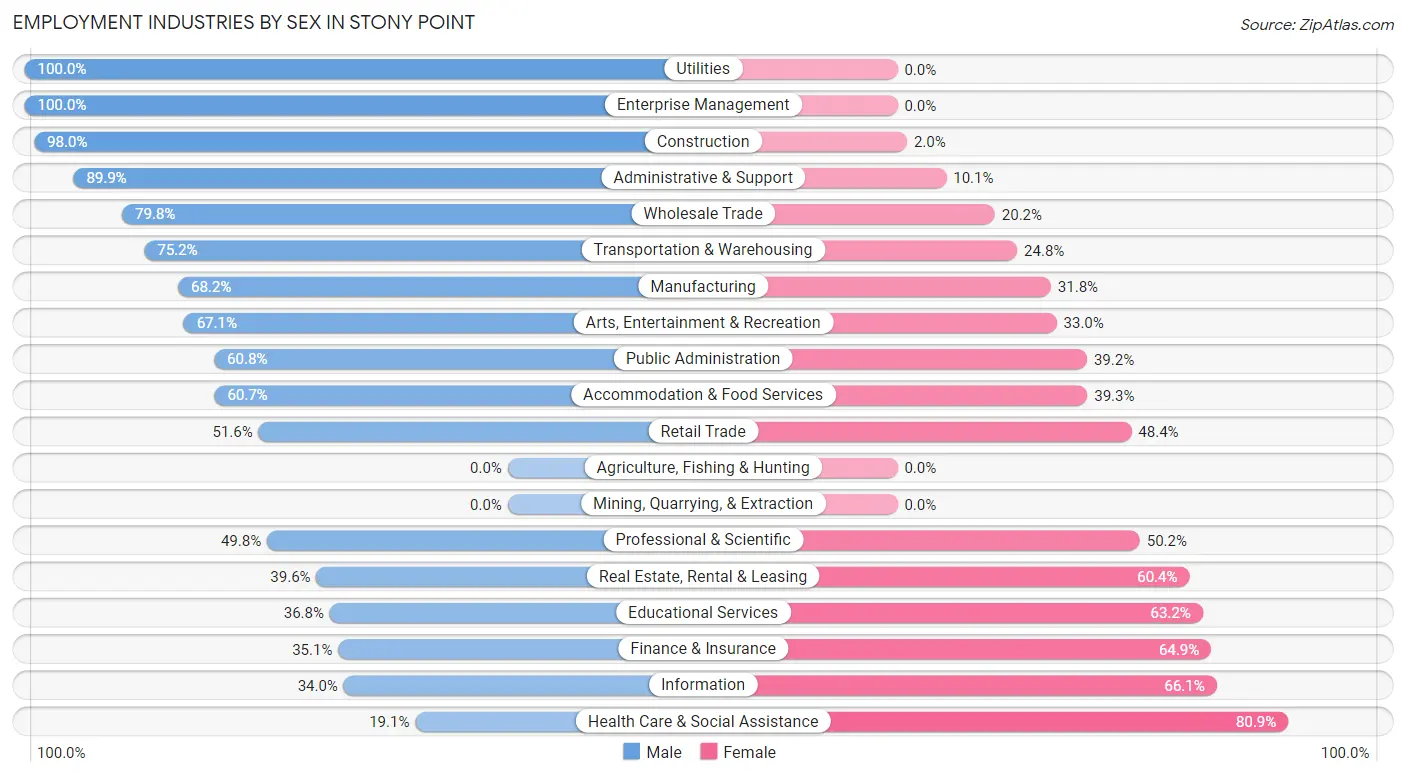
Employment Industries by Sex in Stony Point
The Stony Point industries that see more men than women are Utilities (100.0%), Enterprise Management (100.0%), and Construction (98.0%), whereas the industries that tend to have a higher number of women are Health Care & Social Assistance (80.9%), Information (66.0%), and Finance & Insurance (64.9%).
| Industry | Male | Female |
| Agriculture, Fishing & Hunting | 0 (0.0%) | 0 (0.0%) |
| Mining, Quarrying, & Extraction | 0 (0.0%) | 0 (0.0%) |
| Construction | 249 (98.0%) | 5 (2.0%) |
| Manufacturing | 189 (68.2%) | 88 (31.8%) |
| Wholesale Trade | 95 (79.8%) | 24 (20.2%) |
| Retail Trade | 411 (51.6%) | 386 (48.4%) |
| Transportation & Warehousing | 170 (75.2%) | 56 (24.8%) |
| Utilities | 67 (100.0%) | 0 (0.0%) |
| Information | 55 (34.0%) | 107 (66.0%) |
| Finance & Insurance | 127 (35.1%) | 235 (64.9%) |
| Real Estate, Rental & Leasing | 40 (39.6%) | 61 (60.4%) |
| Professional & Scientific | 150 (49.8%) | 151 (50.2%) |
| Enterprise Management | 29 (100.0%) | 0 (0.0%) |
| Administrative & Support | 151 (89.9%) | 17 (10.1%) |
| Educational Services | 421 (36.8%) | 722 (63.2%) |
| Health Care & Social Assistance | 188 (19.1%) | 794 (80.9%) |
| Arts, Entertainment & Recreation | 59 (67.0%) | 29 (33.0%) |
| Accommodation & Food Services | 190 (60.7%) | 123 (39.3%) |
| Public Administration | 319 (60.8%) | 206 (39.2%) |
| Total | 3,006 (48.8%) | 3,159 (51.2%) |
Education in Stony Point
School Enrollment in Stony Point
The most common levels of schooling among the 2,693 students in Stony Point are high school (846 | 31.4%), middle school (549 | 20.4%), and elementary school (515 | 19.1%).
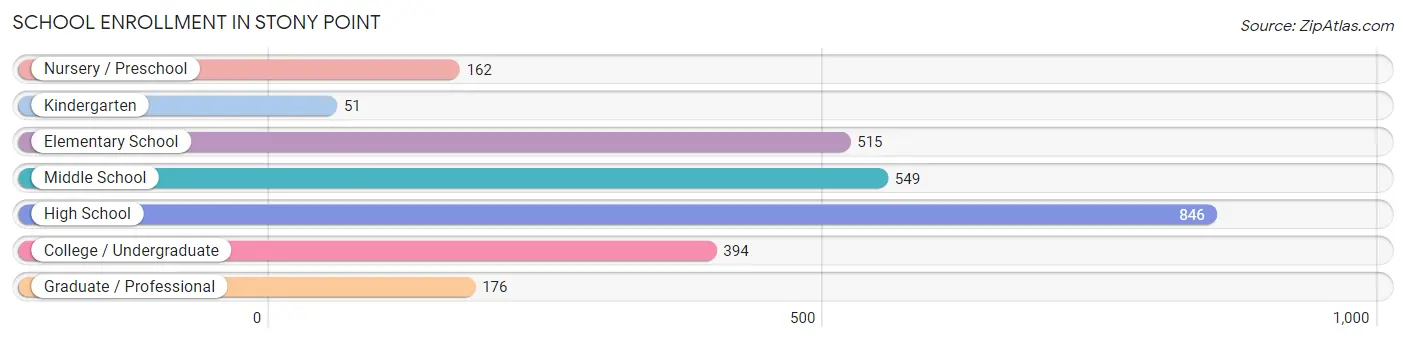
| School Level | # Students | % Students |
| Nursery / Preschool | 162 | 6.0% |
| Kindergarten | 51 | 1.9% |
| Elementary School | 515 | 19.1% |
| Middle School | 549 | 20.4% |
| High School | 846 | 31.4% |
| College / Undergraduate | 394 | 14.6% |
| Graduate / Professional | 176 | 6.5% |
| Total | 2,693 | 100.0% |
School Enrollment by Age by Funding Source in Stony Point
Out of a total of 2,693 students who are enrolled in schools in Stony Point, 444 (16.5%) attend a private institution, while the remaining 2,249 (83.5%) are enrolled in public schools. The age group of 25 to 34 year olds has the highest likelihood of being enrolled in private schools, with 22 (66.7% in the age bracket) enrolled. Conversely, the age group of 10 to 14 year olds has the lowest likelihood of being enrolled in a private school, with 826 (98.3% in the age bracket) attending a public institution.
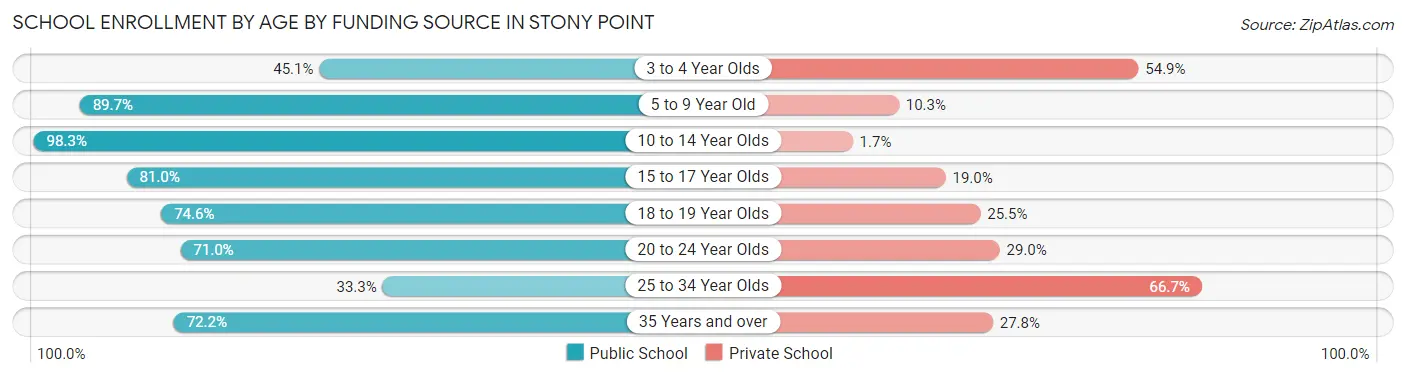
| Age Bracket | Public School | Private School |
| 3 to 4 Year Olds | 60 (45.1%) | 73 (54.9%) |
| 5 to 9 Year Old | 463 (89.7%) | 53 (10.3%) |
| 10 to 14 Year Olds | 826 (98.3%) | 14 (1.7%) |
| 15 to 17 Year Olds | 397 (81.0%) | 93 (19.0%) |
| 18 to 19 Year Olds | 123 (74.6%) | 42 (25.5%) |
| 20 to 24 Year Olds | 264 (71.0%) | 108 (29.0%) |
| 25 to 34 Year Olds | 11 (33.3%) | 22 (66.7%) |
| 35 Years and over | 104 (72.2%) | 40 (27.8%) |
| Total | 2,249 (83.5%) | 444 (16.5%) |
Educational Attainment by Field of Study in Stony Point
Business (901 | 25.1%), education (515 | 14.4%), science & technology (419 | 11.7%), psychology (247 | 6.9%), and computers & mathematics (240 | 6.7%) are the most common fields of study among 3,587 individuals in Stony Point who have obtained a bachelor's degree or higher.
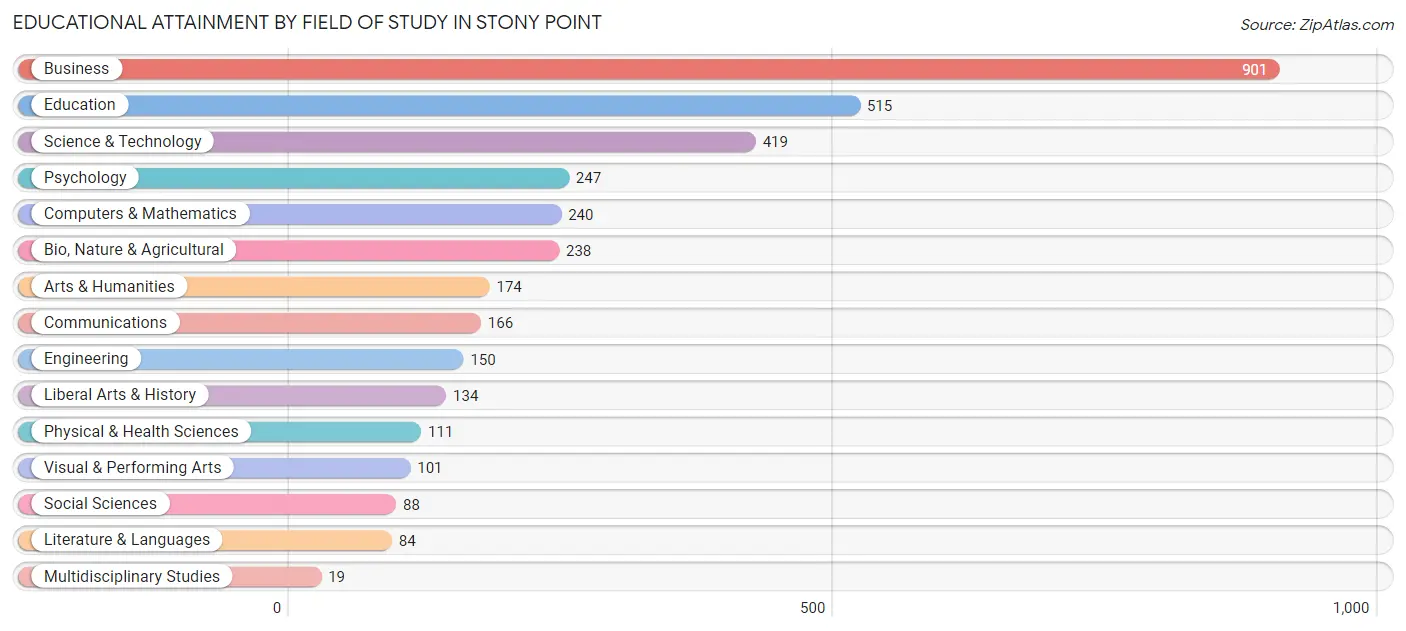
| Field of Study | # Graduates | % Graduates |
| Computers & Mathematics | 240 | 6.7% |
| Bio, Nature & Agricultural | 238 | 6.6% |
| Physical & Health Sciences | 111 | 3.1% |
| Psychology | 247 | 6.9% |
| Social Sciences | 88 | 2.5% |
| Engineering | 150 | 4.2% |
| Multidisciplinary Studies | 19 | 0.5% |
| Science & Technology | 419 | 11.7% |
| Business | 901 | 25.1% |
| Education | 515 | 14.4% |
| Literature & Languages | 84 | 2.3% |
| Liberal Arts & History | 134 | 3.7% |
| Visual & Performing Arts | 101 | 2.8% |
| Communications | 166 | 4.6% |
| Arts & Humanities | 174 | 4.9% |
| Total | 3,587 | 100.0% |
Transportation & Commute in Stony Point
Vehicle Availability by Sex in Stony Point
The most prevalent vehicle ownership categories in Stony Point are males with 2 vehicles (1,034, accounting for 35.2%) and females with 2 vehicles (1,103, making up 35.0%).
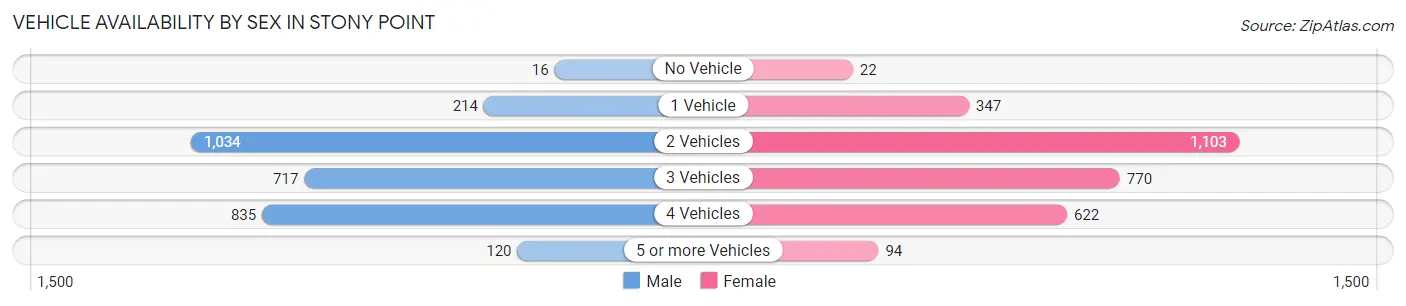
| Vehicles Available | Male | Female |
| No Vehicle | 16 (0.5%) | 22 (0.7%) |
| 1 Vehicle | 214 (7.3%) | 347 (11.7%) |
| 2 Vehicles | 1,034 (35.2%) | 1,103 (37.3%) |
| 3 Vehicles | 717 (24.4%) | 770 (26.0%) |
| 4 Vehicles | 835 (28.4%) | 622 (21.0%) |
| 5 or more Vehicles | 120 (4.1%) | 94 (3.2%) |
| Total | 2,936 (100.0%) | 2,958 (100.0%) |
Commute Time in Stony Point
The most frequently occuring commute durations in Stony Point are 20 to 24 minutes (978 commuters, 17.8%), 60 to 89 minutes (719 commuters, 13.1%), and 25 to 29 minutes (565 commuters, 10.3%).
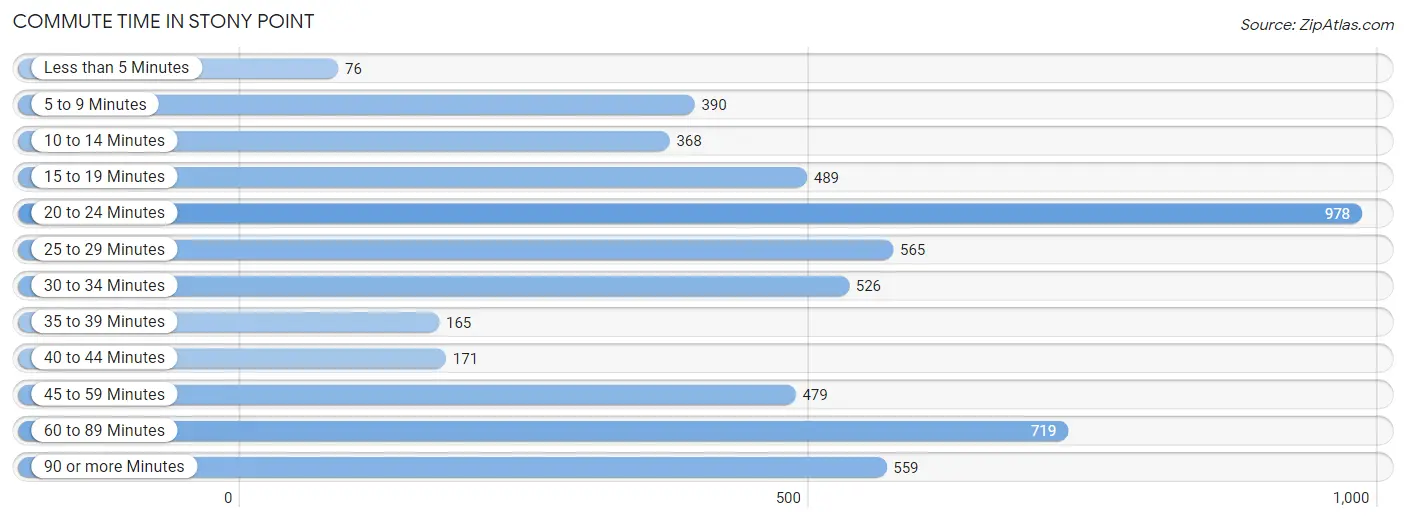
| Commute Time | # Commuters | % Commuters |
| Less than 5 Minutes | 76 | 1.4% |
| 5 to 9 Minutes | 390 | 7.1% |
| 10 to 14 Minutes | 368 | 6.7% |
| 15 to 19 Minutes | 489 | 8.9% |
| 20 to 24 Minutes | 978 | 17.8% |
| 25 to 29 Minutes | 565 | 10.3% |
| 30 to 34 Minutes | 526 | 9.6% |
| 35 to 39 Minutes | 165 | 3.0% |
| 40 to 44 Minutes | 171 | 3.1% |
| 45 to 59 Minutes | 479 | 8.7% |
| 60 to 89 Minutes | 719 | 13.1% |
| 90 or more Minutes | 559 | 10.2% |
Commute Time by Sex in Stony Point
The most common commute times in Stony Point are 20 to 24 minutes (495 commuters, 18.3%) for males and 20 to 24 minutes (483 commuters, 17.3%) for females.
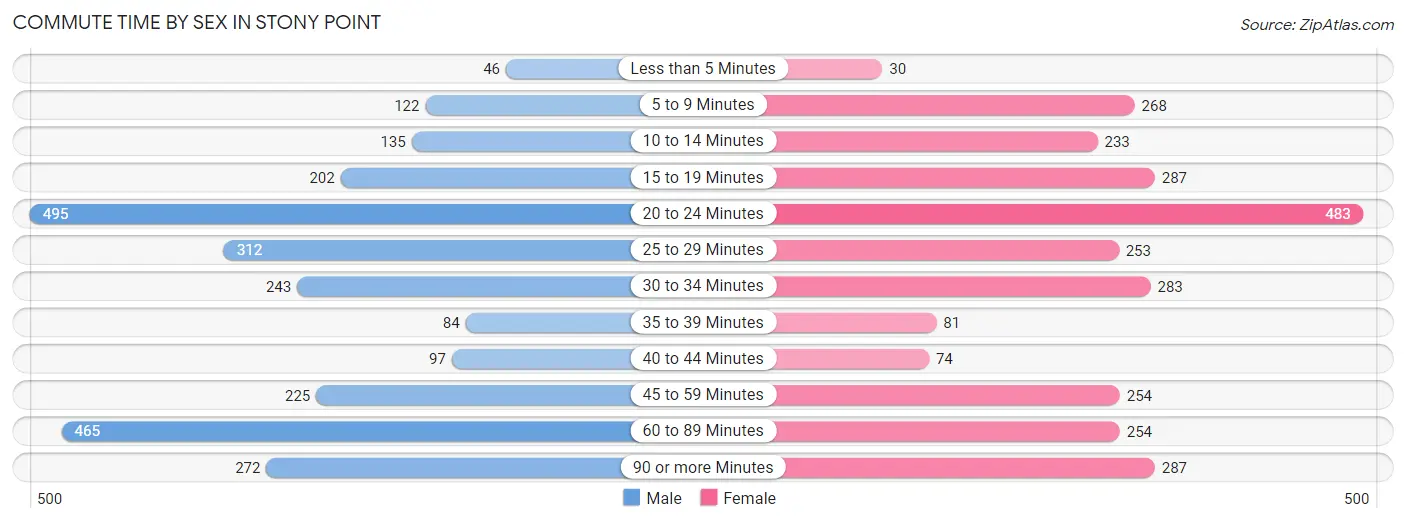
| Commute Time | Male | Female |
| Less than 5 Minutes | 46 (1.7%) | 30 (1.1%) |
| 5 to 9 Minutes | 122 (4.5%) | 268 (9.6%) |
| 10 to 14 Minutes | 135 (5.0%) | 233 (8.4%) |
| 15 to 19 Minutes | 202 (7.5%) | 287 (10.3%) |
| 20 to 24 Minutes | 495 (18.3%) | 483 (17.3%) |
| 25 to 29 Minutes | 312 (11.6%) | 253 (9.1%) |
| 30 to 34 Minutes | 243 (9.0%) | 283 (10.2%) |
| 35 to 39 Minutes | 84 (3.1%) | 81 (2.9%) |
| 40 to 44 Minutes | 97 (3.6%) | 74 (2.7%) |
| 45 to 59 Minutes | 225 (8.3%) | 254 (9.1%) |
| 60 to 89 Minutes | 465 (17.2%) | 254 (9.1%) |
| 90 or more Minutes | 272 (10.1%) | 287 (10.3%) |
Time of Departure to Work by Sex in Stony Point
The most frequent times of departure to work in Stony Point are 7:00 AM to 7:29 AM (359, 13.3%) for males and 8:00 AM to 8:29 AM (602, 21.6%) for females.
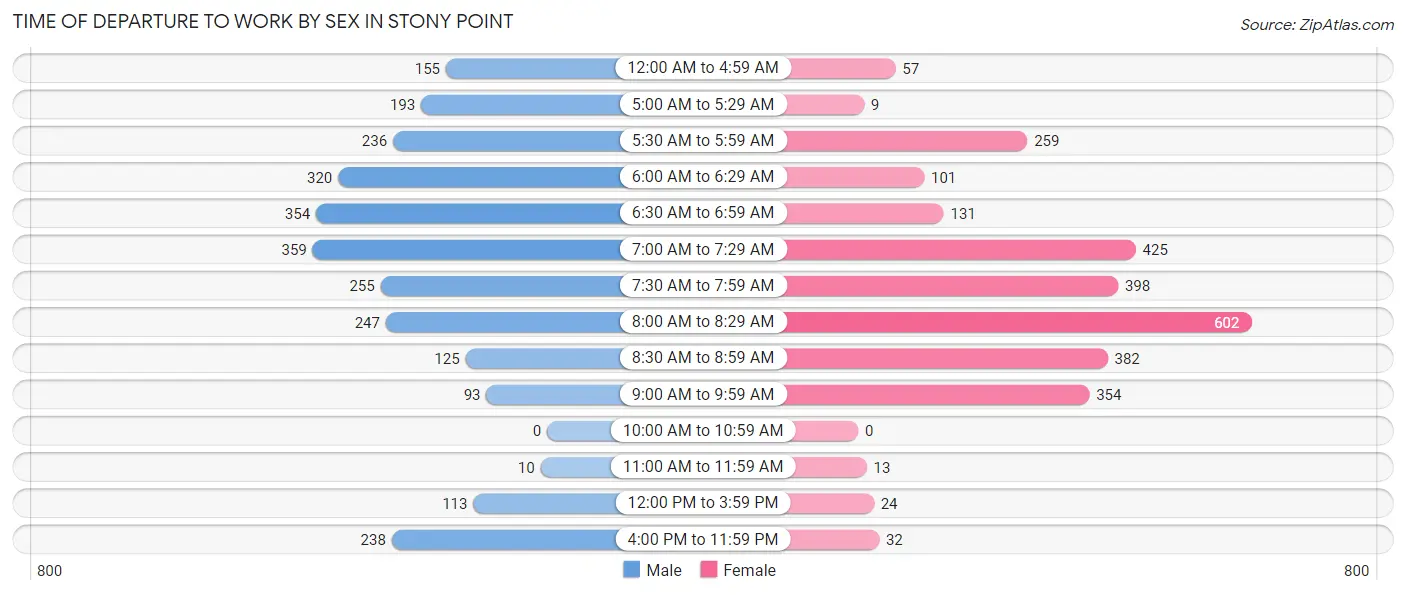
| Time of Departure | Male | Female |
| 12:00 AM to 4:59 AM | 155 (5.7%) | 57 (2.1%) |
| 5:00 AM to 5:29 AM | 193 (7.1%) | 9 (0.3%) |
| 5:30 AM to 5:59 AM | 236 (8.7%) | 259 (9.3%) |
| 6:00 AM to 6:29 AM | 320 (11.9%) | 101 (3.6%) |
| 6:30 AM to 6:59 AM | 354 (13.1%) | 131 (4.7%) |
| 7:00 AM to 7:29 AM | 359 (13.3%) | 425 (15.2%) |
| 7:30 AM to 7:59 AM | 255 (9.5%) | 398 (14.3%) |
| 8:00 AM to 8:29 AM | 247 (9.1%) | 602 (21.6%) |
| 8:30 AM to 8:59 AM | 125 (4.6%) | 382 (13.7%) |
| 9:00 AM to 9:59 AM | 93 (3.5%) | 354 (12.7%) |
| 10:00 AM to 10:59 AM | 0 (0.0%) | 0 (0.0%) |
| 11:00 AM to 11:59 AM | 10 (0.4%) | 13 (0.5%) |
| 12:00 PM to 3:59 PM | 113 (4.2%) | 24 (0.9%) |
| 4:00 PM to 11:59 PM | 238 (8.8%) | 32 (1.1%) |
| Total | 2,698 (100.0%) | 2,787 (100.0%) |
Housing Occupancy in Stony Point
Occupancy by Ownership in Stony Point
Of the total 4,364 dwellings in Stony Point, owner-occupied units account for 3,827 (87.7%), while renter-occupied units make up 537 (12.3%).
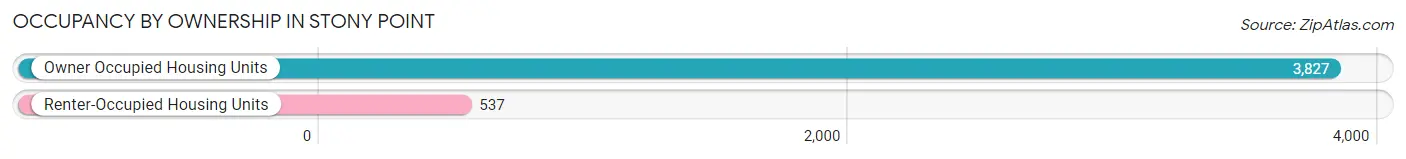
| Occupancy | # Housing Units | % Housing Units |
| Owner Occupied Housing Units | 3,827 | 87.7% |
| Renter-Occupied Housing Units | 537 | 12.3% |
| Total Occupied Housing Units | 4,364 | 100.0% |
Occupancy by Household Size in Stony Point
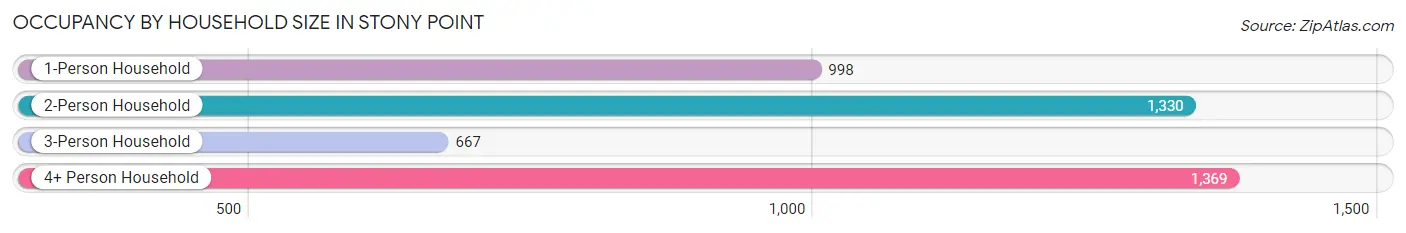
| Household Size | # Housing Units | % Housing Units |
| 1-Person Household | 998 | 22.9% |
| 2-Person Household | 1,330 | 30.5% |
| 3-Person Household | 667 | 15.3% |
| 4+ Person Household | 1,369 | 31.4% |
| Total Housing Units | 4,364 | 100.0% |
Occupancy by Ownership by Household Size in Stony Point
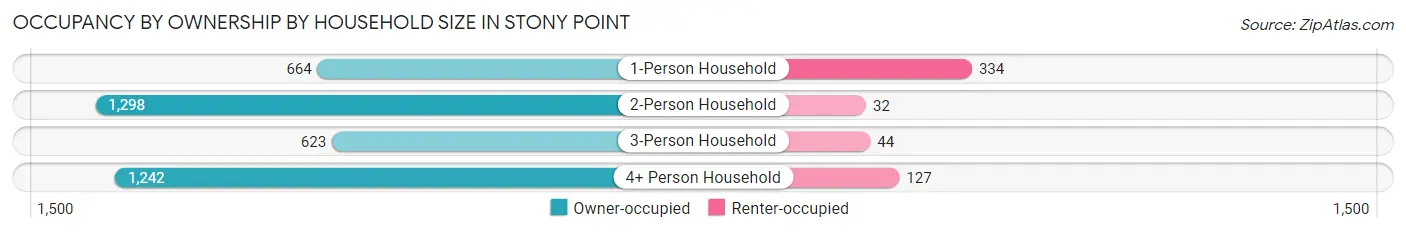
| Household Size | Owner-occupied | Renter-occupied |
| 1-Person Household | 664 (66.5%) | 334 (33.5%) |
| 2-Person Household | 1,298 (97.6%) | 32 (2.4%) |
| 3-Person Household | 623 (93.4%) | 44 (6.6%) |
| 4+ Person Household | 1,242 (90.7%) | 127 (9.3%) |
| Total Housing Units | 3,827 (87.7%) | 537 (12.3%) |
Occupancy by Educational Attainment in Stony Point
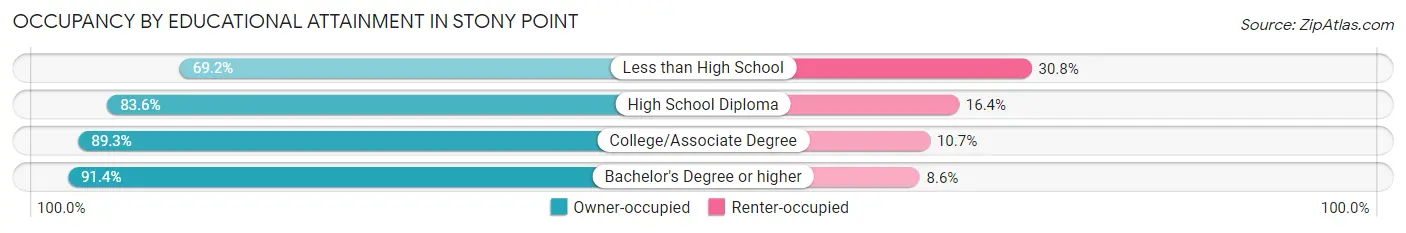
| Household Size | Owner-occupied | Renter-occupied |
| Less than High School | 173 (69.2%) | 77 (30.8%) |
| High School Diploma | 801 (83.6%) | 157 (16.4%) |
| College/Associate Degree | 1,356 (89.3%) | 162 (10.7%) |
| Bachelor's Degree or higher | 1,497 (91.4%) | 141 (8.6%) |
Occupancy by Age of Householder in Stony Point
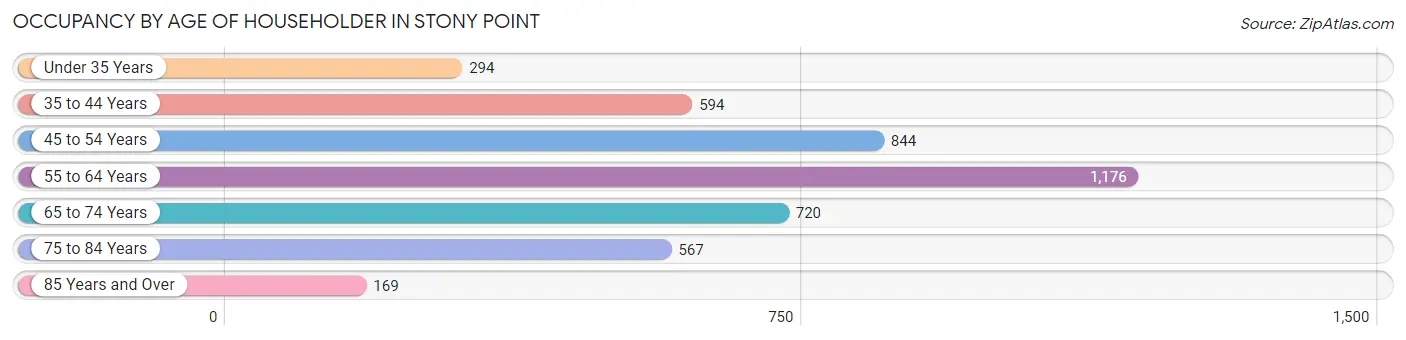
| Age Bracket | # Households | % Households |
| Under 35 Years | 294 | 6.7% |
| 35 to 44 Years | 594 | 13.6% |
| 45 to 54 Years | 844 | 19.3% |
| 55 to 64 Years | 1,176 | 27.0% |
| 65 to 74 Years | 720 | 16.5% |
| 75 to 84 Years | 567 | 13.0% |
| 85 Years and Over | 169 | 3.9% |
| Total | 4,364 | 100.0% |
Housing Finances in Stony Point
Median Income by Occupancy in Stony Point
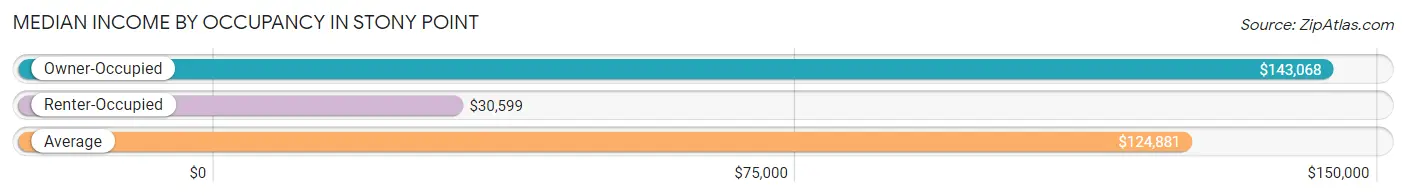
| Occupancy Type | # Households | Median Income |
| Owner-Occupied | 3,827 (87.7%) | $143,068 |
| Renter-Occupied | 537 (12.3%) | $30,599 |
| Average | 4,364 (100.0%) | $124,881 |
Occupancy by Householder Income Bracket in Stony Point
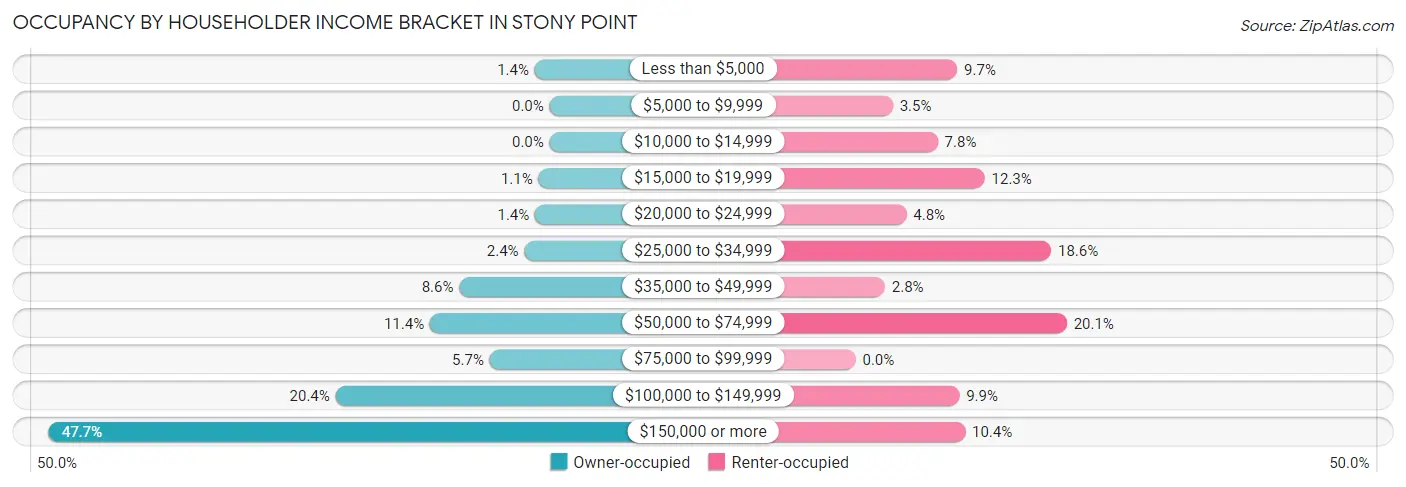
| Income Bracket | Owner-occupied | Renter-occupied |
| Less than $5,000 | 54 (1.4%) | 52 (9.7%) |
| $5,000 to $9,999 | 0 (0.0%) | 19 (3.5%) |
| $10,000 to $14,999 | 0 (0.0%) | 42 (7.8%) |
| $15,000 to $19,999 | 40 (1.1%) | 66 (12.3%) |
| $20,000 to $24,999 | 53 (1.4%) | 26 (4.8%) |
| $25,000 to $34,999 | 92 (2.4%) | 100 (18.6%) |
| $35,000 to $49,999 | 329 (8.6%) | 15 (2.8%) |
| $50,000 to $74,999 | 436 (11.4%) | 108 (20.1%) |
| $75,000 to $99,999 | 218 (5.7%) | 0 (0.0%) |
| $100,000 to $149,999 | 780 (20.4%) | 53 (9.9%) |
| $150,000 or more | 1,825 (47.7%) | 56 (10.4%) |
| Total | 3,827 (100.0%) | 537 (100.0%) |
Monthly Housing Cost Tiers in Stony Point
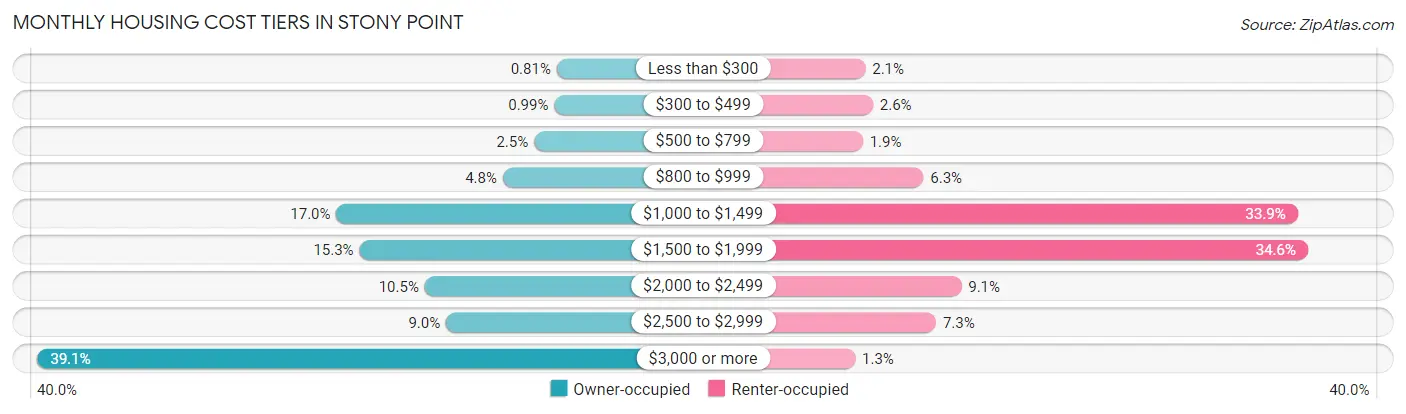
| Monthly Cost | Owner-occupied | Renter-occupied |
| Less than $300 | 31 (0.8%) | 11 (2.1%) |
| $300 to $499 | 38 (1.0%) | 14 (2.6%) |
| $500 to $799 | 95 (2.5%) | 10 (1.9%) |
| $800 to $999 | 183 (4.8%) | 34 (6.3%) |
| $1,000 to $1,499 | 652 (17.0%) | 182 (33.9%) |
| $1,500 to $1,999 | 587 (15.3%) | 186 (34.6%) |
| $2,000 to $2,499 | 403 (10.5%) | 49 (9.1%) |
| $2,500 to $2,999 | 343 (9.0%) | 39 (7.3%) |
| $3,000 or more | 1,495 (39.1%) | 7 (1.3%) |
| Total | 3,827 (100.0%) | 537 (100.0%) |
Physical Housing Characteristics in Stony Point
Housing Structures in Stony Point
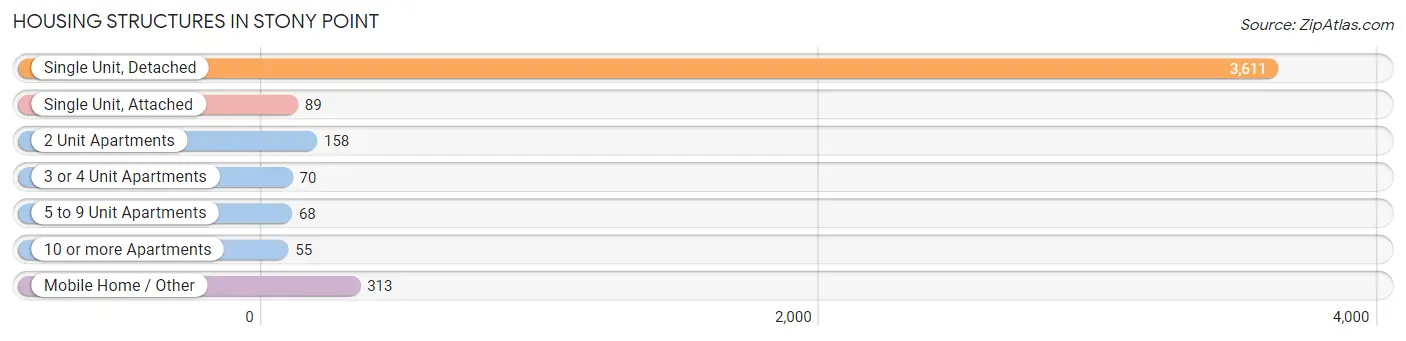
| Structure Type | # Housing Units | % Housing Units |
| Single Unit, Detached | 3,611 | 82.8% |
| Single Unit, Attached | 89 | 2.0% |
| 2 Unit Apartments | 158 | 3.6% |
| 3 or 4 Unit Apartments | 70 | 1.6% |
| 5 to 9 Unit Apartments | 68 | 1.6% |
| 10 or more Apartments | 55 | 1.3% |
| Mobile Home / Other | 313 | 7.2% |
| Total | 4,364 | 100.0% |
Housing Structures by Occupancy in Stony Point
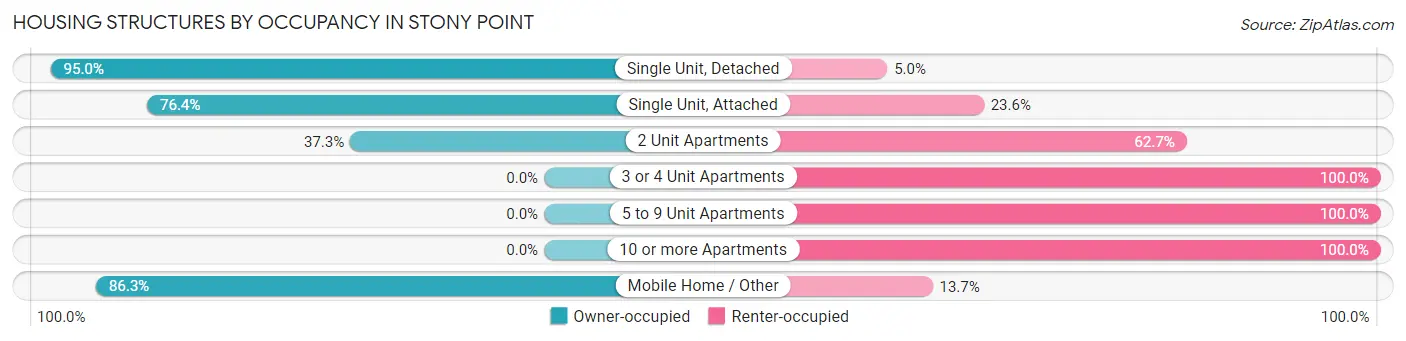
| Structure Type | Owner-occupied | Renter-occupied |
| Single Unit, Detached | 3,430 (95.0%) | 181 (5.0%) |
| Single Unit, Attached | 68 (76.4%) | 21 (23.6%) |
| 2 Unit Apartments | 59 (37.3%) | 99 (62.7%) |
| 3 or 4 Unit Apartments | 0 (0.0%) | 70 (100.0%) |
| 5 to 9 Unit Apartments | 0 (0.0%) | 68 (100.0%) |
| 10 or more Apartments | 0 (0.0%) | 55 (100.0%) |
| Mobile Home / Other | 270 (86.3%) | 43 (13.7%) |
| Total | 3,827 (87.7%) | 537 (12.3%) |
Housing Structures by Number of Rooms in Stony Point
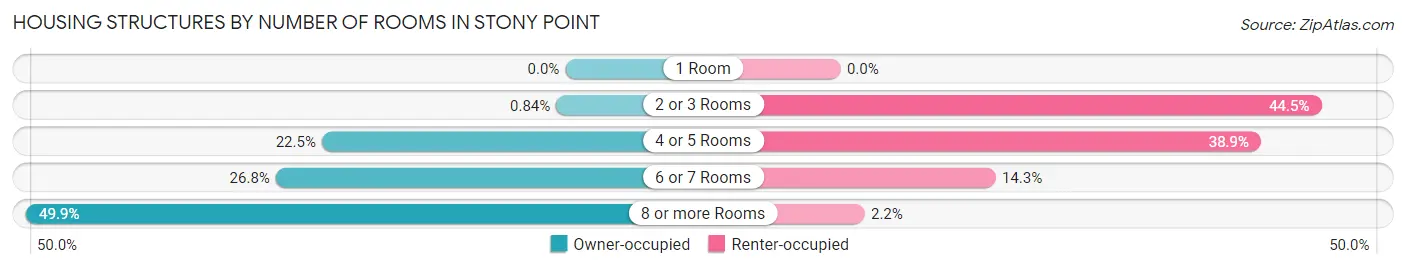
| Number of Rooms | Owner-occupied | Renter-occupied |
| 1 Room | 0 (0.0%) | 0 (0.0%) |
| 2 or 3 Rooms | 32 (0.8%) | 239 (44.5%) |
| 4 or 5 Rooms | 862 (22.5%) | 209 (38.9%) |
| 6 or 7 Rooms | 1,025 (26.8%) | 77 (14.3%) |
| 8 or more Rooms | 1,908 (49.9%) | 12 (2.2%) |
| Total | 3,827 (100.0%) | 537 (100.0%) |
Housing Structure by Heating Type in Stony Point
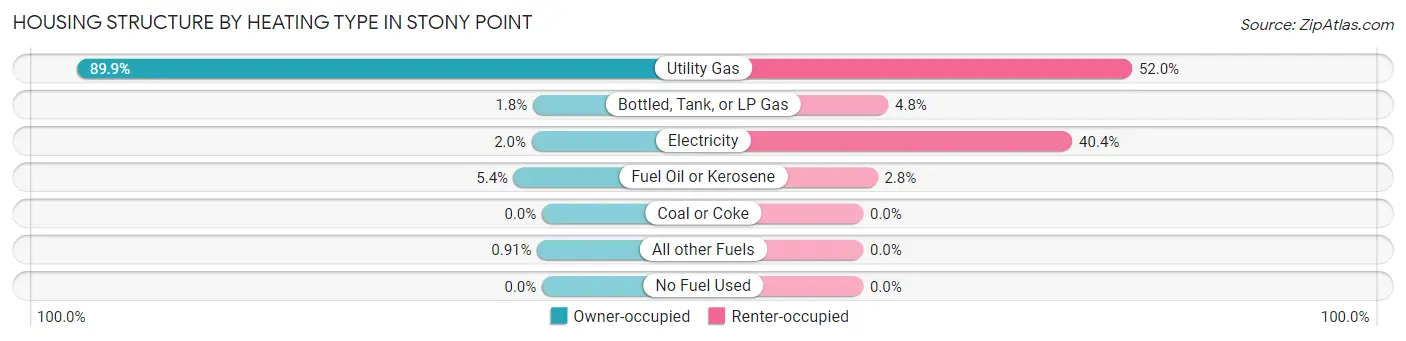
| Heating Type | Owner-occupied | Renter-occupied |
| Utility Gas | 3,441 (89.9%) | 279 (52.0%) |
| Bottled, Tank, or LP Gas | 67 (1.8%) | 26 (4.8%) |
| Electricity | 76 (2.0%) | 217 (40.4%) |
| Fuel Oil or Kerosene | 208 (5.4%) | 15 (2.8%) |
| Coal or Coke | 0 (0.0%) | 0 (0.0%) |
| All other Fuels | 35 (0.9%) | 0 (0.0%) |
| No Fuel Used | 0 (0.0%) | 0 (0.0%) |
| Total | 3,827 (100.0%) | 537 (100.0%) |
Household Vehicle Usage in Stony Point
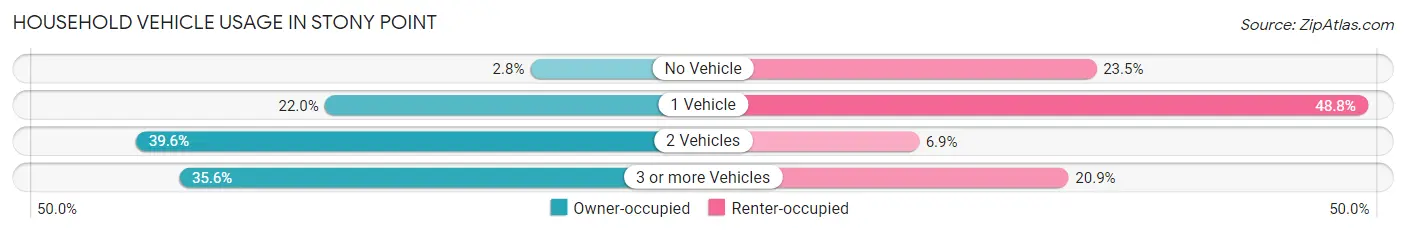
| Vehicles per Household | Owner-occupied | Renter-occupied |
| No Vehicle | 107 (2.8%) | 126 (23.5%) |
| 1 Vehicle | 842 (22.0%) | 262 (48.8%) |
| 2 Vehicles | 1,516 (39.6%) | 37 (6.9%) |
| 3 or more Vehicles | 1,362 (35.6%) | 112 (20.9%) |
| Total | 3,827 (100.0%) | 537 (100.0%) |
Real Estate & Mortgages in Stony Point
Real Estate and Mortgage Overview in Stony Point
| Characteristic | Without Mortgage | With Mortgage |
| Housing Units | 1,626 | 2,201 |
| Median Property Value | $437,200 | $456,800 |
| Median Household Income | $97,708 | $1,389 |
| Monthly Housing Costs | $1,458 | $1,442 |
| Real Estate Taxes | $10,001 | $28 |
Property Value by Mortgage Status in Stony Point
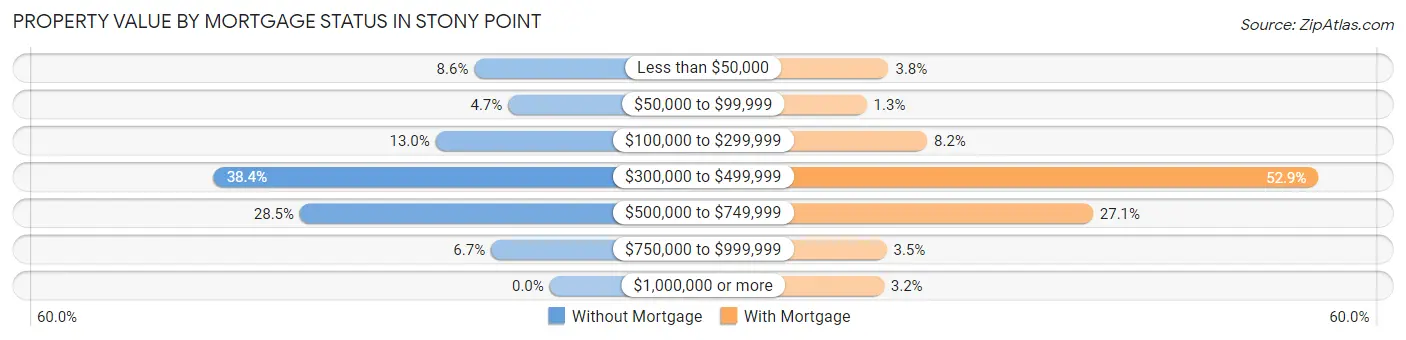
| Property Value | Without Mortgage | With Mortgage |
| Less than $50,000 | 140 (8.6%) | 83 (3.8%) |
| $50,000 to $99,999 | 77 (4.7%) | 28 (1.3%) |
| $100,000 to $299,999 | 212 (13.0%) | 180 (8.2%) |
| $300,000 to $499,999 | 624 (38.4%) | 1,164 (52.9%) |
| $500,000 to $749,999 | 464 (28.5%) | 597 (27.1%) |
| $750,000 to $999,999 | 109 (6.7%) | 78 (3.5%) |
| $1,000,000 or more | 0 (0.0%) | 71 (3.2%) |
| Total | 1,626 (100.0%) | 2,201 (100.0%) |
Household Income by Mortgage Status in Stony Point
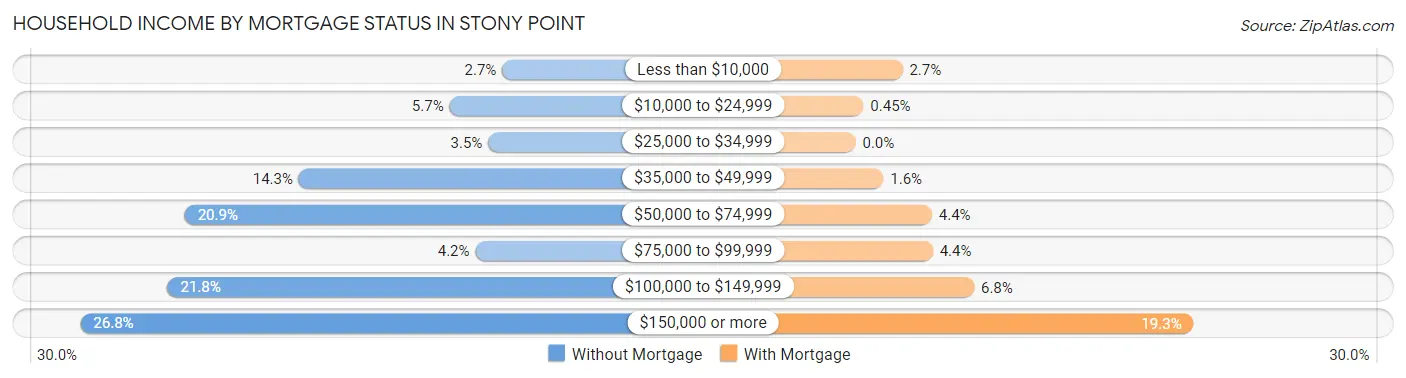
| Household Income | Without Mortgage | With Mortgage |
| Less than $10,000 | 44 (2.7%) | 59 (2.7%) |
| $10,000 to $24,999 | 93 (5.7%) | 10 (0.4%) |
| $25,000 to $34,999 | 57 (3.5%) | 0 (0.0%) |
| $35,000 to $49,999 | 233 (14.3%) | 35 (1.6%) |
| $50,000 to $74,999 | 339 (20.8%) | 96 (4.4%) |
| $75,000 to $99,999 | 69 (4.2%) | 97 (4.4%) |
| $100,000 to $149,999 | 355 (21.8%) | 149 (6.8%) |
| $150,000 or more | 436 (26.8%) | 425 (19.3%) |
| Total | 1,626 (100.0%) | 2,201 (100.0%) |
Property Value to Household Income Ratio in Stony Point
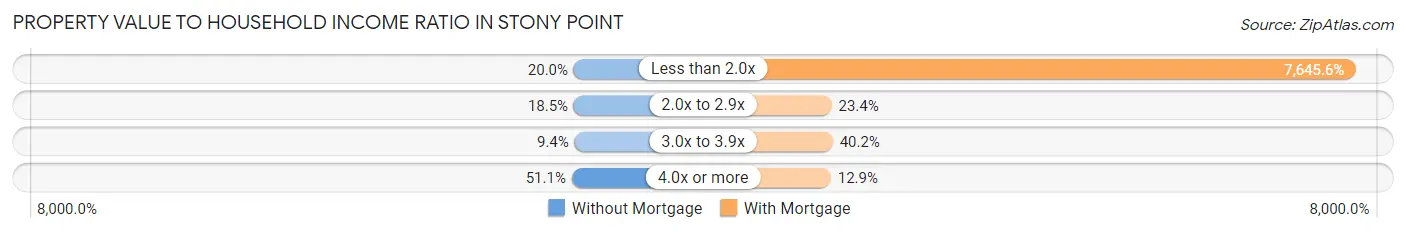
| Value-to-Income Ratio | Without Mortgage | With Mortgage |
| Less than 2.0x | 325 (20.0%) | 168,279 (7,645.6%) |
| 2.0x to 2.9x | 300 (18.4%) | 515 (23.4%) |
| 3.0x to 3.9x | 152 (9.3%) | 884 (40.2%) |
| 4.0x or more | 830 (51.0%) | 284 (12.9%) |
| Total | 1,626 (100.0%) | 2,201 (100.0%) |
Real Estate Taxes by Mortgage Status in Stony Point
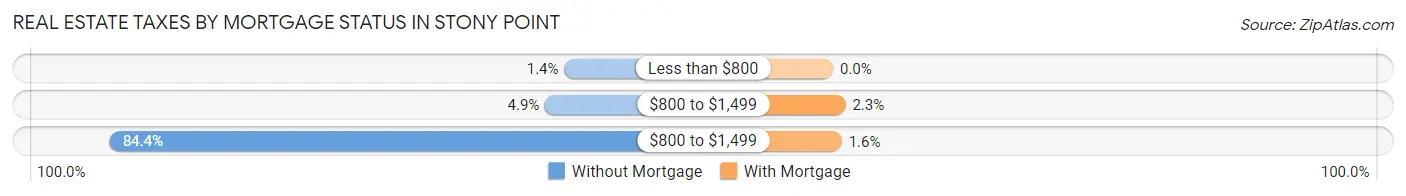
| Property Taxes | Without Mortgage | With Mortgage |
| Less than $800 | 23 (1.4%) | 0 (0.0%) |
| $800 to $1,499 | 80 (4.9%) | 50 (2.3%) |
| $800 to $1,499 | 1,373 (84.4%) | 35 (1.6%) |
| Total | 1,626 (100.0%) | 2,201 (100.0%) |
Health & Disability in Stony Point
Health Insurance Coverage by Age in Stony Point
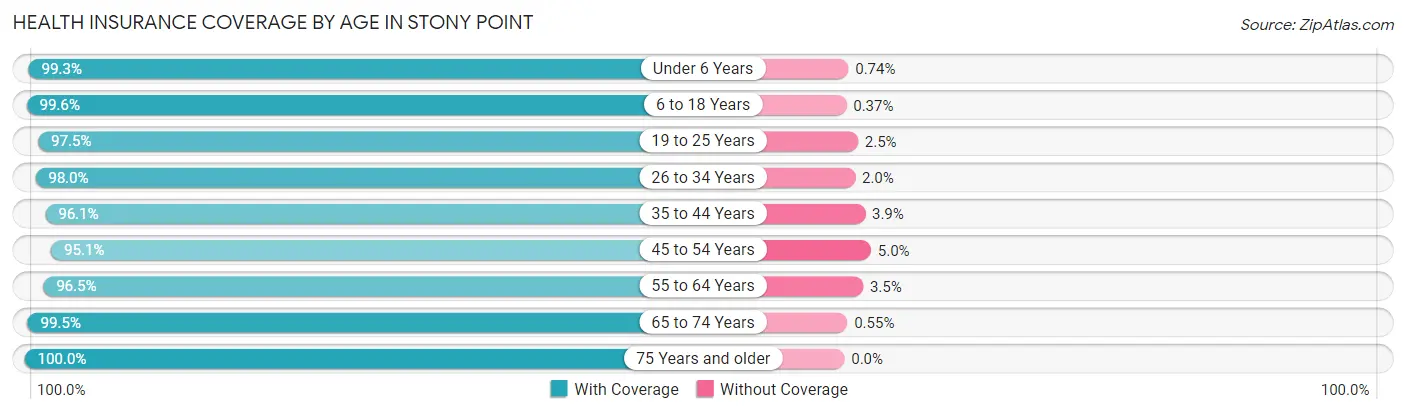
| Age Bracket | With Coverage | Without Coverage |
| Under 6 Years | 802 (99.3%) | 6 (0.7%) |
| 6 to 18 Years | 1,868 (99.6%) | 7 (0.4%) |
| 19 to 25 Years | 1,115 (97.5%) | 29 (2.5%) |
| 26 to 34 Years | 1,028 (98.0%) | 21 (2.0%) |
| 35 to 44 Years | 1,241 (96.1%) | 50 (3.9%) |
| 45 to 54 Years | 1,688 (95.1%) | 88 (5.0%) |
| 55 to 64 Years | 2,051 (96.5%) | 74 (3.5%) |
| 65 to 74 Years | 1,082 (99.5%) | 6 (0.5%) |
| 75 Years and older | 1,360 (100.0%) | 0 (0.0%) |
| Total | 12,235 (97.8%) | 281 (2.2%) |
Health Insurance Coverage by Citizenship Status in Stony Point
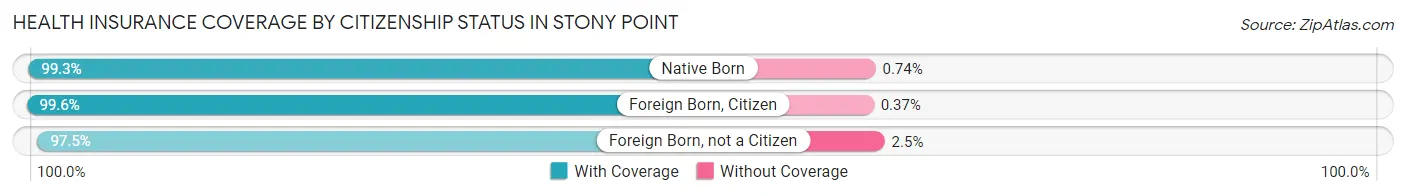
| Citizenship Status | With Coverage | Without Coverage |
| Native Born | 802 (99.3%) | 6 (0.7%) |
| Foreign Born, Citizen | 1,868 (99.6%) | 7 (0.4%) |
| Foreign Born, not a Citizen | 1,115 (97.5%) | 29 (2.5%) |
Health Insurance Coverage by Household Income in Stony Point
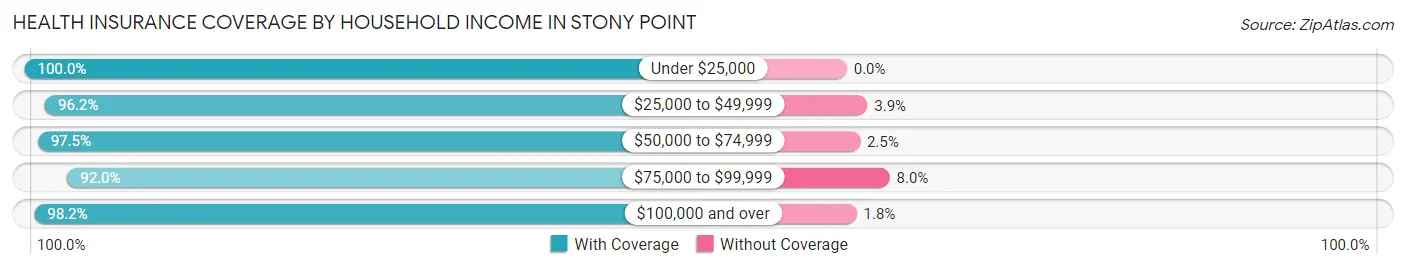
| Household Income | With Coverage | Without Coverage |
| Under $25,000 | 492 (100.0%) | 0 (0.0%) |
| $25,000 to $49,999 | 1,049 (96.2%) | 42 (3.8%) |
| $50,000 to $74,999 | 1,186 (97.5%) | 30 (2.5%) |
| $75,000 to $99,999 | 470 (92.0%) | 41 (8.0%) |
| $100,000 and over | 8,947 (98.2%) | 168 (1.8%) |
Public vs Private Health Insurance Coverage by Age in Stony Point
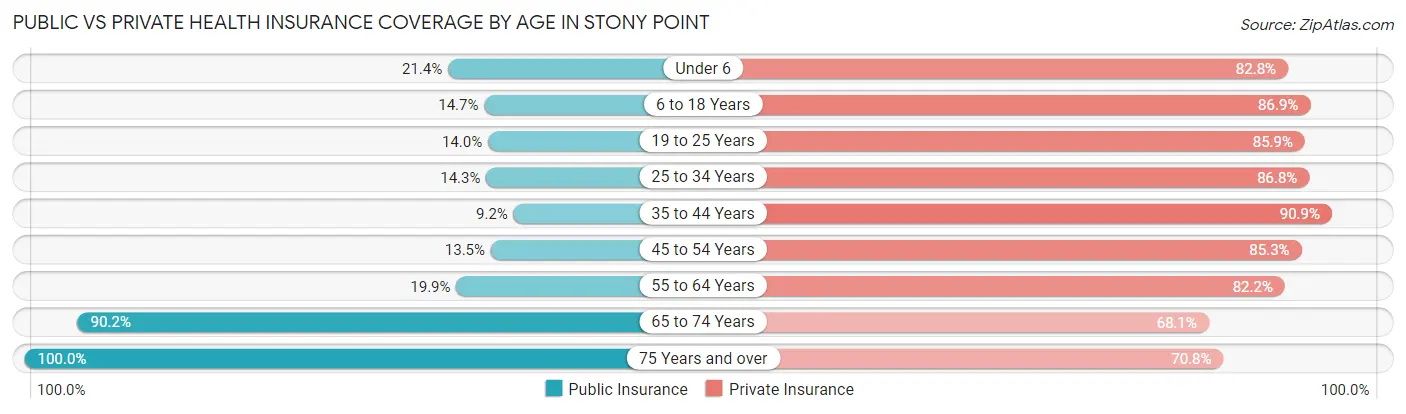
| Age Bracket | Public Insurance | Private Insurance |
| Under 6 | 173 (21.4%) | 669 (82.8%) |
| 6 to 18 Years | 275 (14.7%) | 1,630 (86.9%) |
| 19 to 25 Years | 160 (14.0%) | 983 (85.9%) |
| 25 to 34 Years | 150 (14.3%) | 910 (86.8%) |
| 35 to 44 Years | 119 (9.2%) | 1,174 (90.9%) |
| 45 to 54 Years | 239 (13.5%) | 1,515 (85.3%) |
| 55 to 64 Years | 422 (19.9%) | 1,747 (82.2%) |
| 65 to 74 Years | 981 (90.2%) | 741 (68.1%) |
| 75 Years and over | 1,360 (100.0%) | 963 (70.8%) |
| Total | 3,879 (31.0%) | 10,332 (82.6%) |
Disability Status by Sex by Age in Stony Point
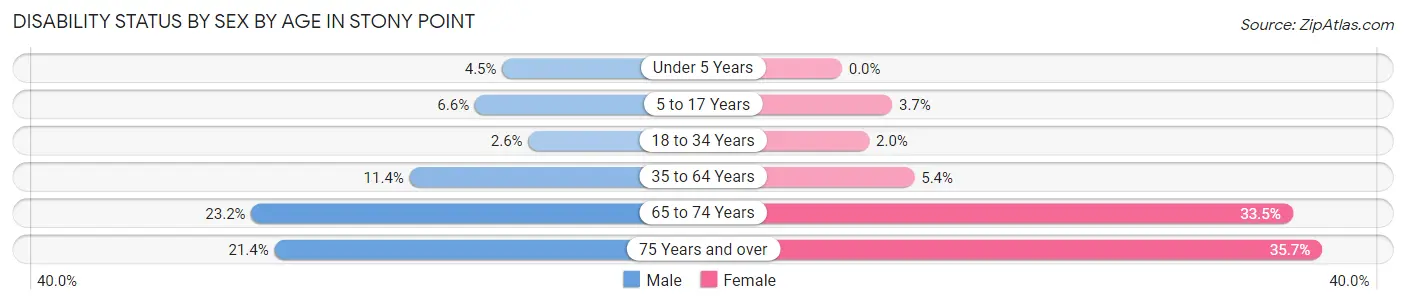
| Age Bracket | Male | Female |
| Under 5 Years | 15 (4.5%) | 0 (0.0%) |
| 5 to 17 Years | 72 (6.6%) | 31 (3.7%) |
| 18 to 34 Years | 35 (2.6%) | 19 (2.0%) |
| 35 to 64 Years | 287 (11.4%) | 144 (5.4%) |
| 65 to 74 Years | 126 (23.2%) | 182 (33.5%) |
| 75 Years and over | 116 (21.4%) | 292 (35.6%) |
Disability Class by Sex by Age in Stony Point
Disability Class: Hearing Difficulty
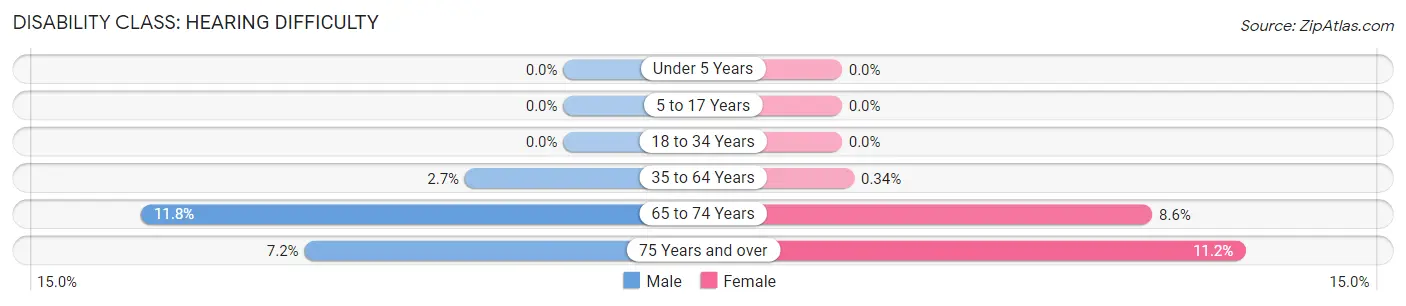
| Age Bracket | Male | Female |
| Under 5 Years | 0 (0.0%) | 0 (0.0%) |
| 5 to 17 Years | 0 (0.0%) | 0 (0.0%) |
| 18 to 34 Years | 0 (0.0%) | 0 (0.0%) |
| 35 to 64 Years | 69 (2.7%) | 9 (0.3%) |
| 65 to 74 Years | 64 (11.8%) | 47 (8.6%) |
| 75 Years and over | 39 (7.2%) | 92 (11.2%) |
Disability Class: Vision Difficulty
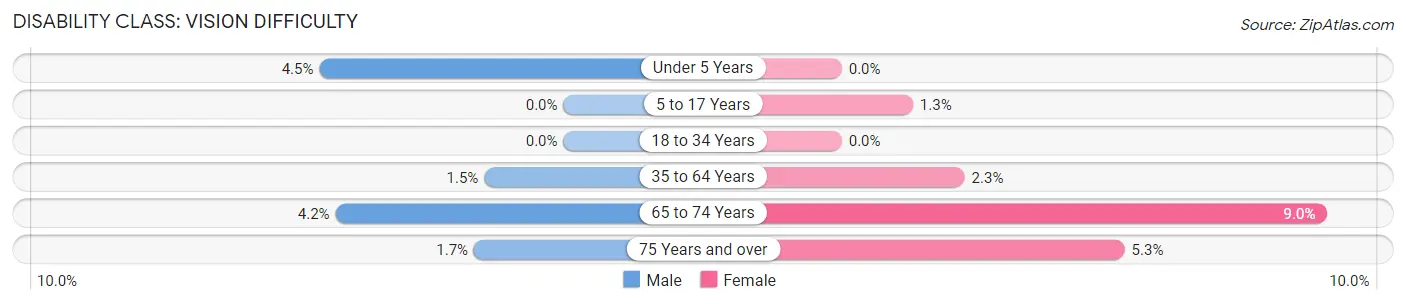
| Age Bracket | Male | Female |
| Under 5 Years | 15 (4.5%) | 0 (0.0%) |
| 5 to 17 Years | 0 (0.0%) | 11 (1.3%) |
| 18 to 34 Years | 0 (0.0%) | 0 (0.0%) |
| 35 to 64 Years | 37 (1.5%) | 61 (2.3%) |
| 65 to 74 Years | 23 (4.2%) | 49 (9.0%) |
| 75 Years and over | 9 (1.7%) | 43 (5.2%) |
Disability Class: Cognitive Difficulty
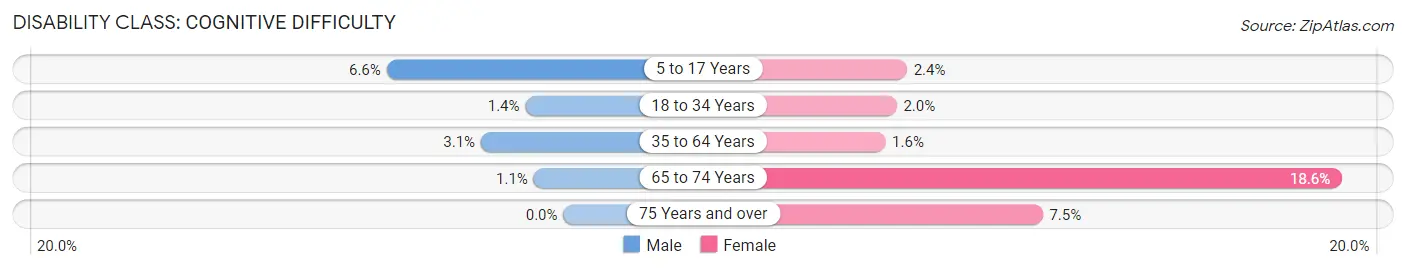
| Age Bracket | Male | Female |
| 5 to 17 Years | 72 (6.6%) | 20 (2.4%) |
| 18 to 34 Years | 19 (1.4%) | 19 (2.0%) |
| 35 to 64 Years | 77 (3.1%) | 43 (1.6%) |
| 65 to 74 Years | 6 (1.1%) | 101 (18.6%) |
| 75 Years and over | 0 (0.0%) | 61 (7.4%) |
Disability Class: Ambulatory Difficulty
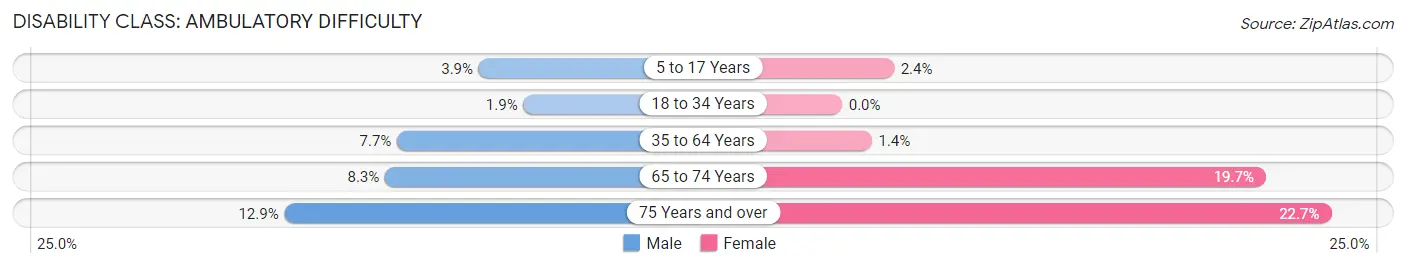
| Age Bracket | Male | Female |
| 5 to 17 Years | 43 (3.9%) | 20 (2.4%) |
| 18 to 34 Years | 25 (1.8%) | 0 (0.0%) |
| 35 to 64 Years | 194 (7.7%) | 37 (1.4%) |
| 65 to 74 Years | 45 (8.3%) | 107 (19.7%) |
| 75 Years and over | 70 (12.9%) | 186 (22.7%) |
Disability Class: Self-Care Difficulty
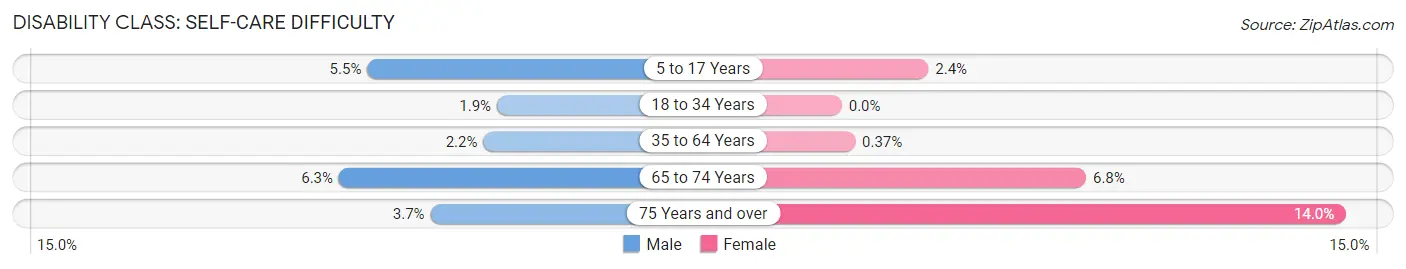
| Age Bracket | Male | Female |
| 5 to 17 Years | 60 (5.5%) | 20 (2.4%) |
| 18 to 34 Years | 25 (1.8%) | 0 (0.0%) |
| 35 to 64 Years | 56 (2.2%) | 10 (0.4%) |
| 65 to 74 Years | 34 (6.2%) | 37 (6.8%) |
| 75 Years and over | 20 (3.7%) | 115 (14.0%) |
Technology Access in Stony Point
Computing Device Access in Stony Point
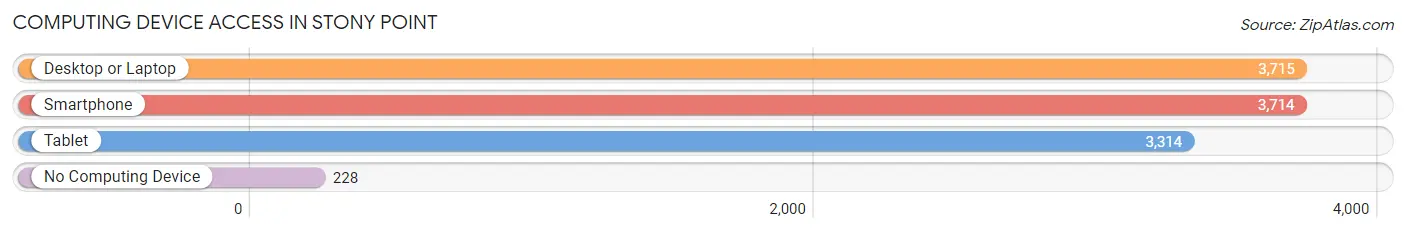
| Device Type | # Households | % Households |
| Desktop or Laptop | 3,715 | 85.1% |
| Smartphone | 3,714 | 85.1% |
| Tablet | 3,314 | 75.9% |
| No Computing Device | 228 | 5.2% |
| Total | 4,364 | 100.0% |
Internet Access in Stony Point
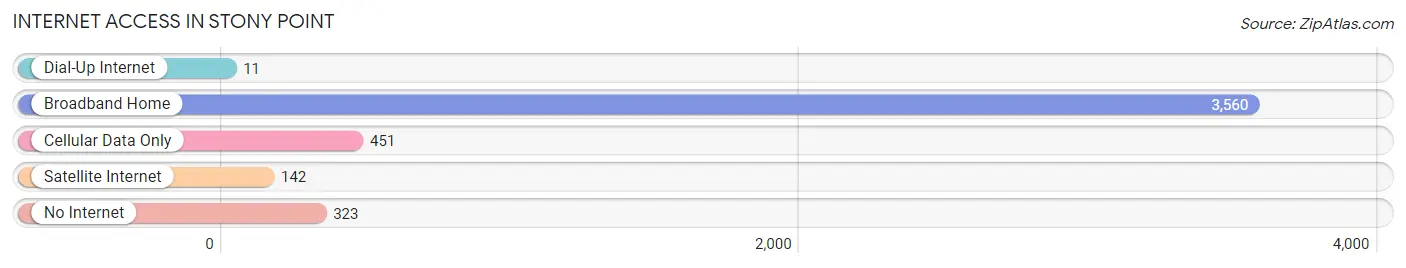
| Internet Type | # Households | % Households |
| Dial-Up Internet | 11 | 0.3% |
| Broadband Home | 3,560 | 81.6% |
| Cellular Data Only | 451 | 10.3% |
| Satellite Internet | 142 | 3.3% |
| No Internet | 323 | 7.4% |
| Total | 4,364 | 100.0% |
Stony Point Summary
Stony Point is a town located in Rockland County, New York, United States. It is part of the New York metropolitan area and is located approximately 30 miles north of New York City. The town is situated on the west bank of the Hudson River and is bordered by the towns of Haverstraw, Clarkstown, and Ramapo. As of the 2010 census, the town had a population of 15,059.
History
The area that is now Stony Point was originally inhabited by the Munsee people, a branch of the Lenape Native Americans. The first European settlers arrived in the area in the late 17th century, and the town was officially established in 1779. During the Revolutionary War, the town was the site of the Battle of Stony Point, a major victory for the Continental Army.
Geography
Stony Point is located in southeastern Rockland County, on the west bank of the Hudson River. It is bordered by the towns of Haverstraw to the north, Clarkstown to the east, and Ramapo to the south and west. The town covers an area of 8.3 square miles, of which 7.9 square miles is land and 0.4 square miles is water.
The town is located in the Hudson Valley region of New York and is part of the New York metropolitan area. The terrain is mostly hilly, with elevations ranging from sea level to over 500 feet. The highest point in the town is the summit of Stony Point Mountain, which has an elevation of 545 feet.
Economy
The economy of Stony Point is largely based on tourism and retail. The town is home to several popular tourist attractions, including the Stony Point Battlefield State Historic Site, the Stony Point Lighthouse, and the Stony Point Seaport. The town is also home to several retail stores, restaurants, and other businesses.
Demographics
As of the 2010 census, there were 15,059 people, 5,541 households, and 4,072 families residing in the town. The population density was 1,902.3 people per square mile. The racial makeup of the town was 87.2% White, 5.3% African American, 0.3% Native American, 2.2% Asian, 0.1% Pacific Islander, 2.7% from other races, and 2.3% from two or more races. Hispanic or Latino of any race were 8.7% of the population.
The median income for a household in the town was $76,945, and the median income for a family was $90,945. The per capita income for the town was $32,945. About 4.2% of families and 5.7% of the population were below the poverty line, including 6.3% of those under age 18 and 5.2% of those age 65 or over.
Common Questions
What is Per Capita Income in Stony Point?
Per Capita income in Stony Point is $49,448.
What is the Median Family Income in Stony Point?
Median Family Income in Stony Point is $157,842.
What is the Median Household income in Stony Point?
Median Household Income in Stony Point is $124,881.
What is Income or Wage Gap in Stony Point?
Income or Wage Gap in Stony Point is 21.8%.
Women in Stony Point earn 78.2 cents for every dollar earned by a man.
What is Inequality or Gini Index in Stony Point?
Inequality or Gini Index in Stony Point is 0.38.
What is the Total Population of Stony Point?
Total Population of Stony Point is 12,533.
What is the Total Male Population of Stony Point?
Total Male Population of Stony Point is 6,381.
What is the Total Female Population of Stony Point?
Total Female Population of Stony Point is 6,152.
What is the Ratio of Males per 100 Females in Stony Point?
There are 103.72 Males per 100 Females in Stony Point.
What is the Ratio of Females per 100 Males in Stony Point?
There are 96.41 Females per 100 Males in Stony Point.
What is the Median Population Age in Stony Point?
Median Population Age in Stony Point is 45.4 Years.
What is the Average Family Size in Stony Point
Average Family Size in Stony Point is 3.4 People.
What is the Average Household Size in Stony Point
Average Household Size in Stony Point is 2.9 People.
How Large is the Labor Force in Stony Point?
There are 6,588 People in the Labor Forcein in Stony Point.
What is the Percentage of People in the Labor Force in Stony Point?
63.7% of People are in the Labor Force in Stony Point.
What is the Unemployment Rate in Stony Point?
Unemployment Rate in Stony Point is 6.2%.