Airmont, NY Map & Demographics
Airmont Map
Airmont Overview
$38,382
PER CAPITA INCOME
$116,050
AVG FAMILY INCOME
$101,612
AVG HOUSEHOLD INCOME
28.4%
WAGE / INCOME GAP [ % ]
71.6¢/ $1
WAGE / INCOME GAP [ $ ]
$9,445
FAMILY INCOME DEFICIT
0.45
INEQUALITY / GINI INDEX
10,020
TOTAL POPULATION
4,697
MALE POPULATION
5,323
FEMALE POPULATION
88.24
MALES / 100 FEMALES
113.33
FEMALES / 100 MALES
28.8
MEDIAN AGE
4.2
AVG FAMILY SIZE
3.7
AVG HOUSEHOLD SIZE
3,748
LABOR FORCE [ PEOPLE ]
53.2%
PERCENT IN LABOR FORCE
7.3%
UNEMPLOYMENT RATE
Airmont Area Codes
Income in Airmont
Income Overview in Airmont
Per Capita Income in Airmont is $38,382, while median incomes of families and households are $116,050 and $101,612 respectively.
| Characteristic | Number | Measure |
| Per Capita Income | 10,020 | $38,382 |
| Median Family Income | 2,164 | $116,050 |
| Mean Family Income | 2,164 | $155,112 |
| Median Household Income | 2,635 | $101,612 |
| Mean Household Income | 2,635 | $142,772 |
| Income Deficit | 2,164 | $9,445 |
| Wage / Income Gap (%) | 10,020 | 28.38% |
| Wage / Income Gap ($) | 10,020 | 71.62¢ per $1 |
| Gini / Inequality Index | 10,020 | 0.45 |
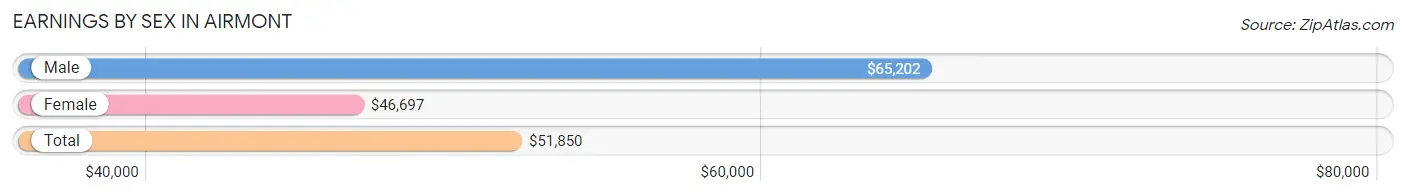
Earnings by Sex in Airmont
Average Earnings in Airmont are $51,850, $65,202 for men and $46,697 for women, a difference of 28.4%.
| Sex | Number | Average Earnings |
| Male | 2,034 (53.5%) | $65,202 |
| Female | 1,771 (46.5%) | $46,697 |
| Total | 3,805 (100.0%) | $51,850 |
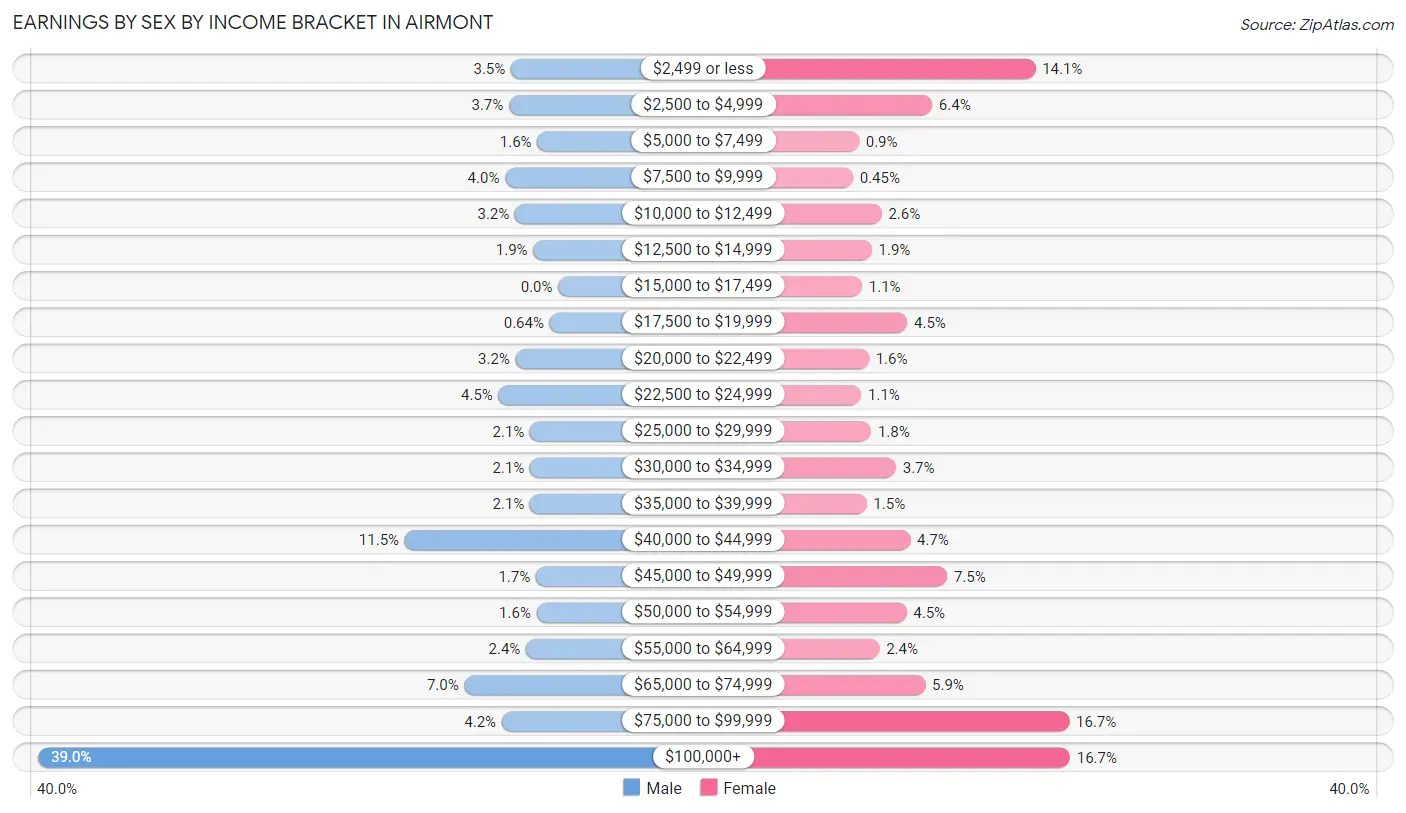
Earnings by Sex by Income Bracket in Airmont
The most common earnings brackets in Airmont are $100,000+ for men (793 | 39.0%) and $100,000+ for women (296 | 16.7%).
| Income | Male | Female |
| $2,499 or less | 72 (3.5%) | 250 (14.1%) |
| $2,500 to $4,999 | 75 (3.7%) | 113 (6.4%) |
| $5,000 to $7,499 | 32 (1.6%) | 16 (0.9%) |
| $7,500 to $9,999 | 81 (4.0%) | 8 (0.4%) |
| $10,000 to $12,499 | 66 (3.2%) | 46 (2.6%) |
| $12,500 to $14,999 | 38 (1.9%) | 33 (1.9%) |
| $15,000 to $17,499 | 0 (0.0%) | 20 (1.1%) |
| $17,500 to $19,999 | 13 (0.6%) | 80 (4.5%) |
| $20,000 to $22,499 | 65 (3.2%) | 29 (1.6%) |
| $22,500 to $24,999 | 91 (4.5%) | 19 (1.1%) |
| $25,000 to $29,999 | 43 (2.1%) | 32 (1.8%) |
| $30,000 to $34,999 | 43 (2.1%) | 65 (3.7%) |
| $35,000 to $39,999 | 43 (2.1%) | 26 (1.5%) |
| $40,000 to $44,999 | 234 (11.5%) | 84 (4.7%) |
| $45,000 to $49,999 | 34 (1.7%) | 133 (7.5%) |
| $50,000 to $54,999 | 33 (1.6%) | 79 (4.5%) |
| $55,000 to $64,999 | 49 (2.4%) | 43 (2.4%) |
| $65,000 to $74,999 | 143 (7.0%) | 104 (5.9%) |
| $75,000 to $99,999 | 86 (4.2%) | 295 (16.7%) |
| $100,000+ | 793 (39.0%) | 296 (16.7%) |
| Total | 2,034 (100.0%) | 1,771 (100.0%) |
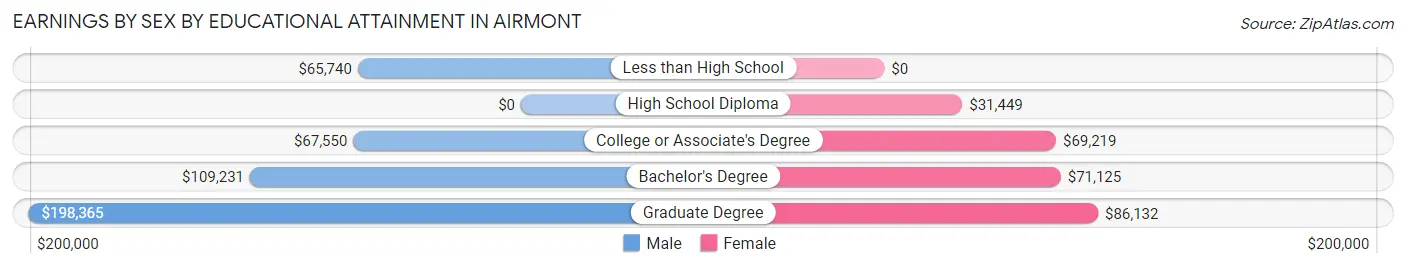
Earnings by Sex by Educational Attainment in Airmont
Average earnings in Airmont are $72,731 for men and $60,000 for women, a difference of 17.5%. Men with an educational attainment of graduate degree enjoy the highest average annual earnings of $198,365, while those with less than high school education earn the least with $65,740. Women with an educational attainment of graduate degree earn the most with the average annual earnings of $86,132, while those with high school diploma education have the smallest earnings of $31,449.
| Educational Attainment | Male Income | Female Income |
| Less than High School | $65,740 | $0 |
| High School Diploma | - | - |
| College or Associate's Degree | $67,550 | $69,219 |
| Bachelor's Degree | $109,231 | $71,125 |
| Graduate Degree | $198,365 | $86,132 |
| Total | $72,731 | $60,000 |
Family Income in Airmont
Family Income Brackets in Airmont
According to the Airmont family income data, there are 677 families falling into the $200,000+ income range, which is the most common income bracket and makes up 31.3% of all families.
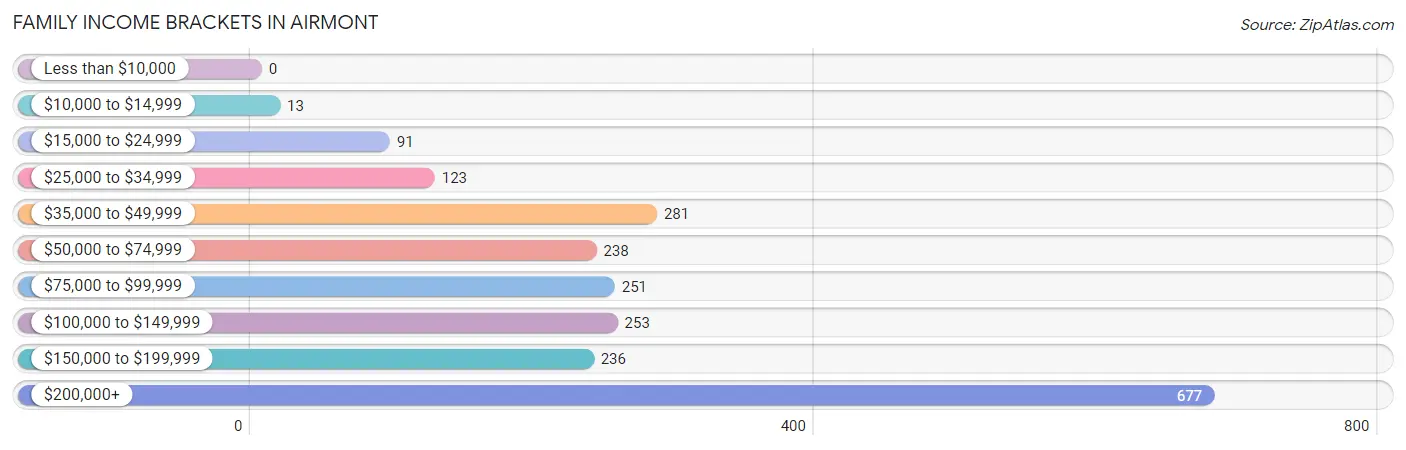
| Income Bracket | # Families | % Families |
| Less than $10,000 | 0 | 0.0% |
| $10,000 to $14,999 | 13 | 0.6% |
| $15,000 to $24,999 | 91 | 4.2% |
| $25,000 to $34,999 | 123 | 5.7% |
| $35,000 to $49,999 | 281 | 13.0% |
| $50,000 to $74,999 | 238 | 11.0% |
| $75,000 to $99,999 | 251 | 11.6% |
| $100,000 to $149,999 | 253 | 11.7% |
| $150,000 to $199,999 | 236 | 10.9% |
| $200,000+ | 677 | 31.3% |
Family Income by Famaliy Size in Airmont
4-person families (426 | 19.7%) account for the highest median family income in Airmont with $206,197 per family, while 3-person families (415 | 19.2%) have the highest median income of $63,260 per family member.
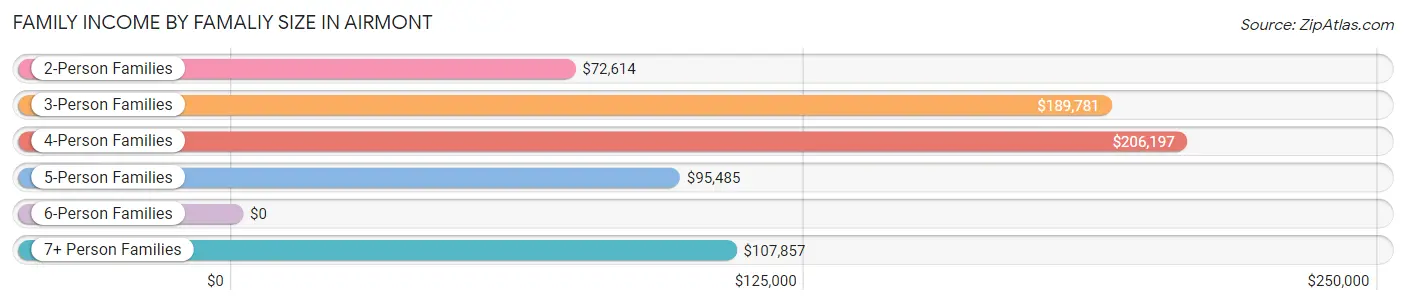
| Income Bracket | # Families | Median Income |
| 2-Person Families | 603 (27.9%) | $72,614 |
| 3-Person Families | 415 (19.2%) | $189,781 |
| 4-Person Families | 426 (19.7%) | $206,197 |
| 5-Person Families | 255 (11.8%) | $95,485 |
| 6-Person Families | 223 (10.3%) | $0 |
| 7+ Person Families | 242 (11.2%) | $107,857 |
| Total | 2,164 (100.0%) | $116,050 |
Family Income by Number of Earners in Airmont
The median family income in Airmont is $116,050, with families comprising 2 earners (778) having the highest median family income of $205,231, while families with no earners (283) have the lowest median family income of $51,696, accounting for 35.9% and 13.1% of families, respectively.
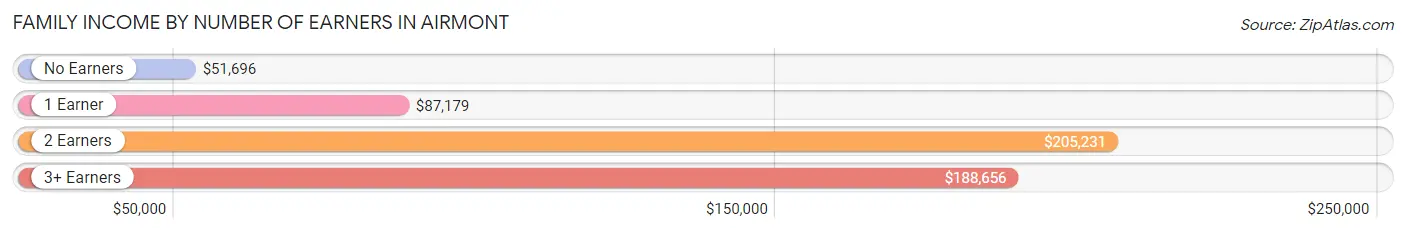
| Number of Earners | # Families | Median Income |
| No Earners | 283 (13.1%) | $51,696 |
| 1 Earner | 750 (34.7%) | $87,179 |
| 2 Earners | 778 (35.9%) | $205,231 |
| 3+ Earners | 353 (16.3%) | $188,656 |
| Total | 2,164 (100.0%) | $116,050 |
Household Income in Airmont
Household Income Brackets in Airmont
With 714 households falling in the category, the $200,000+ income range is the most frequent in Airmont, accounting for 27.1% of all households. In contrast, only 13 households (0.5%) fall into the $10,000 to $14,999 income bracket, making it the least populous group.
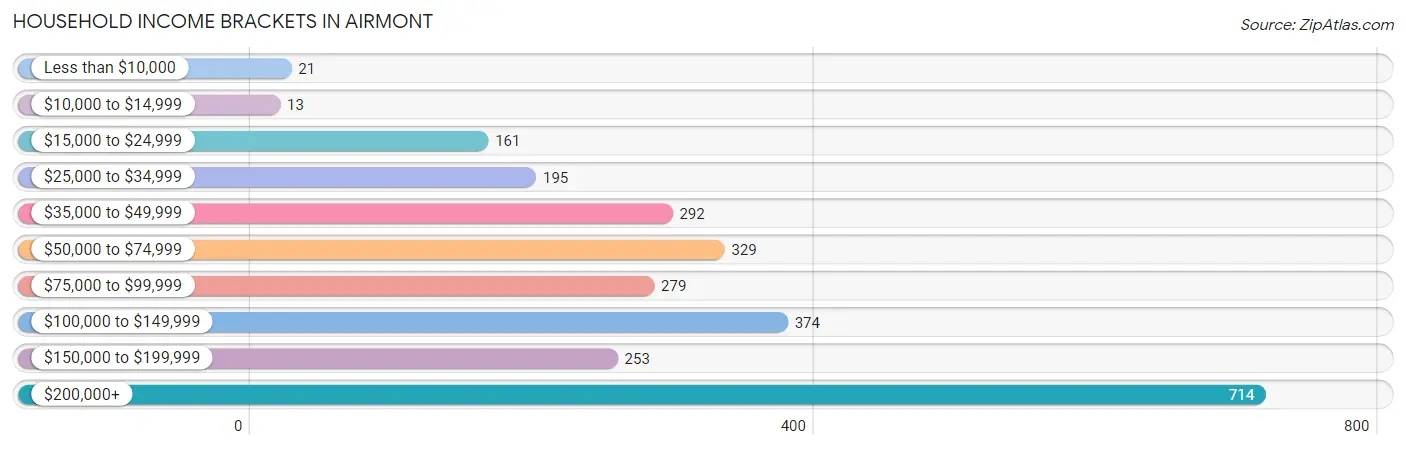
| Income Bracket | # Households | % Households |
| Less than $10,000 | 21 | 0.8% |
| $10,000 to $14,999 | 13 | 0.5% |
| $15,000 to $24,999 | 161 | 6.1% |
| $25,000 to $34,999 | 195 | 7.4% |
| $35,000 to $49,999 | 292 | 11.1% |
| $50,000 to $74,999 | 329 | 12.5% |
| $75,000 to $99,999 | 279 | 10.6% |
| $100,000 to $149,999 | 374 | 14.2% |
| $150,000 to $199,999 | 253 | 9.6% |
| $200,000+ | 714 | 27.1% |
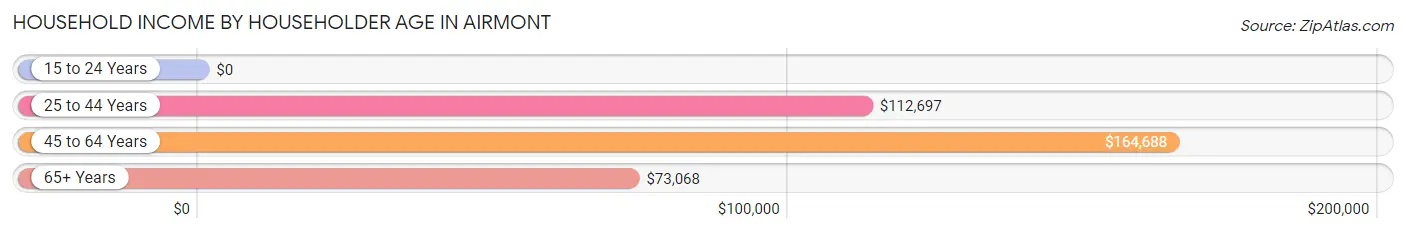
Household Income by Householder Age in Airmont
The median household income in Airmont is $101,612, with the highest median household income of $164,688 found in the 45 to 64 years age bracket for the primary householder. A total of 969 households (36.8%) fall into this category. Meanwhile, the 15 to 24 years age bracket for the primary householder has the lowest median household income of $0, with 24 households (0.9%) in this group.
| Income Bracket | # Households | Median Income |
| 15 to 24 Years | 24 (0.9%) | $0 |
| 25 to 44 Years | 735 (27.9%) | $112,697 |
| 45 to 64 Years | 969 (36.8%) | $164,688 |
| 65+ Years | 907 (34.4%) | $73,068 |
| Total | 2,635 (100.0%) | $101,612 |
Poverty in Airmont
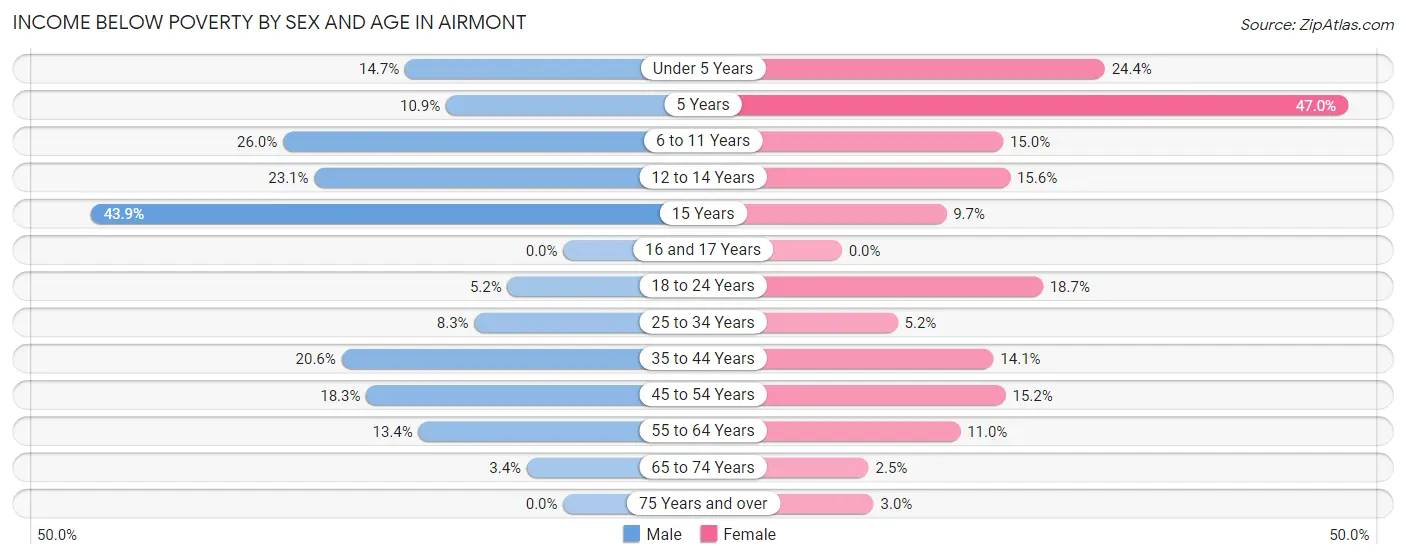
Income Below Poverty by Sex and Age in Airmont
With 13.4% poverty level for males and 12.4% for females among the residents of Airmont, 15 year old males and 5 year old females are the most vulnerable to poverty, with 25 males (43.9%) and 31 females (47.0%) in their respective age groups living below the poverty level.
| Age Bracket | Male | Female |
| Under 5 Years | 42 (14.7%) | 102 (24.4%) |
| 5 Years | 11 (10.9%) | 31 (47.0%) |
| 6 to 11 Years | 167 (26.0%) | 86 (15.0%) |
| 12 to 14 Years | 52 (23.1%) | 54 (15.6%) |
| 15 Years | 25 (43.9%) | 25 (9.7%) |
| 16 and 17 Years | 0 (0.0%) | 0 (0.0%) |
| 18 to 24 Years | 31 (5.2%) | 102 (18.6%) |
| 25 to 34 Years | 52 (8.3%) | 28 (5.2%) |
| 35 to 44 Years | 71 (20.6%) | 75 (14.1%) |
| 45 to 54 Years | 107 (18.3%) | 83 (15.2%) |
| 55 to 64 Years | 47 (13.4%) | 41 (11.0%) |
| 65 to 74 Years | 11 (3.4%) | 12 (2.5%) |
| 75 Years and over | 0 (0.0%) | 13 (2.9%) |
| Total | 616 (13.4%) | 652 (12.4%) |
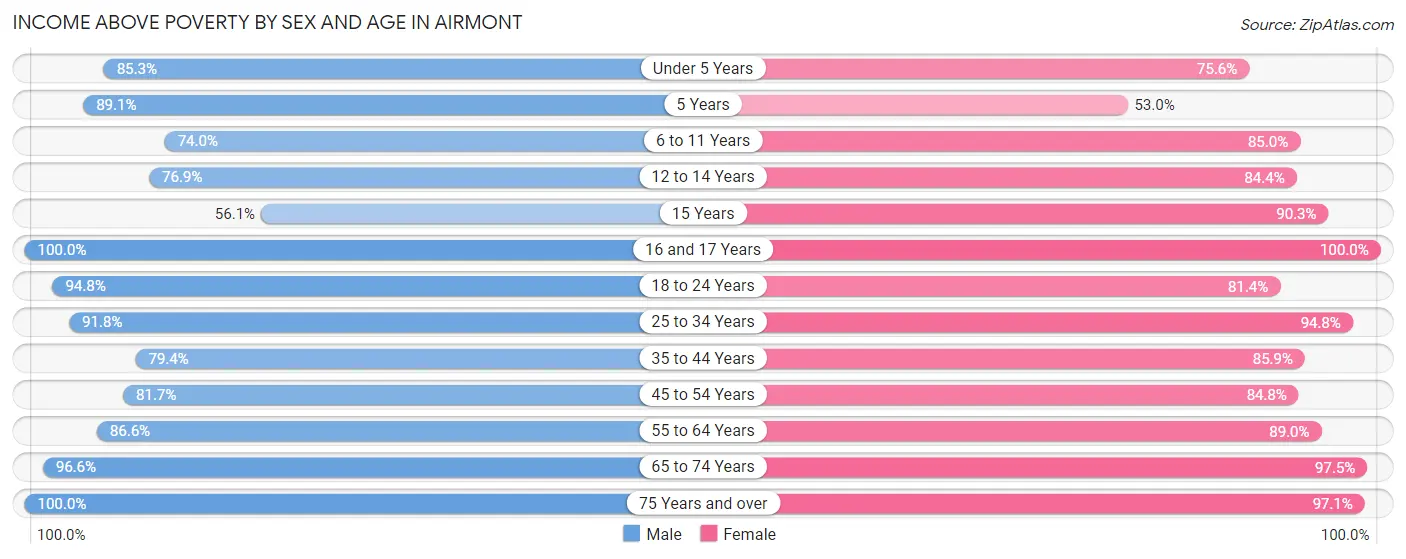
Income Above Poverty by Sex and Age in Airmont
According to the poverty statistics in Airmont, males aged 16 and 17 years and females aged 16 and 17 years are the age groups that are most secure financially, with 100.0% of males and 100.0% of females in these age groups living above the poverty line.
| Age Bracket | Male | Female |
| Under 5 Years | 244 (85.3%) | 316 (75.6%) |
| 5 Years | 90 (89.1%) | 35 (53.0%) |
| 6 to 11 Years | 475 (74.0%) | 489 (85.0%) |
| 12 to 14 Years | 173 (76.9%) | 292 (84.4%) |
| 15 Years | 32 (56.1%) | 233 (90.3%) |
| 16 and 17 Years | 204 (100.0%) | 135 (100.0%) |
| 18 to 24 Years | 567 (94.8%) | 445 (81.4%) |
| 25 to 34 Years | 578 (91.7%) | 513 (94.8%) |
| 35 to 44 Years | 274 (79.4%) | 458 (85.9%) |
| 45 to 54 Years | 478 (81.7%) | 463 (84.8%) |
| 55 to 64 Years | 303 (86.6%) | 332 (89.0%) |
| 65 to 74 Years | 314 (96.6%) | 470 (97.5%) |
| 75 Years and over | 263 (100.0%) | 427 (97.1%) |
| Total | 3,995 (86.6%) | 4,608 (87.6%) |
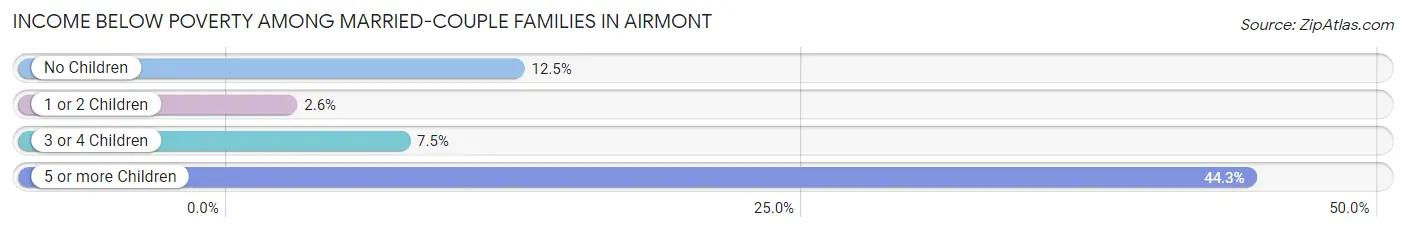
Income Below Poverty Among Married-Couple Families in Airmont
The poverty statistics for married-couple families in Airmont show that 12.1% or 221 of the total 1,832 families live below the poverty line. Families with 5 or more children have the highest poverty rate of 44.3%, comprising of 82 families. On the other hand, families with 1 or 2 children have the lowest poverty rate of 2.6%, which includes 13 families.
| Children | Above Poverty | Below Poverty |
| No Children | 709 (87.5%) | 101 (12.5%) |
| 1 or 2 Children | 490 (97.4%) | 13 (2.6%) |
| 3 or 4 Children | 309 (92.5%) | 25 (7.5%) |
| 5 or more Children | 103 (55.7%) | 82 (44.3%) |
| Total | 1,611 (87.9%) | 221 (12.1%) |
Income Below Poverty Among Single-Parent Households in Airmont
| Children | Single Father | Single Mother |
| No Children | 0 (0.0%) | 0 (0.0%) |
| 1 or 2 Children | 0 (0.0%) | 0 (0.0%) |
| 3 or 4 Children | 0 (0.0%) | 0 (0.0%) |
| 5 or more Children | 0 (0.0%) | 0 (0.0%) |
| Total | 0 (0.0%) | 0 (0.0%) |
Income Below Poverty Among Married-Couple vs Single-Parent Households in Airmont
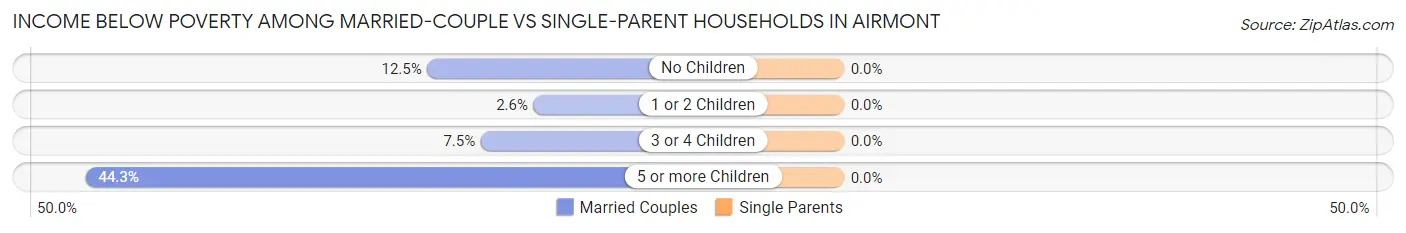
| Children | Married-Couple Families | Single-Parent Households |
| No Children | 101 (12.5%) | 0 (0.0%) |
| 1 or 2 Children | 13 (2.6%) | 0 (0.0%) |
| 3 or 4 Children | 25 (7.5%) | 0 (0.0%) |
| 5 or more Children | 82 (44.3%) | 0 (0.0%) |
| Total | 221 (12.1%) | 0 (0.0%) |
Race in Airmont
The most populous races in Airmont are White / Caucasian (8,140 | 81.2%), Hispanic or Latino (1,404 | 14.0%), and Two or more Races (652 | 6.5%).
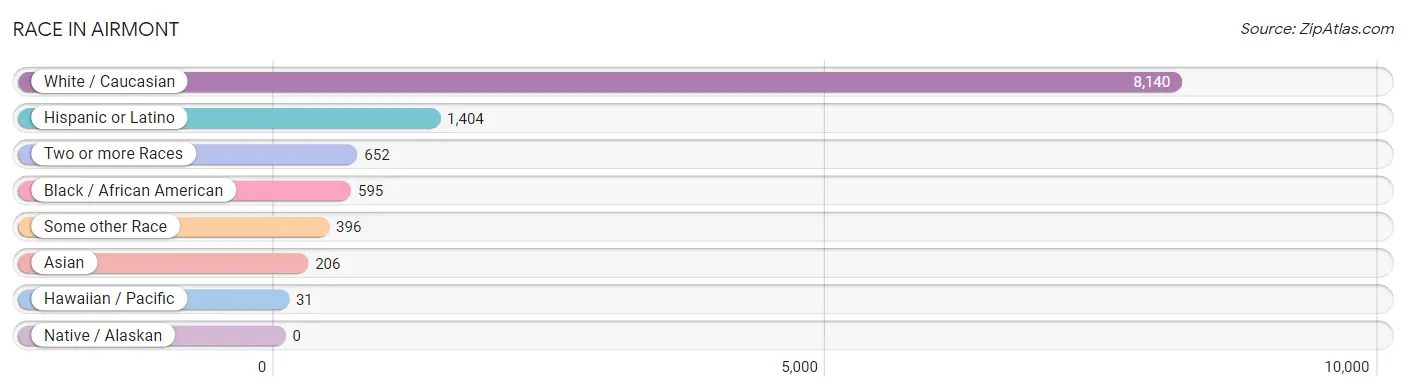
| Race | # Population | % Population |
| Asian | 206 | 2.1% |
| Black / African American | 595 | 5.9% |
| Hawaiian / Pacific | 31 | 0.3% |
| Hispanic or Latino | 1,404 | 14.0% |
| Native / Alaskan | 0 | 0.0% |
| White / Caucasian | 8,140 | 81.2% |
| Two or more Races | 652 | 6.5% |
| Some other Race | 396 | 4.0% |
| Total | 10,020 | 100.0% |
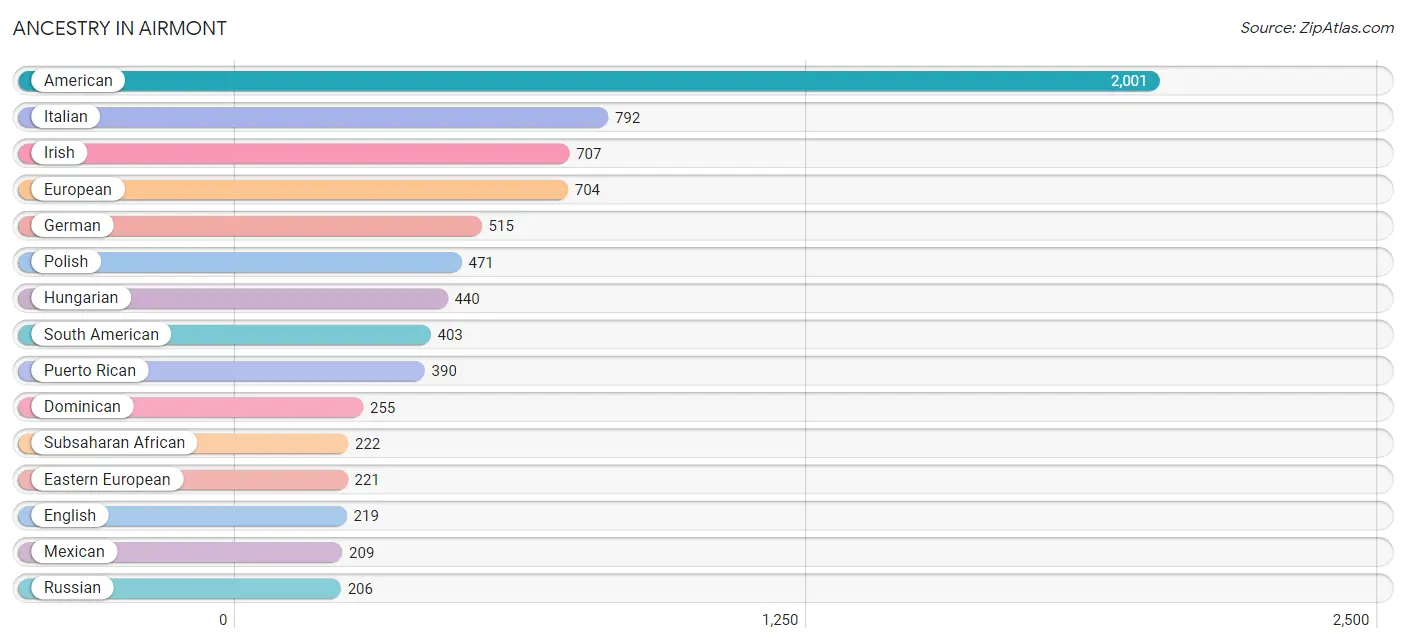
Ancestry in Airmont
The most populous ancestries reported in Airmont are American (2,001 | 20.0%), Italian (792 | 7.9%), Irish (707 | 7.1%), European (704 | 7.0%), and German (515 | 5.1%), together accounting for 47.1% of all Airmont residents.
| Ancestry | # Population | % Population |
| African | 44 | 0.4% |
| American | 2,001 | 20.0% |
| Argentinean | 34 | 0.3% |
| Austrian | 50 | 0.5% |
| British | 4 | 0.0% |
| Burmese | 9 | 0.1% |
| Canadian | 55 | 0.5% |
| Central American | 54 | 0.5% |
| Colombian | 49 | 0.5% |
| Croatian | 7 | 0.1% |
| Cuban | 33 | 0.3% |
| Czech | 9 | 0.1% |
| Czechoslovakian | 27 | 0.3% |
| Danish | 16 | 0.2% |
| Dominican | 255 | 2.5% |
| Dutch | 69 | 0.7% |
| Eastern European | 221 | 2.2% |
| Ecuadorian | 134 | 1.3% |
| English | 219 | 2.2% |
| European | 704 | 7.0% |
| French | 27 | 0.3% |
| French Canadian | 88 | 0.9% |
| German | 515 | 5.1% |
| Greek | 152 | 1.5% |
| Guatemalan | 46 | 0.5% |
| Haitian | 50 | 0.5% |
| Hungarian | 440 | 4.4% |
| Indian (Asian) | 2 | 0.0% |
| Irish | 707 | 7.1% |
| Israeli | 192 | 1.9% |
| Italian | 792 | 7.9% |
| Jamaican | 8 | 0.1% |
| Japanese | 54 | 0.5% |
| Korean | 96 | 1.0% |
| Latvian | 32 | 0.3% |
| Lithuanian | 100 | 1.0% |
| Mexican | 209 | 2.1% |
| Native Hawaiian | 31 | 0.3% |
| Norwegian | 45 | 0.4% |
| Panamanian | 8 | 0.1% |
| Peruvian | 186 | 1.9% |
| Polish | 471 | 4.7% |
| Portuguese | 16 | 0.2% |
| Puerto Rican | 390 | 3.9% |
| Romanian | 138 | 1.4% |
| Russian | 206 | 2.1% |
| Samoan | 8 | 0.1% |
| Scotch-Irish | 9 | 0.1% |
| Scottish | 41 | 0.4% |
| Slovak | 37 | 0.4% |
| South American | 403 | 4.0% |
| Spanish | 33 | 0.3% |
| Subsaharan African | 222 | 2.2% |
| Swedish | 13 | 0.1% |
| Thai | 58 | 0.6% |
| Ukrainian | 34 | 0.3% |
| Welsh | 27 | 0.3% |
| West Indian | 14 | 0.1% | View All 58 Rows |
Immigrants in Airmont
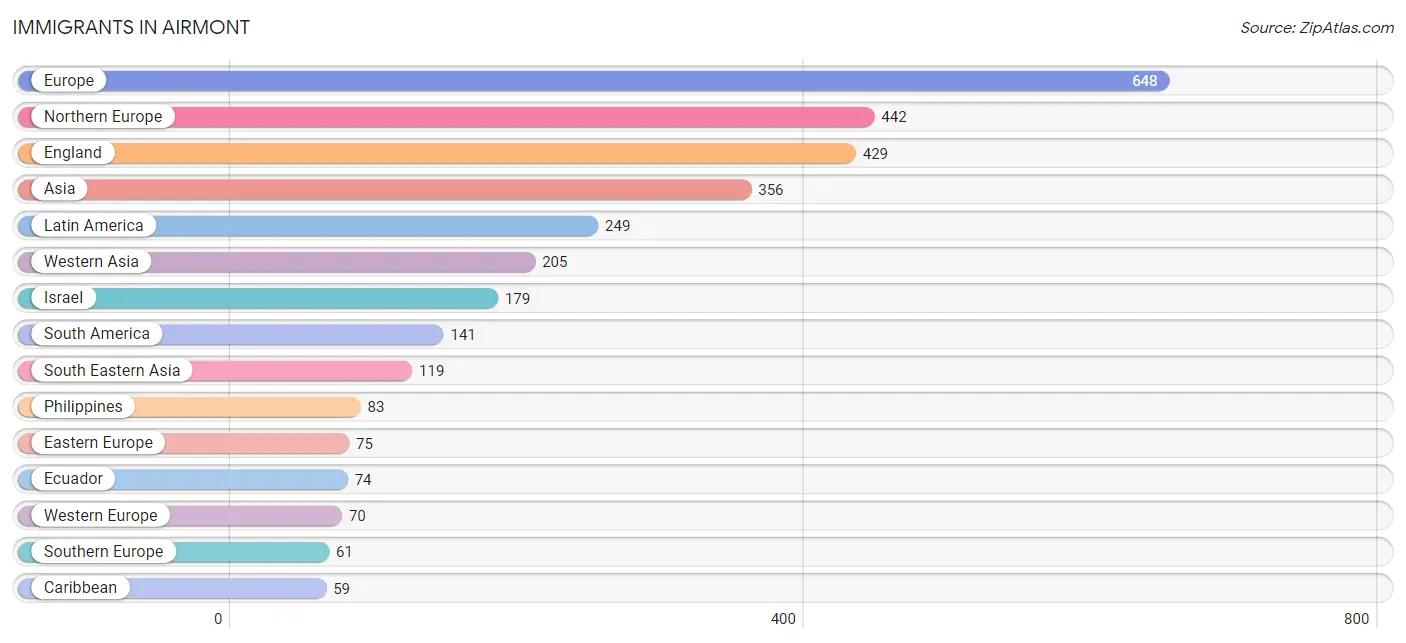
The most numerous immigrant groups reported in Airmont came from Europe (648 | 6.5%), Northern Europe (442 | 4.4%), England (429 | 4.3%), Asia (356 | 3.5%), and Latin America (249 | 2.5%), together accounting for 21.2% of all Airmont residents.
| Immigration Origin | # Population | % Population |
| Africa | 44 | 0.4% |
| Argentina | 25 | 0.3% |
| Asia | 356 | 3.5% |
| Australia | 8 | 0.1% |
| Austria | 25 | 0.3% |
| Cambodia | 36 | 0.4% |
| Canada | 9 | 0.1% |
| Caribbean | 59 | 0.6% |
| Central America | 49 | 0.5% |
| Colombia | 42 | 0.4% |
| Croatia | 7 | 0.1% |
| Cuba | 16 | 0.2% |
| Dominican Republic | 4 | 0.0% |
| Eastern Africa | 44 | 0.4% |
| Eastern Europe | 75 | 0.7% |
| Ecuador | 74 | 0.7% |
| England | 429 | 4.3% |
| Europe | 648 | 6.5% |
| France | 14 | 0.1% |
| Germany | 31 | 0.3% |
| Greece | 41 | 0.4% |
| Haiti | 31 | 0.3% |
| India | 32 | 0.3% |
| Ireland | 13 | 0.1% |
| Israel | 179 | 1.8% |
| Italy | 20 | 0.2% |
| Jamaica | 8 | 0.1% |
| Latin America | 249 | 2.5% |
| Mexico | 49 | 0.5% |
| Northern Europe | 442 | 4.4% |
| Oceania | 8 | 0.1% |
| Philippines | 83 | 0.8% |
| Poland | 5 | 0.1% |
| Romania | 26 | 0.3% |
| Russia | 25 | 0.3% |
| Saudi Arabia | 26 | 0.3% |
| South America | 141 | 1.4% |
| South Central Asia | 32 | 0.3% |
| South Eastern Asia | 119 | 1.2% |
| Southern Europe | 61 | 0.6% |
| Ukraine | 12 | 0.1% |
| Western Asia | 205 | 2.1% |
| Western Europe | 70 | 0.7% | View All 43 Rows |
Sex and Age in Airmont
Sex and Age in Airmont
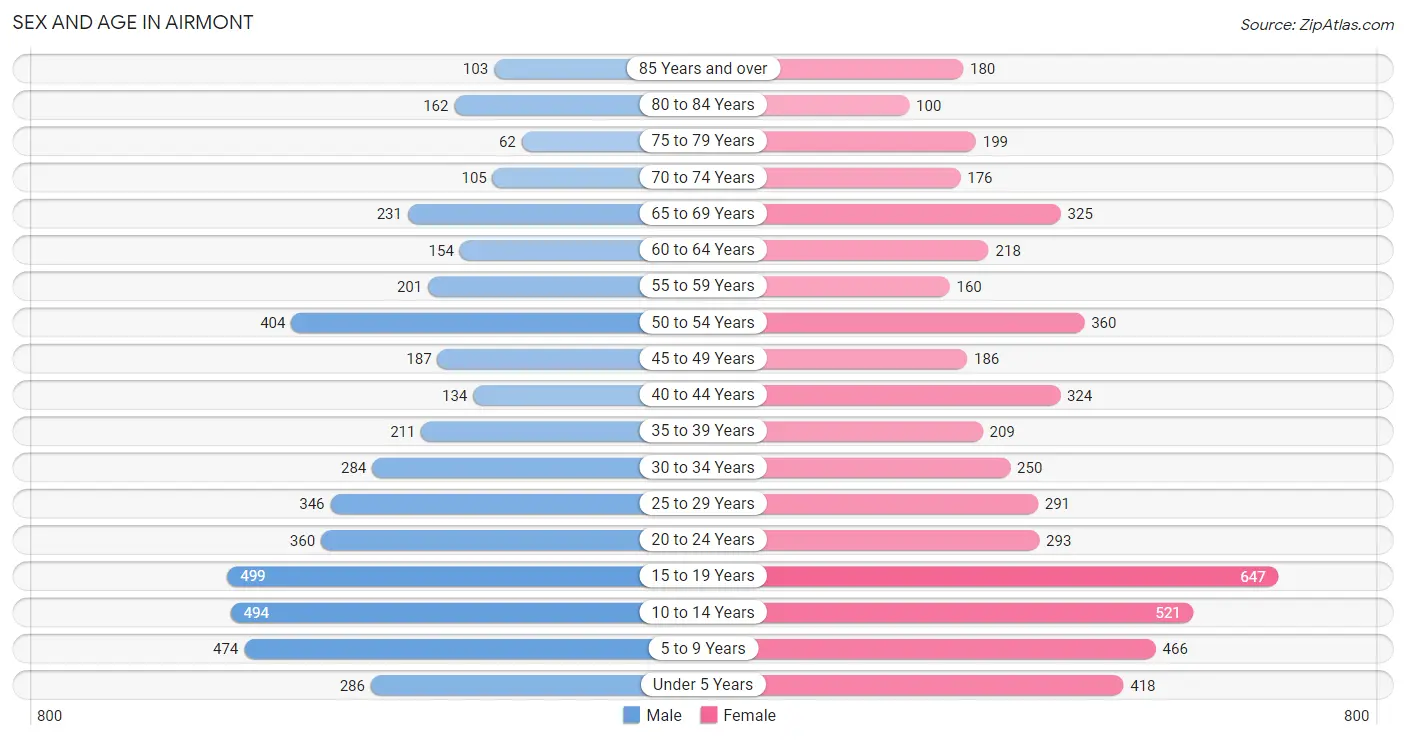
The most populous age groups in Airmont are 15 to 19 Years (499 | 10.6%) for men and 15 to 19 Years (647 | 12.1%) for women.
| Age Bracket | Male | Female |
| Under 5 Years | 286 (6.1%) | 418 (7.9%) |
| 5 to 9 Years | 474 (10.1%) | 466 (8.7%) |
| 10 to 14 Years | 494 (10.5%) | 521 (9.8%) |
| 15 to 19 Years | 499 (10.6%) | 647 (12.1%) |
| 20 to 24 Years | 360 (7.7%) | 293 (5.5%) |
| 25 to 29 Years | 346 (7.4%) | 291 (5.5%) |
| 30 to 34 Years | 284 (6.0%) | 250 (4.7%) |
| 35 to 39 Years | 211 (4.5%) | 209 (3.9%) |
| 40 to 44 Years | 134 (2.9%) | 324 (6.1%) |
| 45 to 49 Years | 187 (4.0%) | 186 (3.5%) |
| 50 to 54 Years | 404 (8.6%) | 360 (6.8%) |
| 55 to 59 Years | 201 (4.3%) | 160 (3.0%) |
| 60 to 64 Years | 154 (3.3%) | 218 (4.1%) |
| 65 to 69 Years | 231 (4.9%) | 325 (6.1%) |
| 70 to 74 Years | 105 (2.2%) | 176 (3.3%) |
| 75 to 79 Years | 62 (1.3%) | 199 (3.7%) |
| 80 to 84 Years | 162 (3.5%) | 100 (1.9%) |
| 85 Years and over | 103 (2.2%) | 180 (3.4%) |
| Total | 4,697 (100.0%) | 5,323 (100.0%) |
Families and Households in Airmont
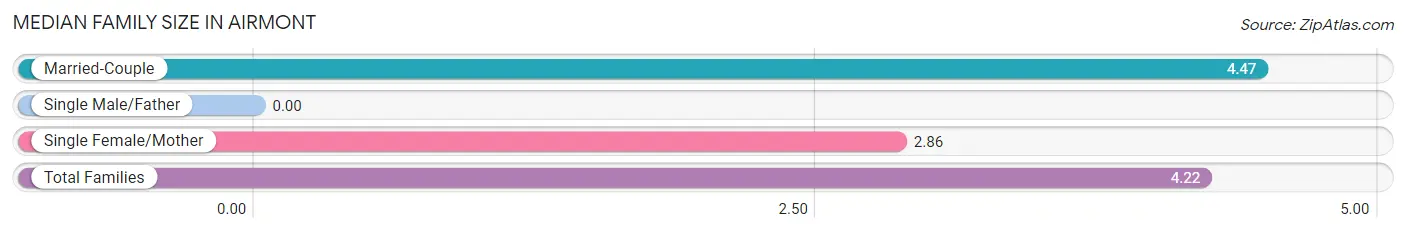
Median Family Size in Airmont
| Family Type | # Families | Family Size |
| Married-Couple | 1,832 (84.7%) | 4.47 |
| Single Male/Father | 0 (0.0%) | - |
| Single Female/Mother | 332 (15.3%) | 2.86 |
| Total Families | 2,164 (100.0%) | 4.22 |
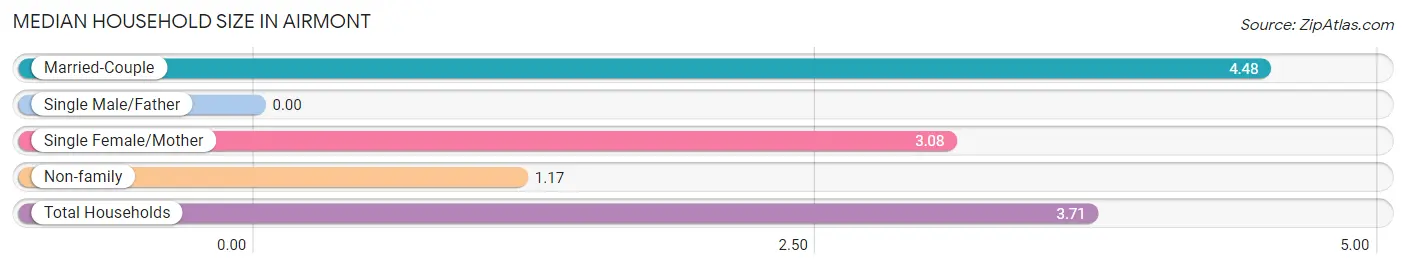
Median Household Size in Airmont
| Household Type | # Households | Household Size |
| Married-Couple | 1,832 (69.5%) | 4.48 |
| Single Male/Father | 0 (0.0%) | - |
| Single Female/Mother | 332 (12.6%) | 3.08 |
| Non-family | 471 (17.9%) | 1.17 |
| Total Households | 2,635 (100.0%) | 3.71 |
Household Size by Marriage Status in Airmont
Out of a total of 2,635 households in Airmont, 2,164 (82.1%) are family households, while 471 (17.9%) are nonfamily households. The most numerous type of family households are 2-person households, comprising 584, and the most common type of nonfamily households are 1-person households, comprising 422.
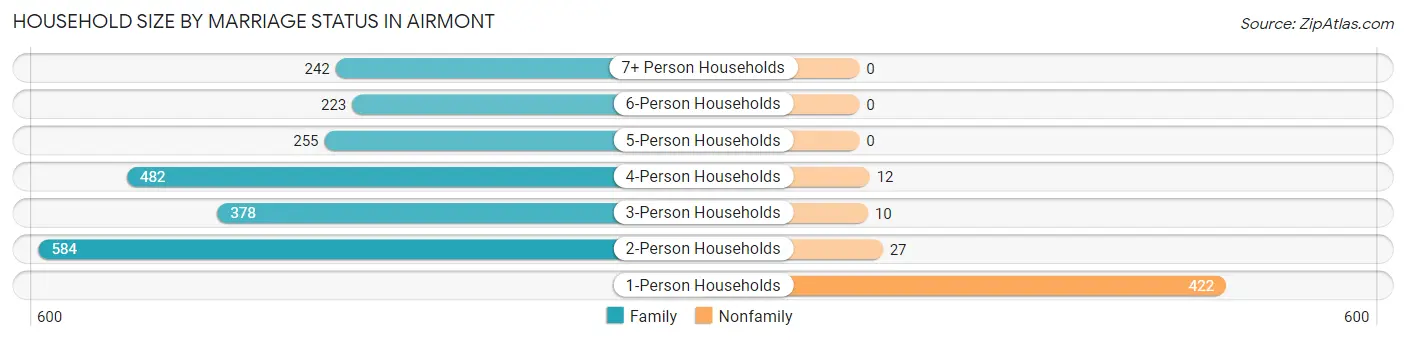
| Household Size | Family Households | Nonfamily Households |
| 1-Person Households | - | 422 (16.0%) |
| 2-Person Households | 584 (22.2%) | 27 (1.0%) |
| 3-Person Households | 378 (14.3%) | 10 (0.4%) |
| 4-Person Households | 482 (18.3%) | 12 (0.5%) |
| 5-Person Households | 255 (9.7%) | 0 (0.0%) |
| 6-Person Households | 223 (8.5%) | 0 (0.0%) |
| 7+ Person Households | 242 (9.2%) | 0 (0.0%) |
| Total | 2,164 (82.1%) | 471 (17.9%) |
Female Fertility in Airmont
Fertility by Age in Airmont
Average fertility rate in Airmont is 41.0 births per 1,000 women. Women in the age bracket of 20 to 34 years have the highest fertility rate with 100.0 births per 1,000 women. Women in the age bracket of 20 to 34 years acount for 84.7% of all women with births.
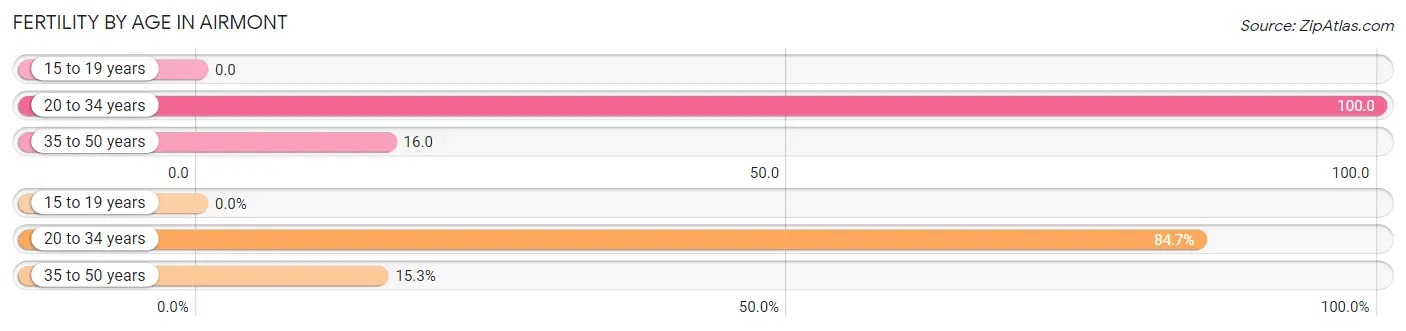
| Age Bracket | Women with Births | Births / 1,000 Women |
| 15 to 19 years | 0 (0.0%) | 0.0 |
| 20 to 34 years | 83 (84.7%) | 100.0 |
| 35 to 50 years | 15 (15.3%) | 16.0 |
| Total | 98 (100.0%) | 41.0 |
Fertility by Age by Marriage Status in Airmont
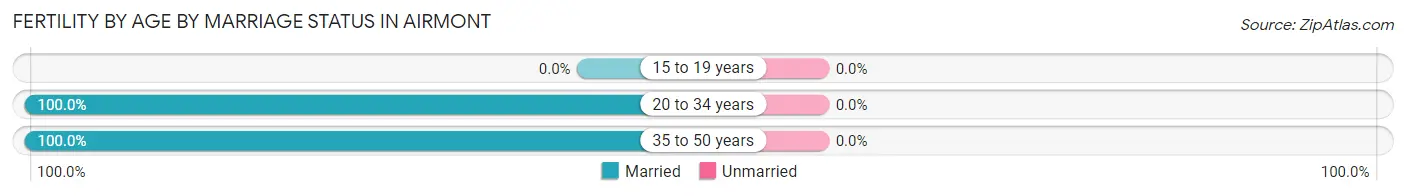
| Age Bracket | Married | Unmarried |
| 15 to 19 years | 0 (0.0%) | 0 (0.0%) |
| 20 to 34 years | 83 (100.0%) | 0 (0.0%) |
| 35 to 50 years | 15 (100.0%) | 0 (0.0%) |
| Total | 98 (100.0%) | 0 (0.0%) |
Fertility by Education in Airmont
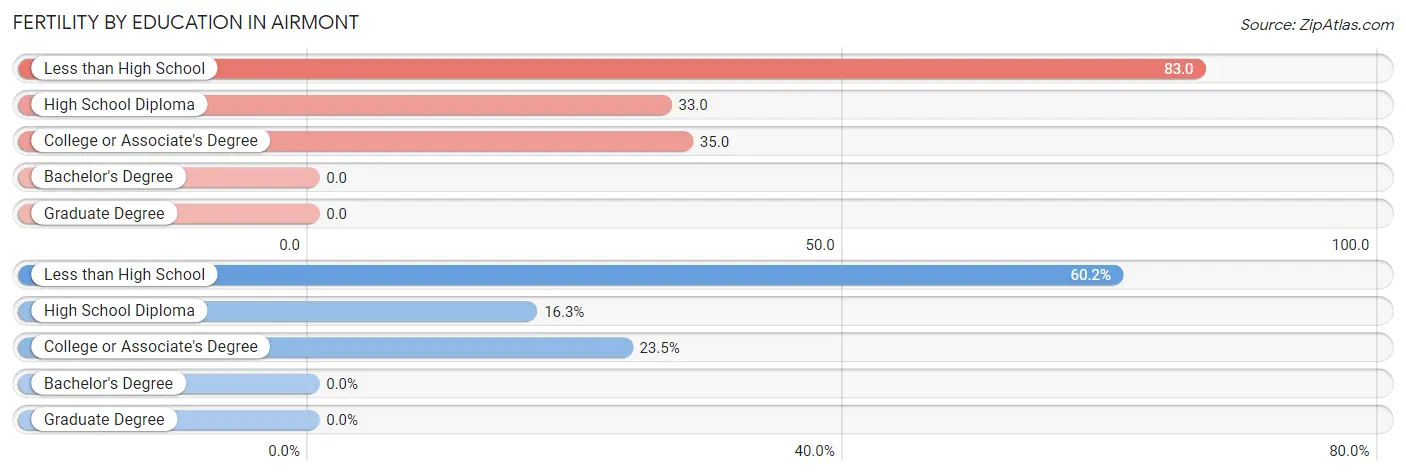
| Educational Attainment | Women with Births | Births / 1,000 Women |
| Less than High School | 59 (60.2%) | 83.0 |
| High School Diploma | 16 (16.3%) | 33.0 |
| College or Associate's Degree | 23 (23.5%) | 35.0 |
| Bachelor's Degree | 0 (0.0%) | 0.0 |
| Graduate Degree | 0 (0.0%) | 0.0 |
| Total | 98 (100.0%) | 41.0 |
Fertility by Education by Marriage Status in Airmont
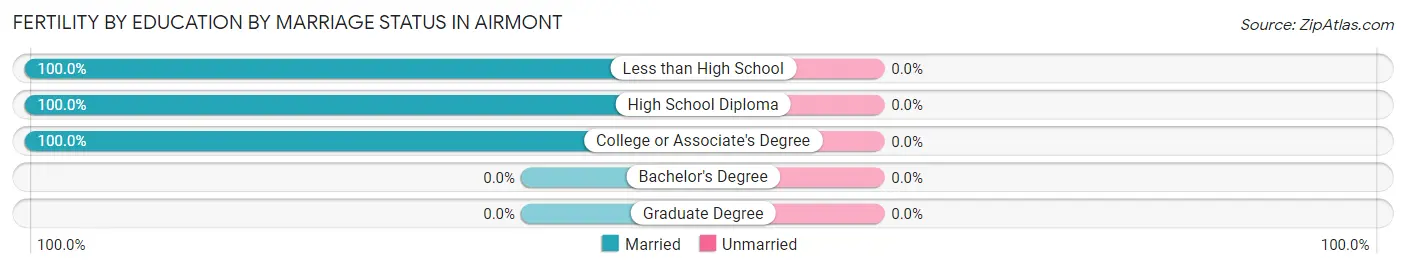
| Educational Attainment | Married | Unmarried |
| Less than High School | 59 (100.0%) | 0 (0.0%) |
| High School Diploma | 16 (100.0%) | 0 (0.0%) |
| College or Associate's Degree | 23 (100.0%) | 0 (0.0%) |
| Bachelor's Degree | 0 (0.0%) | 0 (0.0%) |
| Graduate Degree | 0 (0.0%) | 0 (0.0%) |
| Total | 98 (100.0%) | 0 (0.0%) |
Employment Characteristics in Airmont
Employment by Class of Employer in Airmont
Among the 3,379 employed individuals in Airmont, private company employees (1,481 | 43.8%), not-for-profit organizations (631 | 18.7%), and local government employees (596 | 17.6%) make up the most common classes of employment.
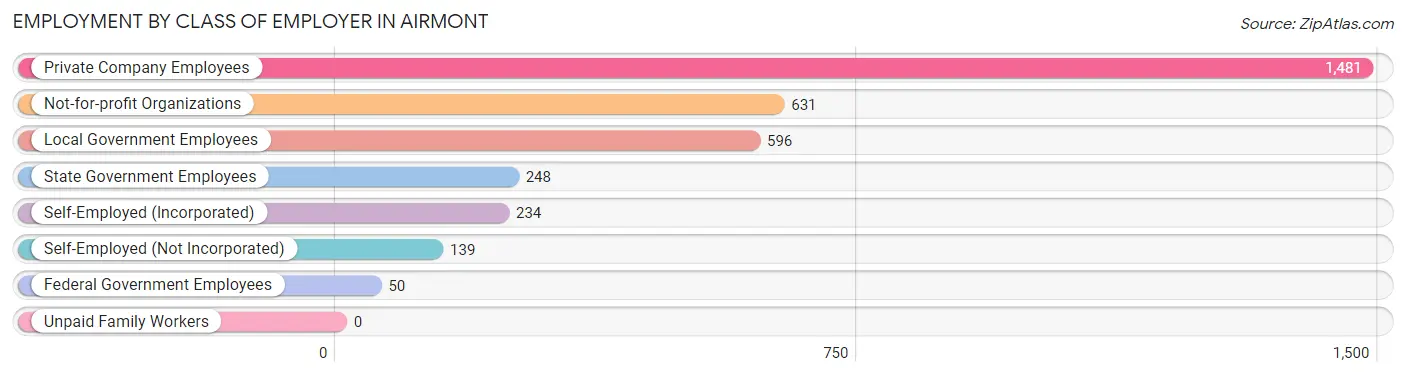
| Employer Class | # Employees | % Employees |
| Private Company Employees | 1,481 | 43.8% |
| Self-Employed (Incorporated) | 234 | 6.9% |
| Self-Employed (Not Incorporated) | 139 | 4.1% |
| Not-for-profit Organizations | 631 | 18.7% |
| Local Government Employees | 596 | 17.6% |
| State Government Employees | 248 | 7.3% |
| Federal Government Employees | 50 | 1.5% |
| Unpaid Family Workers | 0 | 0.0% |
| Total | 3,379 | 100.0% |
Employment Status by Age in Airmont
According to the labor force statistics for Airmont, out of the total population over 16 years of age (7,046), 53.2% or 3,748 individuals are in the labor force, with 7.3% or 274 of them unemployed. The age group with the highest labor force participation rate is 25 to 29 years, with 88.9% or 566 individuals in the labor force. Within the labor force, the 16 to 19 years age range has the highest percentage of unemployed individuals, with 31.4% or 65 of them being unemployed.
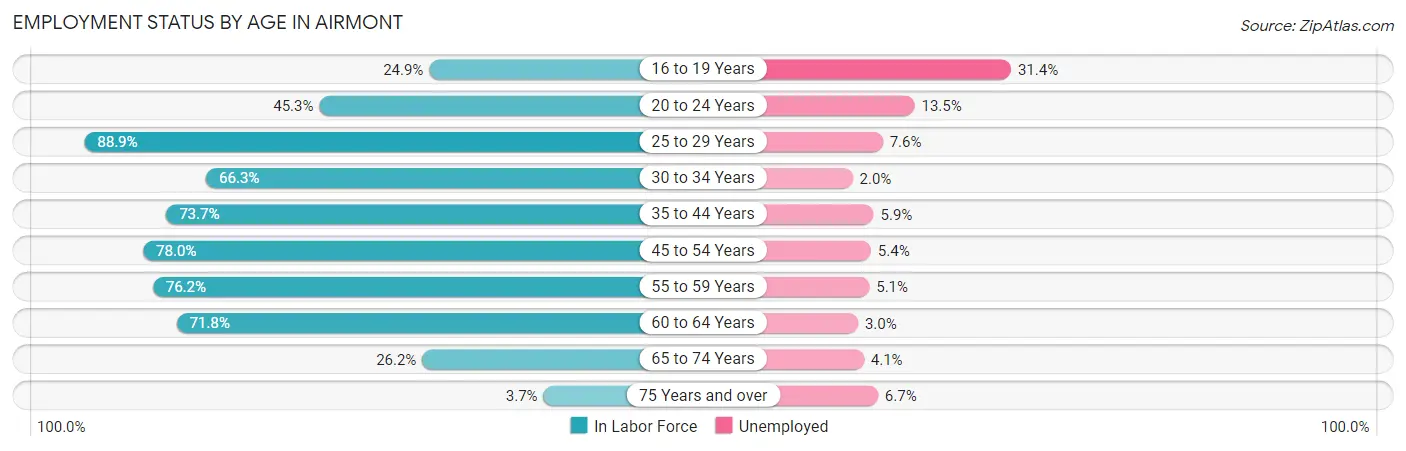
| Age Bracket | In Labor Force | Unemployed |
| 16 to 19 Years | 207 (24.9%) | 65 (31.4%) |
| 20 to 24 Years | 296 (45.3%) | 40 (13.5%) |
| 25 to 29 Years | 566 (88.9%) | 43 (7.6%) |
| 30 to 34 Years | 354 (66.3%) | 7 (2.0%) |
| 35 to 44 Years | 647 (73.7%) | 38 (5.9%) |
| 45 to 54 Years | 887 (78.0%) | 48 (5.4%) |
| 55 to 59 Years | 275 (76.2%) | 14 (5.1%) |
| 60 to 64 Years | 267 (71.8%) | 8 (3.0%) |
| 65 to 74 Years | 219 (26.2%) | 9 (4.1%) |
| 75 Years and over | 30 (3.7%) | 2 (6.7%) |
| Total | 3,748 (53.2%) | 274 (7.3%) |
Employment Status by Educational Attainment in Airmont
According to labor force statistics for Airmont, 76.4% of individuals (2,994) out of the total population between 25 and 64 years of age (3,919) are in the labor force, with 5.3% or 159 of them being unemployed. The group with the highest labor force participation rate are those with the educational attainment of bachelor's degree or higher, with 91.8% or 1,371 individuals in the labor force. Within the labor force, individuals with high school diploma education have the highest percentage of unemployment, with 17.9% or 94 of them being unemployed.
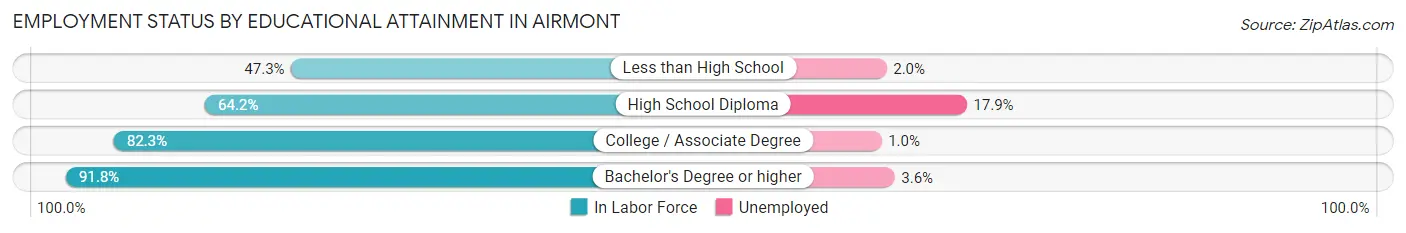
| Educational Attainment | In Labor Force | Unemployed |
| Less than High School | 303 (47.3%) | 13 (2.0%) |
| High School Diploma | 526 (64.2%) | 147 (17.9%) |
| College / Associate Degree | 796 (82.3%) | 10 (1.0%) |
| Bachelor's Degree or higher | 1,371 (91.8%) | 54 (3.6%) |
| Total | 2,994 (76.4%) | 208 (5.3%) |
Employment Occupations by Sex in Airmont
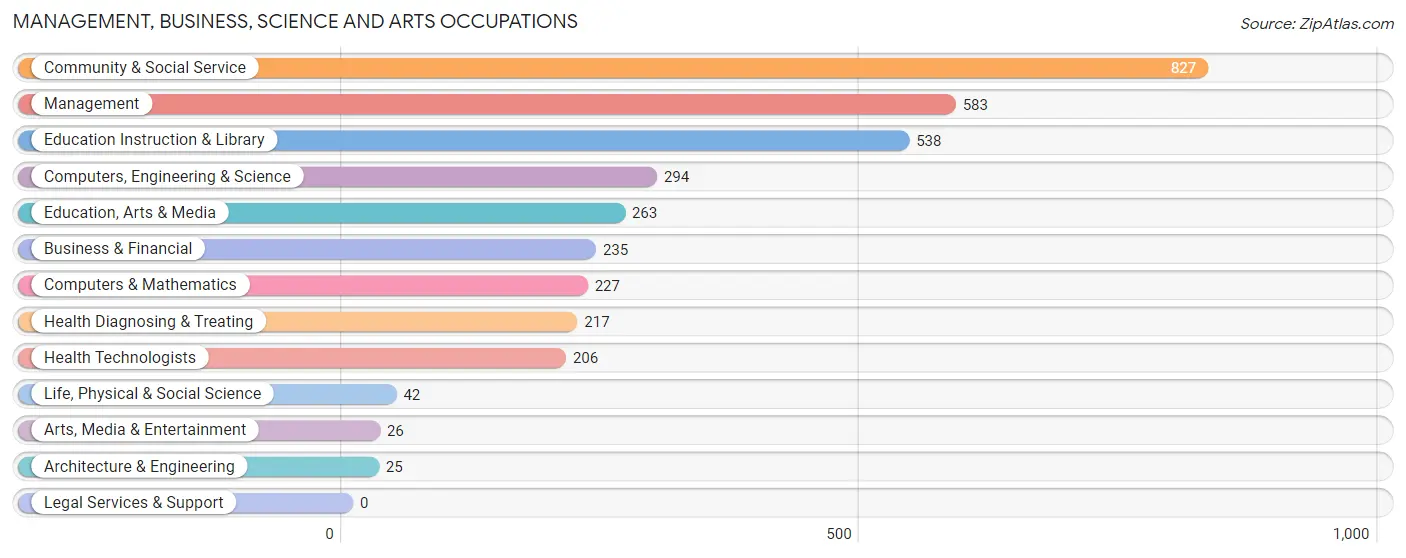
Management, Business, Science and Arts Occupations
The most common Management, Business, Science and Arts occupations in Airmont are Community & Social Service (827 | 23.8%), Management (583 | 16.8%), Education Instruction & Library (538 | 15.5%), Computers, Engineering & Science (294 | 8.5%), and Education, Arts & Media (263 | 7.6%).
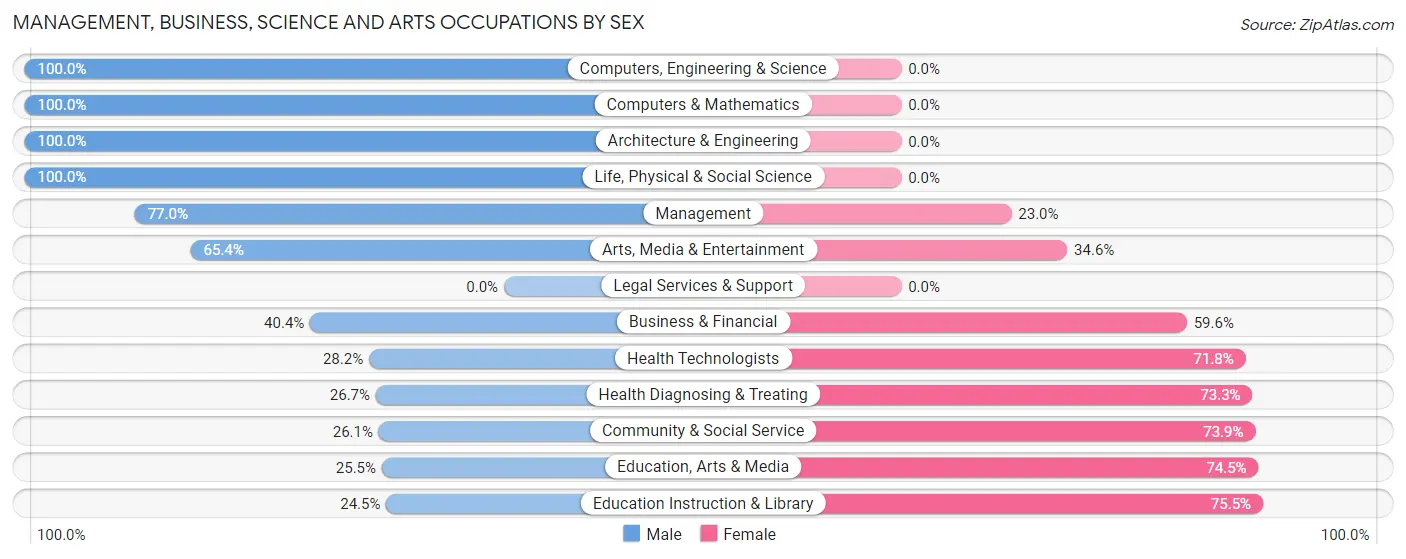
Management, Business, Science and Arts Occupations by Sex
Within the Management, Business, Science and Arts occupations in Airmont, the most male-oriented occupations are Computers, Engineering & Science (100.0%), Computers & Mathematics (100.0%), and Architecture & Engineering (100.0%), while the most female-oriented occupations are Education Instruction & Library (75.5%), Education, Arts & Media (74.5%), and Community & Social Service (73.9%).
| Occupation | Male | Female |
| Management | 449 (77.0%) | 134 (23.0%) |
| Business & Financial | 95 (40.4%) | 140 (59.6%) |
| Computers, Engineering & Science | 294 (100.0%) | 0 (0.0%) |
| Computers & Mathematics | 227 (100.0%) | 0 (0.0%) |
| Architecture & Engineering | 25 (100.0%) | 0 (0.0%) |
| Life, Physical & Social Science | 42 (100.0%) | 0 (0.0%) |
| Community & Social Service | 216 (26.1%) | 611 (73.9%) |
| Education, Arts & Media | 67 (25.5%) | 196 (74.5%) |
| Legal Services & Support | 0 (0.0%) | 0 (0.0%) |
| Education Instruction & Library | 132 (24.5%) | 406 (75.5%) |
| Arts, Media & Entertainment | 17 (65.4%) | 9 (34.6%) |
| Health Diagnosing & Treating | 58 (26.7%) | 159 (73.3%) |
| Health Technologists | 58 (28.2%) | 148 (71.8%) |
| Total (Category) | 1,112 (51.6%) | 1,044 (48.4%) |
| Total (Overall) | 1,850 (53.2%) | 1,624 (46.8%) |
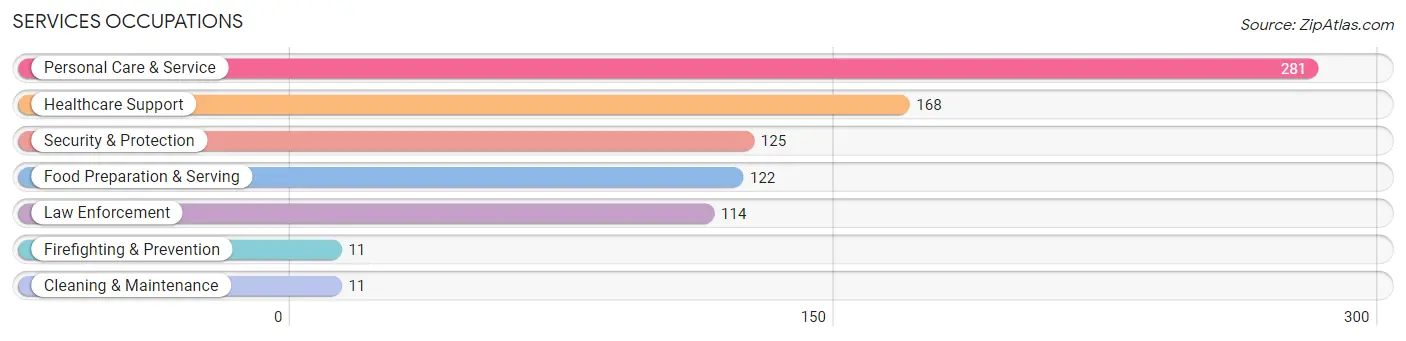
Services Occupations
The most common Services occupations in Airmont are Personal Care & Service (281 | 8.1%), Healthcare Support (168 | 4.8%), Security & Protection (125 | 3.6%), Food Preparation & Serving (122 | 3.5%), and Law Enforcement (114 | 3.3%).
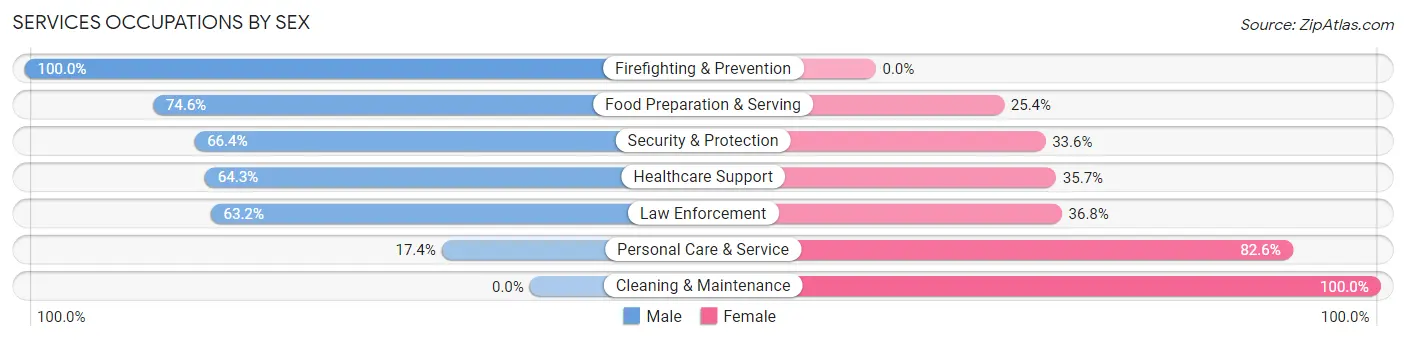
Services Occupations by Sex
Within the Services occupations in Airmont, the most male-oriented occupations are Firefighting & Prevention (100.0%), Food Preparation & Serving (74.6%), and Security & Protection (66.4%), while the most female-oriented occupations are Cleaning & Maintenance (100.0%), Personal Care & Service (82.6%), and Law Enforcement (36.8%).
| Occupation | Male | Female |
| Healthcare Support | 108 (64.3%) | 60 (35.7%) |
| Security & Protection | 83 (66.4%) | 42 (33.6%) |
| Firefighting & Prevention | 11 (100.0%) | 0 (0.0%) |
| Law Enforcement | 72 (63.2%) | 42 (36.8%) |
| Food Preparation & Serving | 91 (74.6%) | 31 (25.4%) |
| Cleaning & Maintenance | 0 (0.0%) | 11 (100.0%) |
| Personal Care & Service | 49 (17.4%) | 232 (82.6%) |
| Total (Category) | 331 (46.8%) | 376 (53.2%) |
| Total (Overall) | 1,850 (53.2%) | 1,624 (46.8%) |
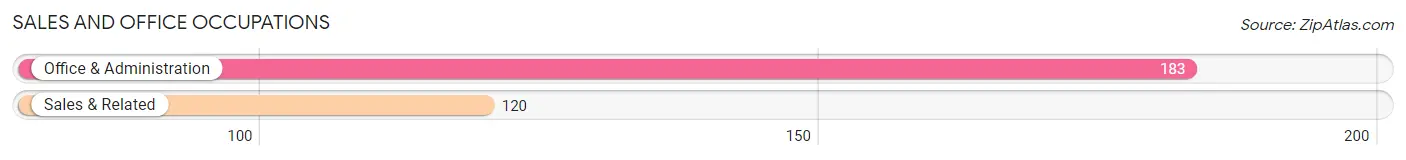
Sales and Office Occupations
The most common Sales and Office occupations in Airmont are Office & Administration (183 | 5.3%), and Sales & Related (120 | 3.5%).
Sales and Office Occupations by Sex
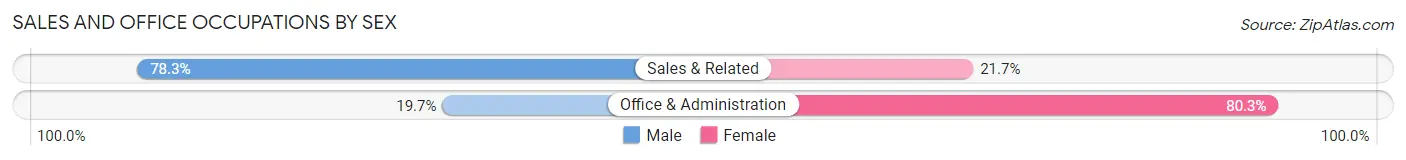
| Occupation | Male | Female |
| Sales & Related | 94 (78.3%) | 26 (21.7%) |
| Office & Administration | 36 (19.7%) | 147 (80.3%) |
| Total (Category) | 130 (42.9%) | 173 (57.1%) |
| Total (Overall) | 1,850 (53.2%) | 1,624 (46.8%) |
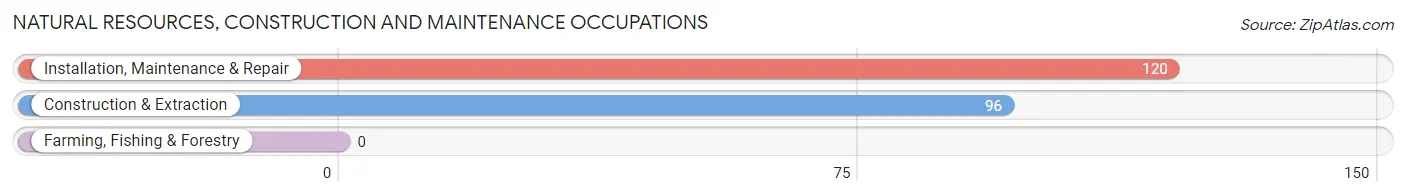
Natural Resources, Construction and Maintenance Occupations
The most common Natural Resources, Construction and Maintenance occupations in Airmont are Installation, Maintenance & Repair (120 | 3.5%), and Construction & Extraction (96 | 2.8%).
Natural Resources, Construction and Maintenance Occupations by Sex
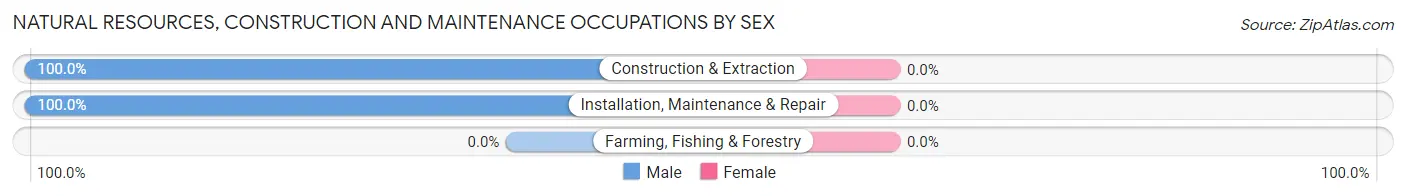
| Occupation | Male | Female |
| Farming, Fishing & Forestry | 0 (0.0%) | 0 (0.0%) |
| Construction & Extraction | 96 (100.0%) | 0 (0.0%) |
| Installation, Maintenance & Repair | 120 (100.0%) | 0 (0.0%) |
| Total (Category) | 216 (100.0%) | 0 (0.0%) |
| Total (Overall) | 1,850 (53.2%) | 1,624 (46.8%) |
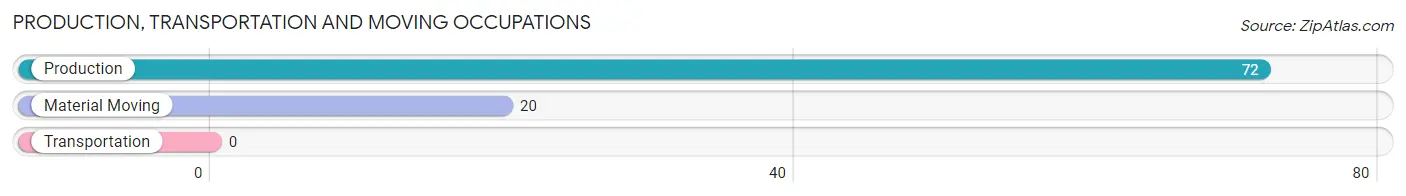
Production, Transportation and Moving Occupations
The most common Production, Transportation and Moving occupations in Airmont are Production (72 | 2.1%), and Material Moving (20 | 0.6%).
Production, Transportation and Moving Occupations by Sex
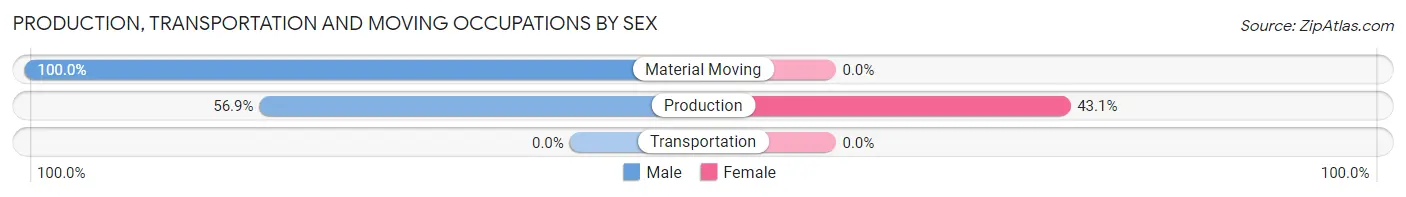
| Occupation | Male | Female |
| Production | 41 (56.9%) | 31 (43.1%) |
| Transportation | 0 (0.0%) | 0 (0.0%) |
| Material Moving | 20 (100.0%) | 0 (0.0%) |
| Total (Category) | 61 (66.3%) | 31 (33.7%) |
| Total (Overall) | 1,850 (53.2%) | 1,624 (46.8%) |
Employment Industries by Sex in Airmont
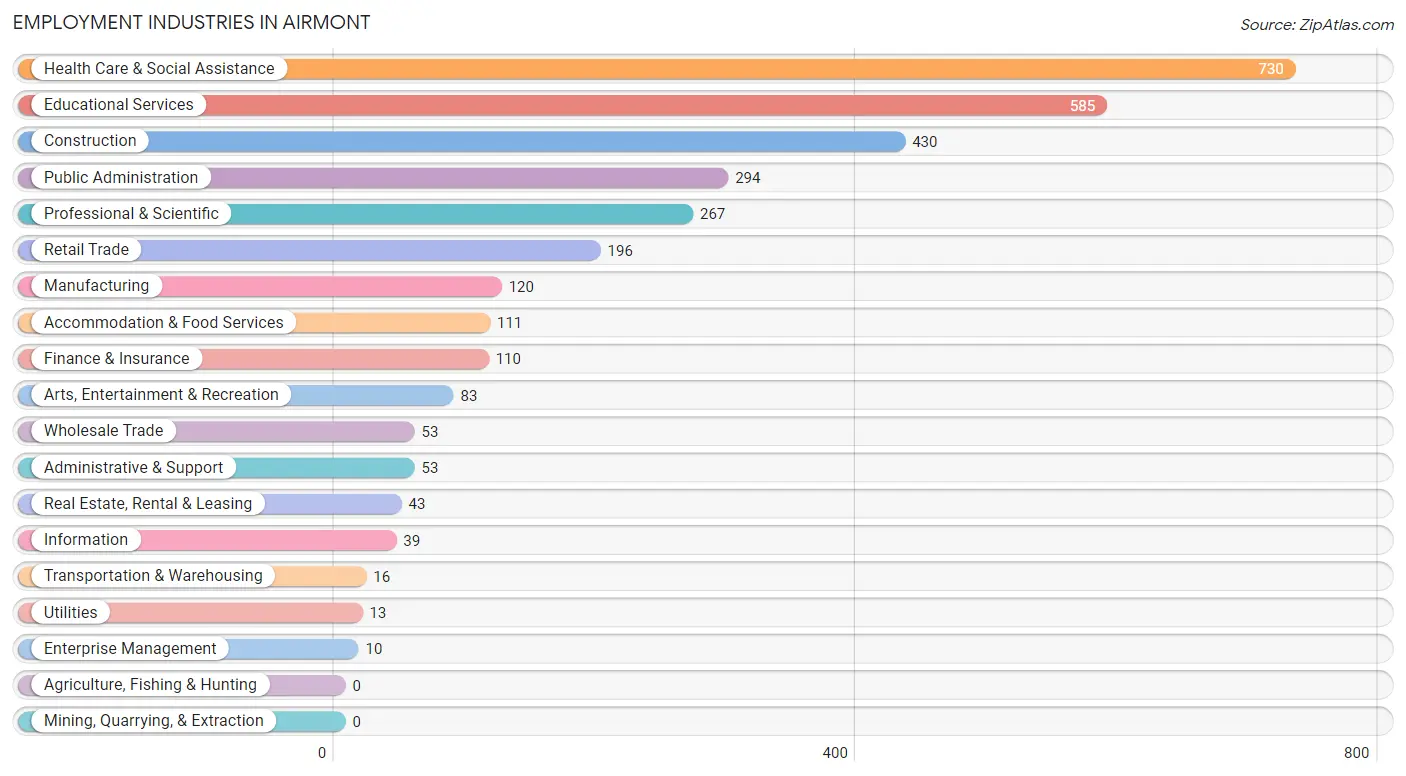
Employment Industries in Airmont
The major employment industries in Airmont include Health Care & Social Assistance (730 | 21.0%), Educational Services (585 | 16.8%), Construction (430 | 12.4%), Public Administration (294 | 8.5%), and Professional & Scientific (267 | 7.7%).
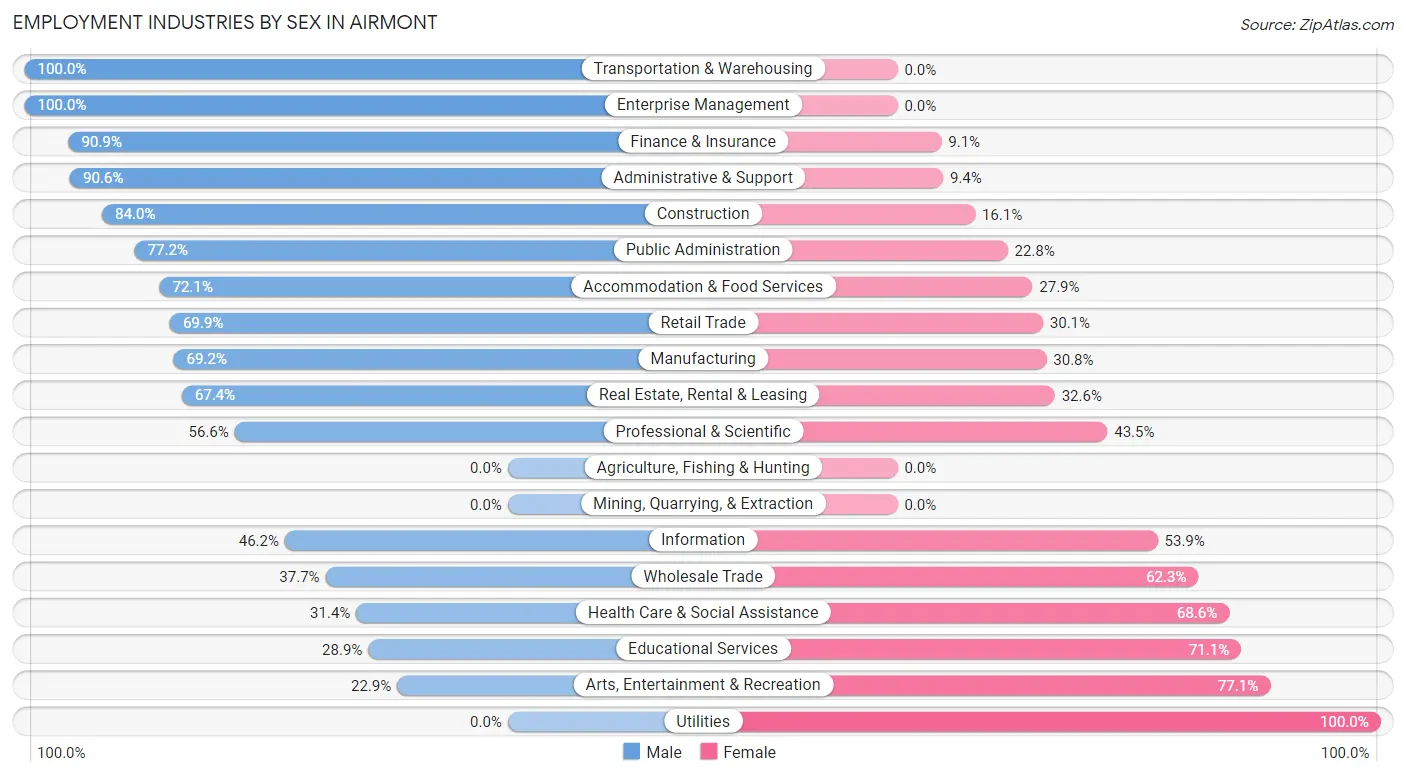
Employment Industries by Sex in Airmont
The Airmont industries that see more men than women are Transportation & Warehousing (100.0%), Enterprise Management (100.0%), and Finance & Insurance (90.9%), whereas the industries that tend to have a higher number of women are Utilities (100.0%), Arts, Entertainment & Recreation (77.1%), and Educational Services (71.1%).
| Industry | Male | Female |
| Agriculture, Fishing & Hunting | 0 (0.0%) | 0 (0.0%) |
| Mining, Quarrying, & Extraction | 0 (0.0%) | 0 (0.0%) |
| Construction | 361 (84.0%) | 69 (16.1%) |
| Manufacturing | 83 (69.2%) | 37 (30.8%) |
| Wholesale Trade | 20 (37.7%) | 33 (62.3%) |
| Retail Trade | 137 (69.9%) | 59 (30.1%) |
| Transportation & Warehousing | 16 (100.0%) | 0 (0.0%) |
| Utilities | 0 (0.0%) | 13 (100.0%) |
| Information | 18 (46.2%) | 21 (53.8%) |
| Finance & Insurance | 100 (90.9%) | 10 (9.1%) |
| Real Estate, Rental & Leasing | 29 (67.4%) | 14 (32.6%) |
| Professional & Scientific | 151 (56.6%) | 116 (43.4%) |
| Enterprise Management | 10 (100.0%) | 0 (0.0%) |
| Administrative & Support | 48 (90.6%) | 5 (9.4%) |
| Educational Services | 169 (28.9%) | 416 (71.1%) |
| Health Care & Social Assistance | 229 (31.4%) | 501 (68.6%) |
| Arts, Entertainment & Recreation | 19 (22.9%) | 64 (77.1%) |
| Accommodation & Food Services | 80 (72.1%) | 31 (27.9%) |
| Public Administration | 227 (77.2%) | 67 (22.8%) |
| Total | 1,850 (53.2%) | 1,624 (46.8%) |
Education in Airmont
School Enrollment in Airmont
The most common levels of schooling among the 3,610 students in Airmont are middle school (913 | 25.3%), high school (810 | 22.4%), and elementary school (730 | 20.2%).
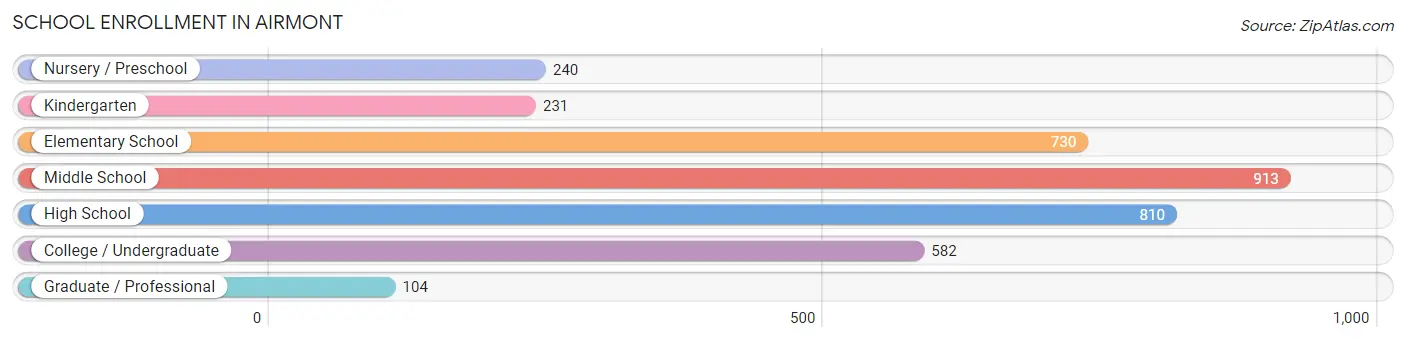
| School Level | # Students | % Students |
| Nursery / Preschool | 240 | 6.7% |
| Kindergarten | 231 | 6.4% |
| Elementary School | 730 | 20.2% |
| Middle School | 913 | 25.3% |
| High School | 810 | 22.4% |
| College / Undergraduate | 582 | 16.1% |
| Graduate / Professional | 104 | 2.9% |
| Total | 3,610 | 100.0% |
School Enrollment by Age by Funding Source in Airmont
Out of a total of 3,610 students who are enrolled in schools in Airmont, 2,404 (66.6%) attend a private institution, while the remaining 1,206 (33.4%) are enrolled in public schools. The age group of 35 years and over has the highest likelihood of being enrolled in private schools, with 19 (100.0% in the age bracket) enrolled. Conversely, the age group of 25 to 34 year olds has the lowest likelihood of being enrolled in a private school, with 66 (71.7% in the age bracket) attending a public institution.
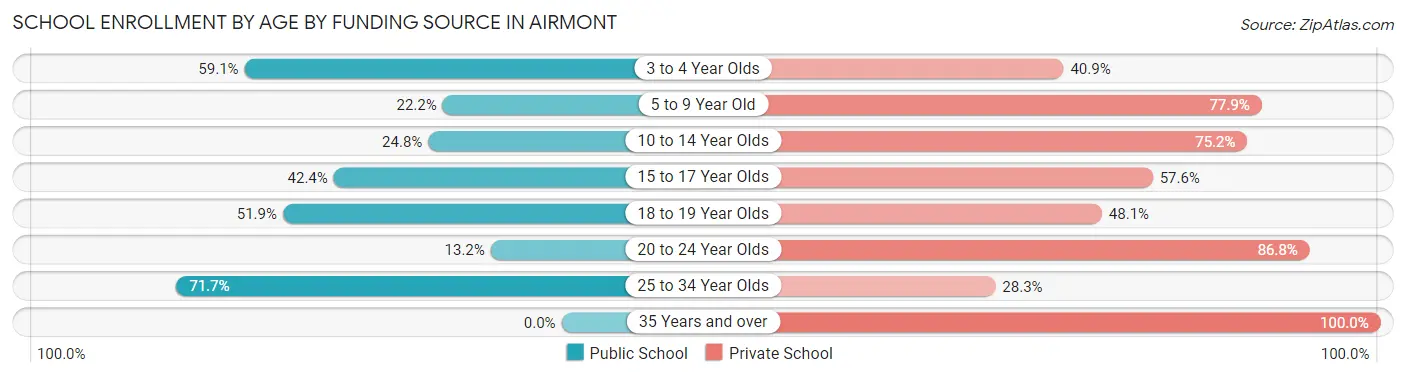
| Age Bracket | Public School | Private School |
| 3 to 4 Year Olds | 176 (59.1%) | 122 (40.9%) |
| 5 to 9 Year Old | 198 (22.2%) | 696 (77.8%) |
| 10 to 14 Year Olds | 252 (24.8%) | 763 (75.2%) |
| 15 to 17 Year Olds | 264 (42.4%) | 358 (57.6%) |
| 18 to 19 Year Olds | 218 (51.9%) | 202 (48.1%) |
| 20 to 24 Year Olds | 33 (13.2%) | 217 (86.8%) |
| 25 to 34 Year Olds | 66 (71.7%) | 26 (28.3%) |
| 35 Years and over | 0 (0.0%) | 19 (100.0%) |
| Total | 1,206 (33.4%) | 2,404 (66.6%) |
Educational Attainment by Field of Study in Airmont
Business (338 | 15.9%), education (311 | 14.7%), liberal arts & history (297 | 14.0%), science & technology (202 | 9.5%), and social sciences (201 | 9.5%) are the most common fields of study among 2,122 individuals in Airmont who have obtained a bachelor's degree or higher.
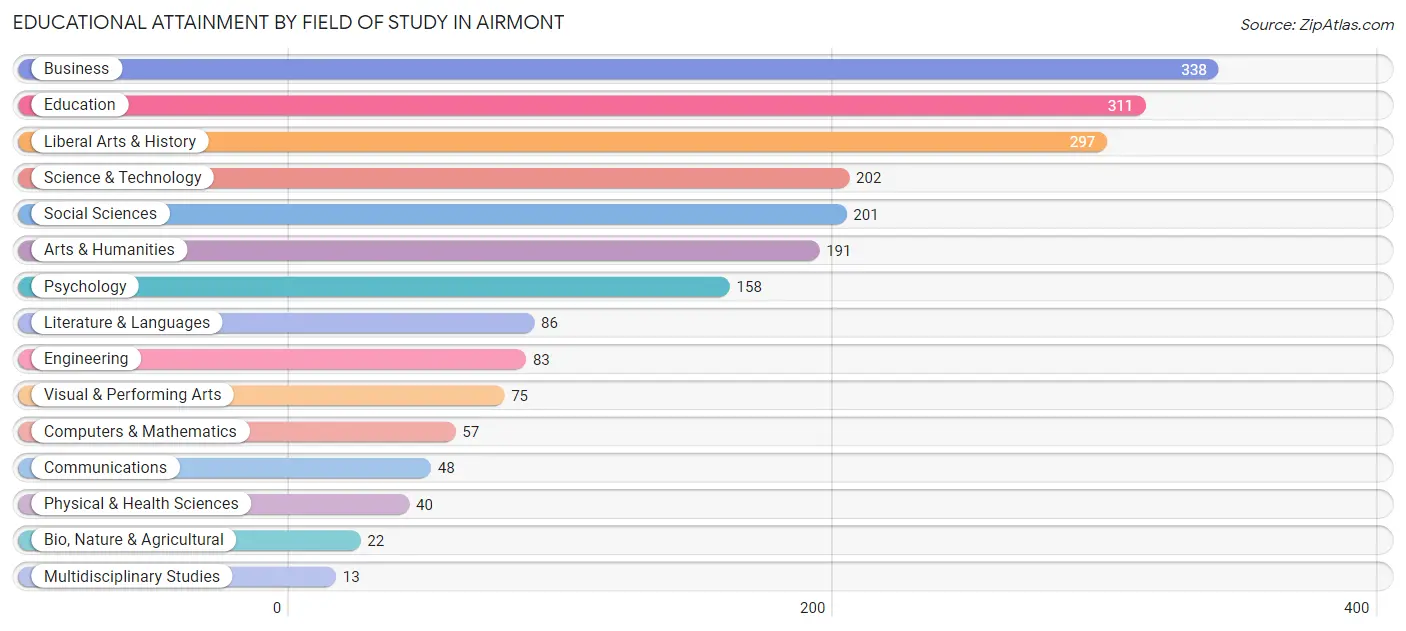
| Field of Study | # Graduates | % Graduates |
| Computers & Mathematics | 57 | 2.7% |
| Bio, Nature & Agricultural | 22 | 1.0% |
| Physical & Health Sciences | 40 | 1.9% |
| Psychology | 158 | 7.4% |
| Social Sciences | 201 | 9.5% |
| Engineering | 83 | 3.9% |
| Multidisciplinary Studies | 13 | 0.6% |
| Science & Technology | 202 | 9.5% |
| Business | 338 | 15.9% |
| Education | 311 | 14.7% |
| Literature & Languages | 86 | 4.1% |
| Liberal Arts & History | 297 | 14.0% |
| Visual & Performing Arts | 75 | 3.5% |
| Communications | 48 | 2.3% |
| Arts & Humanities | 191 | 9.0% |
| Total | 2,122 | 100.0% |
Transportation & Commute in Airmont
Vehicle Availability by Sex in Airmont
The most prevalent vehicle ownership categories in Airmont are males with 2 vehicles (962, accounting for 53.4%) and females with 2 vehicles (879, making up 61.1%).
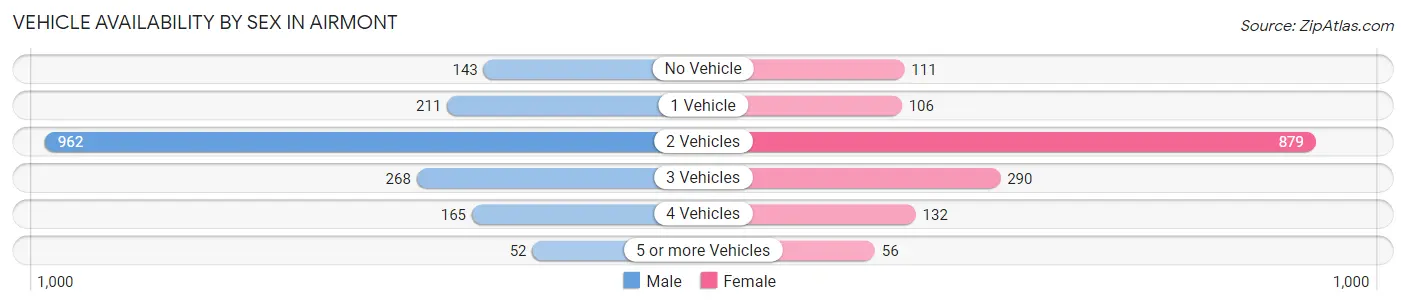
| Vehicles Available | Male | Female |
| No Vehicle | 143 (7.9%) | 111 (7.0%) |
| 1 Vehicle | 211 (11.7%) | 106 (6.7%) |
| 2 Vehicles | 962 (53.4%) | 879 (55.8%) |
| 3 Vehicles | 268 (14.9%) | 290 (18.4%) |
| 4 Vehicles | 165 (9.2%) | 132 (8.4%) |
| 5 or more Vehicles | 52 (2.9%) | 56 (3.6%) |
| Total | 1,801 (100.0%) | 1,574 (100.0%) |
Commute Time in Airmont
The most frequently occuring commute durations in Airmont are 15 to 19 minutes (459 commuters, 15.1%), 5 to 9 minutes (449 commuters, 14.8%), and 30 to 34 minutes (430 commuters, 14.2%).
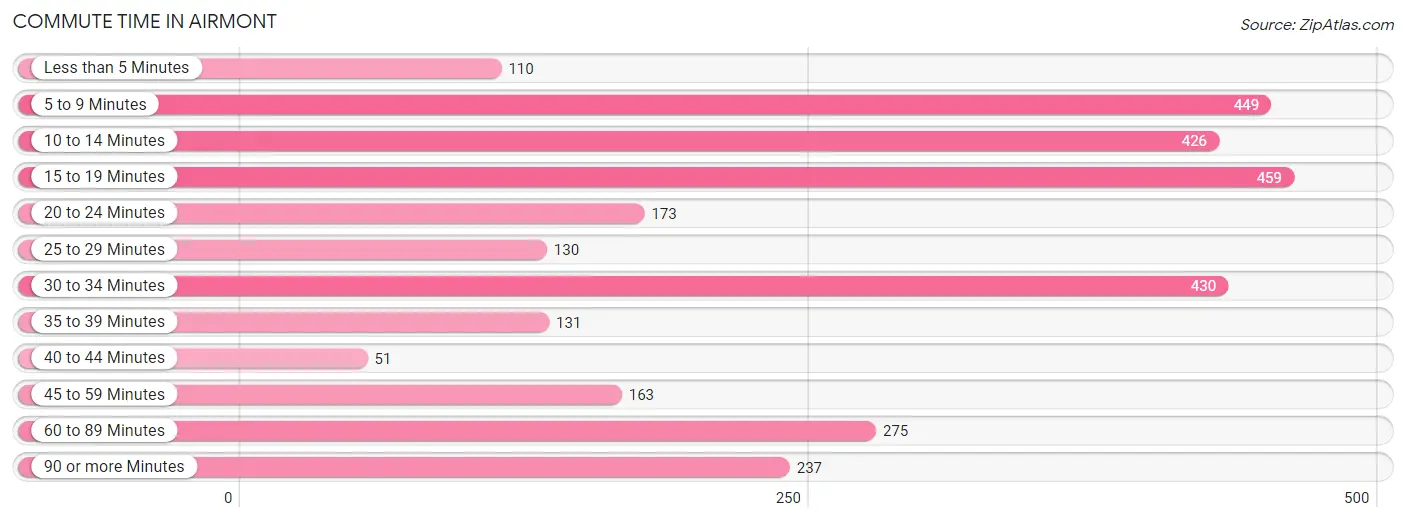
| Commute Time | # Commuters | % Commuters |
| Less than 5 Minutes | 110 | 3.6% |
| 5 to 9 Minutes | 449 | 14.8% |
| 10 to 14 Minutes | 426 | 14.0% |
| 15 to 19 Minutes | 459 | 15.1% |
| 20 to 24 Minutes | 173 | 5.7% |
| 25 to 29 Minutes | 130 | 4.3% |
| 30 to 34 Minutes | 430 | 14.2% |
| 35 to 39 Minutes | 131 | 4.3% |
| 40 to 44 Minutes | 51 | 1.7% |
| 45 to 59 Minutes | 163 | 5.4% |
| 60 to 89 Minutes | 275 | 9.1% |
| 90 or more Minutes | 237 | 7.8% |
Commute Time by Sex in Airmont
The most common commute times in Airmont are 5 to 9 minutes (248 commuters, 15.4%) for males and 10 to 14 minutes (229 commuters, 16.1%) for females.
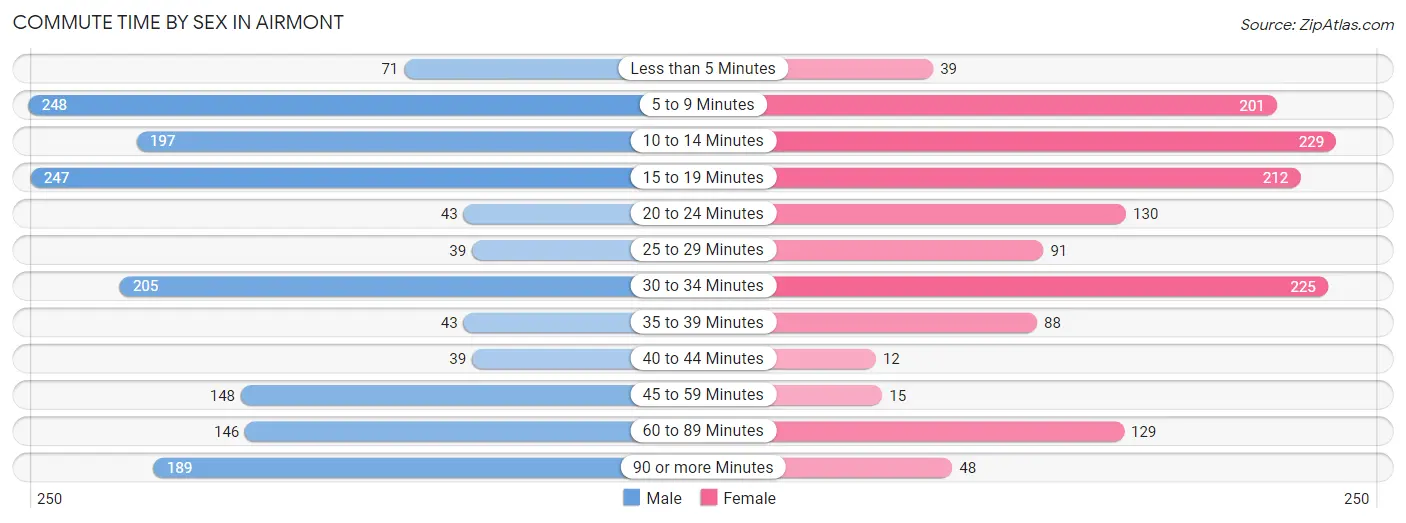
| Commute Time | Male | Female |
| Less than 5 Minutes | 71 (4.4%) | 39 (2.8%) |
| 5 to 9 Minutes | 248 (15.4%) | 201 (14.2%) |
| 10 to 14 Minutes | 197 (12.2%) | 229 (16.1%) |
| 15 to 19 Minutes | 247 (15.3%) | 212 (14.9%) |
| 20 to 24 Minutes | 43 (2.7%) | 130 (9.2%) |
| 25 to 29 Minutes | 39 (2.4%) | 91 (6.4%) |
| 30 to 34 Minutes | 205 (12.7%) | 225 (15.9%) |
| 35 to 39 Minutes | 43 (2.7%) | 88 (6.2%) |
| 40 to 44 Minutes | 39 (2.4%) | 12 (0.9%) |
| 45 to 59 Minutes | 148 (9.2%) | 15 (1.1%) |
| 60 to 89 Minutes | 146 (9.0%) | 129 (9.1%) |
| 90 or more Minutes | 189 (11.7%) | 48 (3.4%) |
Time of Departure to Work by Sex in Airmont
The most frequent times of departure to work in Airmont are 7:00 AM to 7:29 AM (320, 19.8%) for males and 8:30 AM to 8:59 AM (377, 26.6%) for females.
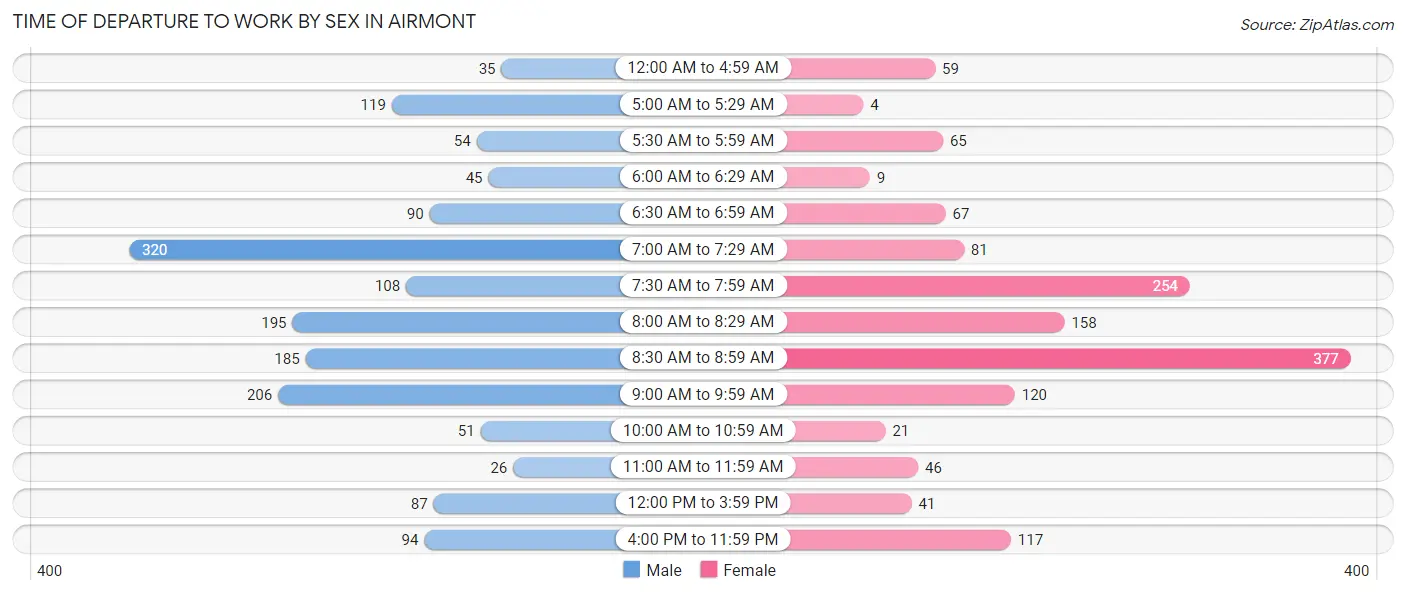
| Time of Departure | Male | Female |
| 12:00 AM to 4:59 AM | 35 (2.2%) | 59 (4.2%) |
| 5:00 AM to 5:29 AM | 119 (7.4%) | 4 (0.3%) |
| 5:30 AM to 5:59 AM | 54 (3.3%) | 65 (4.6%) |
| 6:00 AM to 6:29 AM | 45 (2.8%) | 9 (0.6%) |
| 6:30 AM to 6:59 AM | 90 (5.6%) | 67 (4.7%) |
| 7:00 AM to 7:29 AM | 320 (19.8%) | 81 (5.7%) |
| 7:30 AM to 7:59 AM | 108 (6.7%) | 254 (17.9%) |
| 8:00 AM to 8:29 AM | 195 (12.1%) | 158 (11.1%) |
| 8:30 AM to 8:59 AM | 185 (11.5%) | 377 (26.6%) |
| 9:00 AM to 9:59 AM | 206 (12.8%) | 120 (8.5%) |
| 10:00 AM to 10:59 AM | 51 (3.2%) | 21 (1.5%) |
| 11:00 AM to 11:59 AM | 26 (1.6%) | 46 (3.2%) |
| 12:00 PM to 3:59 PM | 87 (5.4%) | 41 (2.9%) |
| 4:00 PM to 11:59 PM | 94 (5.8%) | 117 (8.3%) |
| Total | 1,615 (100.0%) | 1,419 (100.0%) |
Housing Occupancy in Airmont
Occupancy by Ownership in Airmont
Of the total 2,635 dwellings in Airmont, owner-occupied units account for 2,019 (76.6%), while renter-occupied units make up 616 (23.4%).
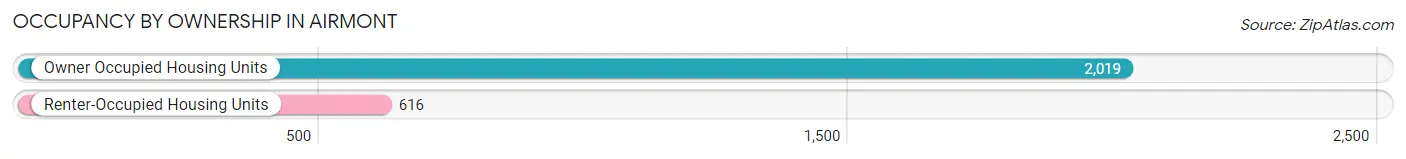
| Occupancy | # Housing Units | % Housing Units |
| Owner Occupied Housing Units | 2,019 | 76.6% |
| Renter-Occupied Housing Units | 616 | 23.4% |
| Total Occupied Housing Units | 2,635 | 100.0% |
Occupancy by Household Size in Airmont
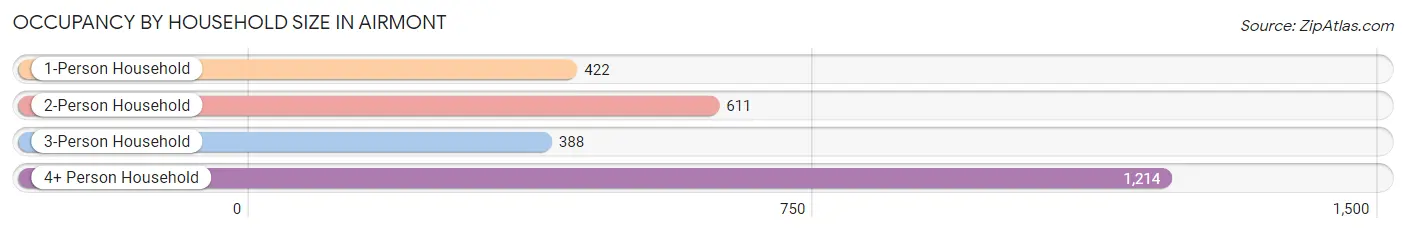
| Household Size | # Housing Units | % Housing Units |
| 1-Person Household | 422 | 16.0% |
| 2-Person Household | 611 | 23.2% |
| 3-Person Household | 388 | 14.7% |
| 4+ Person Household | 1,214 | 46.1% |
| Total Housing Units | 2,635 | 100.0% |
Occupancy by Ownership by Household Size in Airmont
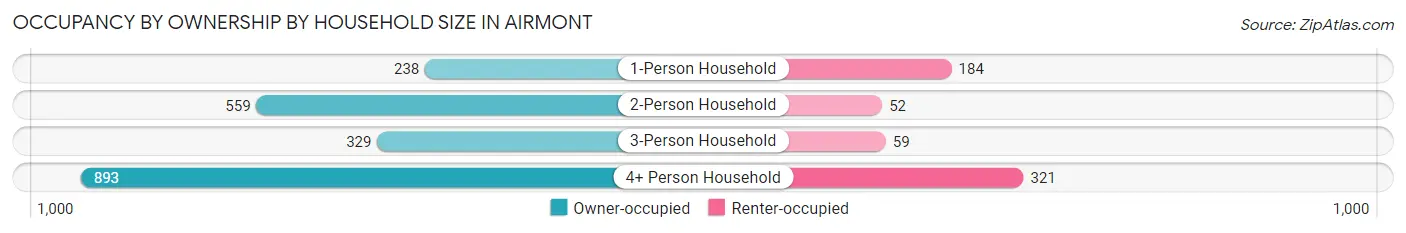
| Household Size | Owner-occupied | Renter-occupied |
| 1-Person Household | 238 (56.4%) | 184 (43.6%) |
| 2-Person Household | 559 (91.5%) | 52 (8.5%) |
| 3-Person Household | 329 (84.8%) | 59 (15.2%) |
| 4+ Person Household | 893 (73.6%) | 321 (26.4%) |
| Total Housing Units | 2,019 (76.6%) | 616 (23.4%) |
Occupancy by Educational Attainment in Airmont
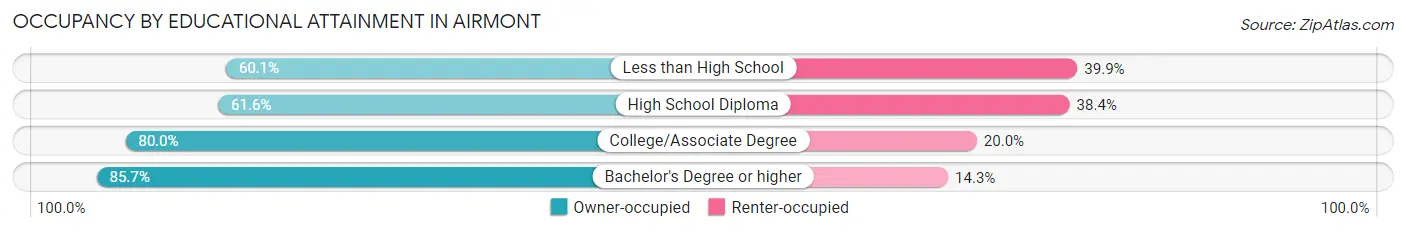
| Household Size | Owner-occupied | Renter-occupied |
| Less than High School | 244 (60.1%) | 162 (39.9%) |
| High School Diploma | 233 (61.6%) | 145 (38.4%) |
| College/Associate Degree | 629 (80.0%) | 157 (20.0%) |
| Bachelor's Degree or higher | 913 (85.7%) | 152 (14.3%) |
Occupancy by Age of Householder in Airmont
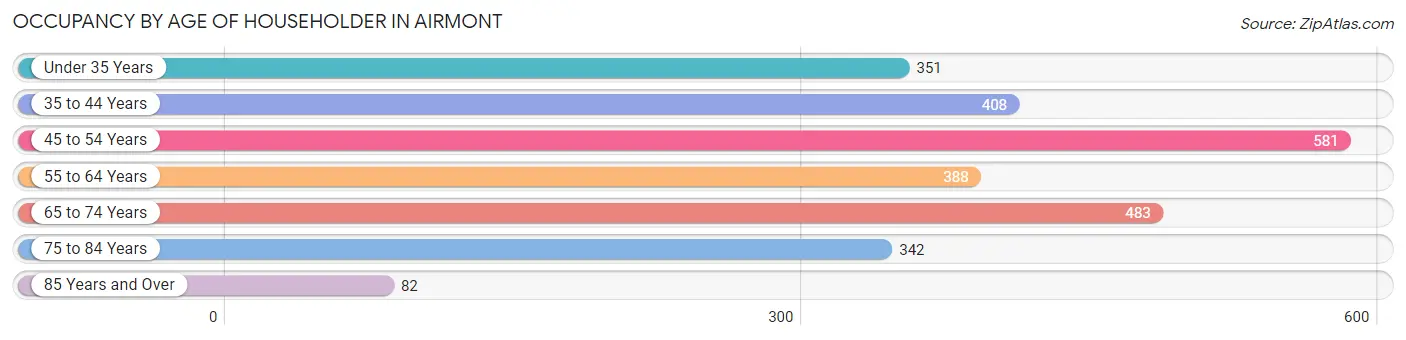
| Age Bracket | # Households | % Households |
| Under 35 Years | 351 | 13.3% |
| 35 to 44 Years | 408 | 15.5% |
| 45 to 54 Years | 581 | 22.1% |
| 55 to 64 Years | 388 | 14.7% |
| 65 to 74 Years | 483 | 18.3% |
| 75 to 84 Years | 342 | 13.0% |
| 85 Years and Over | 82 | 3.1% |
| Total | 2,635 | 100.0% |
Housing Finances in Airmont
Median Income by Occupancy in Airmont
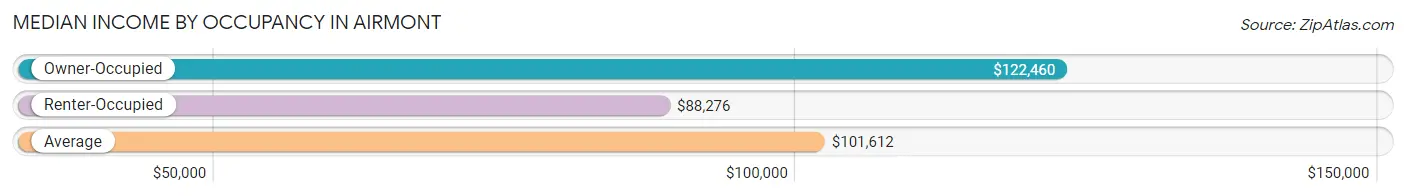
| Occupancy Type | # Households | Median Income |
| Owner-Occupied | 2,019 (76.6%) | $122,460 |
| Renter-Occupied | 616 (23.4%) | $88,276 |
| Average | 2,635 (100.0%) | $101,612 |
Occupancy by Householder Income Bracket in Airmont
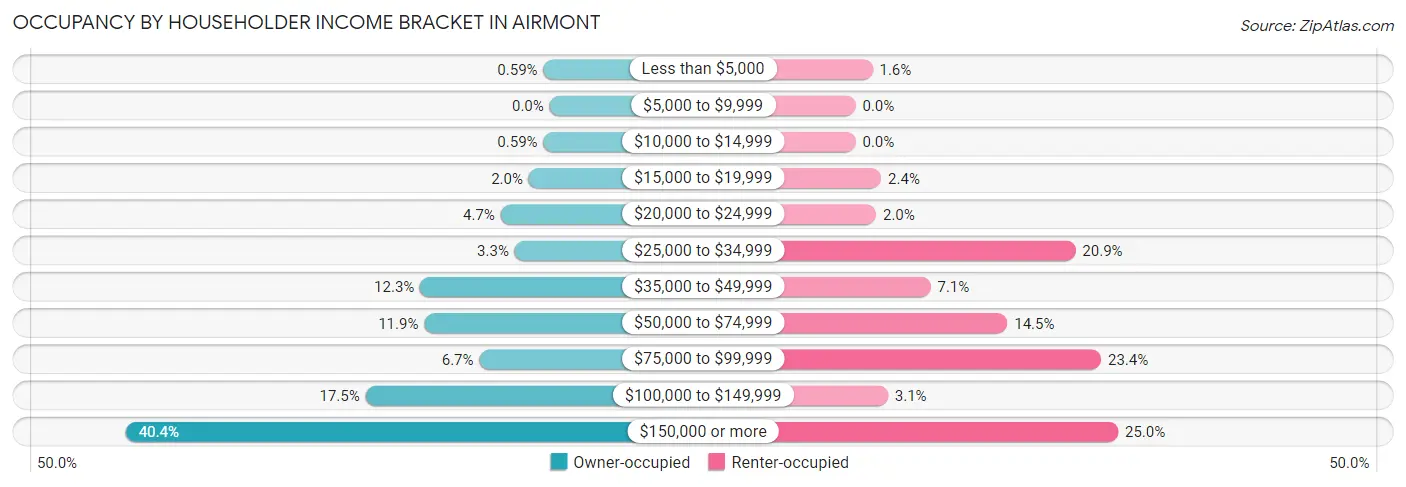
| Income Bracket | Owner-occupied | Renter-occupied |
| Less than $5,000 | 12 (0.6%) | 10 (1.6%) |
| $5,000 to $9,999 | 0 (0.0%) | 0 (0.0%) |
| $10,000 to $14,999 | 12 (0.6%) | 0 (0.0%) |
| $15,000 to $19,999 | 40 (2.0%) | 15 (2.4%) |
| $20,000 to $24,999 | 94 (4.7%) | 12 (1.9%) |
| $25,000 to $34,999 | 67 (3.3%) | 129 (20.9%) |
| $35,000 to $49,999 | 249 (12.3%) | 44 (7.1%) |
| $50,000 to $74,999 | 241 (11.9%) | 89 (14.4%) |
| $75,000 to $99,999 | 135 (6.7%) | 144 (23.4%) |
| $100,000 to $149,999 | 354 (17.5%) | 19 (3.1%) |
| $150,000 or more | 815 (40.4%) | 154 (25.0%) |
| Total | 2,019 (100.0%) | 616 (100.0%) |
Monthly Housing Cost Tiers in Airmont
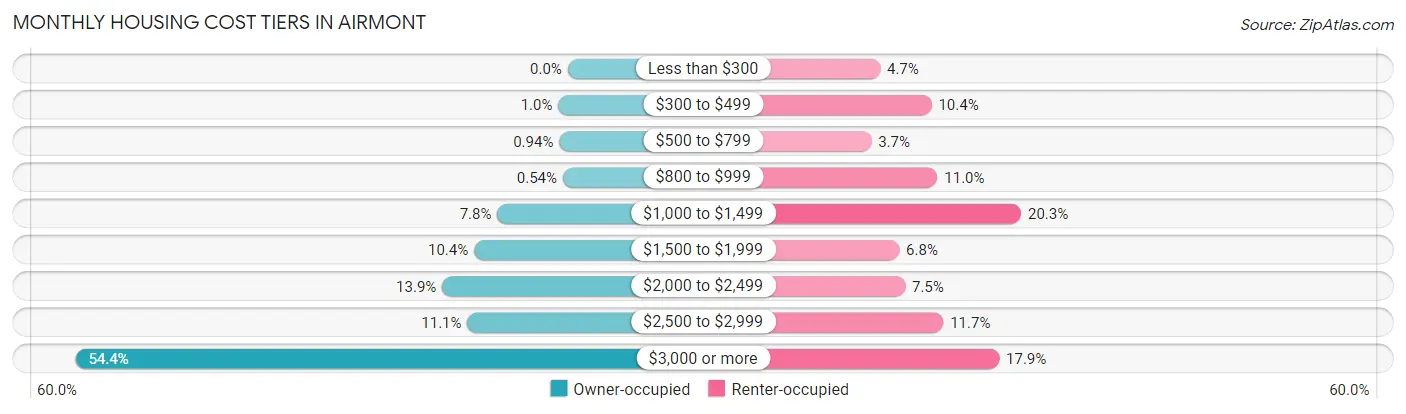
| Monthly Cost | Owner-occupied | Renter-occupied |
| Less than $300 | 0 (0.0%) | 29 (4.7%) |
| $300 to $499 | 21 (1.0%) | 64 (10.4%) |
| $500 to $799 | 19 (0.9%) | 23 (3.7%) |
| $800 to $999 | 11 (0.5%) | 68 (11.0%) |
| $1,000 to $1,499 | 157 (7.8%) | 125 (20.3%) |
| $1,500 to $1,999 | 209 (10.3%) | 42 (6.8%) |
| $2,000 to $2,499 | 280 (13.9%) | 46 (7.5%) |
| $2,500 to $2,999 | 224 (11.1%) | 72 (11.7%) |
| $3,000 or more | 1,098 (54.4%) | 110 (17.9%) |
| Total | 2,019 (100.0%) | 616 (100.0%) |
Physical Housing Characteristics in Airmont
Housing Structures in Airmont
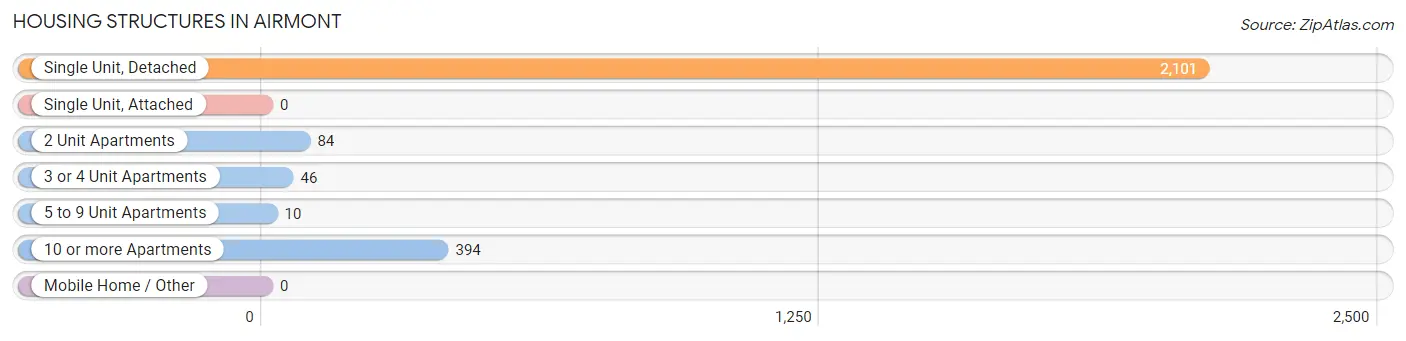
| Structure Type | # Housing Units | % Housing Units |
| Single Unit, Detached | 2,101 | 79.7% |
| Single Unit, Attached | 0 | 0.0% |
| 2 Unit Apartments | 84 | 3.2% |
| 3 or 4 Unit Apartments | 46 | 1.8% |
| 5 to 9 Unit Apartments | 10 | 0.4% |
| 10 or more Apartments | 394 | 14.9% |
| Mobile Home / Other | 0 | 0.0% |
| Total | 2,635 | 100.0% |
Housing Structures by Occupancy in Airmont
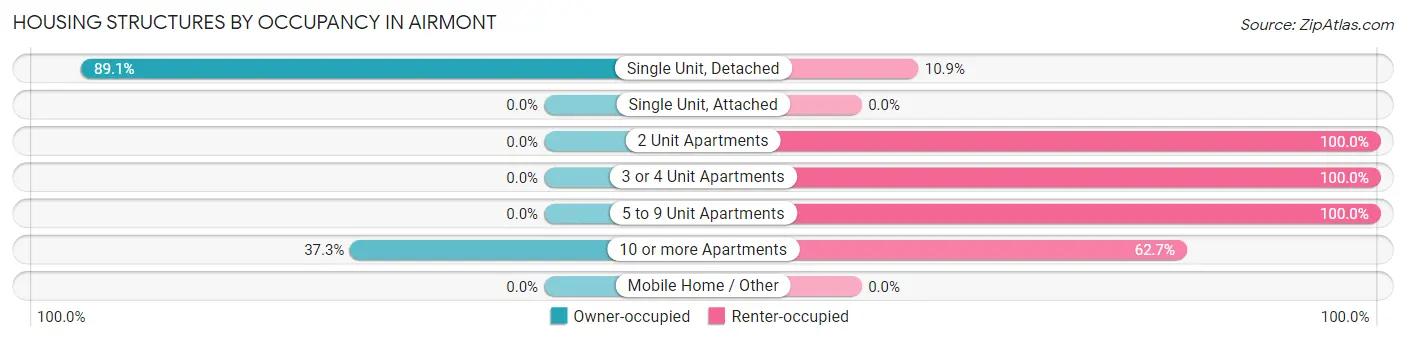
| Structure Type | Owner-occupied | Renter-occupied |
| Single Unit, Detached | 1,872 (89.1%) | 229 (10.9%) |
| Single Unit, Attached | 0 (0.0%) | 0 (0.0%) |
| 2 Unit Apartments | 0 (0.0%) | 84 (100.0%) |
| 3 or 4 Unit Apartments | 0 (0.0%) | 46 (100.0%) |
| 5 to 9 Unit Apartments | 0 (0.0%) | 10 (100.0%) |
| 10 or more Apartments | 147 (37.3%) | 247 (62.7%) |
| Mobile Home / Other | 0 (0.0%) | 0 (0.0%) |
| Total | 2,019 (76.6%) | 616 (23.4%) |
Housing Structures by Number of Rooms in Airmont
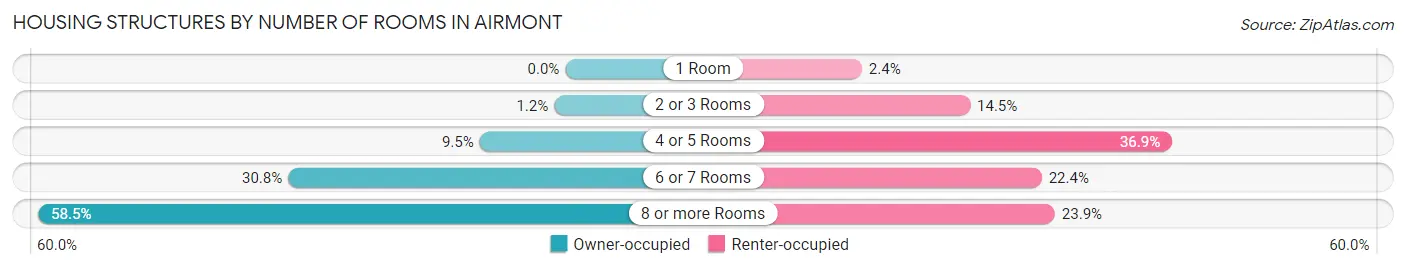
| Number of Rooms | Owner-occupied | Renter-occupied |
| 1 Room | 0 (0.0%) | 15 (2.4%) |
| 2 or 3 Rooms | 25 (1.2%) | 89 (14.4%) |
| 4 or 5 Rooms | 192 (9.5%) | 227 (36.8%) |
| 6 or 7 Rooms | 621 (30.8%) | 138 (22.4%) |
| 8 or more Rooms | 1,181 (58.5%) | 147 (23.9%) |
| Total | 2,019 (100.0%) | 616 (100.0%) |
Housing Structure by Heating Type in Airmont
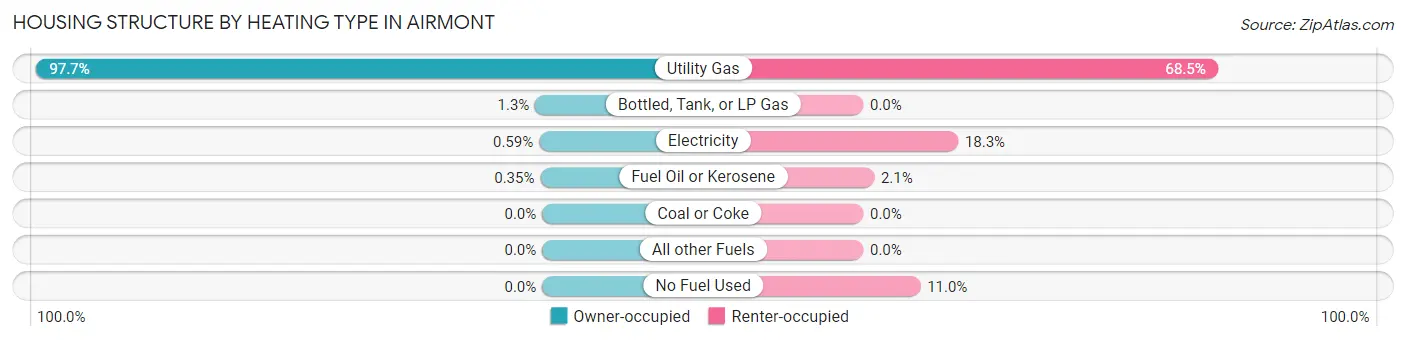
| Heating Type | Owner-occupied | Renter-occupied |
| Utility Gas | 1,973 (97.7%) | 422 (68.5%) |
| Bottled, Tank, or LP Gas | 27 (1.3%) | 0 (0.0%) |
| Electricity | 12 (0.6%) | 113 (18.3%) |
| Fuel Oil or Kerosene | 7 (0.4%) | 13 (2.1%) |
| Coal or Coke | 0 (0.0%) | 0 (0.0%) |
| All other Fuels | 0 (0.0%) | 0 (0.0%) |
| No Fuel Used | 0 (0.0%) | 68 (11.0%) |
| Total | 2,019 (100.0%) | 616 (100.0%) |
Household Vehicle Usage in Airmont
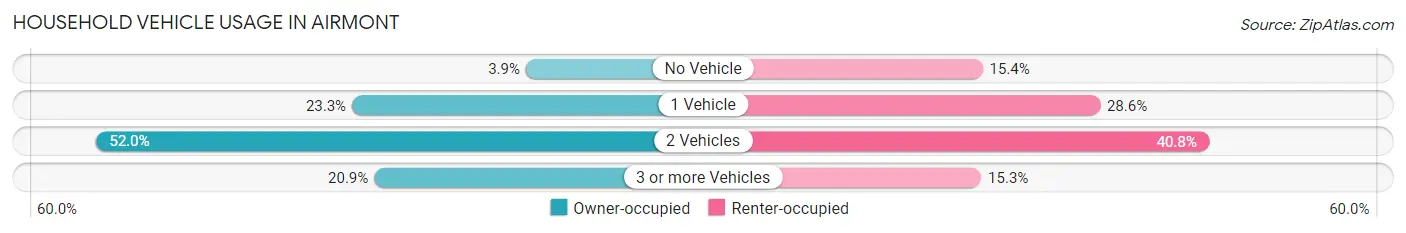
| Vehicles per Household | Owner-occupied | Renter-occupied |
| No Vehicle | 78 (3.9%) | 95 (15.4%) |
| 1 Vehicle | 471 (23.3%) | 176 (28.6%) |
| 2 Vehicles | 1,049 (52.0%) | 251 (40.7%) |
| 3 or more Vehicles | 421 (20.8%) | 94 (15.3%) |
| Total | 2,019 (100.0%) | 616 (100.0%) |
Real Estate & Mortgages in Airmont
Real Estate and Mortgage Overview in Airmont
| Characteristic | Without Mortgage | With Mortgage |
| Housing Units | 601 | 1,418 |
| Median Property Value | $559,700 | $647,200 |
| Median Household Income | $69,028 | $719 |
| Monthly Housing Costs | $1,501 | $1,056 |
| Real Estate Taxes | $10,001 | $20 |
Property Value by Mortgage Status in Airmont
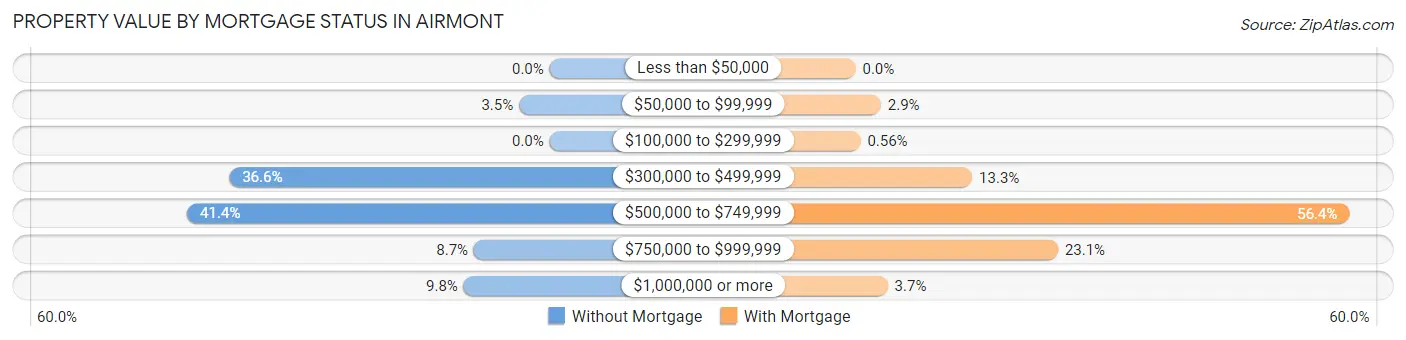
| Property Value | Without Mortgage | With Mortgage |
| Less than $50,000 | 0 (0.0%) | 0 (0.0%) |
| $50,000 to $99,999 | 21 (3.5%) | 41 (2.9%) |
| $100,000 to $299,999 | 0 (0.0%) | 8 (0.6%) |
| $300,000 to $499,999 | 220 (36.6%) | 189 (13.3%) |
| $500,000 to $749,999 | 249 (41.4%) | 800 (56.4%) |
| $750,000 to $999,999 | 52 (8.6%) | 328 (23.1%) |
| $1,000,000 or more | 59 (9.8%) | 52 (3.7%) |
| Total | 601 (100.0%) | 1,418 (100.0%) |
Household Income by Mortgage Status in Airmont
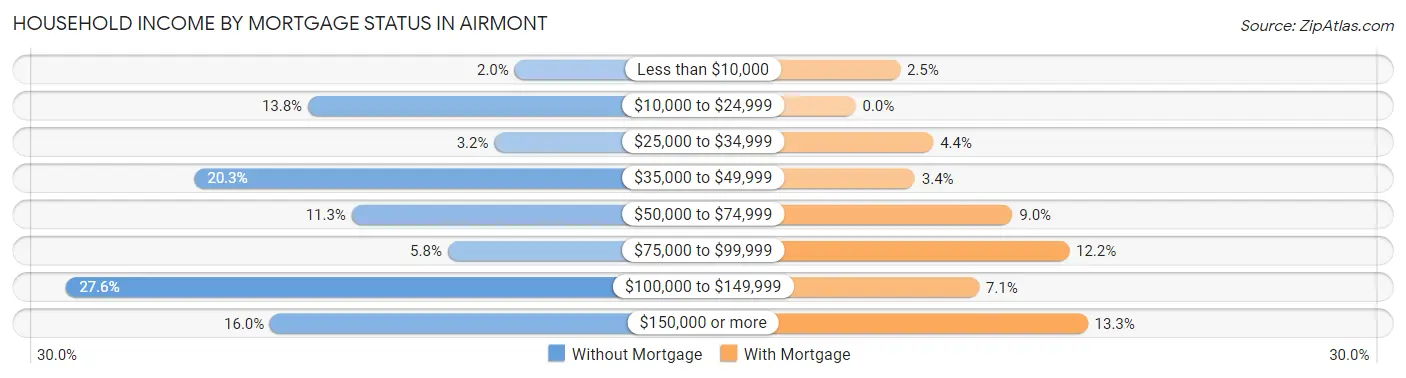
| Household Income | Without Mortgage | With Mortgage |
| Less than $10,000 | 12 (2.0%) | 36 (2.5%) |
| $10,000 to $24,999 | 83 (13.8%) | 0 (0.0%) |
| $25,000 to $34,999 | 19 (3.2%) | 63 (4.4%) |
| $35,000 to $49,999 | 122 (20.3%) | 48 (3.4%) |
| $50,000 to $74,999 | 68 (11.3%) | 127 (9.0%) |
| $75,000 to $99,999 | 35 (5.8%) | 173 (12.2%) |
| $100,000 to $149,999 | 166 (27.6%) | 100 (7.0%) |
| $150,000 or more | 96 (16.0%) | 188 (13.3%) |
| Total | 601 (100.0%) | 1,418 (100.0%) |
Property Value to Household Income Ratio in Airmont
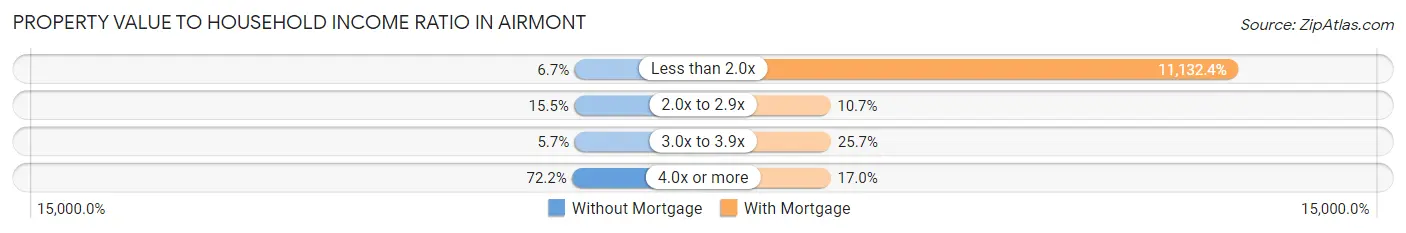
| Value-to-Income Ratio | Without Mortgage | With Mortgage |
| Less than 2.0x | 40 (6.7%) | 157,857 (11,132.4%) |
| 2.0x to 2.9x | 93 (15.5%) | 151 (10.6%) |
| 3.0x to 3.9x | 34 (5.7%) | 365 (25.7%) |
| 4.0x or more | 434 (72.2%) | 241 (17.0%) |
| Total | 601 (100.0%) | 1,418 (100.0%) |
Real Estate Taxes by Mortgage Status in Airmont
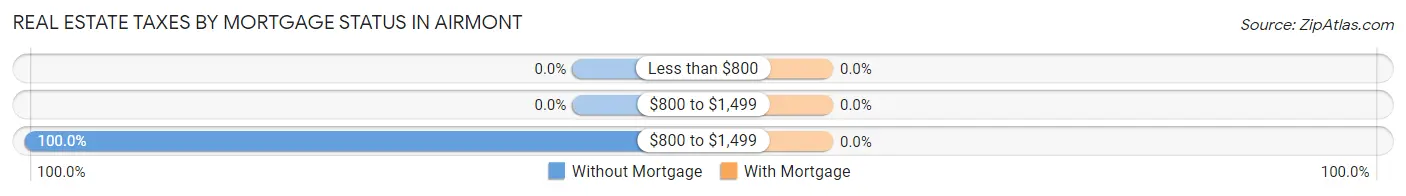
| Property Taxes | Without Mortgage | With Mortgage |
| Less than $800 | 0 (0.0%) | 0 (0.0%) |
| $800 to $1,499 | 0 (0.0%) | 0 (0.0%) |
| $800 to $1,499 | 601 (100.0%) | 0 (0.0%) |
| Total | 601 (100.0%) | 1,418 (100.0%) |
Health & Disability in Airmont
Health Insurance Coverage by Age in Airmont
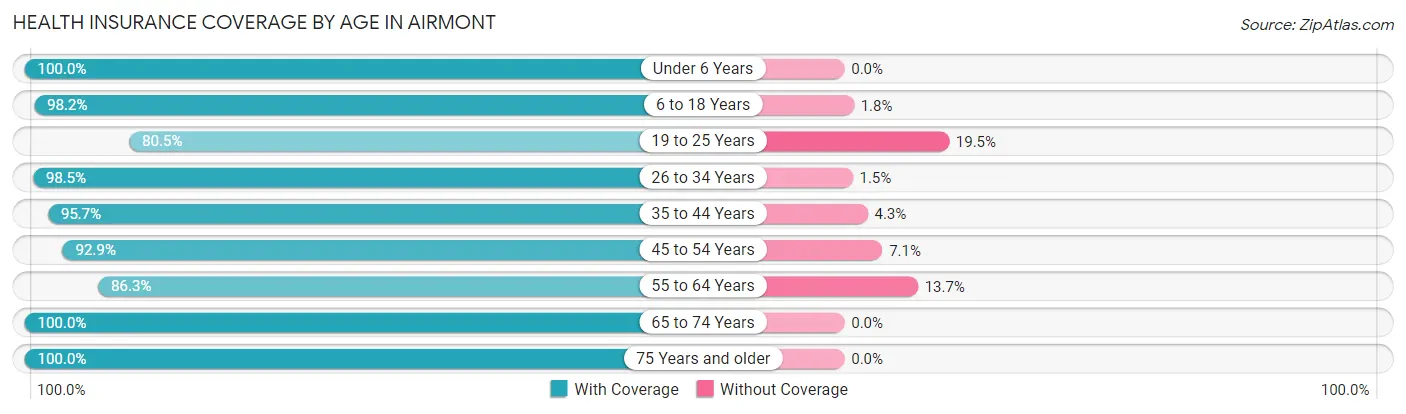
| Age Bracket | With Coverage | Without Coverage |
| Under 6 Years | 871 (100.0%) | 0 (0.0%) |
| 6 to 18 Years | 2,789 (98.2%) | 50 (1.8%) |
| 19 to 25 Years | 809 (80.5%) | 196 (19.5%) |
| 26 to 34 Years | 900 (98.5%) | 14 (1.5%) |
| 35 to 44 Years | 840 (95.7%) | 38 (4.3%) |
| 45 to 54 Years | 1,051 (92.9%) | 80 (7.1%) |
| 55 to 64 Years | 624 (86.3%) | 99 (13.7%) |
| 65 to 74 Years | 807 (100.0%) | 0 (0.0%) |
| 75 Years and older | 703 (100.0%) | 0 (0.0%) |
| Total | 9,394 (95.2%) | 477 (4.8%) |
Health Insurance Coverage by Citizenship Status in Airmont
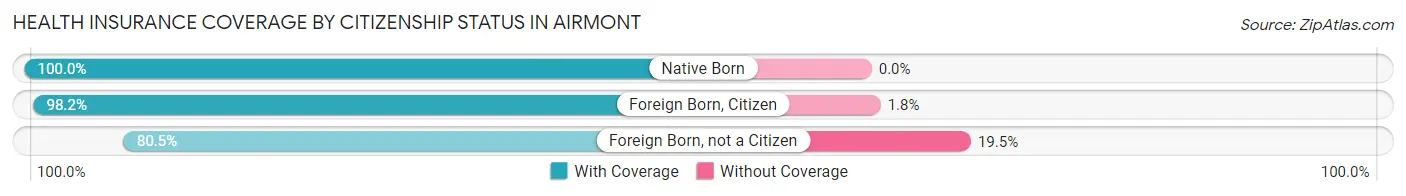
| Citizenship Status | With Coverage | Without Coverage |
| Native Born | 871 (100.0%) | 0 (0.0%) |
| Foreign Born, Citizen | 2,789 (98.2%) | 50 (1.8%) |
| Foreign Born, not a Citizen | 809 (80.5%) | 196 (19.5%) |
Health Insurance Coverage by Household Income in Airmont
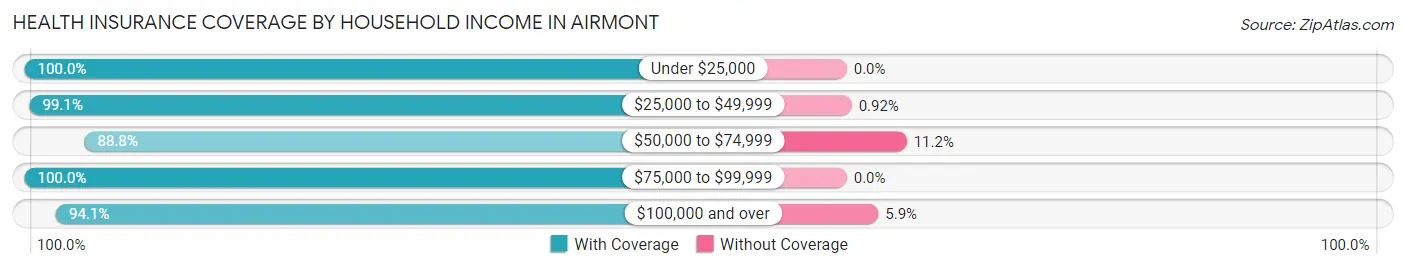
| Household Income | With Coverage | Without Coverage |
| Under $25,000 | 563 (100.0%) | 0 (0.0%) |
| $25,000 to $49,999 | 1,511 (99.1%) | 14 (0.9%) |
| $50,000 to $74,999 | 1,138 (88.8%) | 144 (11.2%) |
| $75,000 to $99,999 | 1,018 (100.0%) | 0 (0.0%) |
| $100,000 and over | 5,081 (94.1%) | 319 (5.9%) |
Public vs Private Health Insurance Coverage by Age in Airmont
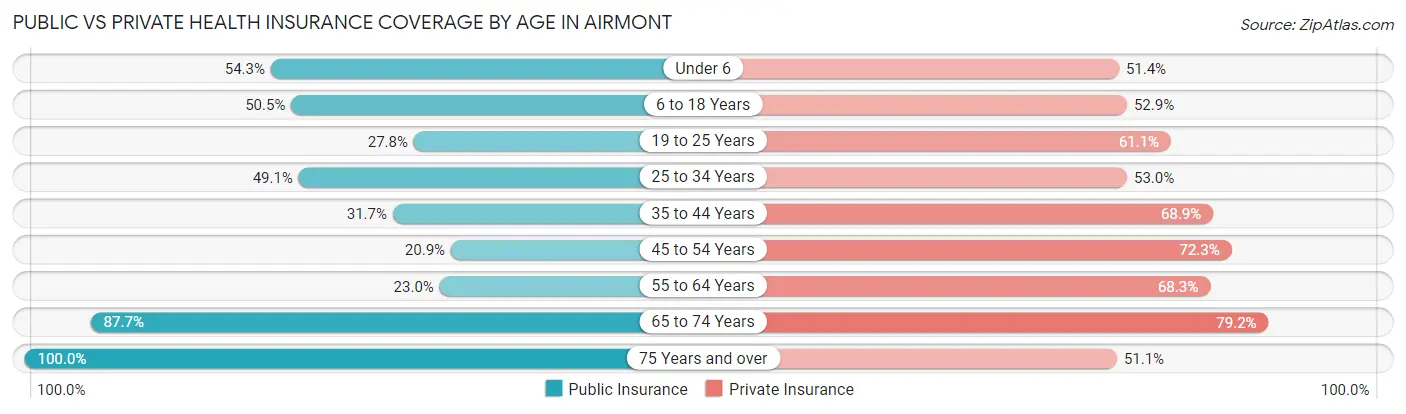
| Age Bracket | Public Insurance | Private Insurance |
| Under 6 | 473 (54.3%) | 448 (51.4%) |
| 6 to 18 Years | 1,434 (50.5%) | 1,503 (52.9%) |
| 19 to 25 Years | 279 (27.8%) | 614 (61.1%) |
| 25 to 34 Years | 449 (49.1%) | 484 (52.9%) |
| 35 to 44 Years | 278 (31.7%) | 605 (68.9%) |
| 45 to 54 Years | 236 (20.9%) | 818 (72.3%) |
| 55 to 64 Years | 166 (23.0%) | 494 (68.3%) |
| 65 to 74 Years | 708 (87.7%) | 639 (79.2%) |
| 75 Years and over | 703 (100.0%) | 359 (51.1%) |
| Total | 4,726 (47.9%) | 5,964 (60.4%) |
Disability Status by Sex by Age in Airmont
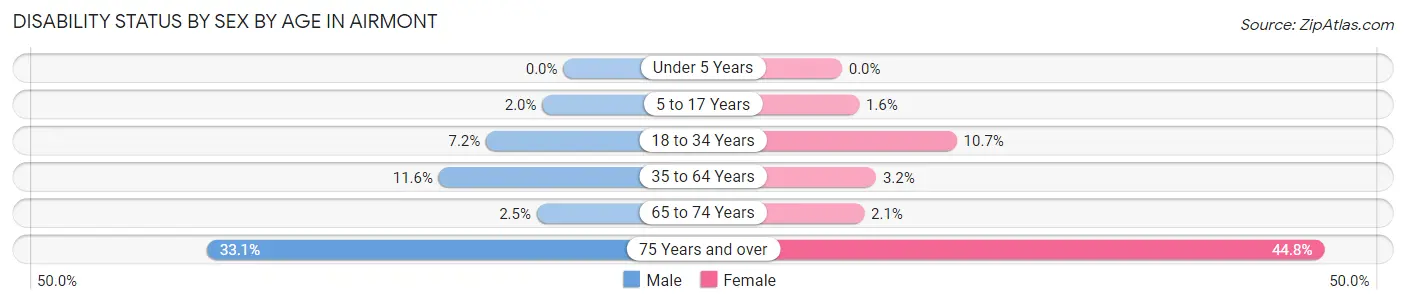
| Age Bracket | Male | Female |
| Under 5 Years | 0 (0.0%) | 0 (0.0%) |
| 5 to 17 Years | 24 (1.9%) | 22 (1.6%) |
| 18 to 34 Years | 88 (7.2%) | 116 (10.7%) |
| 35 to 64 Years | 148 (11.6%) | 46 (3.2%) |
| 65 to 74 Years | 8 (2.5%) | 10 (2.1%) |
| 75 Years and over | 87 (33.1%) | 197 (44.8%) |
Disability Class by Sex by Age in Airmont
Disability Class: Hearing Difficulty
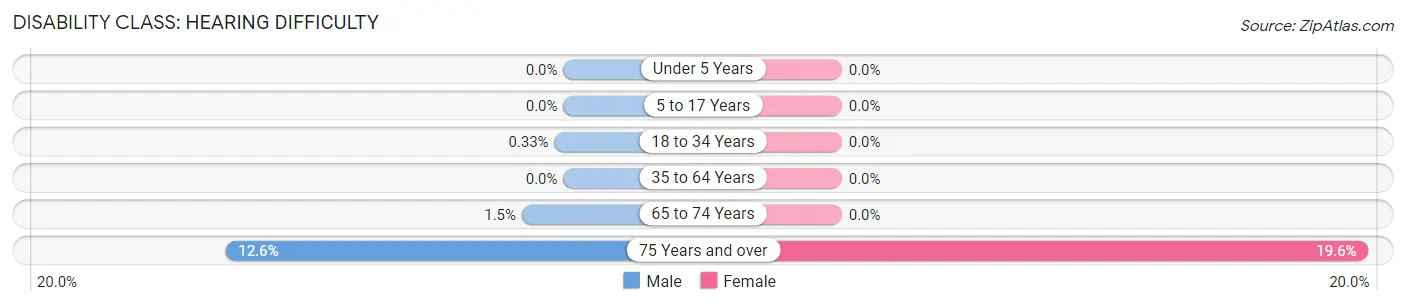
| Age Bracket | Male | Female |
| Under 5 Years | 0 (0.0%) | 0 (0.0%) |
| 5 to 17 Years | 0 (0.0%) | 0 (0.0%) |
| 18 to 34 Years | 4 (0.3%) | 0 (0.0%) |
| 35 to 64 Years | 0 (0.0%) | 0 (0.0%) |
| 65 to 74 Years | 5 (1.5%) | 0 (0.0%) |
| 75 Years and over | 33 (12.6%) | 86 (19.6%) |
Disability Class: Vision Difficulty
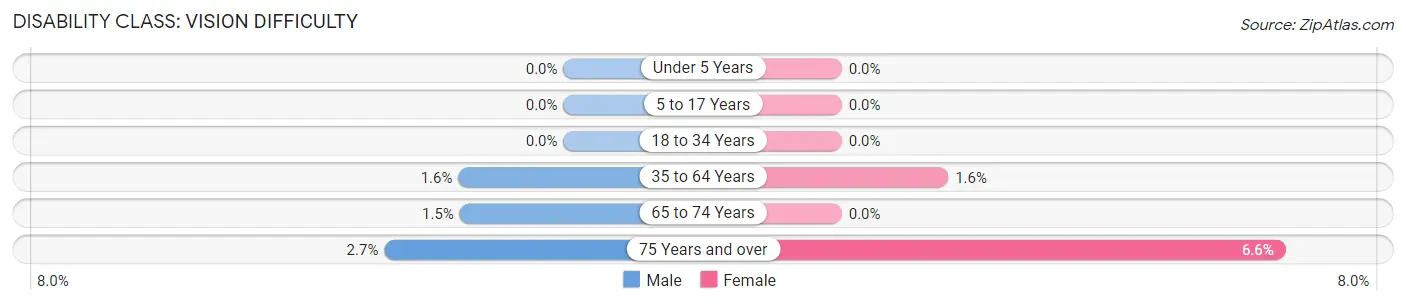
| Age Bracket | Male | Female |
| Under 5 Years | 0 (0.0%) | 0 (0.0%) |
| 5 to 17 Years | 0 (0.0%) | 0 (0.0%) |
| 18 to 34 Years | 0 (0.0%) | 0 (0.0%) |
| 35 to 64 Years | 20 (1.6%) | 23 (1.6%) |
| 65 to 74 Years | 5 (1.5%) | 0 (0.0%) |
| 75 Years and over | 7 (2.7%) | 29 (6.6%) |
Disability Class: Cognitive Difficulty
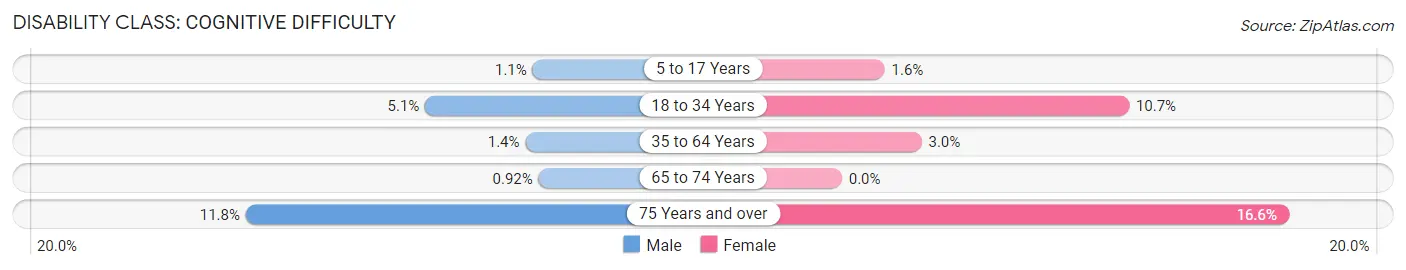
| Age Bracket | Male | Female |
| 5 to 17 Years | 14 (1.1%) | 22 (1.6%) |
| 18 to 34 Years | 63 (5.1%) | 116 (10.7%) |
| 35 to 64 Years | 18 (1.4%) | 43 (3.0%) |
| 65 to 74 Years | 3 (0.9%) | 0 (0.0%) |
| 75 Years and over | 31 (11.8%) | 73 (16.6%) |
Disability Class: Ambulatory Difficulty
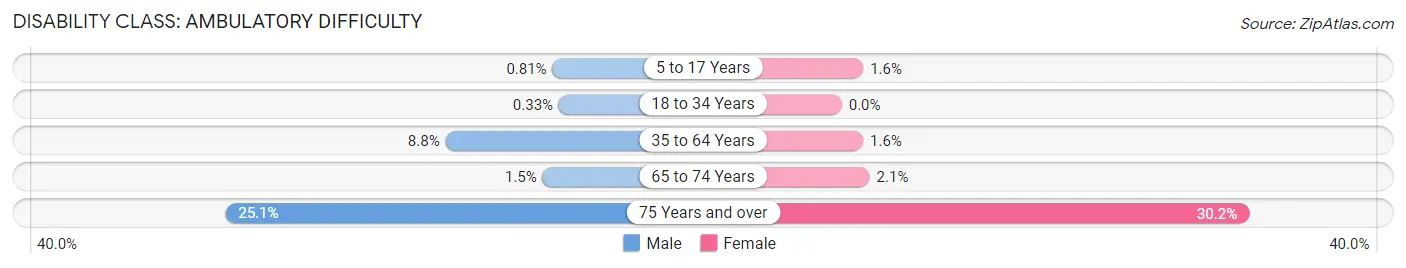
| Age Bracket | Male | Female |
| 5 to 17 Years | 10 (0.8%) | 22 (1.6%) |
| 18 to 34 Years | 4 (0.3%) | 0 (0.0%) |
| 35 to 64 Years | 112 (8.7%) | 23 (1.6%) |
| 65 to 74 Years | 5 (1.5%) | 10 (2.1%) |
| 75 Years and over | 66 (25.1%) | 133 (30.2%) |
Disability Class: Self-Care Difficulty
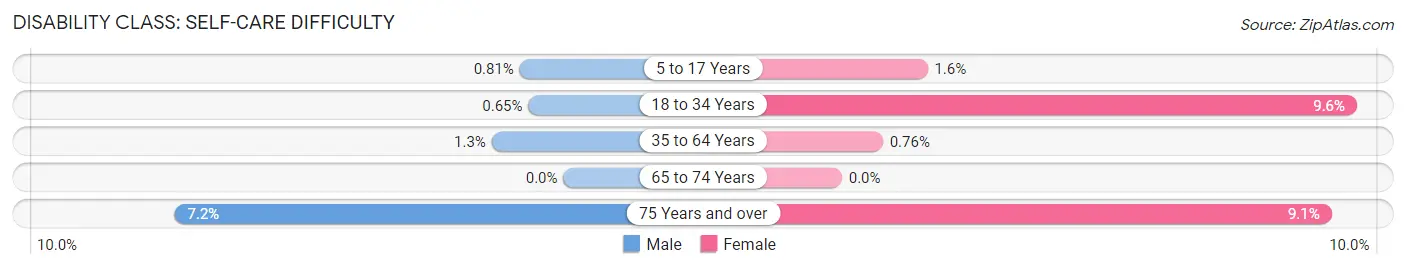
| Age Bracket | Male | Female |
| 5 to 17 Years | 10 (0.8%) | 22 (1.6%) |
| 18 to 34 Years | 8 (0.6%) | 104 (9.6%) |
| 35 to 64 Years | 17 (1.3%) | 11 (0.8%) |
| 65 to 74 Years | 0 (0.0%) | 0 (0.0%) |
| 75 Years and over | 19 (7.2%) | 40 (9.1%) |
Technology Access in Airmont
Computing Device Access in Airmont
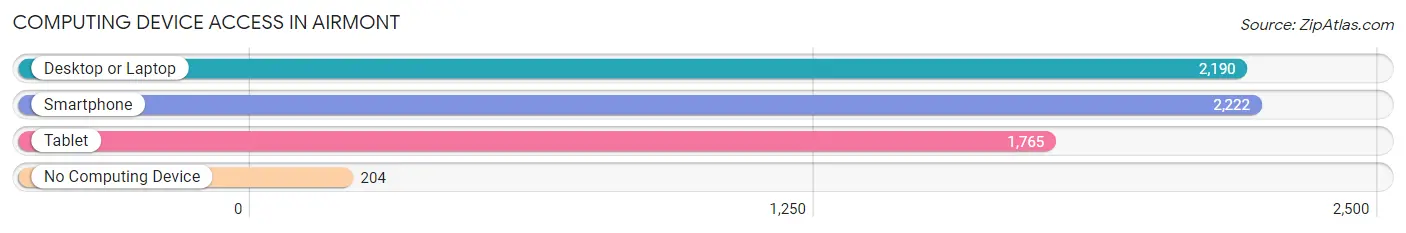
| Device Type | # Households | % Households |
| Desktop or Laptop | 2,190 | 83.1% |
| Smartphone | 2,222 | 84.3% |
| Tablet | 1,765 | 67.0% |
| No Computing Device | 204 | 7.7% |
| Total | 2,635 | 100.0% |
Internet Access in Airmont
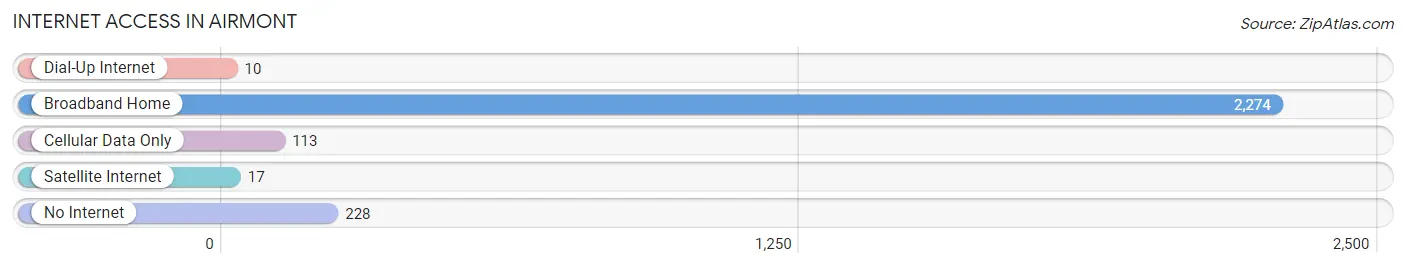
| Internet Type | # Households | % Households |
| Dial-Up Internet | 10 | 0.4% |
| Broadband Home | 2,274 | 86.3% |
| Cellular Data Only | 113 | 4.3% |
| Satellite Internet | 17 | 0.6% |
| No Internet | 228 | 8.6% |
| Total | 2,635 | 100.0% |
Airmont Summary
Airmont is a village located in the town of Ramapo in Rockland County, New York. It is located approximately 25 miles northwest of New York City. The village was incorporated in 1991 and has a population of 8,620 as of the 2010 census.
History
The area that is now Airmont was originally inhabited by the Munsee Native Americans. The first European settlers arrived in the area in the late 1700s. The area was known as “New Hempstead” and was part of the town of Ramapo. In 1809, the area was renamed “Airmont” after the nearby mountain.
In the late 1800s, the area began to develop as a summer resort destination. The village was home to several large hotels and resorts, including the Airmont House, the Airmont Hotel, and the Airmont Inn. The village also had a post office, a school, and a train station.
In the early 1900s, the village began to decline as a resort destination. The hotels and resorts closed and the population decreased. In the 1950s, the village began to experience a resurgence as a residential community. The population began to grow and the village was incorporated in 1991.
Geography
Airmont is located in the town of Ramapo in Rockland County, New York. It is located approximately 25 miles northwest of New York City. The village is bordered by the towns of Clarkstown to the north, Orangetown to the east, and Ramapo to the south and west.
The village has a total area of 2.2 square miles, all of which is land. The terrain is mostly hilly and the highest point in the village is the summit of Airmont Mountain, which has an elevation of 1,068 feet.
Economy
The economy of Airmont is largely based on retail and services. The village is home to several shopping centers, including the Airmont Shopping Center and the Airmont Plaza Shopping Center. The village is also home to several restaurants, banks, and other businesses.
The village is also home to several manufacturing companies, including the Airmont Manufacturing Company and the Airmont Tool and Die Company. The village is also home to several medical facilities, including the Airmont Medical Center and the Airmont Surgical Center.
Demographics
As of the 2010 census, the population of Airmont was 8,620. The racial makeup of the village was 79.3% White, 8.2% African American, 0.2% Native American, 6.2% Asian, and 4.9% from other races. Hispanic or Latino of any race were 11.3% of the population.
The median household income in the village was $90,945 and the median family income was $103,945. The per capita income in the village was $37,945. About 4.2% of families and 5.3% of the population were below the poverty line.
Common Questions
What is Per Capita Income in Airmont?
Per Capita income in Airmont is $38,382.
What is the Median Family Income in Airmont?
Median Family Income in Airmont is $116,050.
What is the Median Household income in Airmont?
Median Household Income in Airmont is $101,612.
What is Income or Wage Gap in Airmont?
Income or Wage Gap in Airmont is 28.4%.
Women in Airmont earn 71.6 cents for every dollar earned by a man.
What is Family Income Deficit in Airmont?
Family Income Deficit in Airmont is $9,445.
Families that are below poverty line in Airmont earn $9,445 less on average than the poverty threshold level.
What is Inequality or Gini Index in Airmont?
Inequality or Gini Index in Airmont is 0.45.
What is the Total Population of Airmont?
Total Population of Airmont is 10,020.
What is the Total Male Population of Airmont?
Total Male Population of Airmont is 4,697.
What is the Total Female Population of Airmont?
Total Female Population of Airmont is 5,323.
What is the Ratio of Males per 100 Females in Airmont?
There are 88.24 Males per 100 Females in Airmont.
What is the Ratio of Females per 100 Males in Airmont?
There are 113.33 Females per 100 Males in Airmont.
What is the Median Population Age in Airmont?
Median Population Age in Airmont is 28.8 Years.
What is the Average Family Size in Airmont
Average Family Size in Airmont is 4.2 People.
What is the Average Household Size in Airmont
Average Household Size in Airmont is 3.7 People.
How Large is the Labor Force in Airmont?
There are 3,748 People in the Labor Forcein in Airmont.
What is the Percentage of People in the Labor Force in Airmont?
53.2% of People are in the Labor Force in Airmont.
What is the Unemployment Rate in Airmont?
Unemployment Rate in Airmont is 7.3%.