South Glens Falls, NY Map & Demographics
South Glens Falls Map
South Glens Falls Overview
$43,915
PER CAPITA INCOME
$66,791
AVG FAMILY INCOME
$57,336
AVG HOUSEHOLD INCOME
33.4%
WAGE / INCOME GAP [ % ]
66.6¢/ $1
WAGE / INCOME GAP [ $ ]
0.54
INEQUALITY / GINI INDEX
3,739
TOTAL POPULATION
1,886
MALE POPULATION
1,853
FEMALE POPULATION
101.78
MALES / 100 FEMALES
98.25
FEMALES / 100 MALES
38.0
MEDIAN AGE
2.8
AVG FAMILY SIZE
2.2
AVG HOUSEHOLD SIZE
2,280
LABOR FORCE [ PEOPLE ]
72.9%
PERCENT IN LABOR FORCE
7.2%
UNEMPLOYMENT RATE
South Glens Falls Zip Codes
South Glens Falls Area Codes
Income in South Glens Falls
Income Overview in South Glens Falls
Per Capita Income in South Glens Falls is $43,915, while median incomes of families and households are $66,791 and $57,336 respectively.
| Characteristic | Number | Measure |
| Per Capita Income | 3,739 | $43,915 |
| Median Family Income | 907 | $66,791 |
| Mean Family Income | 907 | $130,042 |
| Median Household Income | 1,683 | $57,336 |
| Mean Household Income | 1,683 | $98,421 |
| Income Deficit | 907 | $0 |
| Wage / Income Gap (%) | 3,739 | 33.43% |
| Wage / Income Gap ($) | 3,739 | 66.57¢ per $1 |
| Gini / Inequality Index | 3,739 | 0.54 |
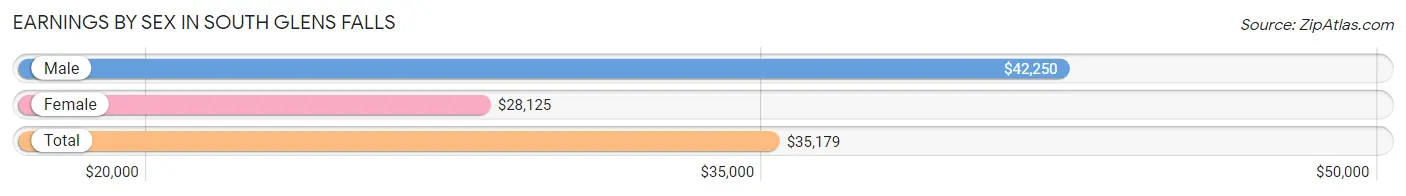
Earnings by Sex in South Glens Falls
Average Earnings in South Glens Falls are $35,179, $42,250 for men and $28,125 for women, a difference of 33.4%.
| Sex | Number | Average Earnings |
| Male | 1,268 (57.0%) | $42,250 |
| Female | 957 (43.0%) | $28,125 |
| Total | 2,225 (100.0%) | $35,179 |
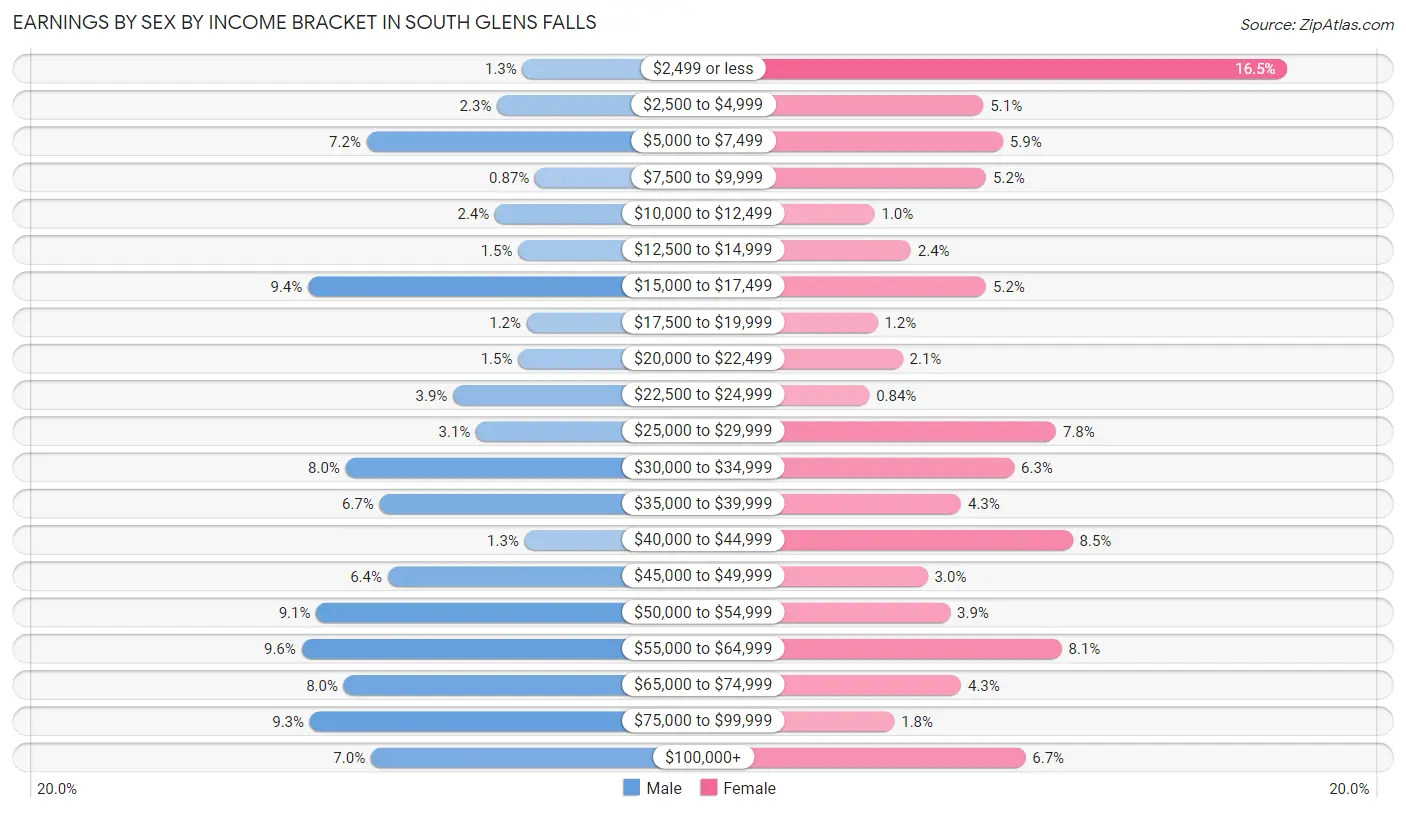
Earnings by Sex by Income Bracket in South Glens Falls
The most common earnings brackets in South Glens Falls are $55,000 to $64,999 for men (122 | 9.6%) and $2,499 or less for women (158 | 16.5%).
| Income | Male | Female |
| $2,499 or less | 17 (1.3%) | 158 (16.5%) |
| $2,500 to $4,999 | 29 (2.3%) | 49 (5.1%) |
| $5,000 to $7,499 | 91 (7.2%) | 56 (5.9%) |
| $7,500 to $9,999 | 11 (0.9%) | 50 (5.2%) |
| $10,000 to $12,499 | 30 (2.4%) | 10 (1.0%) |
| $12,500 to $14,999 | 19 (1.5%) | 23 (2.4%) |
| $15,000 to $17,499 | 119 (9.4%) | 50 (5.2%) |
| $17,500 to $19,999 | 15 (1.2%) | 11 (1.1%) |
| $20,000 to $22,499 | 19 (1.5%) | 20 (2.1%) |
| $22,500 to $24,999 | 50 (3.9%) | 8 (0.8%) |
| $25,000 to $29,999 | 39 (3.1%) | 75 (7.8%) |
| $30,000 to $34,999 | 101 (8.0%) | 60 (6.3%) |
| $35,000 to $39,999 | 85 (6.7%) | 41 (4.3%) |
| $40,000 to $44,999 | 16 (1.3%) | 81 (8.5%) |
| $45,000 to $49,999 | 81 (6.4%) | 29 (3.0%) |
| $50,000 to $54,999 | 115 (9.1%) | 37 (3.9%) |
| $55,000 to $64,999 | 122 (9.6%) | 77 (8.1%) |
| $65,000 to $74,999 | 102 (8.0%) | 41 (4.3%) |
| $75,000 to $99,999 | 118 (9.3%) | 17 (1.8%) |
| $100,000+ | 89 (7.0%) | 64 (6.7%) |
| Total | 1,268 (100.0%) | 957 (100.0%) |
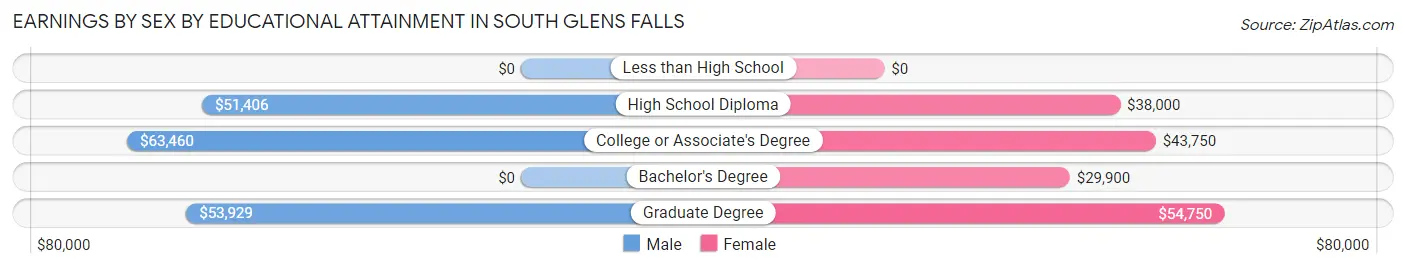
Earnings by Sex by Educational Attainment in South Glens Falls
Average earnings in South Glens Falls are $52,652 for men and $41,786 for women, a difference of 20.6%. Men with an educational attainment of college or associate's degree enjoy the highest average annual earnings of $63,460, while those with high school diploma education earn the least with $51,406. Women with an educational attainment of graduate degree earn the most with the average annual earnings of $54,750, while those with bachelor's degree education have the smallest earnings of $29,900.
| Educational Attainment | Male Income | Female Income |
| Less than High School | - | - |
| High School Diploma | $51,406 | $38,000 |
| College or Associate's Degree | $63,460 | $43,750 |
| Bachelor's Degree | - | - |
| Graduate Degree | $53,929 | $54,750 |
| Total | $52,652 | $41,786 |
Family Income in South Glens Falls
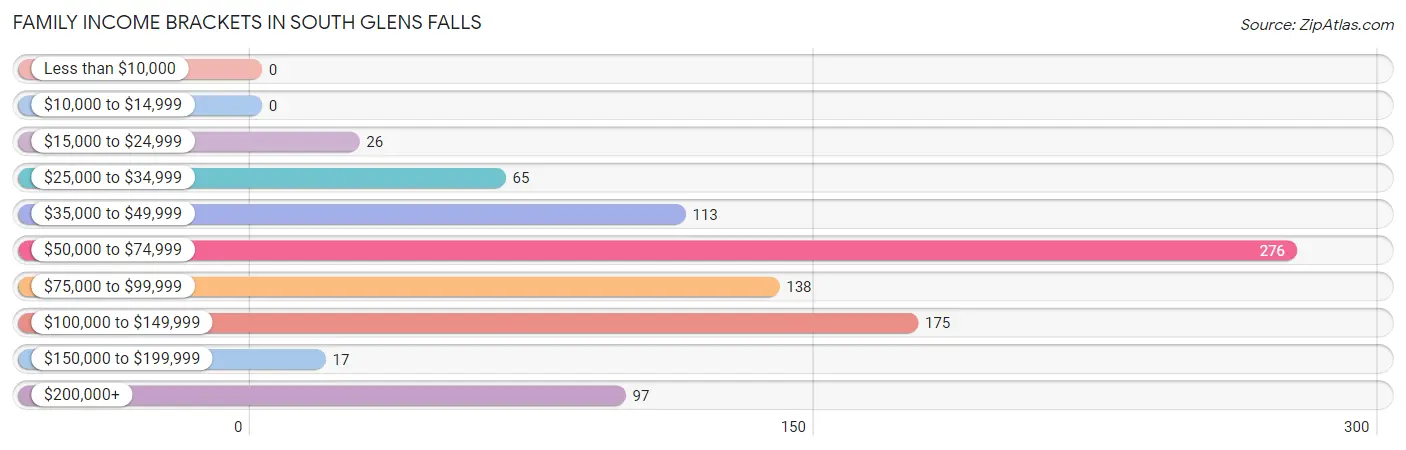
Family Income Brackets in South Glens Falls
According to the South Glens Falls family income data, there are 276 families falling into the $50,000 to $74,999 income range, which is the most common income bracket and makes up 30.4% of all families.
| Income Bracket | # Families | % Families |
| Less than $10,000 | 0 | 0.0% |
| $10,000 to $14,999 | 0 | 0.0% |
| $15,000 to $24,999 | 26 | 2.9% |
| $25,000 to $34,999 | 65 | 7.2% |
| $35,000 to $49,999 | 113 | 12.5% |
| $50,000 to $74,999 | 276 | 30.4% |
| $75,000 to $99,999 | 138 | 15.2% |
| $100,000 to $149,999 | 175 | 19.3% |
| $150,000 to $199,999 | 17 | 1.9% |
| $200,000+ | 97 | 10.7% |
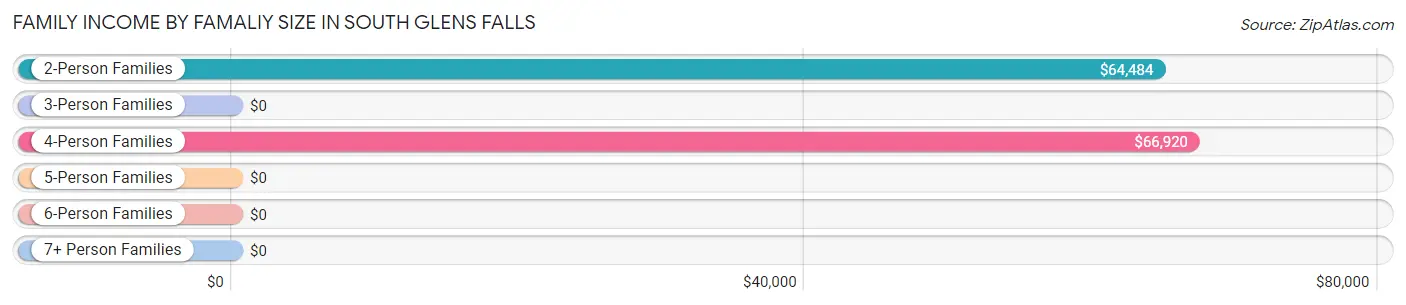
Family Income by Famaliy Size in South Glens Falls
4-person families (139 | 15.3%) account for the highest median family income in South Glens Falls with $66,920 per family, while 2-person families (407 | 44.9%) have the highest median income of $32,242 per family member.
| Income Bracket | # Families | Median Income |
| 2-Person Families | 407 (44.9%) | $64,484 |
| 3-Person Families | 296 (32.6%) | $0 |
| 4-Person Families | 139 (15.3%) | $66,920 |
| 5-Person Families | 38 (4.2%) | $0 |
| 6-Person Families | 27 (3.0%) | $0 |
| 7+ Person Families | 0 (0.0%) | $0 |
| Total | 907 (100.0%) | $66,791 |
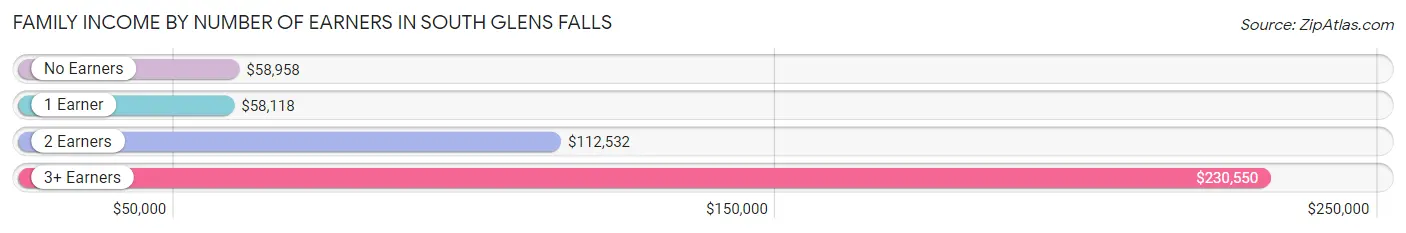
Family Income by Number of Earners in South Glens Falls
The median family income in South Glens Falls is $66,791, with families comprising 3+ earners (113) having the highest median family income of $230,550, while families with 1 earner (391) have the lowest median family income of $58,118, accounting for 12.5% and 43.1% of families, respectively.
| Number of Earners | # Families | Median Income |
| No Earners | 116 (12.8%) | $58,958 |
| 1 Earner | 391 (43.1%) | $58,118 |
| 2 Earners | 287 (31.6%) | $112,532 |
| 3+ Earners | 113 (12.5%) | $230,550 |
| Total | 907 (100.0%) | $66,791 |
Household Income in South Glens Falls
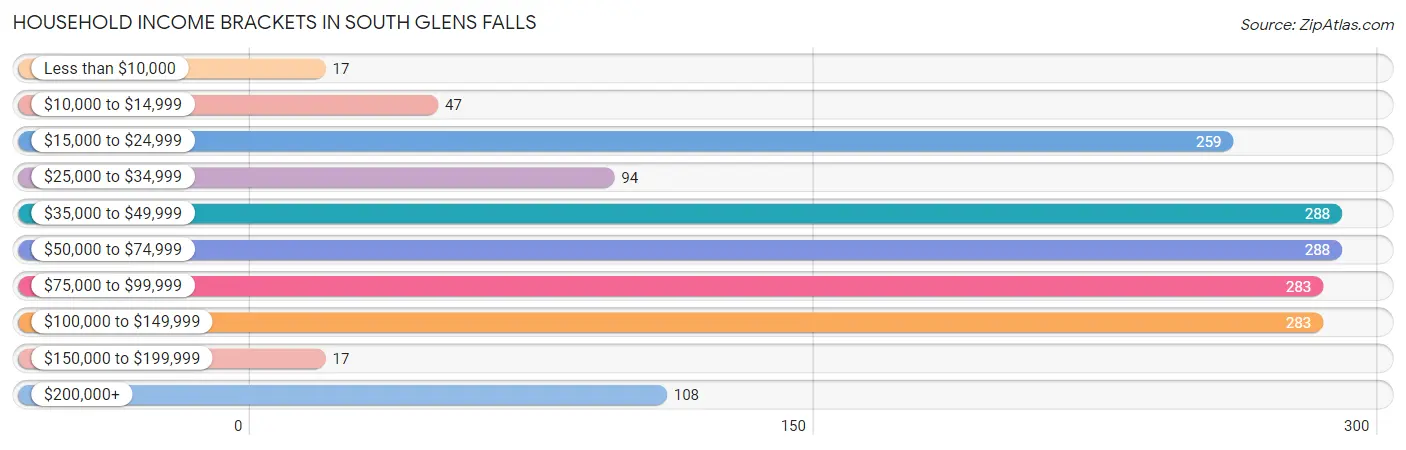
Household Income Brackets in South Glens Falls
With 288 households falling in the category, the $35,000 to $49,999 income range is the most frequent in South Glens Falls, accounting for 17.1% of all households. In contrast, only 17 households (1.0%) fall into the less than $10,000 income bracket, making it the least populous group.
| Income Bracket | # Households | % Households |
| Less than $10,000 | 17 | 1.0% |
| $10,000 to $14,999 | 47 | 2.8% |
| $15,000 to $24,999 | 259 | 15.4% |
| $25,000 to $34,999 | 94 | 5.6% |
| $35,000 to $49,999 | 288 | 17.1% |
| $50,000 to $74,999 | 288 | 17.1% |
| $75,000 to $99,999 | 283 | 16.8% |
| $100,000 to $149,999 | 283 | 16.8% |
| $150,000 to $199,999 | 17 | 1.0% |
| $200,000+ | 108 | 6.4% |
Household Income by Householder Age in South Glens Falls
The median household income in South Glens Falls is $57,336, with the highest median household income of $86,354 found in the 45 to 64 years age bracket for the primary householder. A total of 473 households (28.1%) fall into this category. Meanwhile, the 15 to 24 years age bracket for the primary householder has the lowest median household income of $0, with 183 households (10.9%) in this group.
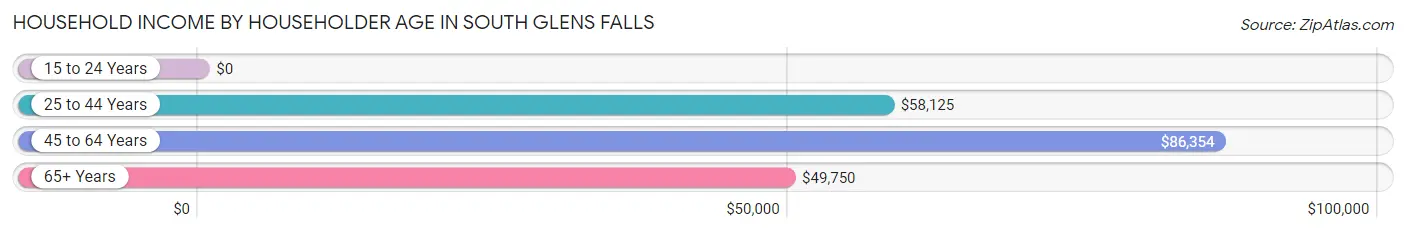
| Income Bracket | # Households | Median Income |
| 15 to 24 Years | 183 (10.9%) | $0 |
| 25 to 44 Years | 486 (28.9%) | $58,125 |
| 45 to 64 Years | 473 (28.1%) | $86,354 |
| 65+ Years | 541 (32.1%) | $49,750 |
| Total | 1,683 (100.0%) | $57,336 |
Poverty in South Glens Falls
Income Below Poverty by Sex and Age in South Glens Falls
With 8.5% poverty level for males and 11.8% for females among the residents of South Glens Falls, 18 to 24 year old males and 16 and 17 year old females are the most vulnerable to poverty, with 74 males (21.9%) and 12 females (38.7%) in their respective age groups living below the poverty level.
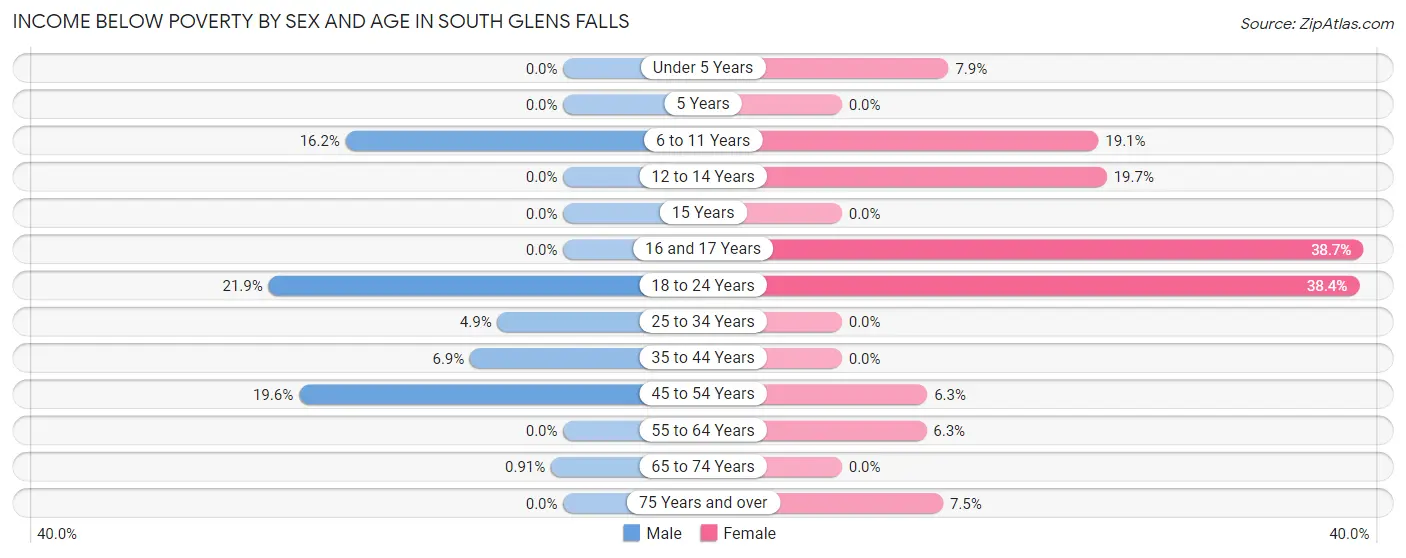
| Age Bracket | Male | Female |
| Under 5 Years | 0 (0.0%) | 8 (7.9%) |
| 5 Years | 0 (0.0%) | 0 (0.0%) |
| 6 to 11 Years | 16 (16.2%) | 24 (19.1%) |
| 12 to 14 Years | 0 (0.0%) | 12 (19.7%) |
| 15 Years | 0 (0.0%) | 0 (0.0%) |
| 16 and 17 Years | 0 (0.0%) | 12 (38.7%) |
| 18 to 24 Years | 74 (21.9%) | 126 (38.4%) |
| 25 to 34 Years | 9 (4.9%) | 0 (0.0%) |
| 35 to 44 Years | 27 (6.9%) | 0 (0.0%) |
| 45 to 54 Years | 32 (19.6%) | 9 (6.3%) |
| 55 to 64 Years | 0 (0.0%) | 15 (6.3%) |
| 65 to 74 Years | 2 (0.9%) | 0 (0.0%) |
| 75 Years and over | 0 (0.0%) | 13 (7.5%) |
| Total | 160 (8.5%) | 219 (11.8%) |
Income Above Poverty by Sex and Age in South Glens Falls
According to the poverty statistics in South Glens Falls, males aged under 5 years and females aged 5 years are the age groups that are most secure financially, with 100.0% of males and 100.0% of females in these age groups living above the poverty line.
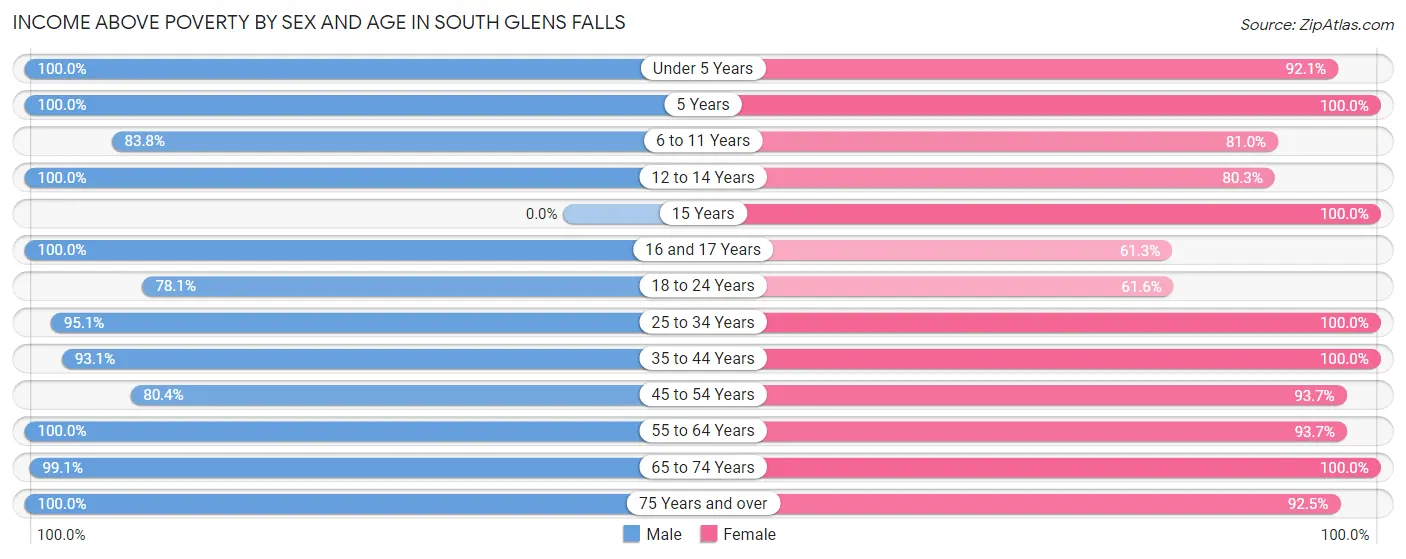
| Age Bracket | Male | Female |
| Under 5 Years | 103 (100.0%) | 93 (92.1%) |
| 5 Years | 9 (100.0%) | 22 (100.0%) |
| 6 to 11 Years | 83 (83.8%) | 102 (80.9%) |
| 12 to 14 Years | 72 (100.0%) | 49 (80.3%) |
| 15 Years | 0 (0.0%) | 8 (100.0%) |
| 16 and 17 Years | 15 (100.0%) | 19 (61.3%) |
| 18 to 24 Years | 264 (78.1%) | 202 (61.6%) |
| 25 to 34 Years | 175 (95.1%) | 139 (100.0%) |
| 35 to 44 Years | 363 (93.1%) | 256 (100.0%) |
| 45 to 54 Years | 131 (80.4%) | 133 (93.7%) |
| 55 to 64 Years | 216 (100.0%) | 224 (93.7%) |
| 65 to 74 Years | 217 (99.1%) | 227 (100.0%) |
| 75 Years and over | 68 (100.0%) | 160 (92.5%) |
| Total | 1,716 (91.5%) | 1,634 (88.2%) |
Income Below Poverty Among Married-Couple Families in South Glens Falls
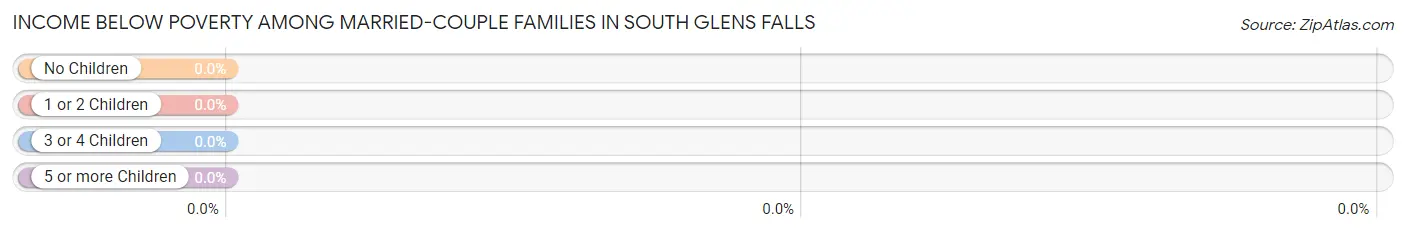
| Children | Above Poverty | Below Poverty |
| No Children | 354 (100.0%) | 0 (0.0%) |
| 1 or 2 Children | 140 (100.0%) | 0 (0.0%) |
| 3 or 4 Children | 27 (100.0%) | 0 (0.0%) |
| 5 or more Children | 0 (0.0%) | 0 (0.0%) |
| Total | 521 (100.0%) | 0 (0.0%) |
Income Below Poverty Among Single-Parent Households in South Glens Falls
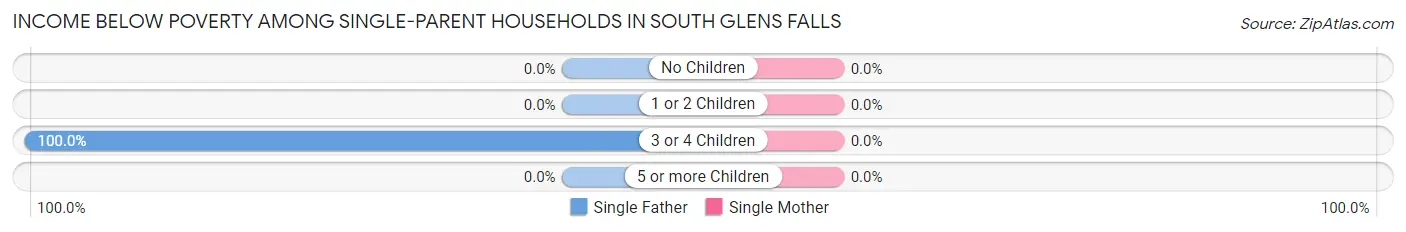
| Children | Single Father | Single Mother |
| No Children | 0 (0.0%) | 0 (0.0%) |
| 1 or 2 Children | 0 (0.0%) | 0 (0.0%) |
| 3 or 4 Children | 22 (100.0%) | 0 (0.0%) |
| 5 or more Children | 0 (0.0%) | 0 (0.0%) |
| Total | 22 (11.4%) | 0 (0.0%) |
Income Below Poverty Among Married-Couple vs Single-Parent Households in South Glens Falls
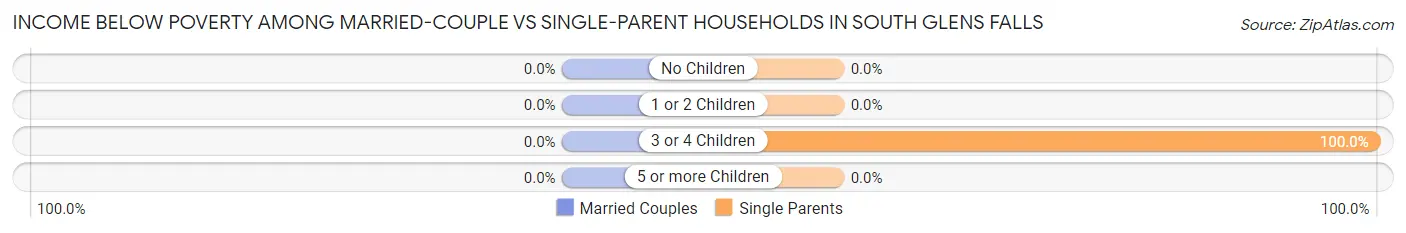
| Children | Married-Couple Families | Single-Parent Households |
| No Children | 0 (0.0%) | 0 (0.0%) |
| 1 or 2 Children | 0 (0.0%) | 0 (0.0%) |
| 3 or 4 Children | 0 (0.0%) | 22 (100.0%) |
| 5 or more Children | 0 (0.0%) | 0 (0.0%) |
| Total | 0 (0.0%) | 22 (5.7%) |
Race in South Glens Falls
The most populous races in South Glens Falls are White / Caucasian (3,448 | 92.2%), Hispanic or Latino (198 | 5.3%), and Two or more Races (150 | 4.0%).
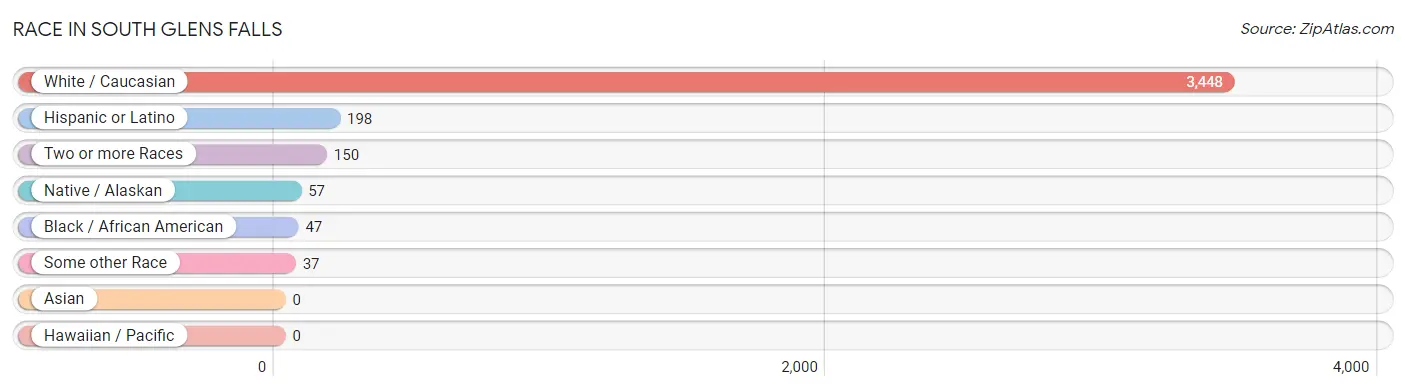
| Race | # Population | % Population |
| Asian | 0 | 0.0% |
| Black / African American | 47 | 1.3% |
| Hawaiian / Pacific | 0 | 0.0% |
| Hispanic or Latino | 198 | 5.3% |
| Native / Alaskan | 57 | 1.5% |
| White / Caucasian | 3,448 | 92.2% |
| Two or more Races | 150 | 4.0% |
| Some other Race | 37 | 1.0% |
| Total | 3,739 | 100.0% |
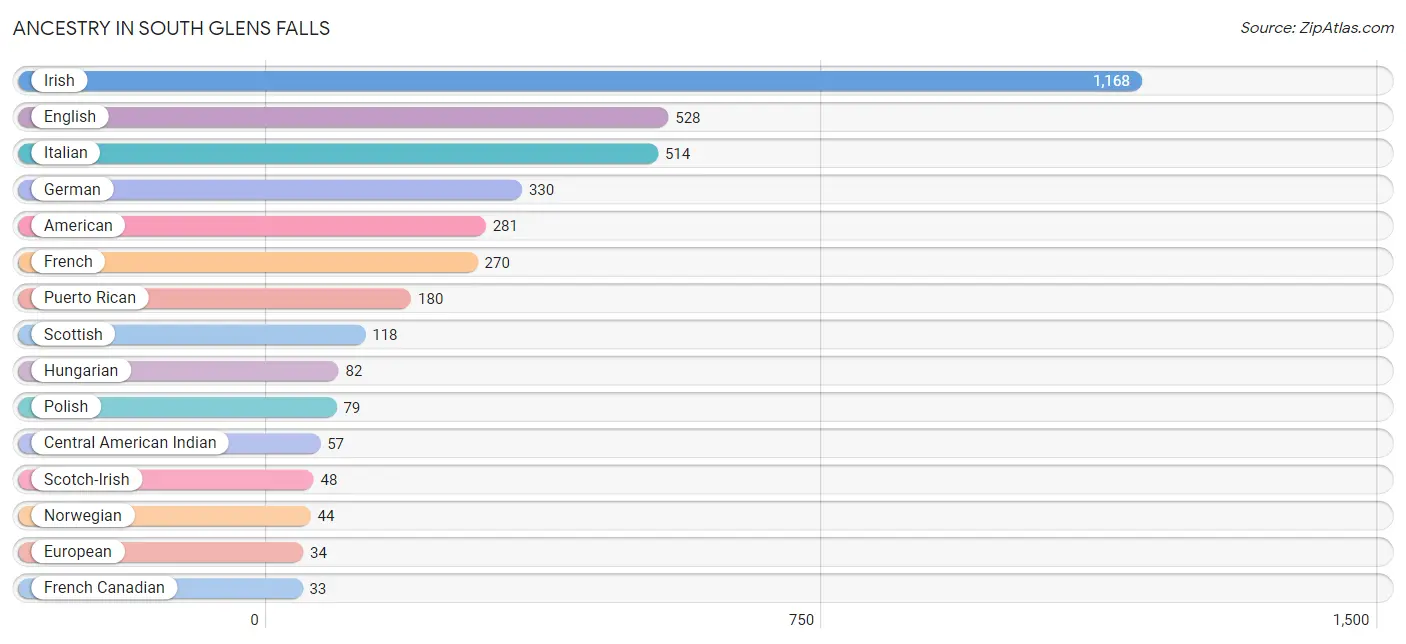
Ancestry in South Glens Falls
The most populous ancestries reported in South Glens Falls are Irish (1,168 | 31.2%), English (528 | 14.1%), Italian (514 | 13.8%), German (330 | 8.8%), and American (281 | 7.5%), together accounting for 75.5% of all South Glens Falls residents.
| Ancestry | # Population | % Population |
| American | 281 | 7.5% |
| Arab | 10 | 0.3% |
| British | 9 | 0.2% |
| Canadian | 11 | 0.3% |
| Central American Indian | 57 | 1.5% |
| Dutch | 17 | 0.4% |
| English | 528 | 14.1% |
| European | 34 | 0.9% |
| French | 270 | 7.2% |
| French Canadian | 33 | 0.9% |
| German | 330 | 8.8% |
| Ghanaian | 13 | 0.4% |
| Greek | 10 | 0.3% |
| Hungarian | 82 | 2.2% |
| Irish | 1,168 | 31.2% |
| Italian | 514 | 13.8% |
| Jamaican | 14 | 0.4% |
| Mexican | 18 | 0.5% |
| Norwegian | 44 | 1.2% |
| Polish | 79 | 2.1% |
| Puerto Rican | 180 | 4.8% |
| Romanian | 7 | 0.2% |
| Scotch-Irish | 48 | 1.3% |
| Scottish | 118 | 3.2% |
| Slovak | 4 | 0.1% |
| Slovene | 7 | 0.2% |
| Subsaharan African | 13 | 0.4% |
| Syrian | 10 | 0.3% |
| Welsh | 12 | 0.3% |
| West Indian | 27 | 0.7% | View All 30 Rows |
Immigrants in South Glens Falls
The most numerous immigrant groups reported in South Glens Falls came from Europe (24 | 0.6%), England (17 | 0.4%), Northern Europe (17 | 0.4%), Asia (7 | 0.2%), and Eastern Europe (7 | 0.2%), together accounting for 1.9% of all South Glens Falls residents.
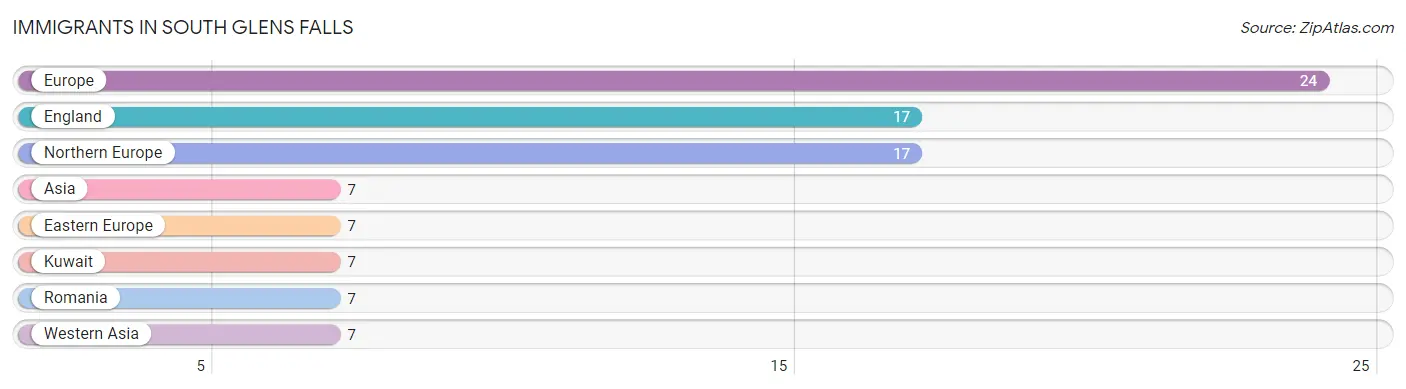
| Immigration Origin | # Population | % Population |
| Asia | 7 | 0.2% |
| Eastern Europe | 7 | 0.2% |
| England | 17 | 0.4% |
| Europe | 24 | 0.6% |
| Kuwait | 7 | 0.2% |
| Northern Europe | 17 | 0.4% |
| Romania | 7 | 0.2% |
| Western Asia | 7 | 0.2% | View All 8 Rows |
Sex and Age in South Glens Falls
Sex and Age in South Glens Falls
The most populous age groups in South Glens Falls are 20 to 24 Years (327 | 17.3%) for men and 20 to 24 Years (238 | 12.8%) for women.
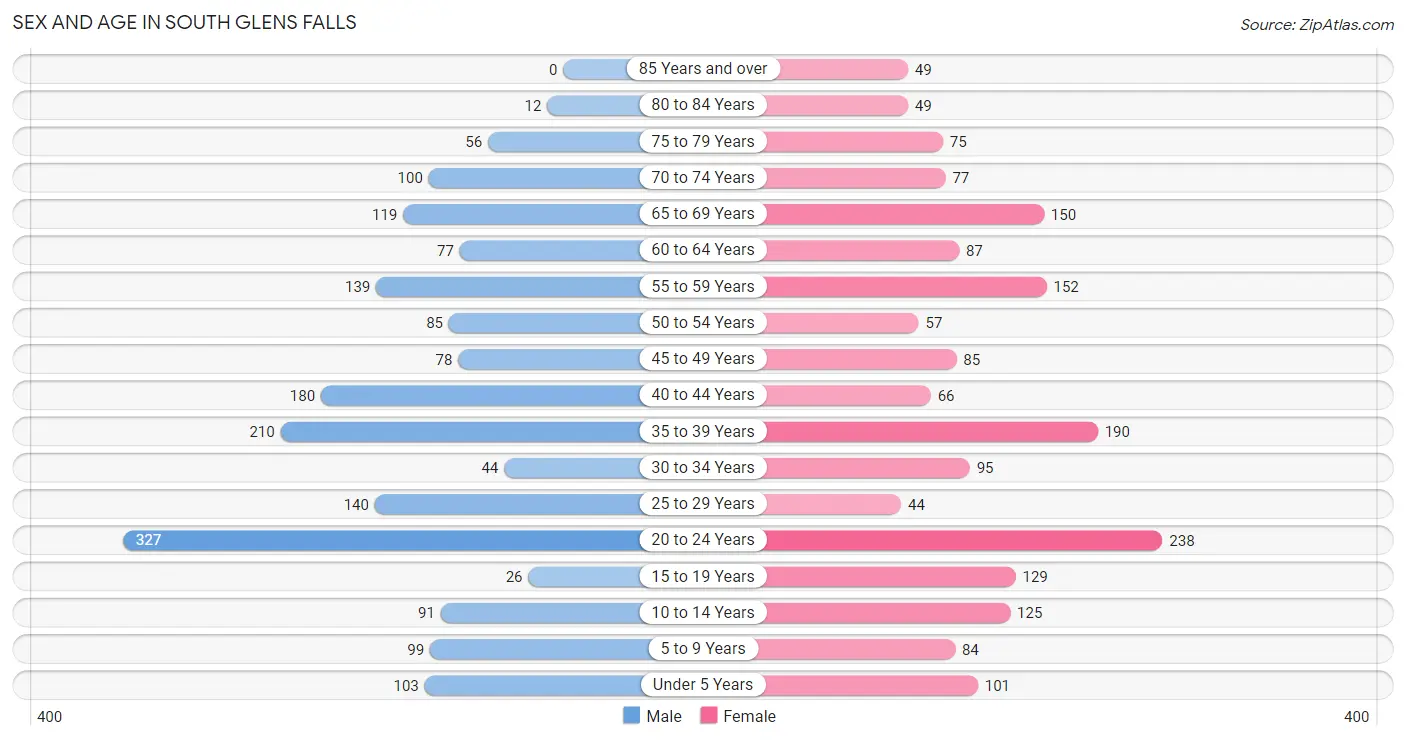
| Age Bracket | Male | Female |
| Under 5 Years | 103 (5.5%) | 101 (5.4%) |
| 5 to 9 Years | 99 (5.2%) | 84 (4.5%) |
| 10 to 14 Years | 91 (4.8%) | 125 (6.8%) |
| 15 to 19 Years | 26 (1.4%) | 129 (7.0%) |
| 20 to 24 Years | 327 (17.3%) | 238 (12.8%) |
| 25 to 29 Years | 140 (7.4%) | 44 (2.4%) |
| 30 to 34 Years | 44 (2.3%) | 95 (5.1%) |
| 35 to 39 Years | 210 (11.1%) | 190 (10.2%) |
| 40 to 44 Years | 180 (9.5%) | 66 (3.6%) |
| 45 to 49 Years | 78 (4.1%) | 85 (4.6%) |
| 50 to 54 Years | 85 (4.5%) | 57 (3.1%) |
| 55 to 59 Years | 139 (7.4%) | 152 (8.2%) |
| 60 to 64 Years | 77 (4.1%) | 87 (4.7%) |
| 65 to 69 Years | 119 (6.3%) | 150 (8.1%) |
| 70 to 74 Years | 100 (5.3%) | 77 (4.2%) |
| 75 to 79 Years | 56 (3.0%) | 75 (4.1%) |
| 80 to 84 Years | 12 (0.6%) | 49 (2.6%) |
| 85 Years and over | 0 (0.0%) | 49 (2.6%) |
| Total | 1,886 (100.0%) | 1,853 (100.0%) |
Families and Households in South Glens Falls
Median Family Size in South Glens Falls
The median family size in South Glens Falls is 2.76 persons per family, with married-couple families (521 | 57.4%) accounting for the largest median family size of 2.96 persons per family. On the other hand, single male/father families (193 | 21.3%) represent the smallest median family size with 2.14 persons per family.
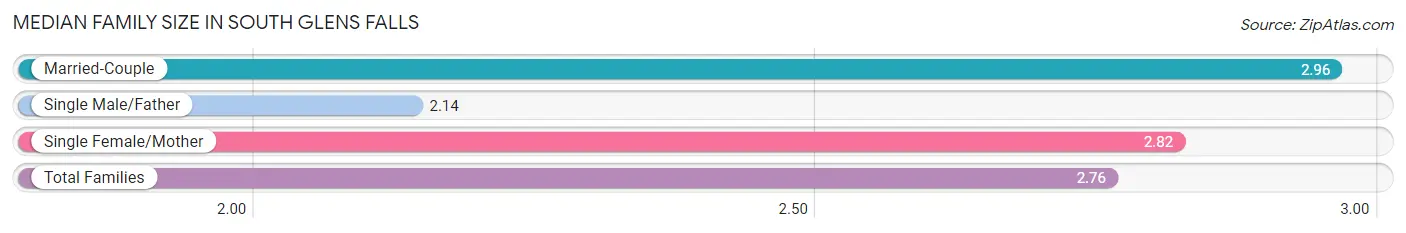
| Family Type | # Families | Family Size |
| Married-Couple | 521 (57.4%) | 2.96 |
| Single Male/Father | 193 (21.3%) | 2.14 |
| Single Female/Mother | 193 (21.3%) | 2.82 |
| Total Families | 907 (100.0%) | 2.76 |
Median Household Size in South Glens Falls
The median household size in South Glens Falls is 2.21 persons per household, with single female/mother households (193 | 11.5%) accounting for the largest median household size of 2.98 persons per household. non-family households (776 | 46.1%) represent the smallest median household size with 1.40 persons per household.
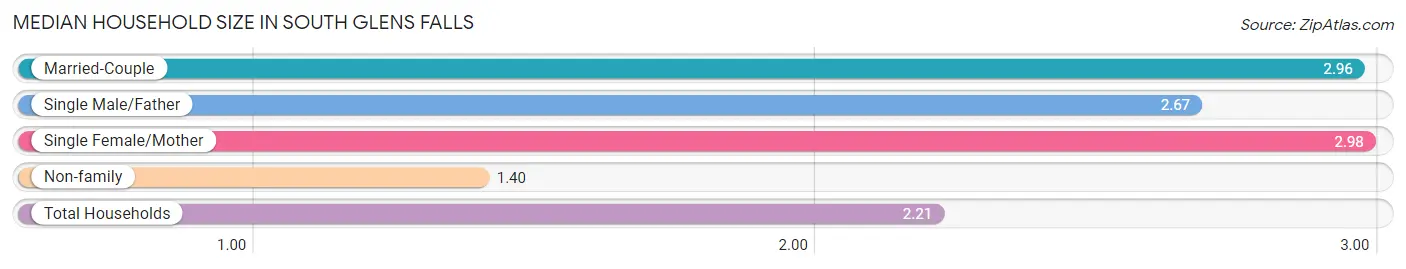
| Household Type | # Households | Household Size |
| Married-Couple | 521 (31.0%) | 2.96 |
| Single Male/Father | 193 (11.5%) | 2.67 |
| Single Female/Mother | 193 (11.5%) | 2.98 |
| Non-family | 776 (46.1%) | 1.40 |
| Total Households | 1,683 (100.0%) | 2.21 |
Household Size by Marriage Status in South Glens Falls
Out of a total of 1,683 households in South Glens Falls, 907 (53.9%) are family households, while 776 (46.1%) are nonfamily households. The most numerous type of family households are 2-person households, comprising 345, and the most common type of nonfamily households are 1-person households, comprising 575.
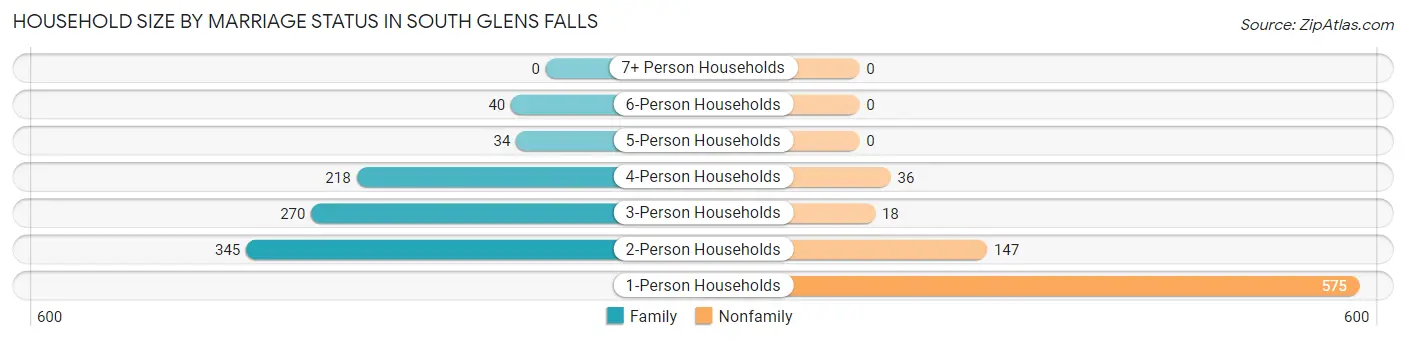
| Household Size | Family Households | Nonfamily Households |
| 1-Person Households | - | 575 (34.2%) |
| 2-Person Households | 345 (20.5%) | 147 (8.7%) |
| 3-Person Households | 270 (16.0%) | 18 (1.1%) |
| 4-Person Households | 218 (13.0%) | 36 (2.1%) |
| 5-Person Households | 34 (2.0%) | 0 (0.0%) |
| 6-Person Households | 40 (2.4%) | 0 (0.0%) |
| 7+ Person Households | 0 (0.0%) | 0 (0.0%) |
| Total | 907 (53.9%) | 776 (46.1%) |
Female Fertility in South Glens Falls
Fertility by Age in South Glens Falls
Average fertility rate in South Glens Falls is 88.0 births per 1,000 women. Women in the age bracket of 20 to 34 years have the highest fertility rate with 199.0 births per 1,000 women. Women in the age bracket of 20 to 34 years acount for 100.0% of all women with births.
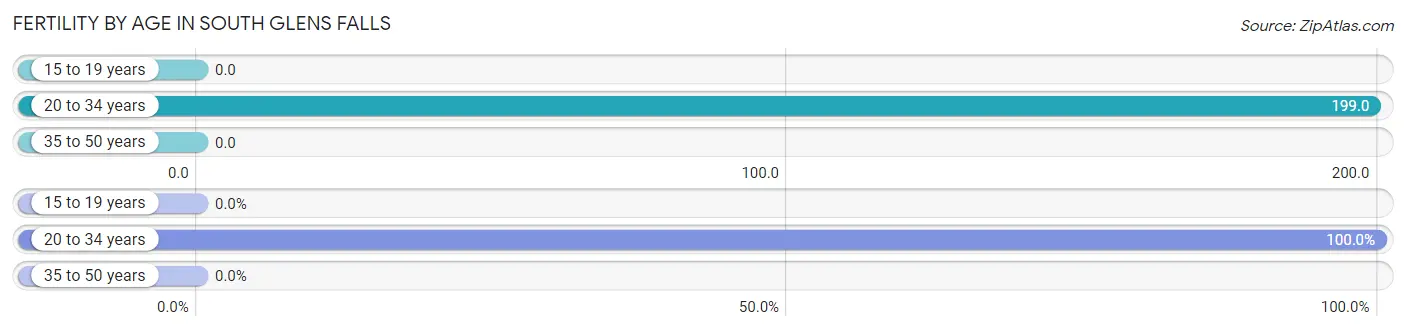
| Age Bracket | Women with Births | Births / 1,000 Women |
| 15 to 19 years | 0 (0.0%) | 0.0 |
| 20 to 34 years | 75 (100.0%) | 199.0 |
| 35 to 50 years | 0 (0.0%) | 0.0 |
| Total | 75 (100.0%) | 88.0 |
Fertility by Age by Marriage Status in South Glens Falls
40.0% of women with births (75) in South Glens Falls are married. The highest percentage of unmarried women with births falls into 20 to 34 years age bracket with 60.0% of them unmarried at the time of birth, while the lowest percentage of unmarried women with births belong to 20 to 34 years age bracket with 60.0% of them unmarried.
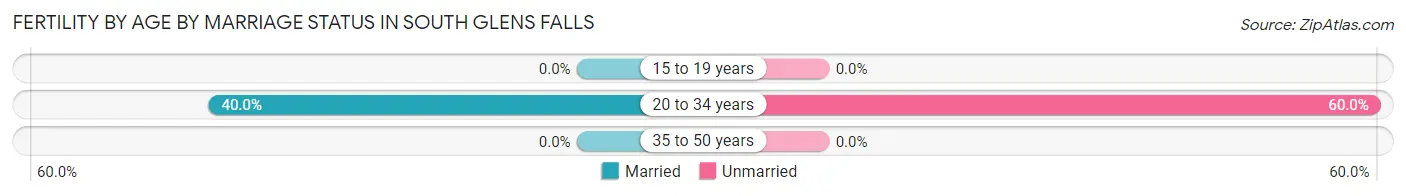
| Age Bracket | Married | Unmarried |
| 15 to 19 years | 0 (0.0%) | 0 (0.0%) |
| 20 to 34 years | 30 (40.0%) | 45 (60.0%) |
| 35 to 50 years | 0 (0.0%) | 0 (0.0%) |
| Total | 30 (40.0%) | 45 (60.0%) |
Fertility by Education in South Glens Falls
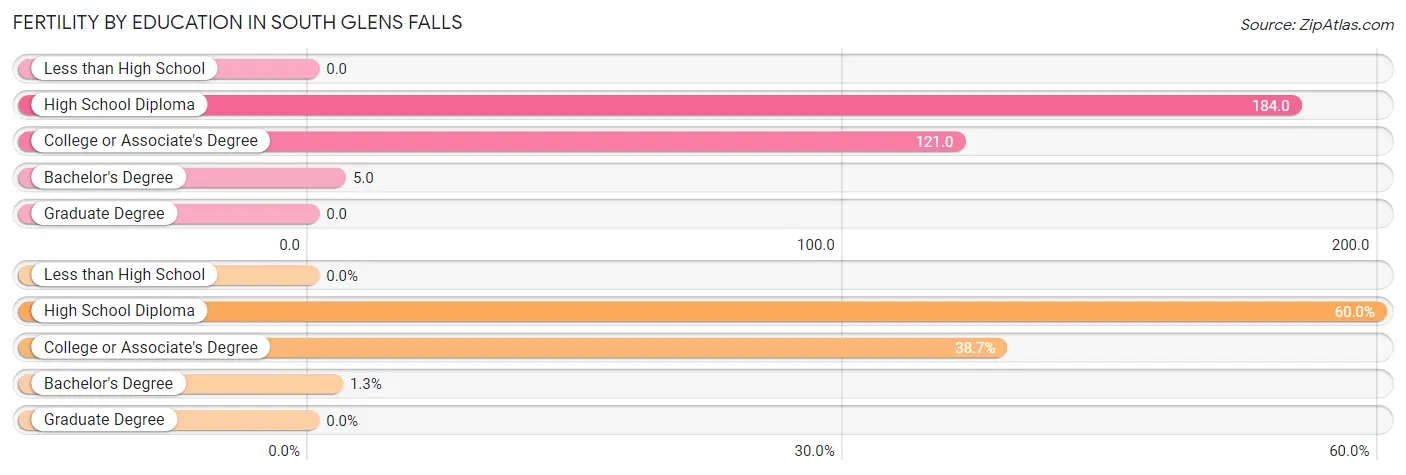
| Educational Attainment | Women with Births | Births / 1,000 Women |
| Less than High School | 0 (0.0%) | 0.0 |
| High School Diploma | 45 (60.0%) | 184.0 |
| College or Associate's Degree | 29 (38.7%) | 121.0 |
| Bachelor's Degree | 1 (1.3%) | 5.0 |
| Graduate Degree | 0 (0.0%) | 0.0 |
| Total | 75 (100.0%) | 88.0 |
Fertility by Education by Marriage Status in South Glens Falls
60.0% of women with births in South Glens Falls are unmarried. Women with the educational attainment of college or associate's degree are most likely to be married with 100.0% of them married at childbirth, while women with the educational attainment of high school diploma are least likely to be married with 100.0% of them unmarried at childbirth.
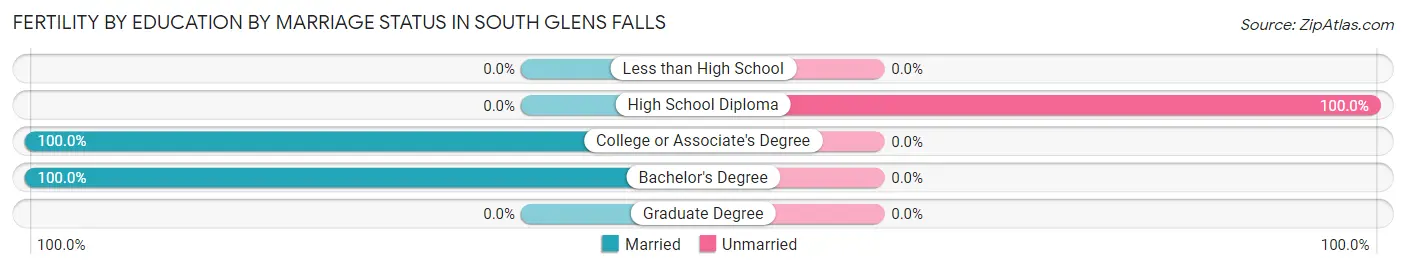
| Educational Attainment | Married | Unmarried |
| Less than High School | 0 (0.0%) | 0 (0.0%) |
| High School Diploma | 0 (0.0%) | 45 (100.0%) |
| College or Associate's Degree | 29 (100.0%) | 0 (0.0%) |
| Bachelor's Degree | 1 (100.0%) | 0 (0.0%) |
| Graduate Degree | 0 (0.0%) | 0 (0.0%) |
| Total | 30 (40.0%) | 45 (60.0%) |
Employment Characteristics in South Glens Falls
Employment by Class of Employer in South Glens Falls
Among the 1,756 employed individuals in South Glens Falls, private company employees (1,282 | 73.0%), local government employees (132 | 7.5%), and state government employees (103 | 5.9%) make up the most common classes of employment.
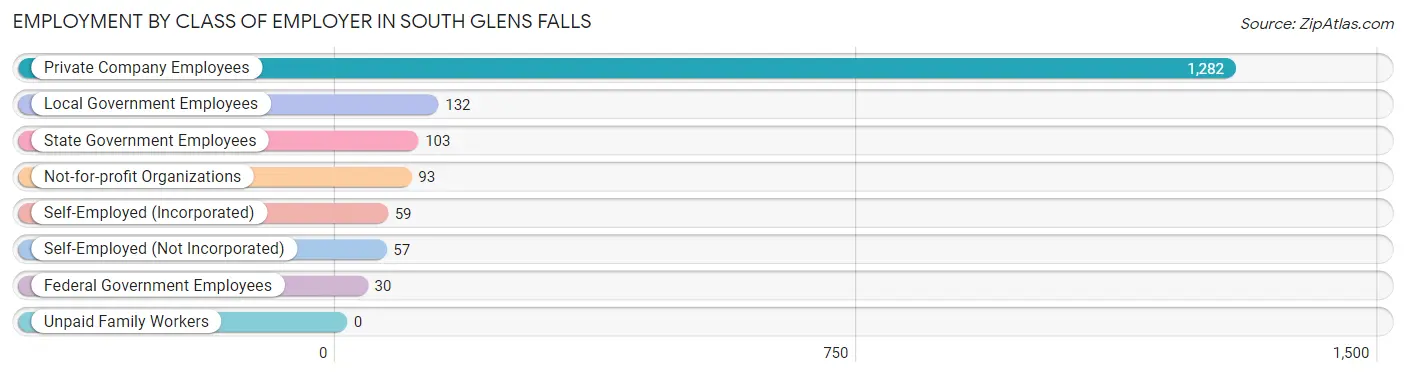
| Employer Class | # Employees | % Employees |
| Private Company Employees | 1,282 | 73.0% |
| Self-Employed (Incorporated) | 59 | 3.4% |
| Self-Employed (Not Incorporated) | 57 | 3.3% |
| Not-for-profit Organizations | 93 | 5.3% |
| Local Government Employees | 132 | 7.5% |
| State Government Employees | 103 | 5.9% |
| Federal Government Employees | 30 | 1.7% |
| Unpaid Family Workers | 0 | 0.0% |
| Total | 1,756 | 100.0% |
Employment Status by Age in South Glens Falls
According to the labor force statistics for South Glens Falls, out of the total population over 16 years of age (3,128), 72.9% or 2,280 individuals are in the labor force, with 7.2% or 164 of them unemployed. The age group with the highest labor force participation rate is 25 to 29 years, with 100.0% or 184 individuals in the labor force. Within the labor force, the 65 to 74 years age range has the highest percentage of unemployed individuals, with 18.9% or 35 of them being unemployed.
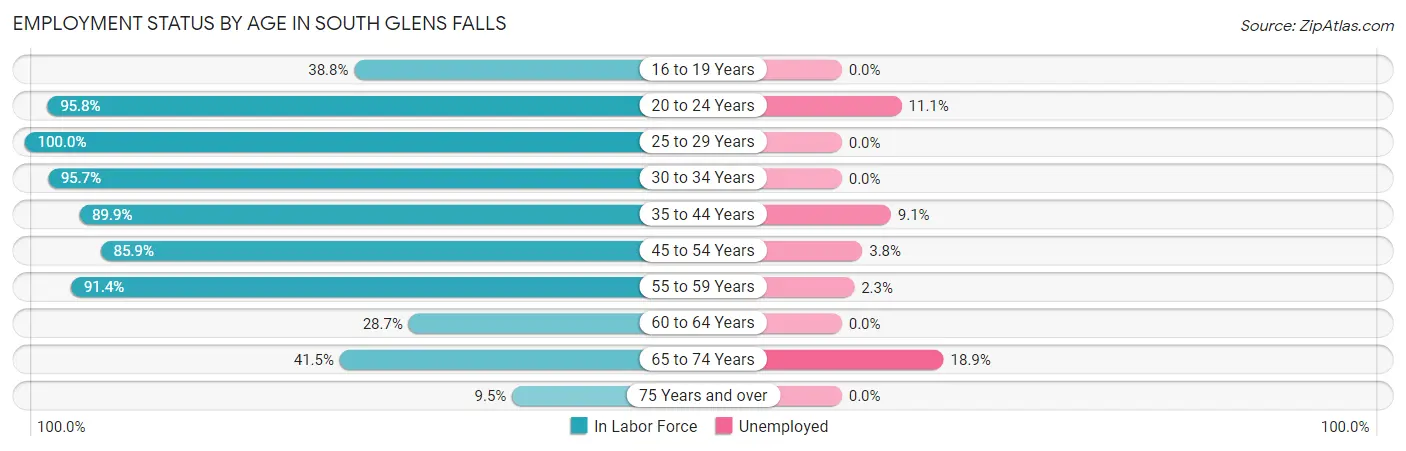
| Age Bracket | In Labor Force | Unemployed |
| 16 to 19 Years | 57 (38.8%) | 0 (0.0%) |
| 20 to 24 Years | 541 (95.8%) | 60 (11.1%) |
| 25 to 29 Years | 184 (100.0%) | 0 (0.0%) |
| 30 to 34 Years | 133 (95.7%) | 0 (0.0%) |
| 35 to 44 Years | 581 (89.9%) | 53 (9.1%) |
| 45 to 54 Years | 262 (85.9%) | 10 (3.8%) |
| 55 to 59 Years | 266 (91.4%) | 6 (2.3%) |
| 60 to 64 Years | 47 (28.7%) | 0 (0.0%) |
| 65 to 74 Years | 185 (41.5%) | 35 (18.9%) |
| 75 Years and over | 23 (9.5%) | 0 (0.0%) |
| Total | 2,280 (72.9%) | 164 (7.2%) |
Employment Status by Educational Attainment in South Glens Falls
According to labor force statistics for South Glens Falls, 85.2% of individuals (1,473) out of the total population between 25 and 64 years of age (1,729) are in the labor force, with 4.7% or 69 of them being unemployed. The group with the highest labor force participation rate are those with the educational attainment of college / associate degree, with 87.3% or 529 individuals in the labor force. Within the labor force, individuals with less than high school education have the highest percentage of unemployment, with 11.0% or 13 of them being unemployed.
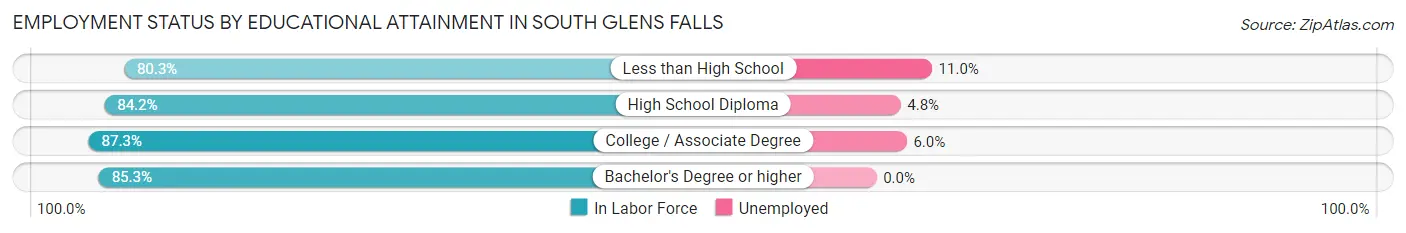
| Educational Attainment | In Labor Force | Unemployed |
| Less than High School | 118 (80.3%) | 16 (11.0%) |
| High School Diploma | 495 (84.2%) | 28 (4.8%) |
| College / Associate Degree | 529 (87.3%) | 36 (6.0%) |
| Bachelor's Degree or higher | 331 (85.3%) | 0 (0.0%) |
| Total | 1,473 (85.2%) | 81 (4.7%) |
Employment Occupations by Sex in South Glens Falls
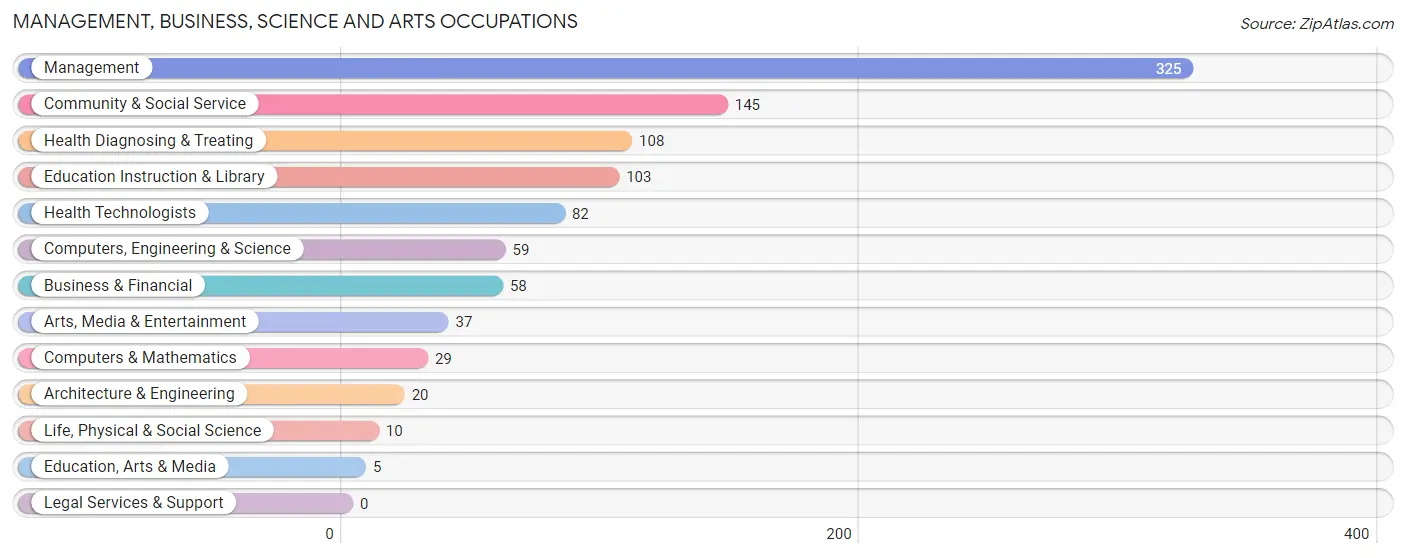
Management, Business, Science and Arts Occupations
The most common Management, Business, Science and Arts occupations in South Glens Falls are Management (325 | 15.4%), Community & Social Service (145 | 6.9%), Health Diagnosing & Treating (108 | 5.1%), Education Instruction & Library (103 | 4.9%), and Health Technologists (82 | 3.9%).
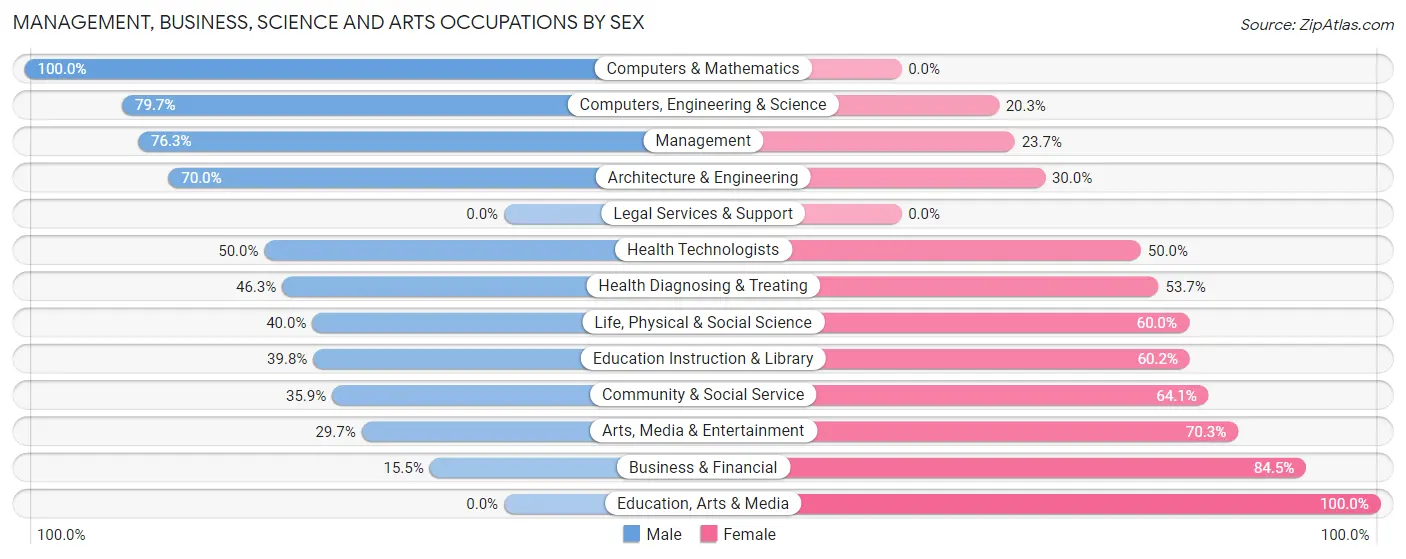
Management, Business, Science and Arts Occupations by Sex
Within the Management, Business, Science and Arts occupations in South Glens Falls, the most male-oriented occupations are Computers & Mathematics (100.0%), Computers, Engineering & Science (79.7%), and Management (76.3%), while the most female-oriented occupations are Education, Arts & Media (100.0%), Business & Financial (84.5%), and Arts, Media & Entertainment (70.3%).
| Occupation | Male | Female |
| Management | 248 (76.3%) | 77 (23.7%) |
| Business & Financial | 9 (15.5%) | 49 (84.5%) |
| Computers, Engineering & Science | 47 (79.7%) | 12 (20.3%) |
| Computers & Mathematics | 29 (100.0%) | 0 (0.0%) |
| Architecture & Engineering | 14 (70.0%) | 6 (30.0%) |
| Life, Physical & Social Science | 4 (40.0%) | 6 (60.0%) |
| Community & Social Service | 52 (35.9%) | 93 (64.1%) |
| Education, Arts & Media | 0 (0.0%) | 5 (100.0%) |
| Legal Services & Support | 0 (0.0%) | 0 (0.0%) |
| Education Instruction & Library | 41 (39.8%) | 62 (60.2%) |
| Arts, Media & Entertainment | 11 (29.7%) | 26 (70.3%) |
| Health Diagnosing & Treating | 50 (46.3%) | 58 (53.7%) |
| Health Technologists | 41 (50.0%) | 41 (50.0%) |
| Total (Category) | 406 (58.4%) | 289 (41.6%) |
| Total (Overall) | 1,242 (58.7%) | 873 (41.3%) |
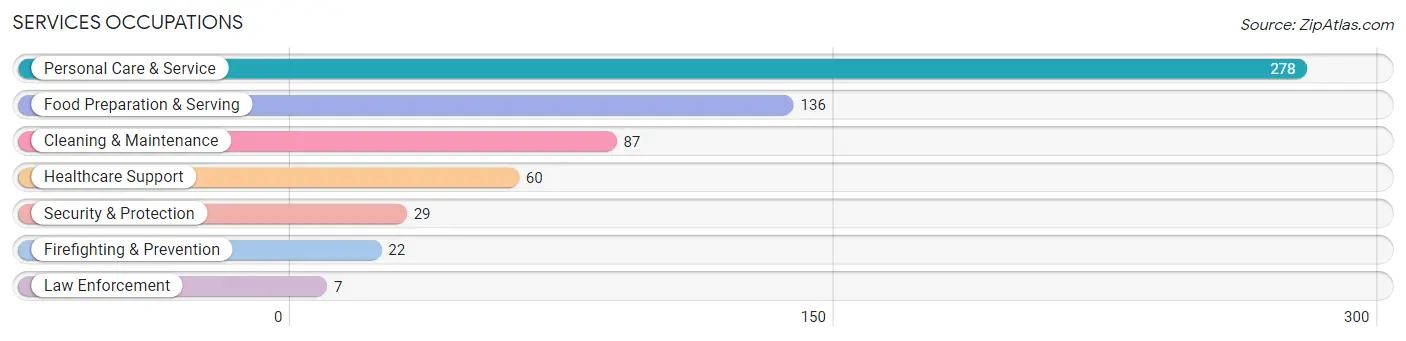
Services Occupations
The most common Services occupations in South Glens Falls are Personal Care & Service (278 | 13.1%), Food Preparation & Serving (136 | 6.4%), Cleaning & Maintenance (87 | 4.1%), Healthcare Support (60 | 2.8%), and Security & Protection (29 | 1.4%).
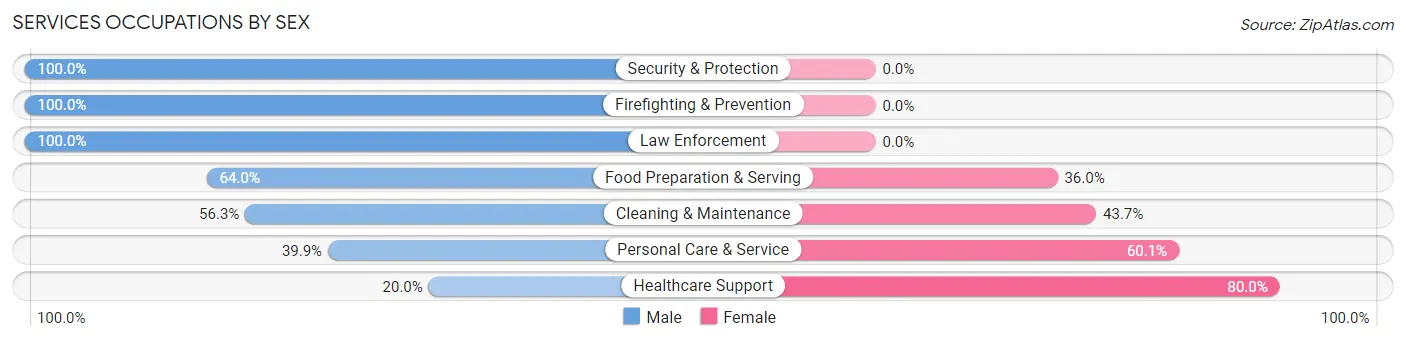
Services Occupations by Sex
Within the Services occupations in South Glens Falls, the most male-oriented occupations are Security & Protection (100.0%), Firefighting & Prevention (100.0%), and Law Enforcement (100.0%), while the most female-oriented occupations are Healthcare Support (80.0%), Personal Care & Service (60.1%), and Cleaning & Maintenance (43.7%).
| Occupation | Male | Female |
| Healthcare Support | 12 (20.0%) | 48 (80.0%) |
| Security & Protection | 29 (100.0%) | 0 (0.0%) |
| Firefighting & Prevention | 22 (100.0%) | 0 (0.0%) |
| Law Enforcement | 7 (100.0%) | 0 (0.0%) |
| Food Preparation & Serving | 87 (64.0%) | 49 (36.0%) |
| Cleaning & Maintenance | 49 (56.3%) | 38 (43.7%) |
| Personal Care & Service | 111 (39.9%) | 167 (60.1%) |
| Total (Category) | 288 (48.8%) | 302 (51.2%) |
| Total (Overall) | 1,242 (58.7%) | 873 (41.3%) |
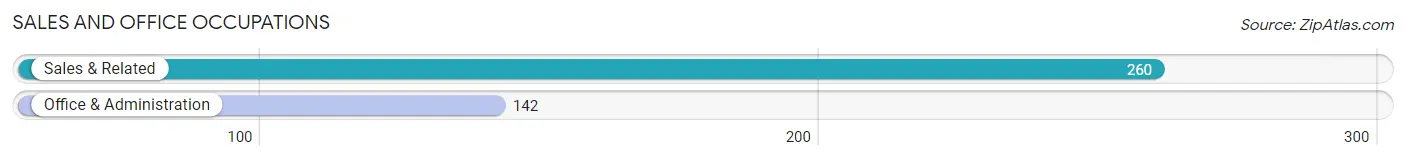
Sales and Office Occupations
The most common Sales and Office occupations in South Glens Falls are Sales & Related (260 | 12.3%), and Office & Administration (142 | 6.7%).
Sales and Office Occupations by Sex
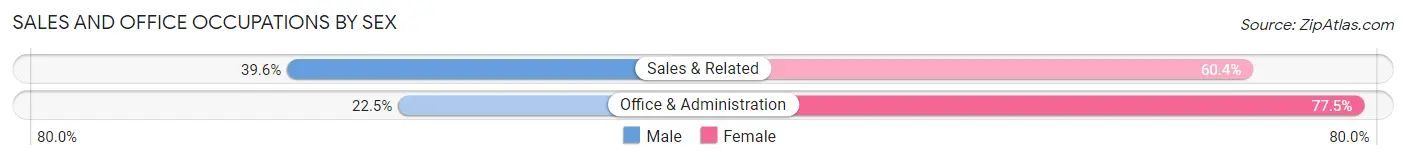
| Occupation | Male | Female |
| Sales & Related | 103 (39.6%) | 157 (60.4%) |
| Office & Administration | 32 (22.5%) | 110 (77.5%) |
| Total (Category) | 135 (33.6%) | 267 (66.4%) |
| Total (Overall) | 1,242 (58.7%) | 873 (41.3%) |
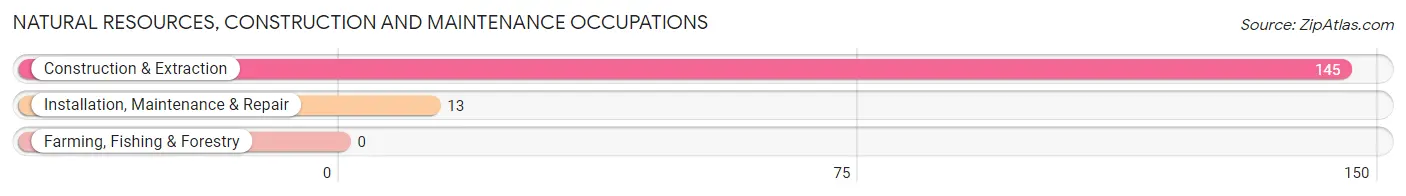
Natural Resources, Construction and Maintenance Occupations
The most common Natural Resources, Construction and Maintenance occupations in South Glens Falls are Construction & Extraction (145 | 6.9%), and Installation, Maintenance & Repair (13 | 0.6%).
Natural Resources, Construction and Maintenance Occupations by Sex
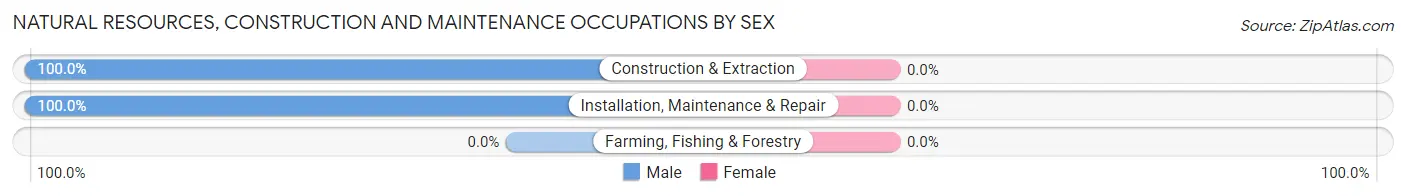
| Occupation | Male | Female |
| Farming, Fishing & Forestry | 0 (0.0%) | 0 (0.0%) |
| Construction & Extraction | 145 (100.0%) | 0 (0.0%) |
| Installation, Maintenance & Repair | 13 (100.0%) | 0 (0.0%) |
| Total (Category) | 158 (100.0%) | 0 (0.0%) |
| Total (Overall) | 1,242 (58.7%) | 873 (41.3%) |
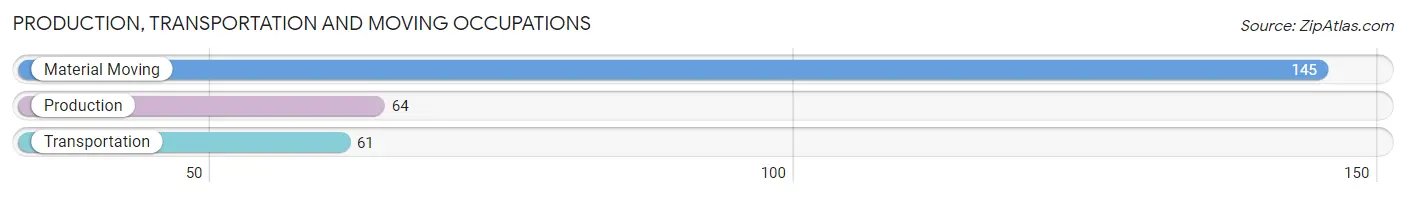
Production, Transportation and Moving Occupations
The most common Production, Transportation and Moving occupations in South Glens Falls are Material Moving (145 | 6.9%), Production (64 | 3.0%), and Transportation (61 | 2.9%).
Production, Transportation and Moving Occupations by Sex
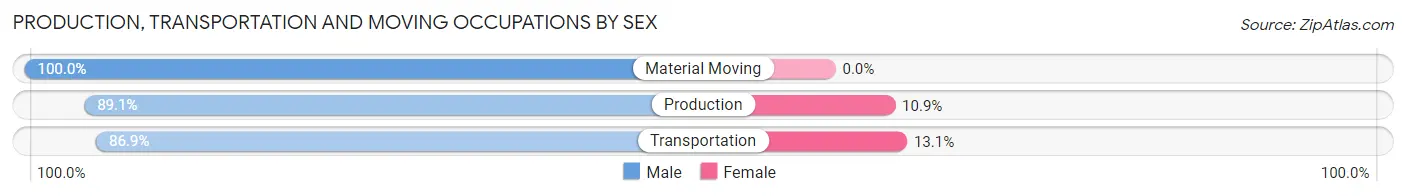
| Occupation | Male | Female |
| Production | 57 (89.1%) | 7 (10.9%) |
| Transportation | 53 (86.9%) | 8 (13.1%) |
| Material Moving | 145 (100.0%) | 0 (0.0%) |
| Total (Category) | 255 (94.4%) | 15 (5.6%) |
| Total (Overall) | 1,242 (58.7%) | 873 (41.3%) |
Employment Industries by Sex in South Glens Falls
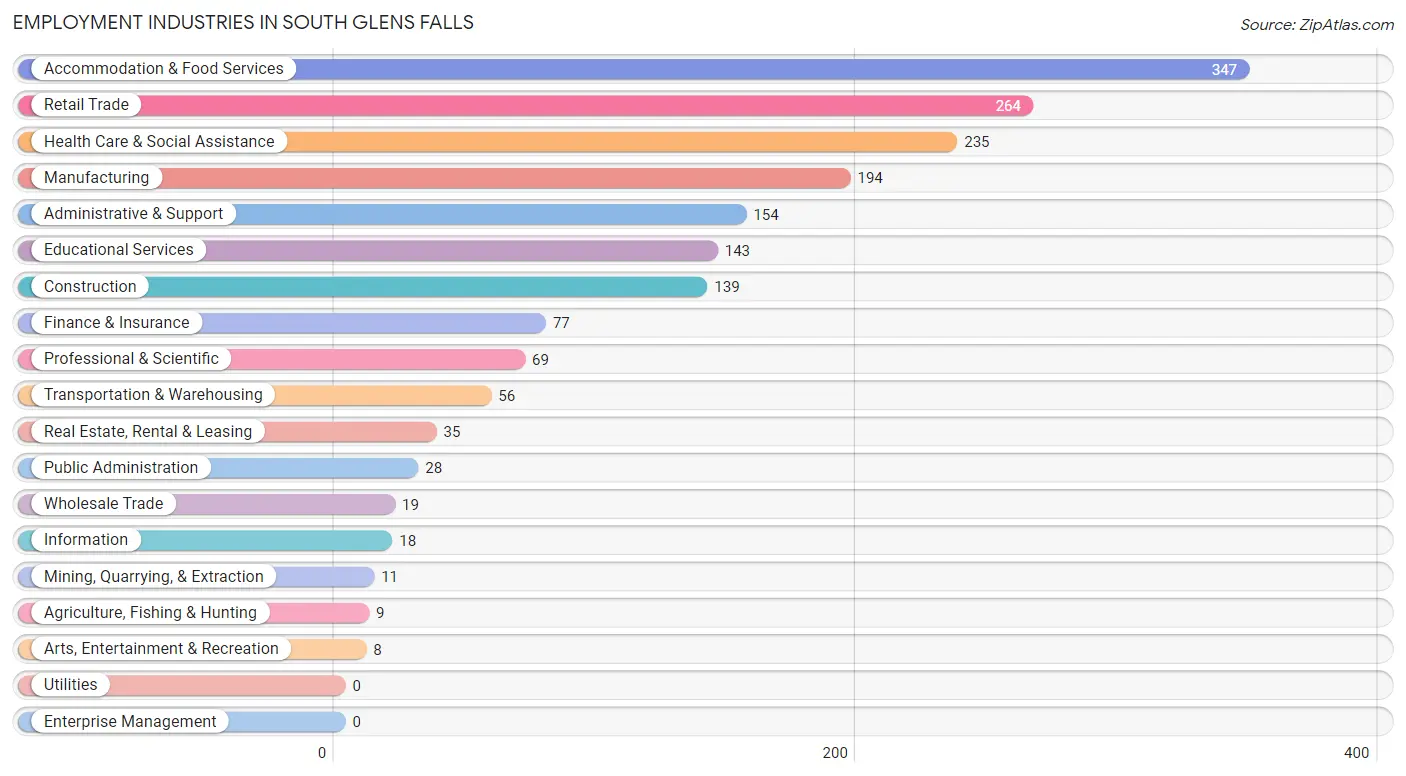
Employment Industries in South Glens Falls
The major employment industries in South Glens Falls include Accommodation & Food Services (347 | 16.4%), Retail Trade (264 | 12.5%), Health Care & Social Assistance (235 | 11.1%), Manufacturing (194 | 9.2%), and Administrative & Support (154 | 7.3%).
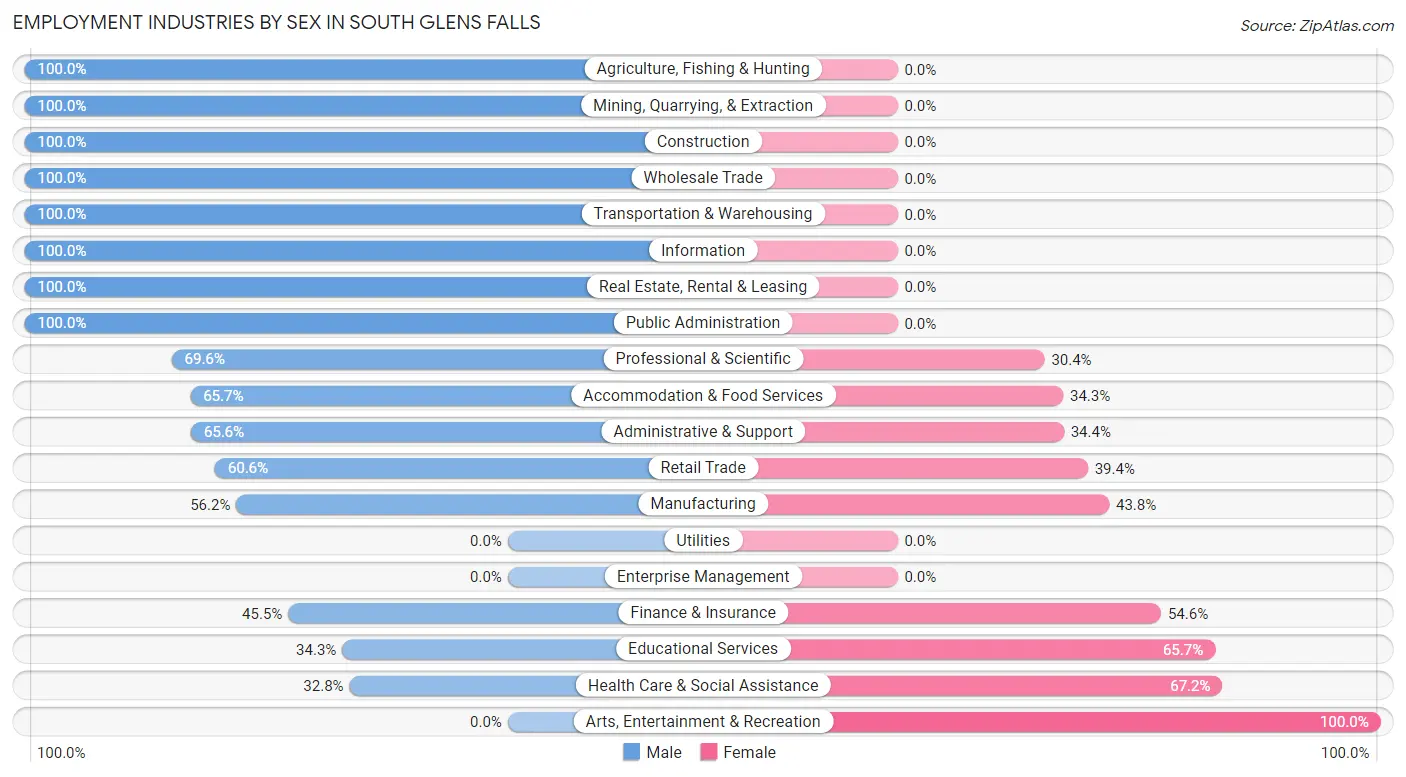
Employment Industries by Sex in South Glens Falls
The South Glens Falls industries that see more men than women are Agriculture, Fishing & Hunting (100.0%), Mining, Quarrying, & Extraction (100.0%), and Construction (100.0%), whereas the industries that tend to have a higher number of women are Arts, Entertainment & Recreation (100.0%), Health Care & Social Assistance (67.2%), and Educational Services (65.7%).
| Industry | Male | Female |
| Agriculture, Fishing & Hunting | 9 (100.0%) | 0 (0.0%) |
| Mining, Quarrying, & Extraction | 11 (100.0%) | 0 (0.0%) |
| Construction | 139 (100.0%) | 0 (0.0%) |
| Manufacturing | 109 (56.2%) | 85 (43.8%) |
| Wholesale Trade | 19 (100.0%) | 0 (0.0%) |
| Retail Trade | 160 (60.6%) | 104 (39.4%) |
| Transportation & Warehousing | 56 (100.0%) | 0 (0.0%) |
| Utilities | 0 (0.0%) | 0 (0.0%) |
| Information | 18 (100.0%) | 0 (0.0%) |
| Finance & Insurance | 35 (45.5%) | 42 (54.5%) |
| Real Estate, Rental & Leasing | 35 (100.0%) | 0 (0.0%) |
| Professional & Scientific | 48 (69.6%) | 21 (30.4%) |
| Enterprise Management | 0 (0.0%) | 0 (0.0%) |
| Administrative & Support | 101 (65.6%) | 53 (34.4%) |
| Educational Services | 49 (34.3%) | 94 (65.7%) |
| Health Care & Social Assistance | 77 (32.8%) | 158 (67.2%) |
| Arts, Entertainment & Recreation | 0 (0.0%) | 8 (100.0%) |
| Accommodation & Food Services | 228 (65.7%) | 119 (34.3%) |
| Public Administration | 28 (100.0%) | 0 (0.0%) |
| Total | 1,242 (58.7%) | 873 (41.3%) |
Education in South Glens Falls
School Enrollment in South Glens Falls
The most common levels of schooling among the 623 students in South Glens Falls are middle school (243 | 39.0%), elementary school (117 | 18.8%), and nursery / preschool (83 | 13.3%).
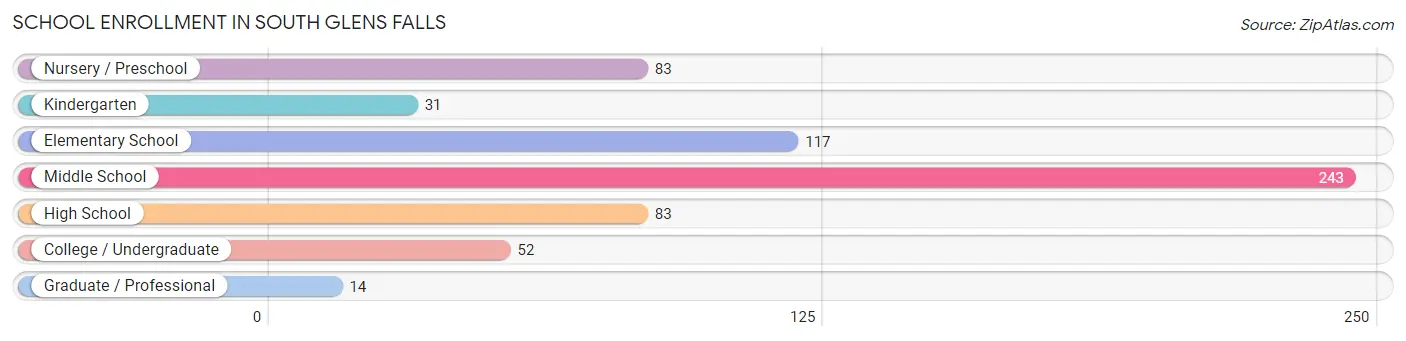
| School Level | # Students | % Students |
| Nursery / Preschool | 83 | 13.3% |
| Kindergarten | 31 | 5.0% |
| Elementary School | 117 | 18.8% |
| Middle School | 243 | 39.0% |
| High School | 83 | 13.3% |
| College / Undergraduate | 52 | 8.4% |
| Graduate / Professional | 14 | 2.2% |
| Total | 623 | 100.0% |
School Enrollment by Age by Funding Source in South Glens Falls
Out of a total of 623 students who are enrolled in schools in South Glens Falls, 59 (9.5%) attend a private institution, while the remaining 564 (90.5%) are enrolled in public schools. The age group of 3 to 4 year olds has the highest likelihood of being enrolled in private schools, with 53 (63.9% in the age bracket) enrolled. Conversely, the age group of 5 to 9 year old has the lowest likelihood of being enrolled in a private school, with 183 (100.0% in the age bracket) attending a public institution.
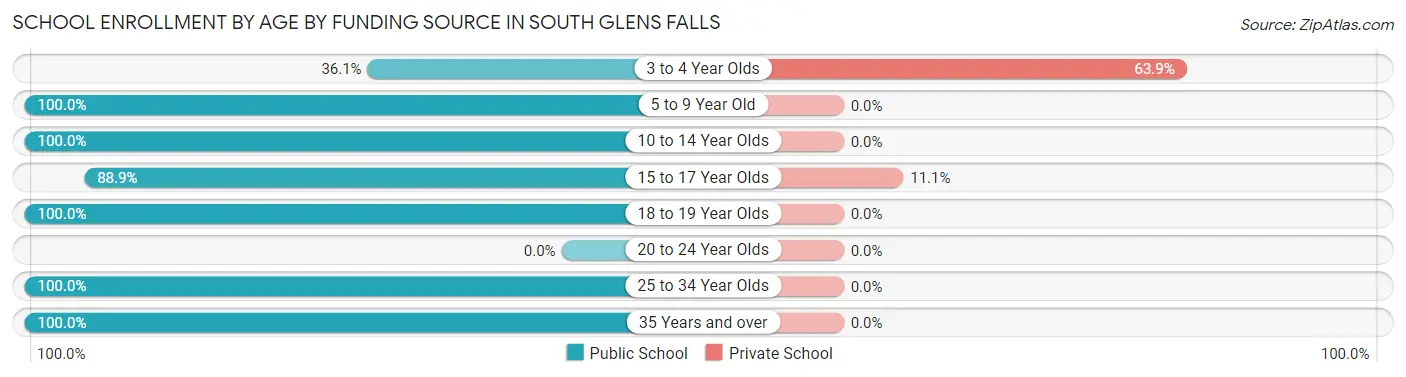
| Age Bracket | Public School | Private School |
| 3 to 4 Year Olds | 30 (36.1%) | 53 (63.9%) |
| 5 to 9 Year Old | 183 (100.0%) | 0 (0.0%) |
| 10 to 14 Year Olds | 216 (100.0%) | 0 (0.0%) |
| 15 to 17 Year Olds | 48 (88.9%) | 6 (11.1%) |
| 18 to 19 Year Olds | 56 (100.0%) | 0 (0.0%) |
| 20 to 24 Year Olds | 0 (0.0%) | 0 (0.0%) |
| 25 to 34 Year Olds | 1 (100.0%) | 0 (0.0%) |
| 35 Years and over | 30 (100.0%) | 0 (0.0%) |
| Total | 564 (90.5%) | 59 (9.5%) |
Educational Attainment by Field of Study in South Glens Falls
Business (129 | 20.4%), education (113 | 17.9%), psychology (78 | 12.4%), visual & performing arts (52 | 8.2%), and literature & languages (43 | 6.8%) are the most common fields of study among 631 individuals in South Glens Falls who have obtained a bachelor's degree or higher.
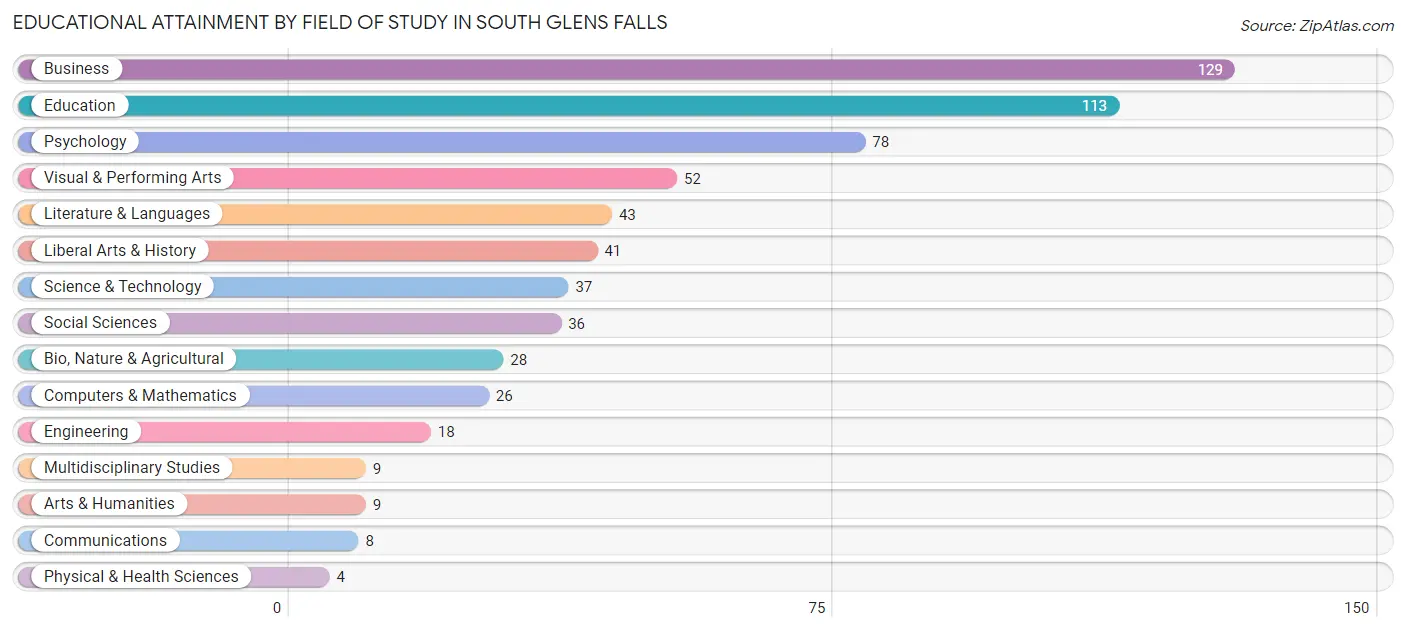
| Field of Study | # Graduates | % Graduates |
| Computers & Mathematics | 26 | 4.1% |
| Bio, Nature & Agricultural | 28 | 4.4% |
| Physical & Health Sciences | 4 | 0.6% |
| Psychology | 78 | 12.4% |
| Social Sciences | 36 | 5.7% |
| Engineering | 18 | 2.9% |
| Multidisciplinary Studies | 9 | 1.4% |
| Science & Technology | 37 | 5.9% |
| Business | 129 | 20.4% |
| Education | 113 | 17.9% |
| Literature & Languages | 43 | 6.8% |
| Liberal Arts & History | 41 | 6.5% |
| Visual & Performing Arts | 52 | 8.2% |
| Communications | 8 | 1.3% |
| Arts & Humanities | 9 | 1.4% |
| Total | 631 | 100.0% |
Transportation & Commute in South Glens Falls
Vehicle Availability by Sex in South Glens Falls
The most prevalent vehicle ownership categories in South Glens Falls are males with 2 vehicles (486, accounting for 45.2%) and females with 2 vehicles (334, making up 71.4%).
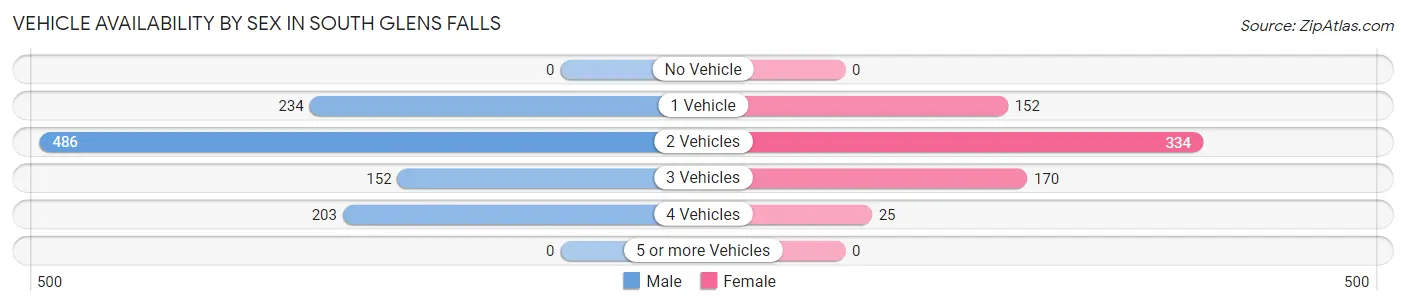
| Vehicles Available | Male | Female |
| No Vehicle | 0 (0.0%) | 0 (0.0%) |
| 1 Vehicle | 234 (21.8%) | 152 (22.3%) |
| 2 Vehicles | 486 (45.2%) | 334 (49.0%) |
| 3 Vehicles | 152 (14.1%) | 170 (25.0%) |
| 4 Vehicles | 203 (18.9%) | 25 (3.7%) |
| 5 or more Vehicles | 0 (0.0%) | 0 (0.0%) |
| Total | 1,075 (100.0%) | 681 (100.0%) |
Commute Time in South Glens Falls
The most frequently occuring commute durations in South Glens Falls are 5 to 9 minutes (286 commuters, 17.9%), 15 to 19 minutes (255 commuters, 15.9%), and 30 to 34 minutes (244 commuters, 15.2%).
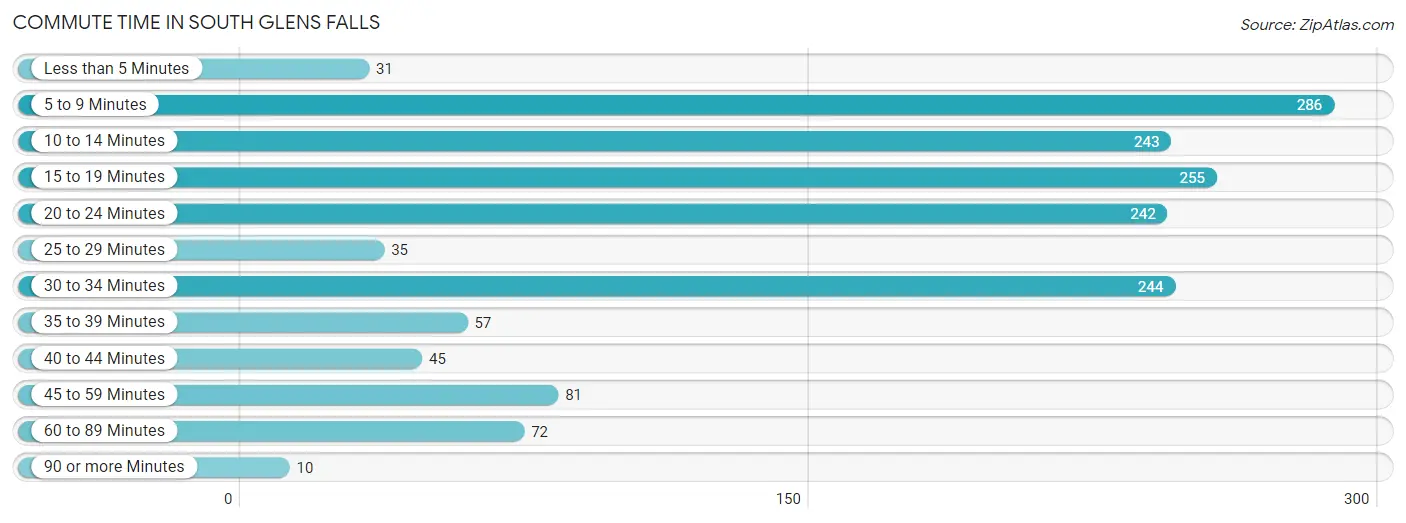
| Commute Time | # Commuters | % Commuters |
| Less than 5 Minutes | 31 | 1.9% |
| 5 to 9 Minutes | 286 | 17.9% |
| 10 to 14 Minutes | 243 | 15.2% |
| 15 to 19 Minutes | 255 | 15.9% |
| 20 to 24 Minutes | 242 | 15.1% |
| 25 to 29 Minutes | 35 | 2.2% |
| 30 to 34 Minutes | 244 | 15.2% |
| 35 to 39 Minutes | 57 | 3.6% |
| 40 to 44 Minutes | 45 | 2.8% |
| 45 to 59 Minutes | 81 | 5.1% |
| 60 to 89 Minutes | 72 | 4.5% |
| 90 or more Minutes | 10 | 0.6% |
Commute Time by Sex in South Glens Falls
The most common commute times in South Glens Falls are 5 to 9 minutes (198 commuters, 19.7%) for males and 20 to 24 minutes (129 commuters, 21.6%) for females.
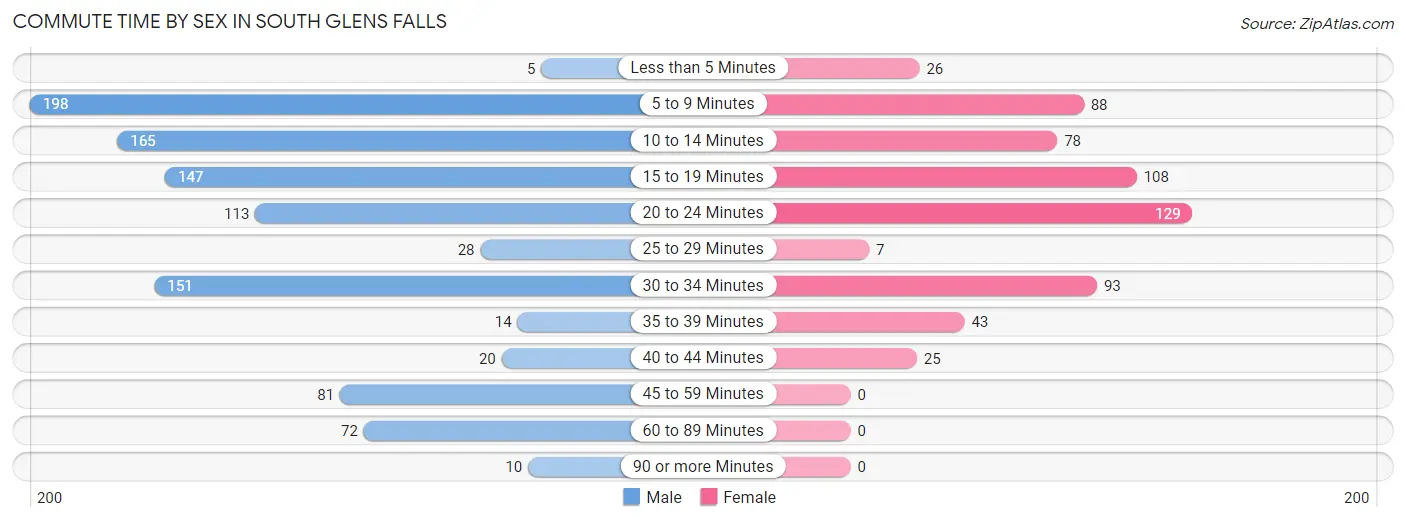
| Commute Time | Male | Female |
| Less than 5 Minutes | 5 (0.5%) | 26 (4.4%) |
| 5 to 9 Minutes | 198 (19.7%) | 88 (14.7%) |
| 10 to 14 Minutes | 165 (16.4%) | 78 (13.1%) |
| 15 to 19 Minutes | 147 (14.6%) | 108 (18.1%) |
| 20 to 24 Minutes | 113 (11.3%) | 129 (21.6%) |
| 25 to 29 Minutes | 28 (2.8%) | 7 (1.2%) |
| 30 to 34 Minutes | 151 (15.0%) | 93 (15.6%) |
| 35 to 39 Minutes | 14 (1.4%) | 43 (7.2%) |
| 40 to 44 Minutes | 20 (2.0%) | 25 (4.2%) |
| 45 to 59 Minutes | 81 (8.1%) | 0 (0.0%) |
| 60 to 89 Minutes | 72 (7.2%) | 0 (0.0%) |
| 90 or more Minutes | 10 (1.0%) | 0 (0.0%) |
Time of Departure to Work by Sex in South Glens Falls
The most frequent times of departure to work in South Glens Falls are 6:30 AM to 6:59 AM (207, 20.6%) for males and 7:30 AM to 7:59 AM (186, 31.2%) for females.
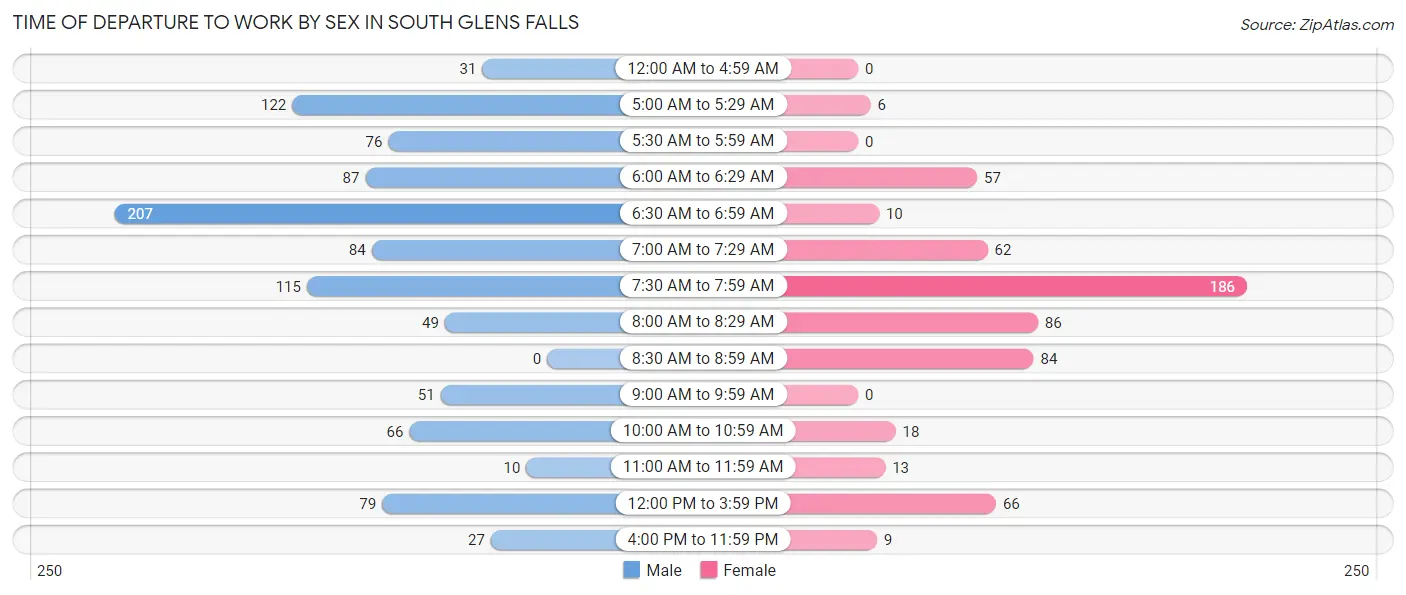
| Time of Departure | Male | Female |
| 12:00 AM to 4:59 AM | 31 (3.1%) | 0 (0.0%) |
| 5:00 AM to 5:29 AM | 122 (12.1%) | 6 (1.0%) |
| 5:30 AM to 5:59 AM | 76 (7.6%) | 0 (0.0%) |
| 6:00 AM to 6:29 AM | 87 (8.7%) | 57 (9.6%) |
| 6:30 AM to 6:59 AM | 207 (20.6%) | 10 (1.7%) |
| 7:00 AM to 7:29 AM | 84 (8.4%) | 62 (10.4%) |
| 7:30 AM to 7:59 AM | 115 (11.5%) | 186 (31.2%) |
| 8:00 AM to 8:29 AM | 49 (4.9%) | 86 (14.4%) |
| 8:30 AM to 8:59 AM | 0 (0.0%) | 84 (14.1%) |
| 9:00 AM to 9:59 AM | 51 (5.1%) | 0 (0.0%) |
| 10:00 AM to 10:59 AM | 66 (6.6%) | 18 (3.0%) |
| 11:00 AM to 11:59 AM | 10 (1.0%) | 13 (2.2%) |
| 12:00 PM to 3:59 PM | 79 (7.9%) | 66 (11.1%) |
| 4:00 PM to 11:59 PM | 27 (2.7%) | 9 (1.5%) |
| Total | 1,004 (100.0%) | 597 (100.0%) |
Housing Occupancy in South Glens Falls
Occupancy by Ownership in South Glens Falls
Of the total 1,683 dwellings in South Glens Falls, owner-occupied units account for 808 (48.0%), while renter-occupied units make up 875 (52.0%).
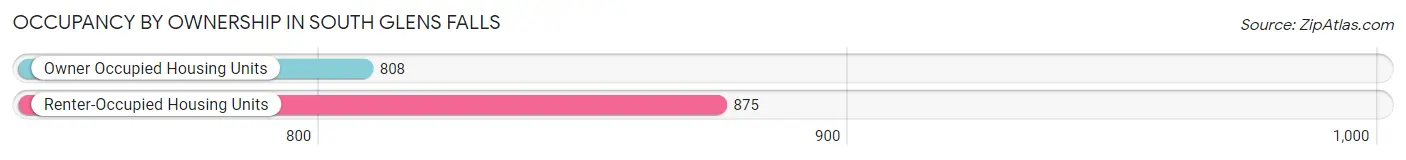
| Occupancy | # Housing Units | % Housing Units |
| Owner Occupied Housing Units | 808 | 48.0% |
| Renter-Occupied Housing Units | 875 | 52.0% |
| Total Occupied Housing Units | 1,683 | 100.0% |
Occupancy by Household Size in South Glens Falls
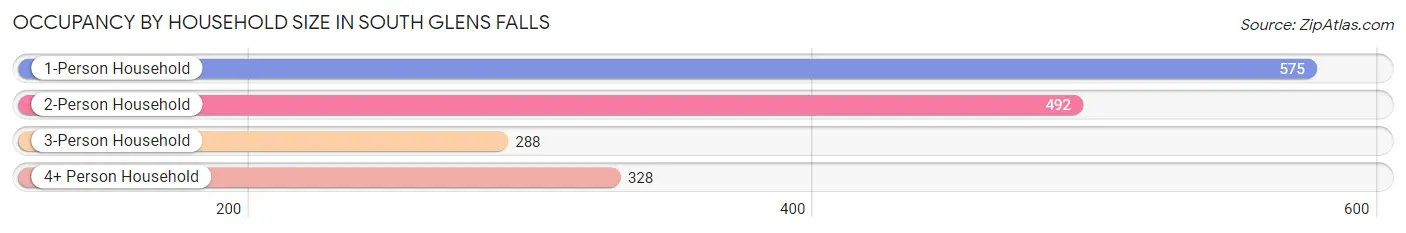
| Household Size | # Housing Units | % Housing Units |
| 1-Person Household | 575 | 34.2% |
| 2-Person Household | 492 | 29.2% |
| 3-Person Household | 288 | 17.1% |
| 4+ Person Household | 328 | 19.5% |
| Total Housing Units | 1,683 | 100.0% |
Occupancy by Ownership by Household Size in South Glens Falls
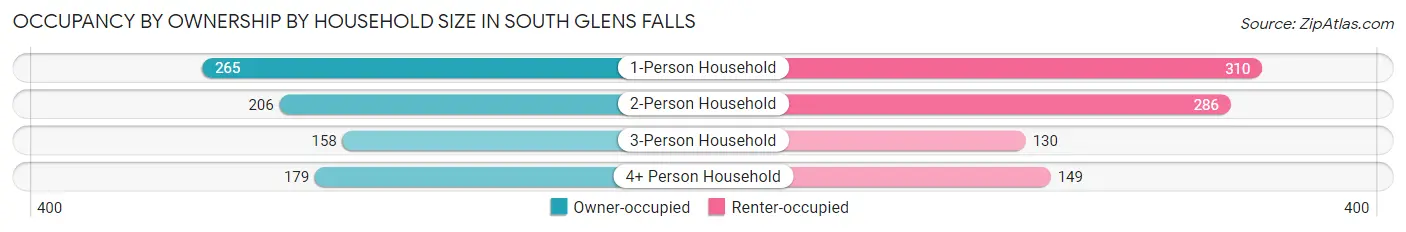
| Household Size | Owner-occupied | Renter-occupied |
| 1-Person Household | 265 (46.1%) | 310 (53.9%) |
| 2-Person Household | 206 (41.9%) | 286 (58.1%) |
| 3-Person Household | 158 (54.9%) | 130 (45.1%) |
| 4+ Person Household | 179 (54.6%) | 149 (45.4%) |
| Total Housing Units | 808 (48.0%) | 875 (52.0%) |
Occupancy by Educational Attainment in South Glens Falls
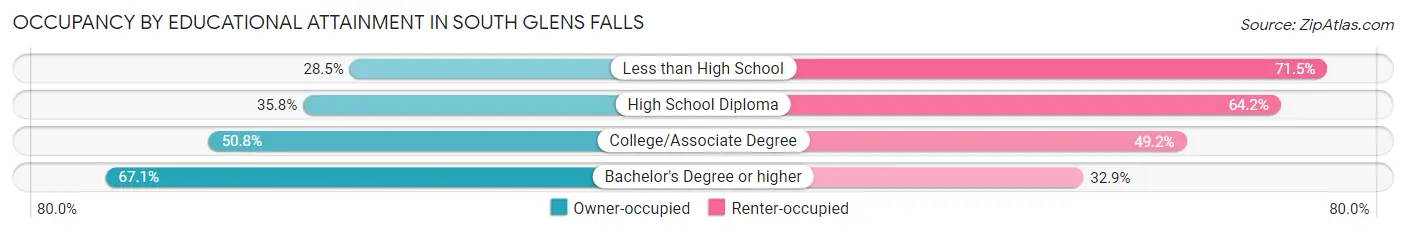
| Household Size | Owner-occupied | Renter-occupied |
| Less than High School | 37 (28.5%) | 93 (71.5%) |
| High School Diploma | 181 (35.8%) | 324 (64.2%) |
| College/Associate Degree | 353 (50.8%) | 342 (49.2%) |
| Bachelor's Degree or higher | 237 (67.1%) | 116 (32.9%) |
Occupancy by Age of Householder in South Glens Falls
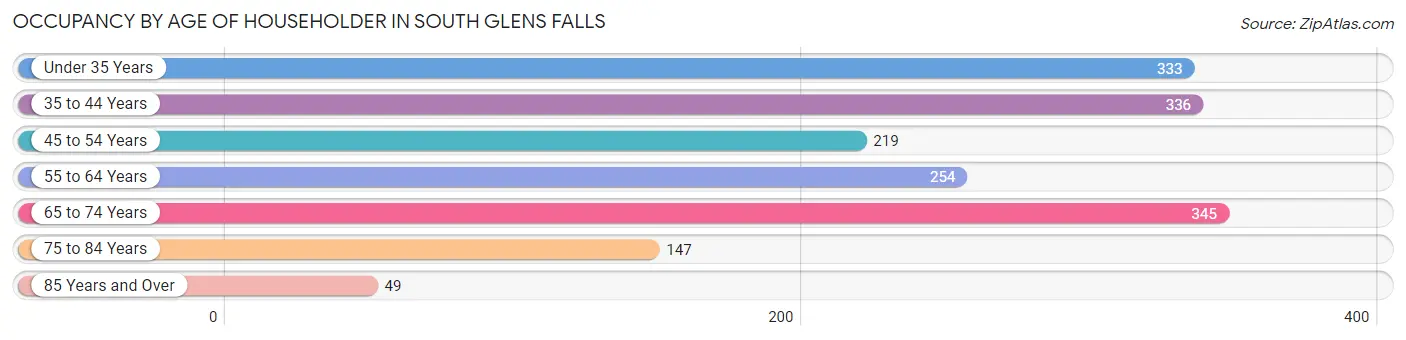
| Age Bracket | # Households | % Households |
| Under 35 Years | 333 | 19.8% |
| 35 to 44 Years | 336 | 20.0% |
| 45 to 54 Years | 219 | 13.0% |
| 55 to 64 Years | 254 | 15.1% |
| 65 to 74 Years | 345 | 20.5% |
| 75 to 84 Years | 147 | 8.7% |
| 85 Years and Over | 49 | 2.9% |
| Total | 1,683 | 100.0% |
Housing Finances in South Glens Falls
Median Income by Occupancy in South Glens Falls
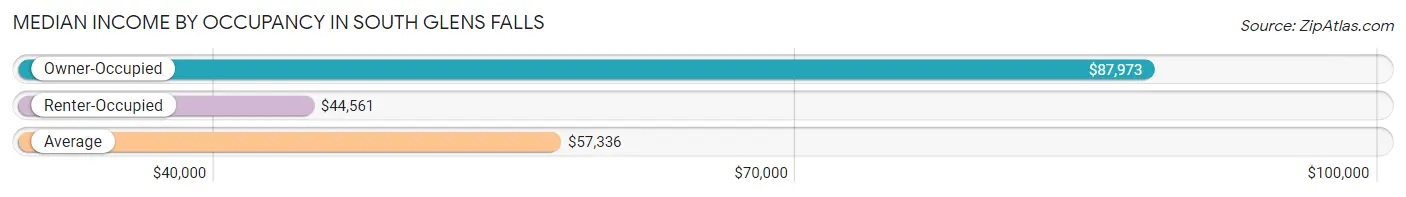
| Occupancy Type | # Households | Median Income |
| Owner-Occupied | 808 (48.0%) | $87,973 |
| Renter-Occupied | 875 (52.0%) | $44,561 |
| Average | 1,683 (100.0%) | $57,336 |
Occupancy by Householder Income Bracket in South Glens Falls
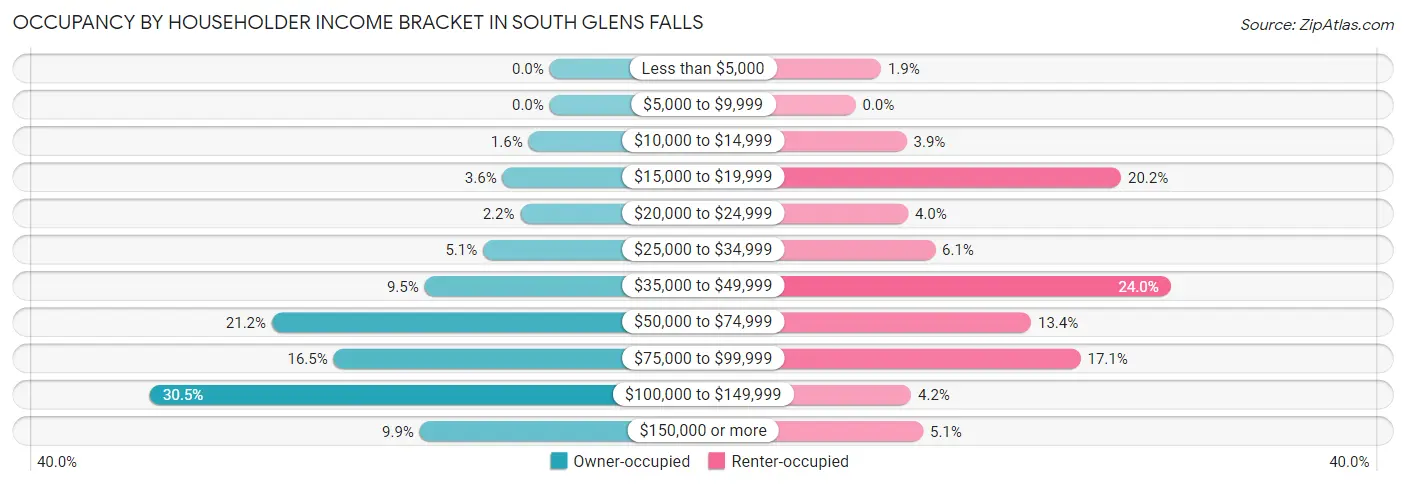
| Income Bracket | Owner-occupied | Renter-occupied |
| Less than $5,000 | 0 (0.0%) | 17 (1.9%) |
| $5,000 to $9,999 | 0 (0.0%) | 0 (0.0%) |
| $10,000 to $14,999 | 13 (1.6%) | 34 (3.9%) |
| $15,000 to $19,999 | 29 (3.6%) | 177 (20.2%) |
| $20,000 to $24,999 | 18 (2.2%) | 35 (4.0%) |
| $25,000 to $34,999 | 41 (5.1%) | 53 (6.1%) |
| $35,000 to $49,999 | 77 (9.5%) | 210 (24.0%) |
| $50,000 to $74,999 | 171 (21.2%) | 117 (13.4%) |
| $75,000 to $99,999 | 133 (16.5%) | 150 (17.1%) |
| $100,000 to $149,999 | 246 (30.4%) | 37 (4.2%) |
| $150,000 or more | 80 (9.9%) | 45 (5.1%) |
| Total | 808 (100.0%) | 875 (100.0%) |
Monthly Housing Cost Tiers in South Glens Falls
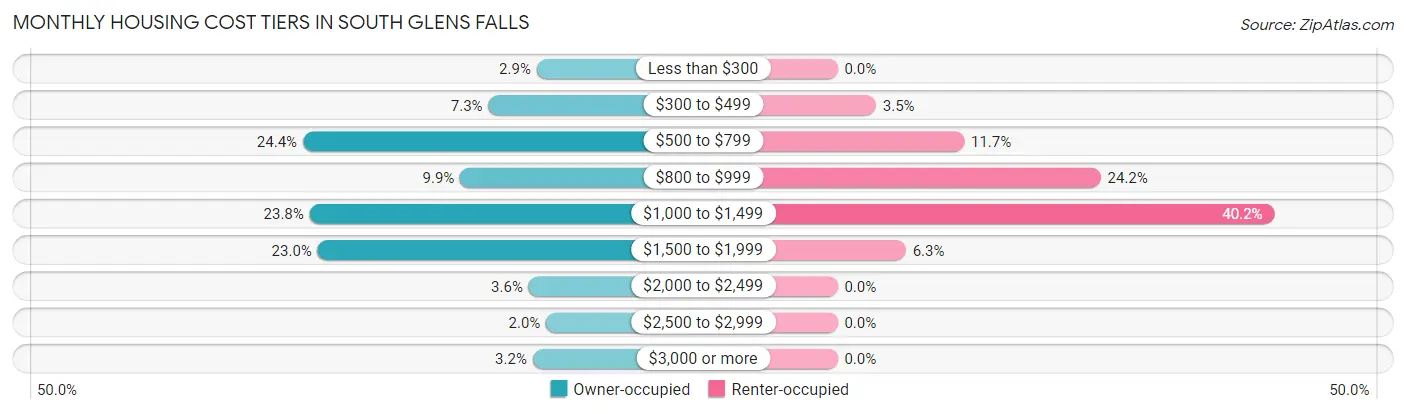
| Monthly Cost | Owner-occupied | Renter-occupied |
| Less than $300 | 23 (2.9%) | 0 (0.0%) |
| $300 to $499 | 59 (7.3%) | 31 (3.5%) |
| $500 to $799 | 197 (24.4%) | 102 (11.7%) |
| $800 to $999 | 80 (9.9%) | 212 (24.2%) |
| $1,000 to $1,499 | 192 (23.8%) | 352 (40.2%) |
| $1,500 to $1,999 | 186 (23.0%) | 55 (6.3%) |
| $2,000 to $2,499 | 29 (3.6%) | 0 (0.0%) |
| $2,500 to $2,999 | 16 (2.0%) | 0 (0.0%) |
| $3,000 or more | 26 (3.2%) | 0 (0.0%) |
| Total | 808 (100.0%) | 875 (100.0%) |
Physical Housing Characteristics in South Glens Falls
Housing Structures in South Glens Falls
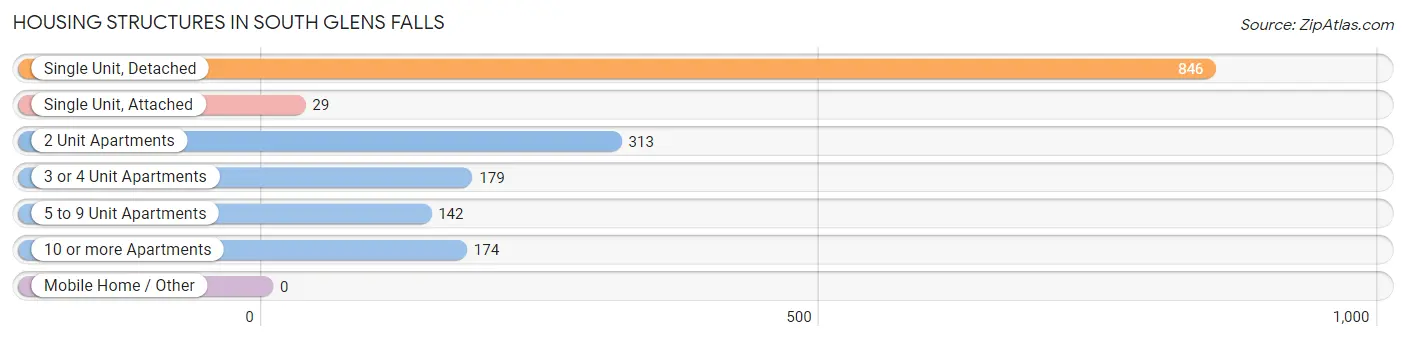
| Structure Type | # Housing Units | % Housing Units |
| Single Unit, Detached | 846 | 50.3% |
| Single Unit, Attached | 29 | 1.7% |
| 2 Unit Apartments | 313 | 18.6% |
| 3 or 4 Unit Apartments | 179 | 10.6% |
| 5 to 9 Unit Apartments | 142 | 8.4% |
| 10 or more Apartments | 174 | 10.3% |
| Mobile Home / Other | 0 | 0.0% |
| Total | 1,683 | 100.0% |
Housing Structures by Occupancy in South Glens Falls
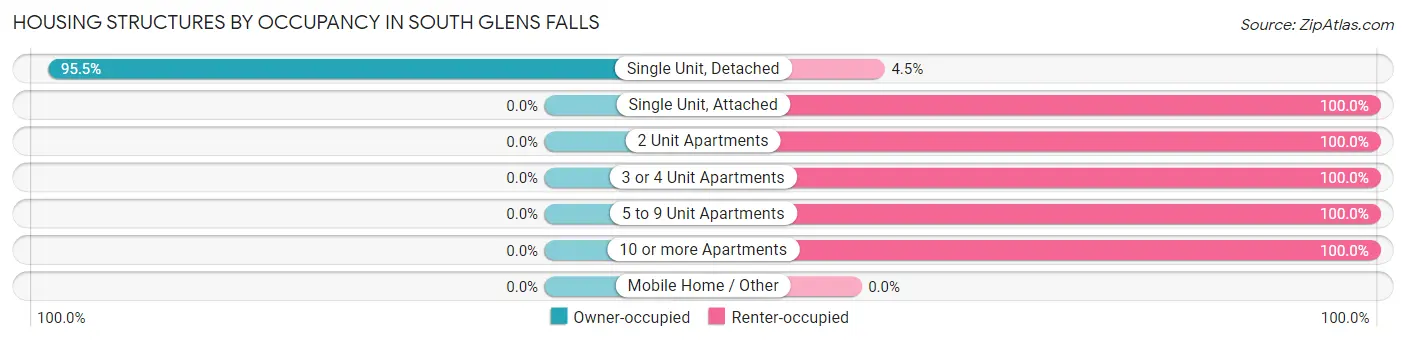
| Structure Type | Owner-occupied | Renter-occupied |
| Single Unit, Detached | 808 (95.5%) | 38 (4.5%) |
| Single Unit, Attached | 0 (0.0%) | 29 (100.0%) |
| 2 Unit Apartments | 0 (0.0%) | 313 (100.0%) |
| 3 or 4 Unit Apartments | 0 (0.0%) | 179 (100.0%) |
| 5 to 9 Unit Apartments | 0 (0.0%) | 142 (100.0%) |
| 10 or more Apartments | 0 (0.0%) | 174 (100.0%) |
| Mobile Home / Other | 0 (0.0%) | 0 (0.0%) |
| Total | 808 (48.0%) | 875 (52.0%) |
Housing Structures by Number of Rooms in South Glens Falls
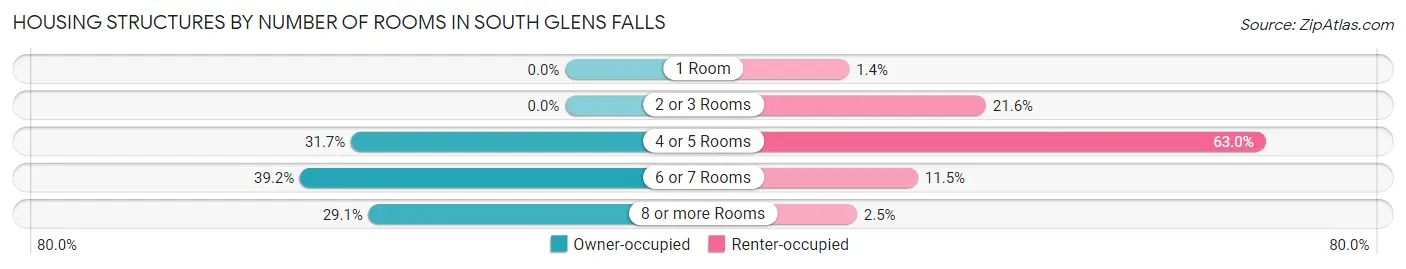
| Number of Rooms | Owner-occupied | Renter-occupied |
| 1 Room | 0 (0.0%) | 12 (1.4%) |
| 2 or 3 Rooms | 0 (0.0%) | 189 (21.6%) |
| 4 or 5 Rooms | 256 (31.7%) | 551 (63.0%) |
| 6 or 7 Rooms | 317 (39.2%) | 101 (11.5%) |
| 8 or more Rooms | 235 (29.1%) | 22 (2.5%) |
| Total | 808 (100.0%) | 875 (100.0%) |
Housing Structure by Heating Type in South Glens Falls
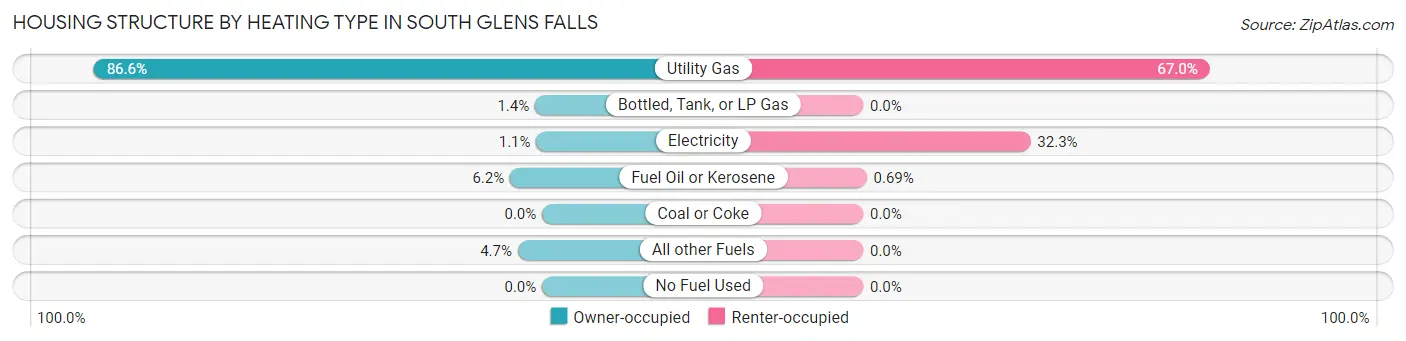
| Heating Type | Owner-occupied | Renter-occupied |
| Utility Gas | 700 (86.6%) | 586 (67.0%) |
| Bottled, Tank, or LP Gas | 11 (1.4%) | 0 (0.0%) |
| Electricity | 9 (1.1%) | 283 (32.3%) |
| Fuel Oil or Kerosene | 50 (6.2%) | 6 (0.7%) |
| Coal or Coke | 0 (0.0%) | 0 (0.0%) |
| All other Fuels | 38 (4.7%) | 0 (0.0%) |
| No Fuel Used | 0 (0.0%) | 0 (0.0%) |
| Total | 808 (100.0%) | 875 (100.0%) |
Household Vehicle Usage in South Glens Falls
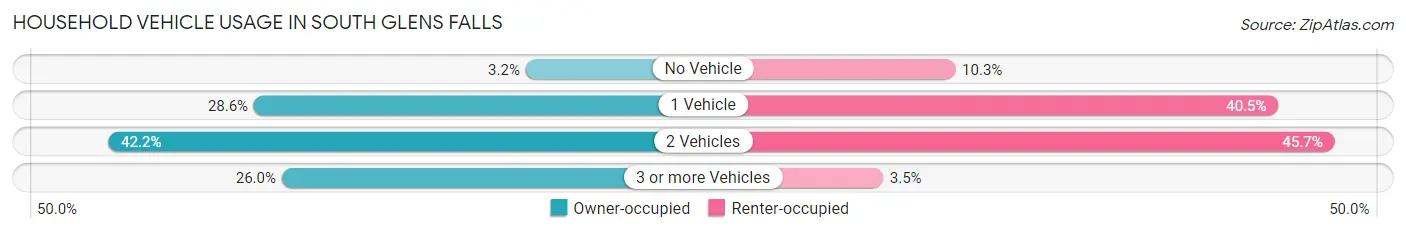
| Vehicles per Household | Owner-occupied | Renter-occupied |
| No Vehicle | 26 (3.2%) | 90 (10.3%) |
| 1 Vehicle | 231 (28.6%) | 354 (40.5%) |
| 2 Vehicles | 341 (42.2%) | 400 (45.7%) |
| 3 or more Vehicles | 210 (26.0%) | 31 (3.5%) |
| Total | 808 (100.0%) | 875 (100.0%) |
Real Estate & Mortgages in South Glens Falls
Real Estate and Mortgage Overview in South Glens Falls
| Characteristic | Without Mortgage | With Mortgage |
| Housing Units | 269 | 539 |
| Median Property Value | $190,100 | $194,700 |
| Median Household Income | $54,306 | $43 |
| Monthly Housing Costs | $638 | $26 |
| Real Estate Taxes | $2,789 | $15 |
Property Value by Mortgage Status in South Glens Falls
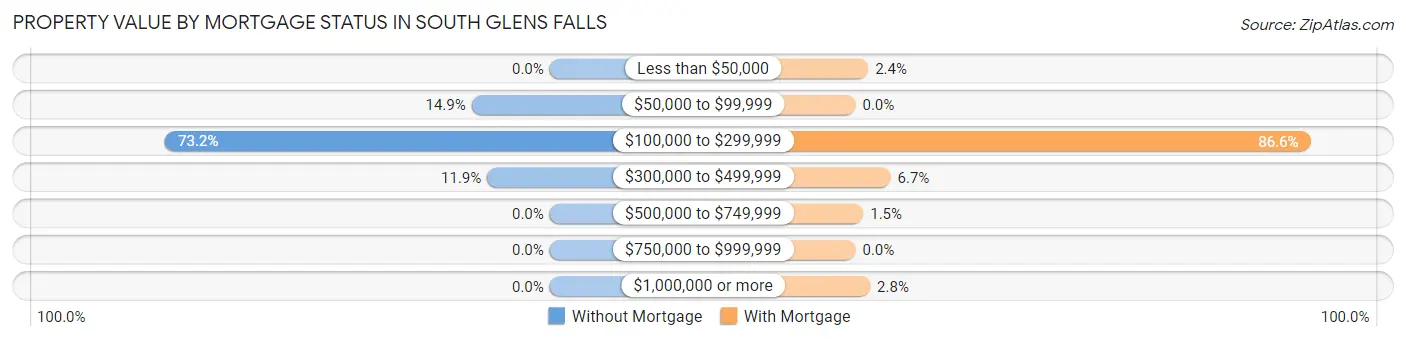
| Property Value | Without Mortgage | With Mortgage |
| Less than $50,000 | 0 (0.0%) | 13 (2.4%) |
| $50,000 to $99,999 | 40 (14.9%) | 0 (0.0%) |
| $100,000 to $299,999 | 197 (73.2%) | 467 (86.6%) |
| $300,000 to $499,999 | 32 (11.9%) | 36 (6.7%) |
| $500,000 to $749,999 | 0 (0.0%) | 8 (1.5%) |
| $750,000 to $999,999 | 0 (0.0%) | 0 (0.0%) |
| $1,000,000 or more | 0 (0.0%) | 15 (2.8%) |
| Total | 269 (100.0%) | 539 (100.0%) |
Household Income by Mortgage Status in South Glens Falls
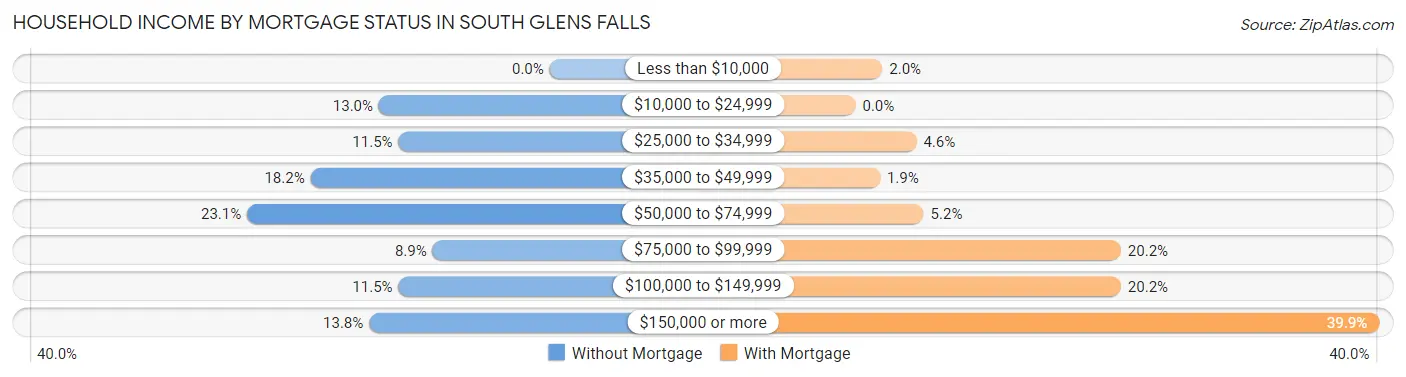
| Household Income | Without Mortgage | With Mortgage |
| Less than $10,000 | 0 (0.0%) | 11 (2.0%) |
| $10,000 to $24,999 | 35 (13.0%) | 0 (0.0%) |
| $25,000 to $34,999 | 31 (11.5%) | 25 (4.6%) |
| $35,000 to $49,999 | 49 (18.2%) | 10 (1.9%) |
| $50,000 to $74,999 | 62 (23.1%) | 28 (5.2%) |
| $75,000 to $99,999 | 24 (8.9%) | 109 (20.2%) |
| $100,000 to $149,999 | 31 (11.5%) | 109 (20.2%) |
| $150,000 or more | 37 (13.8%) | 215 (39.9%) |
| Total | 269 (100.0%) | 539 (100.0%) |
Property Value to Household Income Ratio in South Glens Falls
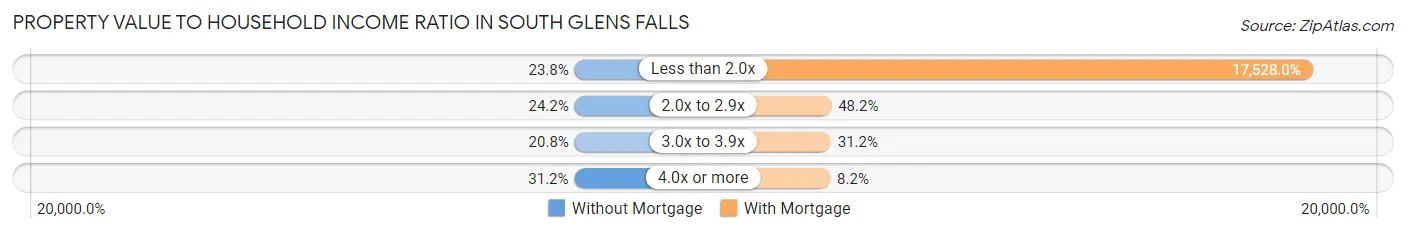
| Value-to-Income Ratio | Without Mortgage | With Mortgage |
| Less than 2.0x | 64 (23.8%) | 94,476 (17,528.0%) |
| 2.0x to 2.9x | 65 (24.2%) | 260 (48.2%) |
| 3.0x to 3.9x | 56 (20.8%) | 168 (31.2%) |
| 4.0x or more | 84 (31.2%) | 44 (8.2%) |
| Total | 269 (100.0%) | 539 (100.0%) |
Real Estate Taxes by Mortgage Status in South Glens Falls
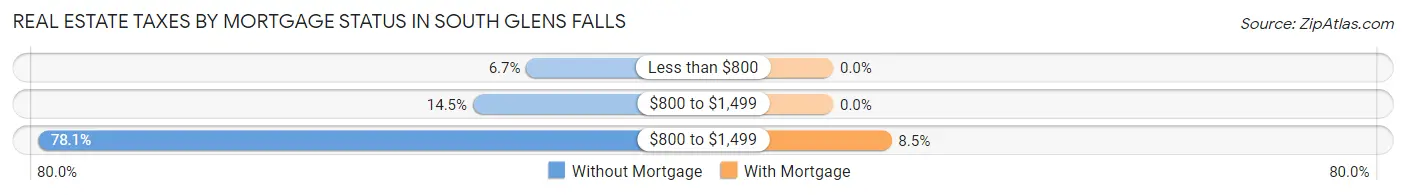
| Property Taxes | Without Mortgage | With Mortgage |
| Less than $800 | 18 (6.7%) | 0 (0.0%) |
| $800 to $1,499 | 39 (14.5%) | 0 (0.0%) |
| $800 to $1,499 | 210 (78.1%) | 46 (8.5%) |
| Total | 269 (100.0%) | 539 (100.0%) |
Health & Disability in South Glens Falls
Health Insurance Coverage by Age in South Glens Falls
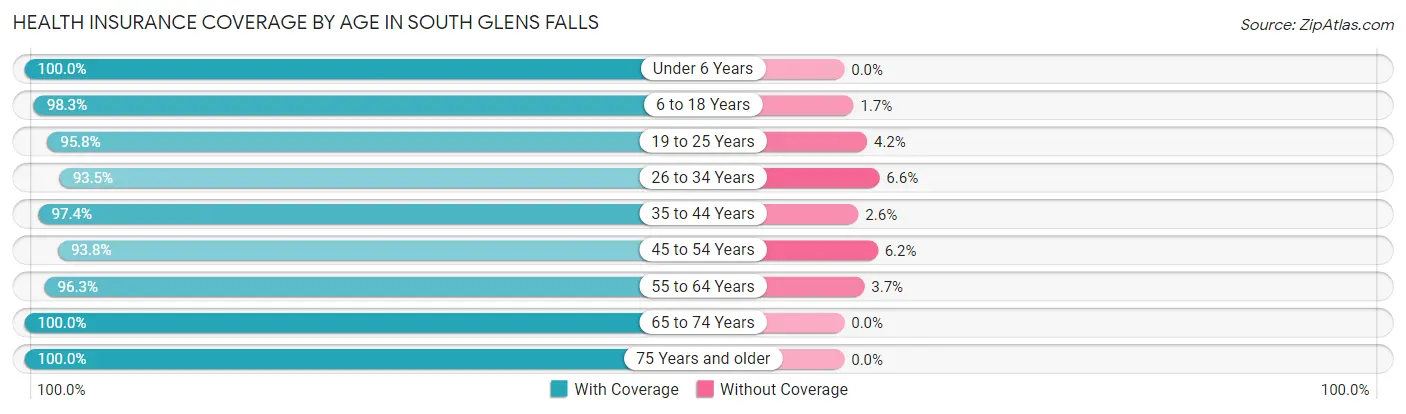
| Age Bracket | With Coverage | Without Coverage |
| Under 6 Years | 235 (100.0%) | 0 (0.0%) |
| 6 to 18 Years | 514 (98.3%) | 9 (1.7%) |
| 19 to 25 Years | 587 (95.8%) | 26 (4.2%) |
| 26 to 34 Years | 257 (93.4%) | 18 (6.6%) |
| 35 to 44 Years | 629 (97.4%) | 17 (2.6%) |
| 45 to 54 Years | 286 (93.8%) | 19 (6.2%) |
| 55 to 64 Years | 438 (96.3%) | 17 (3.7%) |
| 65 to 74 Years | 446 (100.0%) | 0 (0.0%) |
| 75 Years and older | 241 (100.0%) | 0 (0.0%) |
| Total | 3,633 (97.2%) | 106 (2.8%) |
Health Insurance Coverage by Citizenship Status in South Glens Falls
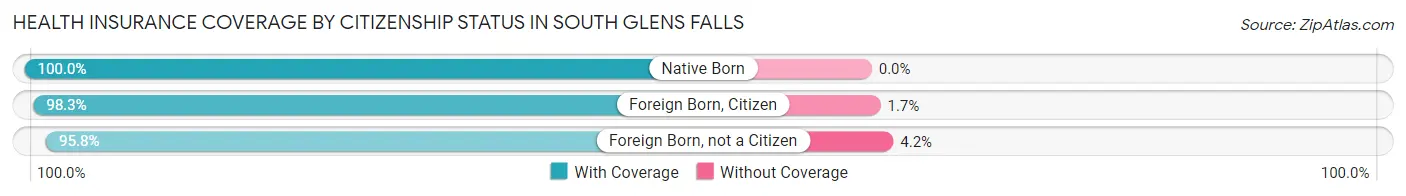
| Citizenship Status | With Coverage | Without Coverage |
| Native Born | 235 (100.0%) | 0 (0.0%) |
| Foreign Born, Citizen | 514 (98.3%) | 9 (1.7%) |
| Foreign Born, not a Citizen | 587 (95.8%) | 26 (4.2%) |
Health Insurance Coverage by Household Income in South Glens Falls
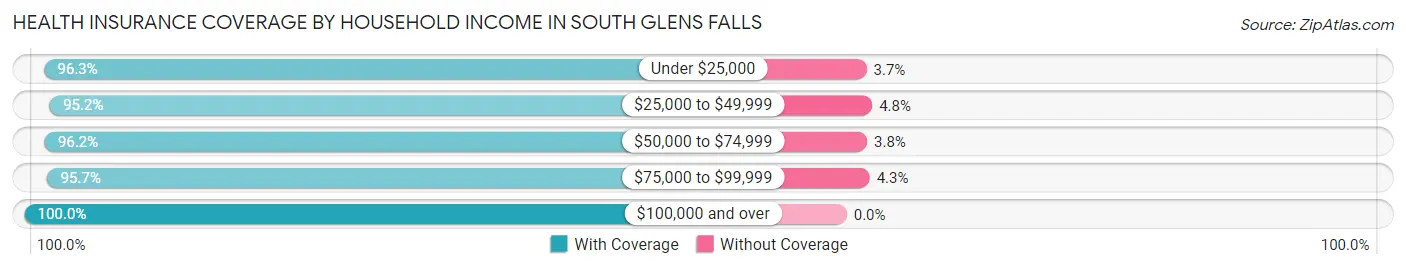
| Household Income | With Coverage | Without Coverage |
| Under $25,000 | 441 (96.3%) | 17 (3.7%) |
| $25,000 to $49,999 | 700 (95.2%) | 35 (4.8%) |
| $50,000 to $74,999 | 658 (96.2%) | 26 (3.8%) |
| $75,000 to $99,999 | 625 (95.7%) | 28 (4.3%) |
| $100,000 and over | 1,186 (100.0%) | 0 (0.0%) |
Public vs Private Health Insurance Coverage by Age in South Glens Falls
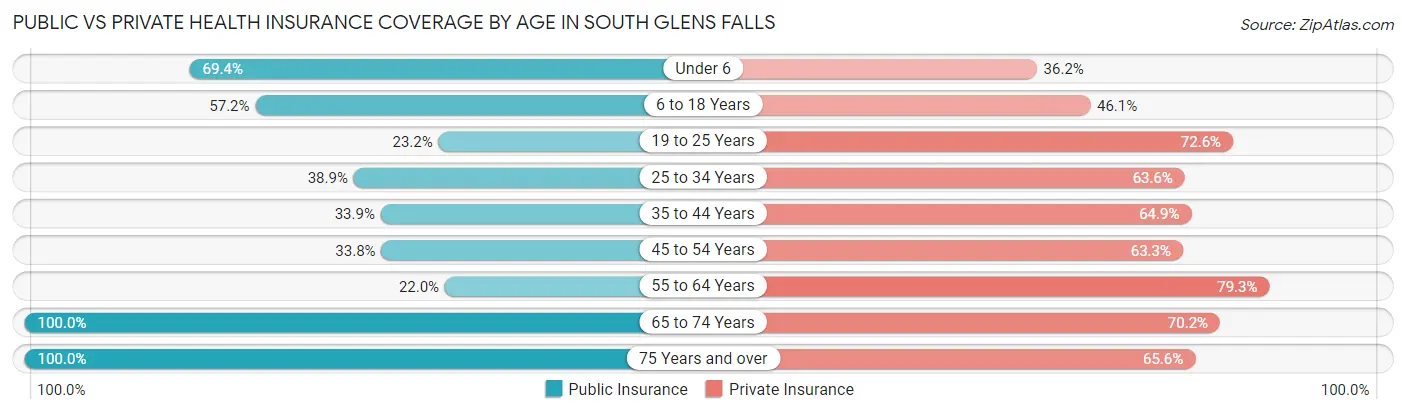
| Age Bracket | Public Insurance | Private Insurance |
| Under 6 | 163 (69.4%) | 85 (36.2%) |
| 6 to 18 Years | 299 (57.2%) | 241 (46.1%) |
| 19 to 25 Years | 142 (23.2%) | 445 (72.6%) |
| 25 to 34 Years | 107 (38.9%) | 175 (63.6%) |
| 35 to 44 Years | 219 (33.9%) | 419 (64.9%) |
| 45 to 54 Years | 103 (33.8%) | 193 (63.3%) |
| 55 to 64 Years | 100 (22.0%) | 361 (79.3%) |
| 65 to 74 Years | 446 (100.0%) | 313 (70.2%) |
| 75 Years and over | 241 (100.0%) | 158 (65.6%) |
| Total | 1,820 (48.7%) | 2,390 (63.9%) |
Disability Status by Sex by Age in South Glens Falls
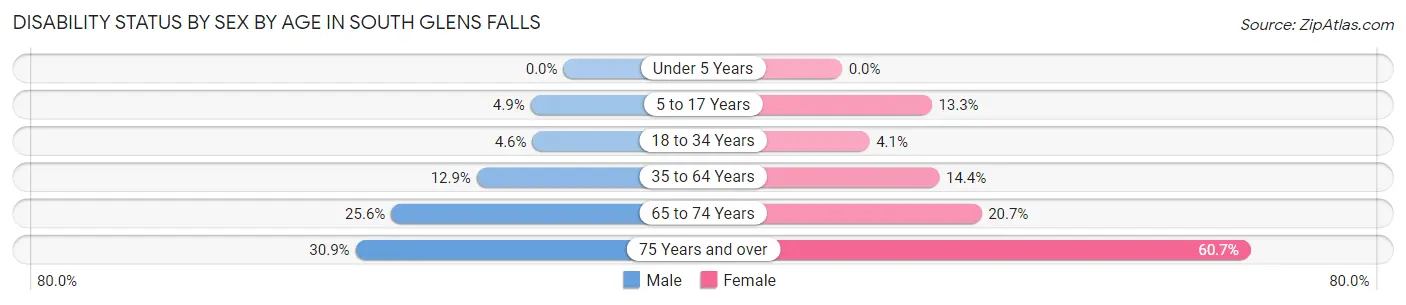
| Age Bracket | Male | Female |
| Under 5 Years | 0 (0.0%) | 0 (0.0%) |
| 5 to 17 Years | 10 (4.9%) | 33 (13.3%) |
| 18 to 34 Years | 24 (4.6%) | 19 (4.1%) |
| 35 to 64 Years | 99 (12.9%) | 92 (14.4%) |
| 65 to 74 Years | 56 (25.6%) | 47 (20.7%) |
| 75 Years and over | 21 (30.9%) | 105 (60.7%) |
Disability Class by Sex by Age in South Glens Falls
Disability Class: Hearing Difficulty
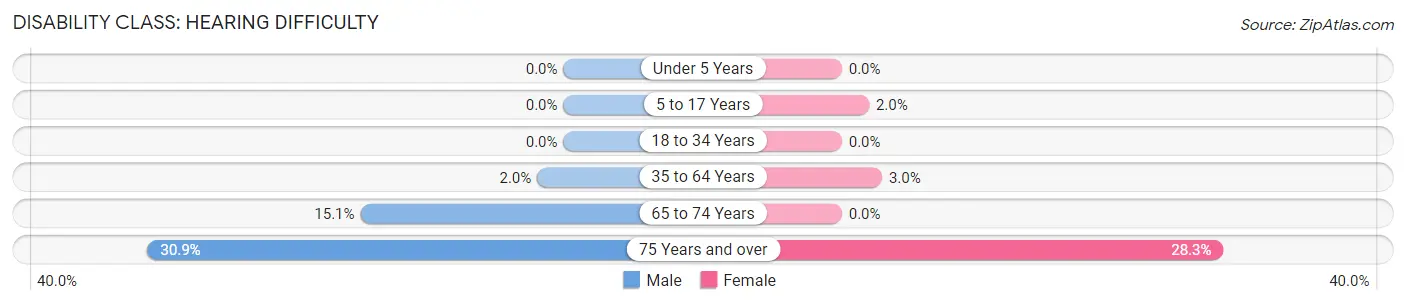
| Age Bracket | Male | Female |
| Under 5 Years | 0 (0.0%) | 0 (0.0%) |
| 5 to 17 Years | 0 (0.0%) | 5 (2.0%) |
| 18 to 34 Years | 0 (0.0%) | 0 (0.0%) |
| 35 to 64 Years | 15 (1.9%) | 19 (3.0%) |
| 65 to 74 Years | 33 (15.1%) | 0 (0.0%) |
| 75 Years and over | 21 (30.9%) | 49 (28.3%) |
Disability Class: Vision Difficulty
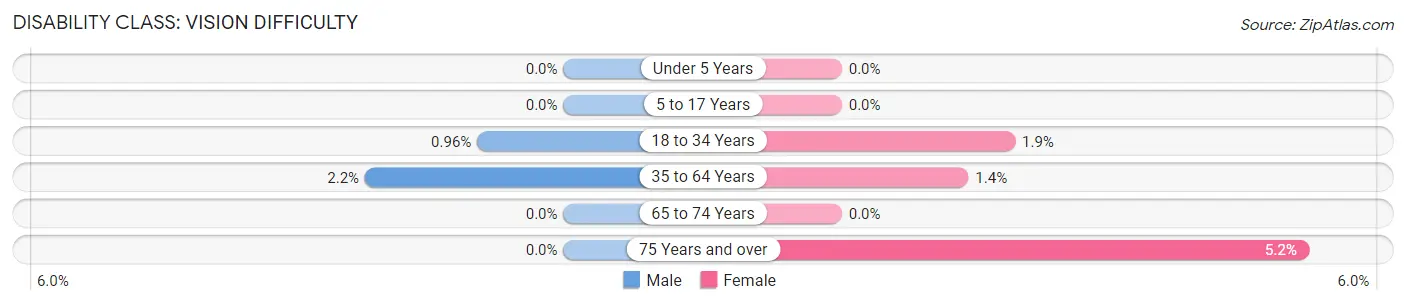
| Age Bracket | Male | Female |
| Under 5 Years | 0 (0.0%) | 0 (0.0%) |
| 5 to 17 Years | 0 (0.0%) | 0 (0.0%) |
| 18 to 34 Years | 5 (1.0%) | 9 (1.9%) |
| 35 to 64 Years | 17 (2.2%) | 9 (1.4%) |
| 65 to 74 Years | 0 (0.0%) | 0 (0.0%) |
| 75 Years and over | 0 (0.0%) | 9 (5.2%) |
Disability Class: Cognitive Difficulty
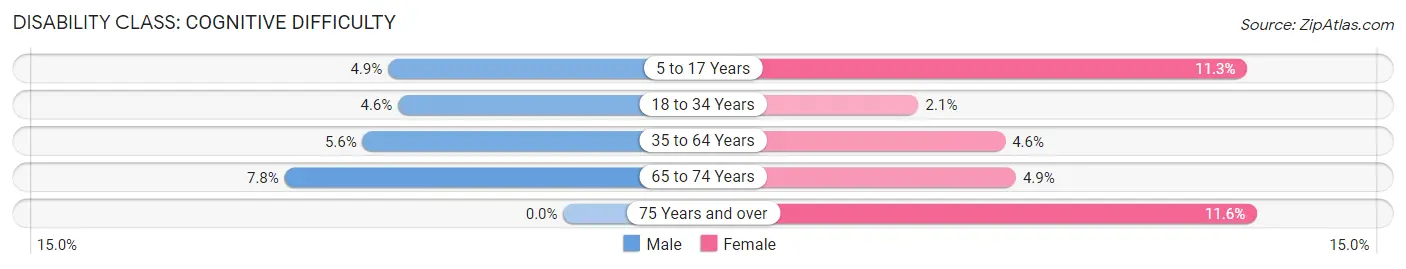
| Age Bracket | Male | Female |
| 5 to 17 Years | 10 (4.9%) | 28 (11.3%) |
| 18 to 34 Years | 24 (4.6%) | 10 (2.1%) |
| 35 to 64 Years | 43 (5.6%) | 29 (4.5%) |
| 65 to 74 Years | 17 (7.8%) | 11 (4.9%) |
| 75 Years and over | 0 (0.0%) | 20 (11.6%) |
Disability Class: Ambulatory Difficulty
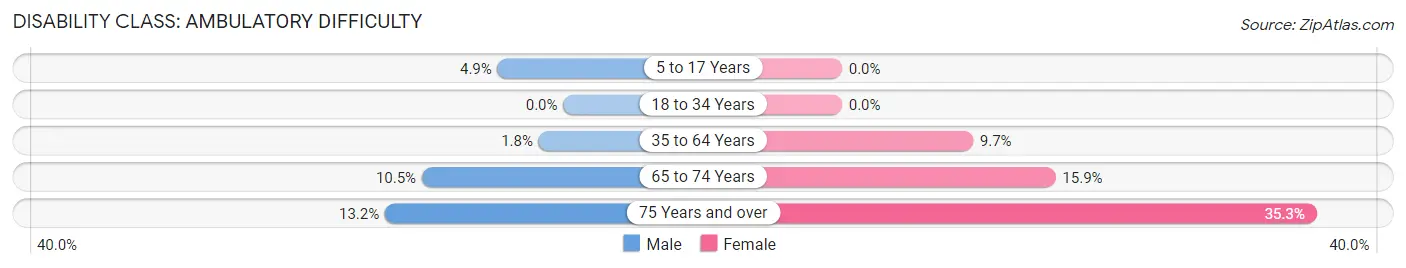
| Age Bracket | Male | Female |
| 5 to 17 Years | 10 (4.9%) | 0 (0.0%) |
| 18 to 34 Years | 0 (0.0%) | 0 (0.0%) |
| 35 to 64 Years | 14 (1.8%) | 62 (9.7%) |
| 65 to 74 Years | 23 (10.5%) | 36 (15.9%) |
| 75 Years and over | 9 (13.2%) | 61 (35.3%) |
Disability Class: Self-Care Difficulty
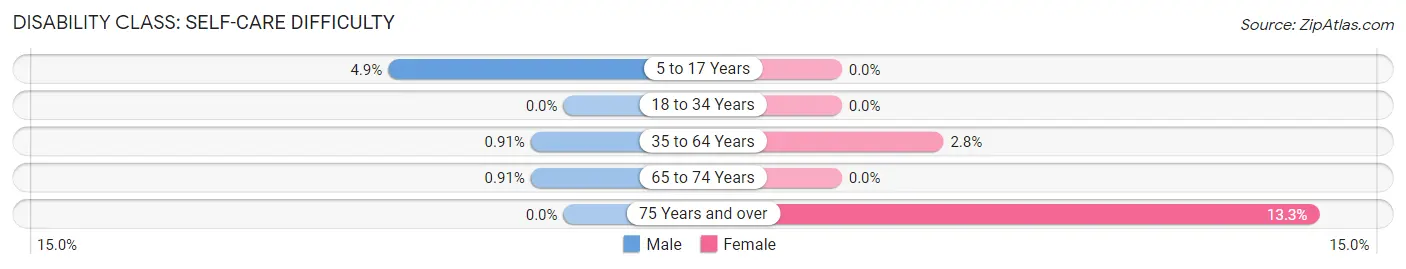
| Age Bracket | Male | Female |
| 5 to 17 Years | 10 (4.9%) | 0 (0.0%) |
| 18 to 34 Years | 0 (0.0%) | 0 (0.0%) |
| 35 to 64 Years | 7 (0.9%) | 18 (2.8%) |
| 65 to 74 Years | 2 (0.9%) | 0 (0.0%) |
| 75 Years and over | 0 (0.0%) | 23 (13.3%) |
Technology Access in South Glens Falls
Computing Device Access in South Glens Falls
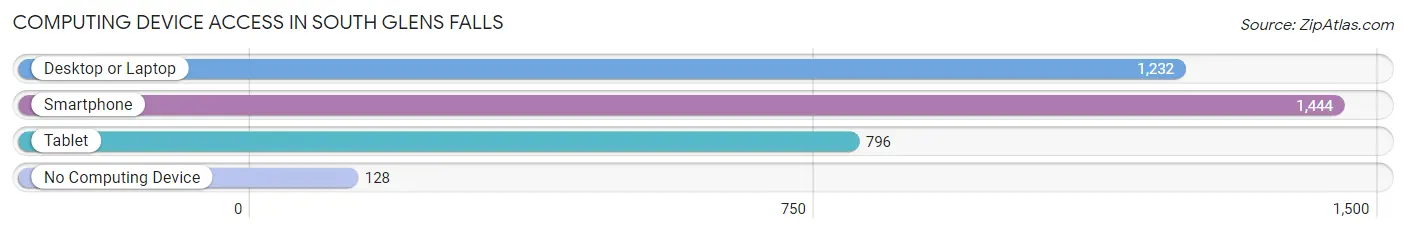
| Device Type | # Households | % Households |
| Desktop or Laptop | 1,232 | 73.2% |
| Smartphone | 1,444 | 85.8% |
| Tablet | 796 | 47.3% |
| No Computing Device | 128 | 7.6% |
| Total | 1,683 | 100.0% |
Internet Access in South Glens Falls
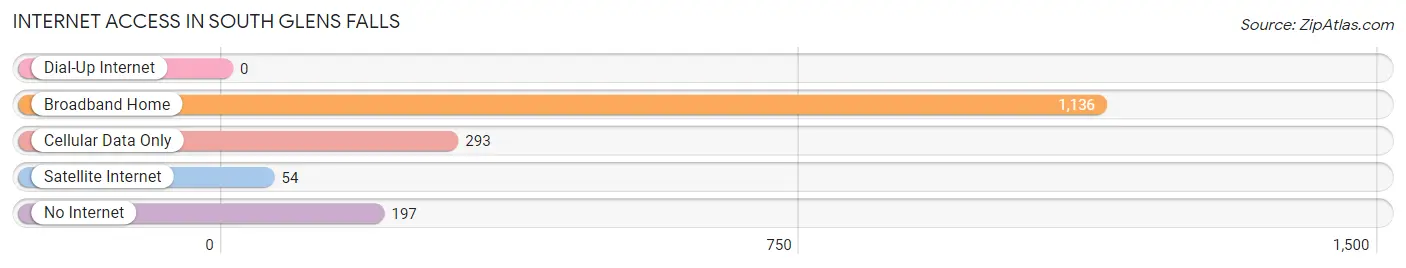
| Internet Type | # Households | % Households |
| Dial-Up Internet | 0 | 0.0% |
| Broadband Home | 1,136 | 67.5% |
| Cellular Data Only | 293 | 17.4% |
| Satellite Internet | 54 | 3.2% |
| No Internet | 197 | 11.7% |
| Total | 1,683 | 100.0% |
South Glens Falls Summary
Glens Falls is a city located in the Adirondack region of New York State, in the United States. It is located in the town of South Glens Falls, in Saratoga County. The city is situated on the Hudson River, and is part of the Glens Falls Metropolitan Statistical Area. The population of South Glens Falls was 5,945 at the 2010 census.
History
The area that is now South Glens Falls was originally inhabited by the Mohawk and Iroquois Native American tribes. The first European settlers arrived in the area in the late 1700s, and the town was officially established in 1810. The town was named after the nearby Glens Falls, which was named after the falls on the Hudson River.
The town grew rapidly in the 19th century, and by the mid-1800s, it was a thriving industrial center. The town was home to several factories, including a paper mill, a tannery, and a sawmill. The town was also home to several hotels, which attracted tourists from all over the country.
In the early 20th century, the town began to decline as the factories closed and the tourists stopped coming. The town was hit hard by the Great Depression, and many of the businesses closed. The town was revitalized in the 1950s, when the state of New York began to invest in the area. The town was incorporated as a village in 1961, and as a city in 1965.
Geography
South Glens Falls is located in the Adirondack region of New York State, in Saratoga County. The city is situated on the Hudson River, and is part of the Glens Falls Metropolitan Statistical Area. The city is bordered by the towns of Moreau to the north, Queensbury to the east, and Fort Edward to the south.
The city has a total area of 2.2 square miles, all of which is land. The city is located at an elevation of approximately 200 feet above sea level. The city is located in the humid continental climate zone, and has four distinct seasons.
Economy
South Glens Falls is a small city, and its economy is largely based on tourism and retail. The city is home to several small businesses, including restaurants, shops, and galleries. The city is also home to several large employers, including Glens Falls Hospital, Glens Falls National Bank, and the Glens Falls City School District.
The city is also home to several manufacturing companies, including Glens Falls Plastics, Glens Falls Manufacturing, and Glens Falls Paper. The city is also home to several technology companies, including Glens Falls Technology and Glens Falls Software.
Demographics
As of the 2010 census, the population of South Glens Falls was 5,945. The racial makeup of the city was 94.3% White, 1.7% African American, 0.3% Native American, 1.2% Asian, 0.1% Pacific Islander, 0.7% from other races, and 1.9% from two or more races. Hispanic or Latino of any race were 3.2% of the population.
The median household income in South Glens Falls was $45,945, and the median family income was $54,945. The per capita income for the city was $22,945. About 8.3% of families and 10.2% of the population were below the poverty line, including 14.2% of those under age 18 and 6.2% of those age 65 or over.
Common Questions
What is Per Capita Income in South Glens Falls?
Per Capita income in South Glens Falls is $43,915.
What is the Median Family Income in South Glens Falls?
Median Family Income in South Glens Falls is $66,791.
What is the Median Household income in South Glens Falls?
Median Household Income in South Glens Falls is $57,336.
What is Income or Wage Gap in South Glens Falls?
Income or Wage Gap in South Glens Falls is 33.4%.
Women in South Glens Falls earn 66.6 cents for every dollar earned by a man.
What is Inequality or Gini Index in South Glens Falls?
Inequality or Gini Index in South Glens Falls is 0.54.
What is the Total Population of South Glens Falls?
Total Population of South Glens Falls is 3,739.
What is the Total Male Population of South Glens Falls?
Total Male Population of South Glens Falls is 1,886.
What is the Total Female Population of South Glens Falls?
Total Female Population of South Glens Falls is 1,853.
What is the Ratio of Males per 100 Females in South Glens Falls?
There are 101.78 Males per 100 Females in South Glens Falls.
What is the Ratio of Females per 100 Males in South Glens Falls?
There are 98.25 Females per 100 Males in South Glens Falls.
What is the Median Population Age in South Glens Falls?
Median Population Age in South Glens Falls is 38.0 Years.
What is the Average Family Size in South Glens Falls
Average Family Size in South Glens Falls is 2.8 People.
What is the Average Household Size in South Glens Falls
Average Household Size in South Glens Falls is 2.2 People.
How Large is the Labor Force in South Glens Falls?
There are 2,280 People in the Labor Forcein in South Glens Falls.
What is the Percentage of People in the Labor Force in South Glens Falls?
72.9% of People are in the Labor Force in South Glens Falls.
What is the Unemployment Rate in South Glens Falls?
Unemployment Rate in South Glens Falls is 7.2%.