Dannemora, NY Map & Demographics
Dannemora Map
Dannemora Overview
$9,082
PER CAPITA INCOME
$95,833
AVG FAMILY INCOME
$67,778
AVG HOUSEHOLD INCOME
0.38
INEQUALITY / GINI INDEX
3,373
TOTAL POPULATION
2,886
MALE POPULATION
487
FEMALE POPULATION
592.61
MALES / 100 FEMALES
16.87
FEMALES / 100 MALES
37.7
MEDIAN AGE
3.2
AVG FAMILY SIZE
2.4
AVG HOUSEHOLD SIZE
436
LABOR FORCE [ PEOPLE ]
13.8%
PERCENT IN LABOR FORCE
4.6%
UNEMPLOYMENT RATE
Dannemora Zip Codes
Dannemora Area Codes
Income in Dannemora
Income Overview in Dannemora
Per Capita Income in Dannemora is $9,082, while median incomes of families and households are $95,833 and $67,778 respectively.
| Characteristic | Number | Measure |
| Per Capita Income | 3,373 | $9,082 |
| Median Family Income | 220 | $95,833 |
| Mean Family Income | 220 | $94,281 |
| Median Household Income | 374 | $67,778 |
| Mean Household Income | 374 | $77,711 |
| Income Deficit | 220 | $0 |
| Wage / Income Gap (%) | 3,373 | 0.00% |
| Wage / Income Gap ($) | 3,373 | 100.00¢ per $1 |
| Gini / Inequality Index | 3,373 | 0.38 |
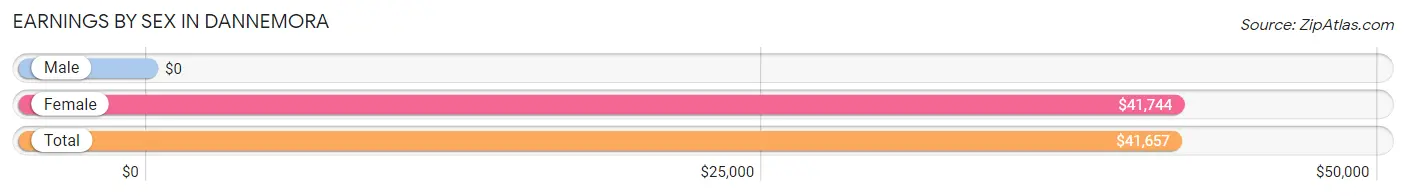
Earnings by Sex in Dannemora
| Sex | Number | Average Earnings |
| Male | 245 (51.4%) | $0 |
| Female | 232 (48.6%) | $41,744 |
| Total | 477 (100.0%) | $41,657 |
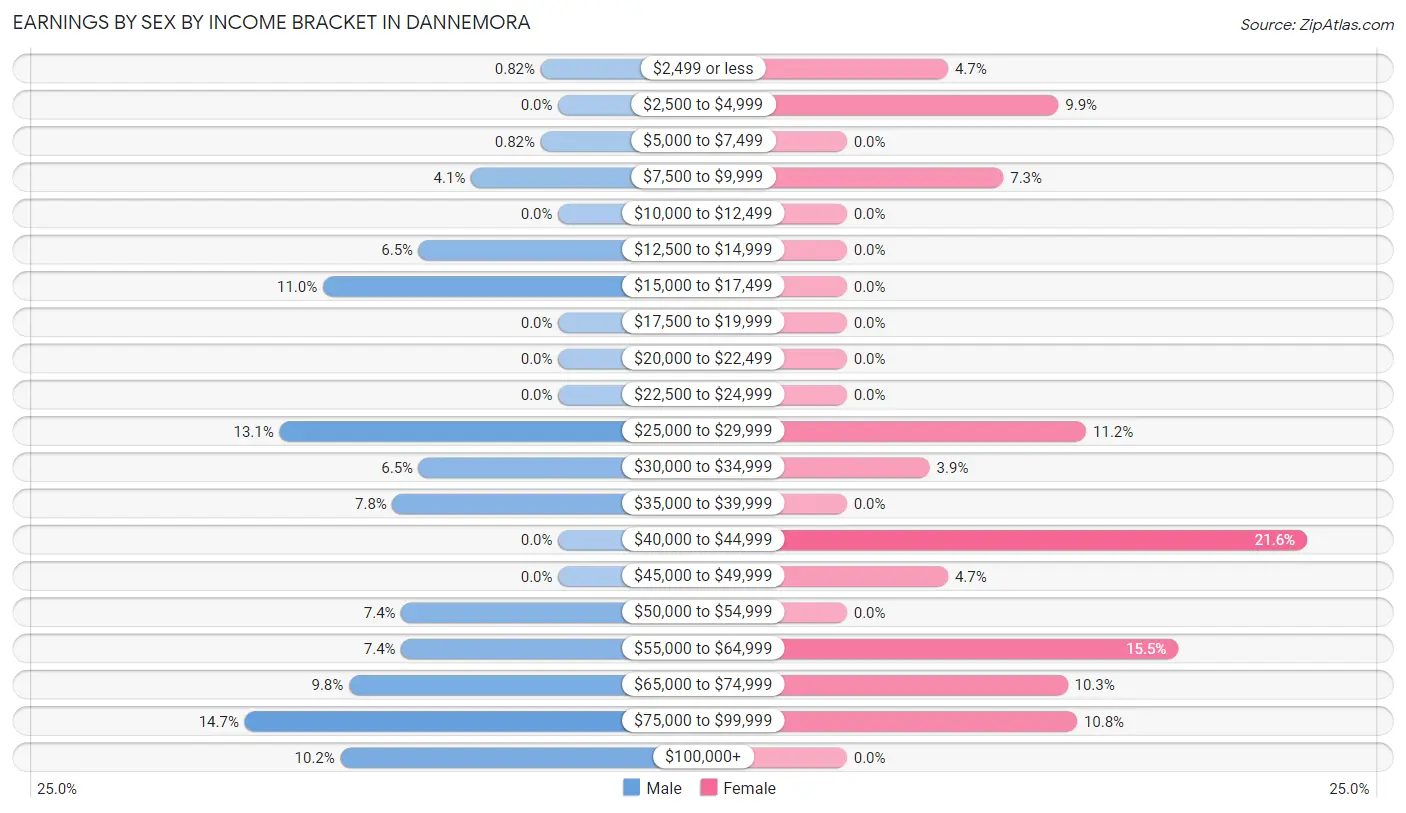
Earnings by Sex by Income Bracket in Dannemora
The most common earnings brackets in Dannemora are $75,000 to $99,999 for men (36 | 14.7%) and $40,000 to $44,999 for women (50 | 21.5%).
| Income | Male | Female |
| $2,499 or less | 2 (0.8%) | 11 (4.7%) |
| $2,500 to $4,999 | 0 (0.0%) | 23 (9.9%) |
| $5,000 to $7,499 | 2 (0.8%) | 0 (0.0%) |
| $7,500 to $9,999 | 10 (4.1%) | 17 (7.3%) |
| $10,000 to $12,499 | 0 (0.0%) | 0 (0.0%) |
| $12,500 to $14,999 | 16 (6.5%) | 0 (0.0%) |
| $15,000 to $17,499 | 27 (11.0%) | 0 (0.0%) |
| $17,500 to $19,999 | 0 (0.0%) | 0 (0.0%) |
| $20,000 to $22,499 | 0 (0.0%) | 0 (0.0%) |
| $22,500 to $24,999 | 0 (0.0%) | 0 (0.0%) |
| $25,000 to $29,999 | 32 (13.1%) | 26 (11.2%) |
| $30,000 to $34,999 | 16 (6.5%) | 9 (3.9%) |
| $35,000 to $39,999 | 19 (7.8%) | 0 (0.0%) |
| $40,000 to $44,999 | 0 (0.0%) | 50 (21.5%) |
| $45,000 to $49,999 | 0 (0.0%) | 11 (4.7%) |
| $50,000 to $54,999 | 18 (7.3%) | 0 (0.0%) |
| $55,000 to $64,999 | 18 (7.3%) | 36 (15.5%) |
| $65,000 to $74,999 | 24 (9.8%) | 24 (10.3%) |
| $75,000 to $99,999 | 36 (14.7%) | 25 (10.8%) |
| $100,000+ | 25 (10.2%) | 0 (0.0%) |
| Total | 245 (100.0%) | 232 (100.0%) |
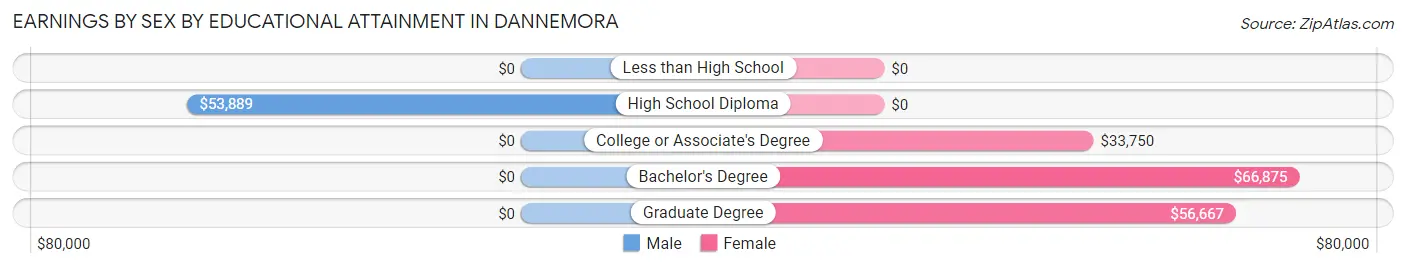
Earnings by Sex by Educational Attainment in Dannemora
Average earnings in Dannemora are $54,514 for men and $42,238 for women, a difference of 22.5%. Men with an educational attainment of high school diploma enjoy the highest average annual earnings of $53,889, while those with high school diploma education earn the least with $53,889. Women with an educational attainment of bachelor's degree earn the most with the average annual earnings of $66,875, while those with college or associate's degree education have the smallest earnings of $33,750.
| Educational Attainment | Male Income | Female Income |
| Less than High School | - | - |
| High School Diploma | $53,889 | $0 |
| College or Associate's Degree | - | - |
| Bachelor's Degree | - | - |
| Graduate Degree | - | - |
| Total | $54,514 | $42,238 |
Family Income in Dannemora
Family Income Brackets in Dannemora
According to the Dannemora family income data, there are 78 families falling into the $100,000 to $149,999 income range, which is the most common income bracket and makes up 35.4% of all families.
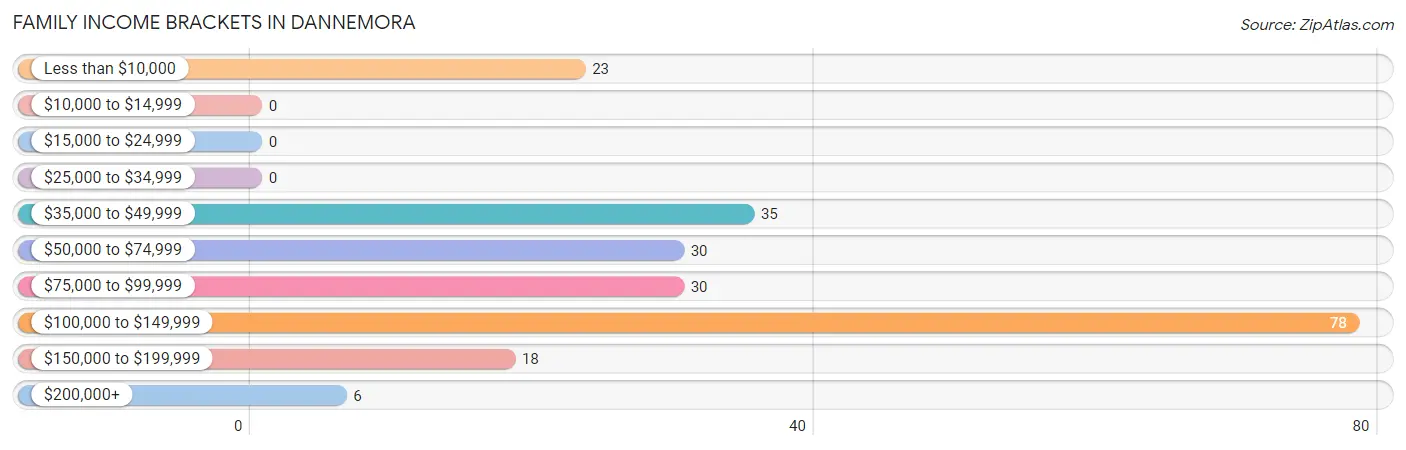
| Income Bracket | # Families | % Families |
| Less than $10,000 | 23 | 10.5% |
| $10,000 to $14,999 | 0 | 0.0% |
| $15,000 to $24,999 | 0 | 0.0% |
| $25,000 to $34,999 | 0 | 0.0% |
| $35,000 to $49,999 | 35 | 15.9% |
| $50,000 to $74,999 | 30 | 13.6% |
| $75,000 to $99,999 | 30 | 13.6% |
| $100,000 to $149,999 | 78 | 35.5% |
| $150,000 to $199,999 | 18 | 8.2% |
| $200,000+ | 6 | 2.7% |
Family Income by Famaliy Size in Dannemora
3-person families (47 | 21.4%) account for the highest median family income in Dannemora with $147,721 per family, while 3-person families (47 | 21.4%) have the highest median income of $49,240 per family member.
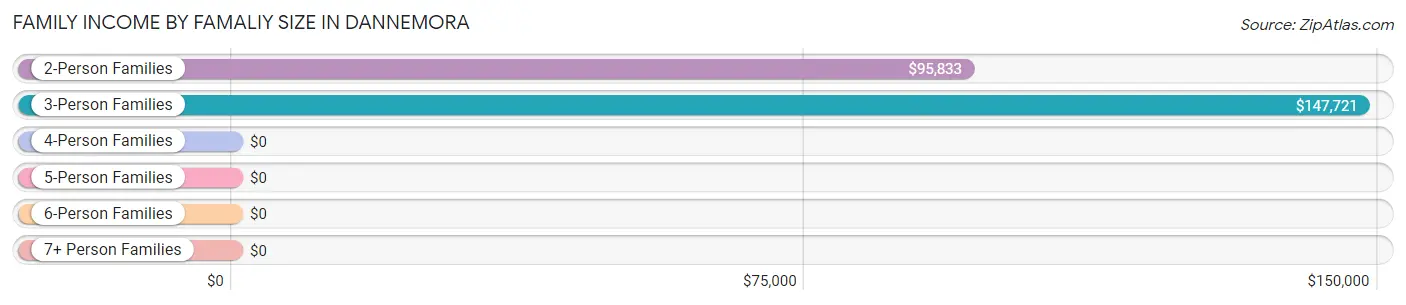
| Income Bracket | # Families | Median Income |
| 2-Person Families | 118 (53.6%) | $95,833 |
| 3-Person Families | 47 (21.4%) | $147,721 |
| 4-Person Families | 45 (20.4%) | $0 |
| 5-Person Families | 10 (4.5%) | $0 |
| 6-Person Families | 0 (0.0%) | $0 |
| 7+ Person Families | 0 (0.0%) | $0 |
| Total | 220 (100.0%) | $95,833 |
Family Income by Number of Earners in Dannemora
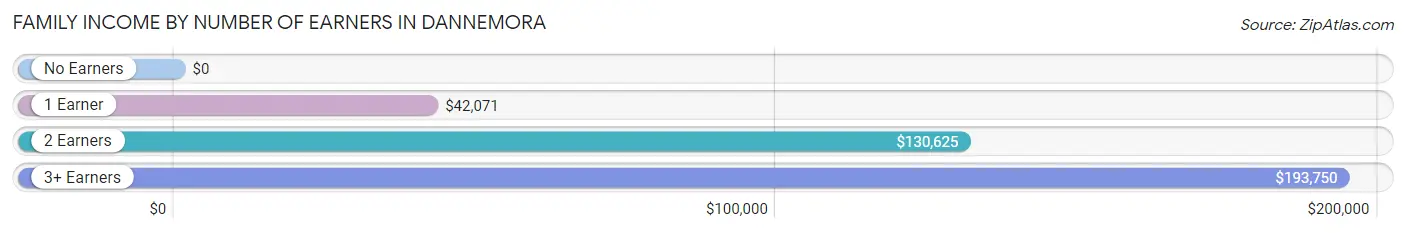
| Number of Earners | # Families | Median Income |
| No Earners | 51 (23.2%) | $0 |
| 1 Earner | 58 (26.4%) | $42,071 |
| 2 Earners | 89 (40.5%) | $130,625 |
| 3+ Earners | 22 (10.0%) | $193,750 |
| Total | 220 (100.0%) | $95,833 |
Household Income in Dannemora
Household Income Brackets in Dannemora
With 78 households falling in the category, the $100,000 to $149,999 income range is the most frequent in Dannemora, accounting for 20.9% of all households.
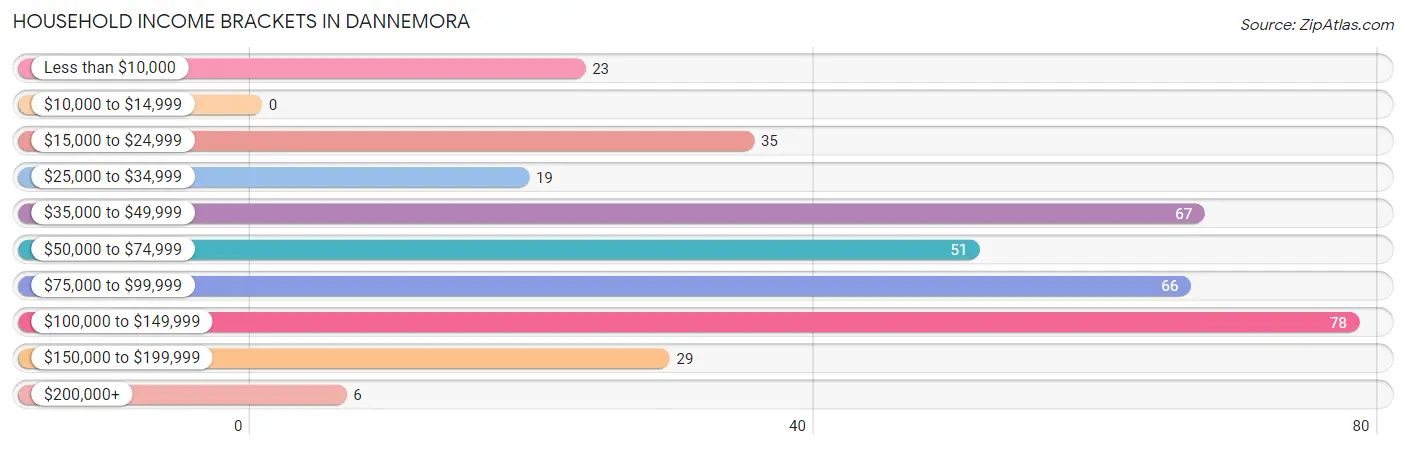
| Income Bracket | # Households | % Households |
| Less than $10,000 | 23 | 6.1% |
| $10,000 to $14,999 | 0 | 0.0% |
| $15,000 to $24,999 | 35 | 9.4% |
| $25,000 to $34,999 | 19 | 5.1% |
| $35,000 to $49,999 | 67 | 17.9% |
| $50,000 to $74,999 | 51 | 13.6% |
| $75,000 to $99,999 | 66 | 17.6% |
| $100,000 to $149,999 | 78 | 20.9% |
| $150,000 to $199,999 | 29 | 7.8% |
| $200,000+ | 6 | 1.6% |
Household Income by Householder Age in Dannemora
The median household income in Dannemora is $67,778, with the highest median household income of $96,250 found in the 45 to 64 years age bracket for the primary householder. A total of 133 households (35.6%) fall into this category. Meanwhile, the 15 to 24 years age bracket for the primary householder has the lowest median household income of $0, with 19 households (5.1%) in this group.
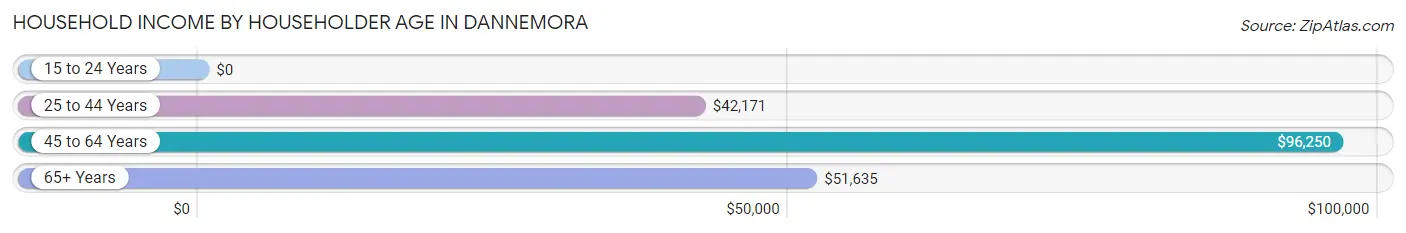
| Income Bracket | # Households | Median Income |
| 15 to 24 Years | 19 (5.1%) | $0 |
| 25 to 44 Years | 135 (36.1%) | $42,171 |
| 45 to 64 Years | 133 (35.6%) | $96,250 |
| 65+ Years | 87 (23.3%) | $51,635 |
| Total | 374 (100.0%) | $67,778 |
Poverty in Dannemora
Income Below Poverty by Sex and Age in Dannemora
With 15.5% poverty level for males and 12.9% for females among the residents of Dannemora, 6 to 11 year old males and 35 to 44 year old females are the most vulnerable to poverty, with 9 males (69.2%) and 30 females (57.7%) in their respective age groups living below the poverty level.
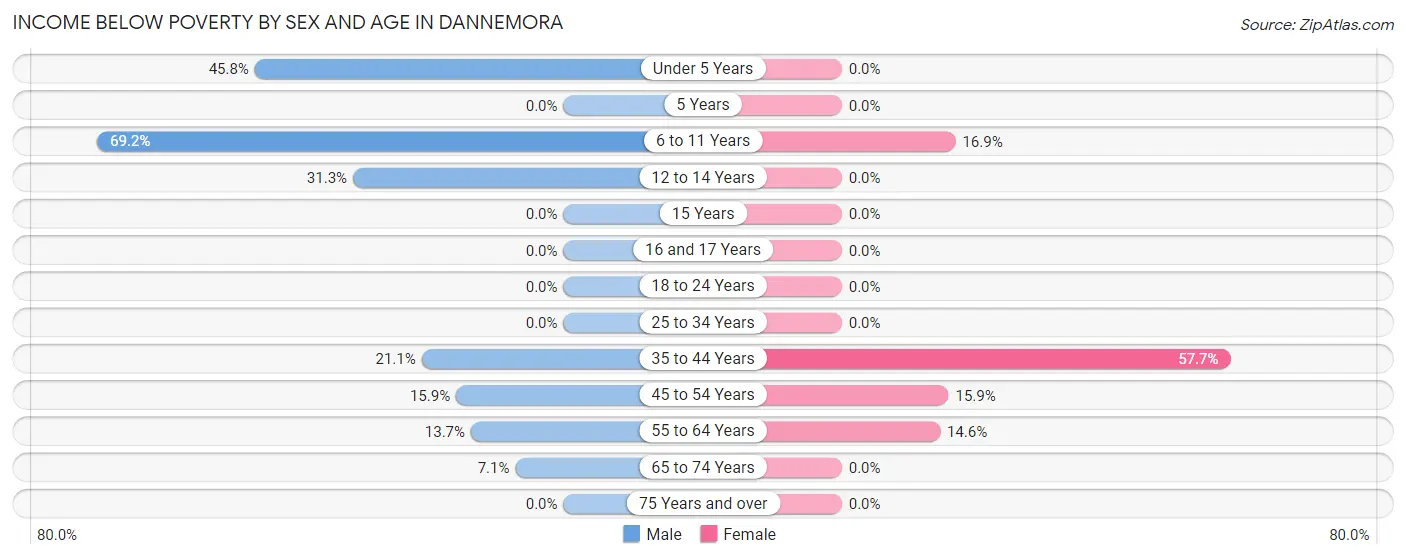
| Age Bracket | Male | Female |
| Under 5 Years | 11 (45.8%) | 0 (0.0%) |
| 5 Years | 0 (0.0%) | 0 (0.0%) |
| 6 to 11 Years | 9 (69.2%) | 13 (16.9%) |
| 12 to 14 Years | 10 (31.2%) | 0 (0.0%) |
| 15 Years | 0 (0.0%) | 0 (0.0%) |
| 16 and 17 Years | 0 (0.0%) | 0 (0.0%) |
| 18 to 24 Years | 0 (0.0%) | 0 (0.0%) |
| 25 to 34 Years | 0 (0.0%) | 0 (0.0%) |
| 35 to 44 Years | 16 (21.0%) | 30 (57.7%) |
| 45 to 54 Years | 11 (15.9%) | 13 (15.9%) |
| 55 to 64 Years | 7 (13.7%) | 7 (14.6%) |
| 65 to 74 Years | 1 (7.1%) | 0 (0.0%) |
| 75 Years and over | 0 (0.0%) | 0 (0.0%) |
| Total | 65 (15.5%) | 63 (12.9%) |
Income Above Poverty by Sex and Age in Dannemora
According to the poverty statistics in Dannemora, males aged 16 and 17 years and females aged under 5 years are the age groups that are most secure financially, with 100.0% of males and 100.0% of females in these age groups living above the poverty line.
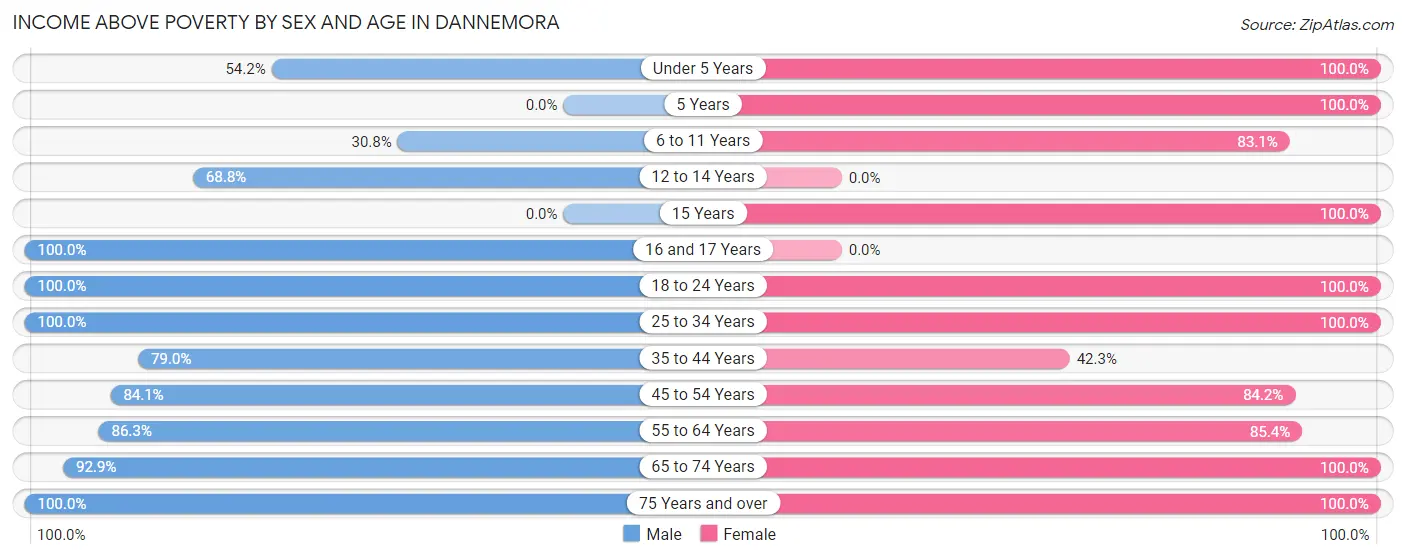
| Age Bracket | Male | Female |
| Under 5 Years | 13 (54.2%) | 40 (100.0%) |
| 5 Years | 0 (0.0%) | 11 (100.0%) |
| 6 to 11 Years | 4 (30.8%) | 64 (83.1%) |
| 12 to 14 Years | 22 (68.8%) | 0 (0.0%) |
| 15 Years | 0 (0.0%) | 7 (100.0%) |
| 16 and 17 Years | 4 (100.0%) | 0 (0.0%) |
| 18 to 24 Years | 32 (100.0%) | 17 (100.0%) |
| 25 to 34 Years | 64 (100.0%) | 75 (100.0%) |
| 35 to 44 Years | 60 (78.9%) | 22 (42.3%) |
| 45 to 54 Years | 58 (84.1%) | 69 (84.2%) |
| 55 to 64 Years | 44 (86.3%) | 41 (85.4%) |
| 65 to 74 Years | 13 (92.9%) | 65 (100.0%) |
| 75 Years and over | 39 (100.0%) | 13 (100.0%) |
| Total | 353 (84.5%) | 424 (87.1%) |
Income Below Poverty Among Married-Couple Families in Dannemora
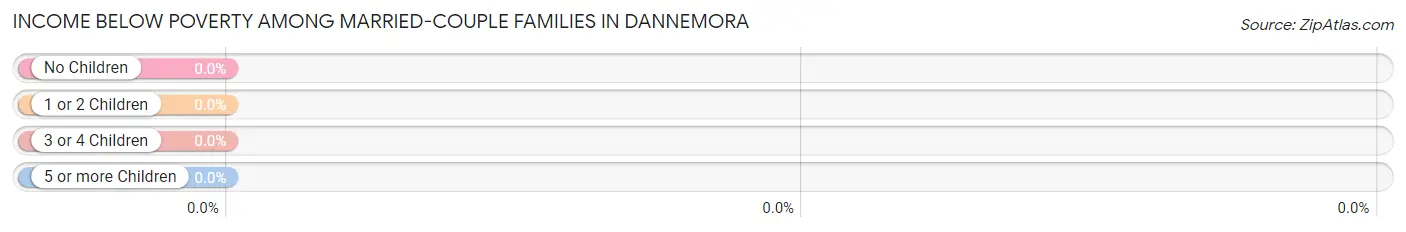
| Children | Above Poverty | Below Poverty |
| No Children | 102 (100.0%) | 0 (0.0%) |
| 1 or 2 Children | 67 (100.0%) | 0 (0.0%) |
| 3 or 4 Children | 0 (0.0%) | 0 (0.0%) |
| 5 or more Children | 0 (0.0%) | 0 (0.0%) |
| Total | 169 (100.0%) | 0 (0.0%) |
Income Below Poverty Among Single-Parent Households in Dannemora
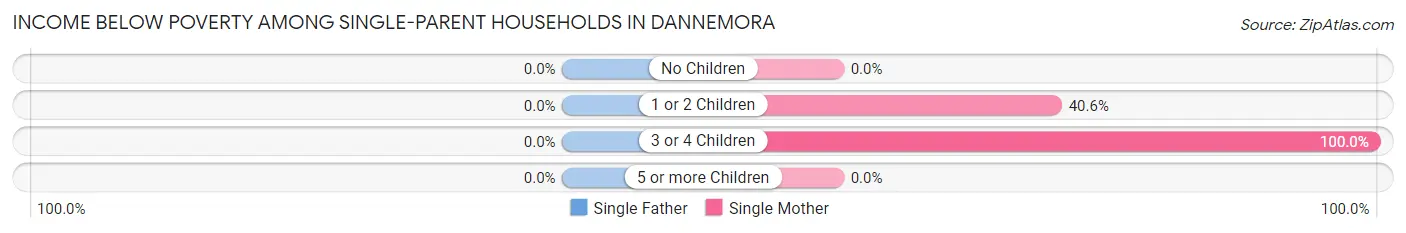
| Children | Single Father | Single Mother |
| No Children | 0 (0.0%) | 0 (0.0%) |
| 1 or 2 Children | 0 (0.0%) | 13 (40.6%) |
| 3 or 4 Children | 0 (0.0%) | 10 (100.0%) |
| 5 or more Children | 0 (0.0%) | 0 (0.0%) |
| Total | 0 (0.0%) | 23 (45.1%) |
Income Below Poverty Among Married-Couple vs Single-Parent Households in Dannemora
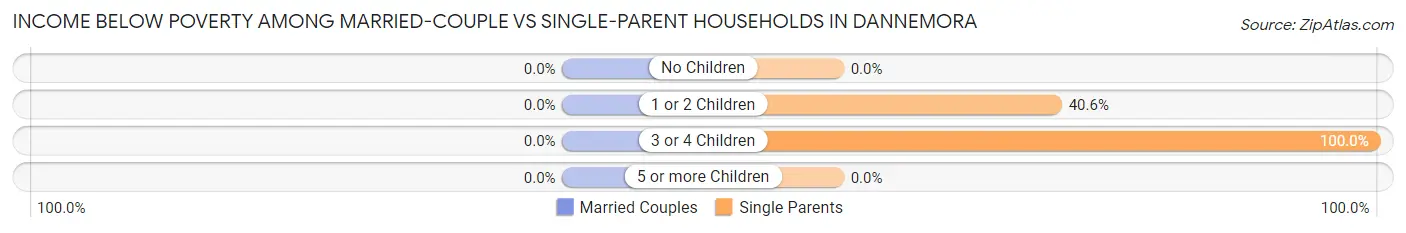
| Children | Married-Couple Families | Single-Parent Households |
| No Children | 0 (0.0%) | 0 (0.0%) |
| 1 or 2 Children | 0 (0.0%) | 13 (40.6%) |
| 3 or 4 Children | 0 (0.0%) | 10 (100.0%) |
| 5 or more Children | 0 (0.0%) | 0 (0.0%) |
| Total | 0 (0.0%) | 23 (45.1%) |
Race in Dannemora
The most populous races in Dannemora are White / Caucasian (1,580 | 46.8%), Black / African American (1,332 | 39.5%), and Hispanic or Latino (505 | 15.0%).
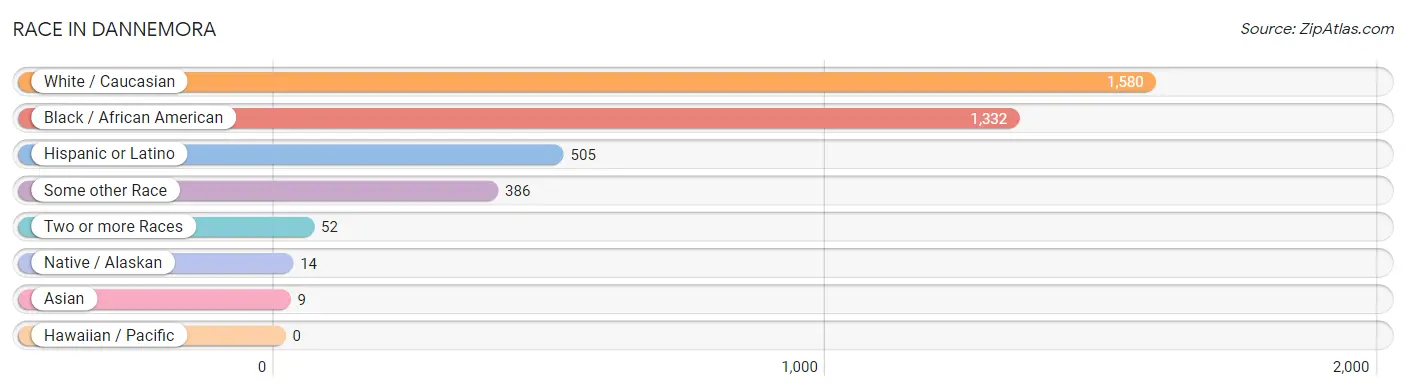
| Race | # Population | % Population |
| Asian | 9 | 0.3% |
| Black / African American | 1,332 | 39.5% |
| Hawaiian / Pacific | 0 | 0.0% |
| Hispanic or Latino | 505 | 15.0% |
| Native / Alaskan | 14 | 0.4% |
| White / Caucasian | 1,580 | 46.8% |
| Two or more Races | 52 | 1.5% |
| Some other Race | 386 | 11.4% |
| Total | 3,373 | 100.0% |
Ancestry in Dannemora
The most populous ancestries reported in Dannemora are Irish (166 | 4.9%), Puerto Rican (161 | 4.8%), English (111 | 3.3%), Central American (97 | 2.9%), and French (87 | 2.6%), together accounting for 18.4% of all Dannemora residents.
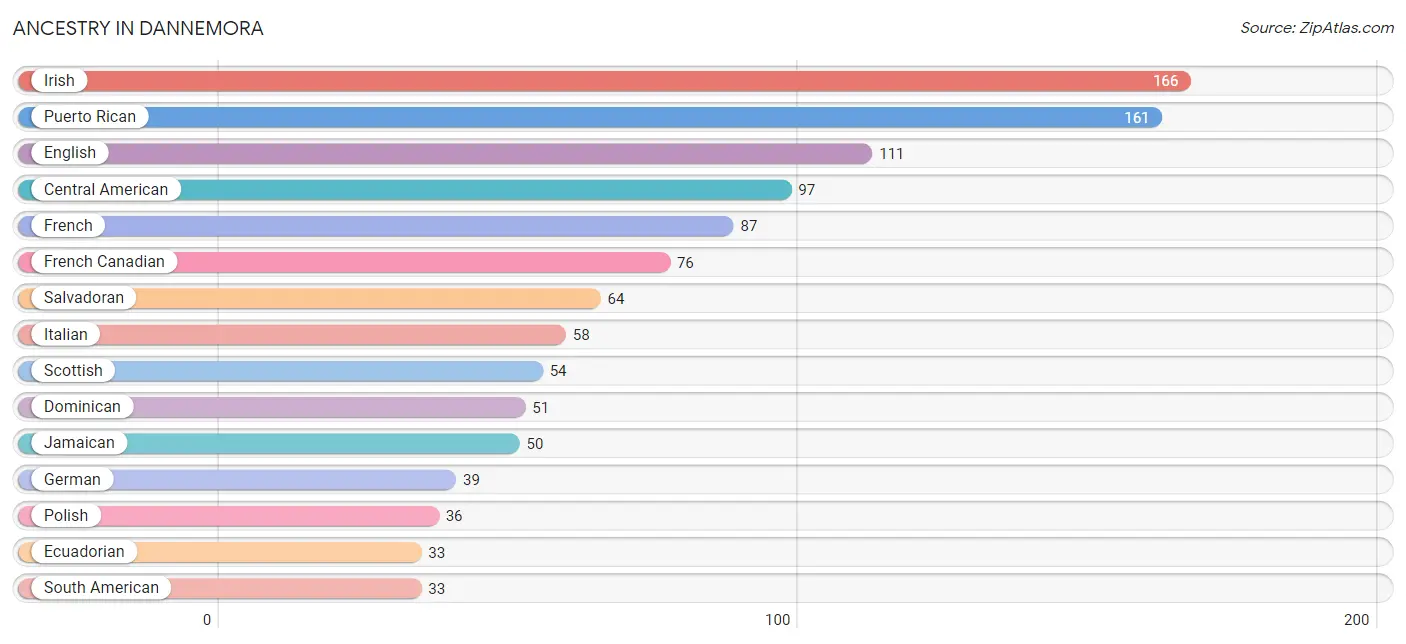
| Ancestry | # Population | % Population |
| African | 4 | 0.1% |
| American | 8 | 0.2% |
| Canadian | 20 | 0.6% |
| Central American | 97 | 2.9% |
| Czech | 9 | 0.3% |
| Dominican | 51 | 1.5% |
| Dutch | 8 | 0.2% |
| Ecuadorian | 33 | 1.0% |
| English | 111 | 3.3% |
| European | 10 | 0.3% |
| French | 87 | 2.6% |
| French Canadian | 76 | 2.2% |
| German | 39 | 1.2% |
| Guatemalan | 17 | 0.5% |
| Honduran | 16 | 0.5% |
| Indian (Asian) | 9 | 0.3% |
| Irish | 166 | 4.9% |
| Italian | 58 | 1.7% |
| Jamaican | 50 | 1.5% |
| Lithuanian | 13 | 0.4% |
| Mexican | 22 | 0.6% |
| Polish | 36 | 1.1% |
| Puerto Rican | 161 | 4.8% |
| Russian | 6 | 0.2% |
| Salvadoran | 64 | 1.9% |
| Scottish | 54 | 1.6% |
| South American | 33 | 1.0% |
| Spanish | 13 | 0.4% |
| Subsaharan African | 4 | 0.1% | View All 29 Rows |
Immigrants in Dannemora
The most numerous immigrant groups reported in Dannemora came from Latin America (445 | 13.2%), Caribbean (234 | 6.9%), Central America (122 | 3.6%), Dominican Republic (112 | 3.3%), and South America (89 | 2.6%), together accounting for 29.7% of all Dannemora residents.
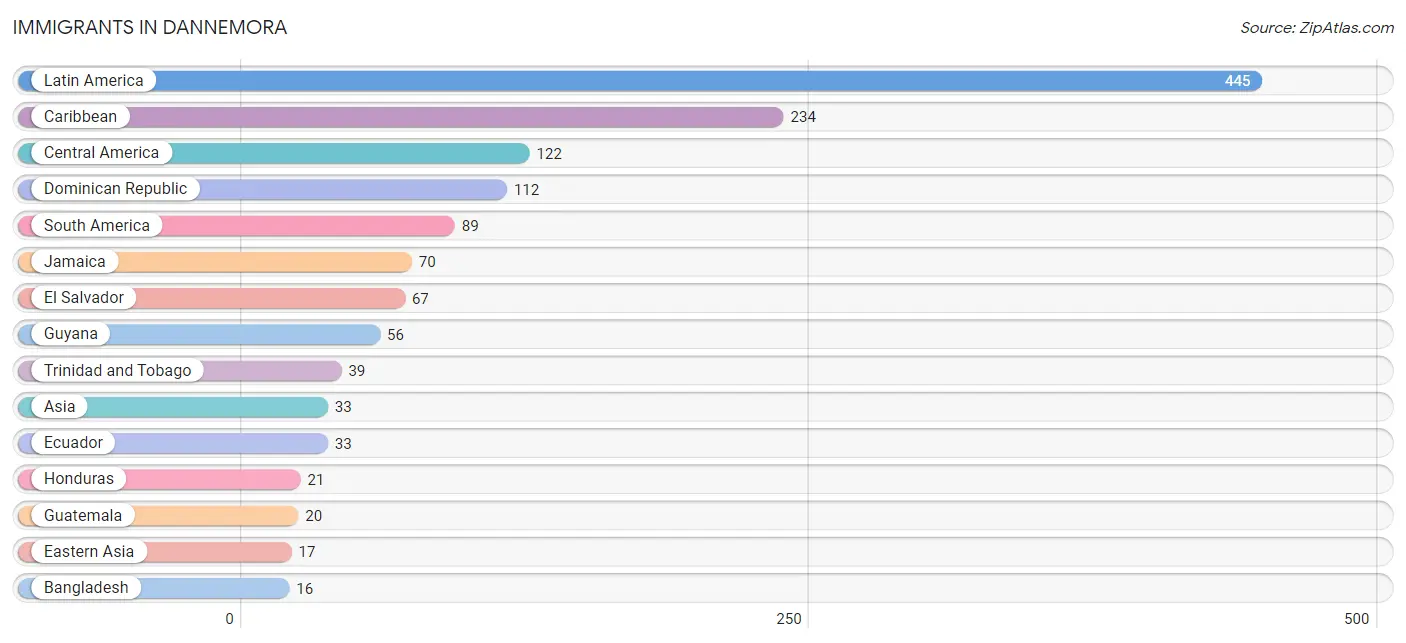
| Immigration Origin | # Population | % Population |
| Africa | 4 | 0.1% |
| Asia | 33 | 1.0% |
| Bangladesh | 16 | 0.5% |
| Caribbean | 234 | 6.9% |
| Central America | 122 | 3.6% |
| China | 1 | 0.0% |
| Dominican Republic | 112 | 3.3% |
| Eastern Asia | 17 | 0.5% |
| Ecuador | 33 | 1.0% |
| El Salvador | 67 | 2.0% |
| England | 4 | 0.1% |
| Europe | 4 | 0.1% |
| Guatemala | 20 | 0.6% |
| Guyana | 56 | 1.7% |
| Honduras | 21 | 0.6% |
| Jamaica | 70 | 2.1% |
| Japan | 16 | 0.5% |
| Latin America | 445 | 13.2% |
| Mexico | 14 | 0.4% |
| Northern Europe | 4 | 0.1% |
| South America | 89 | 2.6% |
| South Central Asia | 16 | 0.5% |
| Trinidad and Tobago | 39 | 1.2% | View All 23 Rows |
Sex and Age in Dannemora
Sex and Age in Dannemora
The most populous age groups in Dannemora are 30 to 34 Years (533 | 18.5%) for men and 70 to 74 Years (65 | 13.4%) for women.
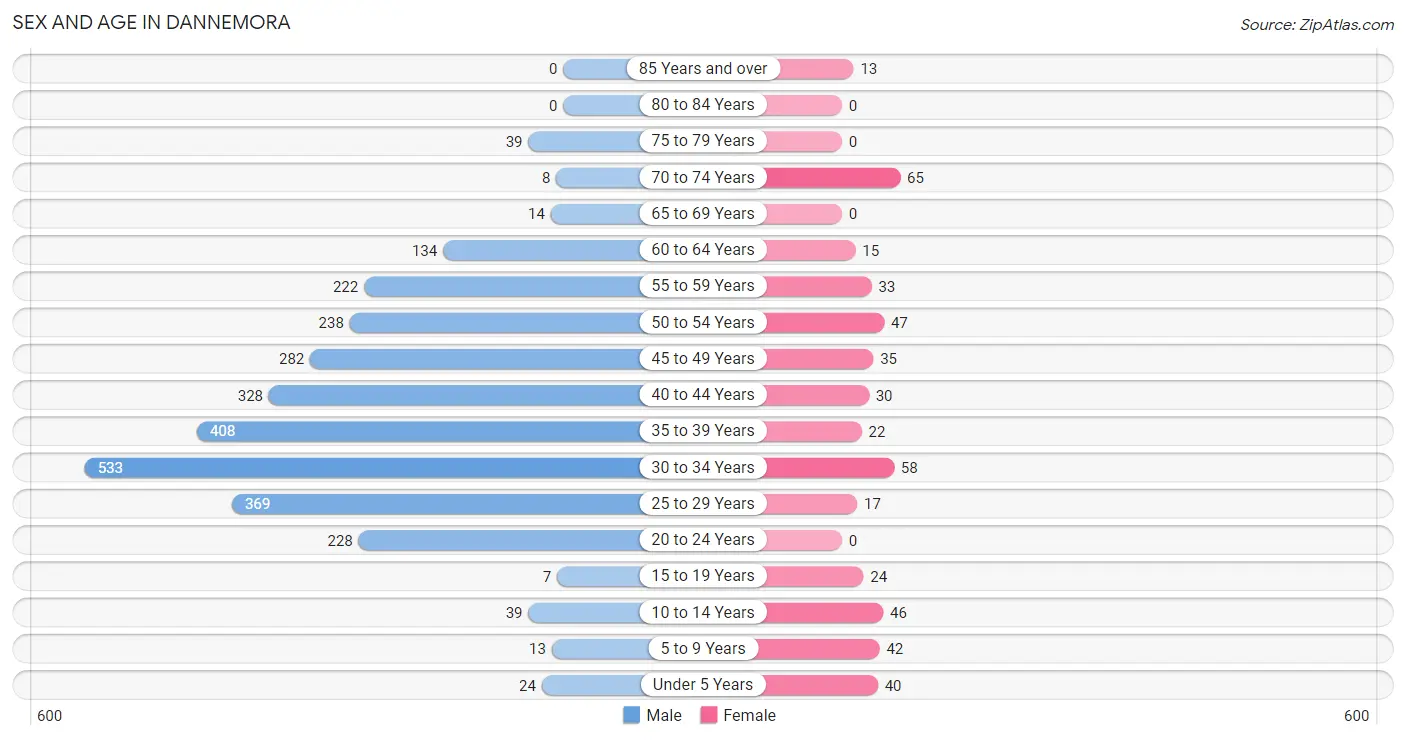
| Age Bracket | Male | Female |
| Under 5 Years | 24 (0.8%) | 40 (8.2%) |
| 5 to 9 Years | 13 (0.4%) | 42 (8.6%) |
| 10 to 14 Years | 39 (1.3%) | 46 (9.5%) |
| 15 to 19 Years | 7 (0.2%) | 24 (4.9%) |
| 20 to 24 Years | 228 (7.9%) | 0 (0.0%) |
| 25 to 29 Years | 369 (12.8%) | 17 (3.5%) |
| 30 to 34 Years | 533 (18.5%) | 58 (11.9%) |
| 35 to 39 Years | 408 (14.1%) | 22 (4.5%) |
| 40 to 44 Years | 328 (11.4%) | 30 (6.2%) |
| 45 to 49 Years | 282 (9.8%) | 35 (7.2%) |
| 50 to 54 Years | 238 (8.3%) | 47 (9.7%) |
| 55 to 59 Years | 222 (7.7%) | 33 (6.8%) |
| 60 to 64 Years | 134 (4.6%) | 15 (3.1%) |
| 65 to 69 Years | 14 (0.5%) | 0 (0.0%) |
| 70 to 74 Years | 8 (0.3%) | 65 (13.4%) |
| 75 to 79 Years | 39 (1.3%) | 0 (0.0%) |
| 80 to 84 Years | 0 (0.0%) | 0 (0.0%) |
| 85 Years and over | 0 (0.0%) | 13 (2.7%) |
| Total | 2,886 (100.0%) | 487 (100.0%) |
Families and Households in Dannemora
Median Family Size in Dannemora
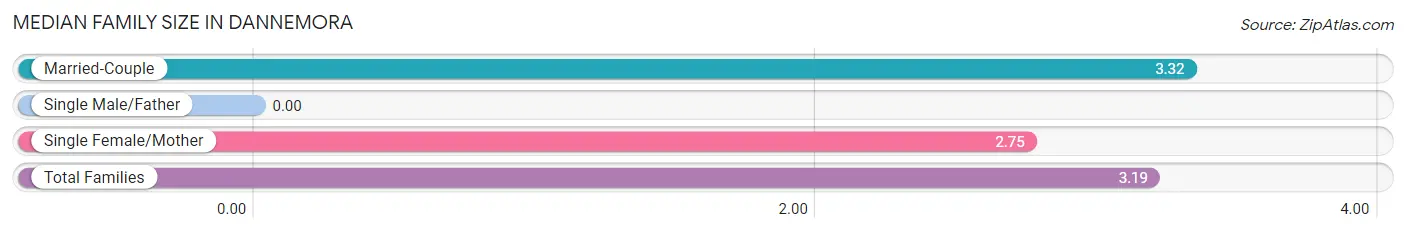
| Family Type | # Families | Family Size |
| Married-Couple | 169 (76.8%) | 3.32 |
| Single Male/Father | 0 (0.0%) | - |
| Single Female/Mother | 51 (23.2%) | 2.75 |
| Total Families | 220 (100.0%) | 3.19 |
Median Household Size in Dannemora
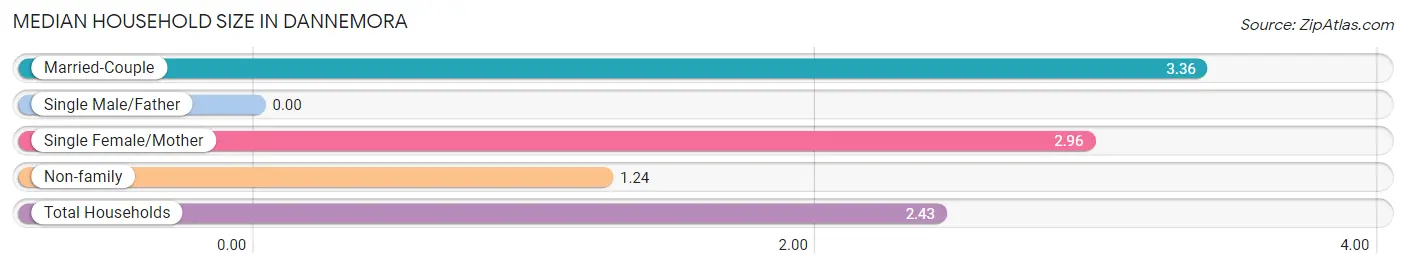
| Household Type | # Households | Household Size |
| Married-Couple | 169 (45.2%) | 3.36 |
| Single Male/Father | 0 (0.0%) | - |
| Single Female/Mother | 51 (13.6%) | 2.96 |
| Non-family | 154 (41.2%) | 1.24 |
| Total Households | 374 (100.0%) | 2.43 |
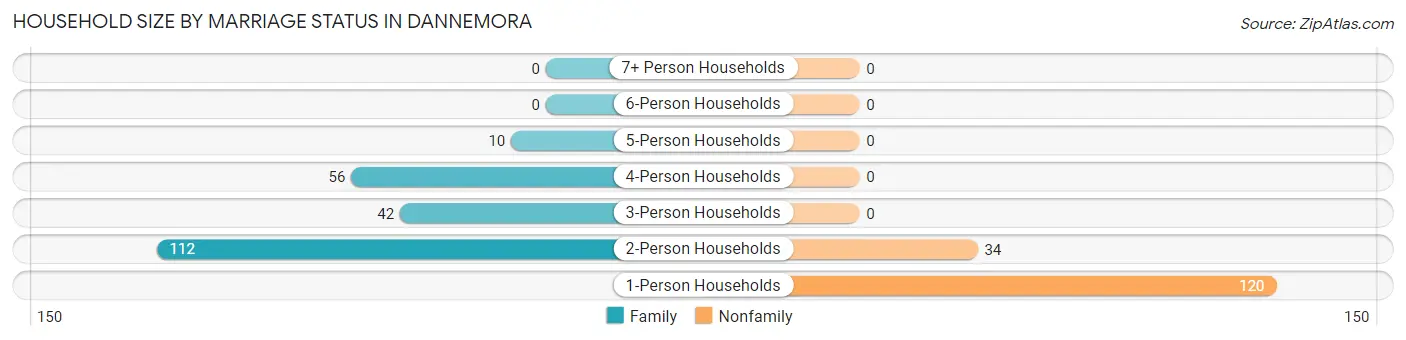
Household Size by Marriage Status in Dannemora
Out of a total of 374 households in Dannemora, 220 (58.8%) are family households, while 154 (41.2%) are nonfamily households. The most numerous type of family households are 2-person households, comprising 112, and the most common type of nonfamily households are 1-person households, comprising 120.
| Household Size | Family Households | Nonfamily Households |
| 1-Person Households | - | 120 (32.1%) |
| 2-Person Households | 112 (29.9%) | 34 (9.1%) |
| 3-Person Households | 42 (11.2%) | 0 (0.0%) |
| 4-Person Households | 56 (15.0%) | 0 (0.0%) |
| 5-Person Households | 10 (2.7%) | 0 (0.0%) |
| 6-Person Households | 0 (0.0%) | 0 (0.0%) |
| 7+ Person Households | 0 (0.0%) | 0 (0.0%) |
| Total | 220 (58.8%) | 154 (41.2%) |
Female Fertility in Dannemora
Fertility by Age in Dannemora
| Age Bracket | Women with Births | Births / 1,000 Women |
| 15 to 19 years | 0 (0.0%) | 0.0 |
| 20 to 34 years | 0 (0.0%) | 0.0 |
| 35 to 50 years | 0 (0.0%) | 0.0 |
| Total | 0 (0.0%) | 0.0 |
Fertility by Age by Marriage Status in Dannemora
| Age Bracket | Married | Unmarried |
| 15 to 19 years | 0 (0.0%) | 0 (0.0%) |
| 20 to 34 years | 0 (0.0%) | 0 (0.0%) |
| 35 to 50 years | 0 (0.0%) | 0 (0.0%) |
| Total | 0 (0.0%) | 0 (0.0%) |
Fertility by Education in Dannemora
| Educational Attainment | Women with Births | Births / 1,000 Women |
| Less than High School | 0 (0.0%) | 0.0 |
| High School Diploma | 0 (0.0%) | 0.0 |
| College or Associate's Degree | 0 (0.0%) | 0.0 |
| Bachelor's Degree | 0 (0.0%) | 0.0 |
| Graduate Degree | 0 (0.0%) | 0.0 |
| Total | 0 (0.0%) | 0.0 |
Fertility by Education by Marriage Status in Dannemora
| Educational Attainment | Married | Unmarried |
| Less than High School | 0 (0.0%) | 0 (0.0%) |
| High School Diploma | 0 (0.0%) | 0 (0.0%) |
| College or Associate's Degree | 0 (0.0%) | 0 (0.0%) |
| Bachelor's Degree | 0 (0.0%) | 0 (0.0%) |
| Graduate Degree | 0 (0.0%) | 0 (0.0%) |
| Total | 0 (0.0%) | 0 (0.0%) |
Employment Characteristics in Dannemora
Employment by Class of Employer in Dannemora
Among the 416 employed individuals in Dannemora, private company employees (202 | 48.6%), state government employees (89 | 21.4%), and not-for-profit organizations (51 | 12.3%) make up the most common classes of employment.
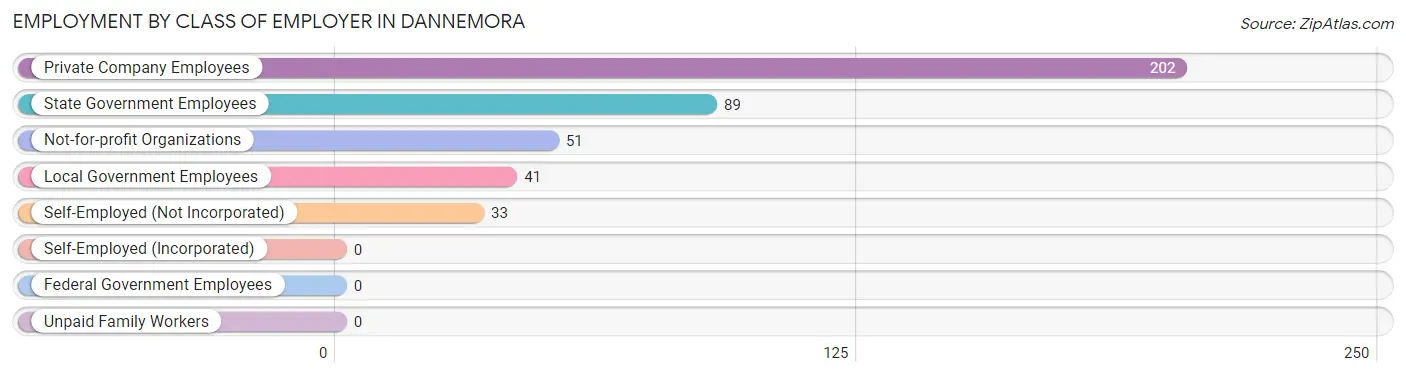
| Employer Class | # Employees | % Employees |
| Private Company Employees | 202 | 48.6% |
| Self-Employed (Incorporated) | 0 | 0.0% |
| Self-Employed (Not Incorporated) | 33 | 7.9% |
| Not-for-profit Organizations | 51 | 12.3% |
| Local Government Employees | 41 | 9.9% |
| State Government Employees | 89 | 21.4% |
| Federal Government Employees | 0 | 0.0% |
| Unpaid Family Workers | 0 | 0.0% |
| Total | 416 | 100.0% |
Employment Status by Age in Dannemora
According to the labor force statistics for Dannemora, out of the total population over 16 years of age (3,162), 13.8% or 436 individuals are in the labor force, with 4.6% or 20 of them unemployed. The age group with the highest labor force participation rate is 45 to 54 years, with 19.4% or 117 individuals in the labor force. Within the labor force, the 30 to 34 years age range has the highest percentage of unemployed individuals, with 20.4% or 19 of them being unemployed.
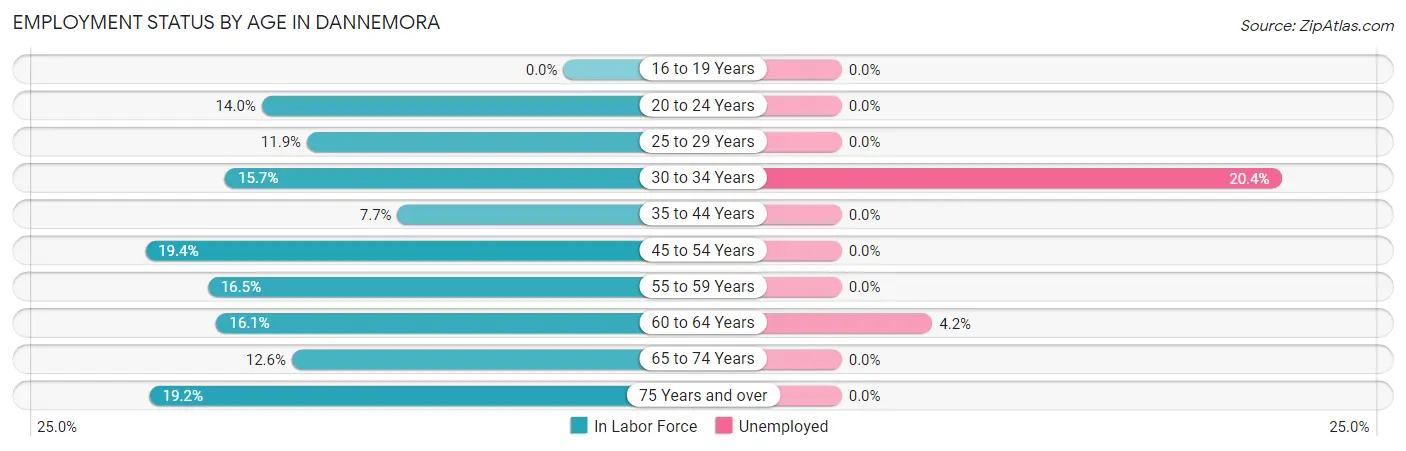
| Age Bracket | In Labor Force | Unemployed |
| 16 to 19 Years | 0 (0.0%) | 0 (0.0%) |
| 20 to 24 Years | 32 (14.0%) | 0 (0.0%) |
| 25 to 29 Years | 46 (11.9%) | 0 (0.0%) |
| 30 to 34 Years | 93 (15.7%) | 19 (20.4%) |
| 35 to 44 Years | 61 (7.7%) | 0 (0.0%) |
| 45 to 54 Years | 117 (19.4%) | 0 (0.0%) |
| 55 to 59 Years | 42 (16.5%) | 0 (0.0%) |
| 60 to 64 Years | 24 (16.1%) | 1 (4.2%) |
| 65 to 74 Years | 11 (12.6%) | 0 (0.0%) |
| 75 Years and over | 10 (19.2%) | 0 (0.0%) |
| Total | 436 (13.8%) | 20 (4.6%) |
Employment Status by Educational Attainment in Dannemora
According to labor force statistics for Dannemora, 13.8% of individuals (382) out of the total population between 25 and 64 years of age (2,771) are in the labor force, with 5.2% or 20 of them being unemployed. The group with the highest labor force participation rate are those with the educational attainment of bachelor's degree or higher, with 78.6% or 121 individuals in the labor force. Within the labor force, individuals with less than high school education have the highest percentage of unemployment, with 28.6% or 20 of them being unemployed.
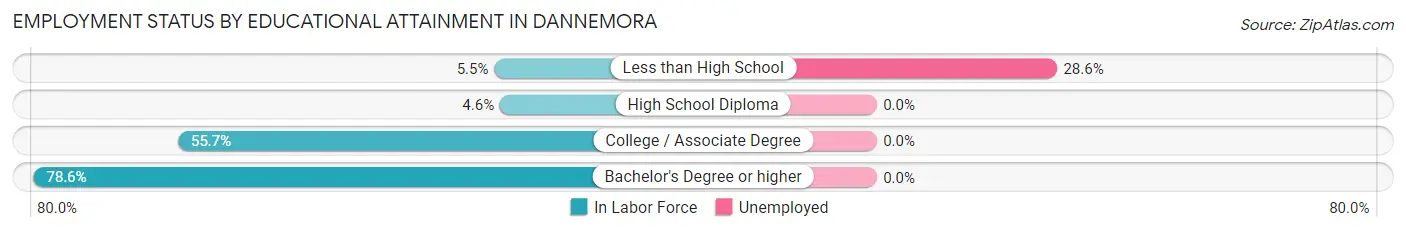
| Educational Attainment | In Labor Force | Unemployed |
| Less than High School | 70 (5.5%) | 363 (28.6%) |
| High School Diploma | 50 (4.6%) | 0 (0.0%) |
| College / Associate Degree | 142 (55.7%) | 0 (0.0%) |
| Bachelor's Degree or higher | 121 (78.6%) | 0 (0.0%) |
| Total | 382 (13.8%) | 144 (5.2%) |
Employment Occupations by Sex in Dannemora
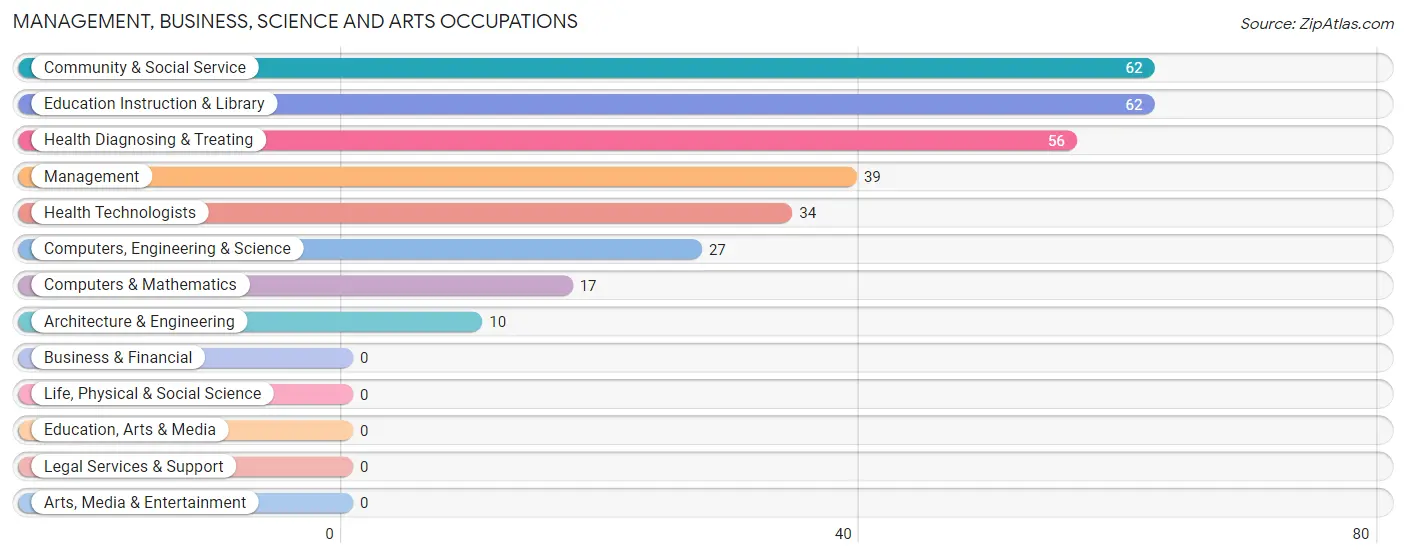
Management, Business, Science and Arts Occupations
The most common Management, Business, Science and Arts occupations in Dannemora are Community & Social Service (62 | 14.9%), Education Instruction & Library (62 | 14.9%), Health Diagnosing & Treating (56 | 13.5%), Management (39 | 9.4%), and Health Technologists (34 | 8.2%).
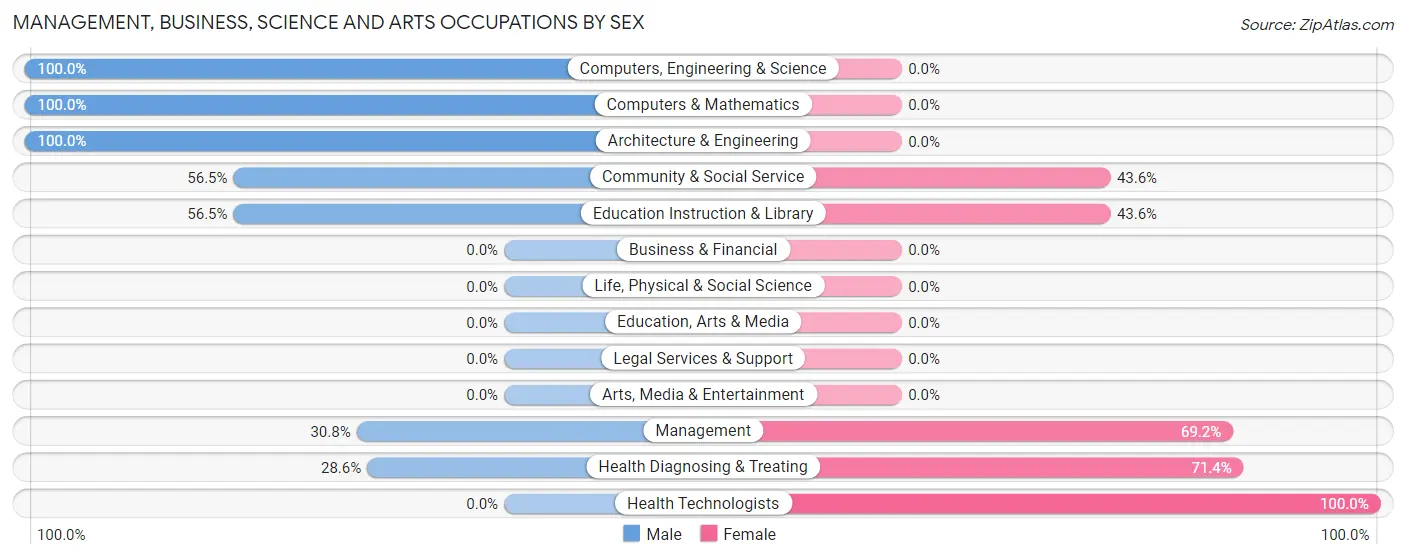
Management, Business, Science and Arts Occupations by Sex
Within the Management, Business, Science and Arts occupations in Dannemora, the most male-oriented occupations are Computers, Engineering & Science (100.0%), Computers & Mathematics (100.0%), and Architecture & Engineering (100.0%), while the most female-oriented occupations are Health Technologists (100.0%), Health Diagnosing & Treating (71.4%), and Management (69.2%).
| Occupation | Male | Female |
| Management | 12 (30.8%) | 27 (69.2%) |
| Business & Financial | 0 (0.0%) | 0 (0.0%) |
| Computers, Engineering & Science | 27 (100.0%) | 0 (0.0%) |
| Computers & Mathematics | 17 (100.0%) | 0 (0.0%) |
| Architecture & Engineering | 10 (100.0%) | 0 (0.0%) |
| Life, Physical & Social Science | 0 (0.0%) | 0 (0.0%) |
| Community & Social Service | 35 (56.5%) | 27 (43.5%) |
| Education, Arts & Media | 0 (0.0%) | 0 (0.0%) |
| Legal Services & Support | 0 (0.0%) | 0 (0.0%) |
| Education Instruction & Library | 35 (56.5%) | 27 (43.5%) |
| Arts, Media & Entertainment | 0 (0.0%) | 0 (0.0%) |
| Health Diagnosing & Treating | 16 (28.6%) | 40 (71.4%) |
| Health Technologists | 0 (0.0%) | 34 (100.0%) |
| Total (Category) | 90 (48.9%) | 94 (51.1%) |
| Total (Overall) | 208 (50.0%) | 208 (50.0%) |
Services Occupations
The most common Services occupations in Dannemora are Security & Protection (28 | 6.7%), Law Enforcement (28 | 6.7%), Personal Care & Service (27 | 6.5%), Healthcare Support (17 | 4.1%), and Cleaning & Maintenance (6 | 1.4%).

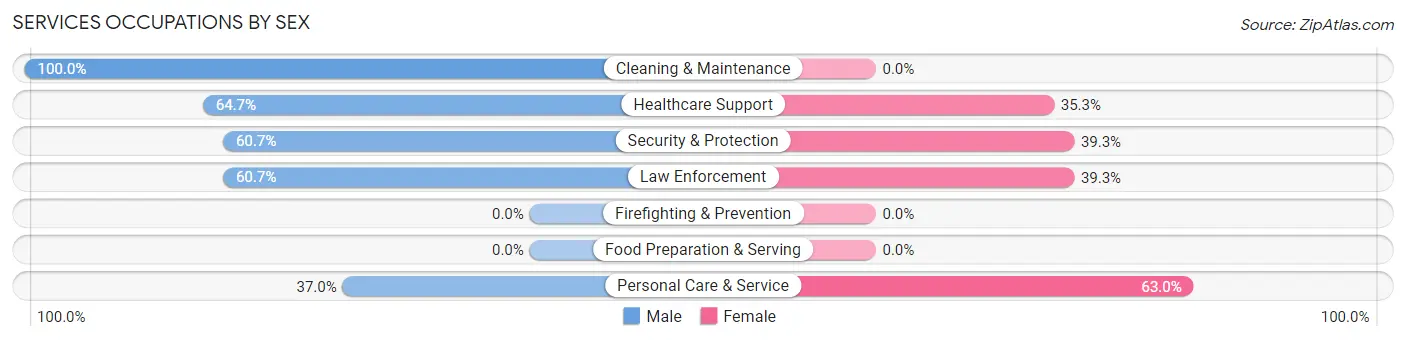
Services Occupations by Sex
Within the Services occupations in Dannemora, the most male-oriented occupations are Cleaning & Maintenance (100.0%), Healthcare Support (64.7%), and Security & Protection (60.7%), while the most female-oriented occupations are Personal Care & Service (63.0%), Security & Protection (39.3%), and Law Enforcement (39.3%).
| Occupation | Male | Female |
| Healthcare Support | 11 (64.7%) | 6 (35.3%) |
| Security & Protection | 17 (60.7%) | 11 (39.3%) |
| Firefighting & Prevention | 0 (0.0%) | 0 (0.0%) |
| Law Enforcement | 17 (60.7%) | 11 (39.3%) |
| Food Preparation & Serving | 0 (0.0%) | 0 (0.0%) |
| Cleaning & Maintenance | 6 (100.0%) | 0 (0.0%) |
| Personal Care & Service | 10 (37.0%) | 17 (63.0%) |
| Total (Category) | 44 (56.4%) | 34 (43.6%) |
| Total (Overall) | 208 (50.0%) | 208 (50.0%) |
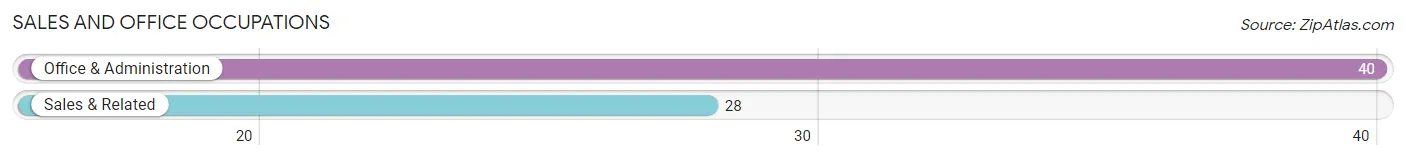
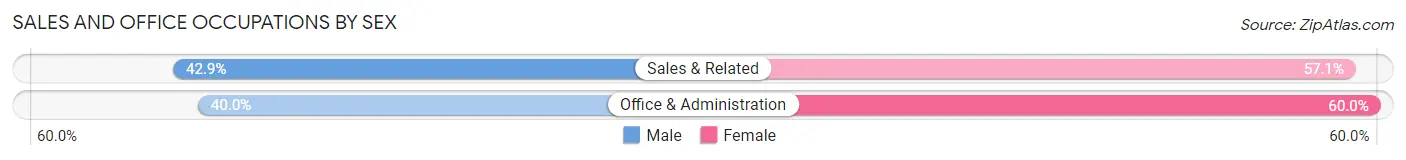
Sales and Office Occupations
The most common Sales and Office occupations in Dannemora are Office & Administration (40 | 9.6%), and Sales & Related (28 | 6.7%).
Sales and Office Occupations by Sex
| Occupation | Male | Female |
| Sales & Related | 12 (42.9%) | 16 (57.1%) |
| Office & Administration | 16 (40.0%) | 24 (60.0%) |
| Total (Category) | 28 (41.2%) | 40 (58.8%) |
| Total (Overall) | 208 (50.0%) | 208 (50.0%) |
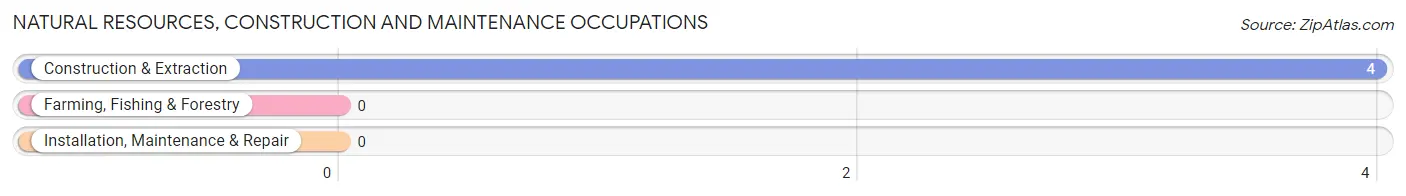
Natural Resources, Construction and Maintenance Occupations
The most common Natural Resources, Construction and Maintenance occupations in Dannemora are , and Construction & Extraction (4 | 1.0%).
Natural Resources, Construction and Maintenance Occupations by Sex
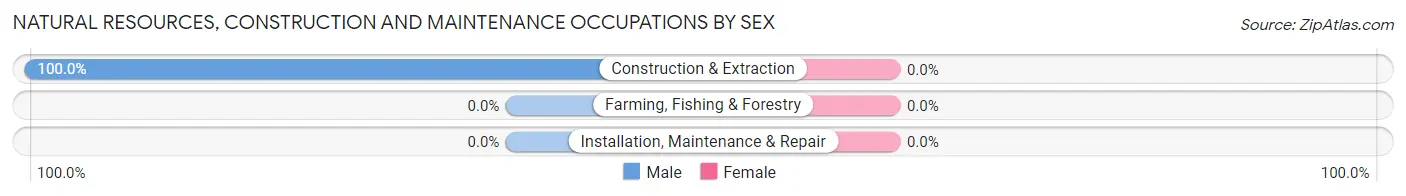
| Occupation | Male | Female |
| Farming, Fishing & Forestry | 0 (0.0%) | 0 (0.0%) |
| Construction & Extraction | 4 (100.0%) | 0 (0.0%) |
| Installation, Maintenance & Repair | 0 (0.0%) | 0 (0.0%) |
| Total (Category) | 4 (100.0%) | 0 (0.0%) |
| Total (Overall) | 208 (50.0%) | 208 (50.0%) |
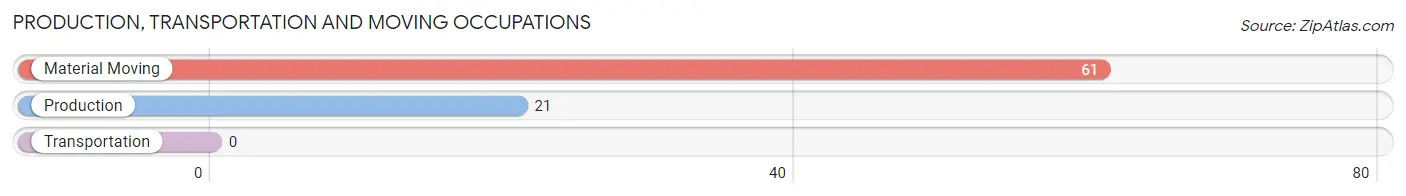
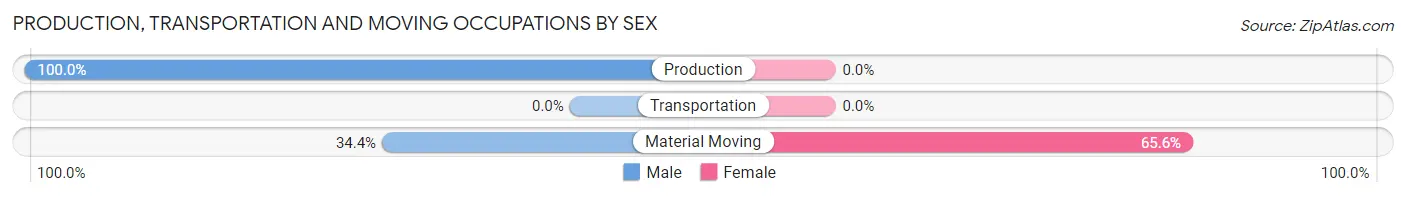
Production, Transportation and Moving Occupations
The most common Production, Transportation and Moving occupations in Dannemora are Material Moving (61 | 14.7%), and Production (21 | 5.1%).
Production, Transportation and Moving Occupations by Sex
| Occupation | Male | Female |
| Production | 21 (100.0%) | 0 (0.0%) |
| Transportation | 0 (0.0%) | 0 (0.0%) |
| Material Moving | 21 (34.4%) | 40 (65.6%) |
| Total (Category) | 42 (51.2%) | 40 (48.8%) |
| Total (Overall) | 208 (50.0%) | 208 (50.0%) |
Employment Industries by Sex in Dannemora
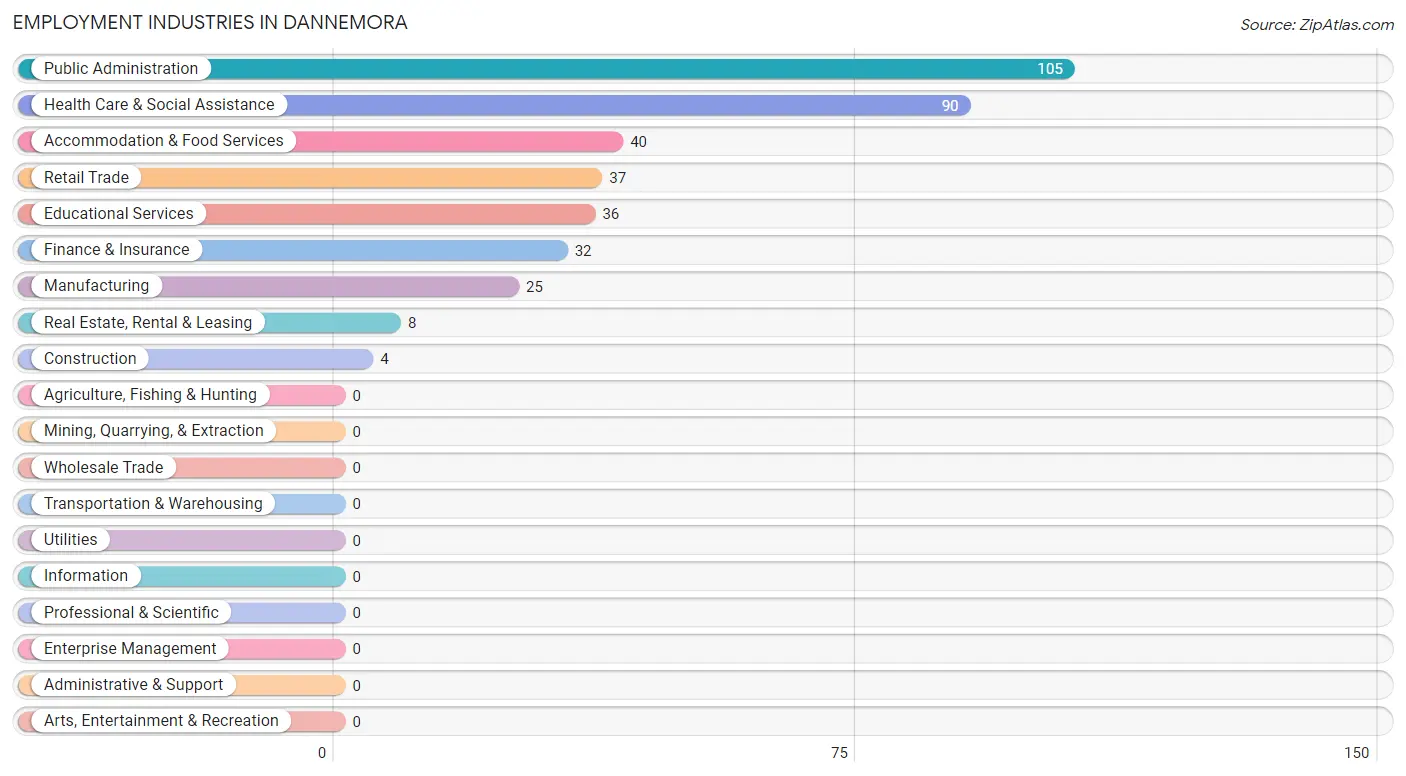
Employment Industries in Dannemora
The major employment industries in Dannemora include Public Administration (105 | 25.2%), Health Care & Social Assistance (90 | 21.6%), Accommodation & Food Services (40 | 9.6%), Retail Trade (37 | 8.9%), and Educational Services (36 | 8.6%).
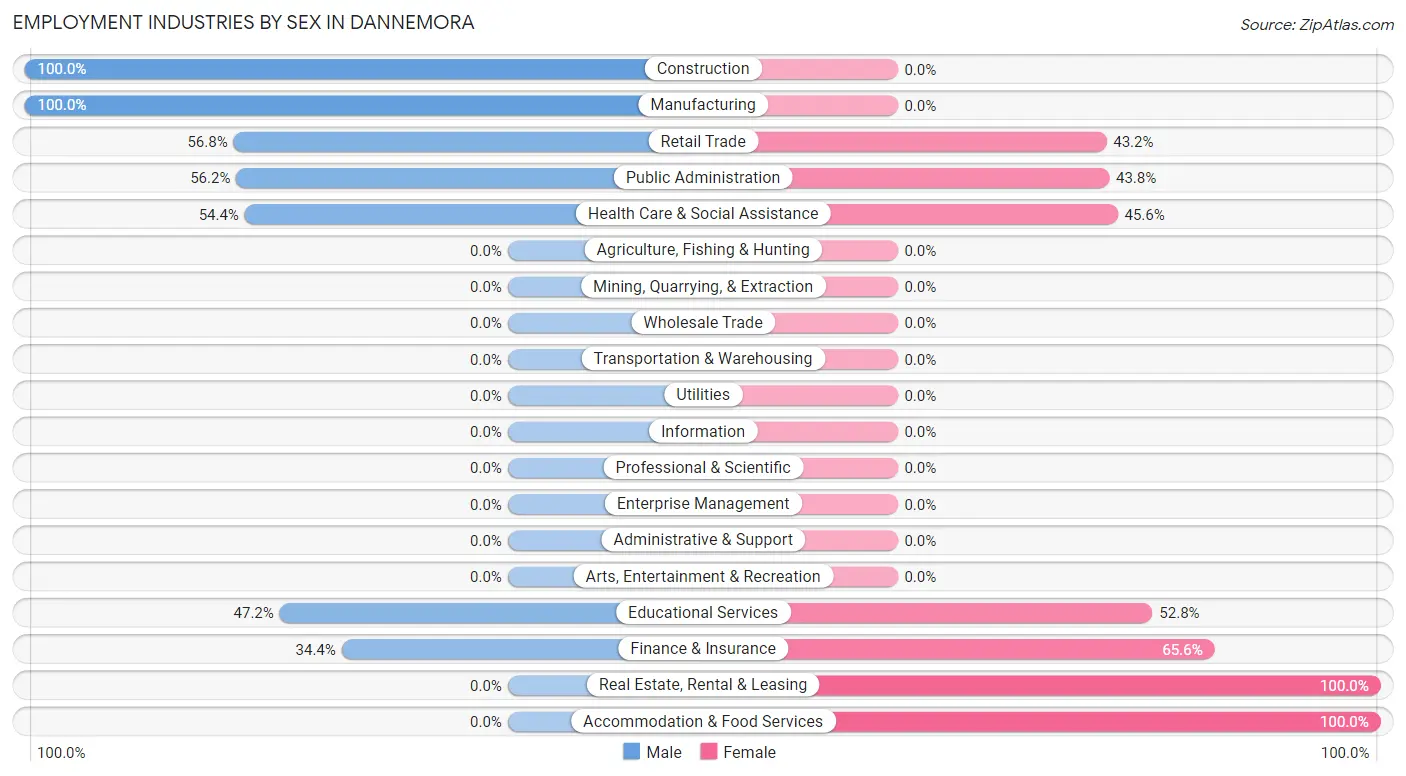
Employment Industries by Sex in Dannemora
The Dannemora industries that see more men than women are Construction (100.0%), Manufacturing (100.0%), and Retail Trade (56.8%), whereas the industries that tend to have a higher number of women are Real Estate, Rental & Leasing (100.0%), Accommodation & Food Services (100.0%), and Finance & Insurance (65.6%).
| Industry | Male | Female |
| Agriculture, Fishing & Hunting | 0 (0.0%) | 0 (0.0%) |
| Mining, Quarrying, & Extraction | 0 (0.0%) | 0 (0.0%) |
| Construction | 4 (100.0%) | 0 (0.0%) |
| Manufacturing | 25 (100.0%) | 0 (0.0%) |
| Wholesale Trade | 0 (0.0%) | 0 (0.0%) |
| Retail Trade | 21 (56.8%) | 16 (43.2%) |
| Transportation & Warehousing | 0 (0.0%) | 0 (0.0%) |
| Utilities | 0 (0.0%) | 0 (0.0%) |
| Information | 0 (0.0%) | 0 (0.0%) |
| Finance & Insurance | 11 (34.4%) | 21 (65.6%) |
| Real Estate, Rental & Leasing | 0 (0.0%) | 8 (100.0%) |
| Professional & Scientific | 0 (0.0%) | 0 (0.0%) |
| Enterprise Management | 0 (0.0%) | 0 (0.0%) |
| Administrative & Support | 0 (0.0%) | 0 (0.0%) |
| Educational Services | 17 (47.2%) | 19 (52.8%) |
| Health Care & Social Assistance | 49 (54.4%) | 41 (45.6%) |
| Arts, Entertainment & Recreation | 0 (0.0%) | 0 (0.0%) |
| Accommodation & Food Services | 0 (0.0%) | 40 (100.0%) |
| Public Administration | 59 (56.2%) | 46 (43.8%) |
| Total | 208 (50.0%) | 208 (50.0%) |
Education in Dannemora
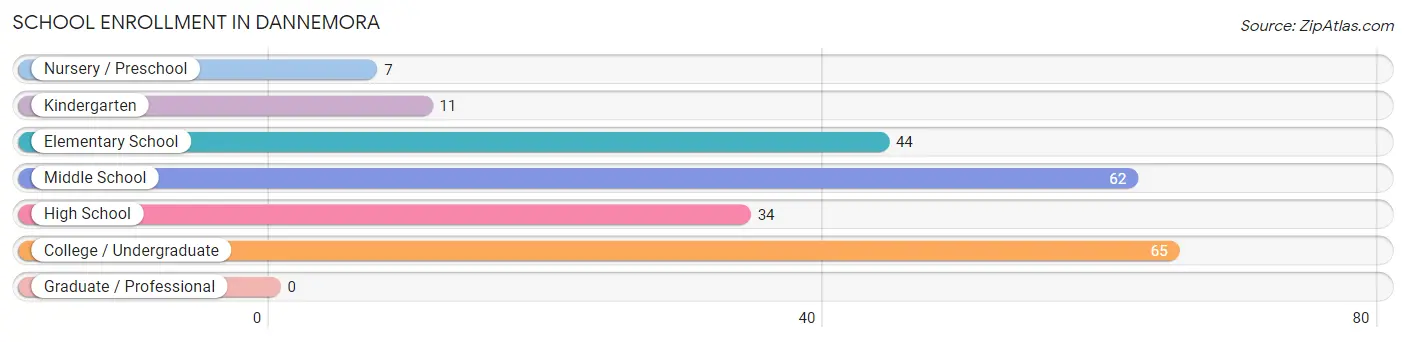
School Enrollment in Dannemora
The most common levels of schooling among the 223 students in Dannemora are college / undergraduate (65 | 29.1%), middle school (62 | 27.8%), and elementary school (44 | 19.7%).
| School Level | # Students | % Students |
| Nursery / Preschool | 7 | 3.1% |
| Kindergarten | 11 | 4.9% |
| Elementary School | 44 | 19.7% |
| Middle School | 62 | 27.8% |
| High School | 34 | 15.2% |
| College / Undergraduate | 65 | 29.1% |
| Graduate / Professional | 0 | 0.0% |
| Total | 223 | 100.0% |
School Enrollment by Age by Funding Source in Dannemora
Out of a total of 223 students who are enrolled in schools in Dannemora, 16 (7.2%) attend a private institution, while the remaining 207 (92.8%) are enrolled in public schools. The age group of 3 to 4 year olds has the highest likelihood of being enrolled in private schools, with 7 (100.0% in the age bracket) enrolled. Conversely, the age group of 5 to 9 year old has the lowest likelihood of being enrolled in a private school, with 55 (100.0% in the age bracket) attending a public institution.
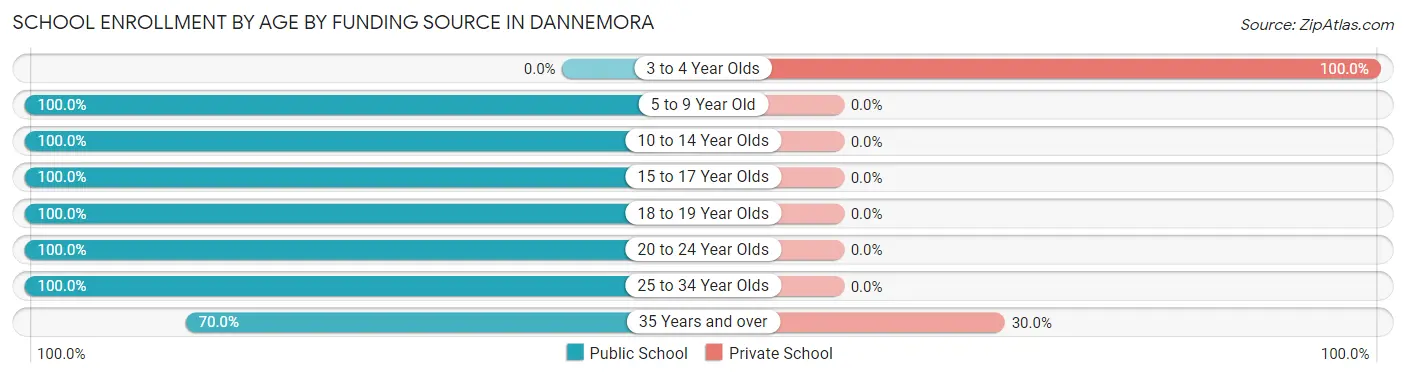
| Age Bracket | Public School | Private School |
| 3 to 4 Year Olds | 0 (0.0%) | 7 (100.0%) |
| 5 to 9 Year Old | 55 (100.0%) | 0 (0.0%) |
| 10 to 14 Year Olds | 85 (100.0%) | 0 (0.0%) |
| 15 to 17 Year Olds | 11 (100.0%) | 0 (0.0%) |
| 18 to 19 Year Olds | 17 (100.0%) | 0 (0.0%) |
| 20 to 24 Year Olds | 2 (100.0%) | 0 (0.0%) |
| 25 to 34 Year Olds | 16 (100.0%) | 0 (0.0%) |
| 35 Years and over | 21 (70.0%) | 9 (30.0%) |
| Total | 207 (92.8%) | 16 (7.2%) |
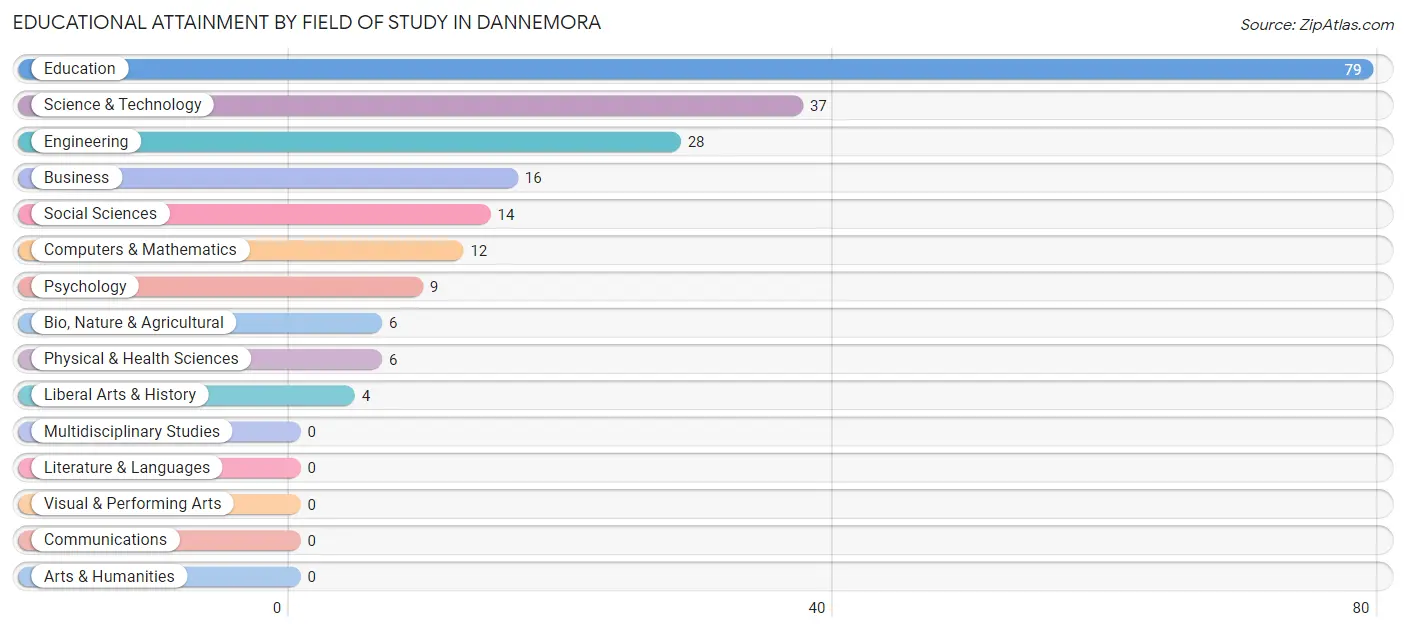
Educational Attainment by Field of Study in Dannemora
Education (79 | 37.4%), science & technology (37 | 17.5%), engineering (28 | 13.3%), business (16 | 7.6%), and social sciences (14 | 6.6%) are the most common fields of study among 211 individuals in Dannemora who have obtained a bachelor's degree or higher.
| Field of Study | # Graduates | % Graduates |
| Computers & Mathematics | 12 | 5.7% |
| Bio, Nature & Agricultural | 6 | 2.8% |
| Physical & Health Sciences | 6 | 2.8% |
| Psychology | 9 | 4.3% |
| Social Sciences | 14 | 6.6% |
| Engineering | 28 | 13.3% |
| Multidisciplinary Studies | 0 | 0.0% |
| Science & Technology | 37 | 17.5% |
| Business | 16 | 7.6% |
| Education | 79 | 37.4% |
| Literature & Languages | 0 | 0.0% |
| Liberal Arts & History | 4 | 1.9% |
| Visual & Performing Arts | 0 | 0.0% |
| Communications | 0 | 0.0% |
| Arts & Humanities | 0 | 0.0% |
| Total | 211 | 100.0% |
Transportation & Commute in Dannemora
Vehicle Availability by Sex in Dannemora
The most prevalent vehicle ownership categories in Dannemora are males with 2 vehicles (109, accounting for 52.4%) and females with 2 vehicles (144, making up 52.4%).
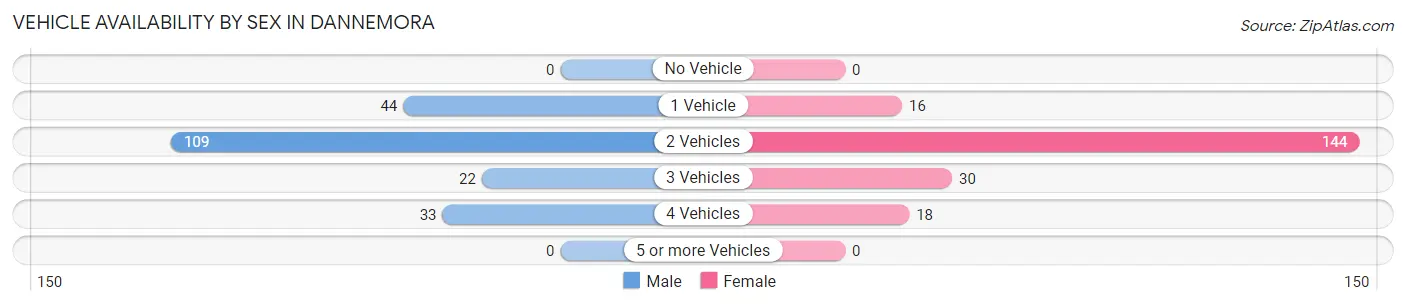
| Vehicles Available | Male | Female |
| No Vehicle | 0 (0.0%) | 0 (0.0%) |
| 1 Vehicle | 44 (21.1%) | 16 (7.7%) |
| 2 Vehicles | 109 (52.4%) | 144 (69.2%) |
| 3 Vehicles | 22 (10.6%) | 30 (14.4%) |
| 4 Vehicles | 33 (15.9%) | 18 (8.6%) |
| 5 or more Vehicles | 0 (0.0%) | 0 (0.0%) |
| Total | 208 (100.0%) | 208 (100.0%) |
Commute Time in Dannemora
The most frequently occuring commute durations in Dannemora are less than 5 minutes (78 commuters, 20.3%), 15 to 19 minutes (78 commuters, 20.3%), and 20 to 24 minutes (61 commuters, 15.8%).
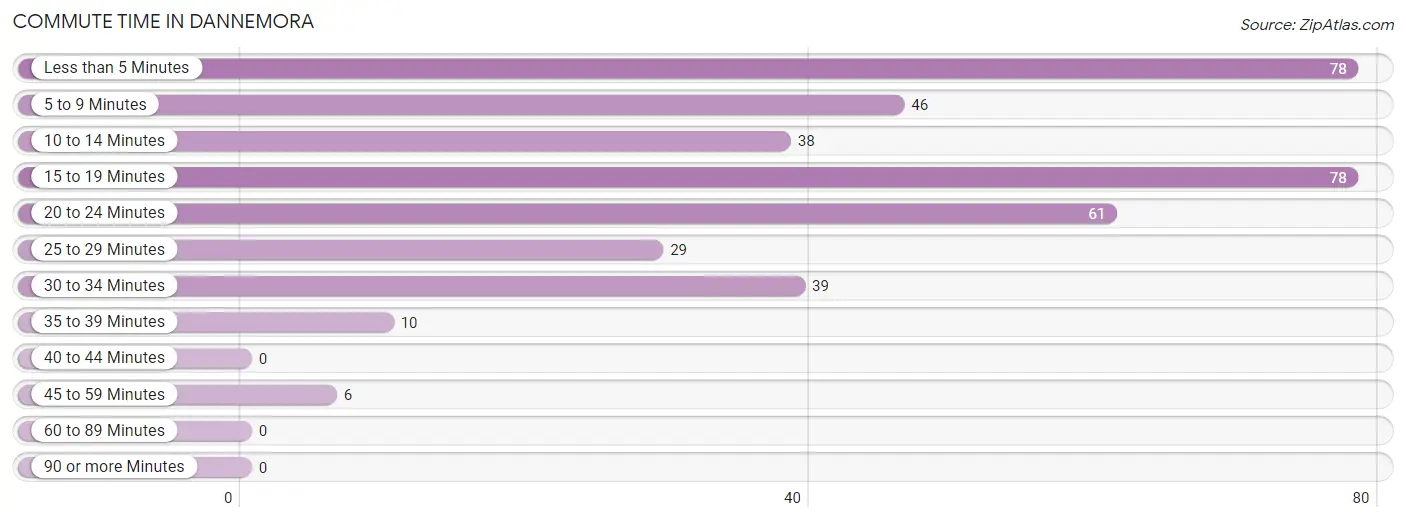
| Commute Time | # Commuters | % Commuters |
| Less than 5 Minutes | 78 | 20.3% |
| 5 to 9 Minutes | 46 | 11.9% |
| 10 to 14 Minutes | 38 | 9.9% |
| 15 to 19 Minutes | 78 | 20.3% |
| 20 to 24 Minutes | 61 | 15.8% |
| 25 to 29 Minutes | 29 | 7.5% |
| 30 to 34 Minutes | 39 | 10.1% |
| 35 to 39 Minutes | 10 | 2.6% |
| 40 to 44 Minutes | 0 | 0.0% |
| 45 to 59 Minutes | 6 | 1.6% |
| 60 to 89 Minutes | 0 | 0.0% |
| 90 or more Minutes | 0 | 0.0% |
Commute Time by Sex in Dannemora
The most common commute times in Dannemora are 10 to 14 minutes (38 commuters, 19.9%) for males and 15 to 19 minutes (51 commuters, 26.3%) for females.
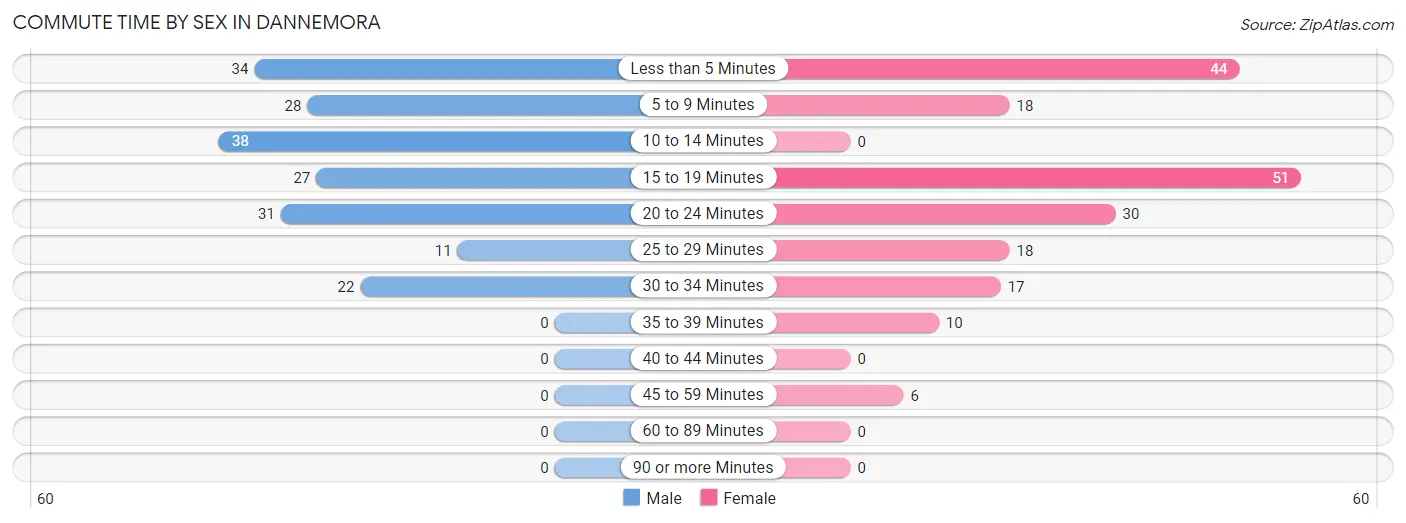
| Commute Time | Male | Female |
| Less than 5 Minutes | 34 (17.8%) | 44 (22.7%) |
| 5 to 9 Minutes | 28 (14.7%) | 18 (9.3%) |
| 10 to 14 Minutes | 38 (19.9%) | 0 (0.0%) |
| 15 to 19 Minutes | 27 (14.1%) | 51 (26.3%) |
| 20 to 24 Minutes | 31 (16.2%) | 30 (15.5%) |
| 25 to 29 Minutes | 11 (5.8%) | 18 (9.3%) |
| 30 to 34 Minutes | 22 (11.5%) | 17 (8.8%) |
| 35 to 39 Minutes | 0 (0.0%) | 10 (5.1%) |
| 40 to 44 Minutes | 0 (0.0%) | 0 (0.0%) |
| 45 to 59 Minutes | 0 (0.0%) | 6 (3.1%) |
| 60 to 89 Minutes | 0 (0.0%) | 0 (0.0%) |
| 90 or more Minutes | 0 (0.0%) | 0 (0.0%) |
Time of Departure to Work by Sex in Dannemora
The most frequent times of departure to work in Dannemora are 6:30 AM to 6:59 AM (58, 30.4%) for males and 7:00 AM to 7:29 AM (51, 26.3%) for females.
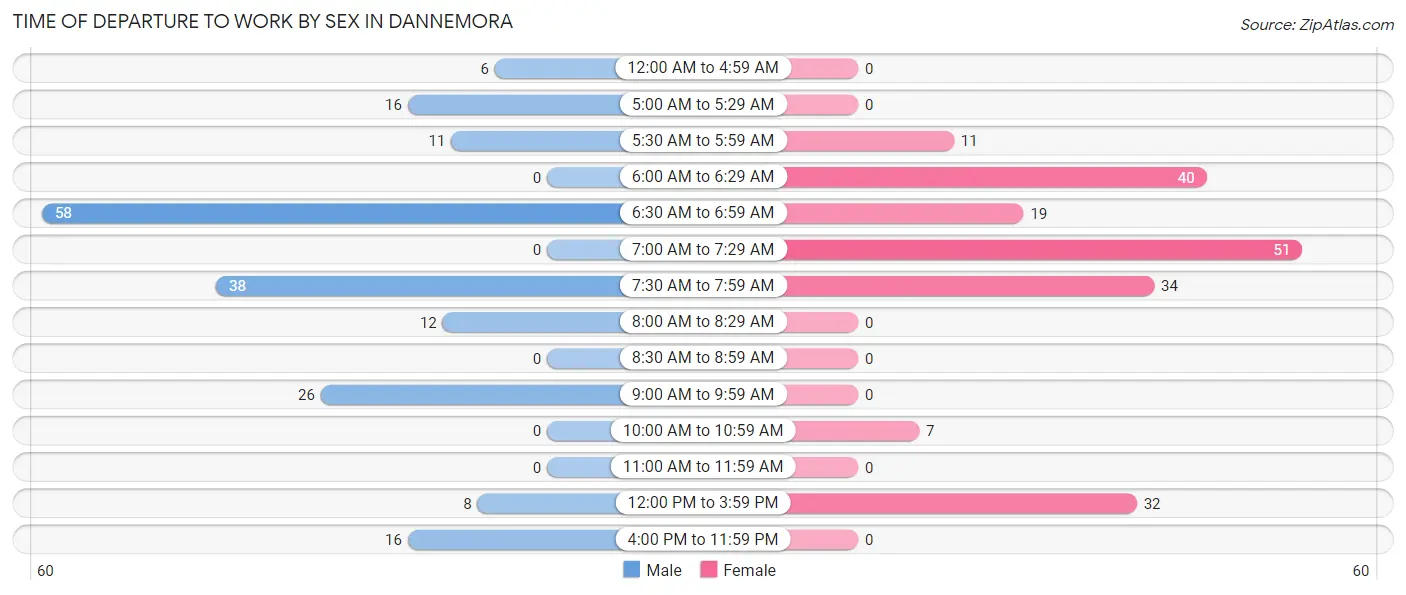
| Time of Departure | Male | Female |
| 12:00 AM to 4:59 AM | 6 (3.1%) | 0 (0.0%) |
| 5:00 AM to 5:29 AM | 16 (8.4%) | 0 (0.0%) |
| 5:30 AM to 5:59 AM | 11 (5.8%) | 11 (5.7%) |
| 6:00 AM to 6:29 AM | 0 (0.0%) | 40 (20.6%) |
| 6:30 AM to 6:59 AM | 58 (30.4%) | 19 (9.8%) |
| 7:00 AM to 7:29 AM | 0 (0.0%) | 51 (26.3%) |
| 7:30 AM to 7:59 AM | 38 (19.9%) | 34 (17.5%) |
| 8:00 AM to 8:29 AM | 12 (6.3%) | 0 (0.0%) |
| 8:30 AM to 8:59 AM | 0 (0.0%) | 0 (0.0%) |
| 9:00 AM to 9:59 AM | 26 (13.6%) | 0 (0.0%) |
| 10:00 AM to 10:59 AM | 0 (0.0%) | 7 (3.6%) |
| 11:00 AM to 11:59 AM | 0 (0.0%) | 0 (0.0%) |
| 12:00 PM to 3:59 PM | 8 (4.2%) | 32 (16.5%) |
| 4:00 PM to 11:59 PM | 16 (8.4%) | 0 (0.0%) |
| Total | 191 (100.0%) | 194 (100.0%) |
Housing Occupancy in Dannemora
Occupancy by Ownership in Dannemora
Of the total 374 dwellings in Dannemora, owner-occupied units account for 278 (74.3%), while renter-occupied units make up 96 (25.7%).
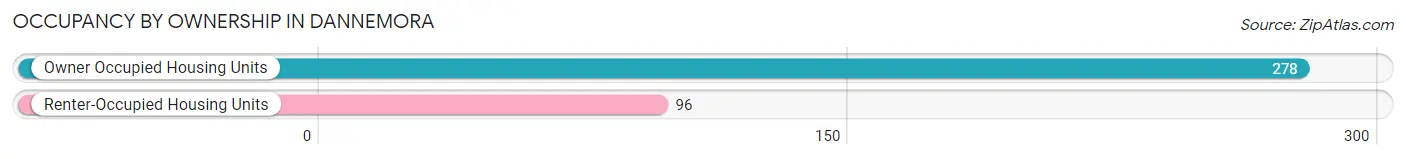
| Occupancy | # Housing Units | % Housing Units |
| Owner Occupied Housing Units | 278 | 74.3% |
| Renter-Occupied Housing Units | 96 | 25.7% |
| Total Occupied Housing Units | 374 | 100.0% |
Occupancy by Household Size in Dannemora
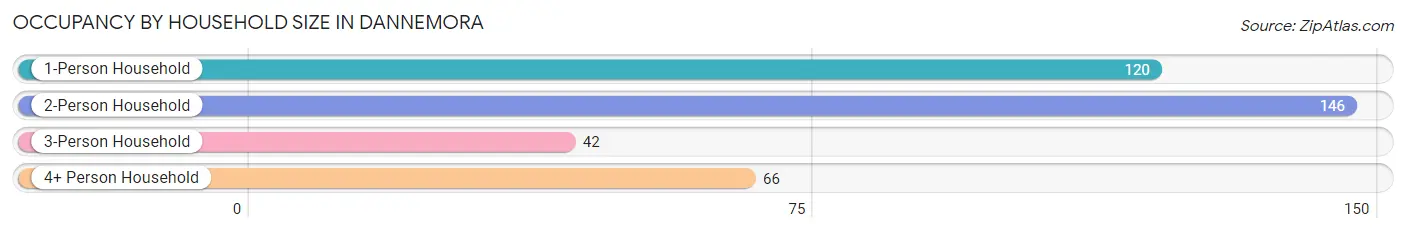
| Household Size | # Housing Units | % Housing Units |
| 1-Person Household | 120 | 32.1% |
| 2-Person Household | 146 | 39.0% |
| 3-Person Household | 42 | 11.2% |
| 4+ Person Household | 66 | 17.6% |
| Total Housing Units | 374 | 100.0% |
Occupancy by Ownership by Household Size in Dannemora
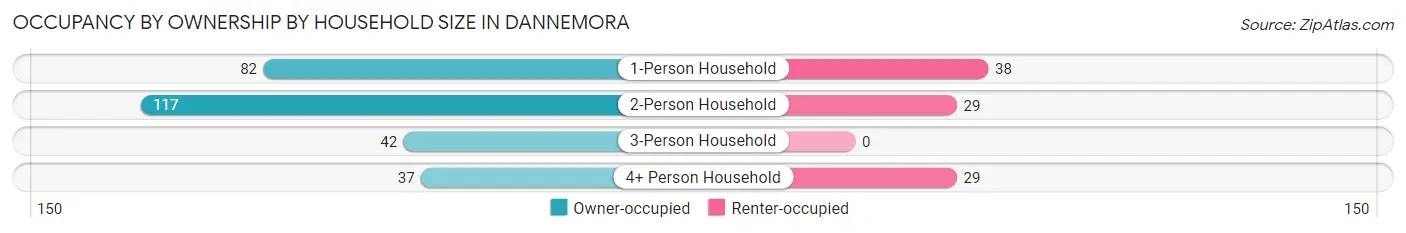
| Household Size | Owner-occupied | Renter-occupied |
| 1-Person Household | 82 (68.3%) | 38 (31.7%) |
| 2-Person Household | 117 (80.1%) | 29 (19.9%) |
| 3-Person Household | 42 (100.0%) | 0 (0.0%) |
| 4+ Person Household | 37 (56.1%) | 29 (43.9%) |
| Total Housing Units | 278 (74.3%) | 96 (25.7%) |
Occupancy by Educational Attainment in Dannemora
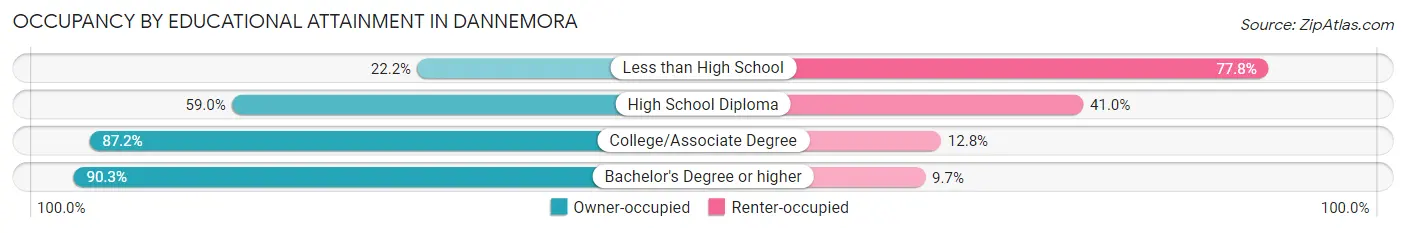
| Household Size | Owner-occupied | Renter-occupied |
| Less than High School | 10 (22.2%) | 35 (77.8%) |
| High School Diploma | 46 (59.0%) | 32 (41.0%) |
| College/Associate Degree | 129 (87.2%) | 19 (12.8%) |
| Bachelor's Degree or higher | 93 (90.3%) | 10 (9.7%) |
Occupancy by Age of Householder in Dannemora
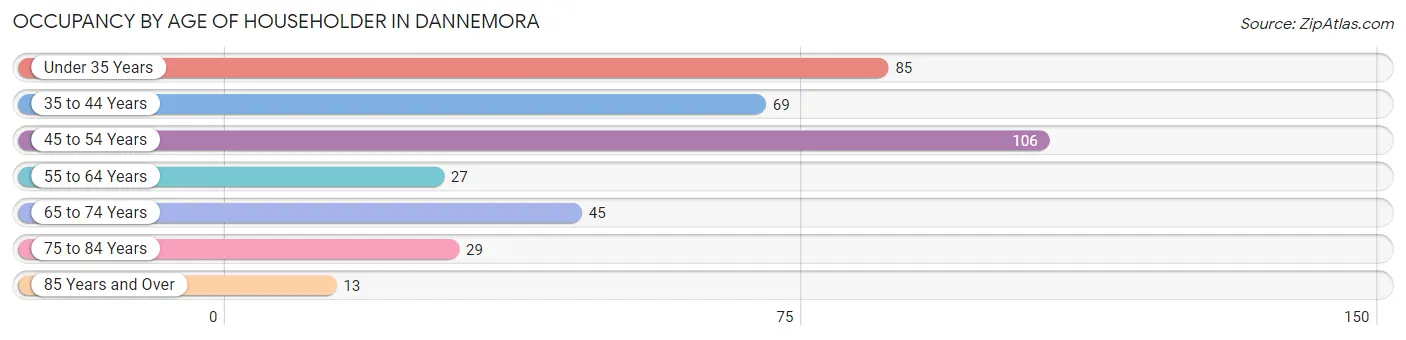
| Age Bracket | # Households | % Households |
| Under 35 Years | 85 | 22.7% |
| 35 to 44 Years | 69 | 18.4% |
| 45 to 54 Years | 106 | 28.3% |
| 55 to 64 Years | 27 | 7.2% |
| 65 to 74 Years | 45 | 12.0% |
| 75 to 84 Years | 29 | 7.7% |
| 85 Years and Over | 13 | 3.5% |
| Total | 374 | 100.0% |
Housing Finances in Dannemora
Median Income by Occupancy in Dannemora
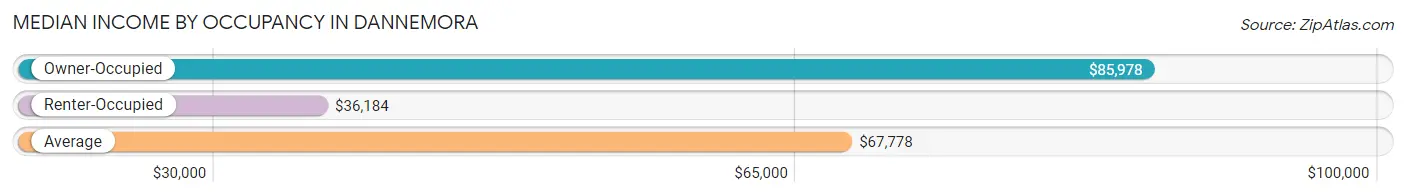
| Occupancy Type | # Households | Median Income |
| Owner-Occupied | 278 (74.3%) | $85,978 |
| Renter-Occupied | 96 (25.7%) | $36,184 |
| Average | 374 (100.0%) | $67,778 |
Occupancy by Householder Income Bracket in Dannemora
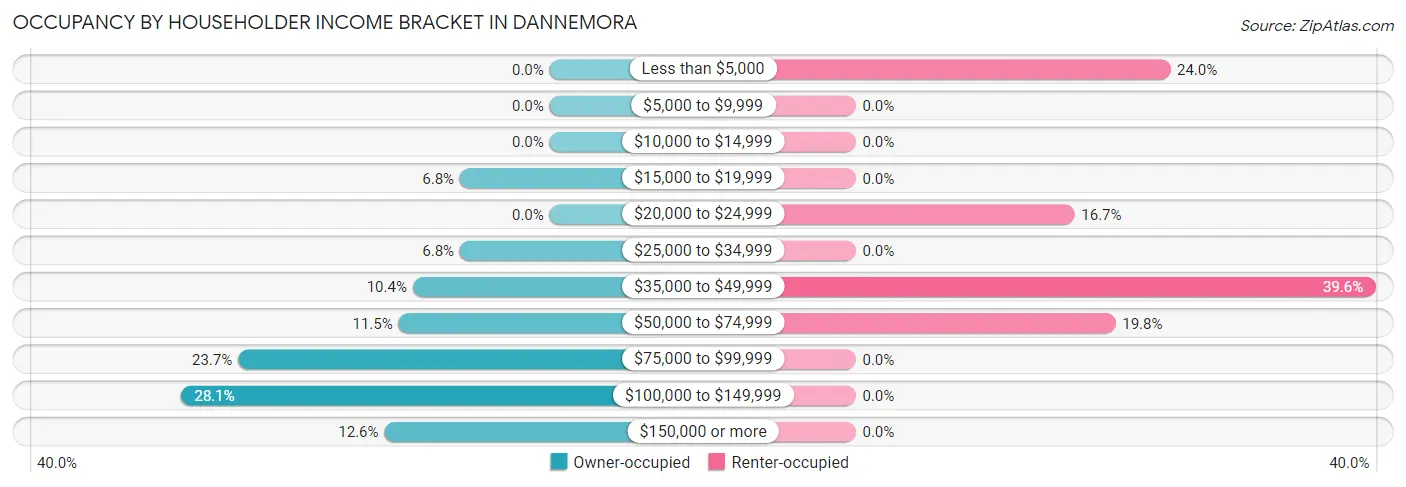
| Income Bracket | Owner-occupied | Renter-occupied |
| Less than $5,000 | 0 (0.0%) | 23 (24.0%) |
| $5,000 to $9,999 | 0 (0.0%) | 0 (0.0%) |
| $10,000 to $14,999 | 0 (0.0%) | 0 (0.0%) |
| $15,000 to $19,999 | 19 (6.8%) | 0 (0.0%) |
| $20,000 to $24,999 | 0 (0.0%) | 16 (16.7%) |
| $25,000 to $34,999 | 19 (6.8%) | 0 (0.0%) |
| $35,000 to $49,999 | 29 (10.4%) | 38 (39.6%) |
| $50,000 to $74,999 | 32 (11.5%) | 19 (19.8%) |
| $75,000 to $99,999 | 66 (23.7%) | 0 (0.0%) |
| $100,000 to $149,999 | 78 (28.1%) | 0 (0.0%) |
| $150,000 or more | 35 (12.6%) | 0 (0.0%) |
| Total | 278 (100.0%) | 96 (100.0%) |
Monthly Housing Cost Tiers in Dannemora
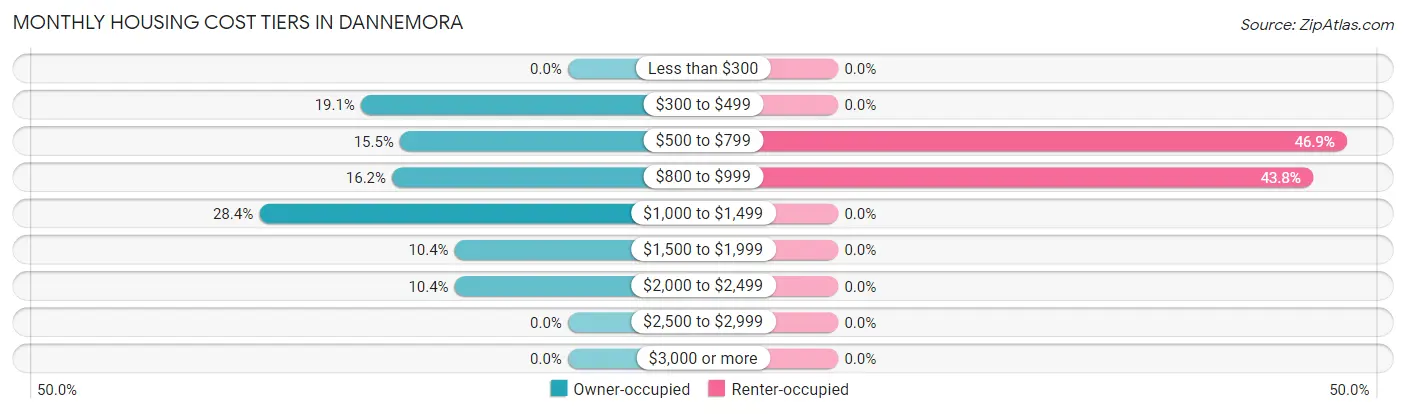
| Monthly Cost | Owner-occupied | Renter-occupied |
| Less than $300 | 0 (0.0%) | 0 (0.0%) |
| $300 to $499 | 53 (19.1%) | 0 (0.0%) |
| $500 to $799 | 43 (15.5%) | 45 (46.9%) |
| $800 to $999 | 45 (16.2%) | 42 (43.8%) |
| $1,000 to $1,499 | 79 (28.4%) | 0 (0.0%) |
| $1,500 to $1,999 | 29 (10.4%) | 0 (0.0%) |
| $2,000 to $2,499 | 29 (10.4%) | 0 (0.0%) |
| $2,500 to $2,999 | 0 (0.0%) | 0 (0.0%) |
| $3,000 or more | 0 (0.0%) | 0 (0.0%) |
| Total | 278 (100.0%) | 96 (100.0%) |
Physical Housing Characteristics in Dannemora
Housing Structures in Dannemora
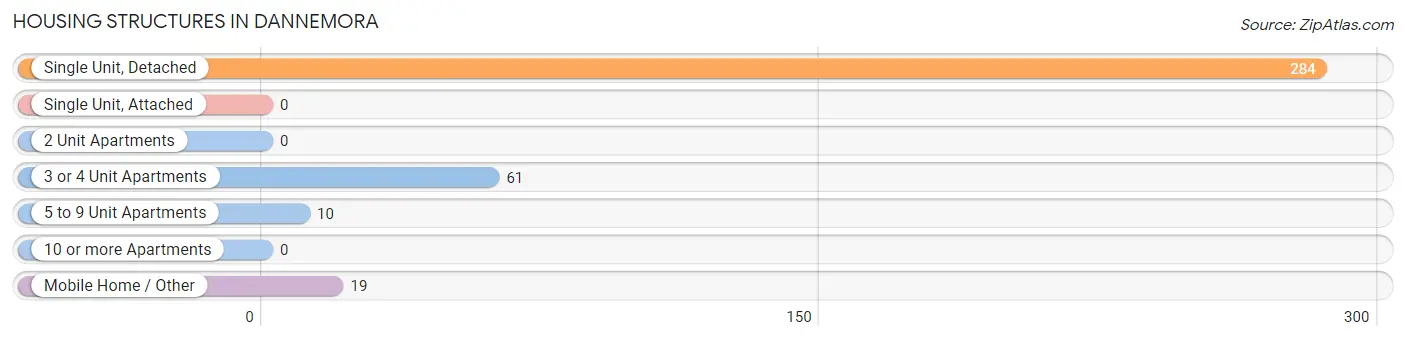
| Structure Type | # Housing Units | % Housing Units |
| Single Unit, Detached | 284 | 75.9% |
| Single Unit, Attached | 0 | 0.0% |
| 2 Unit Apartments | 0 | 0.0% |
| 3 or 4 Unit Apartments | 61 | 16.3% |
| 5 to 9 Unit Apartments | 10 | 2.7% |
| 10 or more Apartments | 0 | 0.0% |
| Mobile Home / Other | 19 | 5.1% |
| Total | 374 | 100.0% |
Housing Structures by Occupancy in Dannemora
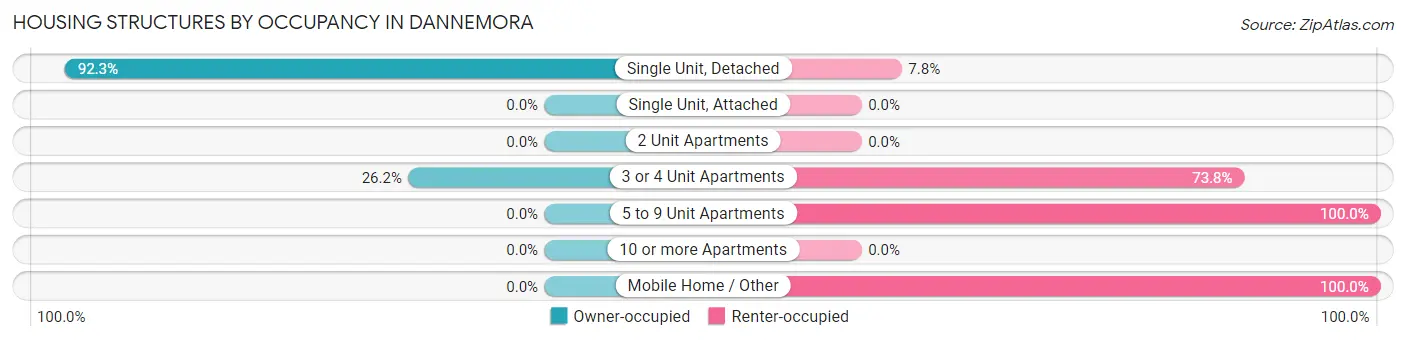
| Structure Type | Owner-occupied | Renter-occupied |
| Single Unit, Detached | 262 (92.2%) | 22 (7.7%) |
| Single Unit, Attached | 0 (0.0%) | 0 (0.0%) |
| 2 Unit Apartments | 0 (0.0%) | 0 (0.0%) |
| 3 or 4 Unit Apartments | 16 (26.2%) | 45 (73.8%) |
| 5 to 9 Unit Apartments | 0 (0.0%) | 10 (100.0%) |
| 10 or more Apartments | 0 (0.0%) | 0 (0.0%) |
| Mobile Home / Other | 0 (0.0%) | 19 (100.0%) |
| Total | 278 (74.3%) | 96 (25.7%) |
Housing Structures by Number of Rooms in Dannemora
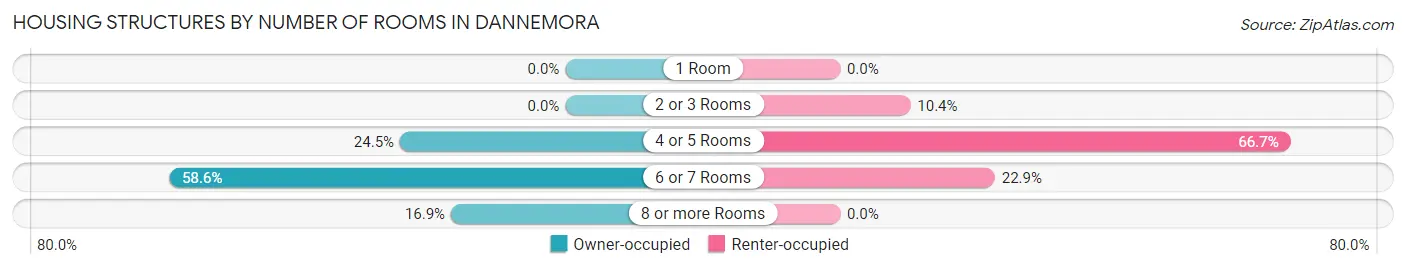
| Number of Rooms | Owner-occupied | Renter-occupied |
| 1 Room | 0 (0.0%) | 0 (0.0%) |
| 2 or 3 Rooms | 0 (0.0%) | 10 (10.4%) |
| 4 or 5 Rooms | 68 (24.5%) | 64 (66.7%) |
| 6 or 7 Rooms | 163 (58.6%) | 22 (22.9%) |
| 8 or more Rooms | 47 (16.9%) | 0 (0.0%) |
| Total | 278 (100.0%) | 96 (100.0%) |
Housing Structure by Heating Type in Dannemora
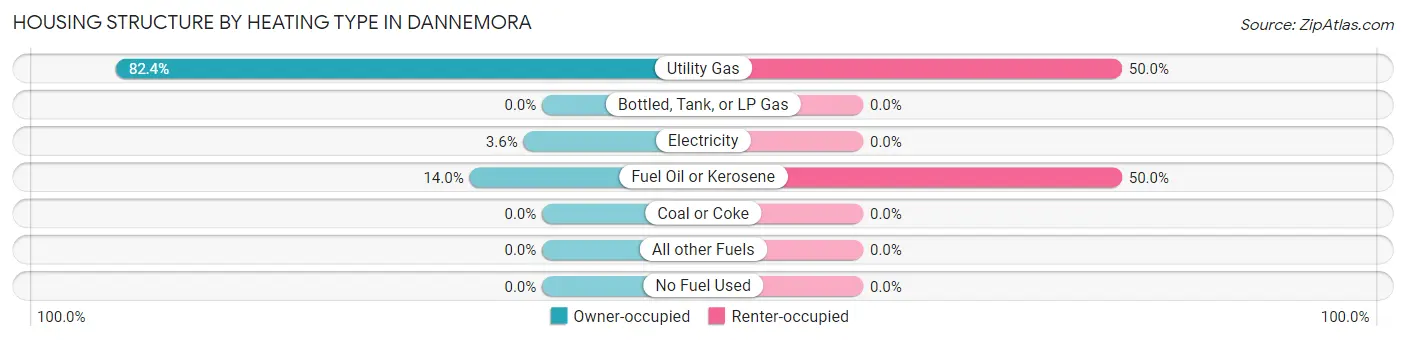
| Heating Type | Owner-occupied | Renter-occupied |
| Utility Gas | 229 (82.4%) | 48 (50.0%) |
| Bottled, Tank, or LP Gas | 0 (0.0%) | 0 (0.0%) |
| Electricity | 10 (3.6%) | 0 (0.0%) |
| Fuel Oil or Kerosene | 39 (14.0%) | 48 (50.0%) |
| Coal or Coke | 0 (0.0%) | 0 (0.0%) |
| All other Fuels | 0 (0.0%) | 0 (0.0%) |
| No Fuel Used | 0 (0.0%) | 0 (0.0%) |
| Total | 278 (100.0%) | 96 (100.0%) |
Household Vehicle Usage in Dannemora
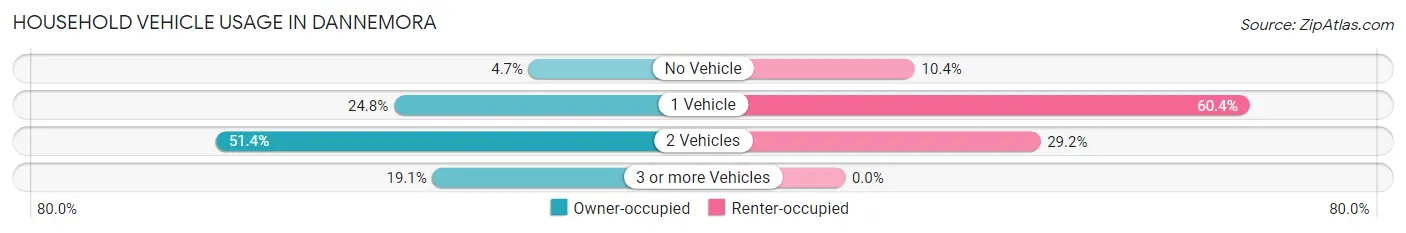
| Vehicles per Household | Owner-occupied | Renter-occupied |
| No Vehicle | 13 (4.7%) | 10 (10.4%) |
| 1 Vehicle | 69 (24.8%) | 58 (60.4%) |
| 2 Vehicles | 143 (51.4%) | 28 (29.2%) |
| 3 or more Vehicles | 53 (19.1%) | 0 (0.0%) |
| Total | 278 (100.0%) | 96 (100.0%) |
Real Estate & Mortgages in Dannemora
Real Estate and Mortgage Overview in Dannemora
| Characteristic | Without Mortgage | With Mortgage |
| Housing Units | 98 | 180 |
| Median Property Value | $135,000 | $127,200 |
| Median Household Income | $69,722 | $35 |
| Monthly Housing Costs | $475 | $0 |
| Real Estate Taxes | - | - |
Property Value by Mortgage Status in Dannemora
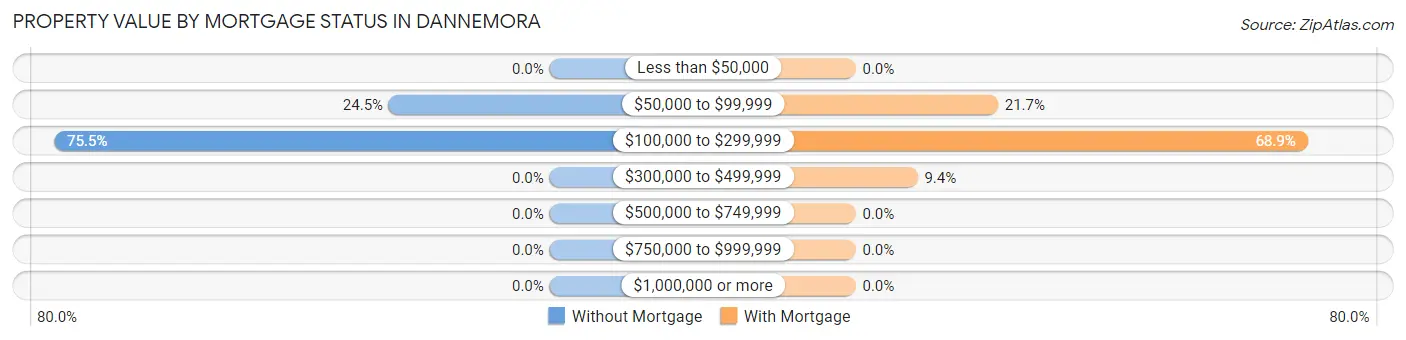
| Property Value | Without Mortgage | With Mortgage |
| Less than $50,000 | 0 (0.0%) | 0 (0.0%) |
| $50,000 to $99,999 | 24 (24.5%) | 39 (21.7%) |
| $100,000 to $299,999 | 74 (75.5%) | 124 (68.9%) |
| $300,000 to $499,999 | 0 (0.0%) | 17 (9.4%) |
| $500,000 to $749,999 | 0 (0.0%) | 0 (0.0%) |
| $750,000 to $999,999 | 0 (0.0%) | 0 (0.0%) |
| $1,000,000 or more | 0 (0.0%) | 0 (0.0%) |
| Total | 98 (100.0%) | 180 (100.0%) |
Household Income by Mortgage Status in Dannemora
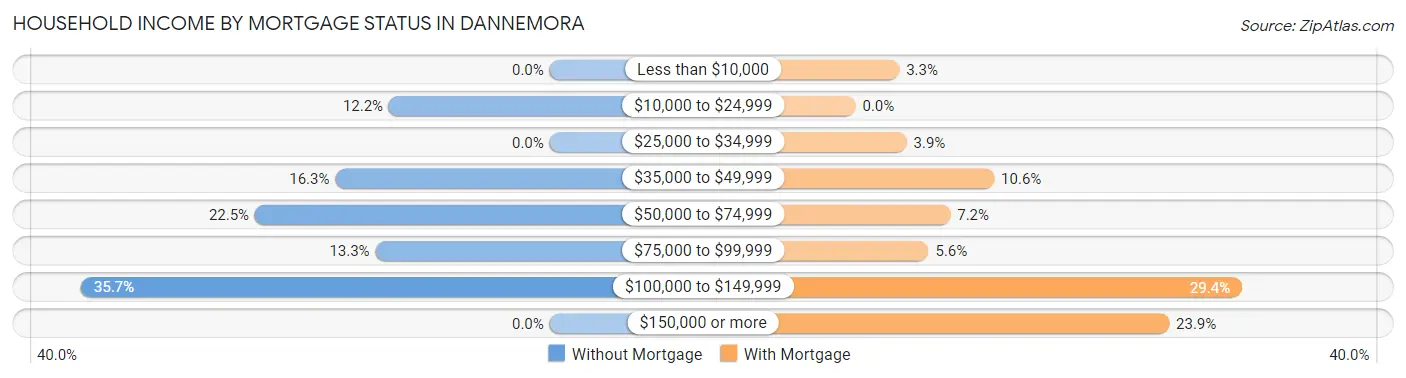
| Household Income | Without Mortgage | With Mortgage |
| Less than $10,000 | 0 (0.0%) | 6 (3.3%) |
| $10,000 to $24,999 | 12 (12.2%) | 0 (0.0%) |
| $25,000 to $34,999 | 0 (0.0%) | 7 (3.9%) |
| $35,000 to $49,999 | 16 (16.3%) | 19 (10.6%) |
| $50,000 to $74,999 | 22 (22.5%) | 13 (7.2%) |
| $75,000 to $99,999 | 13 (13.3%) | 10 (5.6%) |
| $100,000 to $149,999 | 35 (35.7%) | 53 (29.4%) |
| $150,000 or more | 0 (0.0%) | 43 (23.9%) |
| Total | 98 (100.0%) | 180 (100.0%) |
Property Value to Household Income Ratio in Dannemora
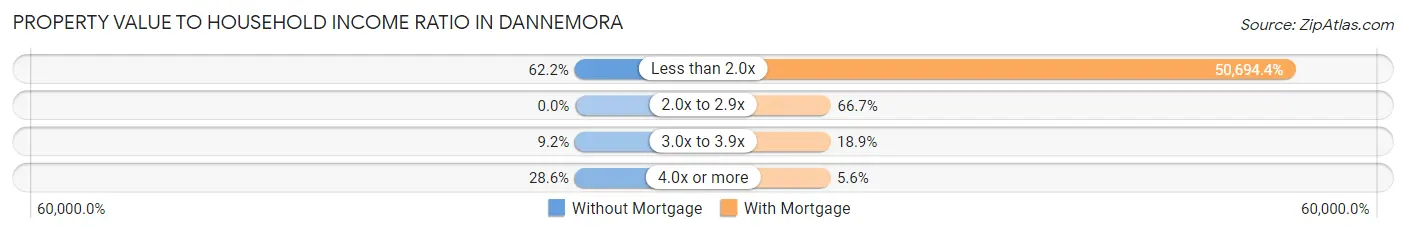
| Value-to-Income Ratio | Without Mortgage | With Mortgage |
| Less than 2.0x | 61 (62.2%) | 91,250 (50,694.4%) |
| 2.0x to 2.9x | 0 (0.0%) | 120 (66.7%) |
| 3.0x to 3.9x | 9 (9.2%) | 34 (18.9%) |
| 4.0x or more | 28 (28.6%) | 10 (5.6%) |
| Total | 98 (100.0%) | 180 (100.0%) |
Real Estate Taxes by Mortgage Status in Dannemora
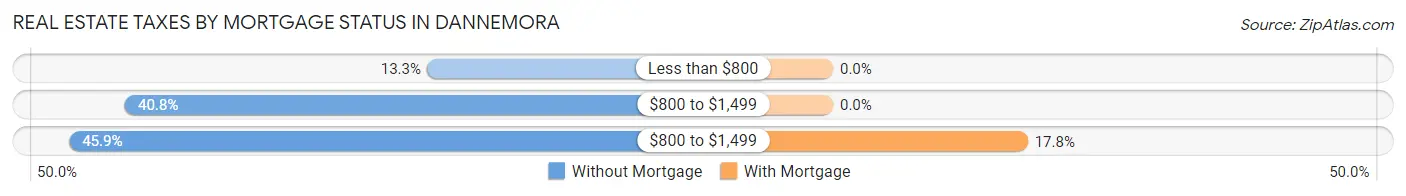
| Property Taxes | Without Mortgage | With Mortgage |
| Less than $800 | 13 (13.3%) | 0 (0.0%) |
| $800 to $1,499 | 40 (40.8%) | 0 (0.0%) |
| $800 to $1,499 | 45 (45.9%) | 32 (17.8%) |
| Total | 98 (100.0%) | 180 (100.0%) |
Health & Disability in Dannemora
Health Insurance Coverage by Age in Dannemora
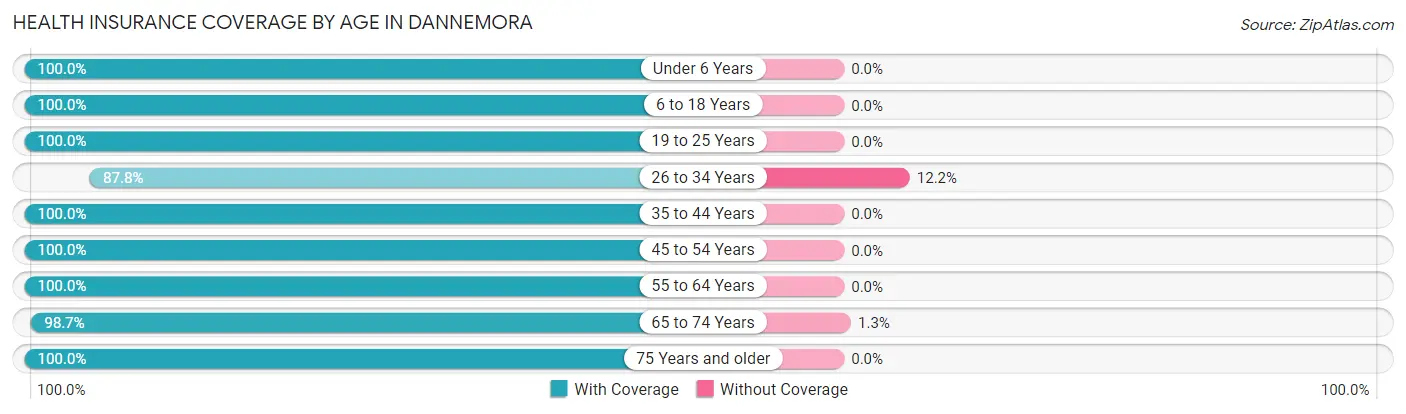
| Age Bracket | With Coverage | Without Coverage |
| Under 6 Years | 75 (100.0%) | 0 (0.0%) |
| 6 to 18 Years | 146 (100.0%) | 0 (0.0%) |
| 19 to 25 Years | 43 (100.0%) | 0 (0.0%) |
| 26 to 34 Years | 122 (87.8%) | 17 (12.2%) |
| 35 to 44 Years | 128 (100.0%) | 0 (0.0%) |
| 45 to 54 Years | 151 (100.0%) | 0 (0.0%) |
| 55 to 64 Years | 99 (100.0%) | 0 (0.0%) |
| 65 to 74 Years | 78 (98.7%) | 1 (1.3%) |
| 75 Years and older | 52 (100.0%) | 0 (0.0%) |
| Total | 894 (98.0%) | 18 (2.0%) |
Health Insurance Coverage by Citizenship Status in Dannemora
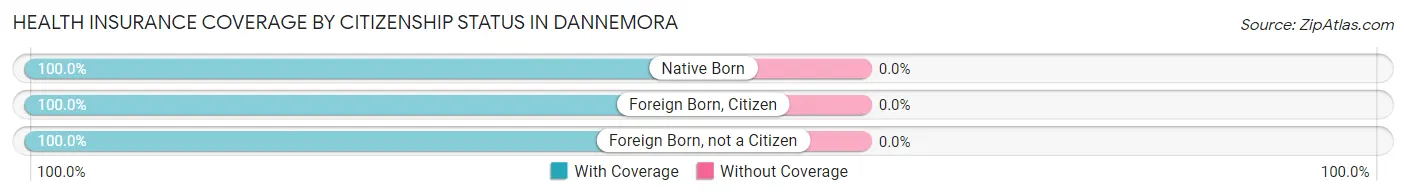
| Citizenship Status | With Coverage | Without Coverage |
| Native Born | 75 (100.0%) | 0 (0.0%) |
| Foreign Born, Citizen | 146 (100.0%) | 0 (0.0%) |
| Foreign Born, not a Citizen | 43 (100.0%) | 0 (0.0%) |
Health Insurance Coverage by Household Income in Dannemora
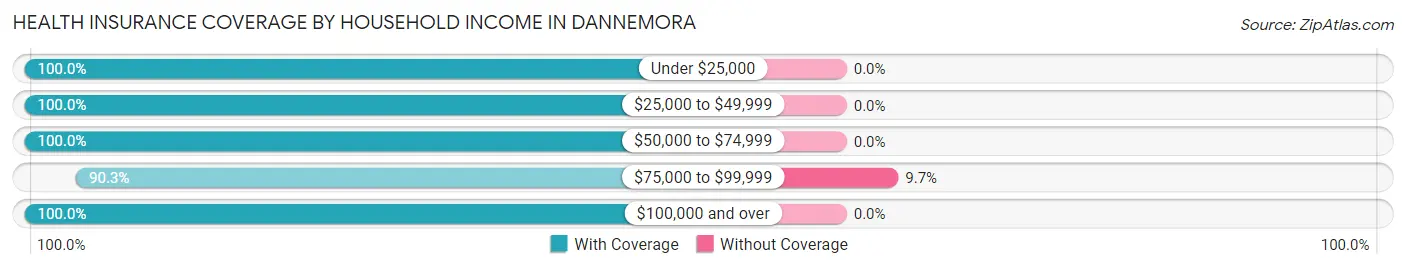
| Household Income | With Coverage | Without Coverage |
| Under $25,000 | 127 (100.0%) | 0 (0.0%) |
| $25,000 to $49,999 | 221 (100.0%) | 0 (0.0%) |
| $50,000 to $74,999 | 68 (100.0%) | 0 (0.0%) |
| $75,000 to $99,999 | 159 (90.3%) | 17 (9.7%) |
| $100,000 and over | 318 (100.0%) | 0 (0.0%) |
Public vs Private Health Insurance Coverage by Age in Dannemora
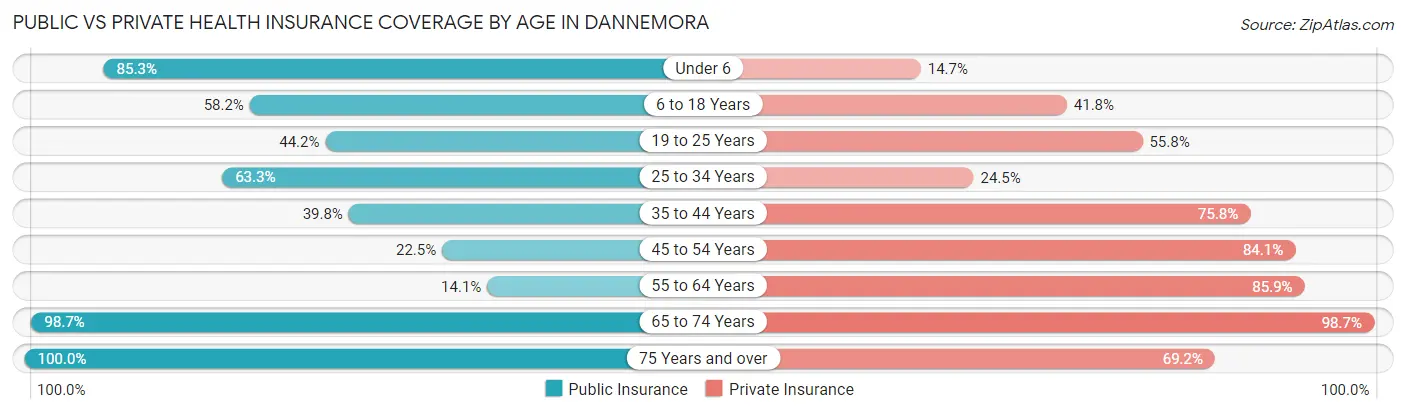
| Age Bracket | Public Insurance | Private Insurance |
| Under 6 | 64 (85.3%) | 11 (14.7%) |
| 6 to 18 Years | 85 (58.2%) | 61 (41.8%) |
| 19 to 25 Years | 19 (44.2%) | 24 (55.8%) |
| 25 to 34 Years | 88 (63.3%) | 34 (24.5%) |
| 35 to 44 Years | 51 (39.8%) | 97 (75.8%) |
| 45 to 54 Years | 34 (22.5%) | 127 (84.1%) |
| 55 to 64 Years | 14 (14.1%) | 85 (85.9%) |
| 65 to 74 Years | 78 (98.7%) | 78 (98.7%) |
| 75 Years and over | 52 (100.0%) | 36 (69.2%) |
| Total | 485 (53.2%) | 553 (60.6%) |
Disability Status by Sex by Age in Dannemora
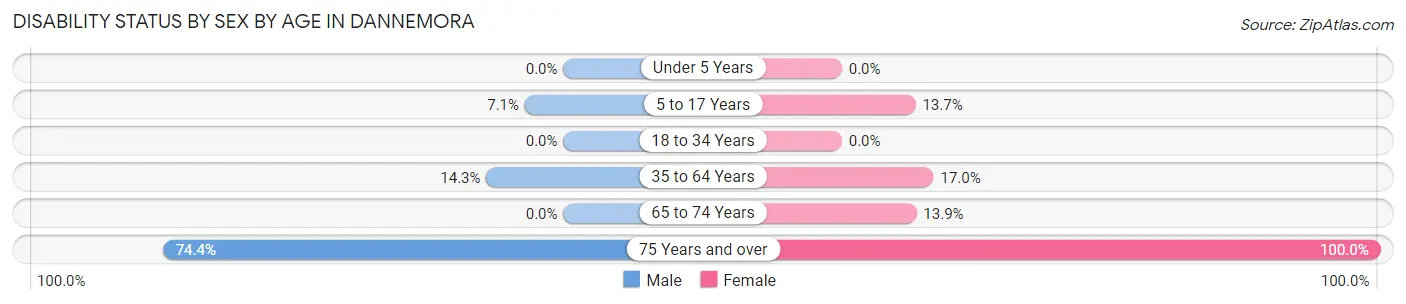
| Age Bracket | Male | Female |
| Under 5 Years | 0 (0.0%) | 0 (0.0%) |
| 5 to 17 Years | 4 (7.1%) | 13 (13.7%) |
| 18 to 34 Years | 0 (0.0%) | 0 (0.0%) |
| 35 to 64 Years | 28 (14.3%) | 31 (17.0%) |
| 65 to 74 Years | 0 (0.0%) | 9 (13.9%) |
| 75 Years and over | 29 (74.4%) | 13 (100.0%) |
Disability Class by Sex by Age in Dannemora
Disability Class: Hearing Difficulty
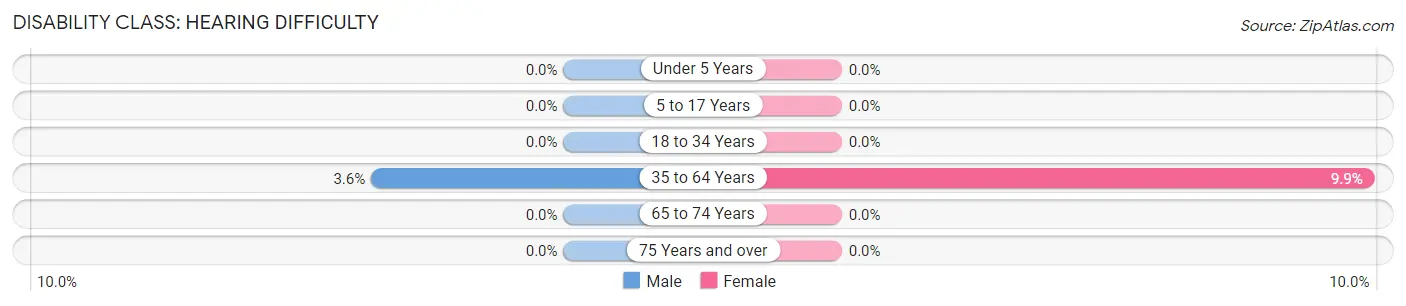
| Age Bracket | Male | Female |
| Under 5 Years | 0 (0.0%) | 0 (0.0%) |
| 5 to 17 Years | 0 (0.0%) | 0 (0.0%) |
| 18 to 34 Years | 0 (0.0%) | 0 (0.0%) |
| 35 to 64 Years | 7 (3.6%) | 18 (9.9%) |
| 65 to 74 Years | 0 (0.0%) | 0 (0.0%) |
| 75 Years and over | 0 (0.0%) | 0 (0.0%) |
Disability Class: Vision Difficulty
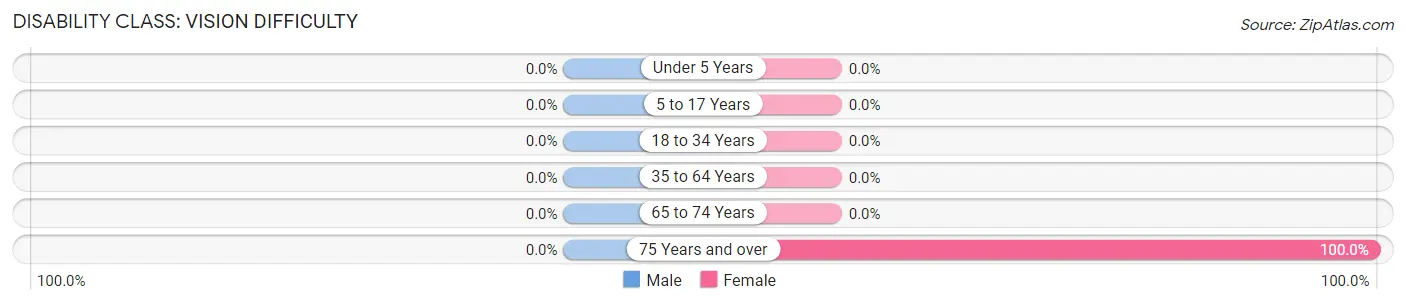
| Age Bracket | Male | Female |
| Under 5 Years | 0 (0.0%) | 0 (0.0%) |
| 5 to 17 Years | 0 (0.0%) | 0 (0.0%) |
| 18 to 34 Years | 0 (0.0%) | 0 (0.0%) |
| 35 to 64 Years | 0 (0.0%) | 0 (0.0%) |
| 65 to 74 Years | 0 (0.0%) | 0 (0.0%) |
| 75 Years and over | 0 (0.0%) | 13 (100.0%) |
Disability Class: Cognitive Difficulty
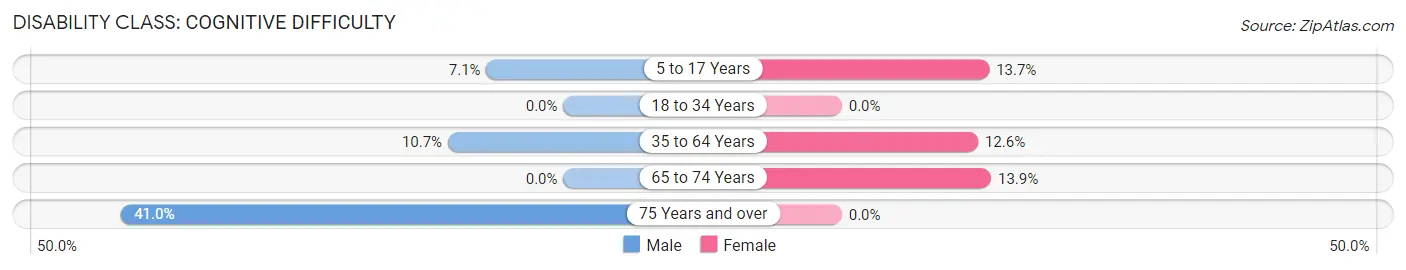
| Age Bracket | Male | Female |
| 5 to 17 Years | 4 (7.1%) | 13 (13.7%) |
| 18 to 34 Years | 0 (0.0%) | 0 (0.0%) |
| 35 to 64 Years | 21 (10.7%) | 23 (12.6%) |
| 65 to 74 Years | 0 (0.0%) | 9 (13.9%) |
| 75 Years and over | 16 (41.0%) | 0 (0.0%) |
Disability Class: Ambulatory Difficulty
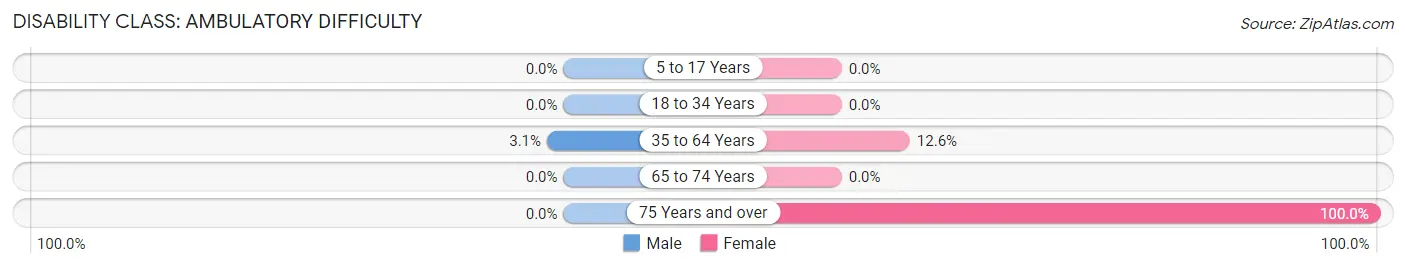
| Age Bracket | Male | Female |
| 5 to 17 Years | 0 (0.0%) | 0 (0.0%) |
| 18 to 34 Years | 0 (0.0%) | 0 (0.0%) |
| 35 to 64 Years | 6 (3.1%) | 23 (12.6%) |
| 65 to 74 Years | 0 (0.0%) | 0 (0.0%) |
| 75 Years and over | 0 (0.0%) | 13 (100.0%) |
Disability Class: Self-Care Difficulty
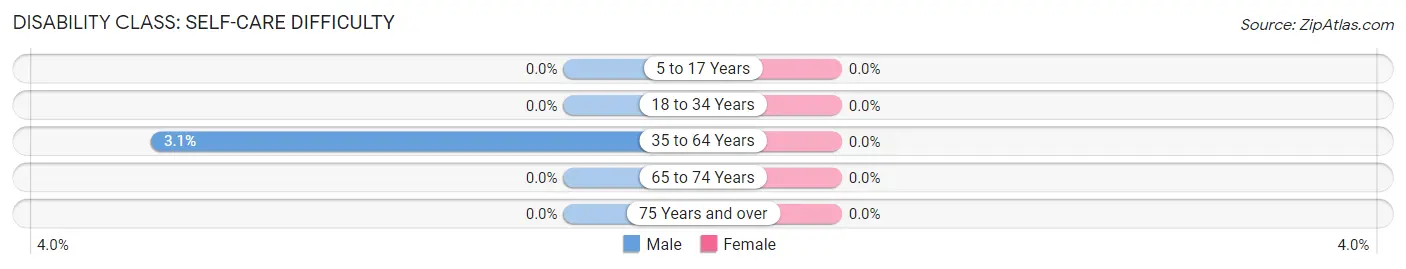
| Age Bracket | Male | Female |
| 5 to 17 Years | 0 (0.0%) | 0 (0.0%) |
| 18 to 34 Years | 0 (0.0%) | 0 (0.0%) |
| 35 to 64 Years | 6 (3.1%) | 0 (0.0%) |
| 65 to 74 Years | 0 (0.0%) | 0 (0.0%) |
| 75 Years and over | 0 (0.0%) | 0 (0.0%) |
Technology Access in Dannemora
Computing Device Access in Dannemora
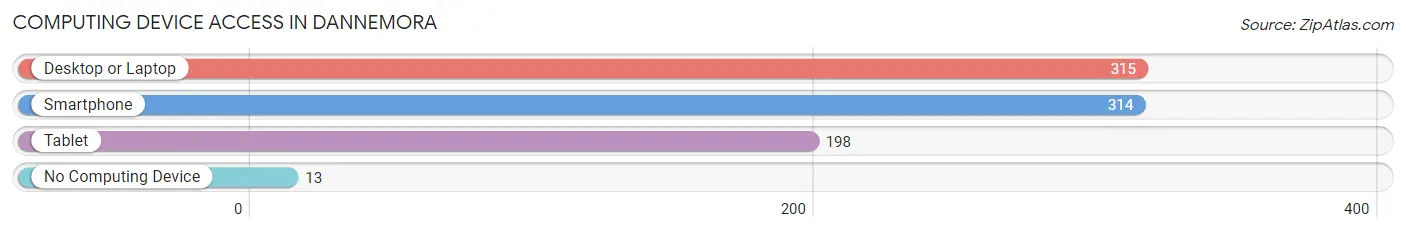
| Device Type | # Households | % Households |
| Desktop or Laptop | 315 | 84.2% |
| Smartphone | 314 | 84.0% |
| Tablet | 198 | 52.9% |
| No Computing Device | 13 | 3.5% |
| Total | 374 | 100.0% |
Internet Access in Dannemora
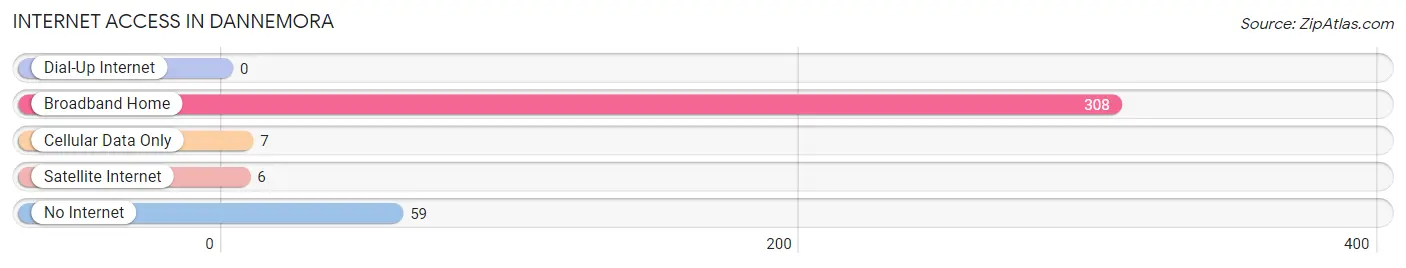
| Internet Type | # Households | % Households |
| Dial-Up Internet | 0 | 0.0% |
| Broadband Home | 308 | 82.4% |
| Cellular Data Only | 7 | 1.9% |
| Satellite Internet | 6 | 1.6% |
| No Internet | 59 | 15.8% |
| Total | 374 | 100.0% |
Dannemora Summary
Dannemora is a small village located in the northern part of New York State, in Clinton County. It is situated in the foothills of the Adirondack Mountains, and is bordered by the towns of Saranac, Peru, and Plattsburgh. The village has a population of approximately 1,800 people, and is home to a variety of businesses, including a prison, a hospital, and a number of small businesses.
History
The area that is now Dannemora was first settled in the late 1700s by a group of Swedish immigrants. The village was originally known as “Swedish Settlement”, and was later renamed “Dannemora” after the Swedish town of the same name. The village was incorporated in 1845, and the first post office was established in 1848.
In 1877, the state of New York opened the Clinton Prison in Dannemora, which is still in operation today. The prison was originally built to house inmates from the state’s other prisons, and it quickly became the largest employer in the village. The prison has been the subject of numerous books and films, including the 2015 film “Escape from Dannemora”.
Geography
Dannemora is located in the northern part of New York State, in Clinton County. It is situated in the foothills of the Adirondack Mountains, and is bordered by the towns of Saranac, Peru, and Plattsburgh. The village is located approximately 25 miles south of the Canadian border, and is approximately 75 miles north of Albany.
The village is situated on the Saranac River, which flows through the center of the village. The river is a popular destination for fishing, canoeing, and kayaking. The village is also home to a number of parks and recreational areas, including the Dannemora State Park, which offers camping, hiking, and other outdoor activities.
Economy
The economy of Dannemora is largely based on the Clinton Prison, which is the largest employer in the village. The prison employs approximately 1,000 people, and is the primary source of income for many of the village’s residents.
In addition to the prison, the village is home to a number of small businesses, including restaurants, retail stores, and other services. The village is also home to a hospital, which provides medical care to the residents of the village and the surrounding area.
Demographics
As of the 2010 census, the population of Dannemora was 1,818. The racial makeup of the village was 97.2% White, 0.7% African American, 0.3% Native American, 0.2% Asian, 0.1% Pacific Islander, and 1.5% from other races. The median household income was $37,917, and the median family income was $45,938.
The village is home to a variety of religious denominations, including Catholic, Protestant, and Jewish. The village is also home to a number of cultural organizations, including the Dannemora Historical Society and the Dannemora Arts Council.
Conclusion
Dannemora is a small village located in the northern part of New York State, in Clinton County. It is situated in the foothills of the Adirondack Mountains, and is bordered by the towns of Saranac, Peru, and Plattsburgh. The village has a population of approximately 1,800 people, and is home to a variety of businesses, including a prison, a hospital, and a number of small businesses. The economy of the village is largely based on the Clinton Prison, which is the largest employer in the village. The village is also home to a number of small businesses, including restaurants, retail stores, and other services. The racial makeup of the village is 97.2% White, 0.7% African American, 0.3% Native American, 0.2% Asian, 0.1% Pacific Islander, and 1.5% from other races. The median household income was $37,917, and the median family income was $45,938. Dannemora is home to a variety of religious denominations, and is also home to a number of cultural organizations.
Common Questions
What is Per Capita Income in Dannemora?
Per Capita income in Dannemora is $9,082.
What is the Median Family Income in Dannemora?
Median Family Income in Dannemora is $95,833.
What is the Median Household income in Dannemora?
Median Household Income in Dannemora is $67,778.
What is Inequality or Gini Index in Dannemora?
Inequality or Gini Index in Dannemora is 0.38.
What is the Total Population of Dannemora?
Total Population of Dannemora is 3,373.
What is the Total Male Population of Dannemora?
Total Male Population of Dannemora is 2,886.
What is the Total Female Population of Dannemora?
Total Female Population of Dannemora is 487.
What is the Ratio of Males per 100 Females in Dannemora?
There are 592.61 Males per 100 Females in Dannemora.
What is the Ratio of Females per 100 Males in Dannemora?
There are 16.87 Females per 100 Males in Dannemora.
What is the Median Population Age in Dannemora?
Median Population Age in Dannemora is 37.7 Years.
What is the Average Family Size in Dannemora
Average Family Size in Dannemora is 3.2 People.
What is the Average Household Size in Dannemora
Average Household Size in Dannemora is 2.4 People.
How Large is the Labor Force in Dannemora?
There are 436 People in the Labor Forcein in Dannemora.
What is the Percentage of People in the Labor Force in Dannemora?
13.8% of People are in the Labor Force in Dannemora.
What is the Unemployment Rate in Dannemora?
Unemployment Rate in Dannemora is 4.6%.