Wilmington, NY Map & Demographics
Wilmington Map
Wilmington Overview
$49,929
PER CAPITA INCOME
$96,406
AVG FAMILY INCOME
$83,750
AVG HOUSEHOLD INCOME
22.7%
WAGE / INCOME GAP [ % ]
77.3¢/ $1
WAGE / INCOME GAP [ $ ]
0.40
INEQUALITY / GINI INDEX
931
TOTAL POPULATION
461
MALE POPULATION
470
FEMALE POPULATION
98.09
MALES / 100 FEMALES
101.95
FEMALES / 100 MALES
50.1
MEDIAN AGE
2.6
AVG FAMILY SIZE
2.2
AVG HOUSEHOLD SIZE
531
LABOR FORCE [ PEOPLE ]
61.9%
PERCENT IN LABOR FORCE
Wilmington Zip Codes
Wilmington Area Codes
Income in Wilmington
Income Overview in Wilmington
Per Capita Income in Wilmington is $49,929, while median incomes of families and households are $96,406 and $83,750 respectively.
| Characteristic | Number | Measure |
| Per Capita Income | 931 | $49,929 |
| Median Family Income | 300 | $96,406 |
| Mean Family Income | 300 | $108,877 |
| Median Household Income | 417 | $83,750 |
| Mean Household Income | 417 | $104,875 |
| Income Deficit | 300 | $0 |
| Wage / Income Gap (%) | 931 | 22.67% |
| Wage / Income Gap ($) | 931 | 77.33¢ per $1 |
| Gini / Inequality Index | 931 | 0.40 |
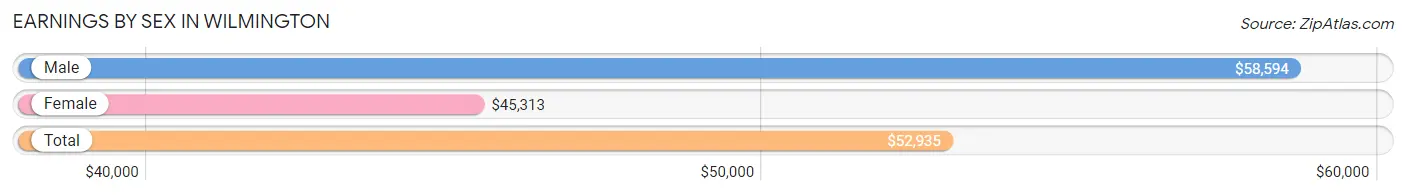
Earnings by Sex in Wilmington
Average Earnings in Wilmington are $52,935, $58,594 for men and $45,313 for women, a difference of 22.7%.
| Sex | Number | Average Earnings |
| Male | 273 (49.3%) | $58,594 |
| Female | 281 (50.7%) | $45,313 |
| Total | 554 (100.0%) | $52,935 |
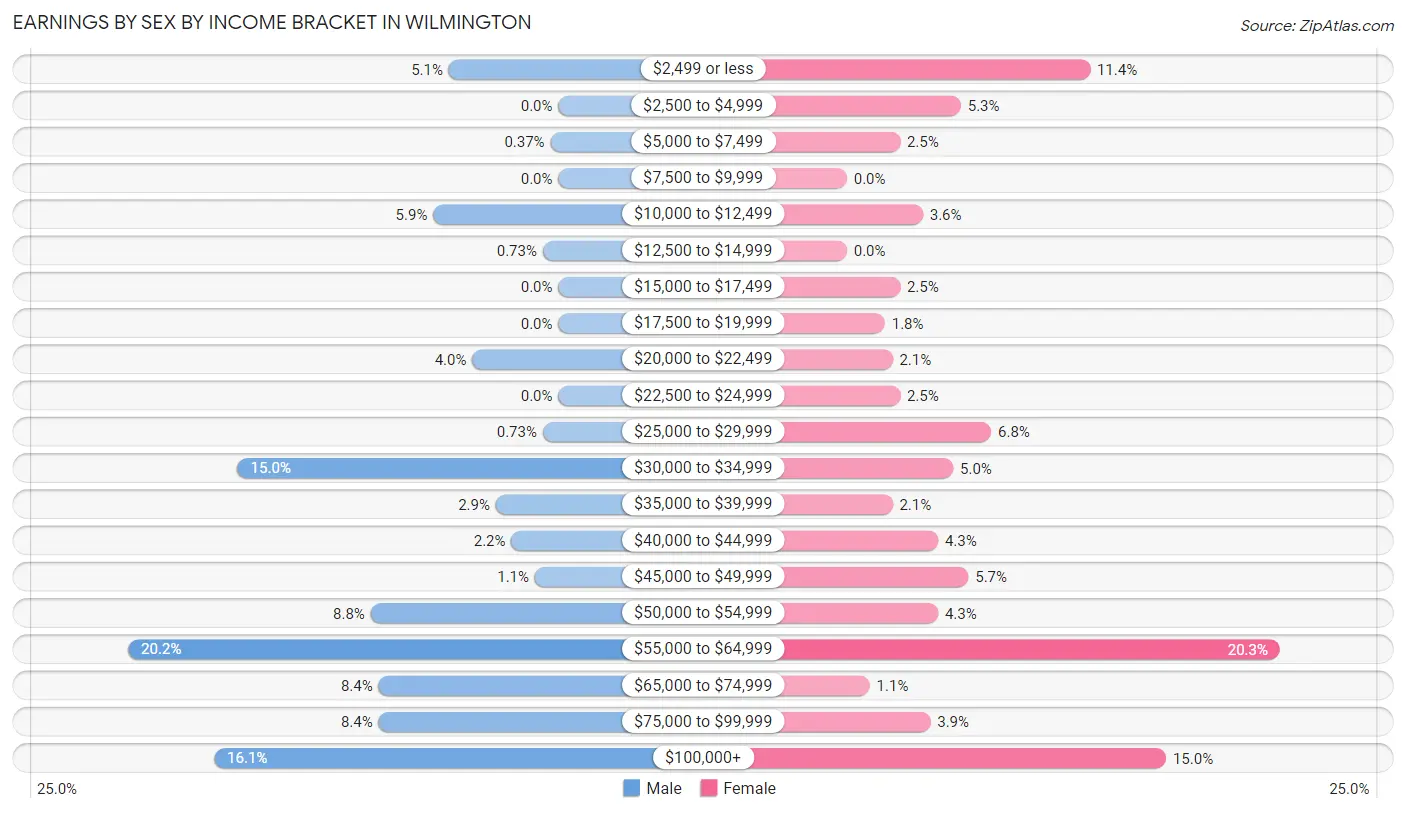
Earnings by Sex by Income Bracket in Wilmington
The most common earnings brackets in Wilmington are $55,000 to $64,999 for men (55 | 20.2%) and $55,000 to $64,999 for women (57 | 20.3%).
| Income | Male | Female |
| $2,499 or less | 14 (5.1%) | 32 (11.4%) |
| $2,500 to $4,999 | 0 (0.0%) | 15 (5.3%) |
| $5,000 to $7,499 | 1 (0.4%) | 7 (2.5%) |
| $7,500 to $9,999 | 0 (0.0%) | 0 (0.0%) |
| $10,000 to $12,499 | 16 (5.9%) | 10 (3.6%) |
| $12,500 to $14,999 | 2 (0.7%) | 0 (0.0%) |
| $15,000 to $17,499 | 0 (0.0%) | 7 (2.5%) |
| $17,500 to $19,999 | 0 (0.0%) | 5 (1.8%) |
| $20,000 to $22,499 | 11 (4.0%) | 6 (2.1%) |
| $22,500 to $24,999 | 0 (0.0%) | 7 (2.5%) |
| $25,000 to $29,999 | 2 (0.7%) | 19 (6.8%) |
| $30,000 to $34,999 | 41 (15.0%) | 14 (5.0%) |
| $35,000 to $39,999 | 8 (2.9%) | 6 (2.1%) |
| $40,000 to $44,999 | 6 (2.2%) | 12 (4.3%) |
| $45,000 to $49,999 | 3 (1.1%) | 16 (5.7%) |
| $50,000 to $54,999 | 24 (8.8%) | 12 (4.3%) |
| $55,000 to $64,999 | 55 (20.2%) | 57 (20.3%) |
| $65,000 to $74,999 | 23 (8.4%) | 3 (1.1%) |
| $75,000 to $99,999 | 23 (8.4%) | 11 (3.9%) |
| $100,000+ | 44 (16.1%) | 42 (14.9%) |
| Total | 273 (100.0%) | 281 (100.0%) |
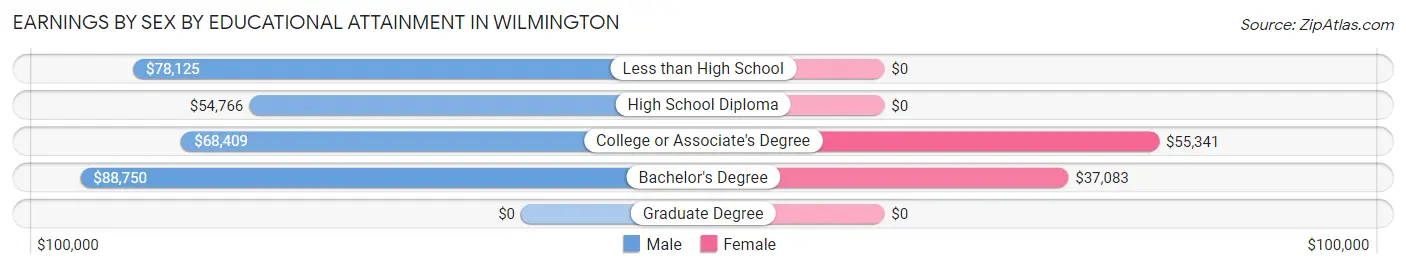
Earnings by Sex by Educational Attainment in Wilmington
Average earnings in Wilmington are $61,471 for men and $52,250 for women, a difference of 15.0%. Men with an educational attainment of bachelor's degree enjoy the highest average annual earnings of $88,750, while those with high school diploma education earn the least with $54,766. Women with an educational attainment of college or associate's degree earn the most with the average annual earnings of $55,341, while those with bachelor's degree education have the smallest earnings of $37,083.
| Educational Attainment | Male Income | Female Income |
| Less than High School | $78,125 | $0 |
| High School Diploma | $54,766 | $0 |
| College or Associate's Degree | $68,409 | $55,341 |
| Bachelor's Degree | $88,750 | $37,083 |
| Graduate Degree | - | - |
| Total | $61,471 | $52,250 |
Family Income in Wilmington
Family Income Brackets in Wilmington
According to the Wilmington family income data, there are 65 families falling into the $100,000 to $149,999 income range, which is the most common income bracket and makes up 21.7% of all families.
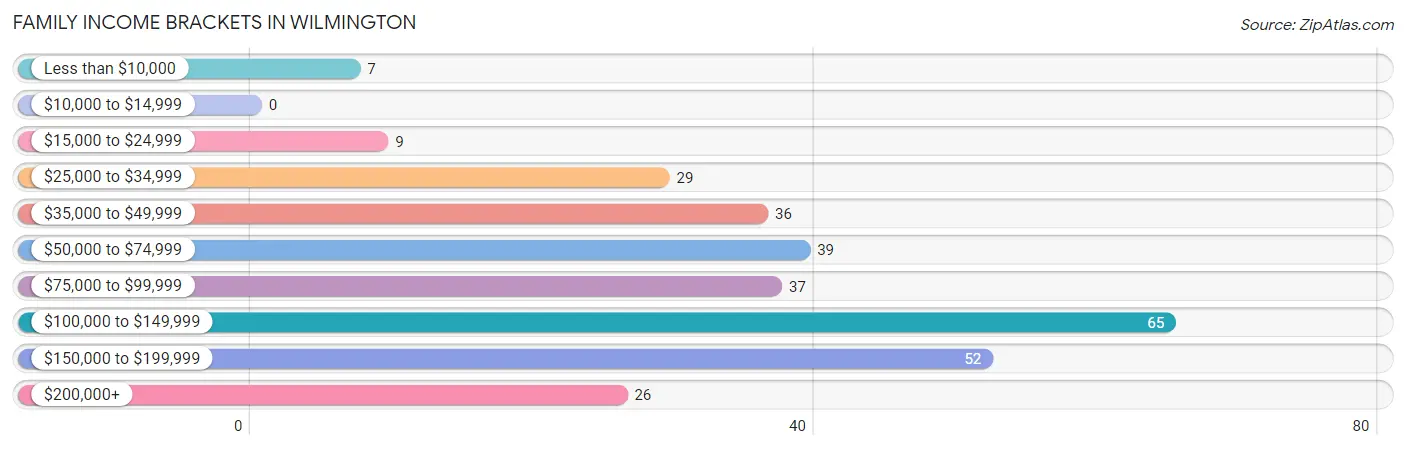
| Income Bracket | # Families | % Families |
| Less than $10,000 | 7 | 2.3% |
| $10,000 to $14,999 | 0 | 0.0% |
| $15,000 to $24,999 | 9 | 3.0% |
| $25,000 to $34,999 | 29 | 9.7% |
| $35,000 to $49,999 | 36 | 12.0% |
| $50,000 to $74,999 | 39 | 13.0% |
| $75,000 to $99,999 | 37 | 12.3% |
| $100,000 to $149,999 | 65 | 21.7% |
| $150,000 to $199,999 | 52 | 17.3% |
| $200,000+ | 26 | 8.7% |
Family Income by Famaliy Size in Wilmington
4-person families (29 | 9.7%) account for the highest median family income in Wilmington with $130,750 per family, while 2-person families (193 | 64.3%) have the highest median income of $37,656 per family member.
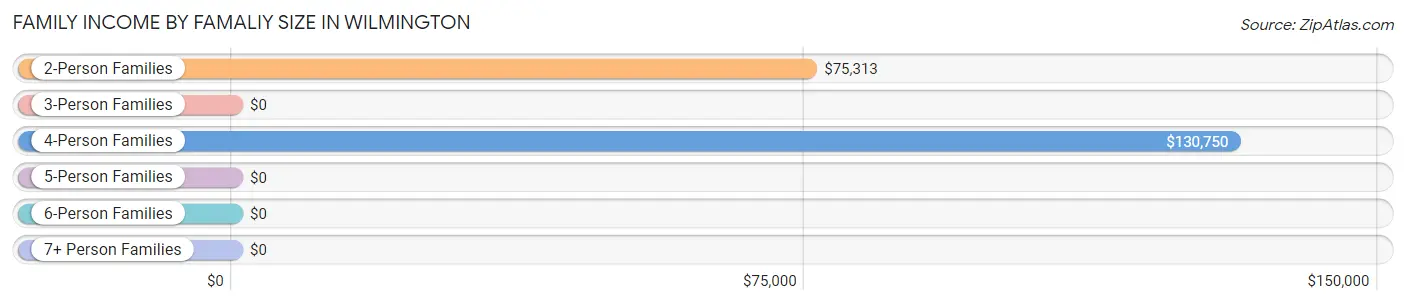
| Income Bracket | # Families | Median Income |
| 2-Person Families | 193 (64.3%) | $75,313 |
| 3-Person Families | 41 (13.7%) | $0 |
| 4-Person Families | 29 (9.7%) | $130,750 |
| 5-Person Families | 37 (12.3%) | $0 |
| 6-Person Families | 0 (0.0%) | $0 |
| 7+ Person Families | 0 (0.0%) | $0 |
| Total | 300 (100.0%) | $96,406 |
Family Income by Number of Earners in Wilmington
The median family income in Wilmington is $96,406, with families comprising 3+ earners (31) having the highest median family income of $137,083, while families with no earners (65) have the lowest median family income of $47,083, accounting for 10.3% and 21.7% of families, respectively.
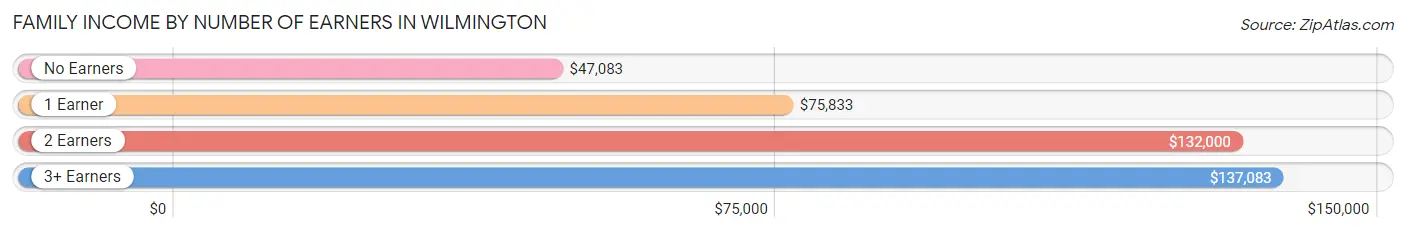
| Number of Earners | # Families | Median Income |
| No Earners | 65 (21.7%) | $47,083 |
| 1 Earner | 76 (25.3%) | $75,833 |
| 2 Earners | 128 (42.7%) | $132,000 |
| 3+ Earners | 31 (10.3%) | $137,083 |
| Total | 300 (100.0%) | $96,406 |
Household Income in Wilmington
Household Income Brackets in Wilmington
With 77 households falling in the category, the $150,000 to $199,999 income range is the most frequent in Wilmington, accounting for 18.5% of all households. In contrast, only 4 households (1.0%) fall into the $10,000 to $14,999 income bracket, making it the least populous group.
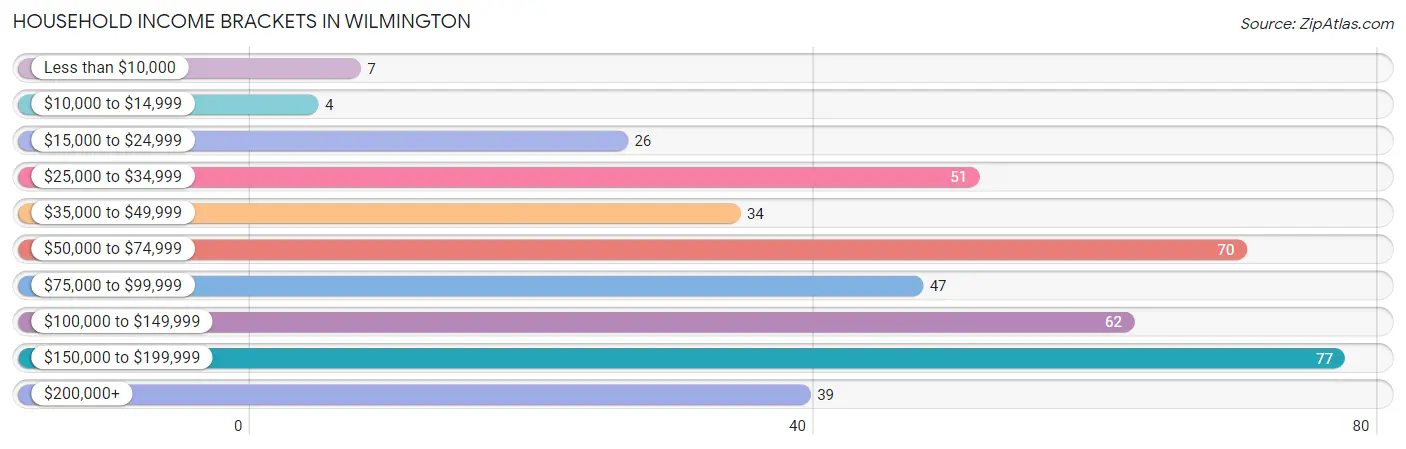
| Income Bracket | # Households | % Households |
| Less than $10,000 | 7 | 1.7% |
| $10,000 to $14,999 | 4 | 1.0% |
| $15,000 to $24,999 | 26 | 6.2% |
| $25,000 to $34,999 | 51 | 12.2% |
| $35,000 to $49,999 | 34 | 8.2% |
| $50,000 to $74,999 | 70 | 16.8% |
| $75,000 to $99,999 | 47 | 11.3% |
| $100,000 to $149,999 | 62 | 14.9% |
| $150,000 to $199,999 | 77 | 18.5% |
| $200,000+ | 39 | 9.4% |
Household Income by Householder Age in Wilmington
The median household income in Wilmington is $83,750, with the highest median household income of $116,875 found in the 45 to 64 years age bracket for the primary householder. A total of 140 households (33.6%) fall into this category. Meanwhile, the 15 to 24 years age bracket for the primary householder has the lowest median household income of $0, with 6 households (1.4%) in this group.
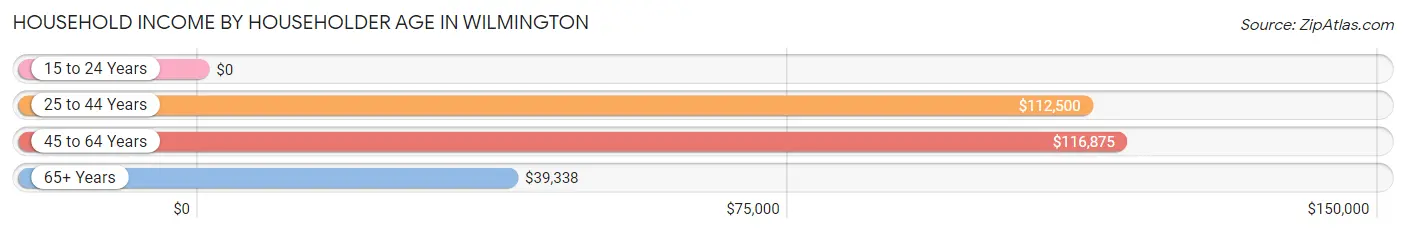
| Income Bracket | # Households | Median Income |
| 15 to 24 Years | 6 (1.4%) | $0 |
| 25 to 44 Years | 124 (29.7%) | $112,500 |
| 45 to 64 Years | 140 (33.6%) | $116,875 |
| 65+ Years | 147 (35.2%) | $39,338 |
| Total | 417 (100.0%) | $83,750 |
Poverty in Wilmington
Income Below Poverty by Sex and Age in Wilmington
With 3.5% poverty level for males and 3.2% for females among the residents of Wilmington, under 5 year old males and 18 to 24 year old females are the most vulnerable to poverty, with 5 males (38.5%) and 5 females (19.2%) in their respective age groups living below the poverty level.
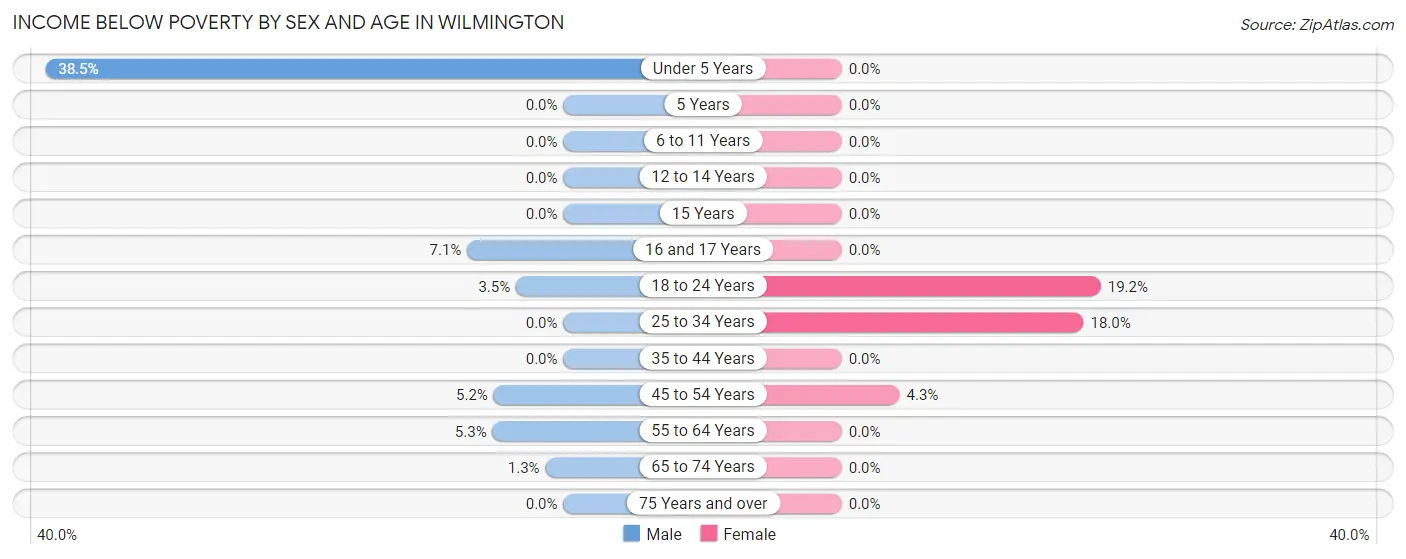
| Age Bracket | Male | Female |
| Under 5 Years | 5 (38.5%) | 0 (0.0%) |
| 5 Years | 0 (0.0%) | 0 (0.0%) |
| 6 to 11 Years | 0 (0.0%) | 0 (0.0%) |
| 12 to 14 Years | 0 (0.0%) | 0 (0.0%) |
| 15 Years | 0 (0.0%) | 0 (0.0%) |
| 16 and 17 Years | 1 (7.1%) | 0 (0.0%) |
| 18 to 24 Years | 2 (3.5%) | 5 (19.2%) |
| 25 to 34 Years | 0 (0.0%) | 7 (17.9%) |
| 35 to 44 Years | 0 (0.0%) | 0 (0.0%) |
| 45 to 54 Years | 3 (5.2%) | 3 (4.3%) |
| 55 to 64 Years | 4 (5.3%) | 0 (0.0%) |
| 65 to 74 Years | 1 (1.3%) | 0 (0.0%) |
| 75 Years and over | 0 (0.0%) | 0 (0.0%) |
| Total | 16 (3.5%) | 15 (3.2%) |
Income Above Poverty by Sex and Age in Wilmington
According to the poverty statistics in Wilmington, males aged 5 years and females aged under 5 years are the age groups that are most secure financially, with 100.0% of males and 100.0% of females in these age groups living above the poverty line.
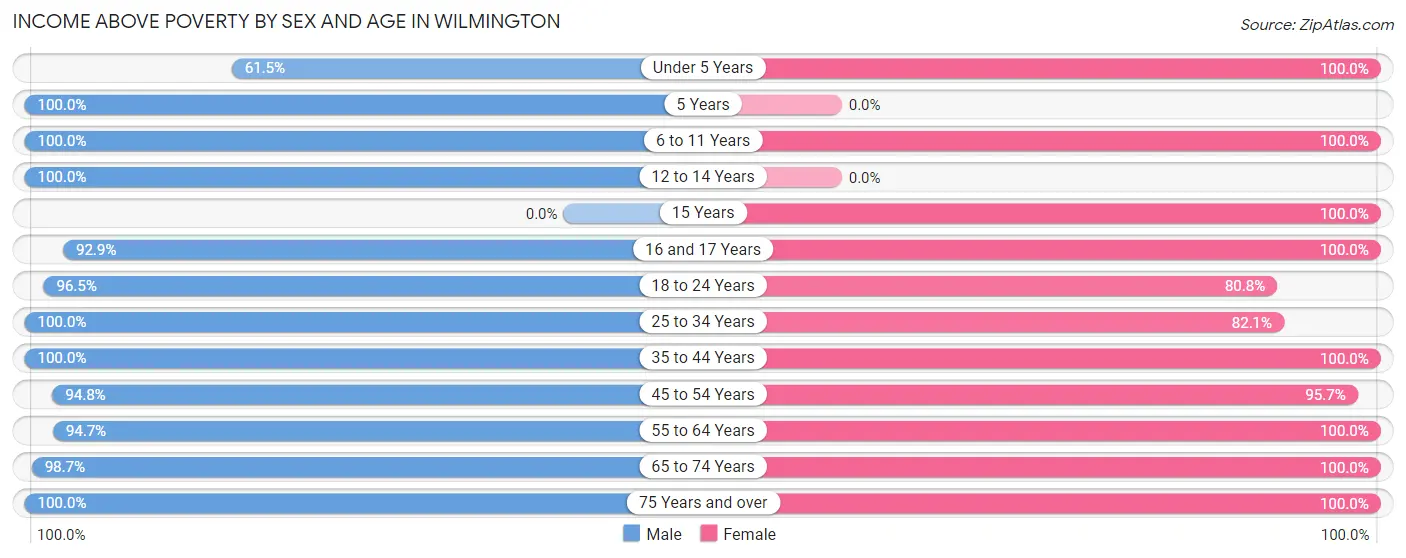
| Age Bracket | Male | Female |
| Under 5 Years | 8 (61.5%) | 5 (100.0%) |
| 5 Years | 2 (100.0%) | 0 (0.0%) |
| 6 to 11 Years | 2 (100.0%) | 38 (100.0%) |
| 12 to 14 Years | 4 (100.0%) | 0 (0.0%) |
| 15 Years | 0 (0.0%) | 9 (100.0%) |
| 16 and 17 Years | 13 (92.9%) | 17 (100.0%) |
| 18 to 24 Years | 55 (96.5%) | 21 (80.8%) |
| 25 to 34 Years | 37 (100.0%) | 32 (82.1%) |
| 35 to 44 Years | 79 (100.0%) | 72 (100.0%) |
| 45 to 54 Years | 55 (94.8%) | 67 (95.7%) |
| 55 to 64 Years | 72 (94.7%) | 49 (100.0%) |
| 65 to 74 Years | 74 (98.7%) | 73 (100.0%) |
| 75 Years and over | 44 (100.0%) | 72 (100.0%) |
| Total | 445 (96.5%) | 455 (96.8%) |
Income Below Poverty Among Married-Couple Families in Wilmington
The poverty statistics for married-couple families in Wilmington show that 1.4% or 3 of the total 219 families live below the poverty line. Families with no children have the highest poverty rate of 1.9%, comprising of 3 families. On the other hand, families with 1 or 2 children have the lowest poverty rate of 0.0%, which includes 0 families.
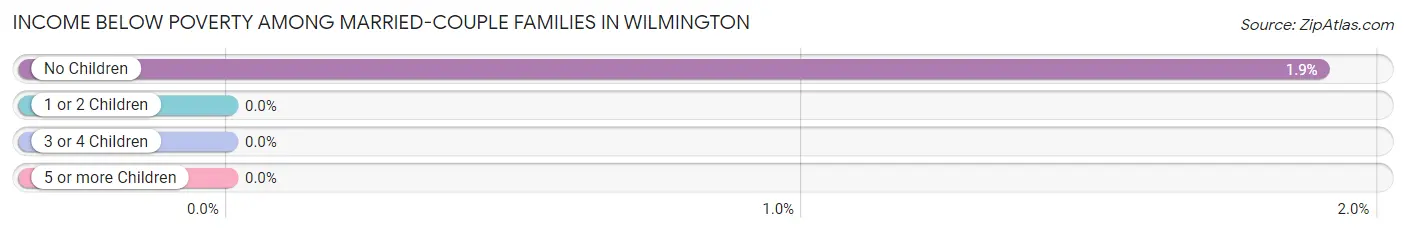
| Children | Above Poverty | Below Poverty |
| No Children | 155 (98.1%) | 3 (1.9%) |
| 1 or 2 Children | 61 (100.0%) | 0 (0.0%) |
| 3 or 4 Children | 0 (0.0%) | 0 (0.0%) |
| 5 or more Children | 0 (0.0%) | 0 (0.0%) |
| Total | 216 (98.6%) | 3 (1.4%) |
Income Below Poverty Among Single-Parent Households in Wilmington
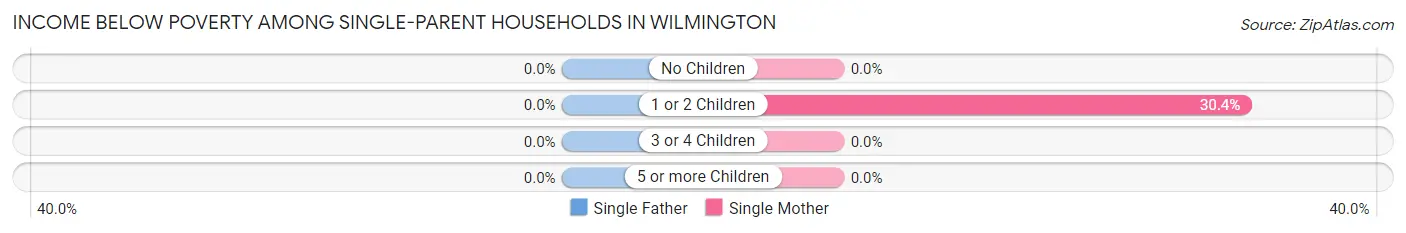
| Children | Single Father | Single Mother |
| No Children | 0 (0.0%) | 0 (0.0%) |
| 1 or 2 Children | 0 (0.0%) | 7 (30.4%) |
| 3 or 4 Children | 0 (0.0%) | 0 (0.0%) |
| 5 or more Children | 0 (0.0%) | 0 (0.0%) |
| Total | 0 (0.0%) | 7 (13.0%) |
Income Below Poverty Among Married-Couple vs Single-Parent Households in Wilmington
The poverty data for Wilmington shows that 3 of the married-couple family households (1.4%) and 7 of the single-parent households (8.6%) are living below the poverty level. Within the married-couple family households, those with no children have the highest poverty rate, with 3 households (1.9%) falling below the poverty line. Among the single-parent households, those with 1 or 2 children have the highest poverty rate, with 7 household (25.0%) living below poverty.
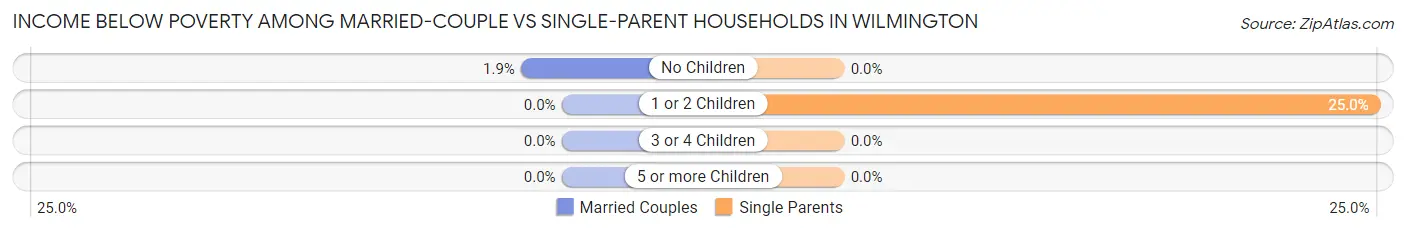
| Children | Married-Couple Families | Single-Parent Households |
| No Children | 3 (1.9%) | 0 (0.0%) |
| 1 or 2 Children | 0 (0.0%) | 7 (25.0%) |
| 3 or 4 Children | 0 (0.0%) | 0 (0.0%) |
| 5 or more Children | 0 (0.0%) | 0 (0.0%) |
| Total | 3 (1.4%) | 7 (8.6%) |
Race in Wilmington
The most populous races in Wilmington are White / Caucasian (910 | 97.7%), Hispanic or Latino (11 | 1.2%), and Native / Alaskan (7 | 0.7%).
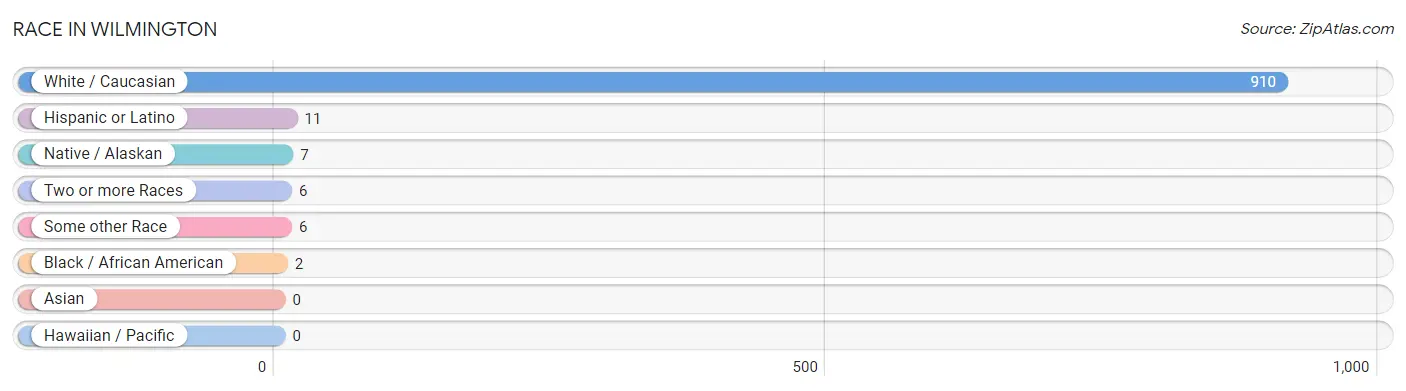
| Race | # Population | % Population |
| Asian | 0 | 0.0% |
| Black / African American | 2 | 0.2% |
| Hawaiian / Pacific | 0 | 0.0% |
| Hispanic or Latino | 11 | 1.2% |
| Native / Alaskan | 7 | 0.7% |
| White / Caucasian | 910 | 97.7% |
| Two or more Races | 6 | 0.6% |
| Some other Race | 6 | 0.6% |
| Total | 931 | 100.0% |
Ancestry in Wilmington
The most populous ancestries reported in Wilmington are English (160 | 17.2%), Irish (138 | 14.8%), Italian (125 | 13.4%), German (106 | 11.4%), and French (101 | 10.8%), together accounting for 67.7% of all Wilmington residents.
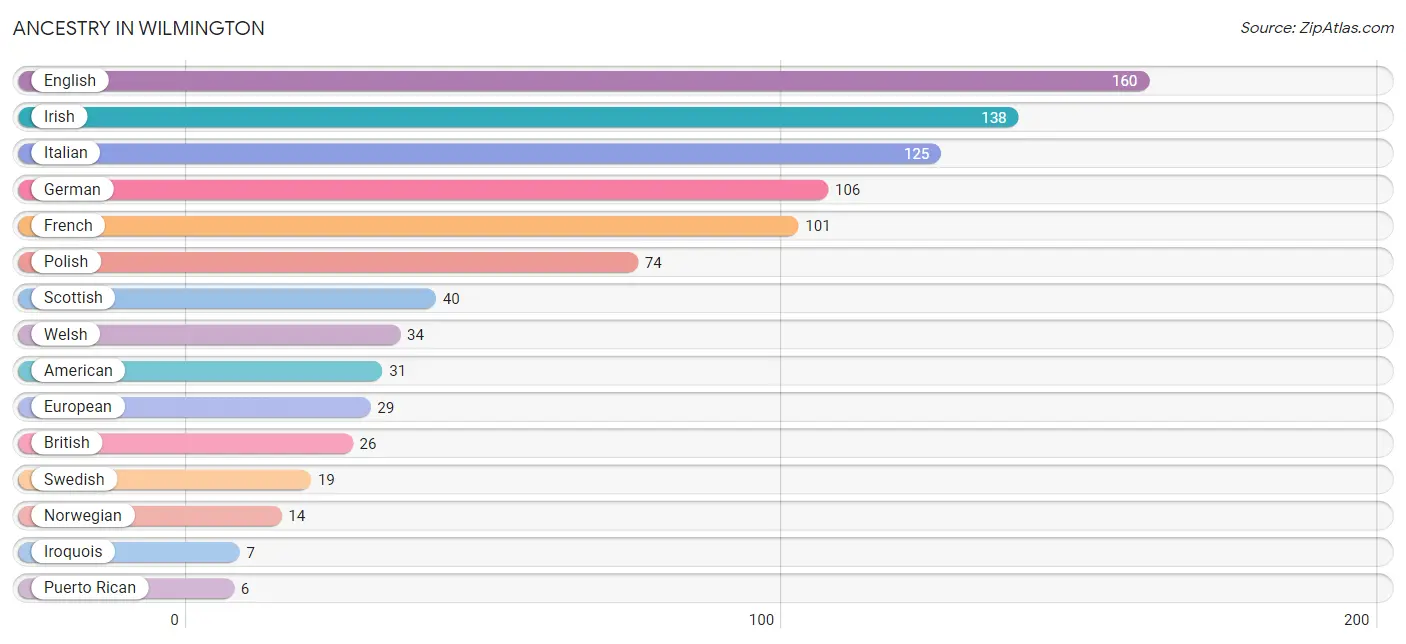
| Ancestry | # Population | % Population |
| American | 31 | 3.3% |
| British | 26 | 2.8% |
| Burmese | 4 | 0.4% |
| Dominican | 5 | 0.5% |
| Dutch | 5 | 0.5% |
| English | 160 | 17.2% |
| European | 29 | 3.1% |
| French | 101 | 10.8% |
| French Canadian | 4 | 0.4% |
| German | 106 | 11.4% |
| Irish | 138 | 14.8% |
| Iroquois | 7 | 0.7% |
| Italian | 125 | 13.4% |
| Lithuanian | 3 | 0.3% |
| Norwegian | 14 | 1.5% |
| Polish | 74 | 8.0% |
| Puerto Rican | 6 | 0.6% |
| Russian | 3 | 0.3% |
| Scotch-Irish | 4 | 0.4% |
| Scottish | 40 | 4.3% |
| South African | 1 | 0.1% |
| Subsaharan African | 1 | 0.1% |
| Swedish | 19 | 2.0% |
| Welsh | 34 | 3.6% | View All 24 Rows |
Immigrants in Wilmington
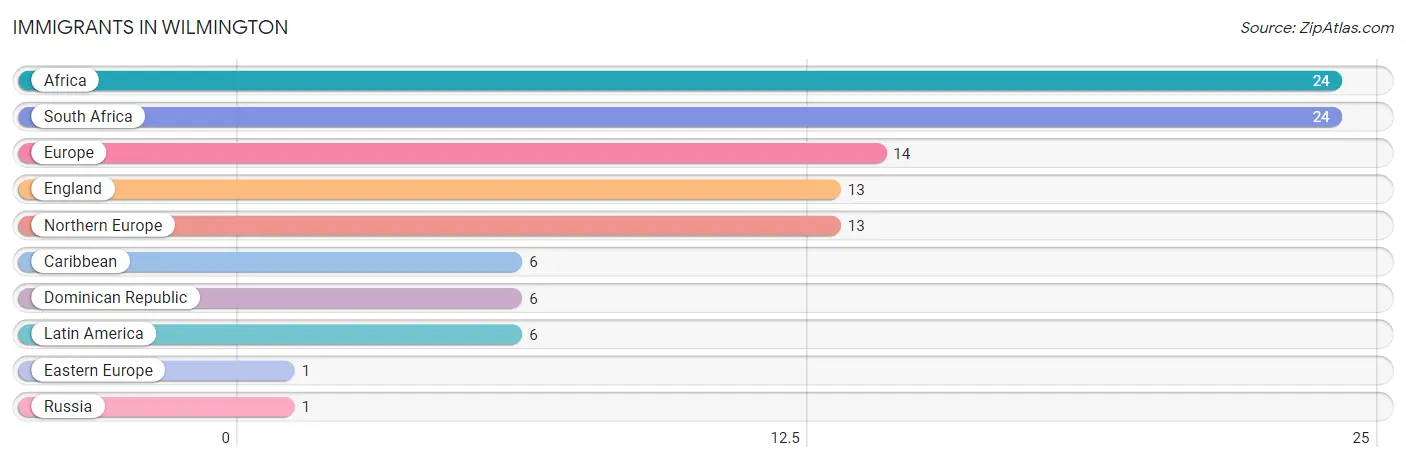
The most numerous immigrant groups reported in Wilmington came from Africa (24 | 2.6%), South Africa (24 | 2.6%), Europe (14 | 1.5%), England (13 | 1.4%), and Northern Europe (13 | 1.4%), together accounting for 9.5% of all Wilmington residents.
| Immigration Origin | # Population | % Population |
| Africa | 24 | 2.6% |
| Caribbean | 6 | 0.6% |
| Dominican Republic | 6 | 0.6% |
| Eastern Europe | 1 | 0.1% |
| England | 13 | 1.4% |
| Europe | 14 | 1.5% |
| Latin America | 6 | 0.6% |
| Northern Europe | 13 | 1.4% |
| Russia | 1 | 0.1% |
| South Africa | 24 | 2.6% | View All 10 Rows |
Sex and Age in Wilmington
Sex and Age in Wilmington
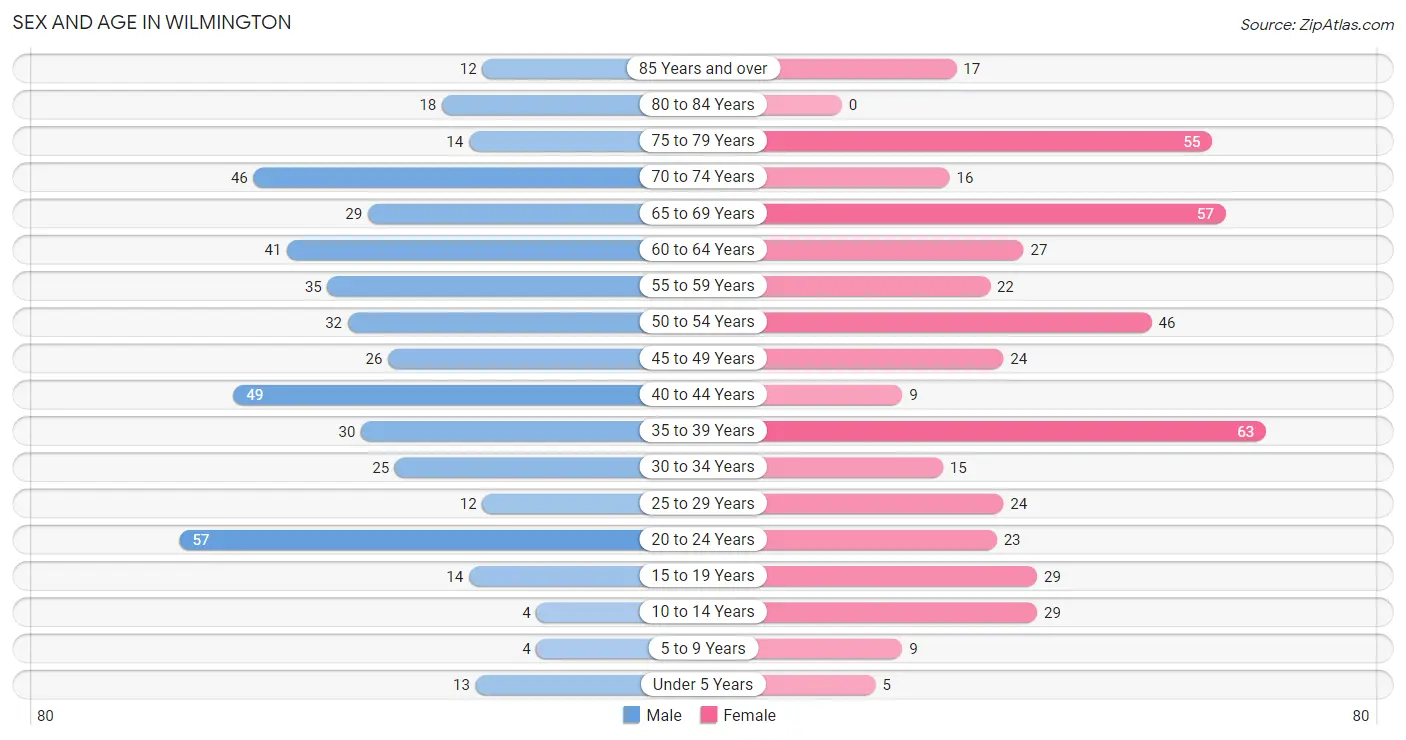
The most populous age groups in Wilmington are 20 to 24 Years (57 | 12.4%) for men and 35 to 39 Years (63 | 13.4%) for women.
| Age Bracket | Male | Female |
| Under 5 Years | 13 (2.8%) | 5 (1.1%) |
| 5 to 9 Years | 4 (0.9%) | 9 (1.9%) |
| 10 to 14 Years | 4 (0.9%) | 29 (6.2%) |
| 15 to 19 Years | 14 (3.0%) | 29 (6.2%) |
| 20 to 24 Years | 57 (12.4%) | 23 (4.9%) |
| 25 to 29 Years | 12 (2.6%) | 24 (5.1%) |
| 30 to 34 Years | 25 (5.4%) | 15 (3.2%) |
| 35 to 39 Years | 30 (6.5%) | 63 (13.4%) |
| 40 to 44 Years | 49 (10.6%) | 9 (1.9%) |
| 45 to 49 Years | 26 (5.6%) | 24 (5.1%) |
| 50 to 54 Years | 32 (6.9%) | 46 (9.8%) |
| 55 to 59 Years | 35 (7.6%) | 22 (4.7%) |
| 60 to 64 Years | 41 (8.9%) | 27 (5.7%) |
| 65 to 69 Years | 29 (6.3%) | 57 (12.1%) |
| 70 to 74 Years | 46 (10.0%) | 16 (3.4%) |
| 75 to 79 Years | 14 (3.0%) | 55 (11.7%) |
| 80 to 84 Years | 18 (3.9%) | 0 (0.0%) |
| 85 Years and over | 12 (2.6%) | 17 (3.6%) |
| Total | 461 (100.0%) | 470 (100.0%) |
Families and Households in Wilmington
Median Family Size in Wilmington
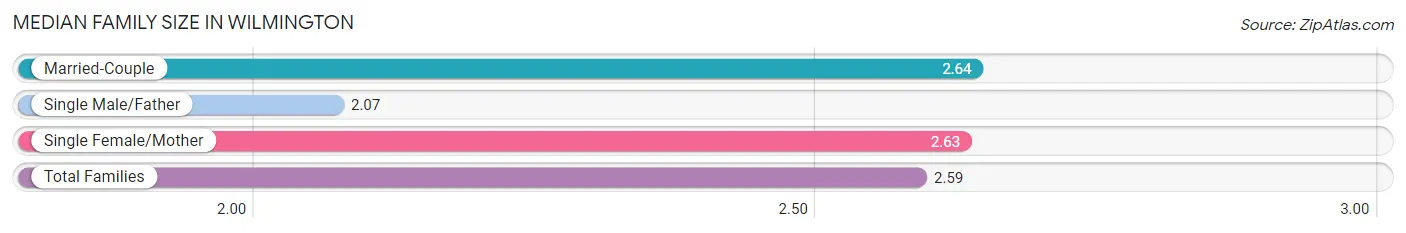
The median family size in Wilmington is 2.59 persons per family, with married-couple families (219 | 73.0%) accounting for the largest median family size of 2.64 persons per family. On the other hand, single male/father families (27 | 9.0%) represent the smallest median family size with 2.07 persons per family.
| Family Type | # Families | Family Size |
| Married-Couple | 219 (73.0%) | 2.64 |
| Single Male/Father | 27 (9.0%) | 2.07 |
| Single Female/Mother | 54 (18.0%) | 2.63 |
| Total Families | 300 (100.0%) | 2.59 |
Median Household Size in Wilmington
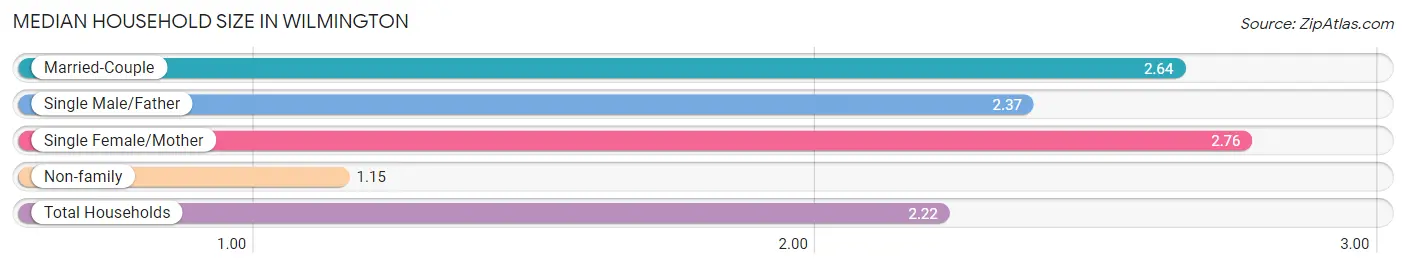
The median household size in Wilmington is 2.22 persons per household, with single female/mother households (54 | 13.0%) accounting for the largest median household size of 2.76 persons per household. non-family households (117 | 28.1%) represent the smallest median household size with 1.15 persons per household.
| Household Type | # Households | Household Size |
| Married-Couple | 219 (52.5%) | 2.64 |
| Single Male/Father | 27 (6.5%) | 2.37 |
| Single Female/Mother | 54 (13.0%) | 2.76 |
| Non-family | 117 (28.1%) | 1.15 |
| Total Households | 417 (100.0%) | 2.22 |
Household Size by Marriage Status in Wilmington
Out of a total of 417 households in Wilmington, 300 (71.9%) are family households, while 117 (28.1%) are nonfamily households. The most numerous type of family households are 2-person households, comprising 182, and the most common type of nonfamily households are 1-person households, comprising 99.
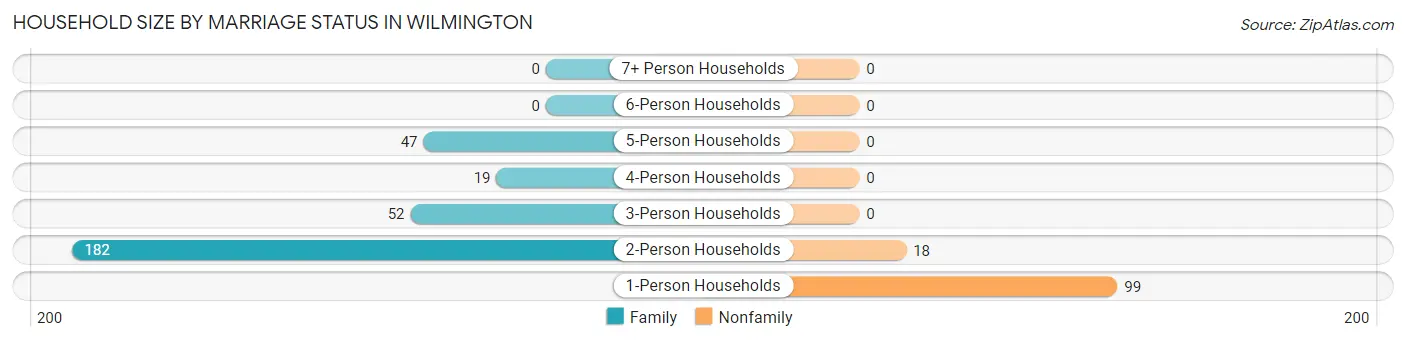
| Household Size | Family Households | Nonfamily Households |
| 1-Person Households | - | 99 (23.7%) |
| 2-Person Households | 182 (43.6%) | 18 (4.3%) |
| 3-Person Households | 52 (12.5%) | 0 (0.0%) |
| 4-Person Households | 19 (4.6%) | 0 (0.0%) |
| 5-Person Households | 47 (11.3%) | 0 (0.0%) |
| 6-Person Households | 0 (0.0%) | 0 (0.0%) |
| 7+ Person Households | 0 (0.0%) | 0 (0.0%) |
| Total | 300 (71.9%) | 117 (28.1%) |
Female Fertility in Wilmington
Fertility by Age in Wilmington
Average fertility rate in Wilmington is 29.0 births per 1,000 women. Women in the age bracket of 20 to 34 years have the highest fertility rate with 97.0 births per 1,000 women. Women in the age bracket of 20 to 34 years acount for 100.0% of all women with births.
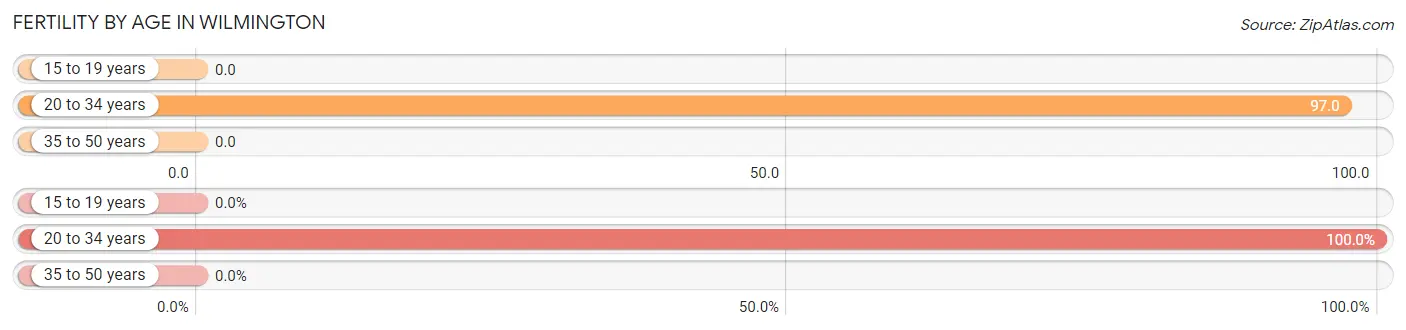
| Age Bracket | Women with Births | Births / 1,000 Women |
| 15 to 19 years | 0 (0.0%) | 0.0 |
| 20 to 34 years | 6 (100.0%) | 97.0 |
| 35 to 50 years | 0 (0.0%) | 0.0 |
| Total | 6 (100.0%) | 29.0 |
Fertility by Age by Marriage Status in Wilmington
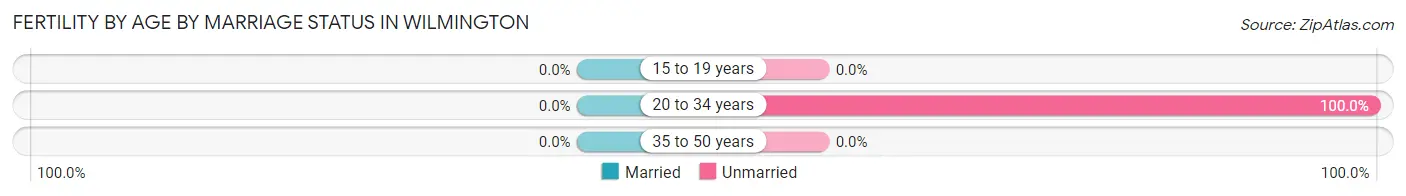
| Age Bracket | Married | Unmarried |
| 15 to 19 years | 0 (0.0%) | 0 (0.0%) |
| 20 to 34 years | 0 (0.0%) | 6 (100.0%) |
| 35 to 50 years | 0 (0.0%) | 0 (0.0%) |
| Total | 0 (0.0%) | 6 (100.0%) |
Fertility by Education in Wilmington
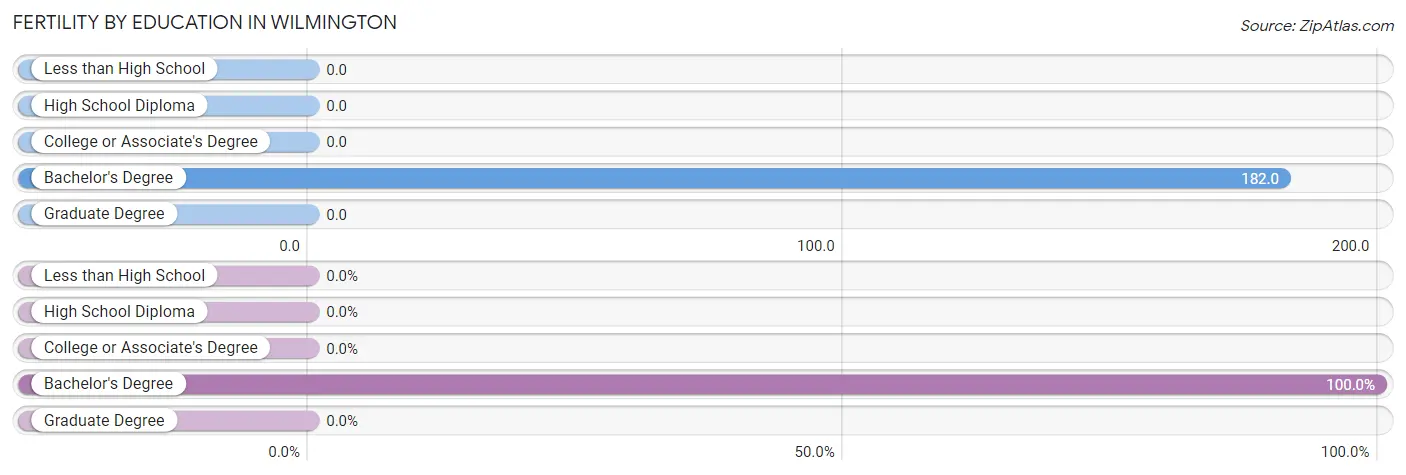
| Educational Attainment | Women with Births | Births / 1,000 Women |
| Less than High School | 0 (0.0%) | 0.0 |
| High School Diploma | 0 (0.0%) | 0.0 |
| College or Associate's Degree | 0 (0.0%) | 0.0 |
| Bachelor's Degree | 6 (100.0%) | 182.0 |
| Graduate Degree | 0 (0.0%) | 0.0 |
| Total | 6 (100.0%) | 29.0 |
Fertility by Education by Marriage Status in Wilmington
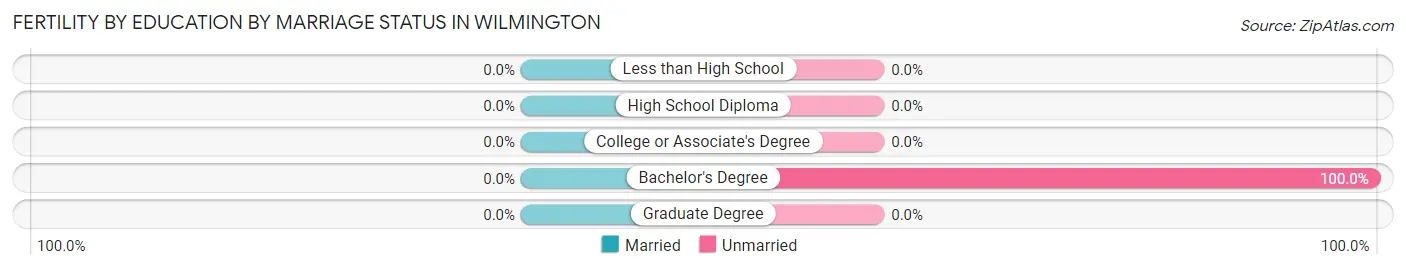
| Educational Attainment | Married | Unmarried |
| Less than High School | 0 (0.0%) | 0 (0.0%) |
| High School Diploma | 0 (0.0%) | 0 (0.0%) |
| College or Associate's Degree | 0 (0.0%) | 0 (0.0%) |
| Bachelor's Degree | 0 (0.0%) | 6 (100.0%) |
| Graduate Degree | 0 (0.0%) | 0 (0.0%) |
| Total | 0 (0.0%) | 6 (100.0%) |
Employment Characteristics in Wilmington
Employment by Class of Employer in Wilmington
Among the 520 employed individuals in Wilmington, private company employees (214 | 41.1%), local government employees (101 | 19.4%), and self-employed (not incorporated) (65 | 12.5%) make up the most common classes of employment.
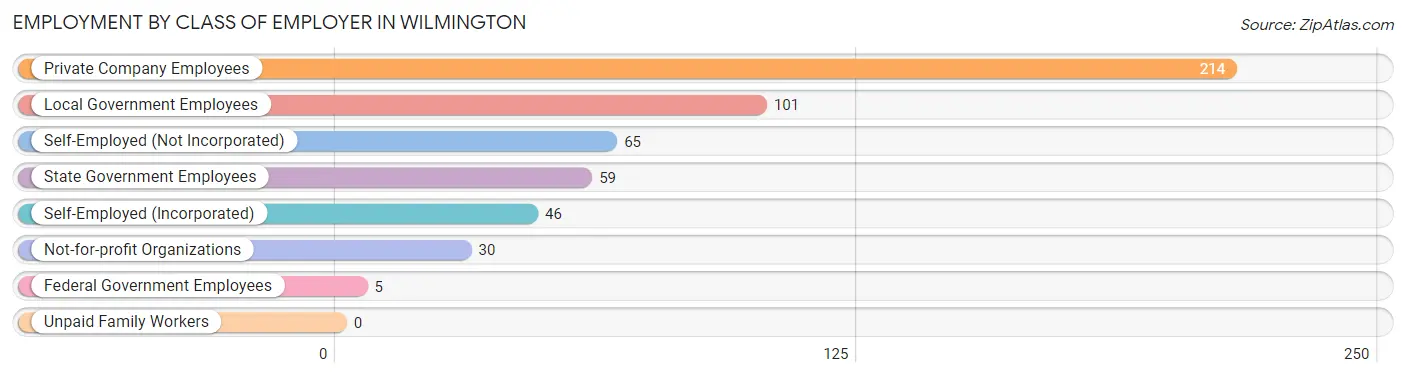
| Employer Class | # Employees | % Employees |
| Private Company Employees | 214 | 41.1% |
| Self-Employed (Incorporated) | 46 | 8.8% |
| Self-Employed (Not Incorporated) | 65 | 12.5% |
| Not-for-profit Organizations | 30 | 5.8% |
| Local Government Employees | 101 | 19.4% |
| State Government Employees | 59 | 11.4% |
| Federal Government Employees | 5 | 1.0% |
| Unpaid Family Workers | 0 | 0.0% |
| Total | 520 | 100.0% |
Employment Status by Age in Wilmington
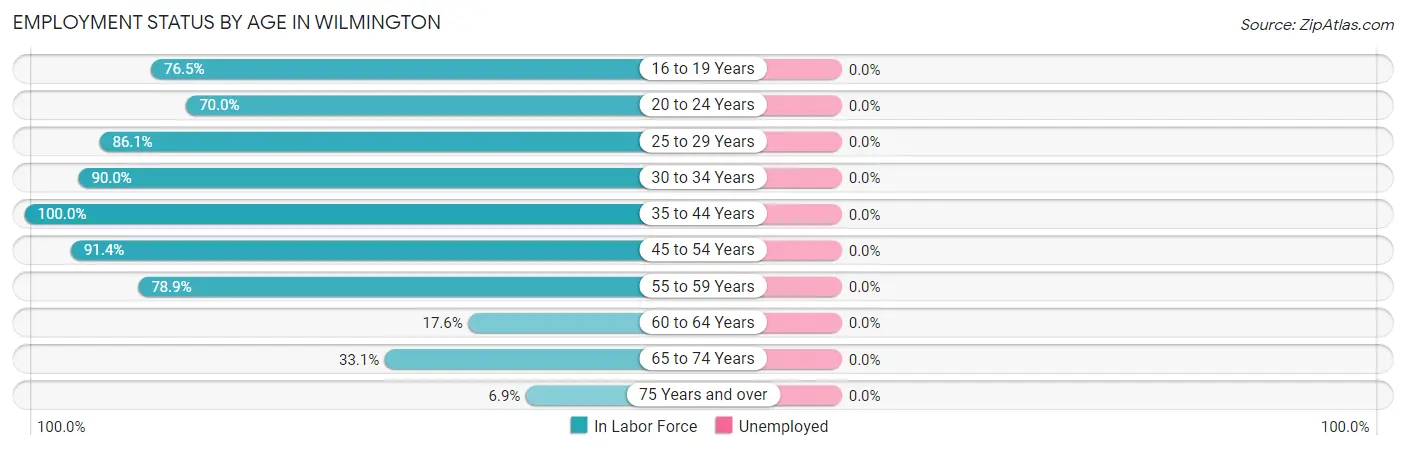
| Age Bracket | In Labor Force | Unemployed |
| 16 to 19 Years | 26 (76.5%) | 0 (0.0%) |
| 20 to 24 Years | 56 (70.0%) | 0 (0.0%) |
| 25 to 29 Years | 31 (86.1%) | 0 (0.0%) |
| 30 to 34 Years | 36 (90.0%) | 0 (0.0%) |
| 35 to 44 Years | 151 (100.0%) | 0 (0.0%) |
| 45 to 54 Years | 117 (91.4%) | 0 (0.0%) |
| 55 to 59 Years | 45 (78.9%) | 0 (0.0%) |
| 60 to 64 Years | 12 (17.6%) | 0 (0.0%) |
| 65 to 74 Years | 49 (33.1%) | 0 (0.0%) |
| 75 Years and over | 8 (6.9%) | 0 (0.0%) |
| Total | 531 (61.9%) | 0 (0.0%) |
Employment Status by Educational Attainment in Wilmington
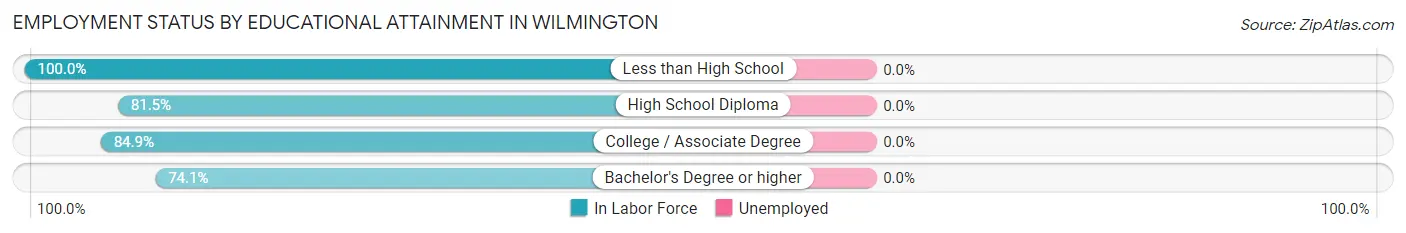
| Educational Attainment | In Labor Force | Unemployed |
| Less than High School | 26 (100.0%) | 0 (0.0%) |
| High School Diploma | 106 (81.5%) | 0 (0.0%) |
| College / Associate Degree | 157 (84.9%) | 0 (0.0%) |
| Bachelor's Degree or higher | 103 (74.1%) | 0 (0.0%) |
| Total | 392 (81.7%) | 0 (0.0%) |
Employment Occupations by Sex in Wilmington
Management, Business, Science and Arts Occupations
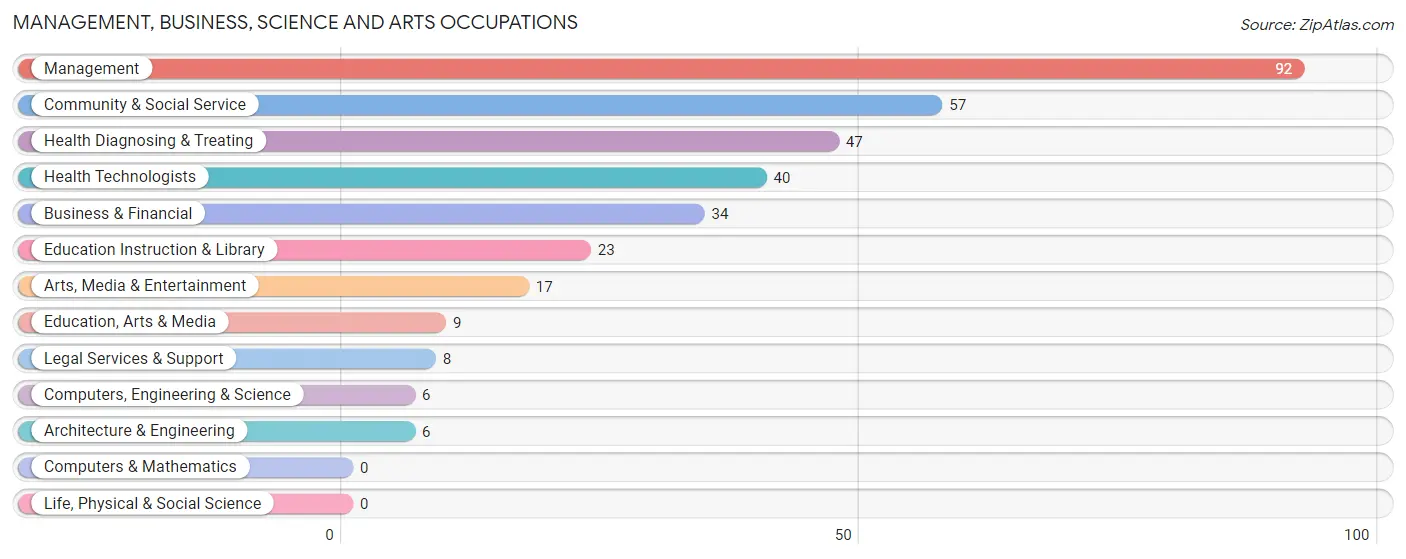
The most common Management, Business, Science and Arts occupations in Wilmington are Management (92 | 17.3%), Community & Social Service (57 | 10.7%), Health Diagnosing & Treating (47 | 8.8%), Health Technologists (40 | 7.5%), and Business & Financial (34 | 6.4%).
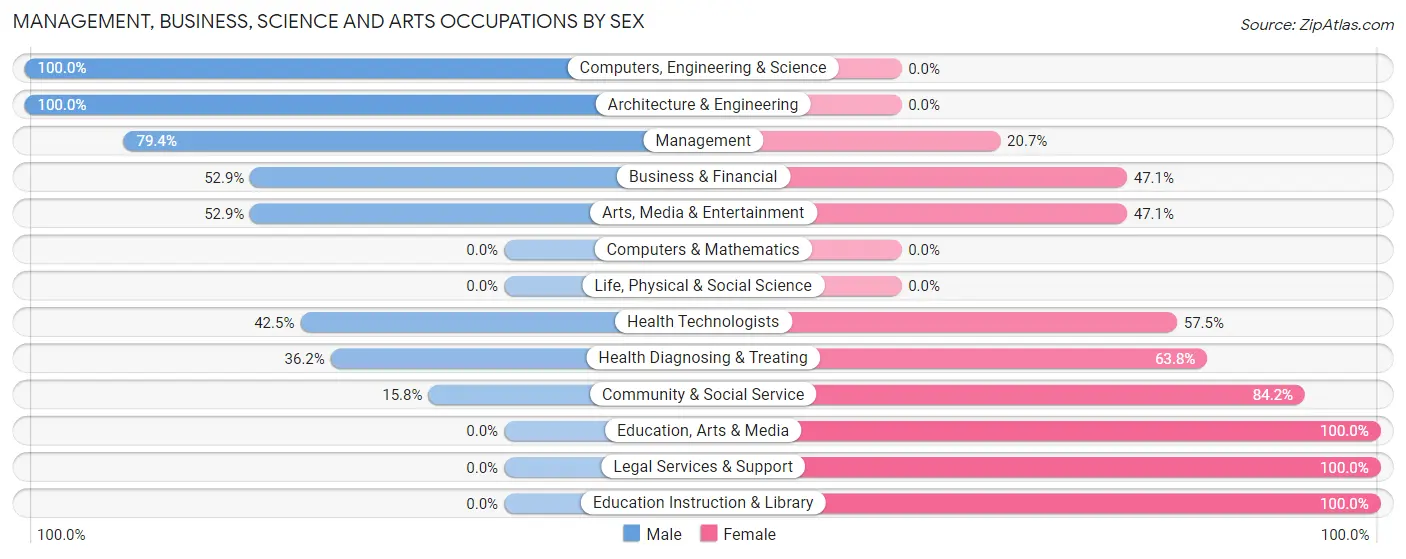
Management, Business, Science and Arts Occupations by Sex
Within the Management, Business, Science and Arts occupations in Wilmington, the most male-oriented occupations are Computers, Engineering & Science (100.0%), Architecture & Engineering (100.0%), and Management (79.3%), while the most female-oriented occupations are Education, Arts & Media (100.0%), Legal Services & Support (100.0%), and Education Instruction & Library (100.0%).
| Occupation | Male | Female |
| Management | 73 (79.3%) | 19 (20.6%) |
| Business & Financial | 18 (52.9%) | 16 (47.1%) |
| Computers, Engineering & Science | 6 (100.0%) | 0 (0.0%) |
| Computers & Mathematics | 0 (0.0%) | 0 (0.0%) |
| Architecture & Engineering | 6 (100.0%) | 0 (0.0%) |
| Life, Physical & Social Science | 0 (0.0%) | 0 (0.0%) |
| Community & Social Service | 9 (15.8%) | 48 (84.2%) |
| Education, Arts & Media | 0 (0.0%) | 9 (100.0%) |
| Legal Services & Support | 0 (0.0%) | 8 (100.0%) |
| Education Instruction & Library | 0 (0.0%) | 23 (100.0%) |
| Arts, Media & Entertainment | 9 (52.9%) | 8 (47.1%) |
| Health Diagnosing & Treating | 17 (36.2%) | 30 (63.8%) |
| Health Technologists | 17 (42.5%) | 23 (57.5%) |
| Total (Category) | 123 (52.1%) | 113 (47.9%) |
| Total (Overall) | 270 (50.8%) | 261 (49.1%) |
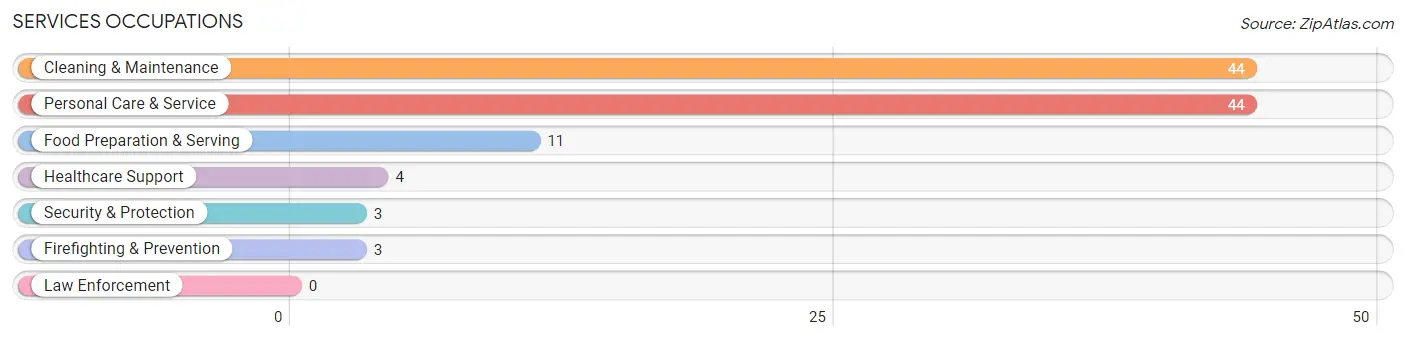
Services Occupations
The most common Services occupations in Wilmington are Cleaning & Maintenance (44 | 8.3%), Personal Care & Service (44 | 8.3%), Food Preparation & Serving (11 | 2.1%), Healthcare Support (4 | 0.7%), and Security & Protection (3 | 0.6%).
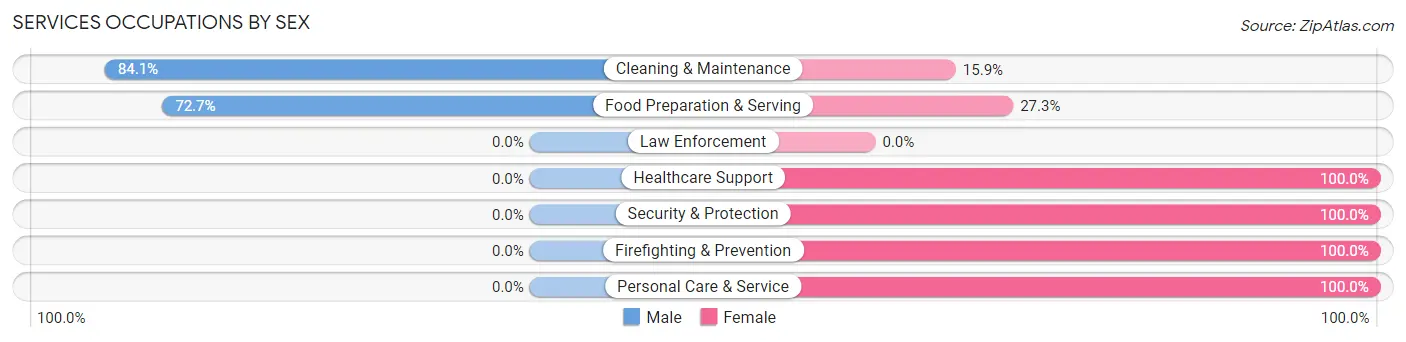
Services Occupations by Sex
Within the Services occupations in Wilmington, the most male-oriented occupations are Cleaning & Maintenance (84.1%), and Food Preparation & Serving (72.7%), while the most female-oriented occupations are Healthcare Support (100.0%), Security & Protection (100.0%), and Firefighting & Prevention (100.0%).
| Occupation | Male | Female |
| Healthcare Support | 0 (0.0%) | 4 (100.0%) |
| Security & Protection | 0 (0.0%) | 3 (100.0%) |
| Firefighting & Prevention | 0 (0.0%) | 3 (100.0%) |
| Law Enforcement | 0 (0.0%) | 0 (0.0%) |
| Food Preparation & Serving | 8 (72.7%) | 3 (27.3%) |
| Cleaning & Maintenance | 37 (84.1%) | 7 (15.9%) |
| Personal Care & Service | 0 (0.0%) | 44 (100.0%) |
| Total (Category) | 45 (42.4%) | 61 (57.6%) |
| Total (Overall) | 270 (50.8%) | 261 (49.1%) |
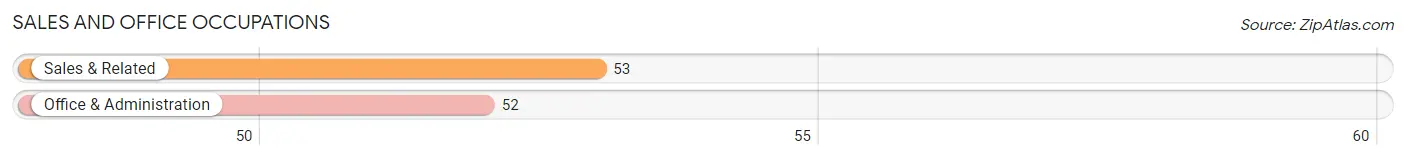
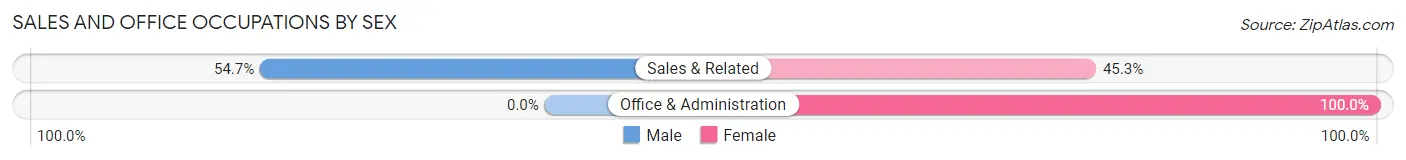
Sales and Office Occupations
The most common Sales and Office occupations in Wilmington are Sales & Related (53 | 10.0%), and Office & Administration (52 | 9.8%).
Sales and Office Occupations by Sex
| Occupation | Male | Female |
| Sales & Related | 29 (54.7%) | 24 (45.3%) |
| Office & Administration | 0 (0.0%) | 52 (100.0%) |
| Total (Category) | 29 (27.6%) | 76 (72.4%) |
| Total (Overall) | 270 (50.8%) | 261 (49.1%) |
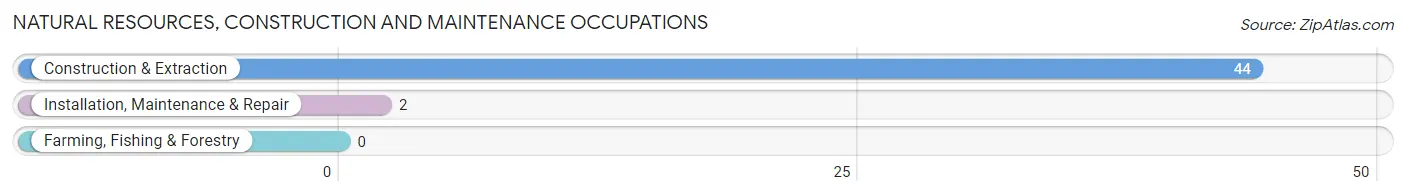
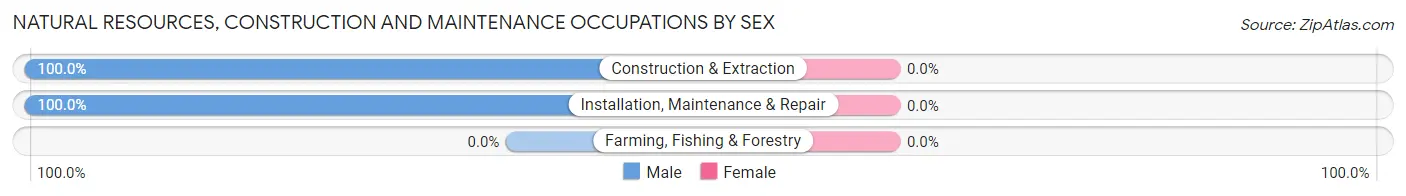
Natural Resources, Construction and Maintenance Occupations
The most common Natural Resources, Construction and Maintenance occupations in Wilmington are Construction & Extraction (44 | 8.3%), and Installation, Maintenance & Repair (2 | 0.4%).
Natural Resources, Construction and Maintenance Occupations by Sex
| Occupation | Male | Female |
| Farming, Fishing & Forestry | 0 (0.0%) | 0 (0.0%) |
| Construction & Extraction | 44 (100.0%) | 0 (0.0%) |
| Installation, Maintenance & Repair | 2 (100.0%) | 0 (0.0%) |
| Total (Category) | 46 (100.0%) | 0 (0.0%) |
| Total (Overall) | 270 (50.8%) | 261 (49.1%) |
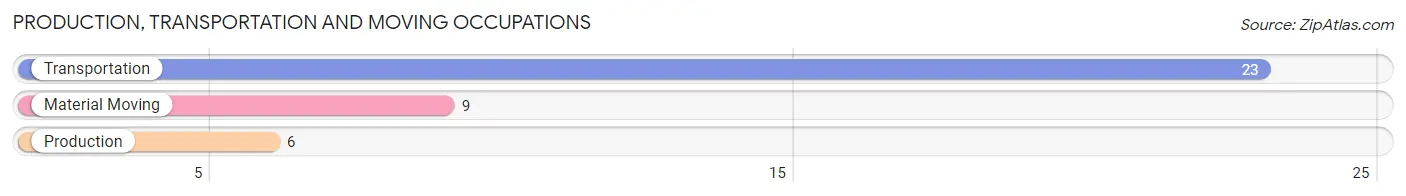
Production, Transportation and Moving Occupations
The most common Production, Transportation and Moving occupations in Wilmington are Transportation (23 | 4.3%), Material Moving (9 | 1.7%), and Production (6 | 1.1%).
Production, Transportation and Moving Occupations by Sex
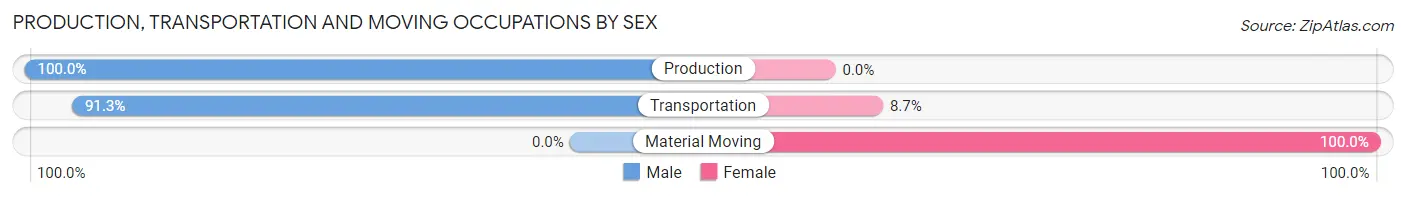
| Occupation | Male | Female |
| Production | 6 (100.0%) | 0 (0.0%) |
| Transportation | 21 (91.3%) | 2 (8.7%) |
| Material Moving | 0 (0.0%) | 9 (100.0%) |
| Total (Category) | 27 (71.1%) | 11 (28.9%) |
| Total (Overall) | 270 (50.8%) | 261 (49.1%) |
Employment Industries by Sex in Wilmington
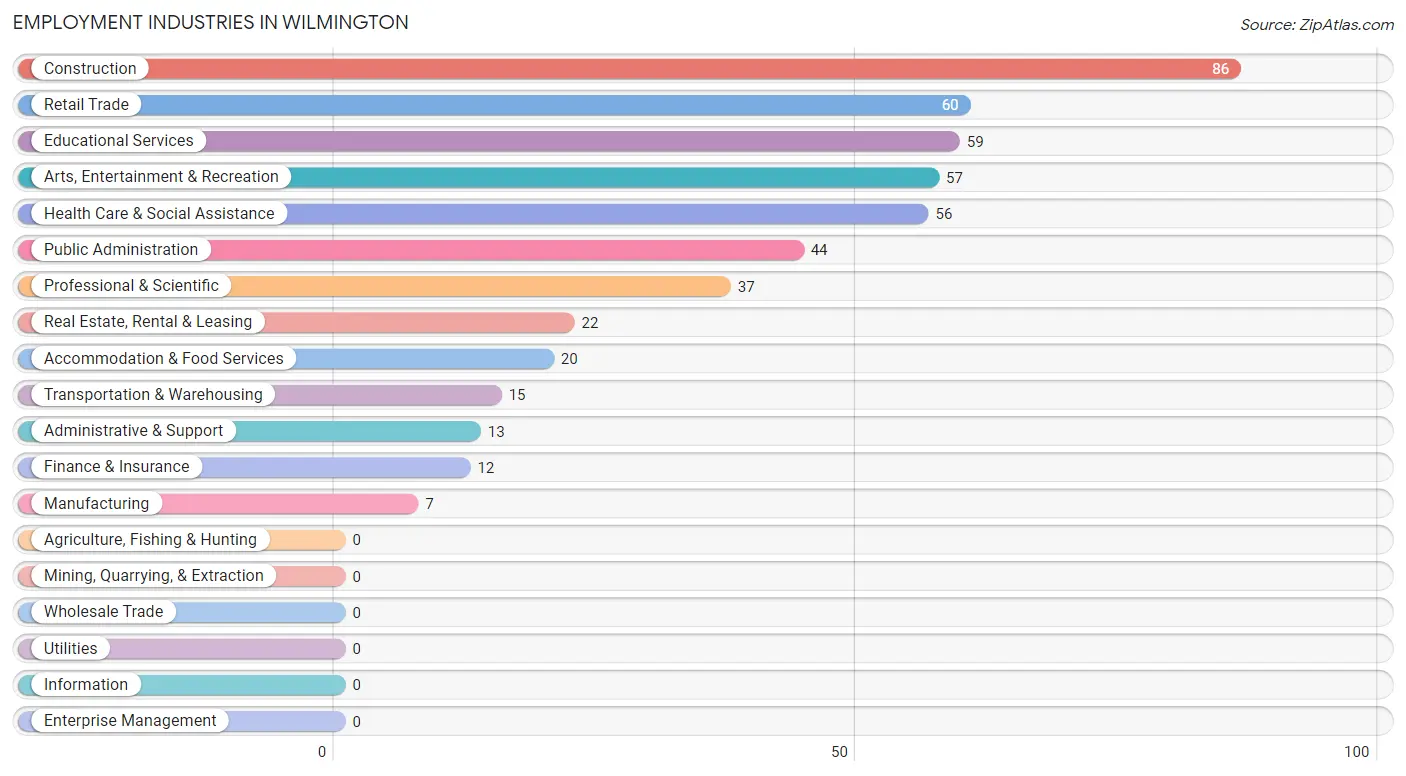
Employment Industries in Wilmington
The major employment industries in Wilmington include Construction (86 | 16.2%), Retail Trade (60 | 11.3%), Educational Services (59 | 11.1%), Arts, Entertainment & Recreation (57 | 10.7%), and Health Care & Social Assistance (56 | 10.5%).
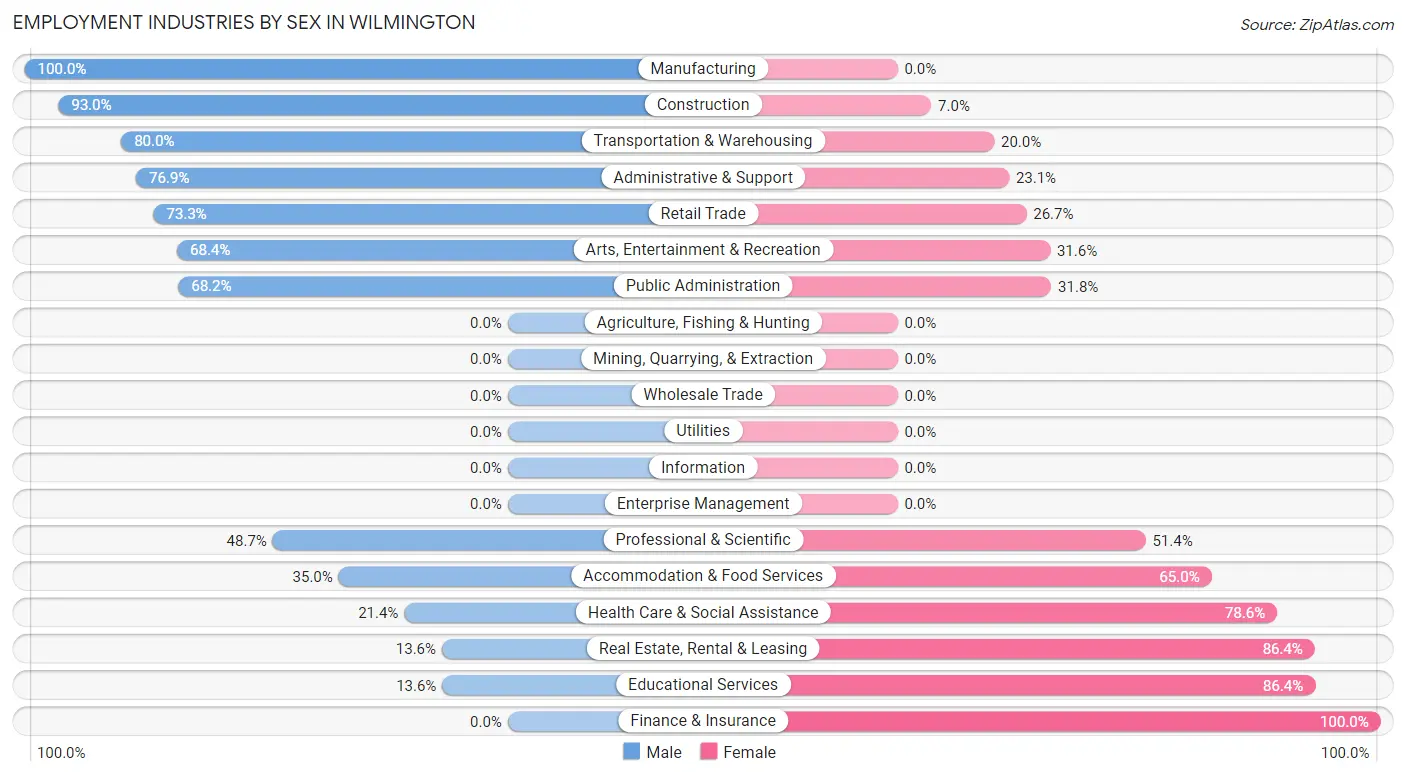
Employment Industries by Sex in Wilmington
The Wilmington industries that see more men than women are Manufacturing (100.0%), Construction (93.0%), and Transportation & Warehousing (80.0%), whereas the industries that tend to have a higher number of women are Finance & Insurance (100.0%), Educational Services (86.4%), and Real Estate, Rental & Leasing (86.4%).
| Industry | Male | Female |
| Agriculture, Fishing & Hunting | 0 (0.0%) | 0 (0.0%) |
| Mining, Quarrying, & Extraction | 0 (0.0%) | 0 (0.0%) |
| Construction | 80 (93.0%) | 6 (7.0%) |
| Manufacturing | 7 (100.0%) | 0 (0.0%) |
| Wholesale Trade | 0 (0.0%) | 0 (0.0%) |
| Retail Trade | 44 (73.3%) | 16 (26.7%) |
| Transportation & Warehousing | 12 (80.0%) | 3 (20.0%) |
| Utilities | 0 (0.0%) | 0 (0.0%) |
| Information | 0 (0.0%) | 0 (0.0%) |
| Finance & Insurance | 0 (0.0%) | 12 (100.0%) |
| Real Estate, Rental & Leasing | 3 (13.6%) | 19 (86.4%) |
| Professional & Scientific | 18 (48.6%) | 19 (51.3%) |
| Enterprise Management | 0 (0.0%) | 0 (0.0%) |
| Administrative & Support | 10 (76.9%) | 3 (23.1%) |
| Educational Services | 8 (13.6%) | 51 (86.4%) |
| Health Care & Social Assistance | 12 (21.4%) | 44 (78.6%) |
| Arts, Entertainment & Recreation | 39 (68.4%) | 18 (31.6%) |
| Accommodation & Food Services | 7 (35.0%) | 13 (65.0%) |
| Public Administration | 30 (68.2%) | 14 (31.8%) |
| Total | 270 (50.8%) | 261 (49.1%) |
Education in Wilmington
School Enrollment in Wilmington
The most common levels of schooling among the 106 students in Wilmington are high school (42 | 39.6%), middle school (33 | 31.1%), and college / undergraduate (15 | 14.1%).
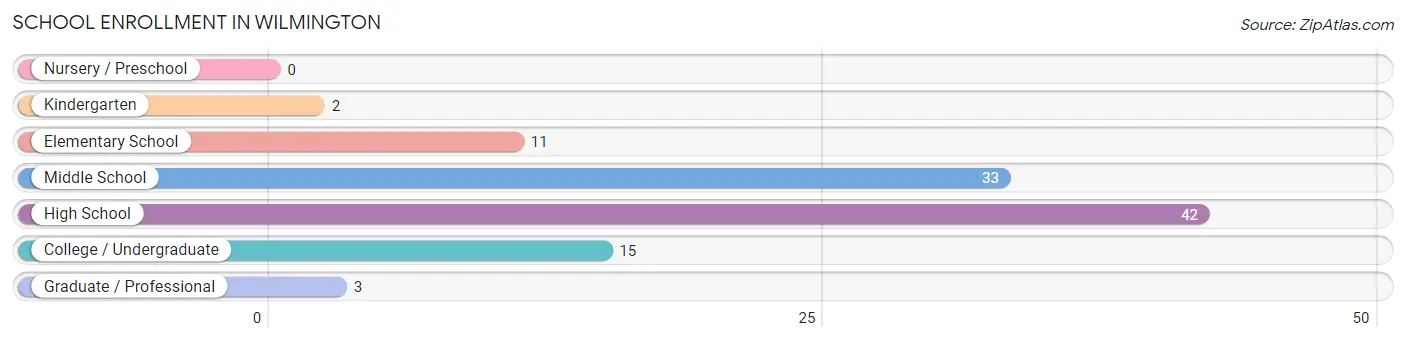
| School Level | # Students | % Students |
| Nursery / Preschool | 0 | 0.0% |
| Kindergarten | 2 | 1.9% |
| Elementary School | 11 | 10.4% |
| Middle School | 33 | 31.1% |
| High School | 42 | 39.6% |
| College / Undergraduate | 15 | 14.1% |
| Graduate / Professional | 3 | 2.8% |
| Total | 106 | 100.0% |
School Enrollment by Age by Funding Source in Wilmington
Out of a total of 106 students who are enrolled in schools in Wilmington, 7 (6.6%) attend a private institution, while the remaining 99 (93.4%) are enrolled in public schools. The age group of 20 to 24 year olds has the highest likelihood of being enrolled in private schools, with 4 (50.0% in the age bracket) enrolled. Conversely, the age group of 5 to 9 year old has the lowest likelihood of being enrolled in a private school, with 13 (100.0% in the age bracket) attending a public institution.
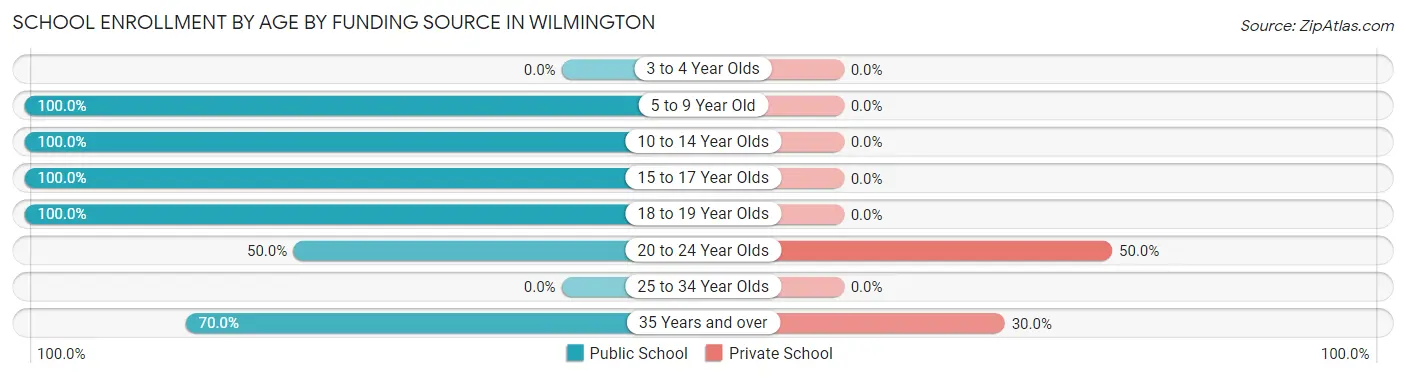
| Age Bracket | Public School | Private School |
| 3 to 4 Year Olds | 0 (0.0%) | 0 (0.0%) |
| 5 to 9 Year Old | 13 (100.0%) | 0 (0.0%) |
| 10 to 14 Year Olds | 33 (100.0%) | 0 (0.0%) |
| 15 to 17 Year Olds | 39 (100.0%) | 0 (0.0%) |
| 18 to 19 Year Olds | 3 (100.0%) | 0 (0.0%) |
| 20 to 24 Year Olds | 4 (50.0%) | 4 (50.0%) |
| 25 to 34 Year Olds | 0 (0.0%) | 0 (0.0%) |
| 35 Years and over | 7 (70.0%) | 3 (30.0%) |
| Total | 99 (93.4%) | 7 (6.6%) |
Educational Attainment by Field of Study in Wilmington
Business (52 | 21.2%), social sciences (26 | 10.6%), literature & languages (26 | 10.6%), psychology (24 | 9.8%), and visual & performing arts (21 | 8.6%) are the most common fields of study among 245 individuals in Wilmington who have obtained a bachelor's degree or higher.
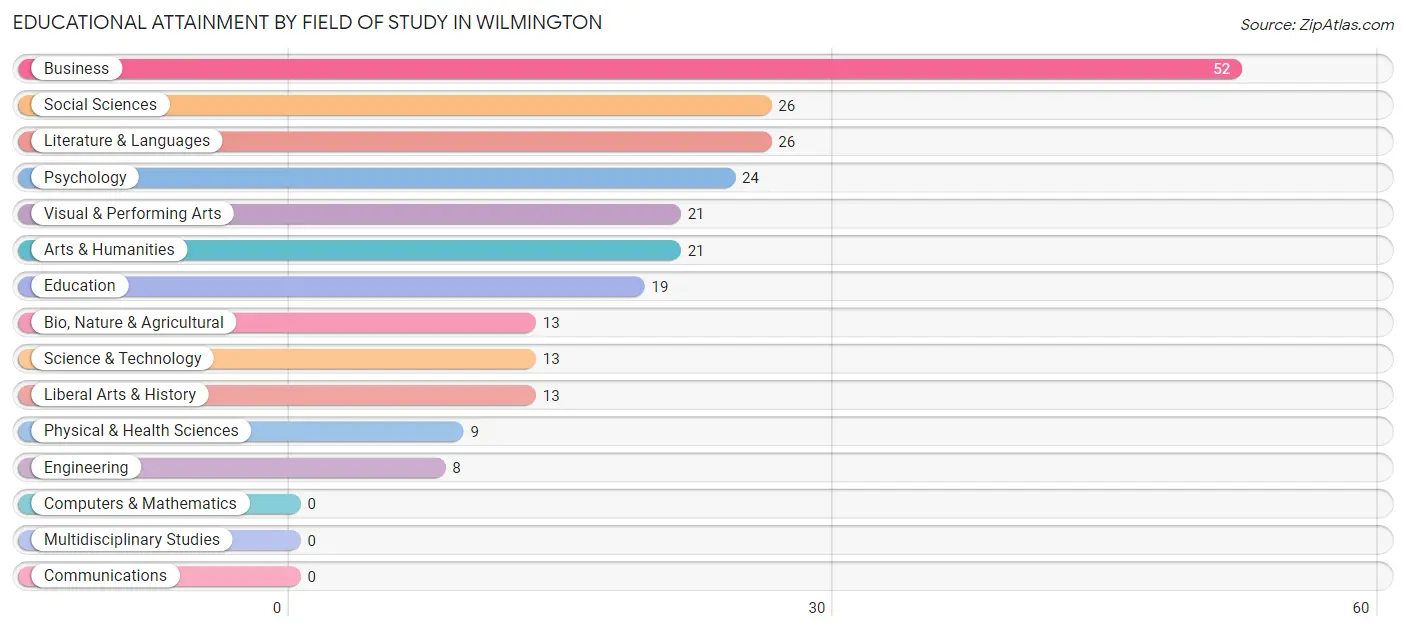
| Field of Study | # Graduates | % Graduates |
| Computers & Mathematics | 0 | 0.0% |
| Bio, Nature & Agricultural | 13 | 5.3% |
| Physical & Health Sciences | 9 | 3.7% |
| Psychology | 24 | 9.8% |
| Social Sciences | 26 | 10.6% |
| Engineering | 8 | 3.3% |
| Multidisciplinary Studies | 0 | 0.0% |
| Science & Technology | 13 | 5.3% |
| Business | 52 | 21.2% |
| Education | 19 | 7.8% |
| Literature & Languages | 26 | 10.6% |
| Liberal Arts & History | 13 | 5.3% |
| Visual & Performing Arts | 21 | 8.6% |
| Communications | 0 | 0.0% |
| Arts & Humanities | 21 | 8.6% |
| Total | 245 | 100.0% |
Transportation & Commute in Wilmington
Vehicle Availability by Sex in Wilmington
The most prevalent vehicle ownership categories in Wilmington are males with 2 vehicles (99, accounting for 38.5%) and females with 2 vehicles (105, making up 37.9%).
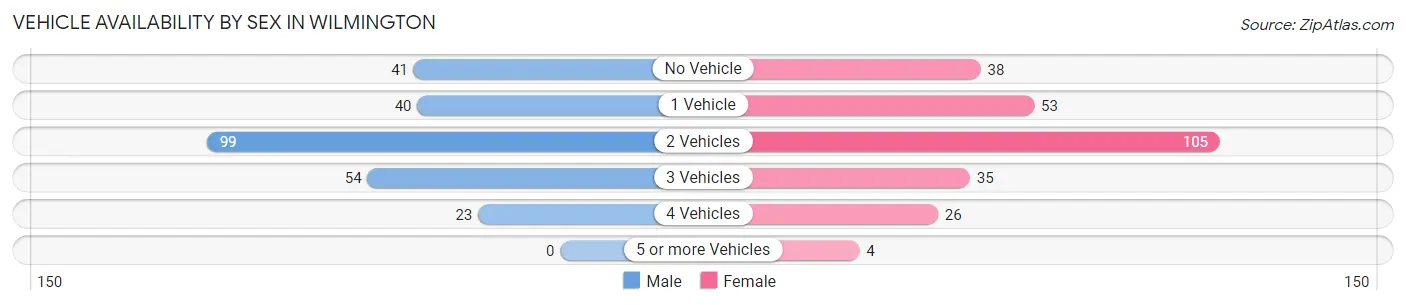
| Vehicles Available | Male | Female |
| No Vehicle | 41 (16.0%) | 38 (14.6%) |
| 1 Vehicle | 40 (15.6%) | 53 (20.3%) |
| 2 Vehicles | 99 (38.5%) | 105 (40.2%) |
| 3 Vehicles | 54 (21.0%) | 35 (13.4%) |
| 4 Vehicles | 23 (8.9%) | 26 (10.0%) |
| 5 or more Vehicles | 0 (0.0%) | 4 (1.5%) |
| Total | 257 (100.0%) | 261 (100.0%) |
Commute Time in Wilmington
The most frequently occuring commute durations in Wilmington are 20 to 24 minutes (106 commuters, 23.4%), 30 to 34 minutes (78 commuters, 17.2%), and 15 to 19 minutes (70 commuters, 15.4%).
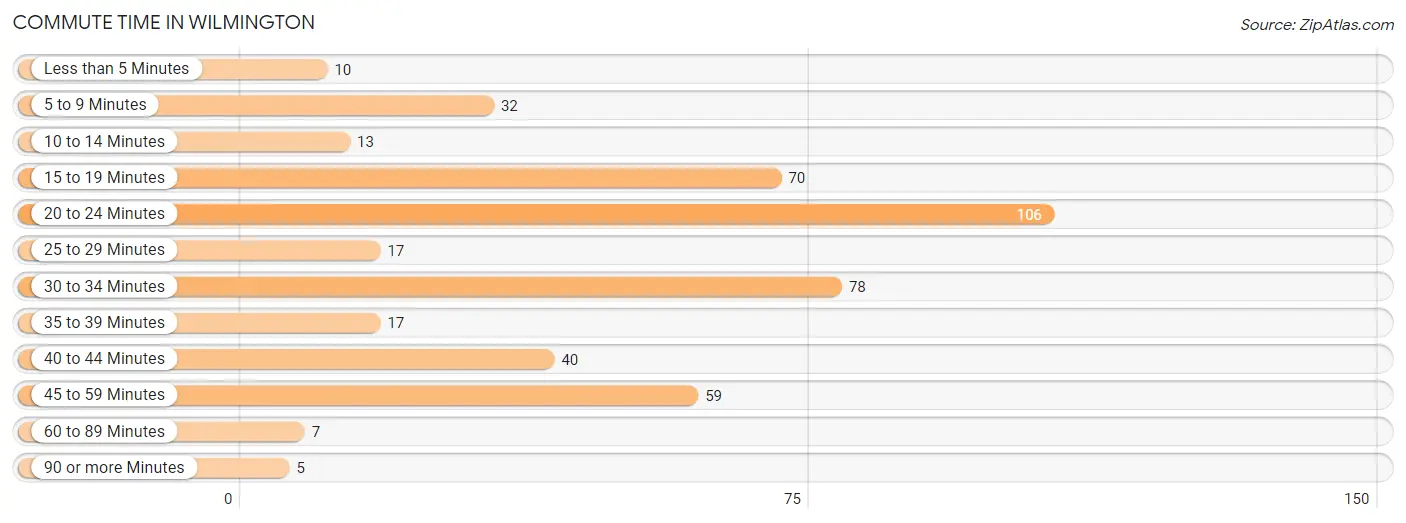
| Commute Time | # Commuters | % Commuters |
| Less than 5 Minutes | 10 | 2.2% |
| 5 to 9 Minutes | 32 | 7.0% |
| 10 to 14 Minutes | 13 | 2.9% |
| 15 to 19 Minutes | 70 | 15.4% |
| 20 to 24 Minutes | 106 | 23.4% |
| 25 to 29 Minutes | 17 | 3.7% |
| 30 to 34 Minutes | 78 | 17.2% |
| 35 to 39 Minutes | 17 | 3.7% |
| 40 to 44 Minutes | 40 | 8.8% |
| 45 to 59 Minutes | 59 | 13.0% |
| 60 to 89 Minutes | 7 | 1.5% |
| 90 or more Minutes | 5 | 1.1% |
Commute Time by Sex in Wilmington
The most common commute times in Wilmington are 30 to 34 minutes (53 commuters, 24.1%) for males and 20 to 24 minutes (94 commuters, 40.2%) for females.
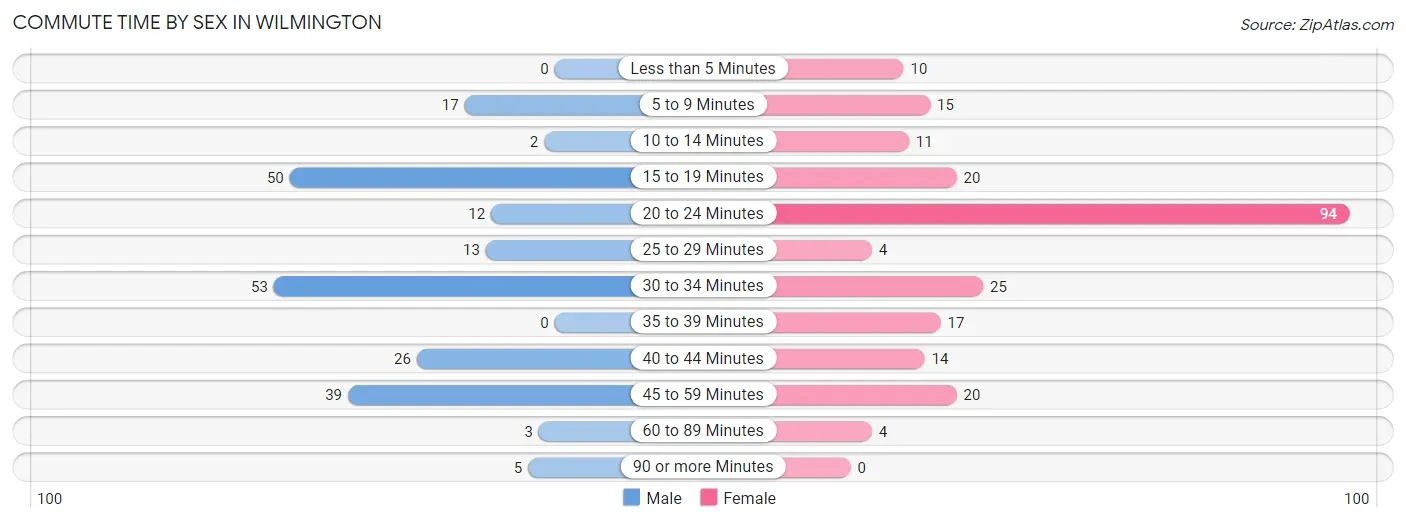
| Commute Time | Male | Female |
| Less than 5 Minutes | 0 (0.0%) | 10 (4.3%) |
| 5 to 9 Minutes | 17 (7.7%) | 15 (6.4%) |
| 10 to 14 Minutes | 2 (0.9%) | 11 (4.7%) |
| 15 to 19 Minutes | 50 (22.7%) | 20 (8.6%) |
| 20 to 24 Minutes | 12 (5.4%) | 94 (40.2%) |
| 25 to 29 Minutes | 13 (5.9%) | 4 (1.7%) |
| 30 to 34 Minutes | 53 (24.1%) | 25 (10.7%) |
| 35 to 39 Minutes | 0 (0.0%) | 17 (7.3%) |
| 40 to 44 Minutes | 26 (11.8%) | 14 (6.0%) |
| 45 to 59 Minutes | 39 (17.7%) | 20 (8.6%) |
| 60 to 89 Minutes | 3 (1.4%) | 4 (1.7%) |
| 90 or more Minutes | 5 (2.3%) | 0 (0.0%) |
Time of Departure to Work by Sex in Wilmington
The most frequent times of departure to work in Wilmington are 5:30 AM to 5:59 AM (48, 21.8%) for males and 7:00 AM to 7:29 AM (105, 44.9%) for females.
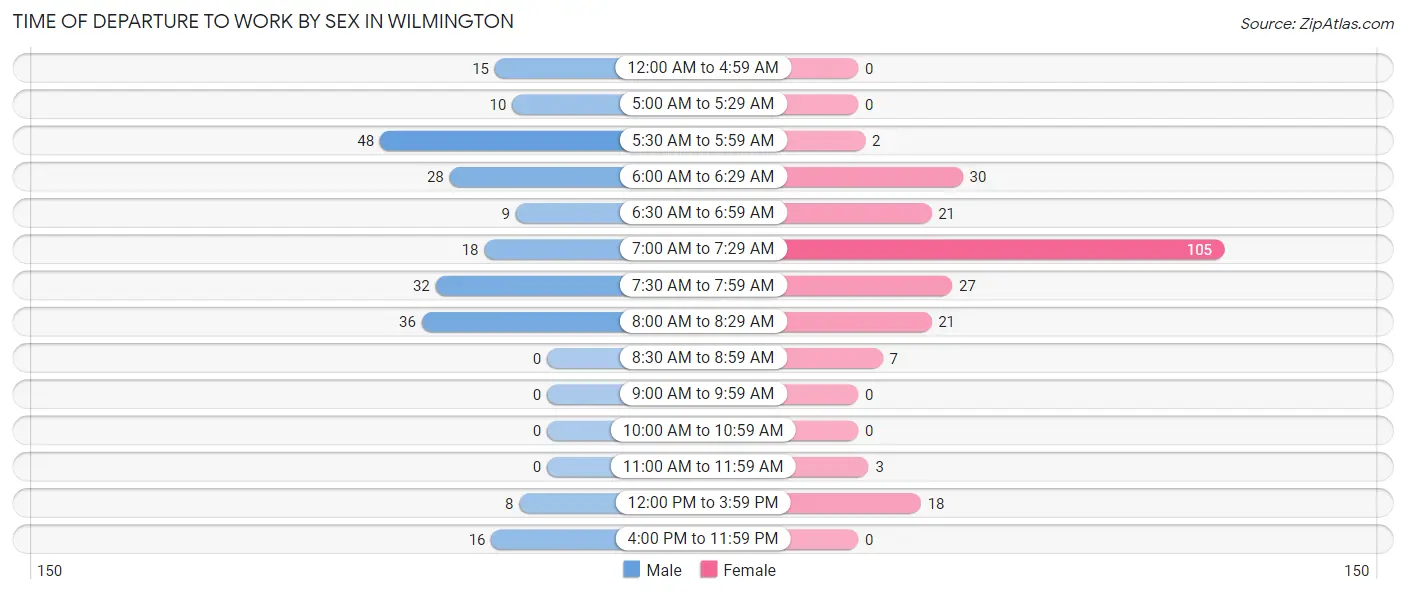
| Time of Departure | Male | Female |
| 12:00 AM to 4:59 AM | 15 (6.8%) | 0 (0.0%) |
| 5:00 AM to 5:29 AM | 10 (4.5%) | 0 (0.0%) |
| 5:30 AM to 5:59 AM | 48 (21.8%) | 2 (0.9%) |
| 6:00 AM to 6:29 AM | 28 (12.7%) | 30 (12.8%) |
| 6:30 AM to 6:59 AM | 9 (4.1%) | 21 (9.0%) |
| 7:00 AM to 7:29 AM | 18 (8.2%) | 105 (44.9%) |
| 7:30 AM to 7:59 AM | 32 (14.5%) | 27 (11.5%) |
| 8:00 AM to 8:29 AM | 36 (16.4%) | 21 (9.0%) |
| 8:30 AM to 8:59 AM | 0 (0.0%) | 7 (3.0%) |
| 9:00 AM to 9:59 AM | 0 (0.0%) | 0 (0.0%) |
| 10:00 AM to 10:59 AM | 0 (0.0%) | 0 (0.0%) |
| 11:00 AM to 11:59 AM | 0 (0.0%) | 3 (1.3%) |
| 12:00 PM to 3:59 PM | 8 (3.6%) | 18 (7.7%) |
| 4:00 PM to 11:59 PM | 16 (7.3%) | 0 (0.0%) |
| Total | 220 (100.0%) | 234 (100.0%) |
Housing Occupancy in Wilmington
Occupancy by Ownership in Wilmington
Of the total 417 dwellings in Wilmington, owner-occupied units account for 355 (85.1%), while renter-occupied units make up 62 (14.9%).
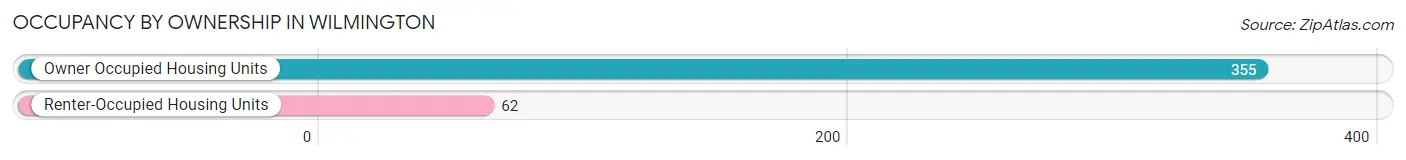
| Occupancy | # Housing Units | % Housing Units |
| Owner Occupied Housing Units | 355 | 85.1% |
| Renter-Occupied Housing Units | 62 | 14.9% |
| Total Occupied Housing Units | 417 | 100.0% |
Occupancy by Household Size in Wilmington
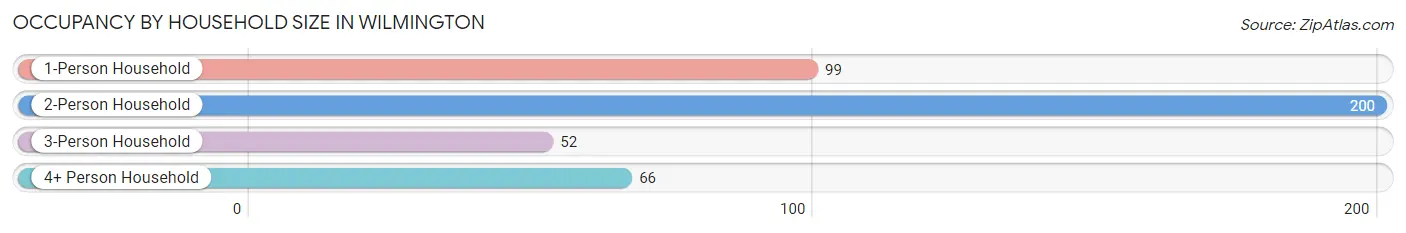
| Household Size | # Housing Units | % Housing Units |
| 1-Person Household | 99 | 23.7% |
| 2-Person Household | 200 | 48.0% |
| 3-Person Household | 52 | 12.5% |
| 4+ Person Household | 66 | 15.8% |
| Total Housing Units | 417 | 100.0% |
Occupancy by Ownership by Household Size in Wilmington
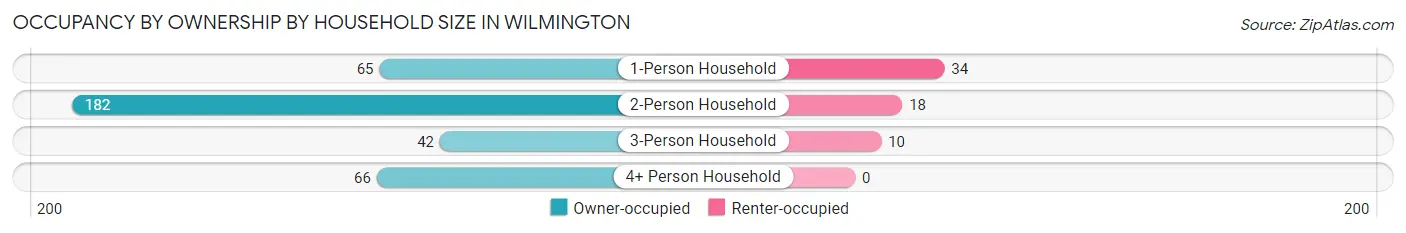
| Household Size | Owner-occupied | Renter-occupied |
| 1-Person Household | 65 (65.7%) | 34 (34.3%) |
| 2-Person Household | 182 (91.0%) | 18 (9.0%) |
| 3-Person Household | 42 (80.8%) | 10 (19.2%) |
| 4+ Person Household | 66 (100.0%) | 0 (0.0%) |
| Total Housing Units | 355 (85.1%) | 62 (14.9%) |
Occupancy by Educational Attainment in Wilmington
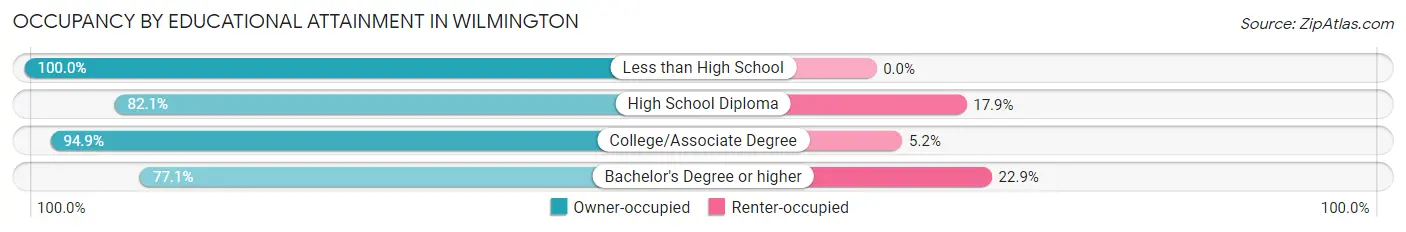
| Household Size | Owner-occupied | Renter-occupied |
| Less than High School | 10 (100.0%) | 0 (0.0%) |
| High School Diploma | 115 (82.1%) | 25 (17.9%) |
| College/Associate Degree | 129 (94.9%) | 7 (5.1%) |
| Bachelor's Degree or higher | 101 (77.1%) | 30 (22.9%) |
Occupancy by Age of Householder in Wilmington
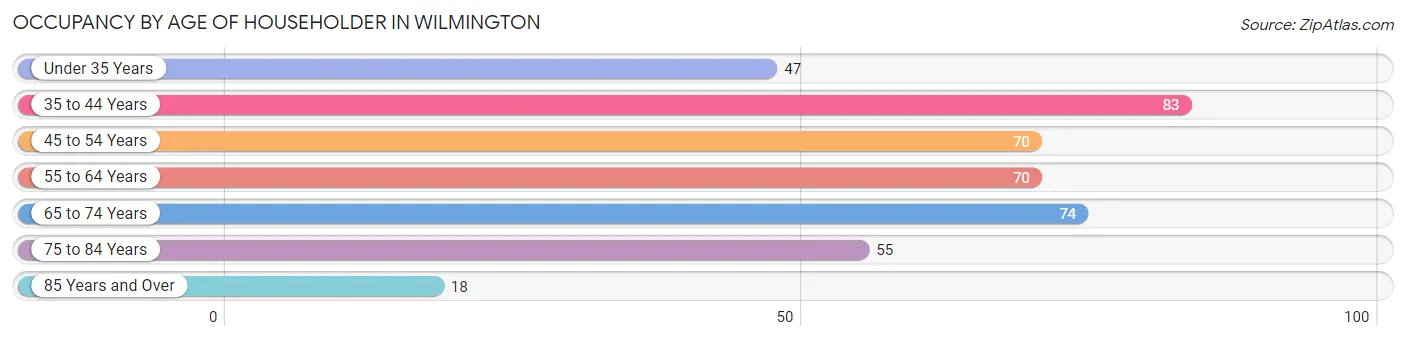
| Age Bracket | # Households | % Households |
| Under 35 Years | 47 | 11.3% |
| 35 to 44 Years | 83 | 19.9% |
| 45 to 54 Years | 70 | 16.8% |
| 55 to 64 Years | 70 | 16.8% |
| 65 to 74 Years | 74 | 17.7% |
| 75 to 84 Years | 55 | 13.2% |
| 85 Years and Over | 18 | 4.3% |
| Total | 417 | 100.0% |
Housing Finances in Wilmington
Median Income by Occupancy in Wilmington
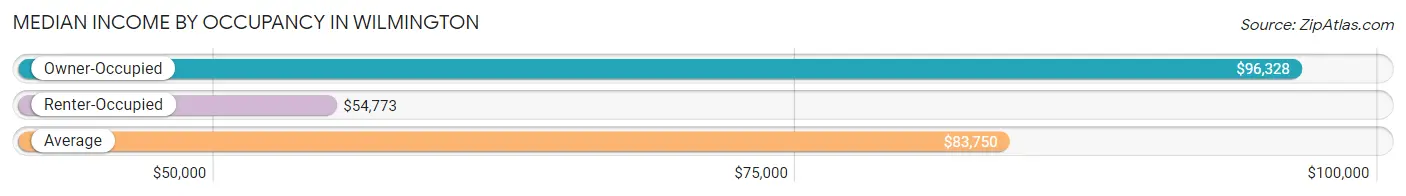
| Occupancy Type | # Households | Median Income |
| Owner-Occupied | 355 (85.1%) | $96,328 |
| Renter-Occupied | 62 (14.9%) | $54,773 |
| Average | 417 (100.0%) | $83,750 |
Occupancy by Householder Income Bracket in Wilmington
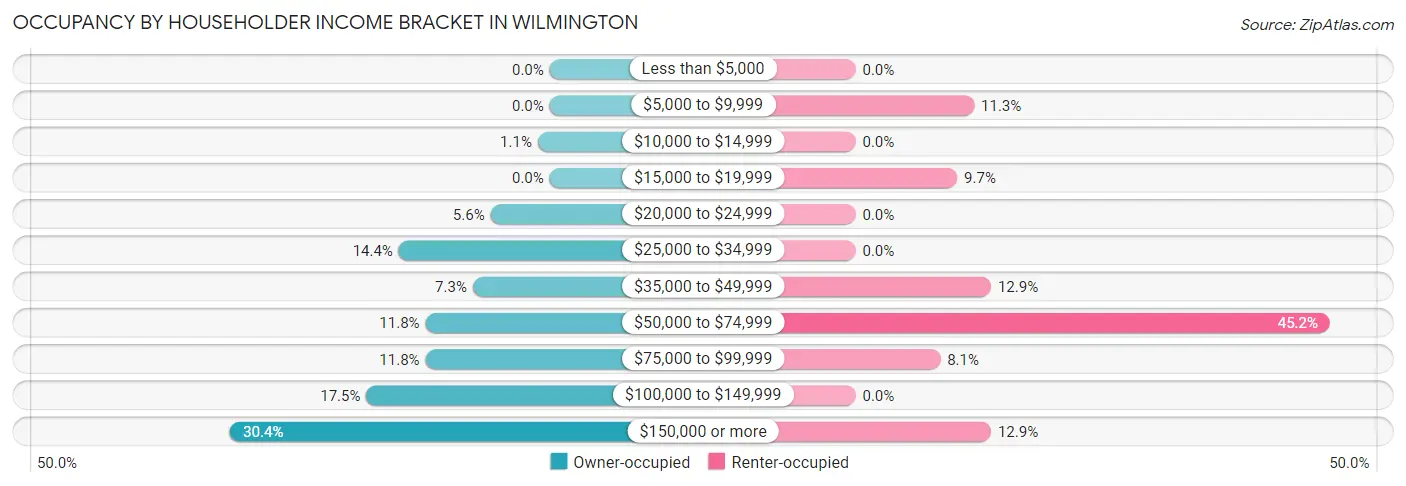
| Income Bracket | Owner-occupied | Renter-occupied |
| Less than $5,000 | 0 (0.0%) | 0 (0.0%) |
| $5,000 to $9,999 | 0 (0.0%) | 7 (11.3%) |
| $10,000 to $14,999 | 4 (1.1%) | 0 (0.0%) |
| $15,000 to $19,999 | 0 (0.0%) | 6 (9.7%) |
| $20,000 to $24,999 | 20 (5.6%) | 0 (0.0%) |
| $25,000 to $34,999 | 51 (14.4%) | 0 (0.0%) |
| $35,000 to $49,999 | 26 (7.3%) | 8 (12.9%) |
| $50,000 to $74,999 | 42 (11.8%) | 28 (45.2%) |
| $75,000 to $99,999 | 42 (11.8%) | 5 (8.1%) |
| $100,000 to $149,999 | 62 (17.5%) | 0 (0.0%) |
| $150,000 or more | 108 (30.4%) | 8 (12.9%) |
| Total | 355 (100.0%) | 62 (100.0%) |
Monthly Housing Cost Tiers in Wilmington
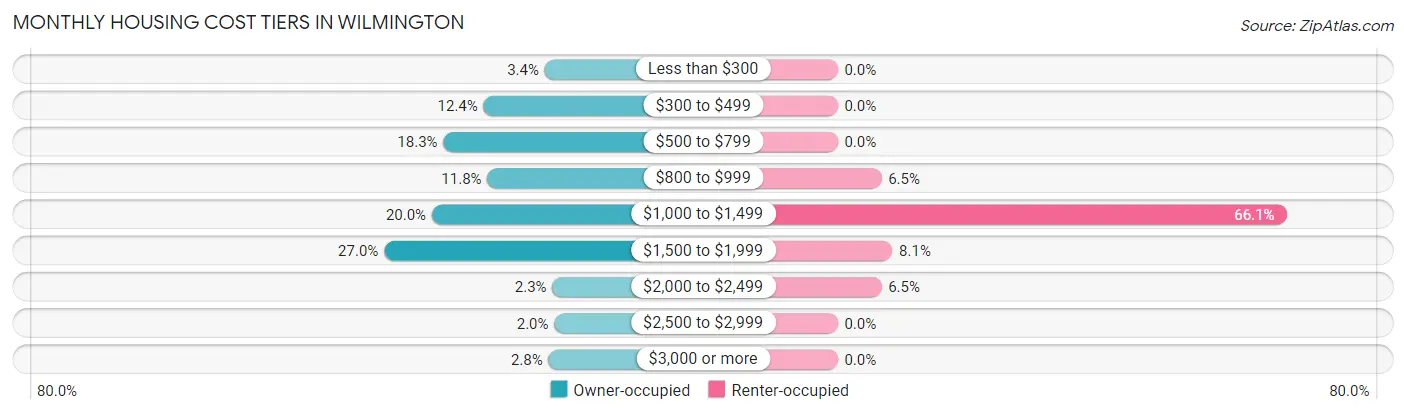
| Monthly Cost | Owner-occupied | Renter-occupied |
| Less than $300 | 12 (3.4%) | 0 (0.0%) |
| $300 to $499 | 44 (12.4%) | 0 (0.0%) |
| $500 to $799 | 65 (18.3%) | 0 (0.0%) |
| $800 to $999 | 42 (11.8%) | 4 (6.5%) |
| $1,000 to $1,499 | 71 (20.0%) | 41 (66.1%) |
| $1,500 to $1,999 | 96 (27.0%) | 5 (8.1%) |
| $2,000 to $2,499 | 8 (2.2%) | 4 (6.5%) |
| $2,500 to $2,999 | 7 (2.0%) | 0 (0.0%) |
| $3,000 or more | 10 (2.8%) | 0 (0.0%) |
| Total | 355 (100.0%) | 62 (100.0%) |
Physical Housing Characteristics in Wilmington
Housing Structures in Wilmington
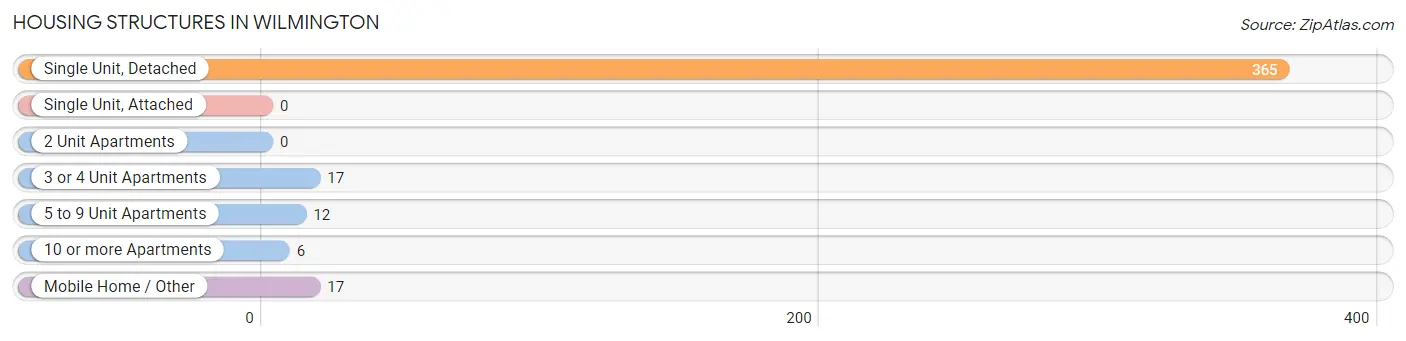
| Structure Type | # Housing Units | % Housing Units |
| Single Unit, Detached | 365 | 87.5% |
| Single Unit, Attached | 0 | 0.0% |
| 2 Unit Apartments | 0 | 0.0% |
| 3 or 4 Unit Apartments | 17 | 4.1% |
| 5 to 9 Unit Apartments | 12 | 2.9% |
| 10 or more Apartments | 6 | 1.4% |
| Mobile Home / Other | 17 | 4.1% |
| Total | 417 | 100.0% |
Housing Structures by Occupancy in Wilmington
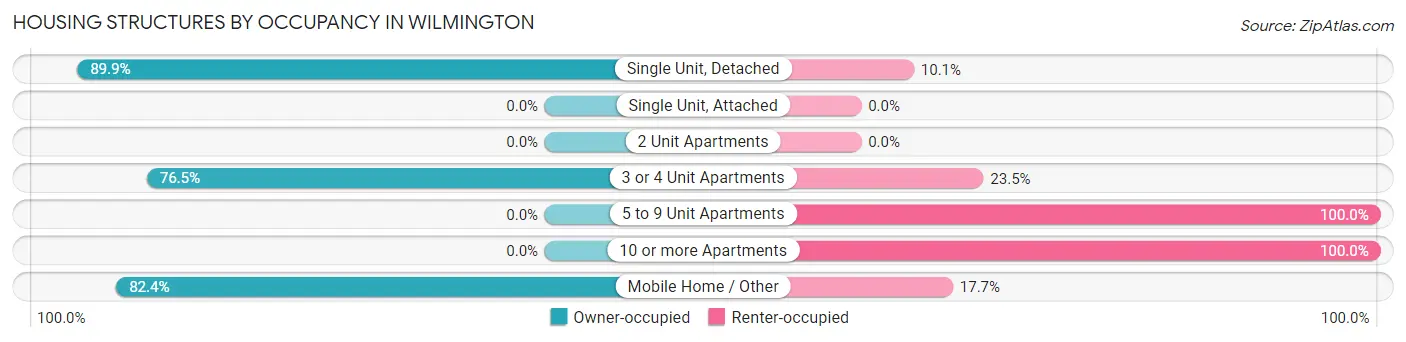
| Structure Type | Owner-occupied | Renter-occupied |
| Single Unit, Detached | 328 (89.9%) | 37 (10.1%) |
| Single Unit, Attached | 0 (0.0%) | 0 (0.0%) |
| 2 Unit Apartments | 0 (0.0%) | 0 (0.0%) |
| 3 or 4 Unit Apartments | 13 (76.5%) | 4 (23.5%) |
| 5 to 9 Unit Apartments | 0 (0.0%) | 12 (100.0%) |
| 10 or more Apartments | 0 (0.0%) | 6 (100.0%) |
| Mobile Home / Other | 14 (82.4%) | 3 (17.6%) |
| Total | 355 (85.1%) | 62 (14.9%) |
Housing Structures by Number of Rooms in Wilmington
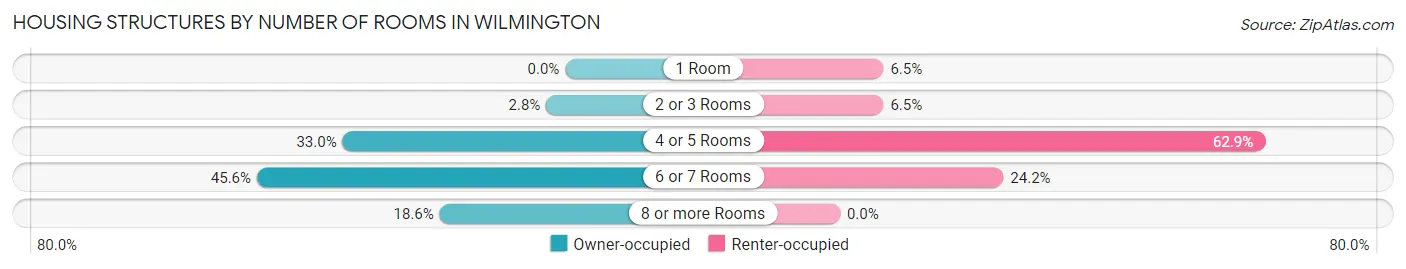
| Number of Rooms | Owner-occupied | Renter-occupied |
| 1 Room | 0 (0.0%) | 4 (6.5%) |
| 2 or 3 Rooms | 10 (2.8%) | 4 (6.5%) |
| 4 or 5 Rooms | 117 (33.0%) | 39 (62.9%) |
| 6 or 7 Rooms | 162 (45.6%) | 15 (24.2%) |
| 8 or more Rooms | 66 (18.6%) | 0 (0.0%) |
| Total | 355 (100.0%) | 62 (100.0%) |
Housing Structure by Heating Type in Wilmington
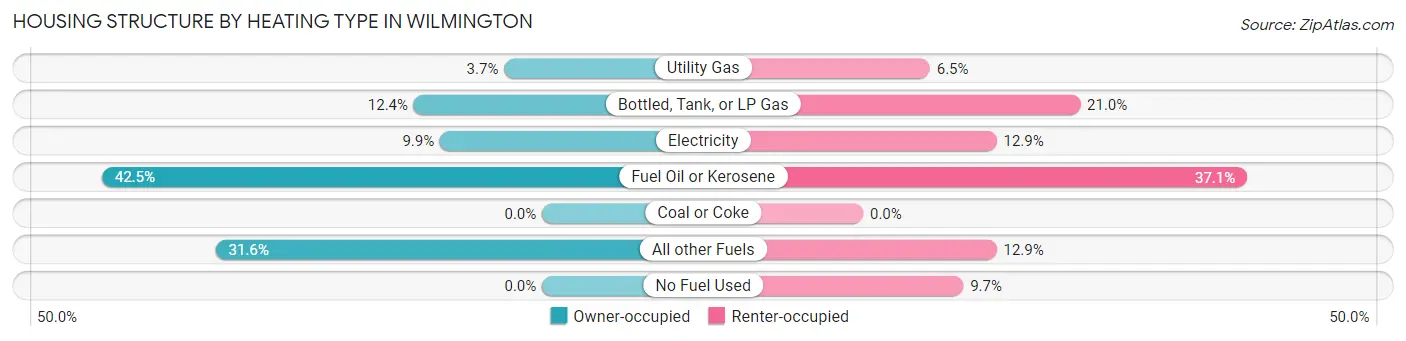
| Heating Type | Owner-occupied | Renter-occupied |
| Utility Gas | 13 (3.7%) | 4 (6.5%) |
| Bottled, Tank, or LP Gas | 44 (12.4%) | 13 (21.0%) |
| Electricity | 35 (9.9%) | 8 (12.9%) |
| Fuel Oil or Kerosene | 151 (42.5%) | 23 (37.1%) |
| Coal or Coke | 0 (0.0%) | 0 (0.0%) |
| All other Fuels | 112 (31.6%) | 8 (12.9%) |
| No Fuel Used | 0 (0.0%) | 6 (9.7%) |
| Total | 355 (100.0%) | 62 (100.0%) |
Household Vehicle Usage in Wilmington
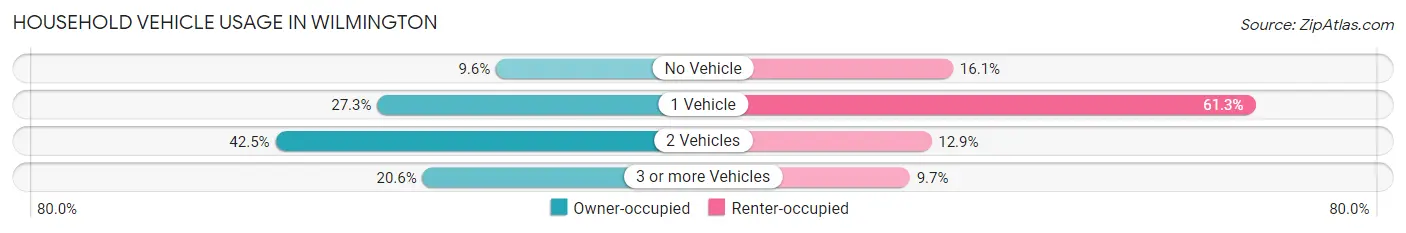
| Vehicles per Household | Owner-occupied | Renter-occupied |
| No Vehicle | 34 (9.6%) | 10 (16.1%) |
| 1 Vehicle | 97 (27.3%) | 38 (61.3%) |
| 2 Vehicles | 151 (42.5%) | 8 (12.9%) |
| 3 or more Vehicles | 73 (20.6%) | 6 (9.7%) |
| Total | 355 (100.0%) | 62 (100.0%) |
Real Estate & Mortgages in Wilmington
Real Estate and Mortgage Overview in Wilmington
| Characteristic | Without Mortgage | With Mortgage |
| Housing Units | 163 | 192 |
| Median Property Value | $221,600 | $276,200 |
| Median Household Income | $68,594 | $68 |
| Monthly Housing Costs | $660 | $0 |
| Real Estate Taxes | $2,578 | $0 |
Property Value by Mortgage Status in Wilmington
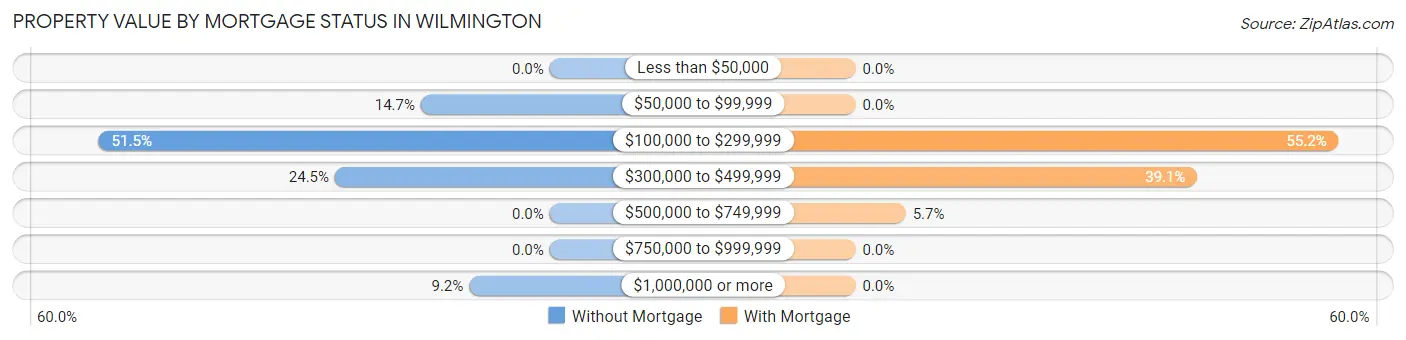
| Property Value | Without Mortgage | With Mortgage |
| Less than $50,000 | 0 (0.0%) | 0 (0.0%) |
| $50,000 to $99,999 | 24 (14.7%) | 0 (0.0%) |
| $100,000 to $299,999 | 84 (51.5%) | 106 (55.2%) |
| $300,000 to $499,999 | 40 (24.5%) | 75 (39.1%) |
| $500,000 to $749,999 | 0 (0.0%) | 11 (5.7%) |
| $750,000 to $999,999 | 0 (0.0%) | 0 (0.0%) |
| $1,000,000 or more | 15 (9.2%) | 0 (0.0%) |
| Total | 163 (100.0%) | 192 (100.0%) |
Household Income by Mortgage Status in Wilmington
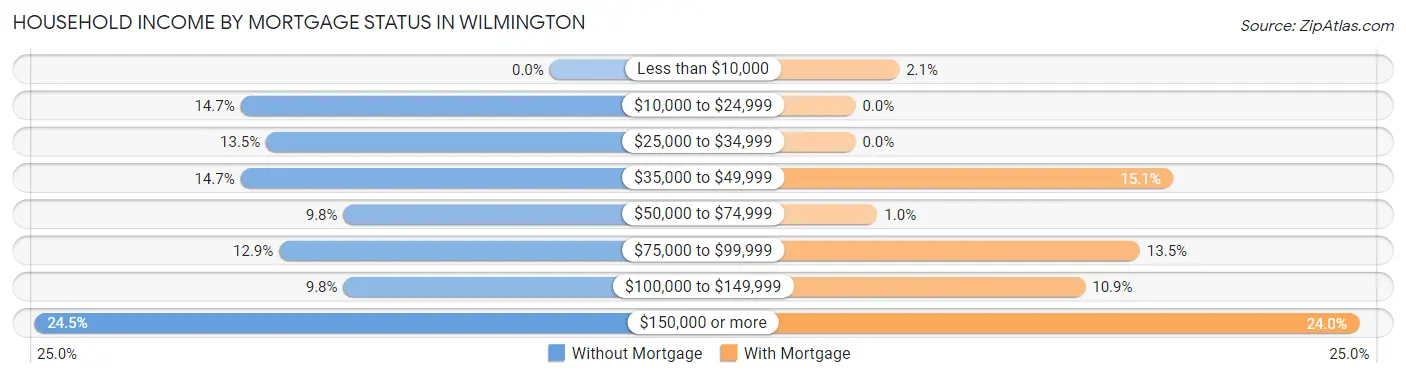
| Household Income | Without Mortgage | With Mortgage |
| Less than $10,000 | 0 (0.0%) | 4 (2.1%) |
| $10,000 to $24,999 | 24 (14.7%) | 0 (0.0%) |
| $25,000 to $34,999 | 22 (13.5%) | 0 (0.0%) |
| $35,000 to $49,999 | 24 (14.7%) | 29 (15.1%) |
| $50,000 to $74,999 | 16 (9.8%) | 2 (1.0%) |
| $75,000 to $99,999 | 21 (12.9%) | 26 (13.5%) |
| $100,000 to $149,999 | 16 (9.8%) | 21 (10.9%) |
| $150,000 or more | 40 (24.5%) | 46 (24.0%) |
| Total | 163 (100.0%) | 192 (100.0%) |
Property Value to Household Income Ratio in Wilmington
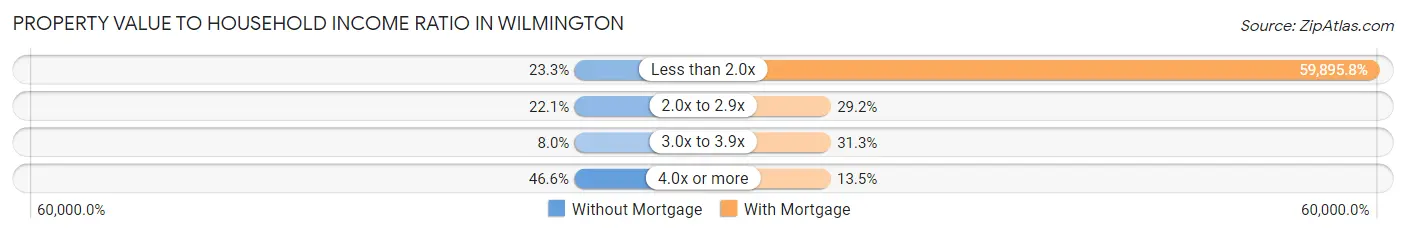
| Value-to-Income Ratio | Without Mortgage | With Mortgage |
| Less than 2.0x | 38 (23.3%) | 115,000 (59,895.8%) |
| 2.0x to 2.9x | 36 (22.1%) | 56 (29.2%) |
| 3.0x to 3.9x | 13 (8.0%) | 60 (31.2%) |
| 4.0x or more | 76 (46.6%) | 26 (13.5%) |
| Total | 163 (100.0%) | 192 (100.0%) |
Real Estate Taxes by Mortgage Status in Wilmington
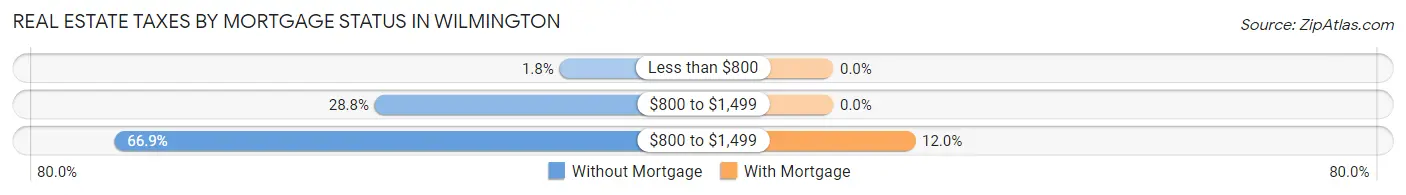
| Property Taxes | Without Mortgage | With Mortgage |
| Less than $800 | 3 (1.8%) | 0 (0.0%) |
| $800 to $1,499 | 47 (28.8%) | 0 (0.0%) |
| $800 to $1,499 | 109 (66.9%) | 23 (12.0%) |
| Total | 163 (100.0%) | 192 (100.0%) |
Health & Disability in Wilmington
Health Insurance Coverage by Age in Wilmington
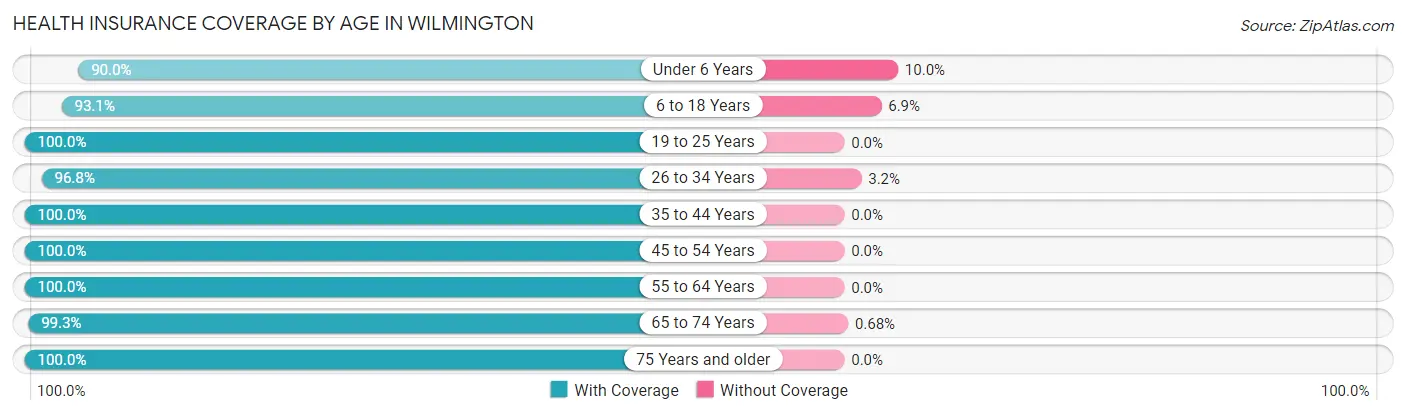
| Age Bracket | With Coverage | Without Coverage |
| Under 6 Years | 18 (90.0%) | 2 (10.0%) |
| 6 to 18 Years | 81 (93.1%) | 6 (6.9%) |
| 19 to 25 Years | 93 (100.0%) | 0 (0.0%) |
| 26 to 34 Years | 61 (96.8%) | 2 (3.2%) |
| 35 to 44 Years | 151 (100.0%) | 0 (0.0%) |
| 45 to 54 Years | 128 (100.0%) | 0 (0.0%) |
| 55 to 64 Years | 125 (100.0%) | 0 (0.0%) |
| 65 to 74 Years | 147 (99.3%) | 1 (0.7%) |
| 75 Years and older | 116 (100.0%) | 0 (0.0%) |
| Total | 920 (98.8%) | 11 (1.2%) |
Health Insurance Coverage by Citizenship Status in Wilmington
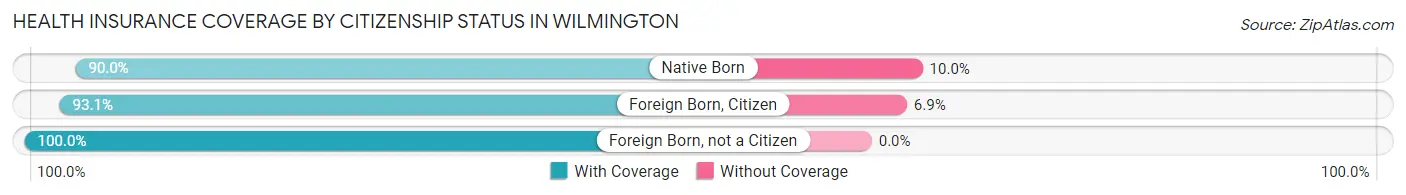
| Citizenship Status | With Coverage | Without Coverage |
| Native Born | 18 (90.0%) | 2 (10.0%) |
| Foreign Born, Citizen | 81 (93.1%) | 6 (6.9%) |
| Foreign Born, not a Citizen | 93 (100.0%) | 0 (0.0%) |
Health Insurance Coverage by Household Income in Wilmington
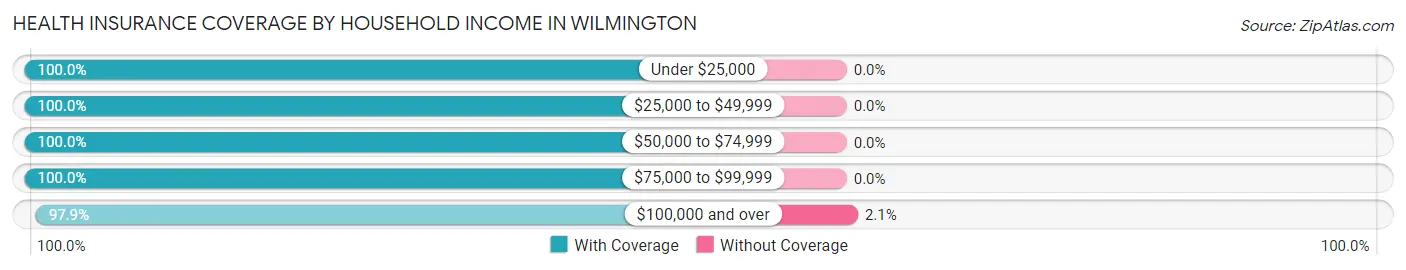
| Household Income | With Coverage | Without Coverage |
| Under $25,000 | 50 (100.0%) | 0 (0.0%) |
| $25,000 to $49,999 | 156 (100.0%) | 0 (0.0%) |
| $50,000 to $74,999 | 139 (100.0%) | 0 (0.0%) |
| $75,000 to $99,999 | 105 (100.0%) | 0 (0.0%) |
| $100,000 and over | 467 (97.9%) | 10 (2.1%) |
Public vs Private Health Insurance Coverage by Age in Wilmington
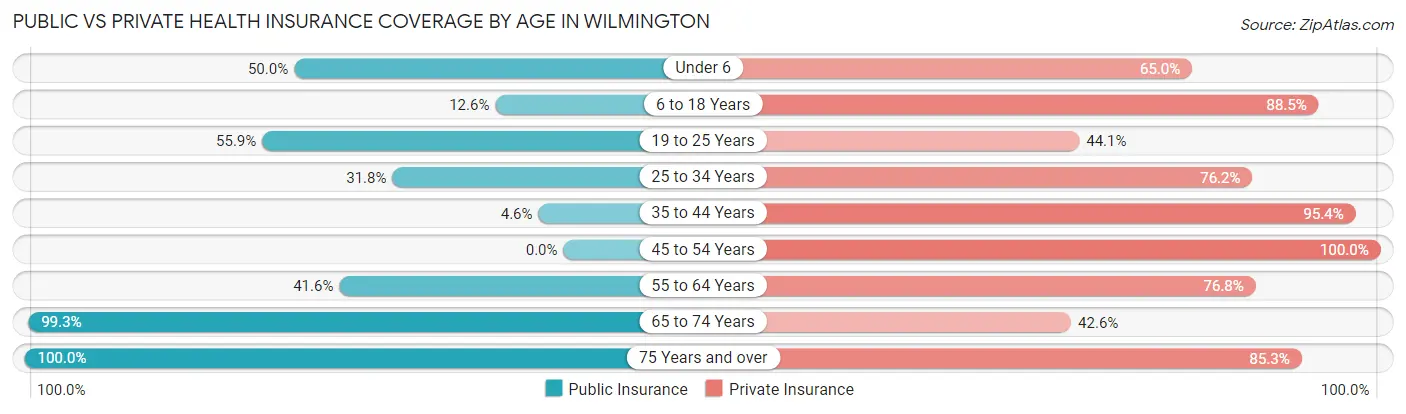
| Age Bracket | Public Insurance | Private Insurance |
| Under 6 | 10 (50.0%) | 13 (65.0%) |
| 6 to 18 Years | 11 (12.6%) | 77 (88.5%) |
| 19 to 25 Years | 52 (55.9%) | 41 (44.1%) |
| 25 to 34 Years | 20 (31.8%) | 48 (76.2%) |
| 35 to 44 Years | 7 (4.6%) | 144 (95.4%) |
| 45 to 54 Years | 0 (0.0%) | 128 (100.0%) |
| 55 to 64 Years | 52 (41.6%) | 96 (76.8%) |
| 65 to 74 Years | 147 (99.3%) | 63 (42.6%) |
| 75 Years and over | 116 (100.0%) | 99 (85.3%) |
| Total | 415 (44.6%) | 709 (76.1%) |
Disability Status by Sex by Age in Wilmington
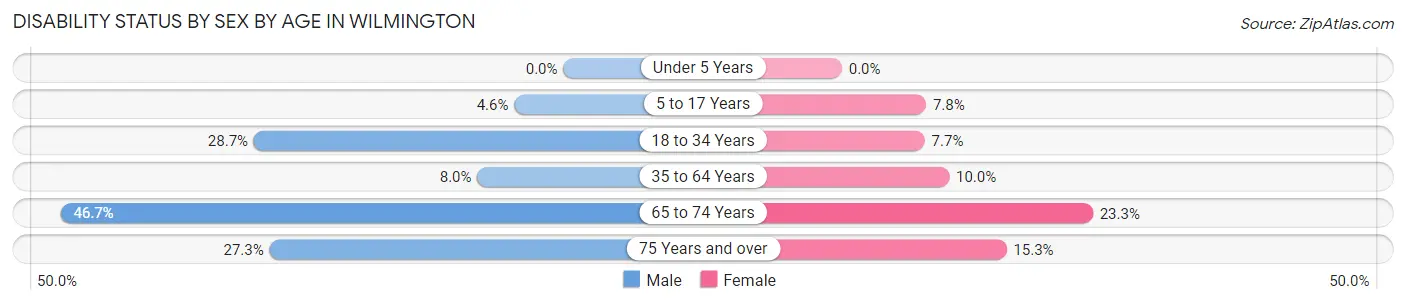
| Age Bracket | Male | Female |
| Under 5 Years | 0 (0.0%) | 0 (0.0%) |
| 5 to 17 Years | 1 (4.5%) | 5 (7.8%) |
| 18 to 34 Years | 27 (28.7%) | 5 (7.7%) |
| 35 to 64 Years | 17 (8.0%) | 19 (10.0%) |
| 65 to 74 Years | 35 (46.7%) | 17 (23.3%) |
| 75 Years and over | 12 (27.3%) | 11 (15.3%) |
Disability Class by Sex by Age in Wilmington
Disability Class: Hearing Difficulty
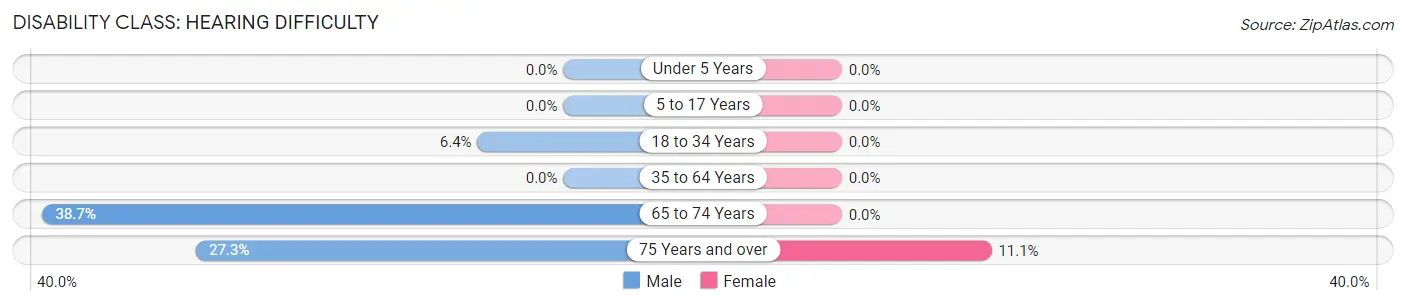
| Age Bracket | Male | Female |
| Under 5 Years | 0 (0.0%) | 0 (0.0%) |
| 5 to 17 Years | 0 (0.0%) | 0 (0.0%) |
| 18 to 34 Years | 6 (6.4%) | 0 (0.0%) |
| 35 to 64 Years | 0 (0.0%) | 0 (0.0%) |
| 65 to 74 Years | 29 (38.7%) | 0 (0.0%) |
| 75 Years and over | 12 (27.3%) | 8 (11.1%) |
Disability Class: Vision Difficulty
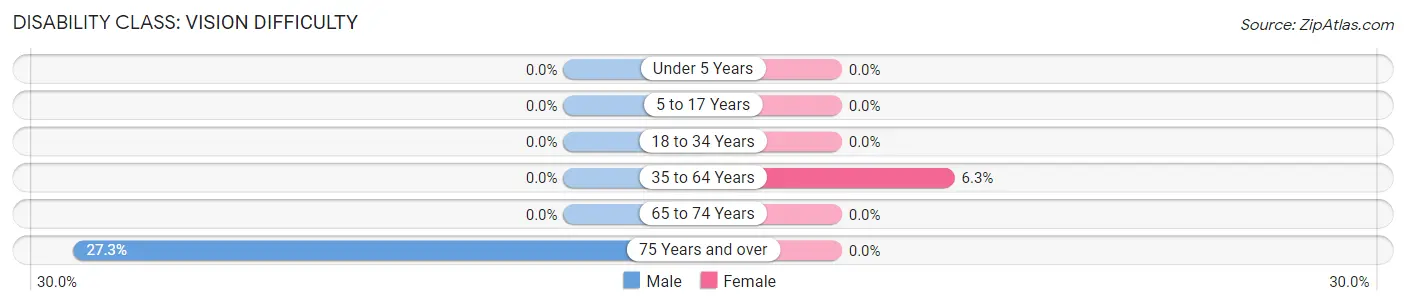
| Age Bracket | Male | Female |
| Under 5 Years | 0 (0.0%) | 0 (0.0%) |
| 5 to 17 Years | 0 (0.0%) | 0 (0.0%) |
| 18 to 34 Years | 0 (0.0%) | 0 (0.0%) |
| 35 to 64 Years | 0 (0.0%) | 12 (6.3%) |
| 65 to 74 Years | 0 (0.0%) | 0 (0.0%) |
| 75 Years and over | 12 (27.3%) | 0 (0.0%) |
Disability Class: Cognitive Difficulty
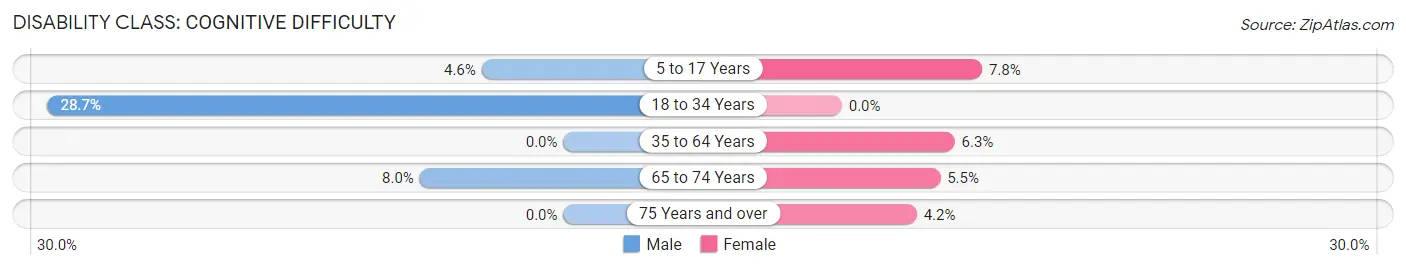
| Age Bracket | Male | Female |
| 5 to 17 Years | 1 (4.5%) | 5 (7.8%) |
| 18 to 34 Years | 27 (28.7%) | 0 (0.0%) |
| 35 to 64 Years | 0 (0.0%) | 12 (6.3%) |
| 65 to 74 Years | 6 (8.0%) | 4 (5.5%) |
| 75 Years and over | 0 (0.0%) | 3 (4.2%) |
Disability Class: Ambulatory Difficulty
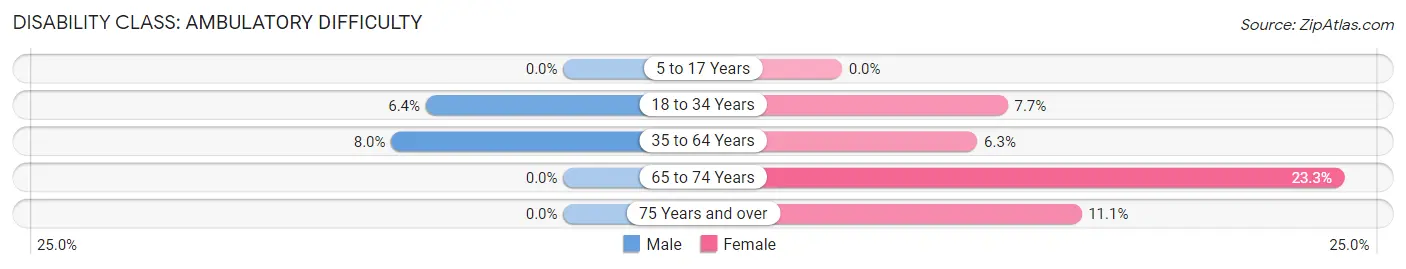
| Age Bracket | Male | Female |
| 5 to 17 Years | 0 (0.0%) | 0 (0.0%) |
| 18 to 34 Years | 6 (6.4%) | 5 (7.7%) |
| 35 to 64 Years | 17 (8.0%) | 12 (6.3%) |
| 65 to 74 Years | 0 (0.0%) | 17 (23.3%) |
| 75 Years and over | 0 (0.0%) | 8 (11.1%) |
Disability Class: Self-Care Difficulty
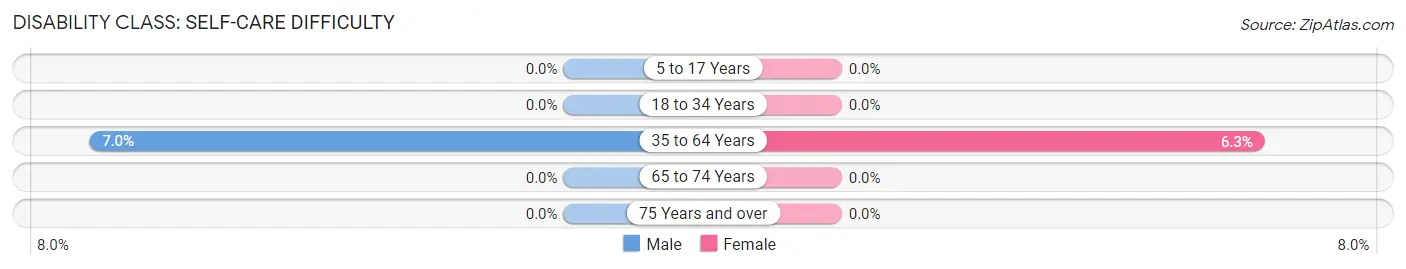
| Age Bracket | Male | Female |
| 5 to 17 Years | 0 (0.0%) | 0 (0.0%) |
| 18 to 34 Years | 0 (0.0%) | 0 (0.0%) |
| 35 to 64 Years | 15 (7.0%) | 12 (6.3%) |
| 65 to 74 Years | 0 (0.0%) | 0 (0.0%) |
| 75 Years and over | 0 (0.0%) | 0 (0.0%) |
Technology Access in Wilmington
Computing Device Access in Wilmington
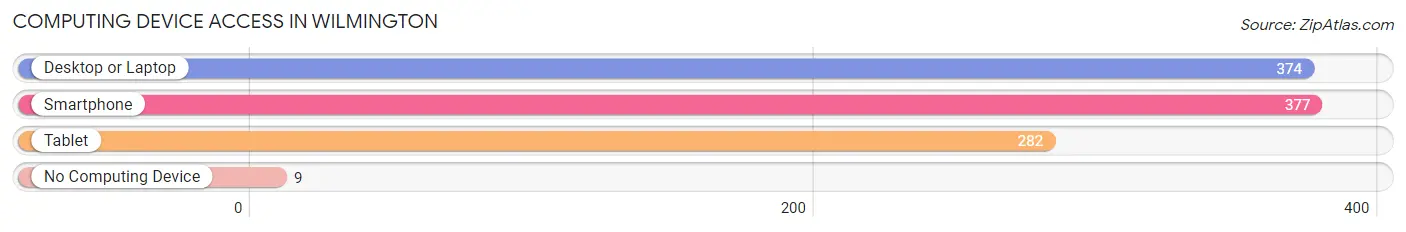
| Device Type | # Households | % Households |
| Desktop or Laptop | 374 | 89.7% |
| Smartphone | 377 | 90.4% |
| Tablet | 282 | 67.6% |
| No Computing Device | 9 | 2.2% |
| Total | 417 | 100.0% |
Internet Access in Wilmington
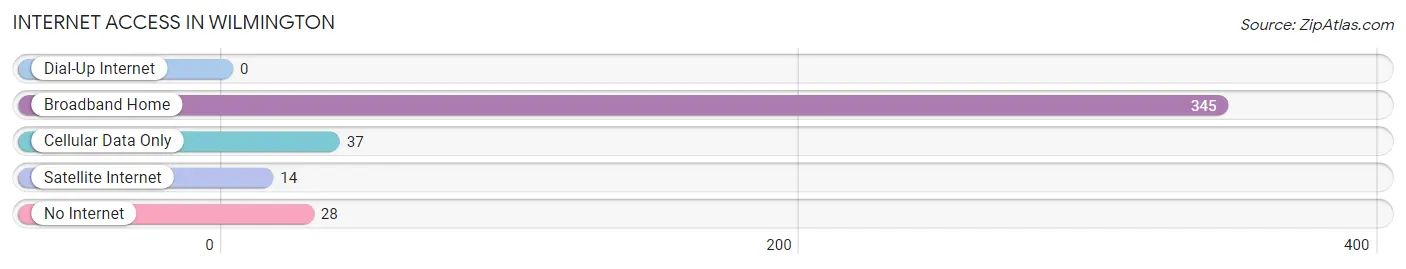
| Internet Type | # Households | % Households |
| Dial-Up Internet | 0 | 0.0% |
| Broadband Home | 345 | 82.7% |
| Cellular Data Only | 37 | 8.9% |
| Satellite Internet | 14 | 3.4% |
| No Internet | 28 | 6.7% |
| Total | 417 | 100.0% |
Wilmington Summary
Wilmington, NY is a small town located in the Adirondack Mountains of New York State. It is situated in the northern part of Essex County, near the border of Clinton County. The town is home to a population of approximately 1,500 people, and is known for its picturesque mountain views and outdoor recreation opportunities.
History
The town of Wilmington was first settled in 1797 by a group of settlers from Vermont. The town was originally known as “Wilmington Flats”, and was named after the town of Wilmington, Vermont. The town was officially incorporated in 1817, and was the first town in Essex County to be incorporated.
In the early 19th century, Wilmington was a thriving agricultural community, with many farms and mills. The town was also home to a number of sawmills, which provided lumber for the growing population. In the late 19th century, the town began to experience a decline in population, as many of the residents moved away to larger cities.
Geography
Wilmington is located in the northern part of Essex County, near the border of Clinton County. The town is situated in the Adirondack Mountains, and is surrounded by the Whiteface Mountain Range. The town is located at an elevation of 1,400 feet, and is home to a number of lakes, including Lake Placid, Mirror Lake, and Lake Everest.
The town is home to a number of parks and recreational areas, including Whiteface Mountain, Wilmington Wild Forest, and the Wilmington Flats Wildlife Management Area. The town is also home to a number of ski resorts, including Whiteface Mountain Ski Resort and Big Tupper Ski Area.
Economy
The economy of Wilmington is largely based on tourism and outdoor recreation. The town is home to a number of ski resorts, which attract visitors from all over the world. The town is also home to a number of restaurants, shops, and other businesses that cater to tourists.
The town is also home to a number of manufacturing and industrial businesses, including a paper mill and a lumber mill. The town is also home to a number of small businesses, including a number of bed and breakfasts, restaurants, and other businesses.
Demographics
As of the 2010 census, the population of Wilmington was 1,500. The town is predominantly white, with a small percentage of African Americans, Hispanics, and other ethnicities. The median household income in the town is $45,000, and the median home value is $150,000.
The town is home to a number of churches, including the Wilmington United Methodist Church, the Wilmington Presbyterian Church, and the Wilmington Baptist Church. The town is also home to a number of schools, including the Wilmington Central School District, which serves the town’s students from kindergarten through twelfth grade.
Common Questions
What is Per Capita Income in Wilmington?
Per Capita income in Wilmington is $49,929.
What is the Median Family Income in Wilmington?
Median Family Income in Wilmington is $96,406.
What is the Median Household income in Wilmington?
Median Household Income in Wilmington is $83,750.
What is Income or Wage Gap in Wilmington?
Income or Wage Gap in Wilmington is 22.7%.
Women in Wilmington earn 77.3 cents for every dollar earned by a man.
What is Inequality or Gini Index in Wilmington?
Inequality or Gini Index in Wilmington is 0.40.
What is the Total Population of Wilmington?
Total Population of Wilmington is 931.
What is the Total Male Population of Wilmington?
Total Male Population of Wilmington is 461.
What is the Total Female Population of Wilmington?
Total Female Population of Wilmington is 470.
What is the Ratio of Males per 100 Females in Wilmington?
There are 98.09 Males per 100 Females in Wilmington.
What is the Ratio of Females per 100 Males in Wilmington?
There are 101.95 Females per 100 Males in Wilmington.
What is the Median Population Age in Wilmington?
Median Population Age in Wilmington is 50.1 Years.
What is the Average Family Size in Wilmington
Average Family Size in Wilmington is 2.6 People.
What is the Average Household Size in Wilmington
Average Household Size in Wilmington is 2.2 People.
How Large is the Labor Force in Wilmington?
There are 531 People in the Labor Forcein in Wilmington.
What is the Percentage of People in the Labor Force in Wilmington?
61.9% of People are in the Labor Force in Wilmington.