Valley Cottage, NY Map & Demographics
Valley Cottage Map
Valley Cottage Overview
$65,256
PER CAPITA INCOME
$156,688
AVG FAMILY INCOME
$131,172
AVG HOUSEHOLD INCOME
10.2%
WAGE / INCOME GAP [ % ]
89.8¢/ $1
WAGE / INCOME GAP [ $ ]
0.41
INEQUALITY / GINI INDEX
9,069
TOTAL POPULATION
4,444
MALE POPULATION
4,625
FEMALE POPULATION
96.09
MALES / 100 FEMALES
104.07
FEMALES / 100 MALES
47.4
MEDIAN AGE
3.1
AVG FAMILY SIZE
2.6
AVG HOUSEHOLD SIZE
5,276
LABOR FORCE [ PEOPLE ]
66.6%
PERCENT IN LABOR FORCE
8.3%
UNEMPLOYMENT RATE
Valley Cottage Zip Codes
Valley Cottage Area Codes
Income in Valley Cottage
Income Overview in Valley Cottage
Per Capita Income in Valley Cottage is $65,256, while median incomes of families and households are $156,688 and $131,172 respectively.
| Characteristic | Number | Measure |
| Per Capita Income | 9,069 | $65,256 |
| Median Family Income | 2,407 | $156,688 |
| Mean Family Income | 2,407 | $196,456 |
| Median Household Income | 3,420 | $131,172 |
| Mean Household Income | 3,420 | $167,249 |
| Income Deficit | 2,407 | $0 |
| Wage / Income Gap (%) | 9,069 | 10.24% |
| Wage / Income Gap ($) | 9,069 | 89.76¢ per $1 |
| Gini / Inequality Index | 9,069 | 0.41 |
Earnings by Sex in Valley Cottage
Average Earnings in Valley Cottage are $63,825, $60,438 for men and $67,336 for women, a difference of 10.2%.
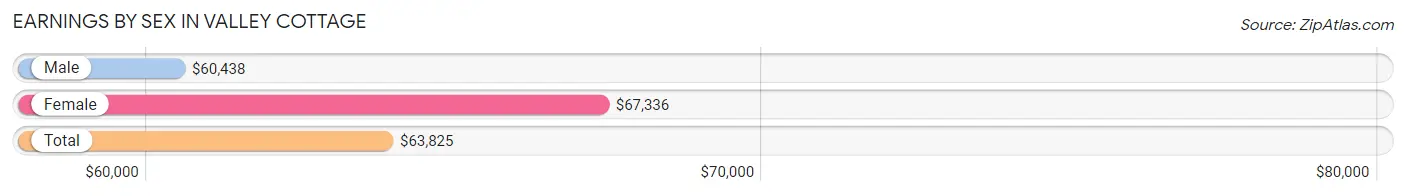
| Sex | Number | Average Earnings |
| Male | 2,638 (49.1%) | $60,438 |
| Female | 2,732 (50.9%) | $67,336 |
| Total | 5,370 (100.0%) | $63,825 |
Earnings by Sex by Income Bracket in Valley Cottage
The most common earnings brackets in Valley Cottage are $100,000+ for men (814 | 30.9%) and $100,000+ for women (702 | 25.7%).
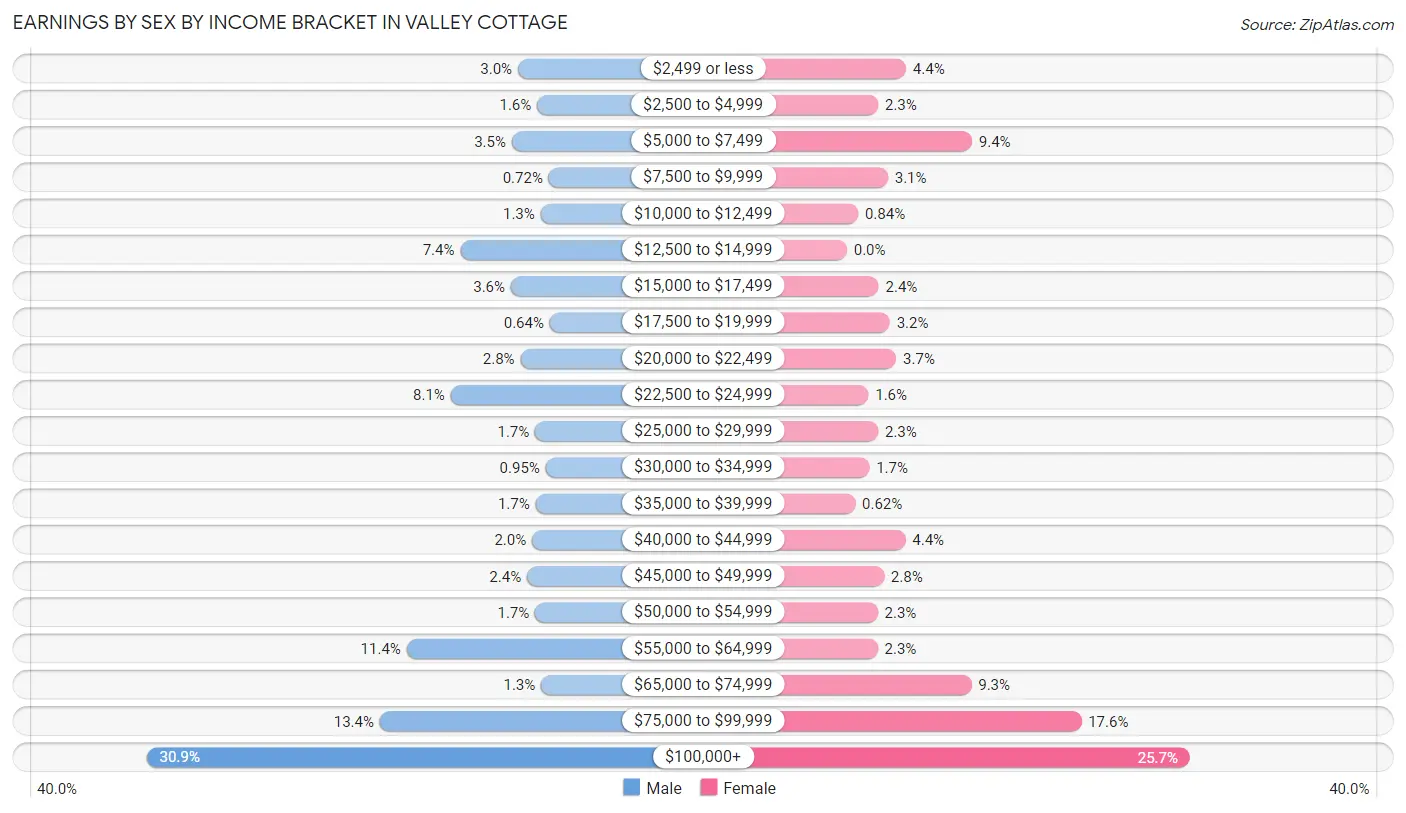
| Income | Male | Female |
| $2,499 or less | 80 (3.0%) | 121 (4.4%) |
| $2,500 to $4,999 | 42 (1.6%) | 64 (2.3%) |
| $5,000 to $7,499 | 92 (3.5%) | 256 (9.4%) |
| $7,500 to $9,999 | 19 (0.7%) | 84 (3.1%) |
| $10,000 to $12,499 | 35 (1.3%) | 23 (0.8%) |
| $12,500 to $14,999 | 194 (7.3%) | 0 (0.0%) |
| $15,000 to $17,499 | 94 (3.6%) | 65 (2.4%) |
| $17,500 to $19,999 | 17 (0.6%) | 88 (3.2%) |
| $20,000 to $22,499 | 75 (2.8%) | 101 (3.7%) |
| $22,500 to $24,999 | 213 (8.1%) | 44 (1.6%) |
| $25,000 to $29,999 | 46 (1.7%) | 64 (2.3%) |
| $30,000 to $34,999 | 25 (0.9%) | 46 (1.7%) |
| $35,000 to $39,999 | 45 (1.7%) | 17 (0.6%) |
| $40,000 to $44,999 | 52 (2.0%) | 120 (4.4%) |
| $45,000 to $49,999 | 62 (2.4%) | 76 (2.8%) |
| $50,000 to $54,999 | 46 (1.7%) | 63 (2.3%) |
| $55,000 to $64,999 | 300 (11.4%) | 63 (2.3%) |
| $65,000 to $74,999 | 34 (1.3%) | 255 (9.3%) |
| $75,000 to $99,999 | 353 (13.4%) | 480 (17.6%) |
| $100,000+ | 814 (30.9%) | 702 (25.7%) |
| Total | 2,638 (100.0%) | 2,732 (100.0%) |
Earnings by Sex by Educational Attainment in Valley Cottage
Average earnings in Valley Cottage are $64,632 for men and $70,625 for women, a difference of 8.5%. Men with an educational attainment of graduate degree enjoy the highest average annual earnings of $105,750, while those with high school diploma education earn the least with $58,504. Women with an educational attainment of graduate degree earn the most with the average annual earnings of $87,056, while those with college or associate's degree education have the smallest earnings of $68,789.
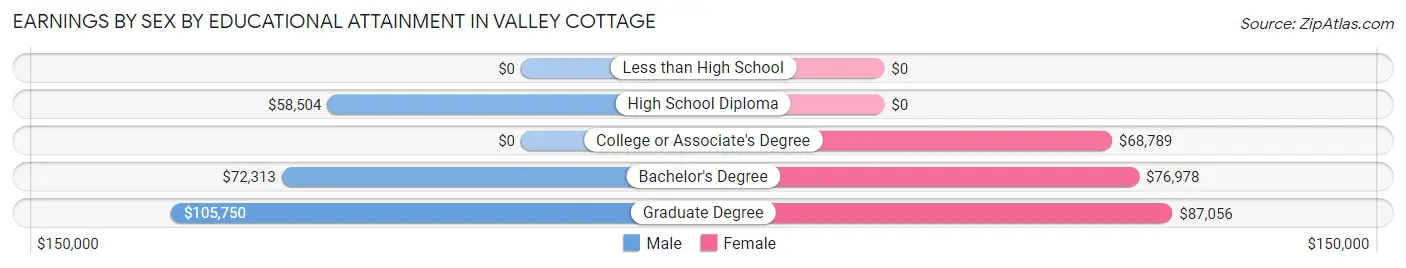
| Educational Attainment | Male Income | Female Income |
| Less than High School | - | - |
| High School Diploma | $58,504 | $0 |
| College or Associate's Degree | - | - |
| Bachelor's Degree | $72,313 | $76,978 |
| Graduate Degree | $105,750 | $87,056 |
| Total | $64,632 | $70,625 |
Family Income in Valley Cottage
Family Income Brackets in Valley Cottage
According to the Valley Cottage family income data, there are 905 families falling into the $200,000+ income range, which is the most common income bracket and makes up 37.6% of all families.
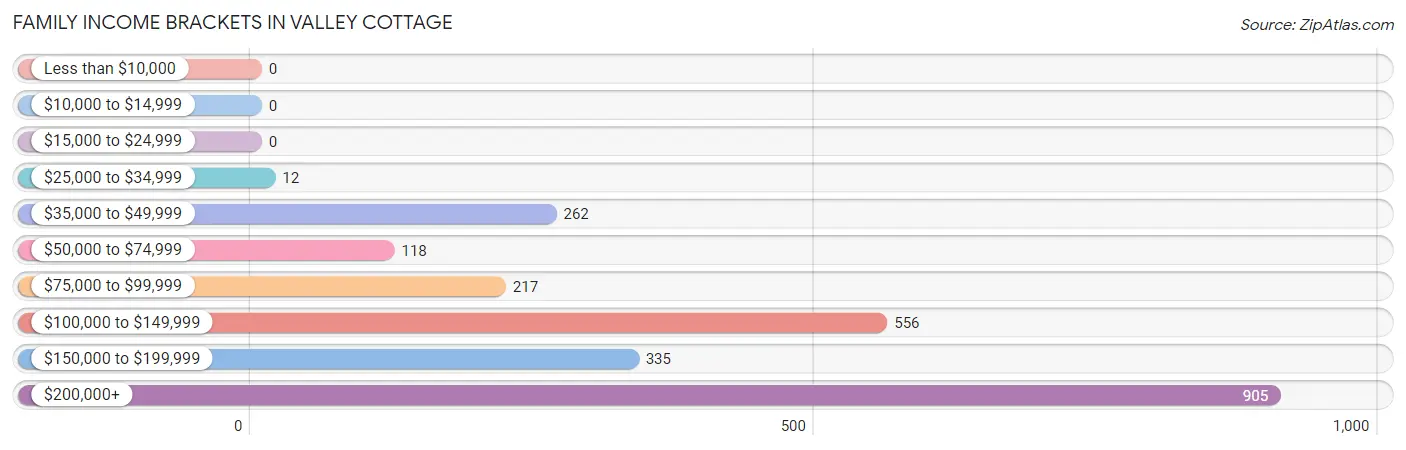
| Income Bracket | # Families | % Families |
| Less than $10,000 | 0 | 0.0% |
| $10,000 to $14,999 | 0 | 0.0% |
| $15,000 to $24,999 | 0 | 0.0% |
| $25,000 to $34,999 | 12 | 0.5% |
| $35,000 to $49,999 | 262 | 10.9% |
| $50,000 to $74,999 | 118 | 4.9% |
| $75,000 to $99,999 | 217 | 9.0% |
| $100,000 to $149,999 | 556 | 23.1% |
| $150,000 to $199,999 | 335 | 13.9% |
| $200,000+ | 905 | 37.6% |
Family Income by Famaliy Size in Valley Cottage
5-person families (139 | 5.8%) account for the highest median family income in Valley Cottage with $250,001 per family, while 3-person families (604 | 25.1%) have the highest median income of $68,039 per family member.
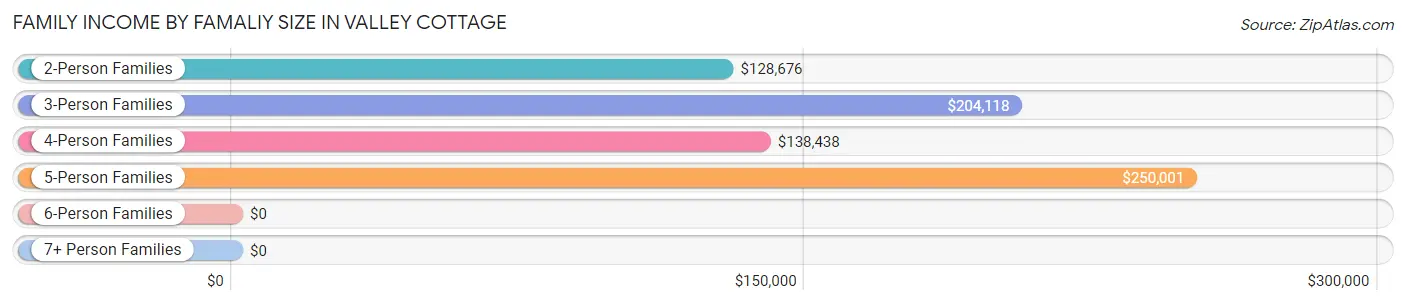
| Income Bracket | # Families | Median Income |
| 2-Person Families | 1,082 (45.0%) | $128,676 |
| 3-Person Families | 604 (25.1%) | $204,118 |
| 4-Person Families | 514 (21.3%) | $138,438 |
| 5-Person Families | 139 (5.8%) | $250,001 |
| 6-Person Families | 68 (2.8%) | $0 |
| 7+ Person Families | 0 (0.0%) | $0 |
| Total | 2,407 (100.0%) | $156,688 |
Family Income by Number of Earners in Valley Cottage
The median family income in Valley Cottage is $156,688, with families comprising 2 earners (1,058) having the highest median family income of $203,676, while families with no earners (428) have the lowest median family income of $84,756, accounting for 44.0% and 17.8% of families, respectively.
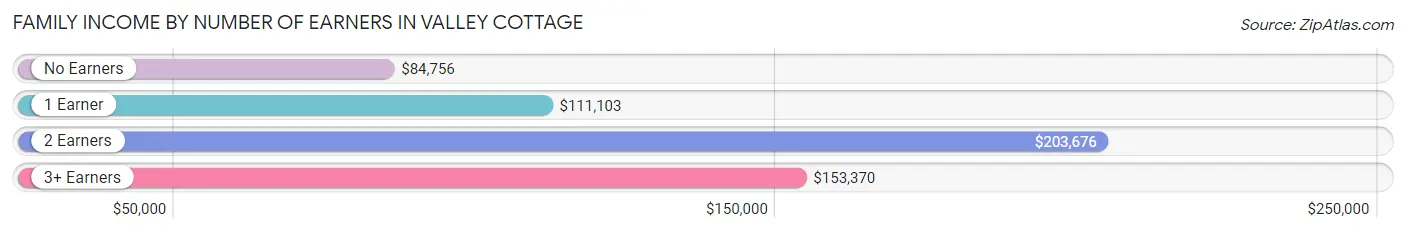
| Number of Earners | # Families | Median Income |
| No Earners | 428 (17.8%) | $84,756 |
| 1 Earner | 345 (14.3%) | $111,103 |
| 2 Earners | 1,058 (44.0%) | $203,676 |
| 3+ Earners | 576 (23.9%) | $153,370 |
| Total | 2,407 (100.0%) | $156,688 |
Household Income in Valley Cottage
Household Income Brackets in Valley Cottage
With 985 households falling in the category, the $200,000+ income range is the most frequent in Valley Cottage, accounting for 28.8% of all households.
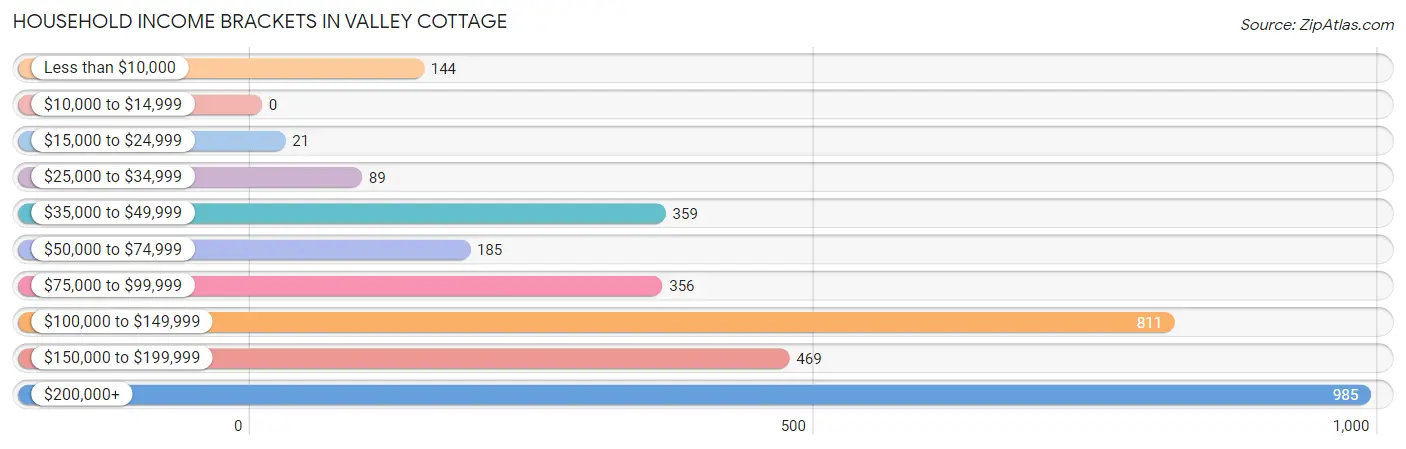
| Income Bracket | # Households | % Households |
| Less than $10,000 | 144 | 4.2% |
| $10,000 to $14,999 | 0 | 0.0% |
| $15,000 to $24,999 | 21 | 0.6% |
| $25,000 to $34,999 | 89 | 2.6% |
| $35,000 to $49,999 | 359 | 10.5% |
| $50,000 to $74,999 | 185 | 5.4% |
| $75,000 to $99,999 | 356 | 10.4% |
| $100,000 to $149,999 | 811 | 23.7% |
| $150,000 to $199,999 | 469 | 13.7% |
| $200,000+ | 985 | 28.8% |
Household Income by Householder Age in Valley Cottage
The median household income in Valley Cottage is $131,172, with the highest median household income of $182,817 found in the 45 to 64 years age bracket for the primary householder. A total of 1,407 households (41.1%) fall into this category. Meanwhile, the 15 to 24 years age bracket for the primary householder has the lowest median household income of $0, with 63 households (1.8%) in this group.
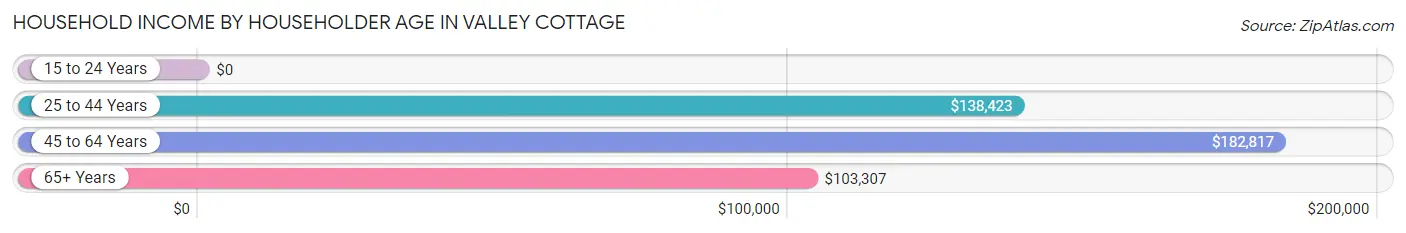
| Income Bracket | # Households | Median Income |
| 15 to 24 Years | 63 (1.8%) | $0 |
| 25 to 44 Years | 735 (21.5%) | $138,423 |
| 45 to 64 Years | 1,407 (41.1%) | $182,817 |
| 65+ Years | 1,215 (35.5%) | $103,307 |
| Total | 3,420 (100.0%) | $131,172 |
Poverty in Valley Cottage
Income Below Poverty by Sex and Age in Valley Cottage
With 5.6% poverty level for males and 0.5% for females among the residents of Valley Cottage, 18 to 24 year old males and 25 to 34 year old females are the most vulnerable to poverty, with 63 males (17.8%) and 14 females (2.5%) in their respective age groups living below the poverty level.
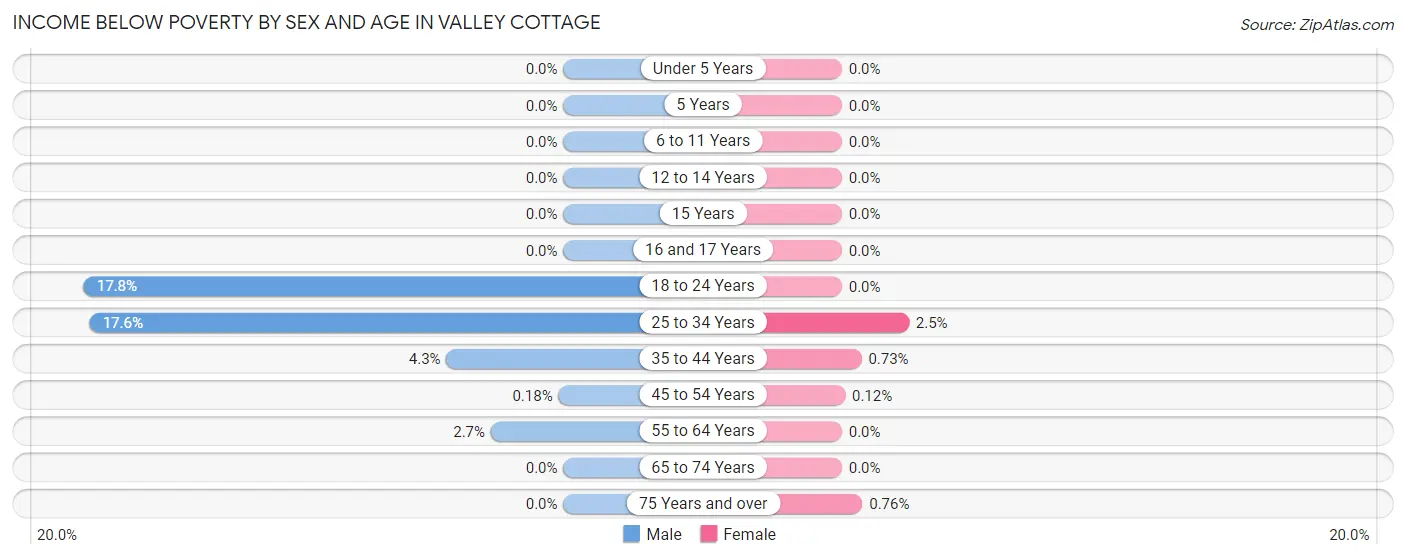
| Age Bracket | Male | Female |
| Under 5 Years | 0 (0.0%) | 0 (0.0%) |
| 5 Years | 0 (0.0%) | 0 (0.0%) |
| 6 to 11 Years | 0 (0.0%) | 0 (0.0%) |
| 12 to 14 Years | 0 (0.0%) | 0 (0.0%) |
| 15 Years | 0 (0.0%) | 0 (0.0%) |
| 16 and 17 Years | 0 (0.0%) | 0 (0.0%) |
| 18 to 24 Years | 63 (17.8%) | 0 (0.0%) |
| 25 to 34 Years | 144 (17.6%) | 14 (2.5%) |
| 35 to 44 Years | 16 (4.3%) | 3 (0.7%) |
| 45 to 54 Years | 1 (0.2%) | 1 (0.1%) |
| 55 to 64 Years | 17 (2.7%) | 0 (0.0%) |
| 65 to 74 Years | 0 (0.0%) | 0 (0.0%) |
| 75 Years and over | 0 (0.0%) | 3 (0.8%) |
| Total | 241 (5.6%) | 21 (0.5%) |
Income Above Poverty by Sex and Age in Valley Cottage
According to the poverty statistics in Valley Cottage, males aged under 5 years and females aged under 5 years are the age groups that are most secure financially, with 100.0% of males and 100.0% of females in these age groups living above the poverty line.
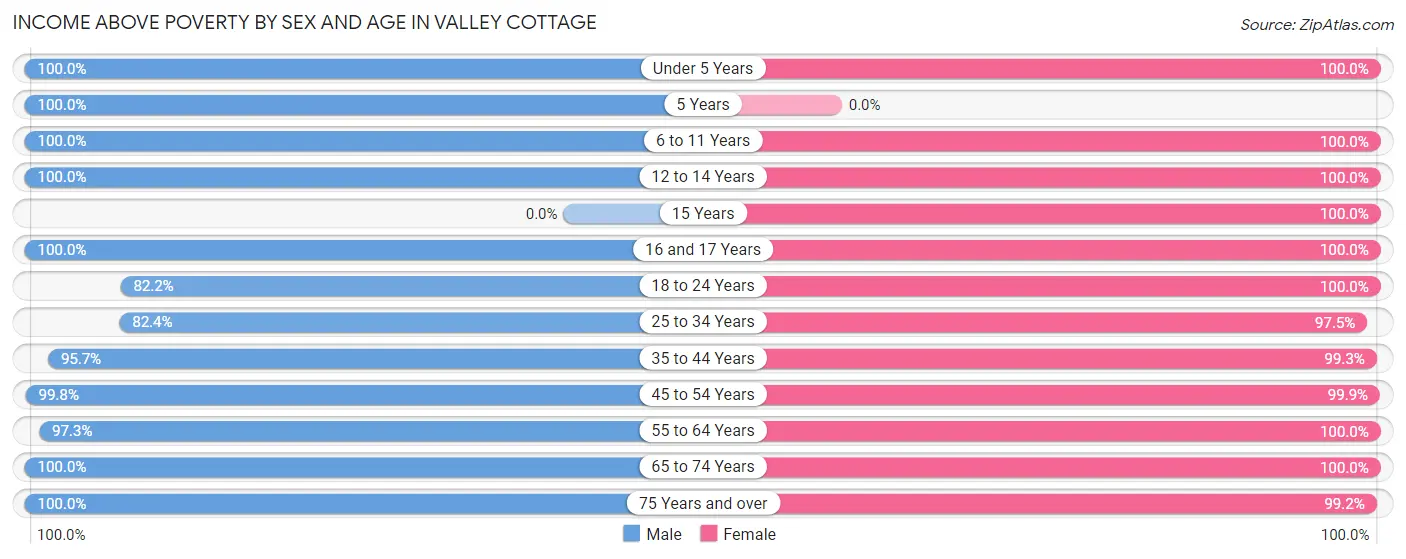
| Age Bracket | Male | Female |
| Under 5 Years | 116 (100.0%) | 142 (100.0%) |
| 5 Years | 54 (100.0%) | 0 (0.0%) |
| 6 to 11 Years | 316 (100.0%) | 199 (100.0%) |
| 12 to 14 Years | 175 (100.0%) | 59 (100.0%) |
| 15 Years | 0 (0.0%) | 86 (100.0%) |
| 16 and 17 Years | 31 (100.0%) | 157 (100.0%) |
| 18 to 24 Years | 291 (82.2%) | 346 (100.0%) |
| 25 to 34 Years | 675 (82.4%) | 549 (97.5%) |
| 35 to 44 Years | 353 (95.7%) | 406 (99.3%) |
| 45 to 54 Years | 557 (99.8%) | 868 (99.9%) |
| 55 to 64 Years | 616 (97.3%) | 737 (100.0%) |
| 65 to 74 Years | 650 (100.0%) | 573 (100.0%) |
| 75 Years and over | 258 (100.0%) | 392 (99.2%) |
| Total | 4,092 (94.4%) | 4,514 (99.5%) |
Income Below Poverty Among Married-Couple Families in Valley Cottage
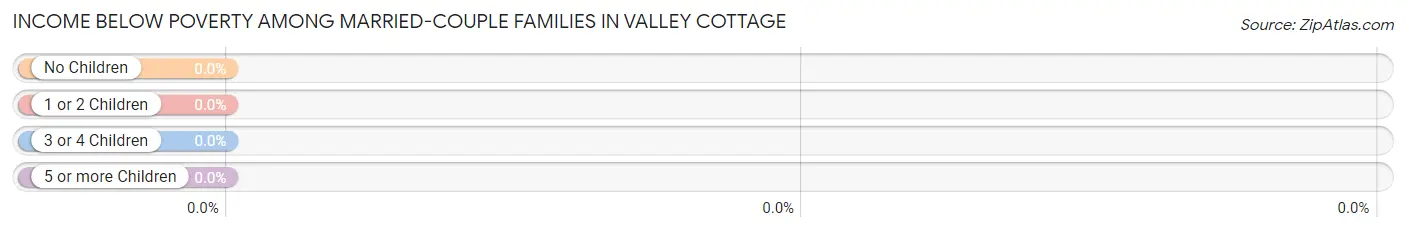
| Children | Above Poverty | Below Poverty |
| No Children | 1,269 (100.0%) | 0 (0.0%) |
| 1 or 2 Children | 586 (100.0%) | 0 (0.0%) |
| 3 or 4 Children | 150 (100.0%) | 0 (0.0%) |
| 5 or more Children | 0 (0.0%) | 0 (0.0%) |
| Total | 2,005 (100.0%) | 0 (0.0%) |
Income Below Poverty Among Single-Parent Households in Valley Cottage
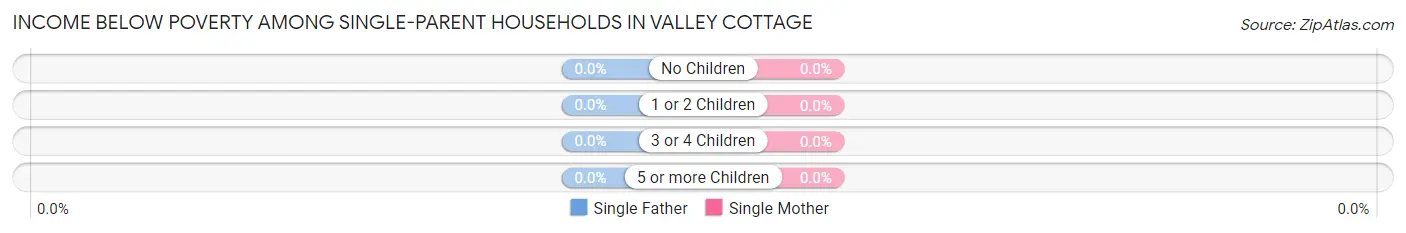
| Children | Single Father | Single Mother |
| No Children | 0 (0.0%) | 0 (0.0%) |
| 1 or 2 Children | 0 (0.0%) | 0 (0.0%) |
| 3 or 4 Children | 0 (0.0%) | 0 (0.0%) |
| 5 or more Children | 0 (0.0%) | 0 (0.0%) |
| Total | 0 (0.0%) | 0 (0.0%) |
Income Below Poverty Among Married-Couple vs Single-Parent Households in Valley Cottage
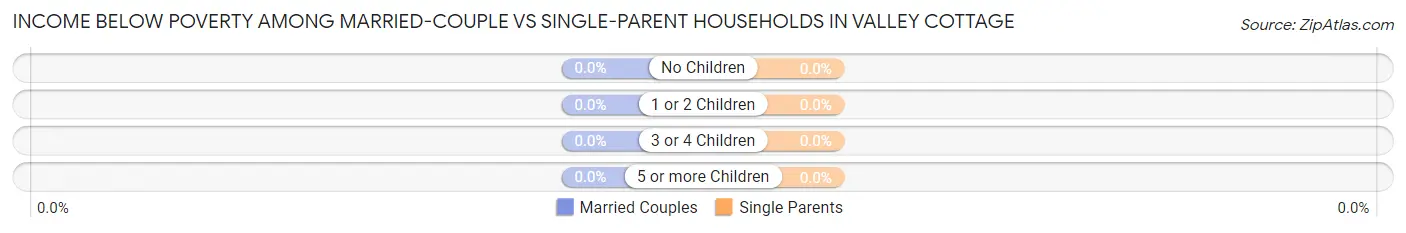
| Children | Married-Couple Families | Single-Parent Households |
| No Children | 0 (0.0%) | 0 (0.0%) |
| 1 or 2 Children | 0 (0.0%) | 0 (0.0%) |
| 3 or 4 Children | 0 (0.0%) | 0 (0.0%) |
| 5 or more Children | 0 (0.0%) | 0 (0.0%) |
| Total | 0 (0.0%) | 0 (0.0%) |
Race in Valley Cottage
The most populous races in Valley Cottage are White / Caucasian (6,071 | 66.9%), Asian (1,167 | 12.9%), and Hispanic or Latino (1,114 | 12.3%).
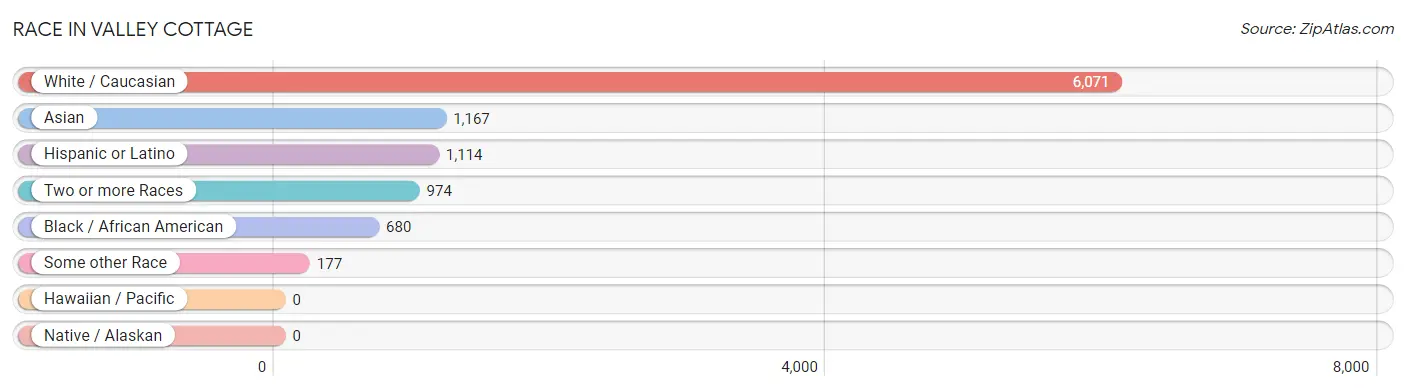
| Race | # Population | % Population |
| Asian | 1,167 | 12.9% |
| Black / African American | 680 | 7.5% |
| Hawaiian / Pacific | 0 | 0.0% |
| Hispanic or Latino | 1,114 | 12.3% |
| Native / Alaskan | 0 | 0.0% |
| White / Caucasian | 6,071 | 66.9% |
| Two or more Races | 974 | 10.7% |
| Some other Race | 177 | 1.9% |
| Total | 9,069 | 100.0% |
Ancestry in Valley Cottage
The most populous ancestries reported in Valley Cottage are Irish (1,649 | 18.2%), Italian (1,375 | 15.2%), German (819 | 9.0%), Korean (556 | 6.1%), and Puerto Rican (495 | 5.5%), together accounting for 54.0% of all Valley Cottage residents.
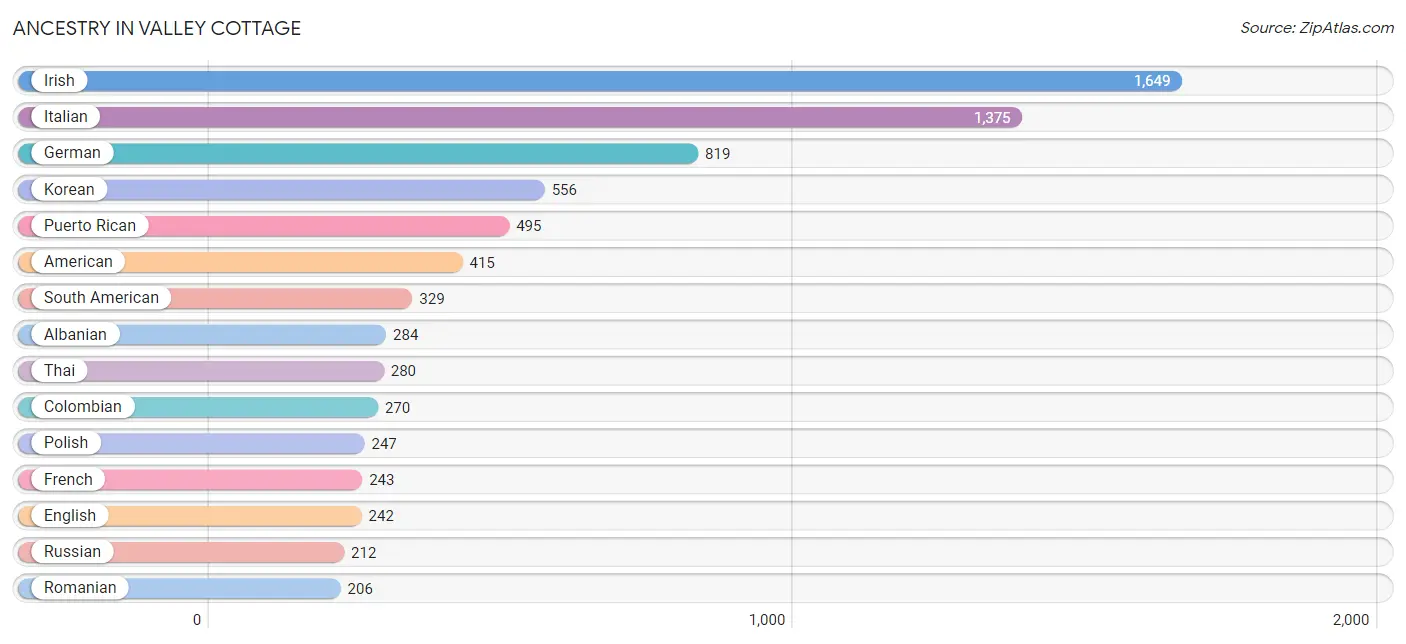
| Ancestry | # Population | % Population |
| African | 13 | 0.1% |
| Albanian | 284 | 3.1% |
| Alsatian | 13 | 0.1% |
| American | 415 | 4.6% |
| Armenian | 42 | 0.5% |
| Brazilian | 36 | 0.4% |
| Burmese | 22 | 0.2% |
| Canadian | 86 | 0.9% |
| Chilean | 10 | 0.1% |
| Colombian | 270 | 3.0% |
| Cuban | 24 | 0.3% |
| Czech | 25 | 0.3% |
| Czechoslovakian | 80 | 0.9% |
| Dominican | 43 | 0.5% |
| Dutch | 60 | 0.7% |
| Eastern European | 150 | 1.7% |
| Ecuadorian | 49 | 0.5% |
| English | 242 | 2.7% |
| Estonian | 24 | 0.3% |
| Finnish | 36 | 0.4% |
| French | 243 | 2.7% |
| German | 819 | 9.0% |
| Ghanaian | 183 | 2.0% |
| Greek | 98 | 1.1% |
| Haitian | 83 | 0.9% |
| Hungarian | 97 | 1.1% |
| Indian (Asian) | 136 | 1.5% |
| Iranian | 34 | 0.4% |
| Irish | 1,649 | 18.2% |
| Israeli | 99 | 1.1% |
| Italian | 1,375 | 15.2% |
| Korean | 556 | 6.1% |
| Mexican | 82 | 0.9% |
| Nigerian | 13 | 0.1% |
| Norwegian | 24 | 0.3% |
| Pennsylvania German | 5 | 0.1% |
| Polish | 247 | 2.7% |
| Portuguese | 11 | 0.1% |
| Puerto Rican | 495 | 5.5% |
| Romanian | 206 | 2.3% |
| Russian | 212 | 2.3% |
| Scandinavian | 58 | 0.6% |
| Scotch-Irish | 142 | 1.6% |
| Scottish | 45 | 0.5% |
| Slovak | 13 | 0.1% |
| Slovene | 18 | 0.2% |
| South American | 329 | 3.6% |
| Spaniard | 131 | 1.4% |
| Subsaharan African | 196 | 2.2% |
| Swiss | 16 | 0.2% |
| Thai | 280 | 3.1% |
| Trinidadian and Tobagonian | 34 | 0.4% |
| Turkish | 1 | 0.0% |
| Ukrainian | 50 | 0.5% |
| Vietnamese | 172 | 1.9% |
| Welsh | 30 | 0.3% |
| West Indian | 30 | 0.3% |
| Yugoslavian | 18 | 0.2% | View All 58 Rows |
Immigrants in Valley Cottage
The most numerous immigrant groups reported in Valley Cottage came from Asia (1,051 | 11.6%), Europe (604 | 6.7%), Philippines (478 | 5.3%), South Eastern Asia (478 | 5.3%), and South Central Asia (428 | 4.7%), together accounting for 33.5% of all Valley Cottage residents.
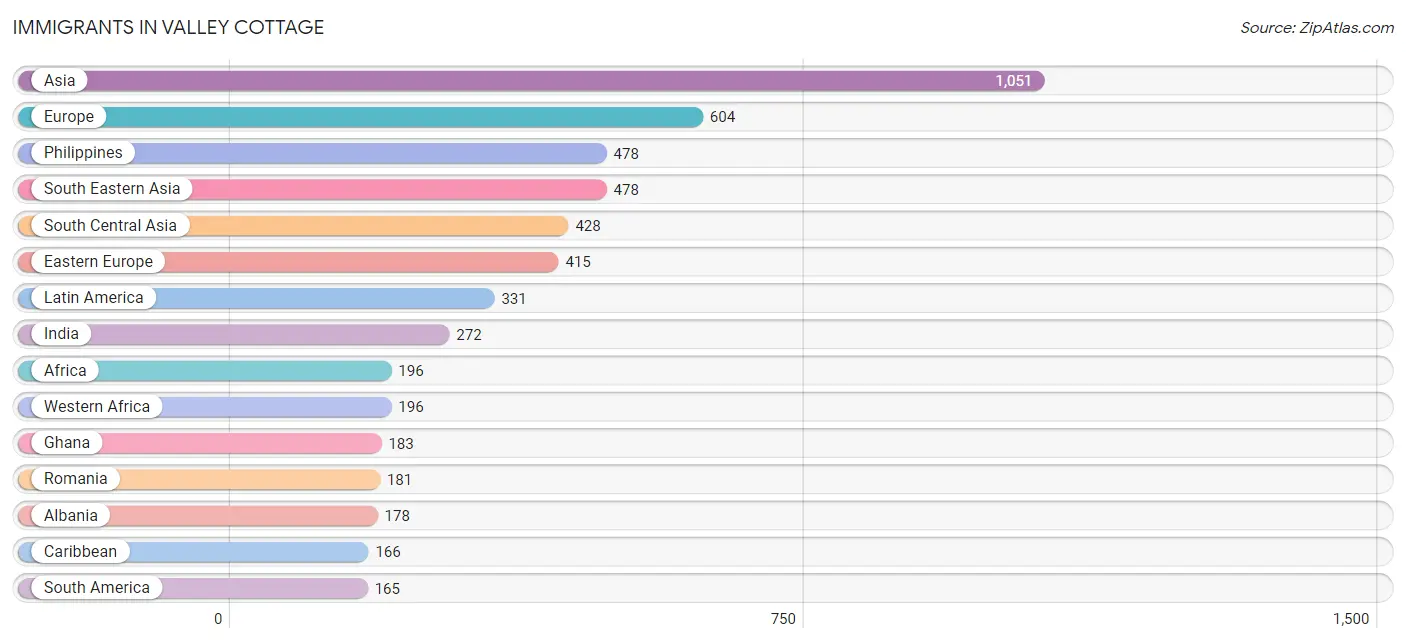
| Immigration Origin | # Population | % Population |
| Africa | 196 | 2.2% |
| Albania | 178 | 2.0% |
| Armenia | 9 | 0.1% |
| Asia | 1,051 | 11.6% |
| Bangladesh | 122 | 1.3% |
| Canada | 21 | 0.2% |
| Caribbean | 166 | 1.8% |
| China | 20 | 0.2% |
| Colombia | 147 | 1.6% |
| Dominican Republic | 53 | 0.6% |
| Eastern Asia | 42 | 0.5% |
| Eastern Europe | 415 | 4.6% |
| Ecuador | 18 | 0.2% |
| England | 12 | 0.1% |
| Europe | 604 | 6.7% |
| France | 12 | 0.1% |
| Germany | 34 | 0.4% |
| Ghana | 183 | 2.0% |
| Haiti | 39 | 0.4% |
| India | 272 | 3.0% |
| Iran | 34 | 0.4% |
| Ireland | 43 | 0.5% |
| Israel | 23 | 0.3% |
| Italy | 75 | 0.8% |
| Jamaica | 53 | 0.6% |
| Korea | 22 | 0.2% |
| Latin America | 331 | 3.6% |
| Nigeria | 13 | 0.1% |
| Northern Europe | 55 | 0.6% |
| Philippines | 478 | 5.3% |
| Romania | 181 | 2.0% |
| Russia | 53 | 0.6% |
| Saudi Arabia | 50 | 0.5% |
| South America | 165 | 1.8% |
| South Central Asia | 428 | 4.7% |
| South Eastern Asia | 478 | 5.3% |
| Southern Europe | 88 | 1.0% |
| Spain | 13 | 0.1% |
| Taiwan | 20 | 0.2% |
| Trinidad and Tobago | 21 | 0.2% |
| Turkey | 1 | 0.0% |
| Ukraine | 3 | 0.0% |
| Western Africa | 196 | 2.2% |
| Western Asia | 103 | 1.1% |
| Western Europe | 46 | 0.5% | View All 45 Rows |
Sex and Age in Valley Cottage
Sex and Age in Valley Cottage
The most populous age groups in Valley Cottage are 25 to 29 Years (459 | 10.3%) for men and 55 to 59 Years (521 | 11.3%) for women.
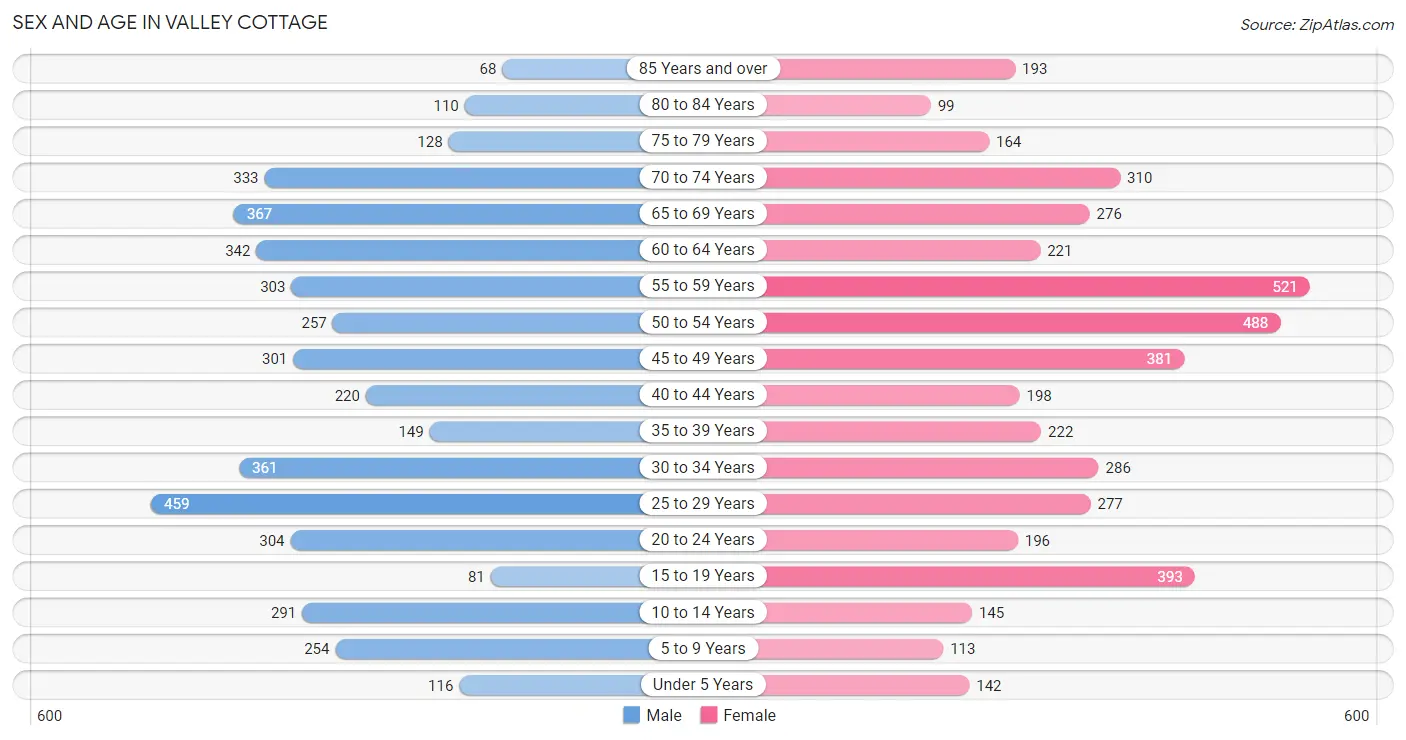
| Age Bracket | Male | Female |
| Under 5 Years | 116 (2.6%) | 142 (3.1%) |
| 5 to 9 Years | 254 (5.7%) | 113 (2.4%) |
| 10 to 14 Years | 291 (6.6%) | 145 (3.1%) |
| 15 to 19 Years | 81 (1.8%) | 393 (8.5%) |
| 20 to 24 Years | 304 (6.8%) | 196 (4.2%) |
| 25 to 29 Years | 459 (10.3%) | 277 (6.0%) |
| 30 to 34 Years | 361 (8.1%) | 286 (6.2%) |
| 35 to 39 Years | 149 (3.4%) | 222 (4.8%) |
| 40 to 44 Years | 220 (5.0%) | 198 (4.3%) |
| 45 to 49 Years | 301 (6.8%) | 381 (8.2%) |
| 50 to 54 Years | 257 (5.8%) | 488 (10.5%) |
| 55 to 59 Years | 303 (6.8%) | 521 (11.3%) |
| 60 to 64 Years | 342 (7.7%) | 221 (4.8%) |
| 65 to 69 Years | 367 (8.3%) | 276 (6.0%) |
| 70 to 74 Years | 333 (7.5%) | 310 (6.7%) |
| 75 to 79 Years | 128 (2.9%) | 164 (3.5%) |
| 80 to 84 Years | 110 (2.5%) | 99 (2.1%) |
| 85 Years and over | 68 (1.5%) | 193 (4.2%) |
| Total | 4,444 (100.0%) | 4,625 (100.0%) |
Families and Households in Valley Cottage
Median Family Size in Valley Cottage
The median family size in Valley Cottage is 3.09 persons per family, with married-couple families (2,005 | 83.3%) accounting for the largest median family size of 3.16 persons per family. On the other hand, single male/father families (94 | 3.9%) represent the smallest median family size with 2.54 persons per family.
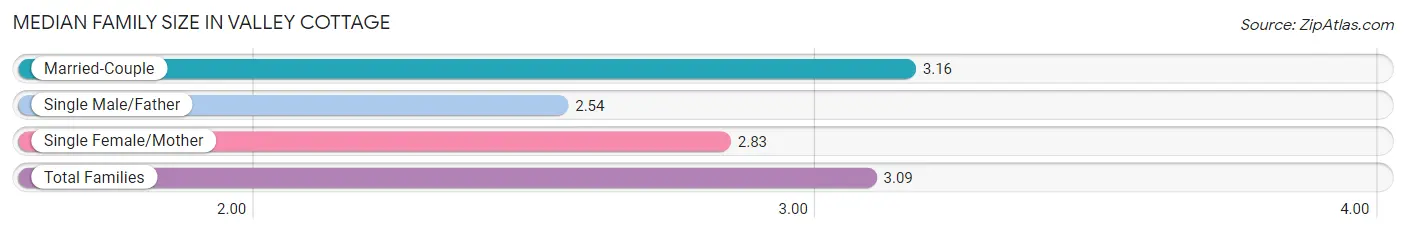
| Family Type | # Families | Family Size |
| Married-Couple | 2,005 (83.3%) | 3.16 |
| Single Male/Father | 94 (3.9%) | 2.54 |
| Single Female/Mother | 308 (12.8%) | 2.83 |
| Total Families | 2,407 (100.0%) | 3.09 |
Median Household Size in Valley Cottage
The median household size in Valley Cottage is 2.58 persons per household, with single female/mother households (308 | 9.0%) accounting for the largest median household size of 3.31 persons per household. non-family households (1,013 | 29.6%) represent the smallest median household size with 1.18 persons per household.
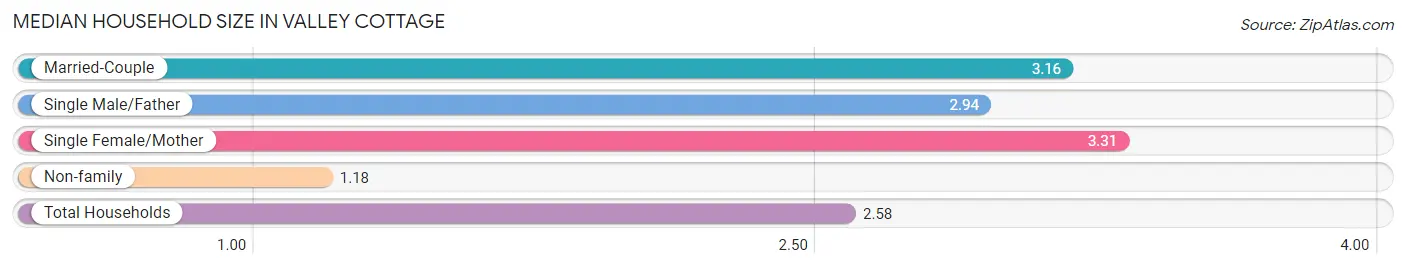
| Household Type | # Households | Household Size |
| Married-Couple | 2,005 (58.6%) | 3.16 |
| Single Male/Father | 94 (2.8%) | 2.94 |
| Single Female/Mother | 308 (9.0%) | 3.31 |
| Non-family | 1,013 (29.6%) | 1.18 |
| Total Households | 3,420 (100.0%) | 2.58 |
Household Size by Marriage Status in Valley Cottage
Out of a total of 3,420 households in Valley Cottage, 2,407 (70.4%) are family households, while 1,013 (29.6%) are nonfamily households. The most numerous type of family households are 2-person households, comprising 1,069, and the most common type of nonfamily households are 1-person households, comprising 843.
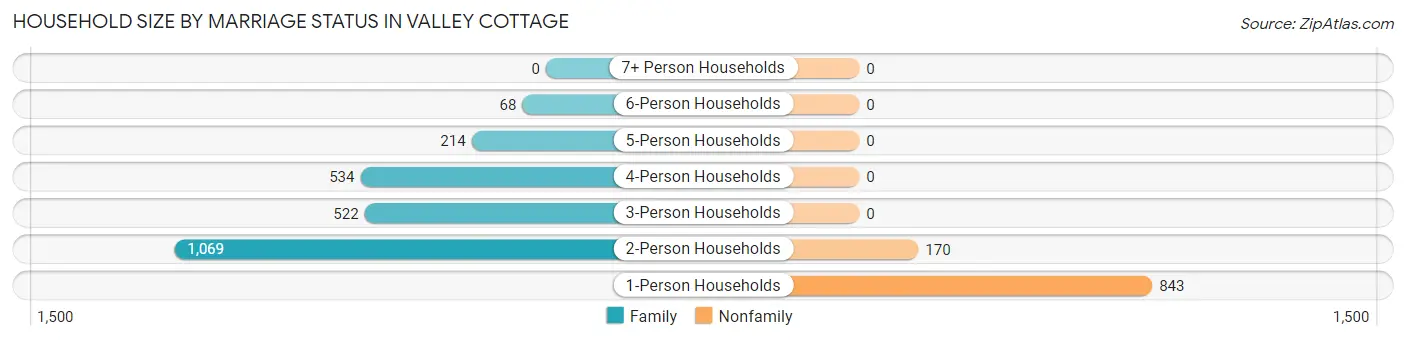
| Household Size | Family Households | Nonfamily Households |
| 1-Person Households | - | 843 (24.6%) |
| 2-Person Households | 1,069 (31.3%) | 170 (5.0%) |
| 3-Person Households | 522 (15.3%) | 0 (0.0%) |
| 4-Person Households | 534 (15.6%) | 0 (0.0%) |
| 5-Person Households | 214 (6.3%) | 0 (0.0%) |
| 6-Person Households | 68 (2.0%) | 0 (0.0%) |
| 7+ Person Households | 0 (0.0%) | 0 (0.0%) |
| Total | 2,407 (70.4%) | 1,013 (29.6%) |
Female Fertility in Valley Cottage
Fertility by Age in Valley Cottage
Average fertility rate in Valley Cottage is 26.0 births per 1,000 women. Women in the age bracket of 20 to 34 years have the highest fertility rate with 36.0 births per 1,000 women. Women in the age bracket of 20 to 34 years acount for 51.9% of all women with births.
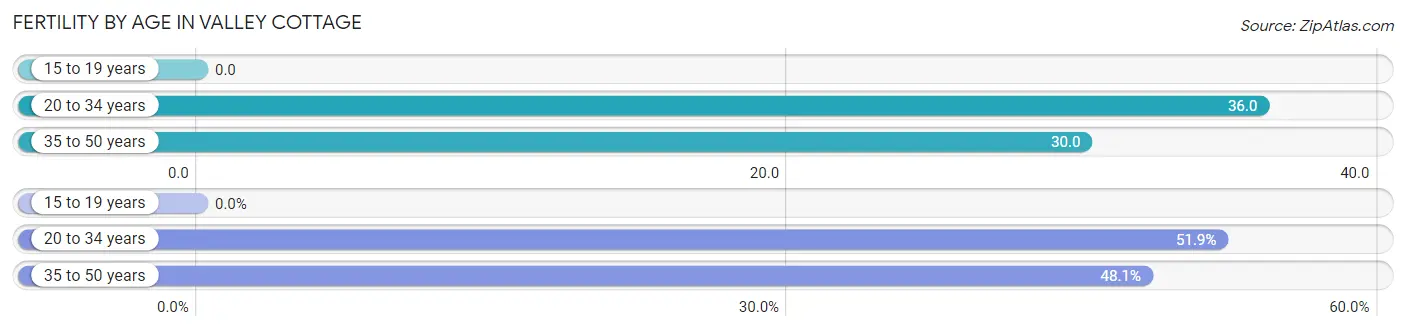
| Age Bracket | Women with Births | Births / 1,000 Women |
| 15 to 19 years | 0 (0.0%) | 0.0 |
| 20 to 34 years | 27 (51.9%) | 36.0 |
| 35 to 50 years | 25 (48.1%) | 30.0 |
| Total | 52 (100.0%) | 26.0 |
Fertility by Age by Marriage Status in Valley Cottage
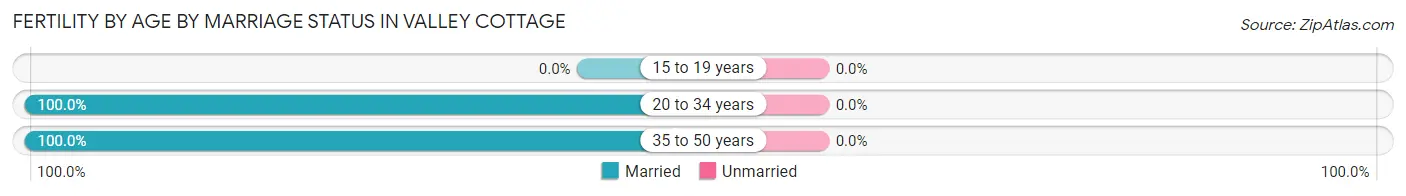
| Age Bracket | Married | Unmarried |
| 15 to 19 years | 0 (0.0%) | 0 (0.0%) |
| 20 to 34 years | 27 (100.0%) | 0 (0.0%) |
| 35 to 50 years | 25 (100.0%) | 0 (0.0%) |
| Total | 52 (100.0%) | 0 (0.0%) |
Fertility by Education in Valley Cottage
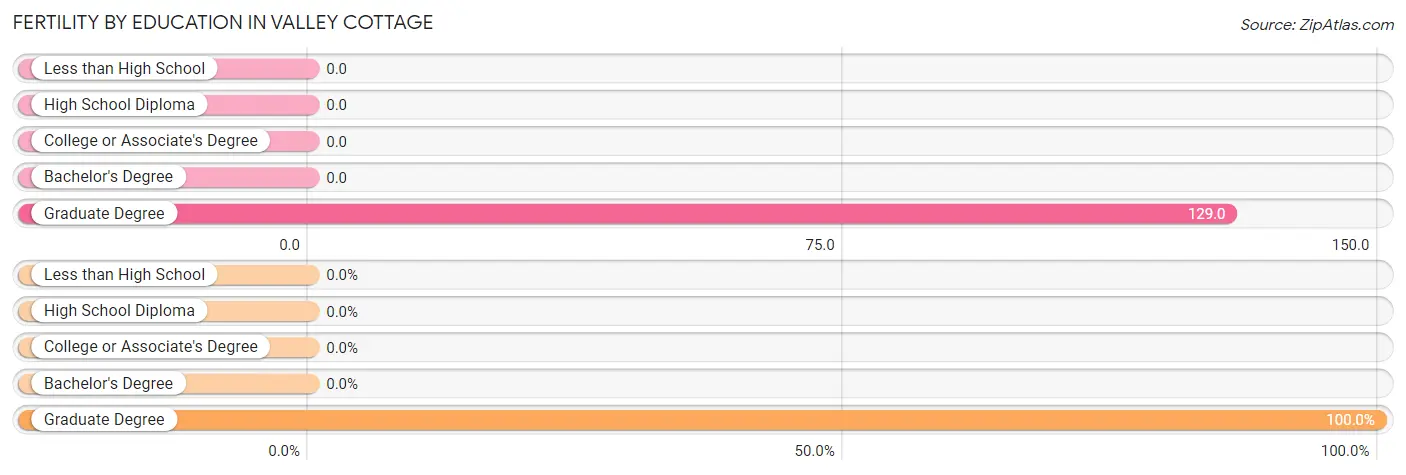
| Educational Attainment | Women with Births | Births / 1,000 Women |
| Less than High School | 0 (0.0%) | 0.0 |
| High School Diploma | 0 (0.0%) | 0.0 |
| College or Associate's Degree | 0 (0.0%) | 0.0 |
| Bachelor's Degree | 0 (0.0%) | 0.0 |
| Graduate Degree | 52 (100.0%) | 129.0 |
| Total | 52 (100.0%) | 26.0 |
Fertility by Education by Marriage Status in Valley Cottage
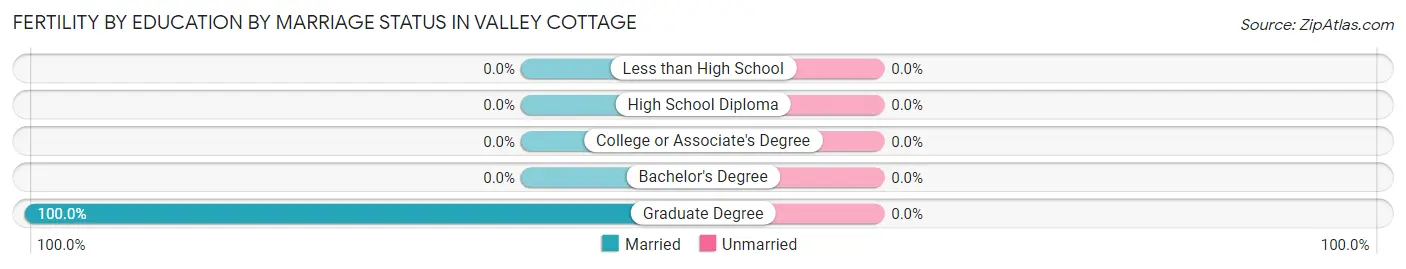
| Educational Attainment | Married | Unmarried |
| Less than High School | 0 (0.0%) | 0 (0.0%) |
| High School Diploma | 0 (0.0%) | 0 (0.0%) |
| College or Associate's Degree | 0 (0.0%) | 0 (0.0%) |
| Bachelor's Degree | 0 (0.0%) | 0 (0.0%) |
| Graduate Degree | 52 (100.0%) | 0 (0.0%) |
| Total | 52 (100.0%) | 0 (0.0%) |
Employment Characteristics in Valley Cottage
Employment by Class of Employer in Valley Cottage
Among the 4,802 employed individuals in Valley Cottage, private company employees (2,599 | 54.1%), local government employees (733 | 15.3%), and not-for-profit organizations (723 | 15.1%) make up the most common classes of employment.
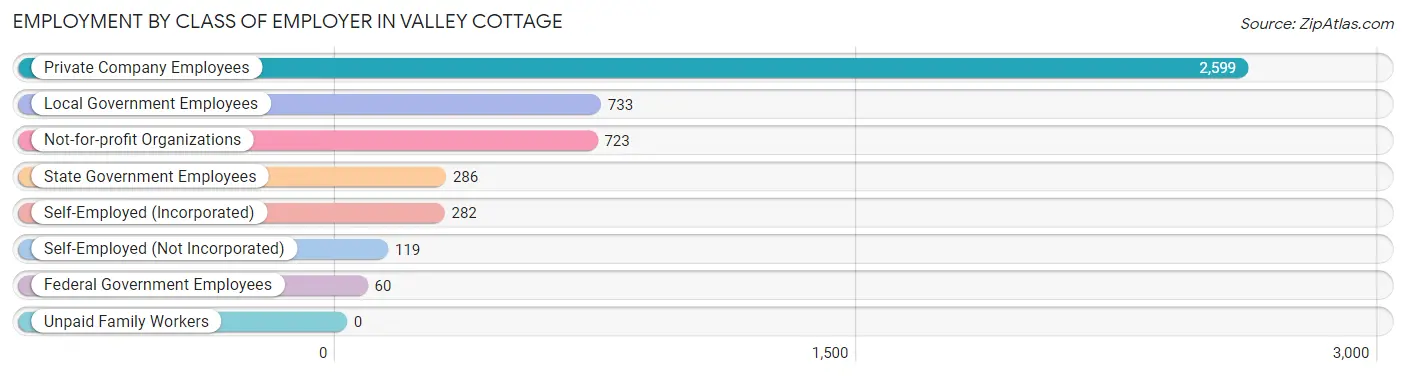
| Employer Class | # Employees | % Employees |
| Private Company Employees | 2,599 | 54.1% |
| Self-Employed (Incorporated) | 282 | 5.9% |
| Self-Employed (Not Incorporated) | 119 | 2.5% |
| Not-for-profit Organizations | 723 | 15.1% |
| Local Government Employees | 733 | 15.3% |
| State Government Employees | 286 | 6.0% |
| Federal Government Employees | 60 | 1.3% |
| Unpaid Family Workers | 0 | 0.0% |
| Total | 4,802 | 100.0% |
Employment Status by Age in Valley Cottage
According to the labor force statistics for Valley Cottage, out of the total population over 16 years of age (7,922), 66.6% or 5,276 individuals are in the labor force, with 8.3% or 438 of them unemployed. The age group with the highest labor force participation rate is 35 to 44 years, with 92.9% or 733 individuals in the labor force. Within the labor force, the 55 to 59 years age range has the highest percentage of unemployed individuals, with 30.9% or 216 of them being unemployed.
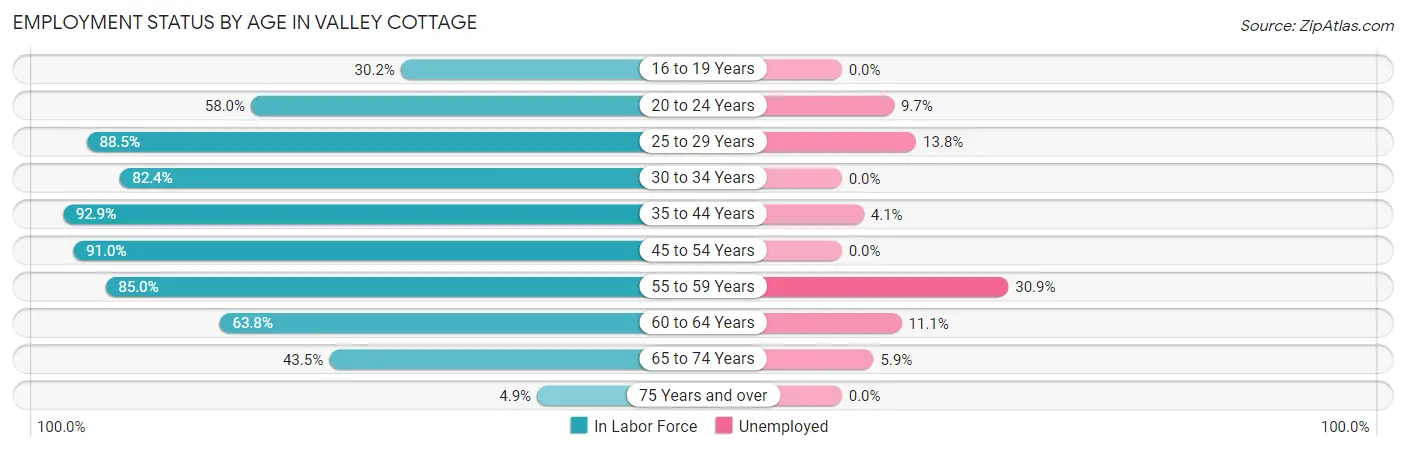
| Age Bracket | In Labor Force | Unemployed |
| 16 to 19 Years | 117 (30.2%) | 0 (0.0%) |
| 20 to 24 Years | 290 (58.0%) | 28 (9.7%) |
| 25 to 29 Years | 651 (88.5%) | 90 (13.8%) |
| 30 to 34 Years | 533 (82.4%) | 0 (0.0%) |
| 35 to 44 Years | 733 (92.9%) | 30 (4.1%) |
| 45 to 54 Years | 1,299 (91.0%) | 0 (0.0%) |
| 55 to 59 Years | 700 (85.0%) | 216 (30.9%) |
| 60 to 64 Years | 359 (63.8%) | 40 (11.1%) |
| 65 to 74 Years | 559 (43.5%) | 33 (5.9%) |
| 75 Years and over | 37 (4.9%) | 0 (0.0%) |
| Total | 5,276 (66.6%) | 438 (8.3%) |
Employment Status by Educational Attainment in Valley Cottage
According to labor force statistics for Valley Cottage, 85.7% of individuals (4,273) out of the total population between 25 and 64 years of age (4,986) are in the labor force, with 8.8% or 376 of them being unemployed. The group with the highest labor force participation rate are those with the educational attainment of college / associate degree, with 89.2% or 1,063 individuals in the labor force. Within the labor force, individuals with high school diploma education have the highest percentage of unemployment, with 36.2% or 217 of them being unemployed.
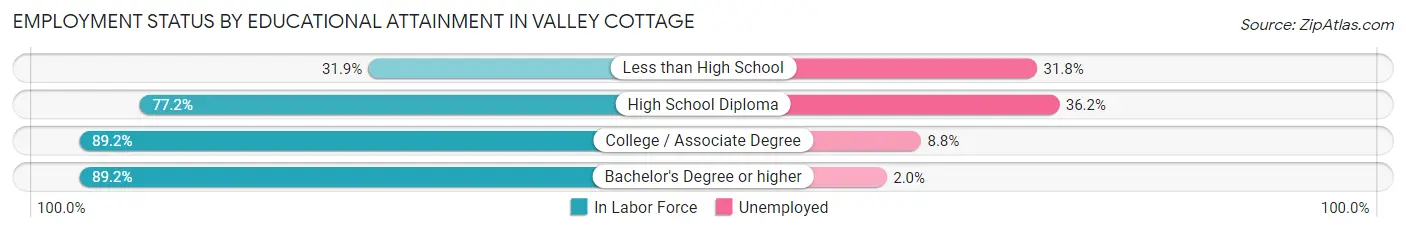
| Educational Attainment | In Labor Force | Unemployed |
| Less than High School | 44 (31.9%) | 44 (31.8%) |
| High School Diploma | 599 (77.2%) | 281 (36.2%) |
| College / Associate Degree | 1,063 (89.2%) | 105 (8.8%) |
| Bachelor's Degree or higher | 2,569 (89.2%) | 58 (2.0%) |
| Total | 4,273 (85.7%) | 439 (8.8%) |
Employment Occupations by Sex in Valley Cottage
Management, Business, Science and Arts Occupations
The most common Management, Business, Science and Arts occupations in Valley Cottage are Community & Social Service (1,136 | 23.5%), Management (876 | 18.1%), Education Instruction & Library (671 | 13.9%), Business & Financial (399 | 8.2%), and Health Diagnosing & Treating (382 | 7.9%).
Management, Business, Science and Arts Occupations by Sex
Within the Management, Business, Science and Arts occupations in Valley Cottage, the most male-oriented occupations are Architecture & Engineering (100.0%), Life, Physical & Social Science (100.0%), and Computers, Engineering & Science (68.1%), while the most female-oriented occupations are Education Instruction & Library (76.9%), Computers & Mathematics (64.7%), and Community & Social Service (59.4%).
| Occupation | Male | Female |
| Management | 436 (49.8%) | 440 (50.2%) |
| Business & Financial | 216 (54.1%) | 183 (45.9%) |
| Computers, Engineering & Science | 141 (68.1%) | 66 (31.9%) |
| Computers & Mathematics | 36 (35.3%) | 66 (64.7%) |
| Architecture & Engineering | 90 (100.0%) | 0 (0.0%) |
| Life, Physical & Social Science | 15 (100.0%) | 0 (0.0%) |
| Community & Social Service | 461 (40.6%) | 675 (59.4%) |
| Education, Arts & Media | 44 (60.3%) | 29 (39.7%) |
| Legal Services & Support | 97 (65.1%) | 52 (34.9%) |
| Education Instruction & Library | 155 (23.1%) | 516 (76.9%) |
| Arts, Media & Entertainment | 165 (67.9%) | 78 (32.1%) |
| Health Diagnosing & Treating | 177 (46.3%) | 205 (53.7%) |
| Health Technologists | 137 (41.9%) | 190 (58.1%) |
| Total (Category) | 1,431 (47.7%) | 1,569 (52.3%) |
| Total (Overall) | 2,438 (50.3%) | 2,404 (49.6%) |
Services Occupations
The most common Services occupations in Valley Cottage are Security & Protection (191 | 3.9%), Law Enforcement (177 | 3.7%), Personal Care & Service (176 | 3.6%), Food Preparation & Serving (92 | 1.9%), and Cleaning & Maintenance (87 | 1.8%).
Services Occupations by Sex
Within the Services occupations in Valley Cottage, the most male-oriented occupations are Security & Protection (100.0%), Firefighting & Prevention (100.0%), and Law Enforcement (100.0%), while the most female-oriented occupations are Healthcare Support (100.0%), Cleaning & Maintenance (78.2%), and Food Preparation & Serving (70.7%).
| Occupation | Male | Female |
| Healthcare Support | 0 (0.0%) | 77 (100.0%) |
| Security & Protection | 191 (100.0%) | 0 (0.0%) |
| Firefighting & Prevention | 14 (100.0%) | 0 (0.0%) |
| Law Enforcement | 177 (100.0%) | 0 (0.0%) |
| Food Preparation & Serving | 27 (29.3%) | 65 (70.7%) |
| Cleaning & Maintenance | 19 (21.8%) | 68 (78.2%) |
| Personal Care & Service | 121 (68.8%) | 55 (31.2%) |
| Total (Category) | 358 (57.5%) | 265 (42.5%) |
| Total (Overall) | 2,438 (50.3%) | 2,404 (49.6%) |
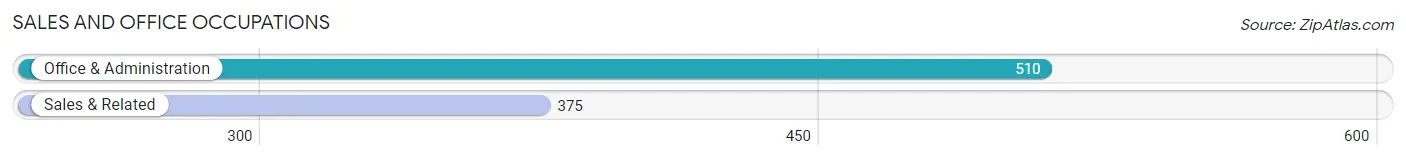
Sales and Office Occupations
The most common Sales and Office occupations in Valley Cottage are Office & Administration (510 | 10.5%), and Sales & Related (375 | 7.7%).
Sales and Office Occupations by Sex
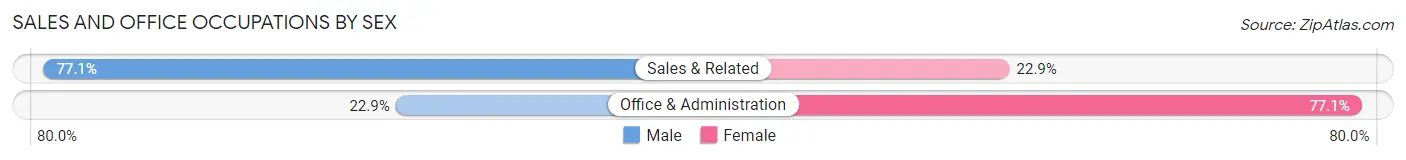
| Occupation | Male | Female |
| Sales & Related | 289 (77.1%) | 86 (22.9%) |
| Office & Administration | 117 (22.9%) | 393 (77.1%) |
| Total (Category) | 406 (45.9%) | 479 (54.1%) |
| Total (Overall) | 2,438 (50.3%) | 2,404 (49.6%) |
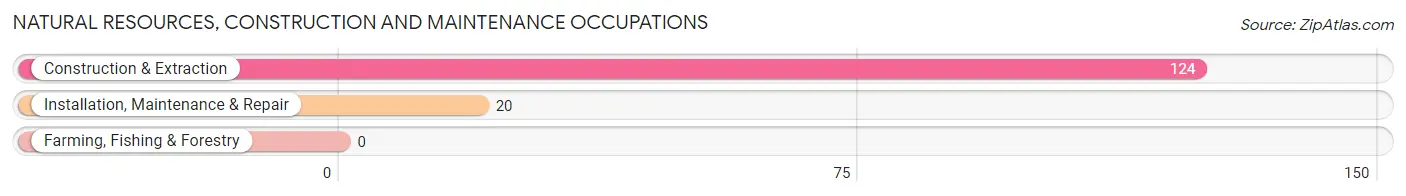
Natural Resources, Construction and Maintenance Occupations
The most common Natural Resources, Construction and Maintenance occupations in Valley Cottage are Construction & Extraction (124 | 2.6%), and Installation, Maintenance & Repair (20 | 0.4%).
Natural Resources, Construction and Maintenance Occupations by Sex
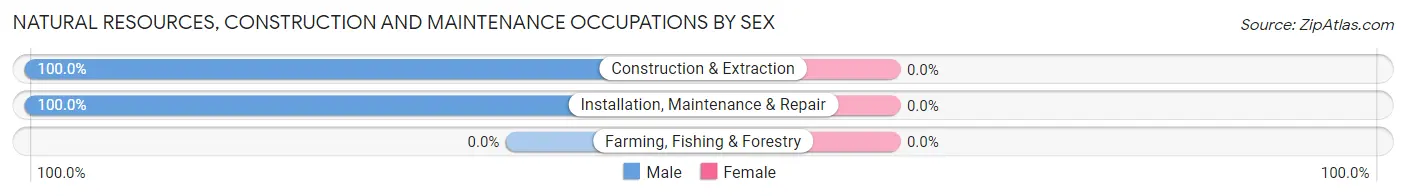
| Occupation | Male | Female |
| Farming, Fishing & Forestry | 0 (0.0%) | 0 (0.0%) |
| Construction & Extraction | 124 (100.0%) | 0 (0.0%) |
| Installation, Maintenance & Repair | 20 (100.0%) | 0 (0.0%) |
| Total (Category) | 144 (100.0%) | 0 (0.0%) |
| Total (Overall) | 2,438 (50.3%) | 2,404 (49.6%) |
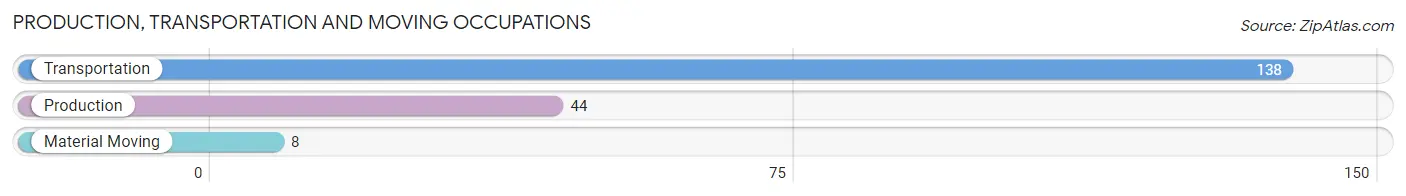
Production, Transportation and Moving Occupations
The most common Production, Transportation and Moving occupations in Valley Cottage are Transportation (138 | 2.9%), Production (44 | 0.9%), and Material Moving (8 | 0.2%).
Production, Transportation and Moving Occupations by Sex
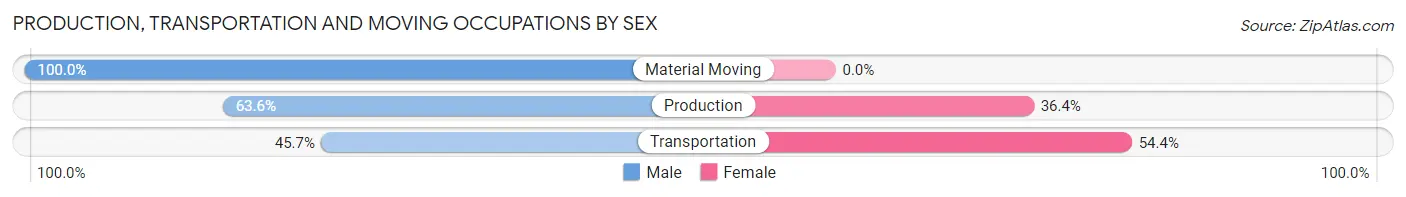
| Occupation | Male | Female |
| Production | 28 (63.6%) | 16 (36.4%) |
| Transportation | 63 (45.7%) | 75 (54.3%) |
| Material Moving | 8 (100.0%) | 0 (0.0%) |
| Total (Category) | 99 (52.1%) | 91 (47.9%) |
| Total (Overall) | 2,438 (50.3%) | 2,404 (49.6%) |
Employment Industries by Sex in Valley Cottage
Employment Industries in Valley Cottage
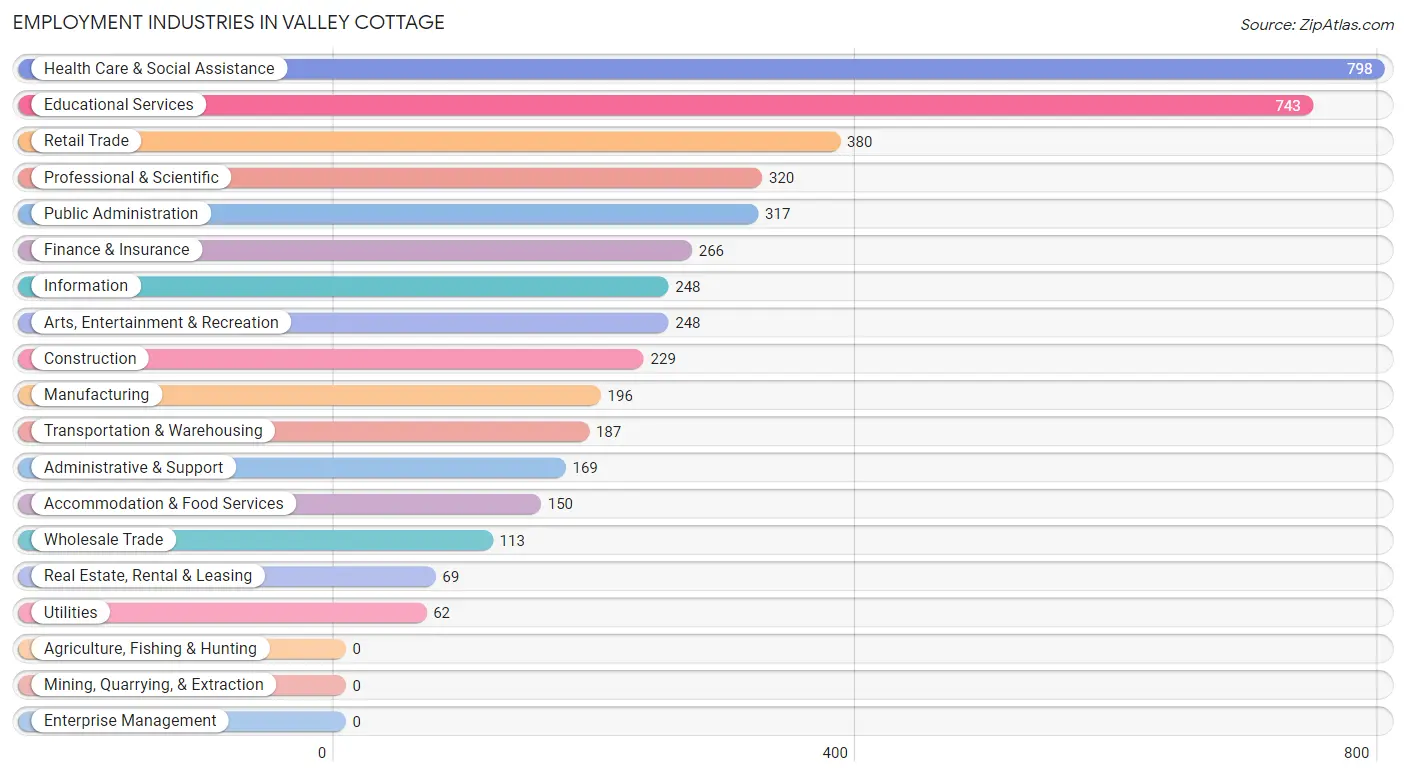
The major employment industries in Valley Cottage include Health Care & Social Assistance (798 | 16.5%), Educational Services (743 | 15.3%), Retail Trade (380 | 7.9%), Professional & Scientific (320 | 6.6%), and Public Administration (317 | 6.6%).
Employment Industries by Sex in Valley Cottage
The Valley Cottage industries that see more men than women are Utilities (100.0%), Arts, Entertainment & Recreation (95.2%), and Construction (88.6%), whereas the industries that tend to have a higher number of women are Educational Services (89.9%), Real Estate, Rental & Leasing (75.4%), and Accommodation & Food Services (73.3%).
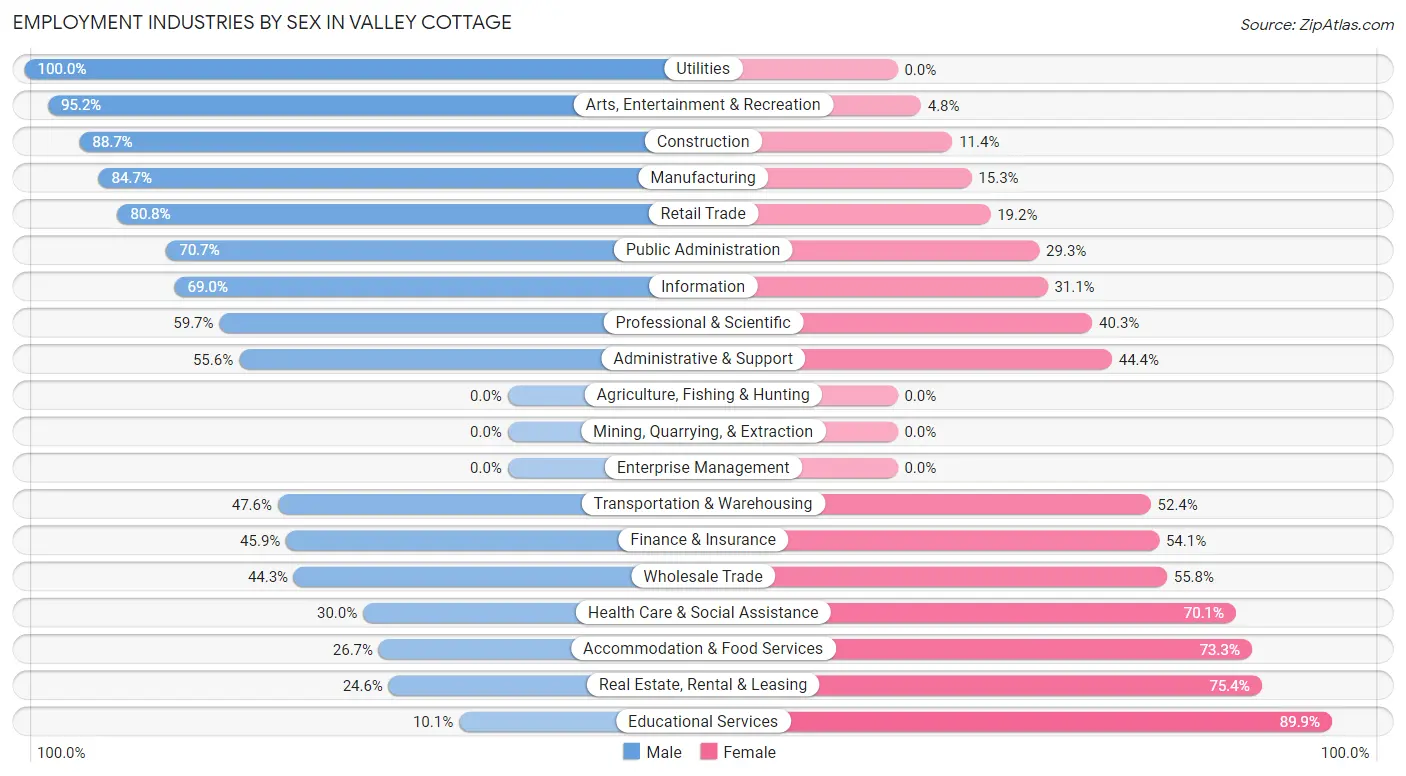
| Industry | Male | Female |
| Agriculture, Fishing & Hunting | 0 (0.0%) | 0 (0.0%) |
| Mining, Quarrying, & Extraction | 0 (0.0%) | 0 (0.0%) |
| Construction | 203 (88.6%) | 26 (11.4%) |
| Manufacturing | 166 (84.7%) | 30 (15.3%) |
| Wholesale Trade | 50 (44.3%) | 63 (55.7%) |
| Retail Trade | 307 (80.8%) | 73 (19.2%) |
| Transportation & Warehousing | 89 (47.6%) | 98 (52.4%) |
| Utilities | 62 (100.0%) | 0 (0.0%) |
| Information | 171 (69.0%) | 77 (31.0%) |
| Finance & Insurance | 122 (45.9%) | 144 (54.1%) |
| Real Estate, Rental & Leasing | 17 (24.6%) | 52 (75.4%) |
| Professional & Scientific | 191 (59.7%) | 129 (40.3%) |
| Enterprise Management | 0 (0.0%) | 0 (0.0%) |
| Administrative & Support | 94 (55.6%) | 75 (44.4%) |
| Educational Services | 75 (10.1%) | 668 (89.9%) |
| Health Care & Social Assistance | 239 (29.9%) | 559 (70.1%) |
| Arts, Entertainment & Recreation | 236 (95.2%) | 12 (4.8%) |
| Accommodation & Food Services | 40 (26.7%) | 110 (73.3%) |
| Public Administration | 224 (70.7%) | 93 (29.3%) |
| Total | 2,438 (50.3%) | 2,404 (49.6%) |
Education in Valley Cottage
School Enrollment in Valley Cottage
The most common levels of schooling among the 1,729 students in Valley Cottage are middle school (413 | 23.9%), college / undergraduate (408 | 23.6%), and high school (289 | 16.7%).
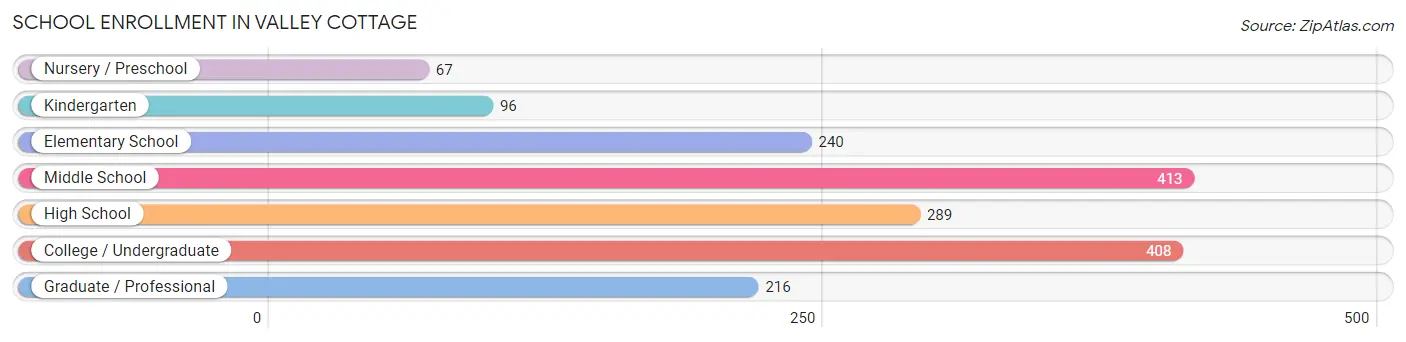
| School Level | # Students | % Students |
| Nursery / Preschool | 67 | 3.9% |
| Kindergarten | 96 | 5.6% |
| Elementary School | 240 | 13.9% |
| Middle School | 413 | 23.9% |
| High School | 289 | 16.7% |
| College / Undergraduate | 408 | 23.6% |
| Graduate / Professional | 216 | 12.5% |
| Total | 1,729 | 100.0% |
School Enrollment by Age by Funding Source in Valley Cottage
Out of a total of 1,729 students who are enrolled in schools in Valley Cottage, 233 (13.5%) attend a private institution, while the remaining 1,496 (86.5%) are enrolled in public schools. The age group of 3 to 4 year olds has the highest likelihood of being enrolled in private schools, with 36 (100.0% in the age bracket) enrolled. Conversely, the age group of 18 to 19 year olds has the lowest likelihood of being enrolled in a private school, with 200 (100.0% in the age bracket) attending a public institution.
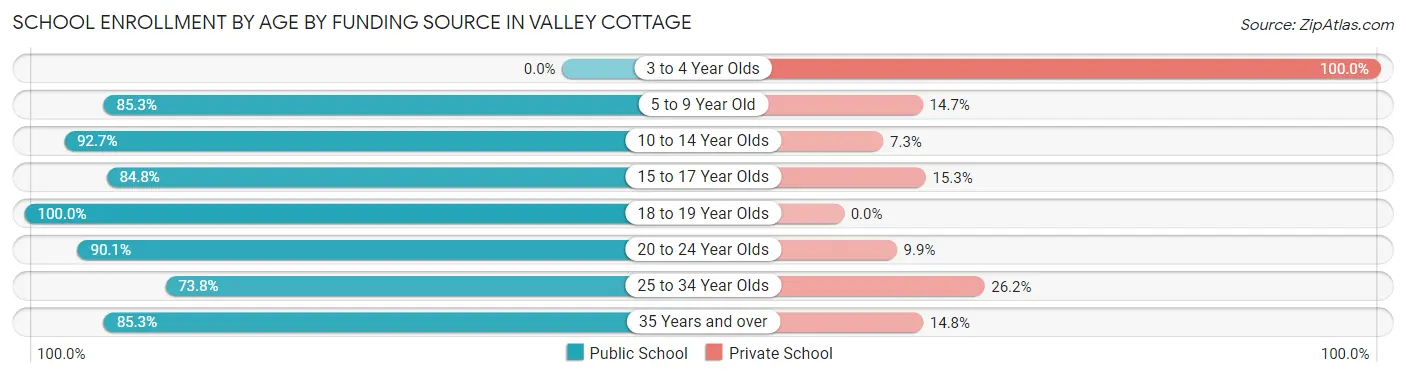
| Age Bracket | Public School | Private School |
| 3 to 4 Year Olds | 0 (0.0%) | 36 (100.0%) |
| 5 to 9 Year Old | 313 (85.3%) | 54 (14.7%) |
| 10 to 14 Year Olds | 404 (92.7%) | 32 (7.3%) |
| 15 to 17 Year Olds | 150 (84.8%) | 27 (15.2%) |
| 18 to 19 Year Olds | 200 (100.0%) | 0 (0.0%) |
| 20 to 24 Year Olds | 201 (90.1%) | 22 (9.9%) |
| 25 to 34 Year Olds | 124 (73.8%) | 44 (26.2%) |
| 35 Years and over | 104 (85.3%) | 18 (14.7%) |
| Total | 1,496 (86.5%) | 233 (13.5%) |
Educational Attainment by Field of Study in Valley Cottage
Business (816 | 19.6%), education (521 | 12.5%), science & technology (494 | 11.8%), social sciences (427 | 10.2%), and visual & performing arts (337 | 8.1%) are the most common fields of study among 4,174 individuals in Valley Cottage who have obtained a bachelor's degree or higher.
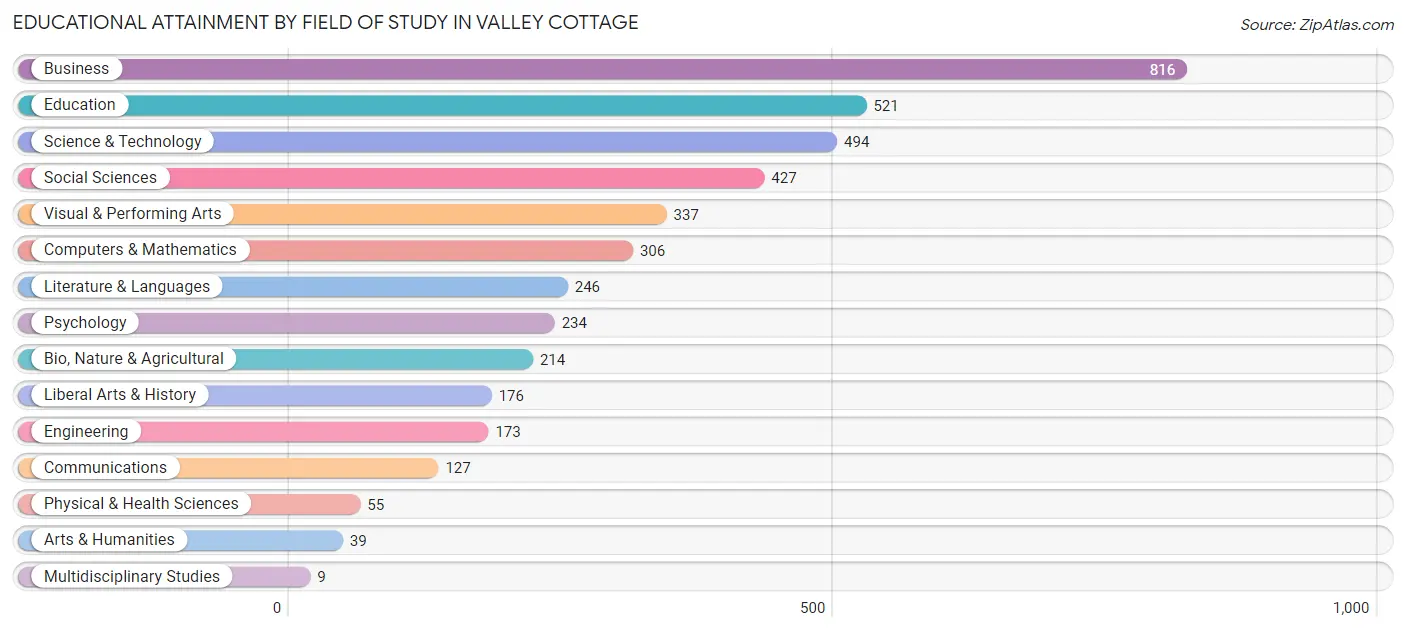
| Field of Study | # Graduates | % Graduates |
| Computers & Mathematics | 306 | 7.3% |
| Bio, Nature & Agricultural | 214 | 5.1% |
| Physical & Health Sciences | 55 | 1.3% |
| Psychology | 234 | 5.6% |
| Social Sciences | 427 | 10.2% |
| Engineering | 173 | 4.1% |
| Multidisciplinary Studies | 9 | 0.2% |
| Science & Technology | 494 | 11.8% |
| Business | 816 | 19.6% |
| Education | 521 | 12.5% |
| Literature & Languages | 246 | 5.9% |
| Liberal Arts & History | 176 | 4.2% |
| Visual & Performing Arts | 337 | 8.1% |
| Communications | 127 | 3.0% |
| Arts & Humanities | 39 | 0.9% |
| Total | 4,174 | 100.0% |
Transportation & Commute in Valley Cottage
Vehicle Availability by Sex in Valley Cottage
The most prevalent vehicle ownership categories in Valley Cottage are males with 2 vehicles (1,136, accounting for 46.6%) and females with 2 vehicles (953, making up 48.1%).
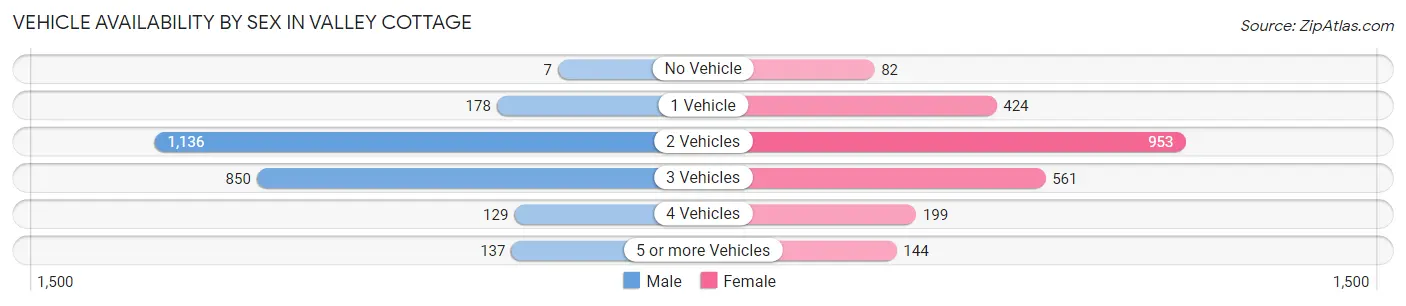
| Vehicles Available | Male | Female |
| No Vehicle | 7 (0.3%) | 82 (3.5%) |
| 1 Vehicle | 178 (7.3%) | 424 (17.9%) |
| 2 Vehicles | 1,136 (46.6%) | 953 (40.3%) |
| 3 Vehicles | 850 (34.9%) | 561 (23.7%) |
| 4 Vehicles | 129 (5.3%) | 199 (8.4%) |
| 5 or more Vehicles | 137 (5.6%) | 144 (6.1%) |
| Total | 2,437 (100.0%) | 2,363 (100.0%) |
Commute Time in Valley Cottage
The most frequently occuring commute durations in Valley Cottage are 15 to 19 minutes (633 commuters, 15.5%), 45 to 59 minutes (539 commuters, 13.2%), and 10 to 14 minutes (444 commuters, 10.9%).
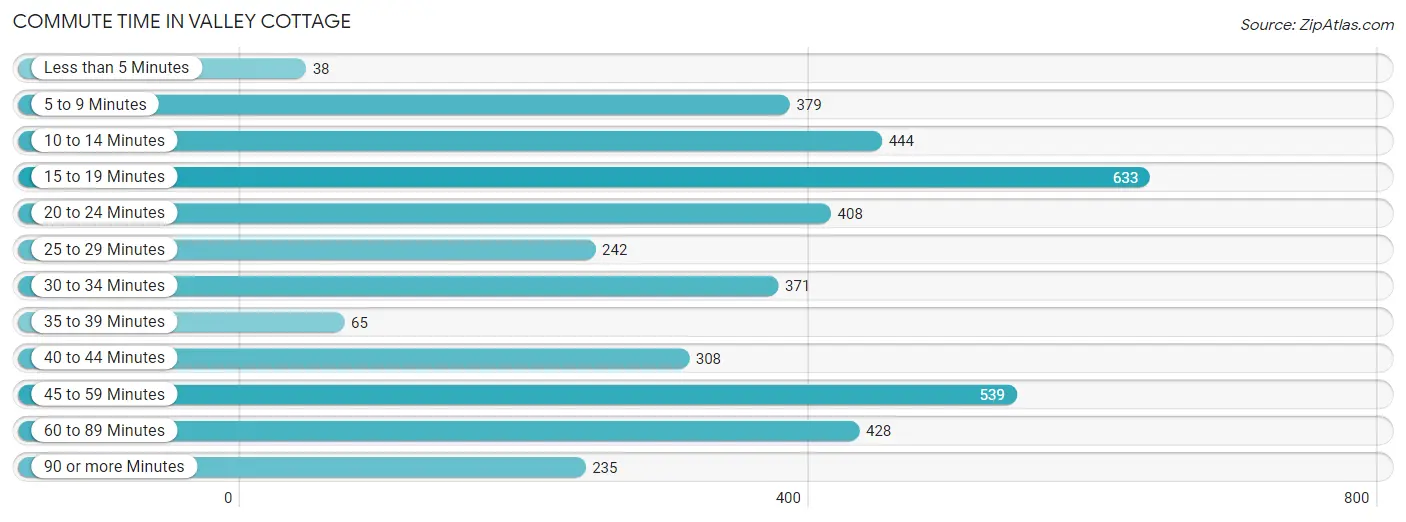
| Commute Time | # Commuters | % Commuters |
| Less than 5 Minutes | 38 | 0.9% |
| 5 to 9 Minutes | 379 | 9.3% |
| 10 to 14 Minutes | 444 | 10.9% |
| 15 to 19 Minutes | 633 | 15.5% |
| 20 to 24 Minutes | 408 | 10.0% |
| 25 to 29 Minutes | 242 | 5.9% |
| 30 to 34 Minutes | 371 | 9.1% |
| 35 to 39 Minutes | 65 | 1.6% |
| 40 to 44 Minutes | 308 | 7.5% |
| 45 to 59 Minutes | 539 | 13.2% |
| 60 to 89 Minutes | 428 | 10.5% |
| 90 or more Minutes | 235 | 5.8% |
Commute Time by Sex in Valley Cottage
The most common commute times in Valley Cottage are 10 to 14 minutes (302 commuters, 14.4%) for males and 15 to 19 minutes (347 commuters, 17.4%) for females.
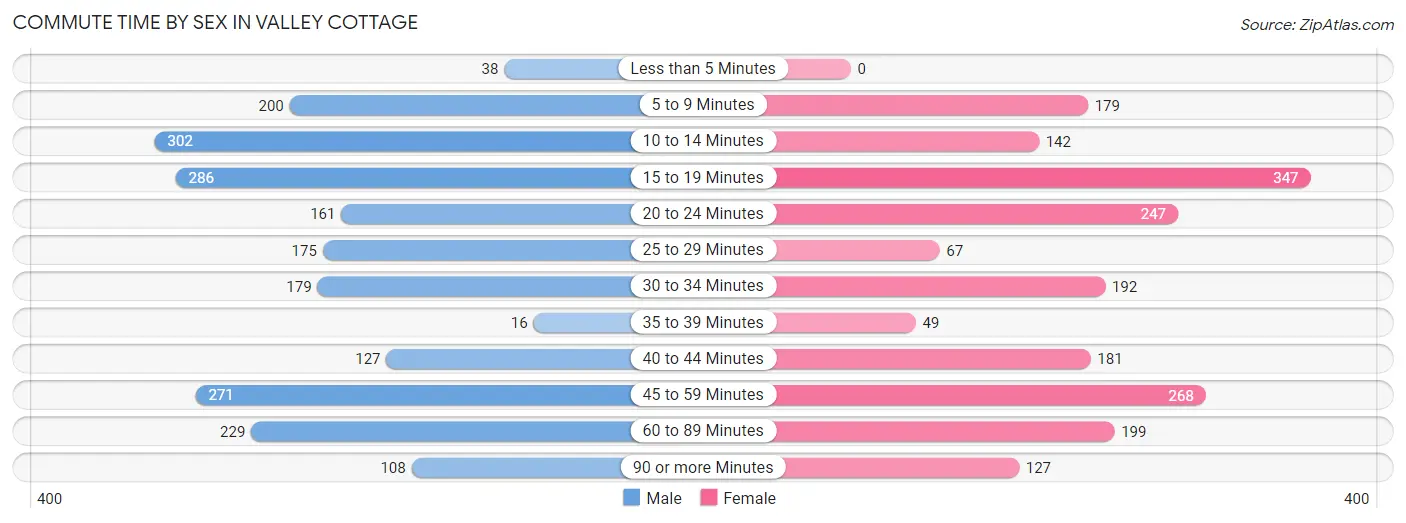
| Commute Time | Male | Female |
| Less than 5 Minutes | 38 (1.8%) | 0 (0.0%) |
| 5 to 9 Minutes | 200 (9.6%) | 179 (9.0%) |
| 10 to 14 Minutes | 302 (14.4%) | 142 (7.1%) |
| 15 to 19 Minutes | 286 (13.7%) | 347 (17.4%) |
| 20 to 24 Minutes | 161 (7.7%) | 247 (12.4%) |
| 25 to 29 Minutes | 175 (8.4%) | 67 (3.4%) |
| 30 to 34 Minutes | 179 (8.6%) | 192 (9.6%) |
| 35 to 39 Minutes | 16 (0.8%) | 49 (2.5%) |
| 40 to 44 Minutes | 127 (6.1%) | 181 (9.1%) |
| 45 to 59 Minutes | 271 (13.0%) | 268 (13.4%) |
| 60 to 89 Minutes | 229 (11.0%) | 199 (10.0%) |
| 90 or more Minutes | 108 (5.2%) | 127 (6.4%) |
Time of Departure to Work by Sex in Valley Cottage
The most frequent times of departure to work in Valley Cottage are 7:00 AM to 7:29 AM (294, 14.1%) for males and 8:00 AM to 8:29 AM (425, 21.3%) for females.
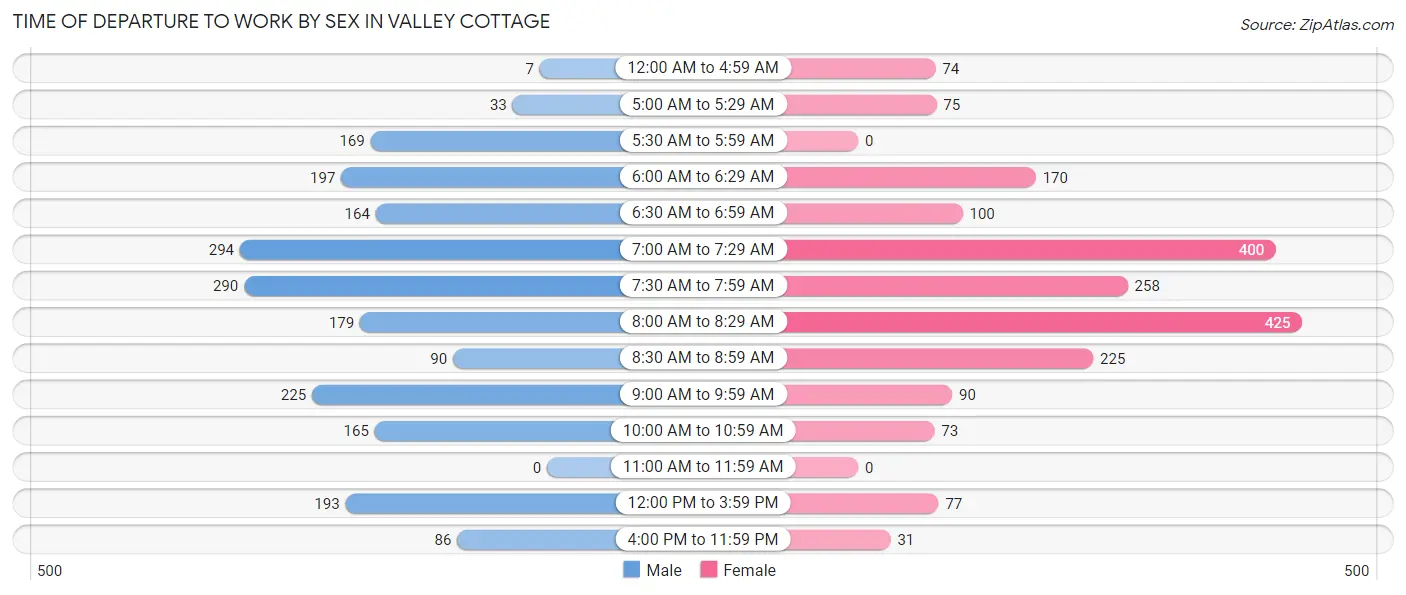
| Time of Departure | Male | Female |
| 12:00 AM to 4:59 AM | 7 (0.3%) | 74 (3.7%) |
| 5:00 AM to 5:29 AM | 33 (1.6%) | 75 (3.7%) |
| 5:30 AM to 5:59 AM | 169 (8.1%) | 0 (0.0%) |
| 6:00 AM to 6:29 AM | 197 (9.4%) | 170 (8.5%) |
| 6:30 AM to 6:59 AM | 164 (7.8%) | 100 (5.0%) |
| 7:00 AM to 7:29 AM | 294 (14.1%) | 400 (20.0%) |
| 7:30 AM to 7:59 AM | 290 (13.9%) | 258 (12.9%) |
| 8:00 AM to 8:29 AM | 179 (8.6%) | 425 (21.3%) |
| 8:30 AM to 8:59 AM | 90 (4.3%) | 225 (11.3%) |
| 9:00 AM to 9:59 AM | 225 (10.8%) | 90 (4.5%) |
| 10:00 AM to 10:59 AM | 165 (7.9%) | 73 (3.6%) |
| 11:00 AM to 11:59 AM | 0 (0.0%) | 0 (0.0%) |
| 12:00 PM to 3:59 PM | 193 (9.2%) | 77 (3.8%) |
| 4:00 PM to 11:59 PM | 86 (4.1%) | 31 (1.5%) |
| Total | 2,092 (100.0%) | 1,998 (100.0%) |
Housing Occupancy in Valley Cottage
Occupancy by Ownership in Valley Cottage
Of the total 3,420 dwellings in Valley Cottage, owner-occupied units account for 3,034 (88.7%), while renter-occupied units make up 386 (11.3%).
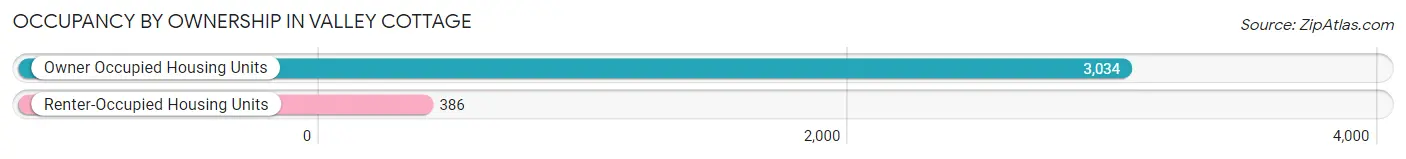
| Occupancy | # Housing Units | % Housing Units |
| Owner Occupied Housing Units | 3,034 | 88.7% |
| Renter-Occupied Housing Units | 386 | 11.3% |
| Total Occupied Housing Units | 3,420 | 100.0% |
Occupancy by Household Size in Valley Cottage
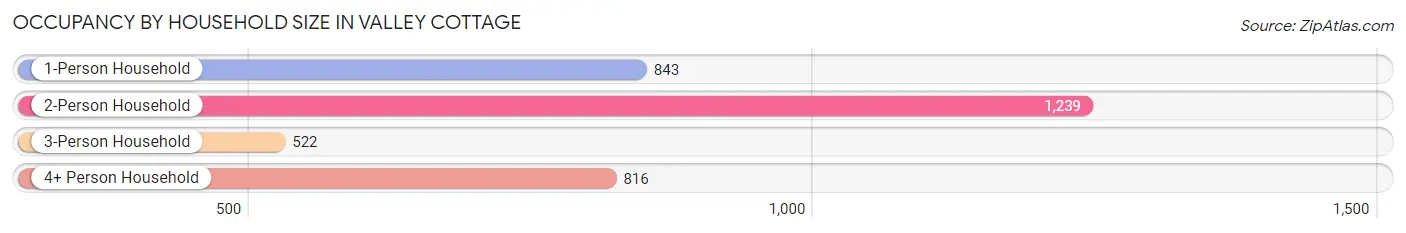
| Household Size | # Housing Units | % Housing Units |
| 1-Person Household | 843 | 24.6% |
| 2-Person Household | 1,239 | 36.2% |
| 3-Person Household | 522 | 15.3% |
| 4+ Person Household | 816 | 23.9% |
| Total Housing Units | 3,420 | 100.0% |
Occupancy by Ownership by Household Size in Valley Cottage
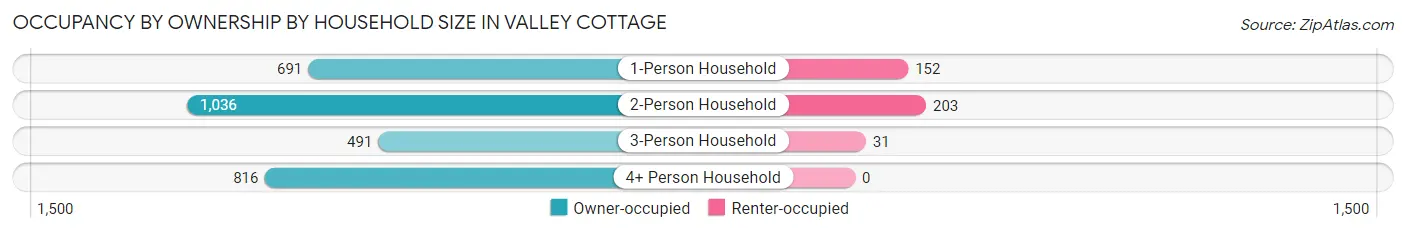
| Household Size | Owner-occupied | Renter-occupied |
| 1-Person Household | 691 (82.0%) | 152 (18.0%) |
| 2-Person Household | 1,036 (83.6%) | 203 (16.4%) |
| 3-Person Household | 491 (94.1%) | 31 (5.9%) |
| 4+ Person Household | 816 (100.0%) | 0 (0.0%) |
| Total Housing Units | 3,034 (88.7%) | 386 (11.3%) |
Occupancy by Educational Attainment in Valley Cottage
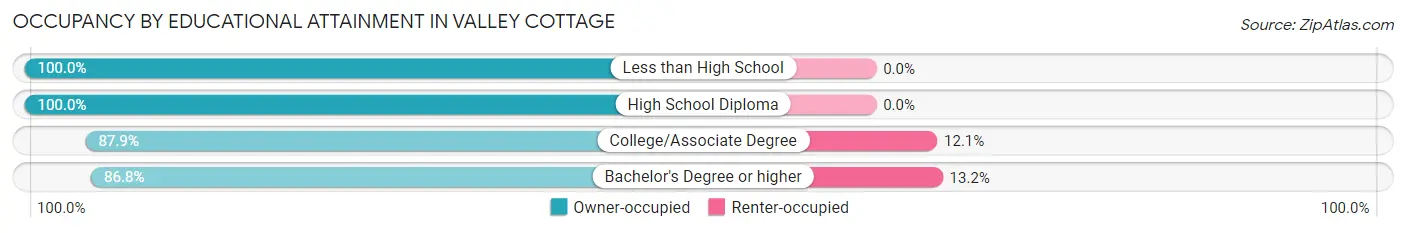
| Household Size | Owner-occupied | Renter-occupied |
| Less than High School | 20 (100.0%) | 0 (0.0%) |
| High School Diploma | 392 (100.0%) | 0 (0.0%) |
| College/Associate Degree | 837 (87.9%) | 115 (12.1%) |
| Bachelor's Degree or higher | 1,785 (86.8%) | 271 (13.2%) |
Occupancy by Age of Householder in Valley Cottage
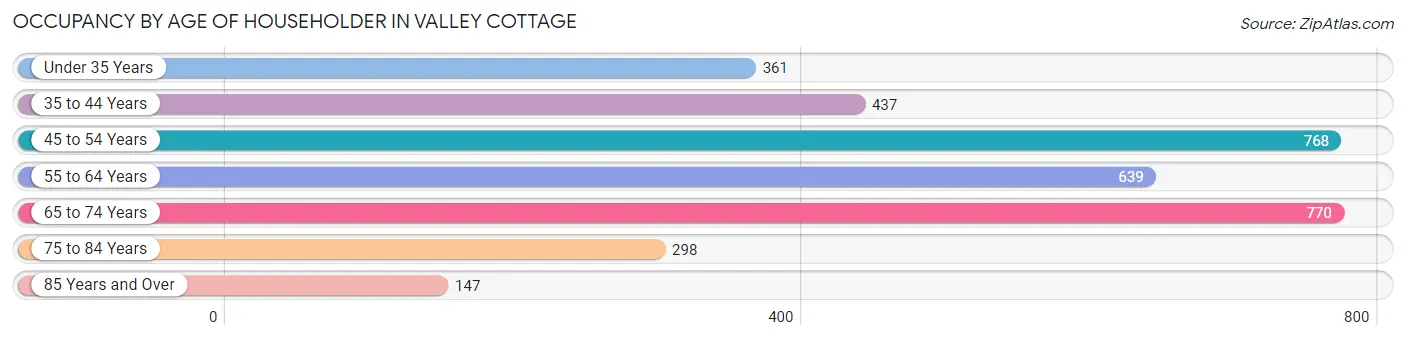
| Age Bracket | # Households | % Households |
| Under 35 Years | 361 | 10.6% |
| 35 to 44 Years | 437 | 12.8% |
| 45 to 54 Years | 768 | 22.5% |
| 55 to 64 Years | 639 | 18.7% |
| 65 to 74 Years | 770 | 22.5% |
| 75 to 84 Years | 298 | 8.7% |
| 85 Years and Over | 147 | 4.3% |
| Total | 3,420 | 100.0% |
Housing Finances in Valley Cottage
Median Income by Occupancy in Valley Cottage
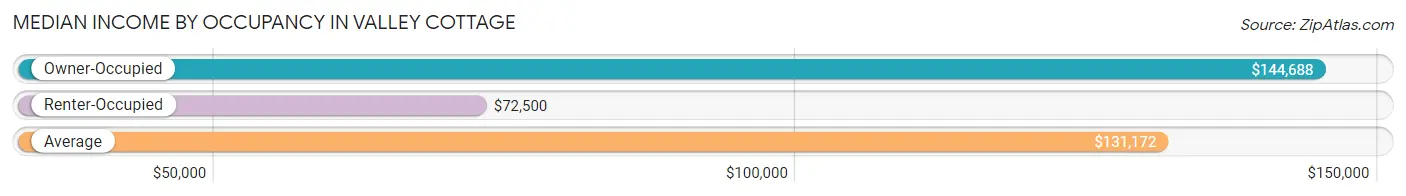
| Occupancy Type | # Households | Median Income |
| Owner-Occupied | 3,034 (88.7%) | $144,688 |
| Renter-Occupied | 386 (11.3%) | $72,500 |
| Average | 3,420 (100.0%) | $131,172 |
Occupancy by Householder Income Bracket in Valley Cottage
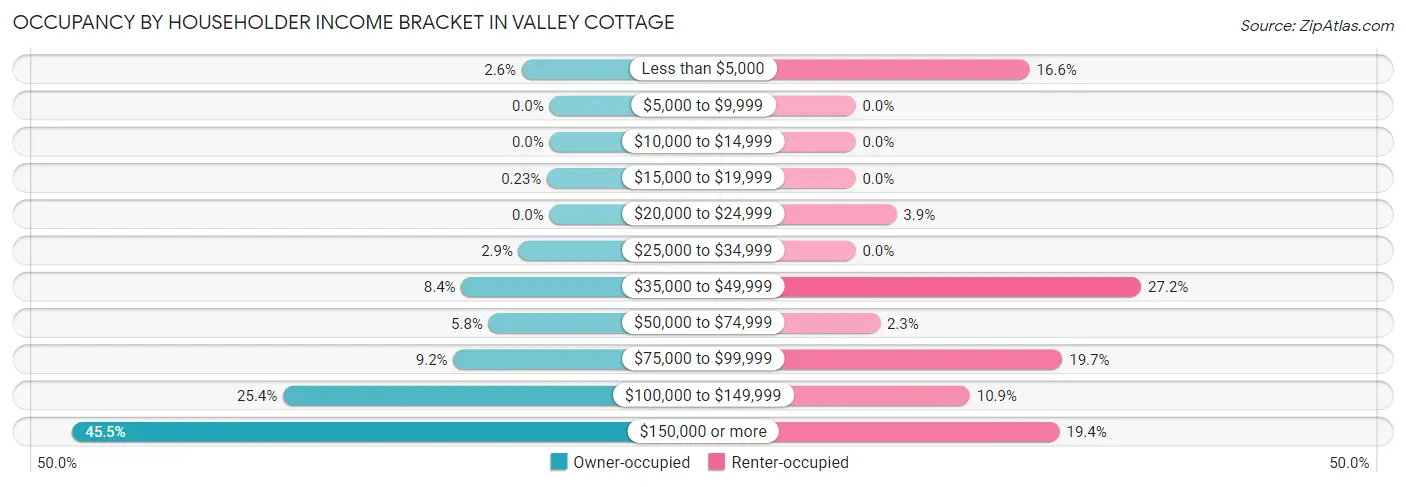
| Income Bracket | Owner-occupied | Renter-occupied |
| Less than $5,000 | 80 (2.6%) | 64 (16.6%) |
| $5,000 to $9,999 | 0 (0.0%) | 0 (0.0%) |
| $10,000 to $14,999 | 0 (0.0%) | 0 (0.0%) |
| $15,000 to $19,999 | 7 (0.2%) | 0 (0.0%) |
| $20,000 to $24,999 | 0 (0.0%) | 15 (3.9%) |
| $25,000 to $34,999 | 89 (2.9%) | 0 (0.0%) |
| $35,000 to $49,999 | 255 (8.4%) | 105 (27.2%) |
| $50,000 to $74,999 | 176 (5.8%) | 9 (2.3%) |
| $75,000 to $99,999 | 278 (9.2%) | 76 (19.7%) |
| $100,000 to $149,999 | 770 (25.4%) | 42 (10.9%) |
| $150,000 or more | 1,379 (45.5%) | 75 (19.4%) |
| Total | 3,034 (100.0%) | 386 (100.0%) |
Monthly Housing Cost Tiers in Valley Cottage
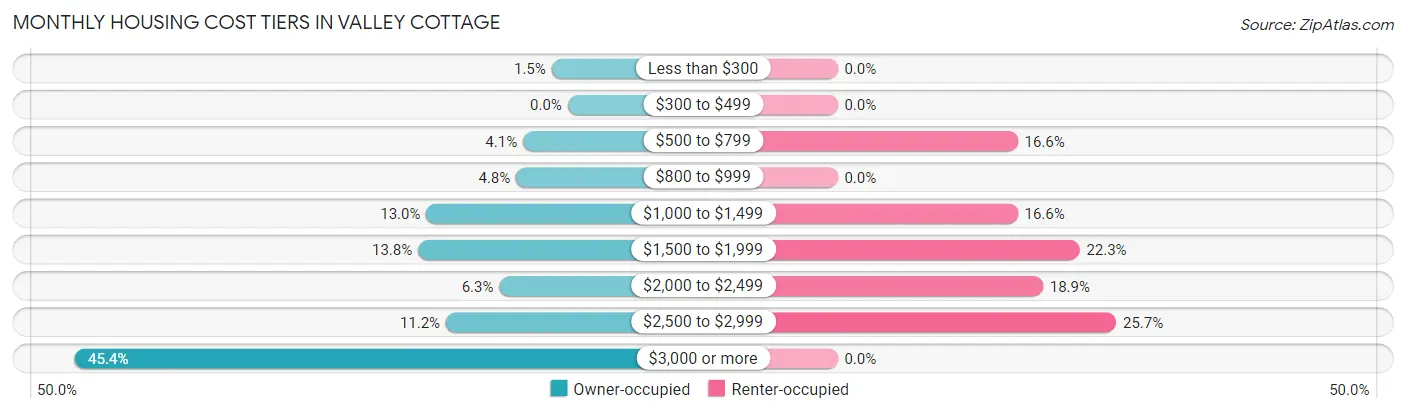
| Monthly Cost | Owner-occupied | Renter-occupied |
| Less than $300 | 45 (1.5%) | 0 (0.0%) |
| $300 to $499 | 0 (0.0%) | 0 (0.0%) |
| $500 to $799 | 125 (4.1%) | 64 (16.6%) |
| $800 to $999 | 144 (4.8%) | 0 (0.0%) |
| $1,000 to $1,499 | 395 (13.0%) | 64 (16.6%) |
| $1,500 to $1,999 | 418 (13.8%) | 86 (22.3%) |
| $2,000 to $2,499 | 191 (6.3%) | 73 (18.9%) |
| $2,500 to $2,999 | 340 (11.2%) | 99 (25.7%) |
| $3,000 or more | 1,376 (45.4%) | 0 (0.0%) |
| Total | 3,034 (100.0%) | 386 (100.0%) |
Physical Housing Characteristics in Valley Cottage
Housing Structures in Valley Cottage
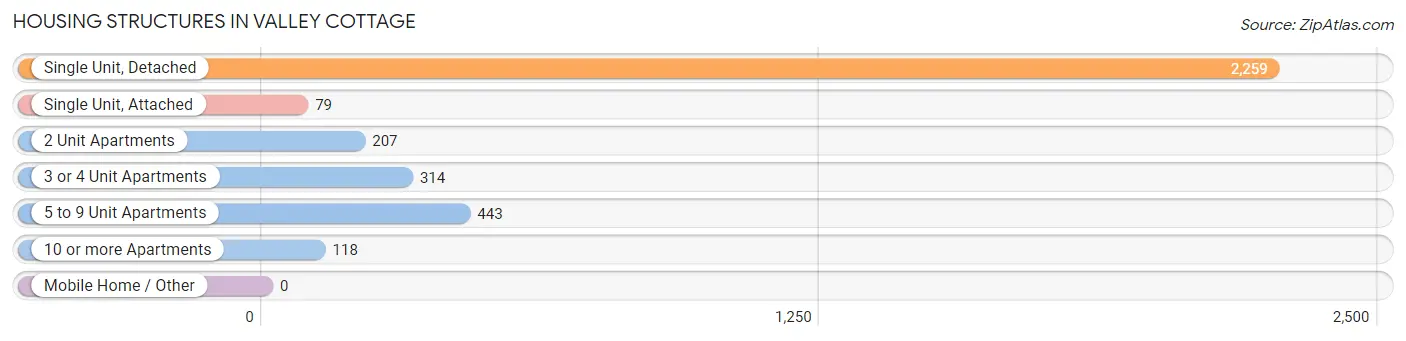
| Structure Type | # Housing Units | % Housing Units |
| Single Unit, Detached | 2,259 | 66.0% |
| Single Unit, Attached | 79 | 2.3% |
| 2 Unit Apartments | 207 | 6.0% |
| 3 or 4 Unit Apartments | 314 | 9.2% |
| 5 to 9 Unit Apartments | 443 | 13.0% |
| 10 or more Apartments | 118 | 3.5% |
| Mobile Home / Other | 0 | 0.0% |
| Total | 3,420 | 100.0% |
Housing Structures by Occupancy in Valley Cottage
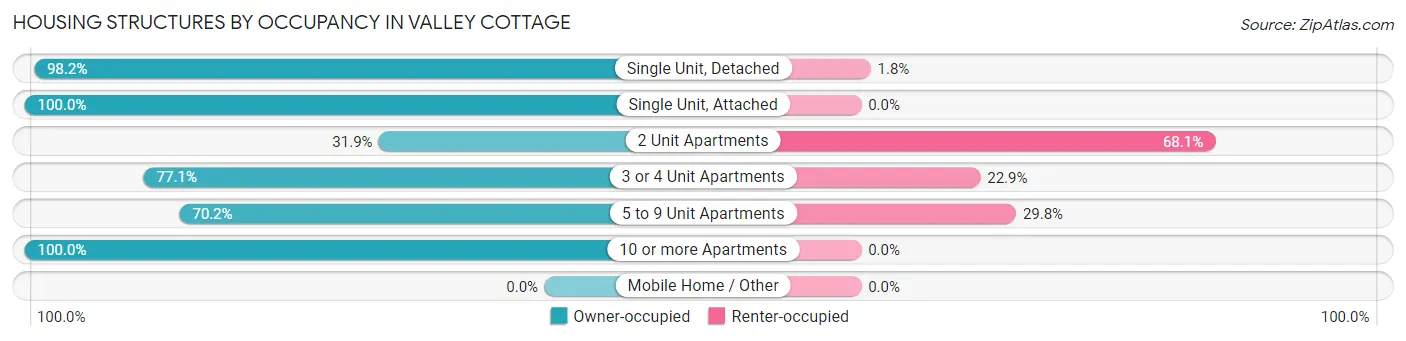
| Structure Type | Owner-occupied | Renter-occupied |
| Single Unit, Detached | 2,218 (98.2%) | 41 (1.8%) |
| Single Unit, Attached | 79 (100.0%) | 0 (0.0%) |
| 2 Unit Apartments | 66 (31.9%) | 141 (68.1%) |
| 3 or 4 Unit Apartments | 242 (77.1%) | 72 (22.9%) |
| 5 to 9 Unit Apartments | 311 (70.2%) | 132 (29.8%) |
| 10 or more Apartments | 118 (100.0%) | 0 (0.0%) |
| Mobile Home / Other | 0 (0.0%) | 0 (0.0%) |
| Total | 3,034 (88.7%) | 386 (11.3%) |
Housing Structures by Number of Rooms in Valley Cottage
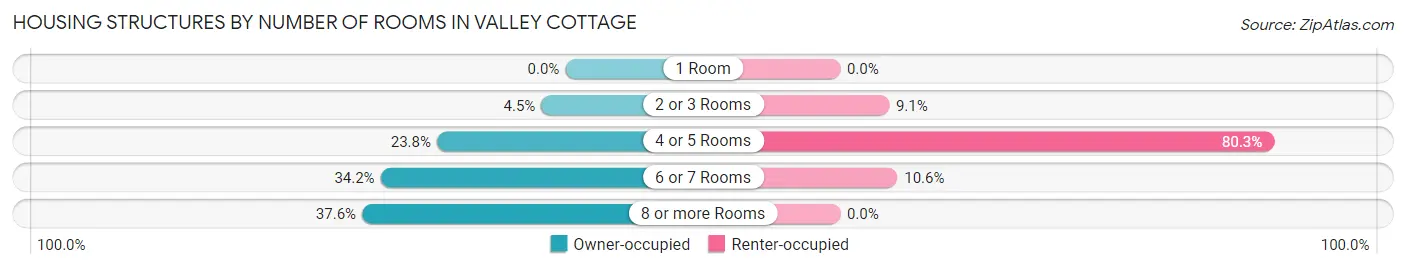
| Number of Rooms | Owner-occupied | Renter-occupied |
| 1 Room | 0 (0.0%) | 0 (0.0%) |
| 2 or 3 Rooms | 135 (4.4%) | 35 (9.1%) |
| 4 or 5 Rooms | 721 (23.8%) | 310 (80.3%) |
| 6 or 7 Rooms | 1,037 (34.2%) | 41 (10.6%) |
| 8 or more Rooms | 1,141 (37.6%) | 0 (0.0%) |
| Total | 3,034 (100.0%) | 386 (100.0%) |
Housing Structure by Heating Type in Valley Cottage
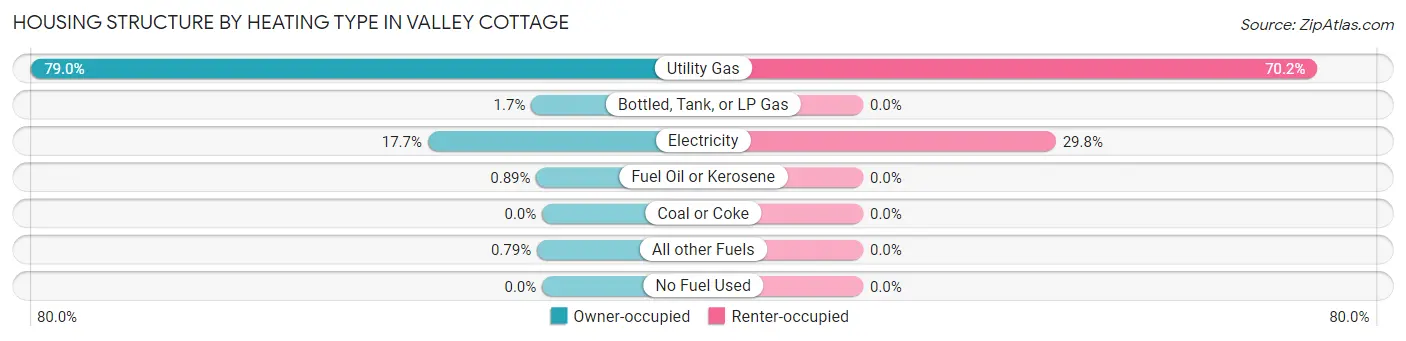
| Heating Type | Owner-occupied | Renter-occupied |
| Utility Gas | 2,396 (79.0%) | 271 (70.2%) |
| Bottled, Tank, or LP Gas | 51 (1.7%) | 0 (0.0%) |
| Electricity | 536 (17.7%) | 115 (29.8%) |
| Fuel Oil or Kerosene | 27 (0.9%) | 0 (0.0%) |
| Coal or Coke | 0 (0.0%) | 0 (0.0%) |
| All other Fuels | 24 (0.8%) | 0 (0.0%) |
| No Fuel Used | 0 (0.0%) | 0 (0.0%) |
| Total | 3,034 (100.0%) | 386 (100.0%) |
Household Vehicle Usage in Valley Cottage
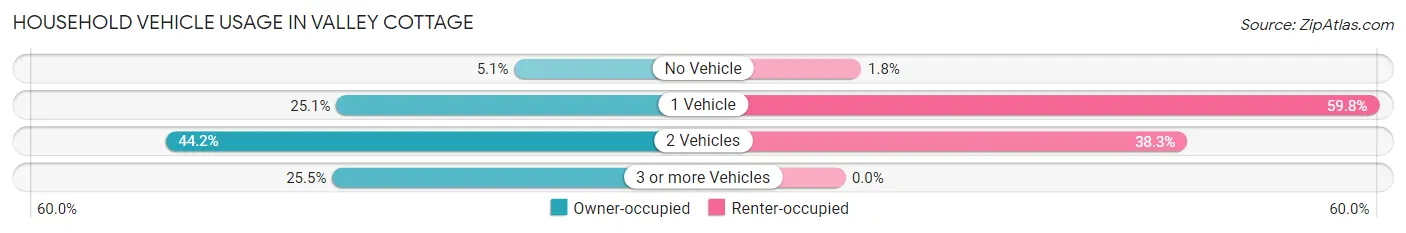
| Vehicles per Household | Owner-occupied | Renter-occupied |
| No Vehicle | 156 (5.1%) | 7 (1.8%) |
| 1 Vehicle | 761 (25.1%) | 231 (59.8%) |
| 2 Vehicles | 1,342 (44.2%) | 148 (38.3%) |
| 3 or more Vehicles | 775 (25.5%) | 0 (0.0%) |
| Total | 3,034 (100.0%) | 386 (100.0%) |
Real Estate & Mortgages in Valley Cottage
Real Estate and Mortgage Overview in Valley Cottage
| Characteristic | Without Mortgage | With Mortgage |
| Housing Units | 1,147 | 1,887 |
| Median Property Value | $439,500 | $492,700 |
| Median Household Income | $104,351 | $1,152 |
| Monthly Housing Costs | $1,442 | $1,376 |
| Real Estate Taxes | $10,001 | $0 |
Property Value by Mortgage Status in Valley Cottage
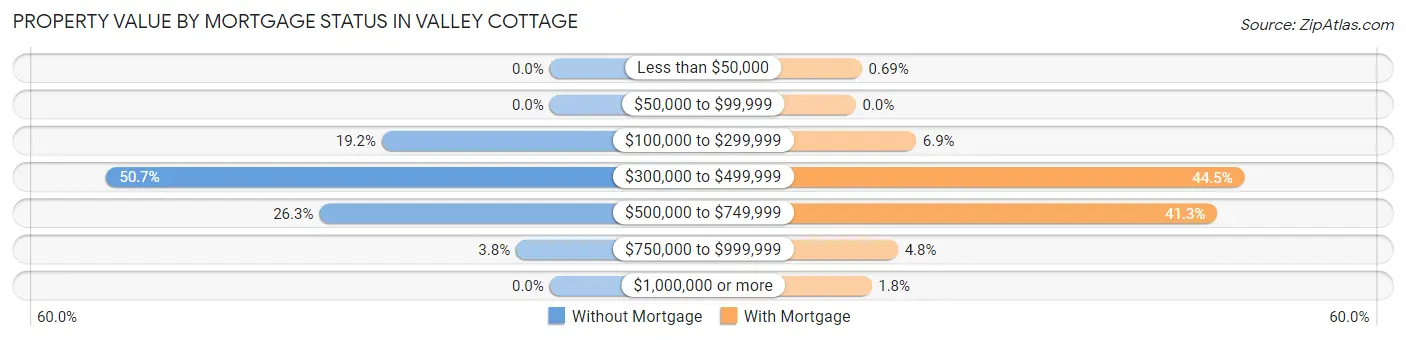
| Property Value | Without Mortgage | With Mortgage |
| Less than $50,000 | 0 (0.0%) | 13 (0.7%) |
| $50,000 to $99,999 | 0 (0.0%) | 0 (0.0%) |
| $100,000 to $299,999 | 220 (19.2%) | 130 (6.9%) |
| $300,000 to $499,999 | 581 (50.6%) | 839 (44.5%) |
| $500,000 to $749,999 | 302 (26.3%) | 780 (41.3%) |
| $750,000 to $999,999 | 44 (3.8%) | 91 (4.8%) |
| $1,000,000 or more | 0 (0.0%) | 34 (1.8%) |
| Total | 1,147 (100.0%) | 1,887 (100.0%) |
Household Income by Mortgage Status in Valley Cottage
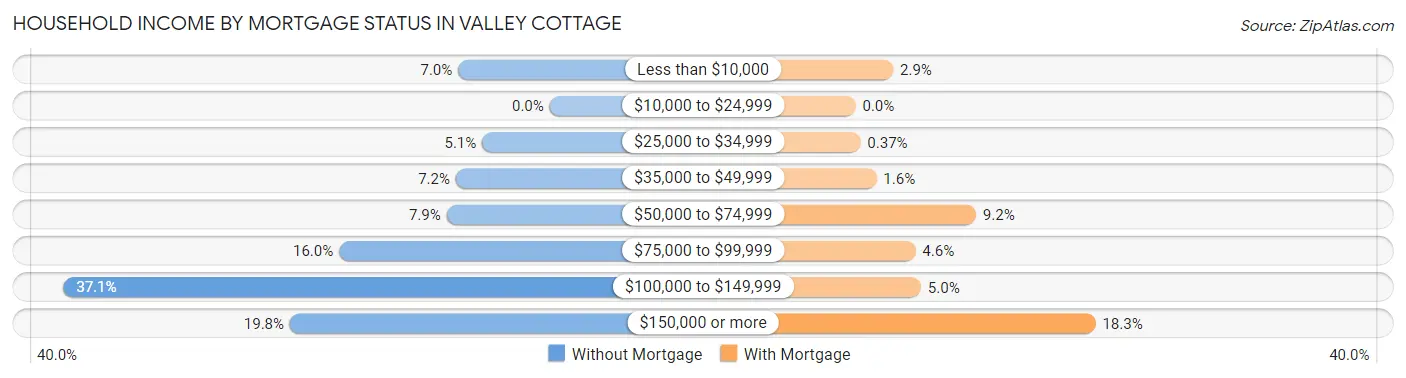
| Household Income | Without Mortgage | With Mortgage |
| Less than $10,000 | 80 (7.0%) | 54 (2.9%) |
| $10,000 to $24,999 | 0 (0.0%) | 0 (0.0%) |
| $25,000 to $34,999 | 59 (5.1%) | 7 (0.4%) |
| $35,000 to $49,999 | 82 (7.1%) | 30 (1.6%) |
| $50,000 to $74,999 | 90 (7.9%) | 173 (9.2%) |
| $75,000 to $99,999 | 184 (16.0%) | 86 (4.6%) |
| $100,000 to $149,999 | 425 (37.0%) | 94 (5.0%) |
| $150,000 or more | 227 (19.8%) | 345 (18.3%) |
| Total | 1,147 (100.0%) | 1,887 (100.0%) |
Property Value to Household Income Ratio in Valley Cottage
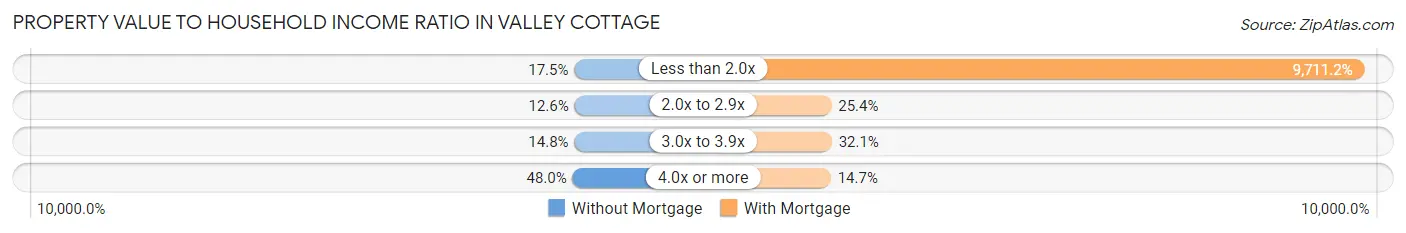
| Value-to-Income Ratio | Without Mortgage | With Mortgage |
| Less than 2.0x | 201 (17.5%) | 183,250 (9,711.2%) |
| 2.0x to 2.9x | 145 (12.6%) | 479 (25.4%) |
| 3.0x to 3.9x | 170 (14.8%) | 605 (32.1%) |
| 4.0x or more | 551 (48.0%) | 278 (14.7%) |
| Total | 1,147 (100.0%) | 1,887 (100.0%) |
Real Estate Taxes by Mortgage Status in Valley Cottage
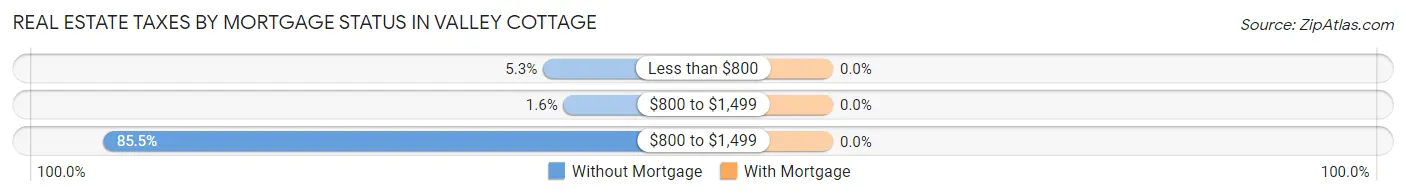
| Property Taxes | Without Mortgage | With Mortgage |
| Less than $800 | 61 (5.3%) | 0 (0.0%) |
| $800 to $1,499 | 18 (1.6%) | 0 (0.0%) |
| $800 to $1,499 | 981 (85.5%) | 0 (0.0%) |
| Total | 1,147 (100.0%) | 1,887 (100.0%) |
Health & Disability in Valley Cottage
Health Insurance Coverage by Age in Valley Cottage
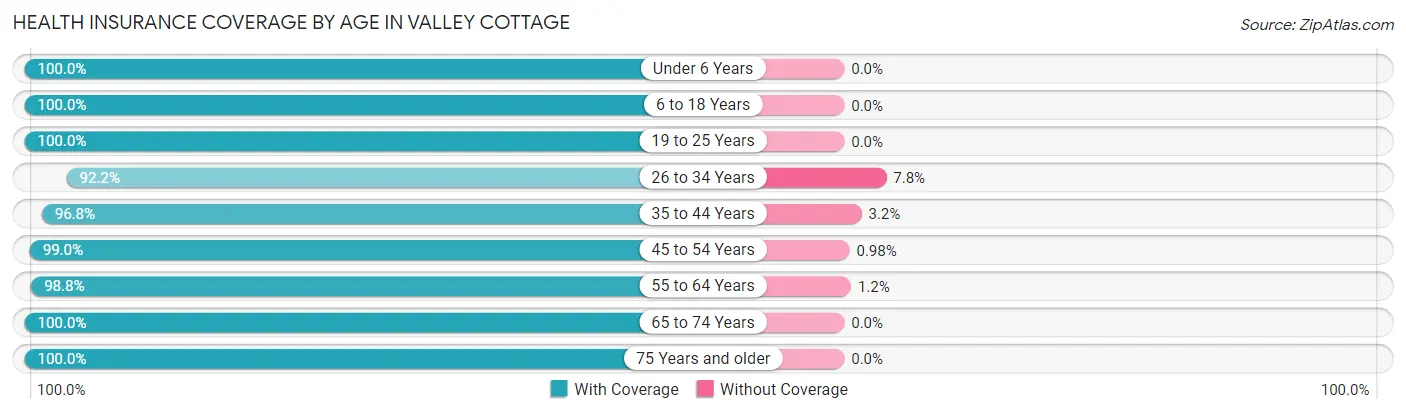
| Age Bracket | With Coverage | Without Coverage |
| Under 6 Years | 312 (100.0%) | 0 (0.0%) |
| 6 to 18 Years | 1,177 (100.0%) | 0 (0.0%) |
| 19 to 25 Years | 614 (100.0%) | 0 (0.0%) |
| 26 to 34 Years | 1,211 (92.2%) | 103 (7.8%) |
| 35 to 44 Years | 753 (96.8%) | 25 (3.2%) |
| 45 to 54 Years | 1,413 (99.0%) | 14 (1.0%) |
| 55 to 64 Years | 1,353 (98.8%) | 17 (1.2%) |
| 65 to 74 Years | 1,223 (100.0%) | 0 (0.0%) |
| 75 Years and older | 653 (100.0%) | 0 (0.0%) |
| Total | 8,709 (98.2%) | 159 (1.8%) |
Health Insurance Coverage by Citizenship Status in Valley Cottage
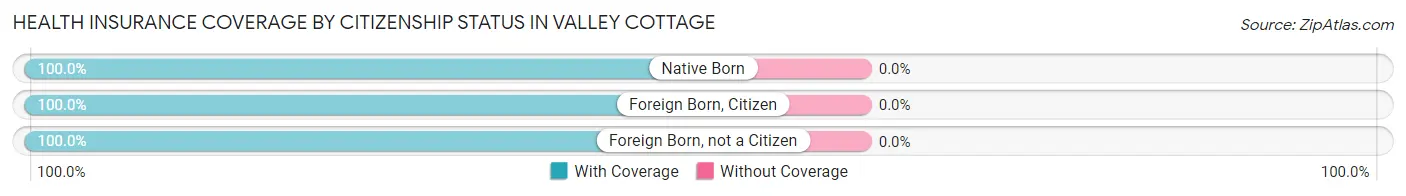
| Citizenship Status | With Coverage | Without Coverage |
| Native Born | 312 (100.0%) | 0 (0.0%) |
| Foreign Born, Citizen | 1,177 (100.0%) | 0 (0.0%) |
| Foreign Born, not a Citizen | 614 (100.0%) | 0 (0.0%) |
Health Insurance Coverage by Household Income in Valley Cottage
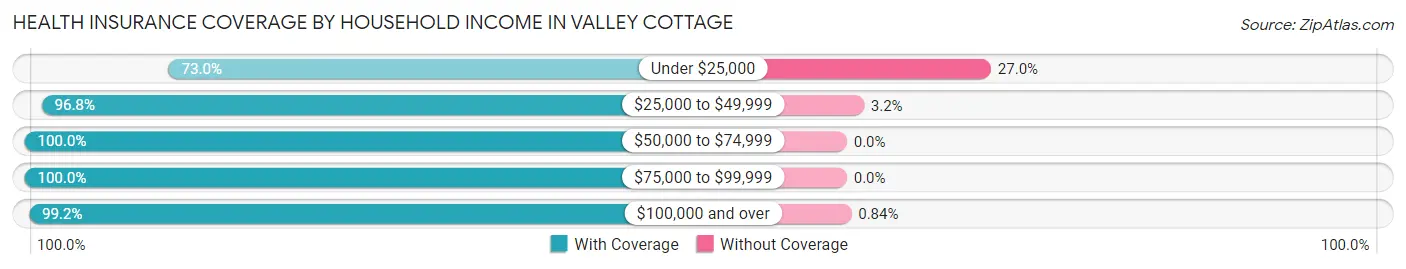
| Household Income | With Coverage | Without Coverage |
| Under $25,000 | 173 (73.0%) | 64 (27.0%) |
| $25,000 to $49,999 | 1,184 (96.8%) | 39 (3.2%) |
| $50,000 to $74,999 | 422 (100.0%) | 0 (0.0%) |
| $75,000 to $99,999 | 634 (100.0%) | 0 (0.0%) |
| $100,000 and over | 6,256 (99.2%) | 53 (0.8%) |
Public vs Private Health Insurance Coverage by Age in Valley Cottage
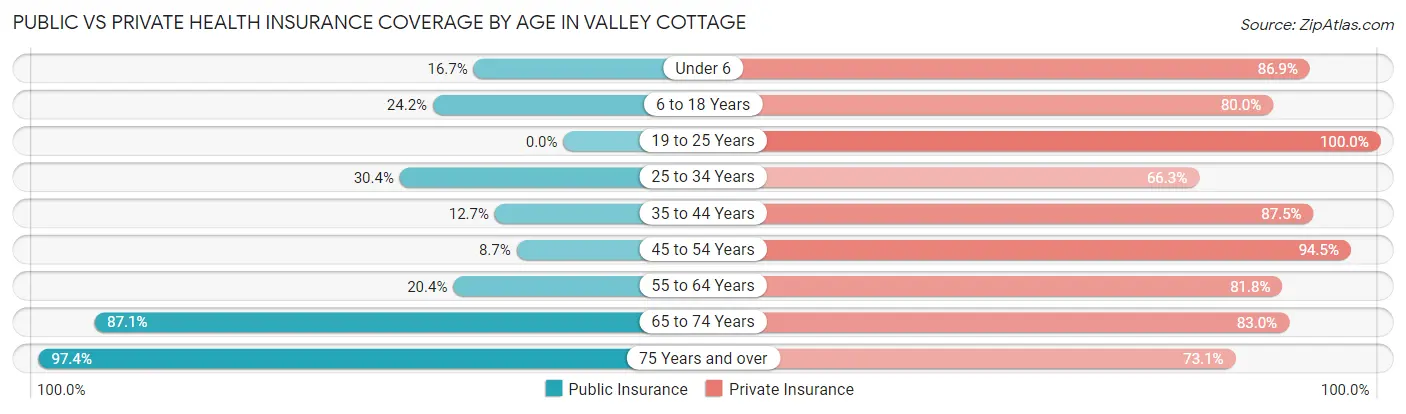
| Age Bracket | Public Insurance | Private Insurance |
| Under 6 | 52 (16.7%) | 271 (86.9%) |
| 6 to 18 Years | 285 (24.2%) | 942 (80.0%) |
| 19 to 25 Years | 0 (0.0%) | 614 (100.0%) |
| 25 to 34 Years | 399 (30.4%) | 871 (66.3%) |
| 35 to 44 Years | 99 (12.7%) | 681 (87.5%) |
| 45 to 54 Years | 124 (8.7%) | 1,348 (94.5%) |
| 55 to 64 Years | 280 (20.4%) | 1,120 (81.8%) |
| 65 to 74 Years | 1,065 (87.1%) | 1,015 (83.0%) |
| 75 Years and over | 636 (97.4%) | 477 (73.1%) |
| Total | 2,940 (33.2%) | 7,339 (82.8%) |
Disability Status by Sex by Age in Valley Cottage
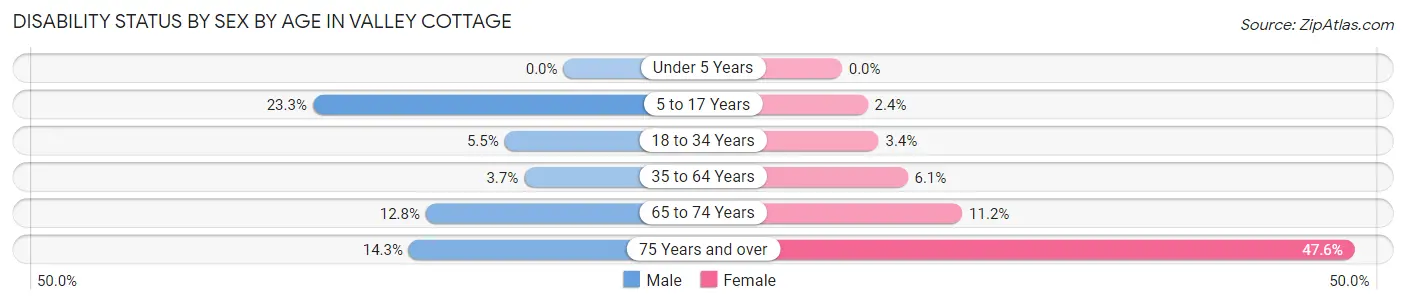
| Age Bracket | Male | Female |
| Under 5 Years | 0 (0.0%) | 0 (0.0%) |
| 5 to 17 Years | 134 (23.3%) | 12 (2.4%) |
| 18 to 34 Years | 64 (5.5%) | 31 (3.4%) |
| 35 to 64 Years | 57 (3.6%) | 123 (6.1%) |
| 65 to 74 Years | 83 (12.8%) | 64 (11.2%) |
| 75 Years and over | 37 (14.3%) | 188 (47.6%) |
Disability Class by Sex by Age in Valley Cottage
Disability Class: Hearing Difficulty
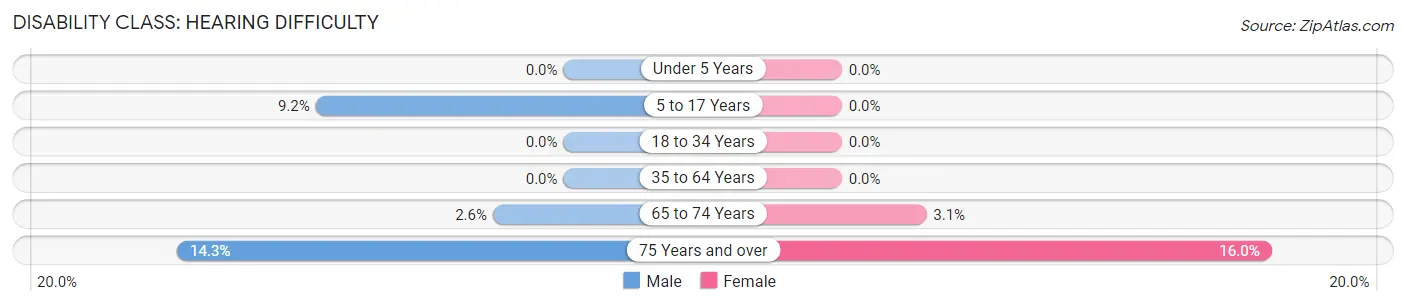
| Age Bracket | Male | Female |
| Under 5 Years | 0 (0.0%) | 0 (0.0%) |
| 5 to 17 Years | 53 (9.2%) | 0 (0.0%) |
| 18 to 34 Years | 0 (0.0%) | 0 (0.0%) |
| 35 to 64 Years | 0 (0.0%) | 0 (0.0%) |
| 65 to 74 Years | 17 (2.6%) | 18 (3.1%) |
| 75 Years and over | 37 (14.3%) | 63 (16.0%) |
Disability Class: Vision Difficulty
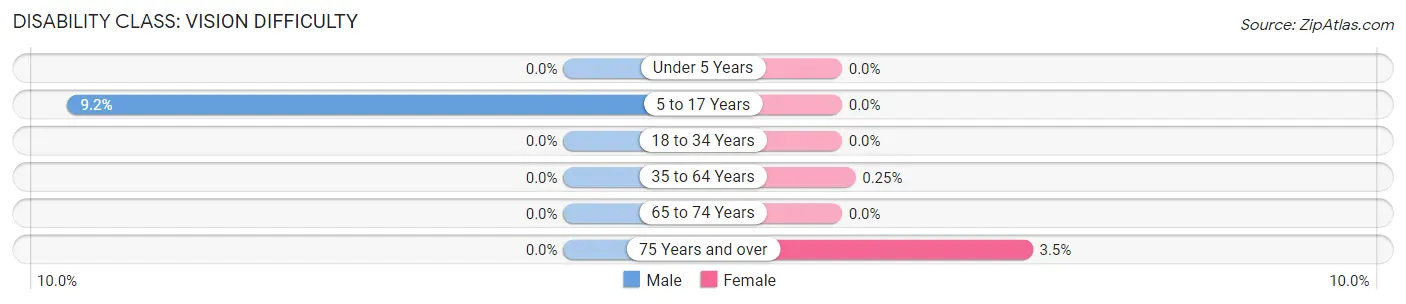
| Age Bracket | Male | Female |
| Under 5 Years | 0 (0.0%) | 0 (0.0%) |
| 5 to 17 Years | 53 (9.2%) | 0 (0.0%) |
| 18 to 34 Years | 0 (0.0%) | 0 (0.0%) |
| 35 to 64 Years | 0 (0.0%) | 5 (0.3%) |
| 65 to 74 Years | 0 (0.0%) | 0 (0.0%) |
| 75 Years and over | 0 (0.0%) | 14 (3.5%) |
Disability Class: Cognitive Difficulty
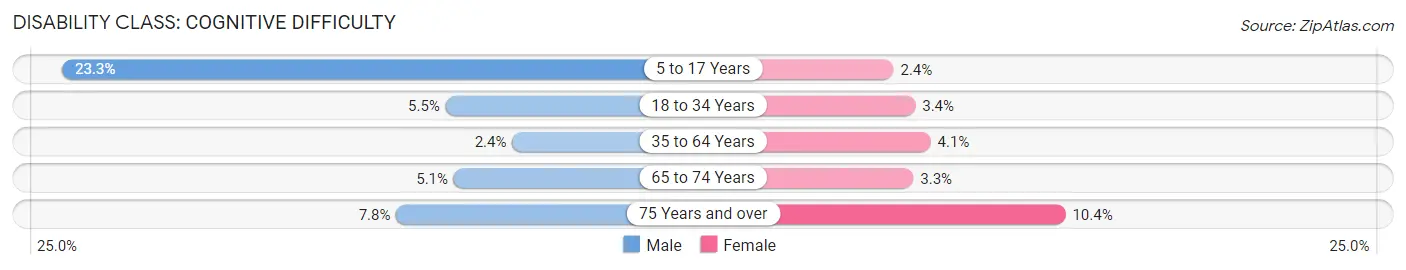
| Age Bracket | Male | Female |
| 5 to 17 Years | 134 (23.3%) | 12 (2.4%) |
| 18 to 34 Years | 64 (5.5%) | 31 (3.4%) |
| 35 to 64 Years | 37 (2.4%) | 83 (4.1%) |
| 65 to 74 Years | 33 (5.1%) | 19 (3.3%) |
| 75 Years and over | 20 (7.7%) | 41 (10.4%) |
Disability Class: Ambulatory Difficulty
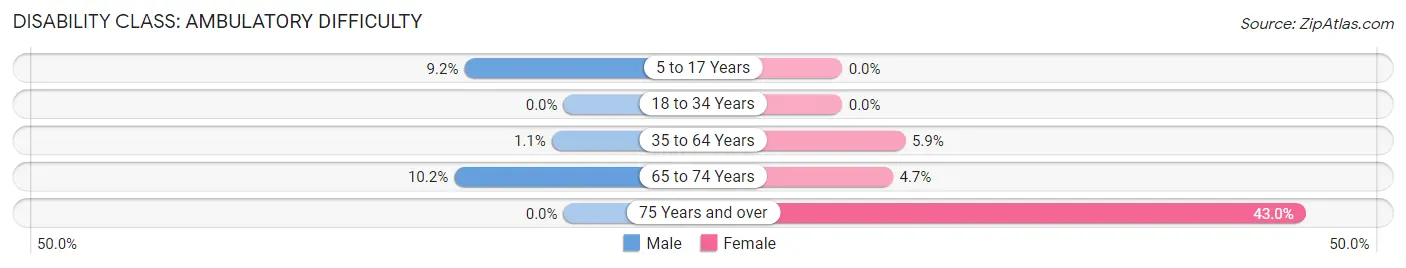
| Age Bracket | Male | Female |
| 5 to 17 Years | 53 (9.2%) | 0 (0.0%) |
| 18 to 34 Years | 0 (0.0%) | 0 (0.0%) |
| 35 to 64 Years | 17 (1.1%) | 118 (5.9%) |
| 65 to 74 Years | 66 (10.2%) | 27 (4.7%) |
| 75 Years and over | 0 (0.0%) | 170 (43.0%) |
Disability Class: Self-Care Difficulty
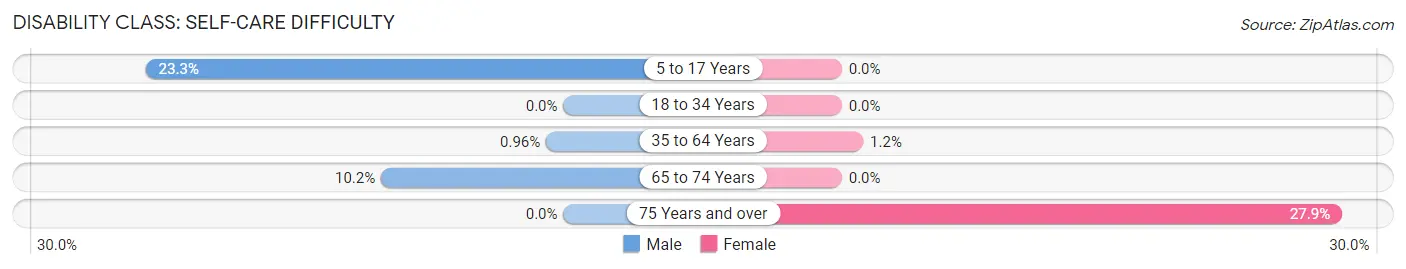
| Age Bracket | Male | Female |
| 5 to 17 Years | 134 (23.3%) | 0 (0.0%) |
| 18 to 34 Years | 0 (0.0%) | 0 (0.0%) |
| 35 to 64 Years | 15 (1.0%) | 24 (1.2%) |
| 65 to 74 Years | 66 (10.2%) | 0 (0.0%) |
| 75 Years and over | 0 (0.0%) | 110 (27.9%) |
Technology Access in Valley Cottage
Computing Device Access in Valley Cottage
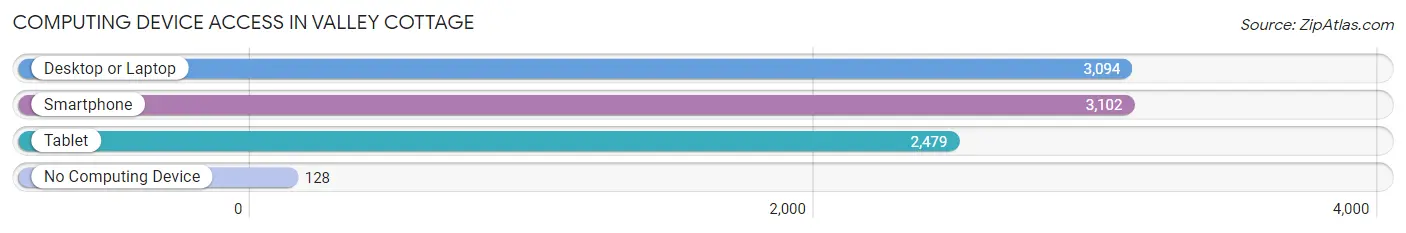
| Device Type | # Households | % Households |
| Desktop or Laptop | 3,094 | 90.5% |
| Smartphone | 3,102 | 90.7% |
| Tablet | 2,479 | 72.5% |
| No Computing Device | 128 | 3.7% |
| Total | 3,420 | 100.0% |
Internet Access in Valley Cottage
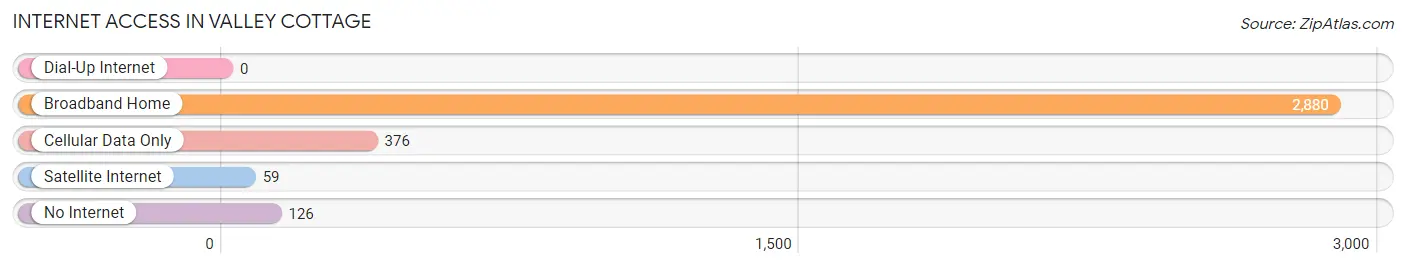
| Internet Type | # Households | % Households |
| Dial-Up Internet | 0 | 0.0% |
| Broadband Home | 2,880 | 84.2% |
| Cellular Data Only | 376 | 11.0% |
| Satellite Internet | 59 | 1.7% |
| No Internet | 126 | 3.7% |
| Total | 3,420 | 100.0% |
Valley Cottage Summary
Valley Cottage is a hamlet located in the town of Clarkstown in Rockland County, New York. It is situated on the west bank of the Hudson River, about 25 miles north of New York City. The hamlet is bordered by the hamlets of Congers to the north, West Nyack to the east, and Nanuet to the south.
History
Valley Cottage was originally part of the town of Orangetown, which was established in 1683. The hamlet was first settled in the late 1700s by Dutch and English settlers. The area was known as “Cottage Valley” due to the many small cottages that were built in the area. The hamlet was officially established in 1845 when the town of Clarkstown was created.
Geography
Valley Cottage is located in the Hudson Valley region of New York. The hamlet is situated on the west bank of the Hudson River, about 25 miles north of New York City. The hamlet is bordered by the hamlets of Congers to the north, West Nyack to the east, and Nanuet to the south. The area is mostly flat, with some rolling hills. The highest point in the hamlet is the summit of High Tor Mountain, which is about 500 feet above sea level.
Economy
Valley Cottage is primarily a residential community, with a few small businesses located in the area. The hamlet is home to several small retail stores, restaurants, and professional services. The hamlet is also home to a number of light industrial businesses, including a printing company, a plastics manufacturer, and a metal fabrication shop.
Demographics
As of the 2010 census, the population of Valley Cottage was 8,945. The population is predominantly white (87.3%), with a small percentage of African Americans (4.2%), Asians (3.2%), and Hispanics (2.7%). The median household income in the hamlet is $77,945, and the median home value is $420,000.
Valley Cottage is a small, quiet hamlet located in the Hudson Valley region of New York. The hamlet is primarily a residential community, with a few small businesses located in the area. The population is predominantly white, with a small percentage of African Americans, Asians, and Hispanics. The median household income in the hamlet is $77,945, and the median home value is $420,000. Valley Cottage is a great place to live, work, and raise a family.
Common Questions
What is Per Capita Income in Valley Cottage?
Per Capita income in Valley Cottage is $65,256.
What is the Median Family Income in Valley Cottage?
Median Family Income in Valley Cottage is $156,688.
What is the Median Household income in Valley Cottage?
Median Household Income in Valley Cottage is $131,172.
What is Income or Wage Gap in Valley Cottage?
Income or Wage Gap in Valley Cottage is 10.2%.
Women in Valley Cottage earn 89.8 cents for every dollar earned by a man.
What is Inequality or Gini Index in Valley Cottage?
Inequality or Gini Index in Valley Cottage is 0.41.
What is the Total Population of Valley Cottage?
Total Population of Valley Cottage is 9,069.
What is the Total Male Population of Valley Cottage?
Total Male Population of Valley Cottage is 4,444.
What is the Total Female Population of Valley Cottage?
Total Female Population of Valley Cottage is 4,625.
What is the Ratio of Males per 100 Females in Valley Cottage?
There are 96.09 Males per 100 Females in Valley Cottage.
What is the Ratio of Females per 100 Males in Valley Cottage?
There are 104.07 Females per 100 Males in Valley Cottage.
What is the Median Population Age in Valley Cottage?
Median Population Age in Valley Cottage is 47.4 Years.
What is the Average Family Size in Valley Cottage
Average Family Size in Valley Cottage is 3.1 People.
What is the Average Household Size in Valley Cottage
Average Household Size in Valley Cottage is 2.6 People.
How Large is the Labor Force in Valley Cottage?
There are 5,276 People in the Labor Forcein in Valley Cottage.
What is the Percentage of People in the Labor Force in Valley Cottage?
66.6% of People are in the Labor Force in Valley Cottage.
What is the Unemployment Rate in Valley Cottage?
Unemployment Rate in Valley Cottage is 8.3%.