Willowbrook, IL Map & Demographics
Willowbrook Map
Willowbrook Overview
$35,418
PER CAPITA INCOME
$93,084
AVG FAMILY INCOME
$91,324
AVG HOUSEHOLD INCOME
27.0%
WAGE / INCOME GAP [ % ]
73.0¢/ $1
WAGE / INCOME GAP [ $ ]
0.30
INEQUALITY / GINI INDEX
2,539
TOTAL POPULATION
1,309
MALE POPULATION
1,230
FEMALE POPULATION
106.42
MALES / 100 FEMALES
93.96
FEMALES / 100 MALES
36.7
MEDIAN AGE
3.5
AVG FAMILY SIZE
3.2
AVG HOUSEHOLD SIZE
1,354
LABOR FORCE [ PEOPLE ]
63.8%
PERCENT IN LABOR FORCE
3.2%
UNEMPLOYMENT RATE
Willowbrook Zip Codes
Income in Willowbrook
Income Overview in Willowbrook
Per Capita Income in Willowbrook is $35,418, while median incomes of families and households are $93,084 and $91,324 respectively.
| Characteristic | Number | Measure |
| Per Capita Income | 2,539 | $35,418 |
| Median Family Income | 682 | $93,084 |
| Mean Family Income | 682 | $118,874 |
| Median Household Income | 784 | $91,324 |
| Mean Household Income | 784 | $112,641 |
| Income Deficit | 682 | $0 |
| Wage / Income Gap (%) | 2,539 | 27.02% |
| Wage / Income Gap ($) | 2,539 | 72.98¢ per $1 |
| Gini / Inequality Index | 2,539 | 0.30 |
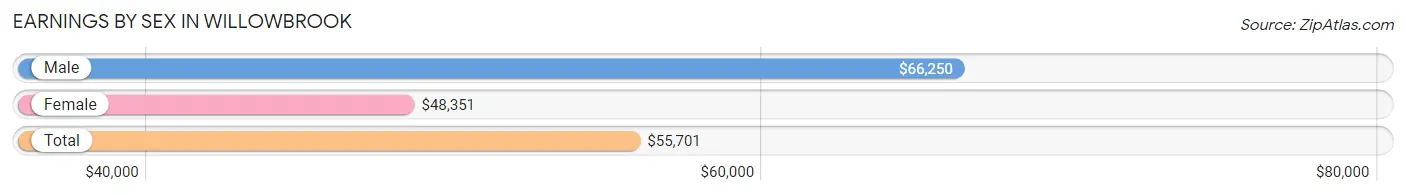
Earnings by Sex in Willowbrook
Average Earnings in Willowbrook are $55,701, $66,250 for men and $48,351 for women, a difference of 27.0%.
| Sex | Number | Average Earnings |
| Male | 759 (53.3%) | $66,250 |
| Female | 666 (46.7%) | $48,351 |
| Total | 1,425 (100.0%) | $55,701 |
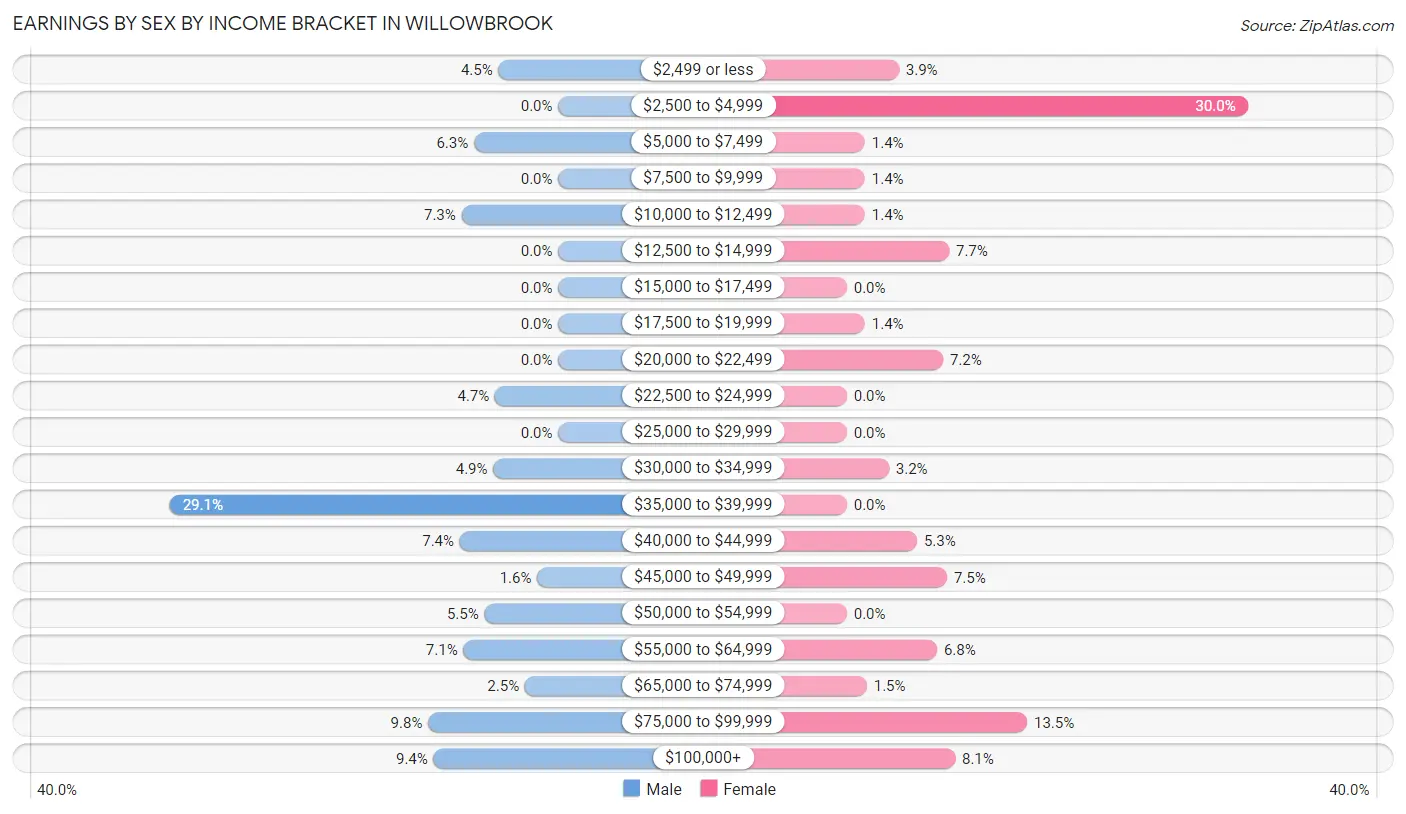
Earnings by Sex by Income Bracket in Willowbrook
The most common earnings brackets in Willowbrook are $35,000 to $39,999 for men (221 | 29.1%) and $2,500 to $4,999 for women (200 | 30.0%).
| Income | Male | Female |
| $2,499 or less | 34 (4.5%) | 26 (3.9%) |
| $2,500 to $4,999 | 0 (0.0%) | 200 (30.0%) |
| $5,000 to $7,499 | 48 (6.3%) | 9 (1.3%) |
| $7,500 to $9,999 | 0 (0.0%) | 9 (1.3%) |
| $10,000 to $12,499 | 55 (7.2%) | 9 (1.3%) |
| $12,500 to $14,999 | 0 (0.0%) | 51 (7.7%) |
| $15,000 to $17,499 | 0 (0.0%) | 0 (0.0%) |
| $17,500 to $19,999 | 0 (0.0%) | 9 (1.3%) |
| $20,000 to $22,499 | 0 (0.0%) | 48 (7.2%) |
| $22,500 to $24,999 | 36 (4.7%) | 0 (0.0%) |
| $25,000 to $29,999 | 0 (0.0%) | 0 (0.0%) |
| $30,000 to $34,999 | 37 (4.9%) | 21 (3.2%) |
| $35,000 to $39,999 | 221 (29.1%) | 0 (0.0%) |
| $40,000 to $44,999 | 56 (7.4%) | 35 (5.3%) |
| $45,000 to $49,999 | 12 (1.6%) | 50 (7.5%) |
| $50,000 to $54,999 | 42 (5.5%) | 0 (0.0%) |
| $55,000 to $64,999 | 54 (7.1%) | 45 (6.8%) |
| $65,000 to $74,999 | 19 (2.5%) | 10 (1.5%) |
| $75,000 to $99,999 | 74 (9.8%) | 90 (13.5%) |
| $100,000+ | 71 (9.3%) | 54 (8.1%) |
| Total | 759 (100.0%) | 666 (100.0%) |
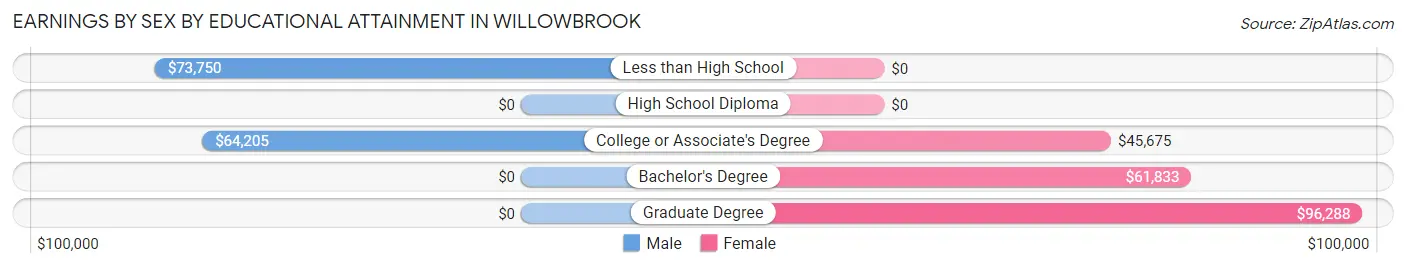
Earnings by Sex by Educational Attainment in Willowbrook
| Educational Attainment | Male Income | Female Income |
| Less than High School | $73,750 | $0 |
| High School Diploma | - | - |
| College or Associate's Degree | $64,205 | $45,675 |
| Bachelor's Degree | - | - |
| Graduate Degree | - | - |
| Total | $52,440 | $0 |
Family Income in Willowbrook
Family Income Brackets in Willowbrook
According to the Willowbrook family income data, there are 303 families falling into the $75,000 to $99,999 income range, which is the most common income bracket and makes up 44.4% of all families.
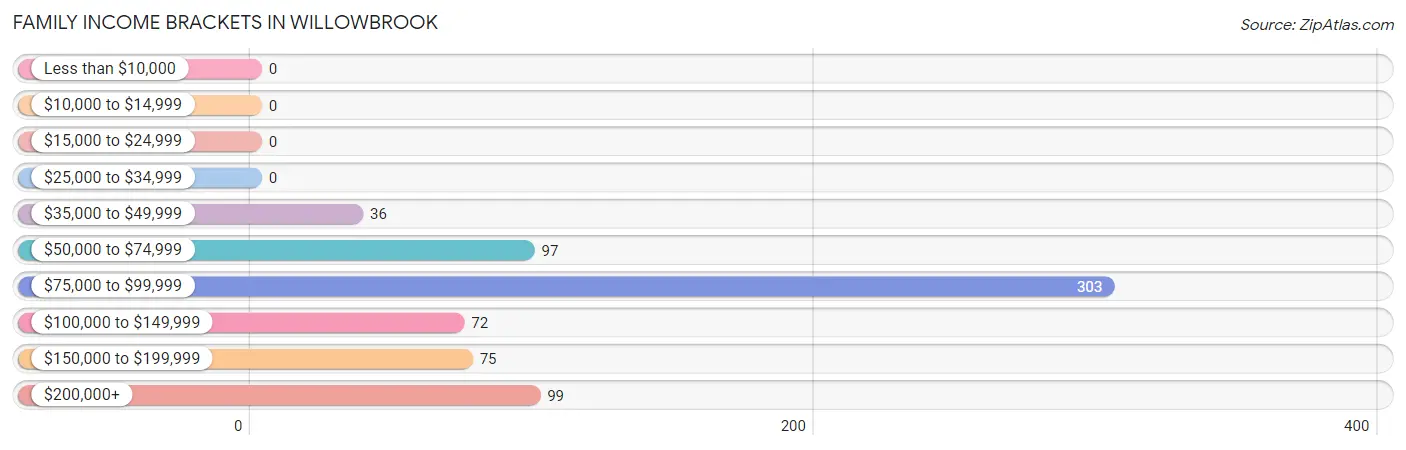
| Income Bracket | # Families | % Families |
| Less than $10,000 | 0 | 0.0% |
| $10,000 to $14,999 | 0 | 0.0% |
| $15,000 to $24,999 | 0 | 0.0% |
| $25,000 to $34,999 | 0 | 0.0% |
| $35,000 to $49,999 | 36 | 5.3% |
| $50,000 to $74,999 | 97 | 14.2% |
| $75,000 to $99,999 | 303 | 44.4% |
| $100,000 to $149,999 | 72 | 10.6% |
| $150,000 to $199,999 | 75 | 11.0% |
| $200,000+ | 99 | 14.5% |
Family Income by Famaliy Size in Willowbrook
7+ person families (35 | 5.1%) account for the highest median family income in Willowbrook with $204,583 per family, while 2-person families (188 | 27.6%) have the highest median income of $47,338 per family member.
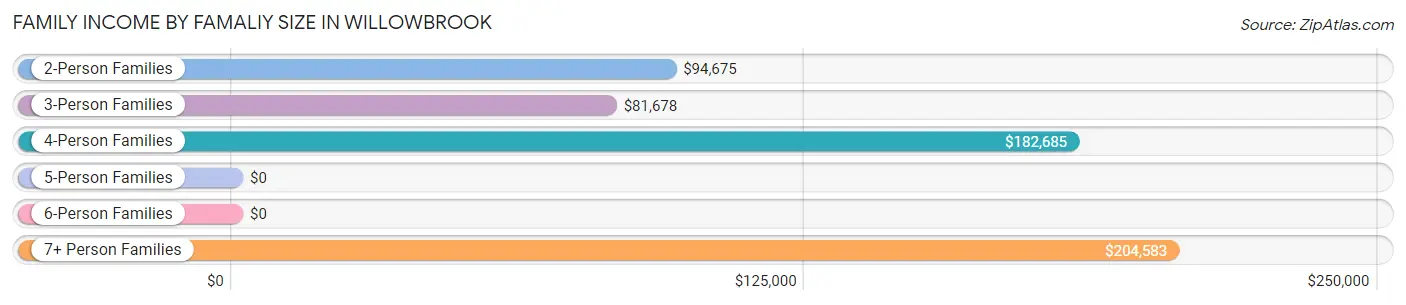
| Income Bracket | # Families | Median Income |
| 2-Person Families | 188 (27.6%) | $94,675 |
| 3-Person Families | 311 (45.6%) | $81,678 |
| 4-Person Families | 70 (10.3%) | $182,685 |
| 5-Person Families | 54 (7.9%) | $0 |
| 6-Person Families | 24 (3.5%) | $0 |
| 7+ Person Families | 35 (5.1%) | $204,583 |
| Total | 682 (100.0%) | $93,084 |
Family Income by Number of Earners in Willowbrook
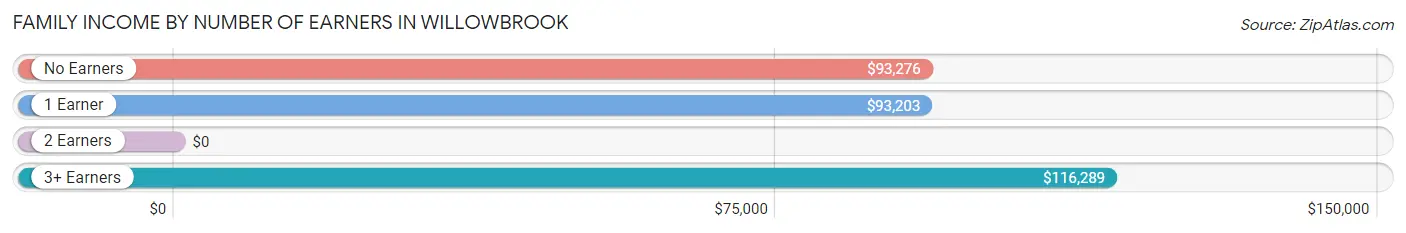
| Number of Earners | # Families | Median Income |
| No Earners | 52 (7.6%) | $93,276 |
| 1 Earner | 191 (28.0%) | $93,203 |
| 2 Earners | 338 (49.6%) | $0 |
| 3+ Earners | 101 (14.8%) | $116,289 |
| Total | 682 (100.0%) | $93,084 |
Household Income in Willowbrook
Household Income Brackets in Willowbrook
With 329 households falling in the category, the $75,000 to $99,999 income range is the most frequent in Willowbrook, accounting for 42.0% of all households.
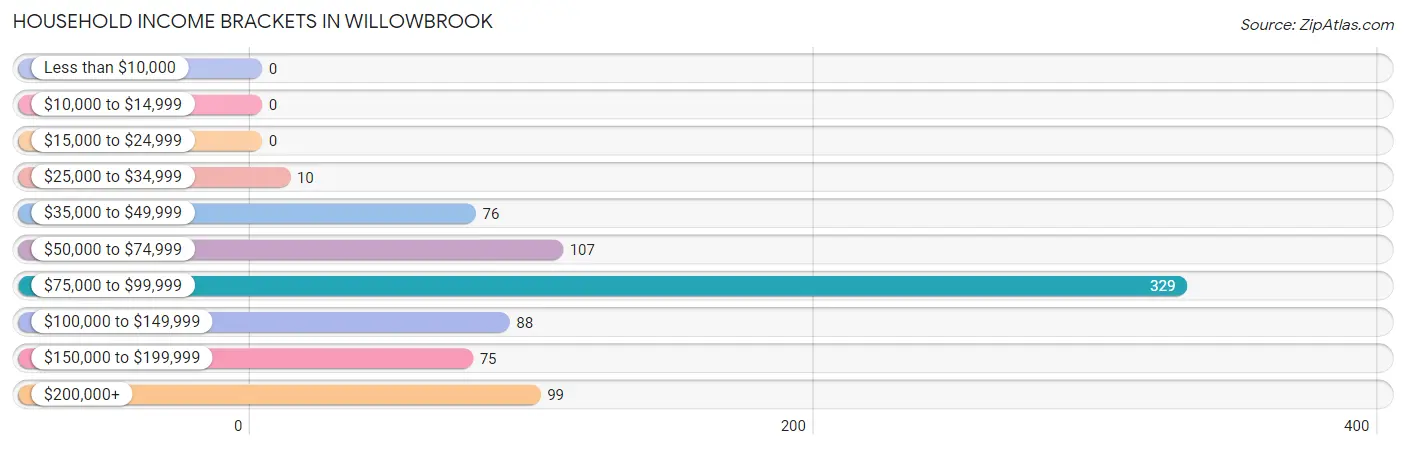
| Income Bracket | # Households | % Households |
| Less than $10,000 | 0 | 0.0% |
| $10,000 to $14,999 | 0 | 0.0% |
| $15,000 to $24,999 | 0 | 0.0% |
| $25,000 to $34,999 | 10 | 1.3% |
| $35,000 to $49,999 | 76 | 9.7% |
| $50,000 to $74,999 | 107 | 13.6% |
| $75,000 to $99,999 | 329 | 42.0% |
| $100,000 to $149,999 | 88 | 11.2% |
| $150,000 to $199,999 | 75 | 9.6% |
| $200,000+ | 99 | 12.6% |
Household Income by Householder Age in Willowbrook
The median household income in Willowbrook is $91,324, with the highest median household income of $95,433 found in the 25 to 44 years age bracket for the primary householder. A total of 221 households (28.2%) fall into this category.
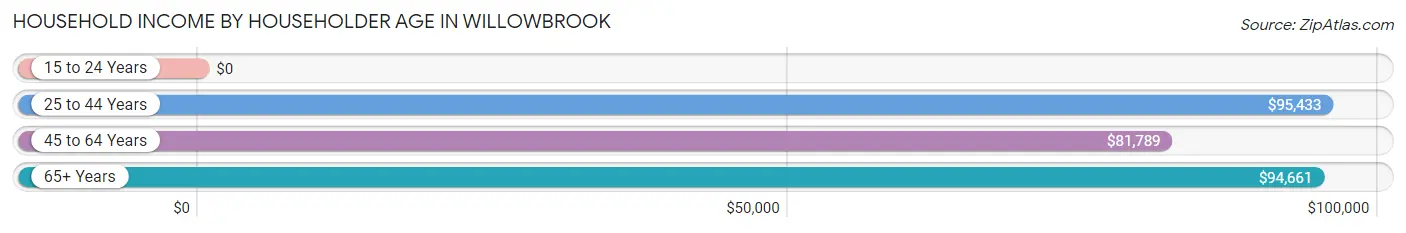
| Income Bracket | # Households | Median Income |
| 15 to 24 Years | 0 (0.0%) | $0 |
| 25 to 44 Years | 221 (28.2%) | $95,433 |
| 45 to 64 Years | 350 (44.6%) | $81,789 |
| 65+ Years | 213 (27.2%) | $94,661 |
| Total | 784 (100.0%) | $91,324 |
Poverty in Willowbrook
Income Below Poverty by Sex and Age in Willowbrook
With 3.0% poverty level for males and 5.6% for females among the residents of Willowbrook, 6 to 11 year old males and 5 year old females are the most vulnerable to poverty, with 9 males (27.3%) and 11 females (50.0%) in their respective age groups living below the poverty level.
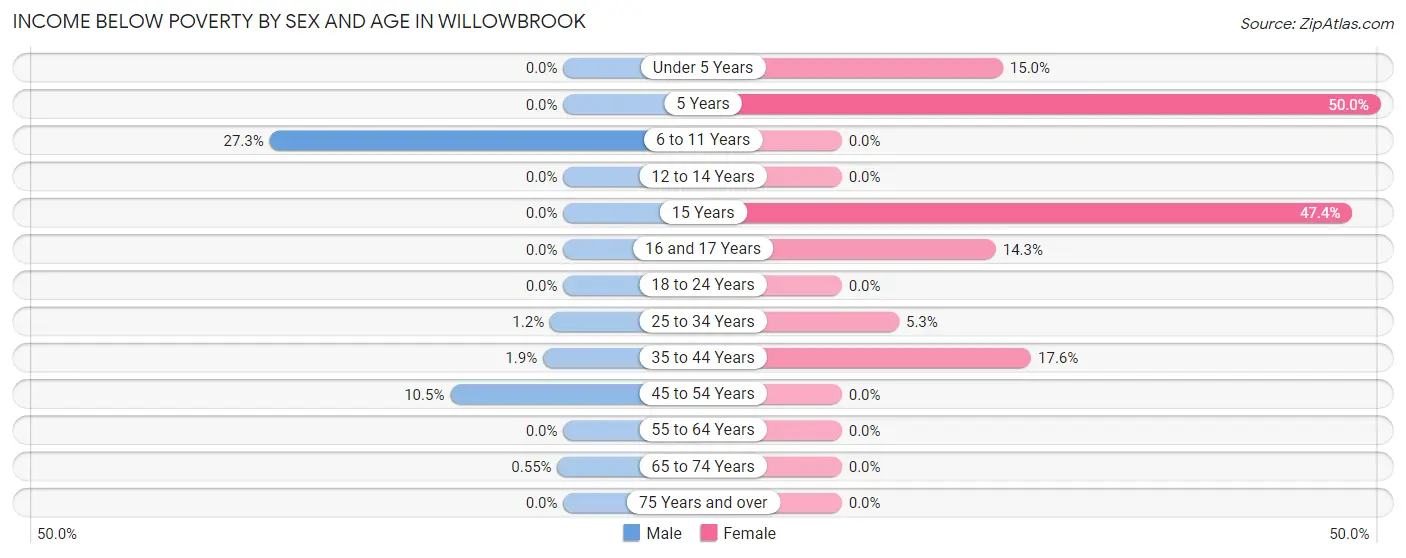
| Age Bracket | Male | Female |
| Under 5 Years | 0 (0.0%) | 16 (14.9%) |
| 5 Years | 0 (0.0%) | 11 (50.0%) |
| 6 to 11 Years | 9 (27.3%) | 0 (0.0%) |
| 12 to 14 Years | 0 (0.0%) | 0 (0.0%) |
| 15 Years | 0 (0.0%) | 9 (47.4%) |
| 16 and 17 Years | 0 (0.0%) | 8 (14.3%) |
| 18 to 24 Years | 0 (0.0%) | 0 (0.0%) |
| 25 to 34 Years | 2 (1.2%) | 12 (5.3%) |
| 35 to 44 Years | 2 (1.9%) | 13 (17.6%) |
| 45 to 54 Years | 25 (10.5%) | 0 (0.0%) |
| 55 to 64 Years | 0 (0.0%) | 0 (0.0%) |
| 65 to 74 Years | 1 (0.5%) | 0 (0.0%) |
| 75 Years and over | 0 (0.0%) | 0 (0.0%) |
| Total | 39 (3.0%) | 69 (5.6%) |
Income Above Poverty by Sex and Age in Willowbrook
According to the poverty statistics in Willowbrook, males aged under 5 years and females aged 6 to 11 years are the age groups that are most secure financially, with 100.0% of males and 100.0% of females in these age groups living above the poverty line.
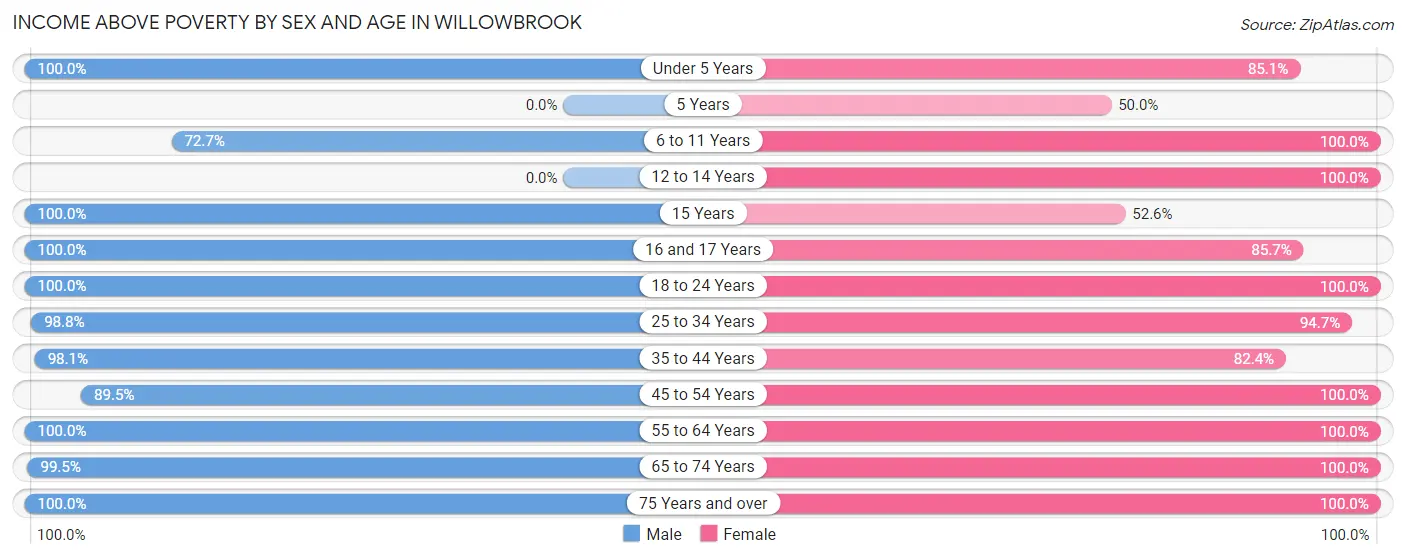
| Age Bracket | Male | Female |
| Under 5 Years | 35 (100.0%) | 91 (85.1%) |
| 5 Years | 0 (0.0%) | 11 (50.0%) |
| 6 to 11 Years | 24 (72.7%) | 68 (100.0%) |
| 12 to 14 Years | 0 (0.0%) | 54 (100.0%) |
| 15 Years | 79 (100.0%) | 10 (52.6%) |
| 16 and 17 Years | 10 (100.0%) | 48 (85.7%) |
| 18 to 24 Years | 281 (100.0%) | 83 (100.0%) |
| 25 to 34 Years | 159 (98.8%) | 214 (94.7%) |
| 35 to 44 Years | 104 (98.1%) | 61 (82.4%) |
| 45 to 54 Years | 213 (89.5%) | 266 (100.0%) |
| 55 to 64 Years | 131 (100.0%) | 77 (100.0%) |
| 65 to 74 Years | 180 (99.5%) | 134 (100.0%) |
| 75 Years and over | 54 (100.0%) | 44 (100.0%) |
| Total | 1,270 (97.0%) | 1,161 (94.4%) |
Income Below Poverty Among Married-Couple Families in Willowbrook
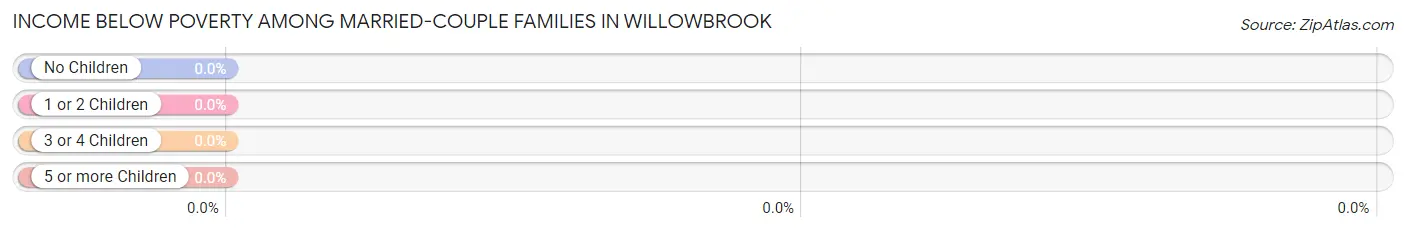
| Children | Above Poverty | Below Poverty |
| No Children | 422 (100.0%) | 0 (0.0%) |
| 1 or 2 Children | 81 (100.0%) | 0 (0.0%) |
| 3 or 4 Children | 44 (100.0%) | 0 (0.0%) |
| 5 or more Children | 0 (0.0%) | 0 (0.0%) |
| Total | 547 (100.0%) | 0 (0.0%) |
Income Below Poverty Among Single-Parent Households in Willowbrook
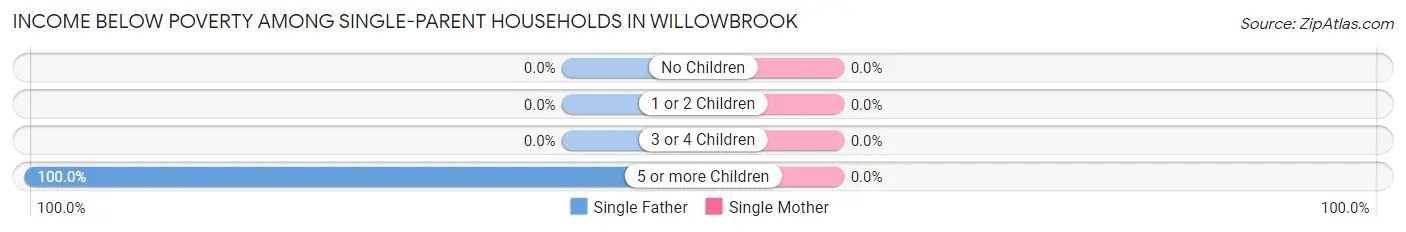
| Children | Single Father | Single Mother |
| No Children | 0 (0.0%) | 0 (0.0%) |
| 1 or 2 Children | 0 (0.0%) | 0 (0.0%) |
| 3 or 4 Children | 0 (0.0%) | 0 (0.0%) |
| 5 or more Children | 10 (100.0%) | 0 (0.0%) |
| Total | 10 (9.6%) | 0 (0.0%) |
Income Below Poverty Among Married-Couple vs Single-Parent Households in Willowbrook
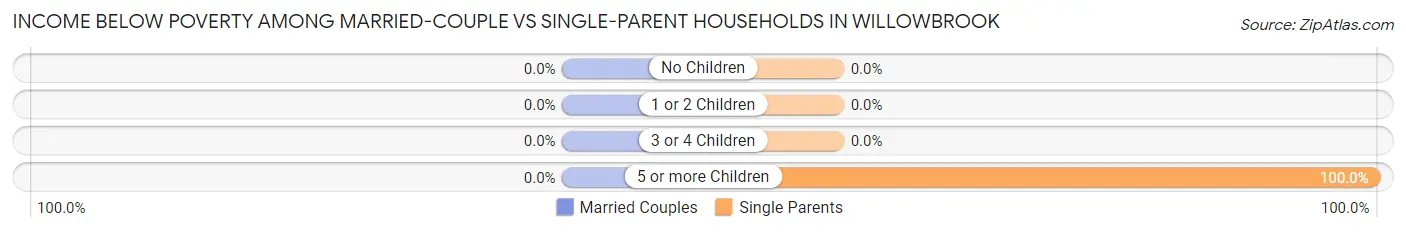
| Children | Married-Couple Families | Single-Parent Households |
| No Children | 0 (0.0%) | 0 (0.0%) |
| 1 or 2 Children | 0 (0.0%) | 0 (0.0%) |
| 3 or 4 Children | 0 (0.0%) | 0 (0.0%) |
| 5 or more Children | 0 (0.0%) | 10 (100.0%) |
| Total | 0 (0.0%) | 10 (7.4%) |
Race in Willowbrook
The most populous races in Willowbrook are Black / African American (2,031 | 80.0%), White / Caucasian (322 | 12.7%), and Hispanic or Latino (126 | 5.0%).
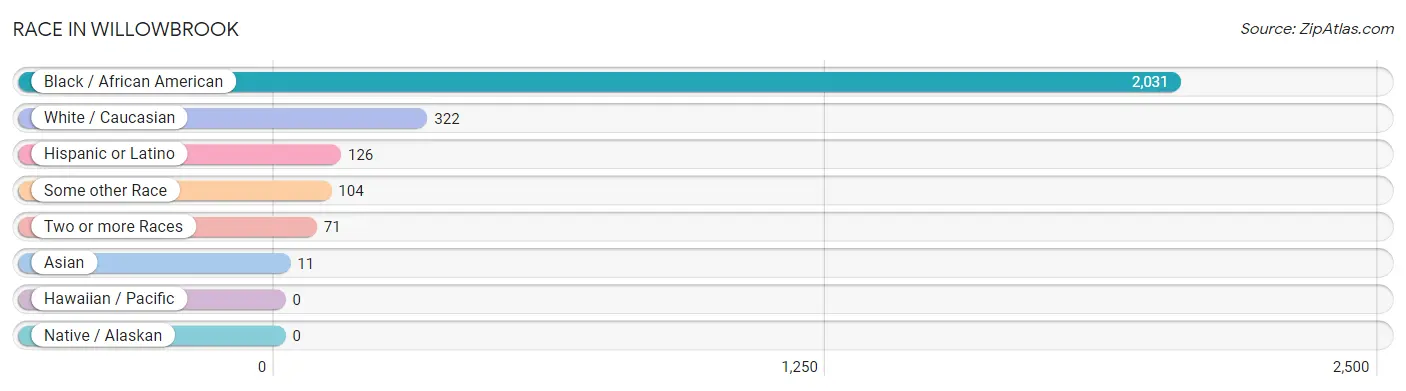
| Race | # Population | % Population |
| Asian | 11 | 0.4% |
| Black / African American | 2,031 | 80.0% |
| Hawaiian / Pacific | 0 | 0.0% |
| Hispanic or Latino | 126 | 5.0% |
| Native / Alaskan | 0 | 0.0% |
| White / Caucasian | 322 | 12.7% |
| Two or more Races | 71 | 2.8% |
| Some other Race | 104 | 4.1% |
| Total | 2,539 | 100.0% |
Ancestry in Willowbrook
The most populous ancestries reported in Willowbrook are African (272 | 10.7%), Subsaharan African (272 | 10.7%), Mexican (113 | 4.4%), English (72 | 2.8%), and Italian (51 | 2.0%), together accounting for 30.7% of all Willowbrook residents.
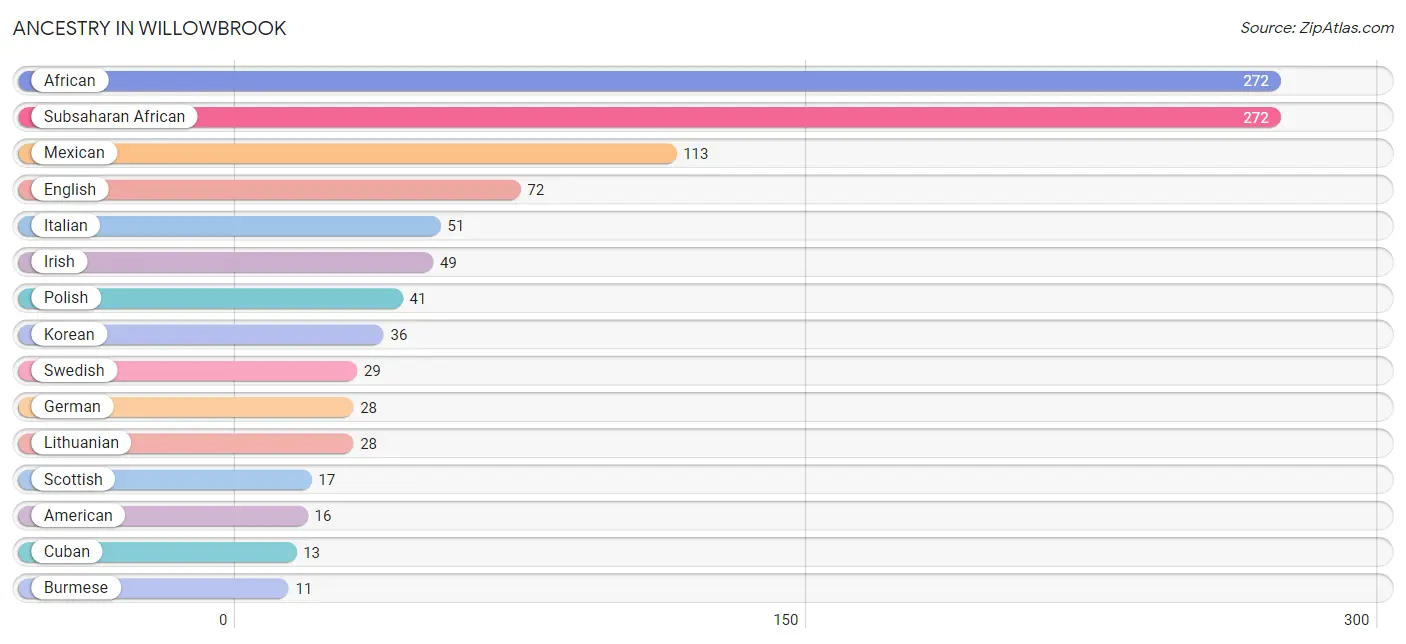
| Ancestry | # Population | % Population |
| African | 272 | 10.7% |
| American | 16 | 0.6% |
| Burmese | 11 | 0.4% |
| Canadian | 6 | 0.2% |
| Croatian | 10 | 0.4% |
| Cuban | 13 | 0.5% |
| Danish | 9 | 0.4% |
| English | 72 | 2.8% |
| German | 28 | 1.1% |
| Irish | 49 | 1.9% |
| Italian | 51 | 2.0% |
| Korean | 36 | 1.4% |
| Lithuanian | 28 | 1.1% |
| Mexican | 113 | 4.4% |
| Polish | 41 | 1.6% |
| Scottish | 17 | 0.7% |
| Subsaharan African | 272 | 10.7% |
| Swedish | 29 | 1.1% | View All 18 Rows |
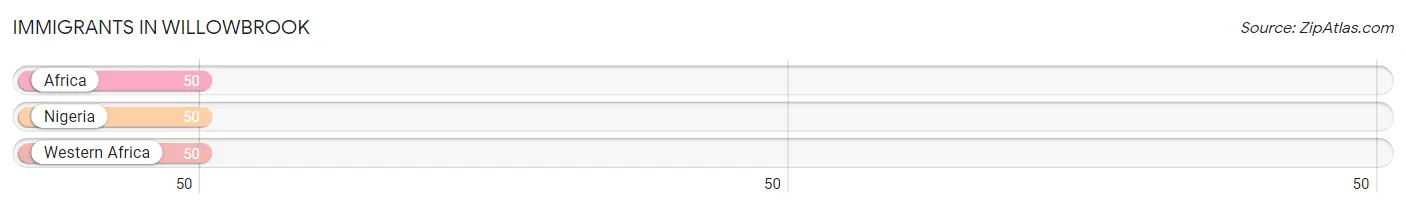
Immigrants in Willowbrook
The most numerous immigrant groups reported in Willowbrook came from Africa (50 | 2.0%), Nigeria (50 | 2.0%), and Western Africa (50 | 2.0%), together accounting for 5.9% of all Willowbrook residents.
| Immigration Origin | # Population | % Population |
| Africa | 50 | 2.0% |
| Nigeria | 50 | 2.0% |
| Western Africa | 50 | 2.0% | View All 3 Rows |
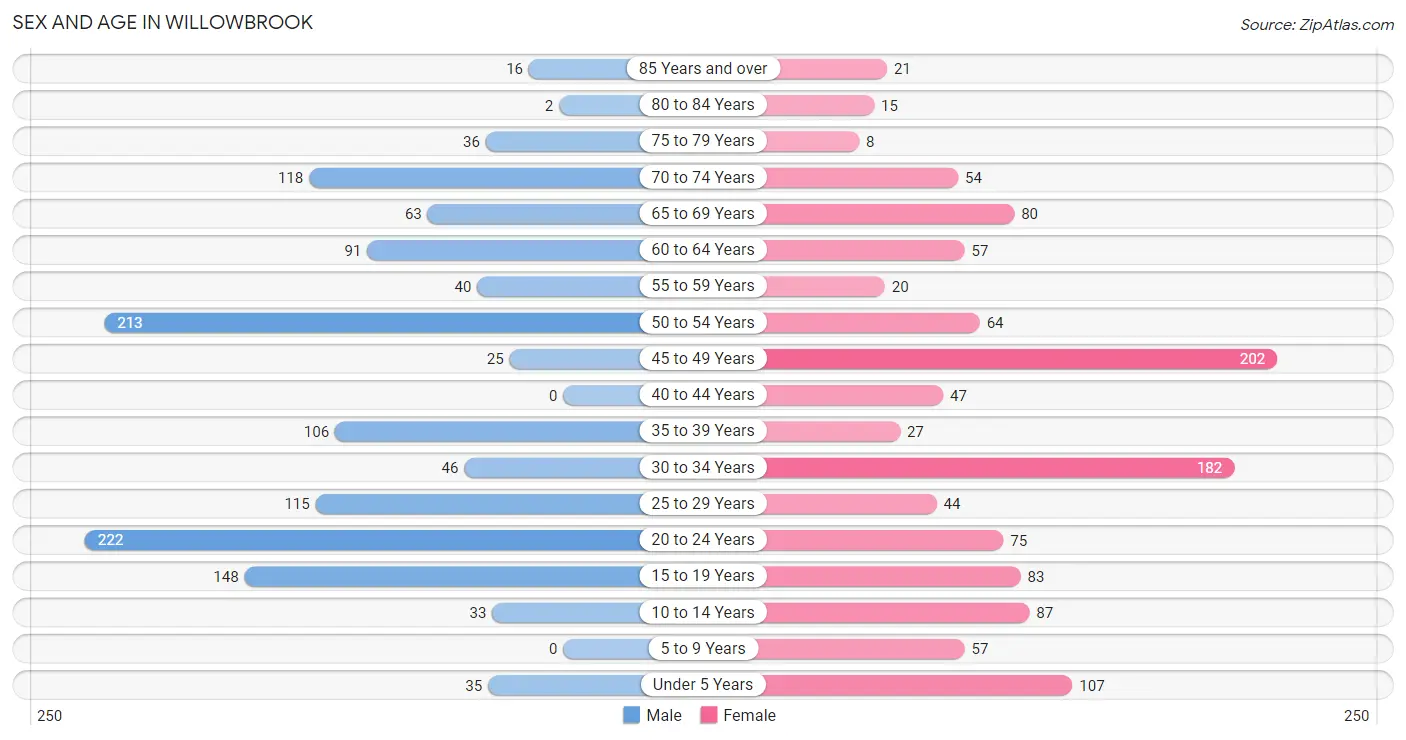
Sex and Age in Willowbrook
Sex and Age in Willowbrook
The most populous age groups in Willowbrook are 20 to 24 Years (222 | 17.0%) for men and 45 to 49 Years (202 | 16.4%) for women.
| Age Bracket | Male | Female |
| Under 5 Years | 35 (2.7%) | 107 (8.7%) |
| 5 to 9 Years | 0 (0.0%) | 57 (4.6%) |
| 10 to 14 Years | 33 (2.5%) | 87 (7.1%) |
| 15 to 19 Years | 148 (11.3%) | 83 (6.8%) |
| 20 to 24 Years | 222 (17.0%) | 75 (6.1%) |
| 25 to 29 Years | 115 (8.8%) | 44 (3.6%) |
| 30 to 34 Years | 46 (3.5%) | 182 (14.8%) |
| 35 to 39 Years | 106 (8.1%) | 27 (2.2%) |
| 40 to 44 Years | 0 (0.0%) | 47 (3.8%) |
| 45 to 49 Years | 25 (1.9%) | 202 (16.4%) |
| 50 to 54 Years | 213 (16.3%) | 64 (5.2%) |
| 55 to 59 Years | 40 (3.1%) | 20 (1.6%) |
| 60 to 64 Years | 91 (7.0%) | 57 (4.6%) |
| 65 to 69 Years | 63 (4.8%) | 80 (6.5%) |
| 70 to 74 Years | 118 (9.0%) | 54 (4.4%) |
| 75 to 79 Years | 36 (2.8%) | 8 (0.6%) |
| 80 to 84 Years | 2 (0.2%) | 15 (1.2%) |
| 85 Years and over | 16 (1.2%) | 21 (1.7%) |
| Total | 1,309 (100.0%) | 1,230 (100.0%) |
Families and Households in Willowbrook
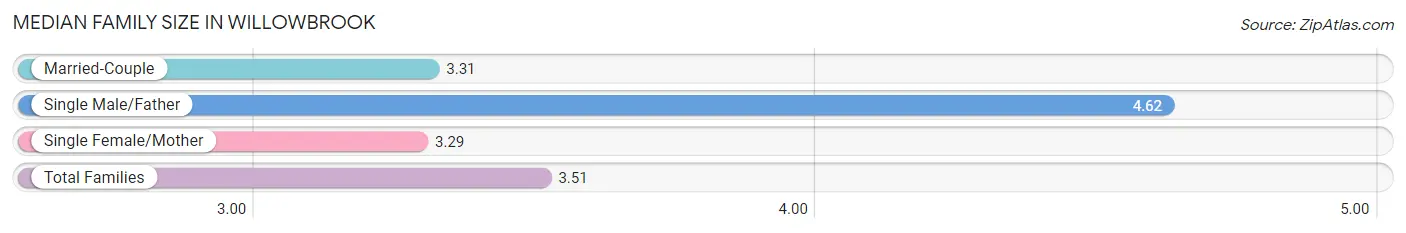
Median Family Size in Willowbrook
The median family size in Willowbrook is 3.51 persons per family, with single male/father families (104 | 15.2%) accounting for the largest median family size of 4.62 persons per family. On the other hand, single female/mother families (31 | 4.5%) represent the smallest median family size with 3.29 persons per family.
| Family Type | # Families | Family Size |
| Married-Couple | 547 (80.2%) | 3.31 |
| Single Male/Father | 104 (15.2%) | 4.62 |
| Single Female/Mother | 31 (4.5%) | 3.29 |
| Total Families | 682 (100.0%) | 3.51 |
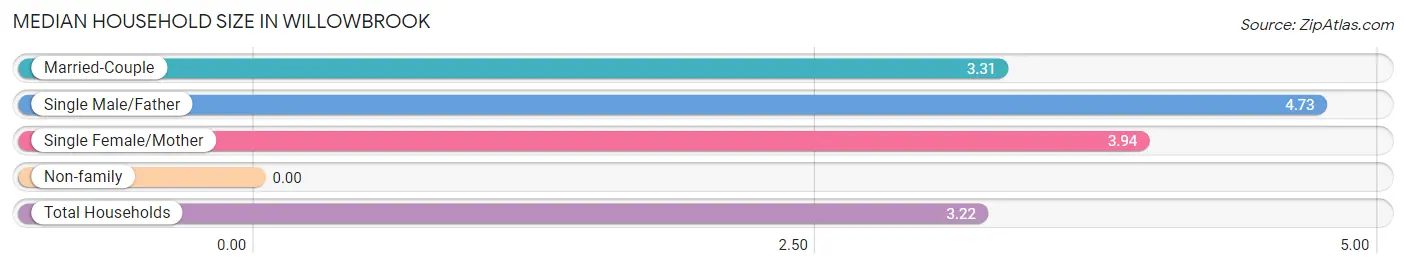
Median Household Size in Willowbrook
| Household Type | # Households | Household Size |
| Married-Couple | 547 (69.8%) | 3.31 |
| Single Male/Father | 104 (13.3%) | 4.73 |
| Single Female/Mother | 31 (4.0%) | 3.94 |
| Non-family | 102 (13.0%) | - |
| Total Households | 784 (100.0%) | 3.22 |
Household Size by Marriage Status in Willowbrook
Out of a total of 784 households in Willowbrook, 682 (87.0%) are family households, while 102 (13.0%) are nonfamily households. The most numerous type of family households are 3-person households, comprising 298, and the most common type of nonfamily households are 1-person households, comprising 102.
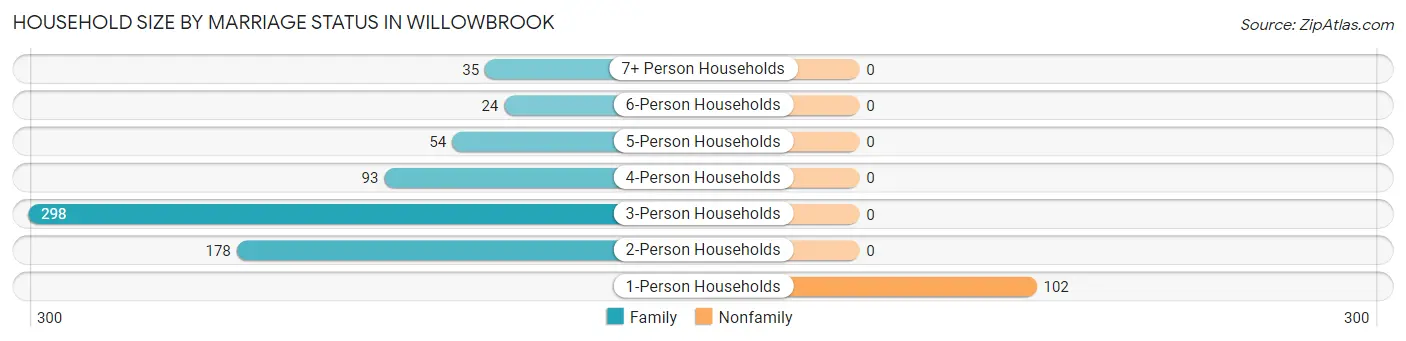
| Household Size | Family Households | Nonfamily Households |
| 1-Person Households | - | 102 (13.0%) |
| 2-Person Households | 178 (22.7%) | 0 (0.0%) |
| 3-Person Households | 298 (38.0%) | 0 (0.0%) |
| 4-Person Households | 93 (11.9%) | 0 (0.0%) |
| 5-Person Households | 54 (6.9%) | 0 (0.0%) |
| 6-Person Households | 24 (3.1%) | 0 (0.0%) |
| 7+ Person Households | 35 (4.5%) | 0 (0.0%) |
| Total | 682 (87.0%) | 102 (13.0%) |
Female Fertility in Willowbrook
Fertility by Age in Willowbrook
| Age Bracket | Women with Births | Births / 1,000 Women |
| 15 to 19 years | 0 (0.0%) | 0.0 |
| 20 to 34 years | 0 (0.0%) | 0.0 |
| 35 to 50 years | 0 (0.0%) | 0.0 |
| Total | 0 (0.0%) | 0.0 |
Fertility by Age by Marriage Status in Willowbrook
| Age Bracket | Married | Unmarried |
| 15 to 19 years | 0 (0.0%) | 0 (0.0%) |
| 20 to 34 years | 0 (0.0%) | 0 (0.0%) |
| 35 to 50 years | 0 (0.0%) | 0 (0.0%) |
| Total | 0 (0.0%) | 0 (0.0%) |
Fertility by Education in Willowbrook
| Educational Attainment | Women with Births | Births / 1,000 Women |
| Less than High School | 0 (0.0%) | 0.0 |
| High School Diploma | 0 (0.0%) | 0.0 |
| College or Associate's Degree | 0 (0.0%) | 0.0 |
| Bachelor's Degree | 0 (0.0%) | 0.0 |
| Graduate Degree | 0 (0.0%) | 0.0 |
| Total | 0 (0.0%) | 0.0 |
Fertility by Education by Marriage Status in Willowbrook
| Educational Attainment | Married | Unmarried |
| Less than High School | 0 (0.0%) | 0 (0.0%) |
| High School Diploma | 0 (0.0%) | 0 (0.0%) |
| College or Associate's Degree | 0 (0.0%) | 0 (0.0%) |
| Bachelor's Degree | 0 (0.0%) | 0 (0.0%) |
| Graduate Degree | 0 (0.0%) | 0 (0.0%) |
| Total | 0 (0.0%) | 0 (0.0%) |
Employment Characteristics in Willowbrook
Employment by Class of Employer in Willowbrook
Among the 1,290 employed individuals in Willowbrook, private company employees (722 | 56.0%), self-employed (not incorporated) (235 | 18.2%), and local government employees (140 | 10.8%) make up the most common classes of employment.
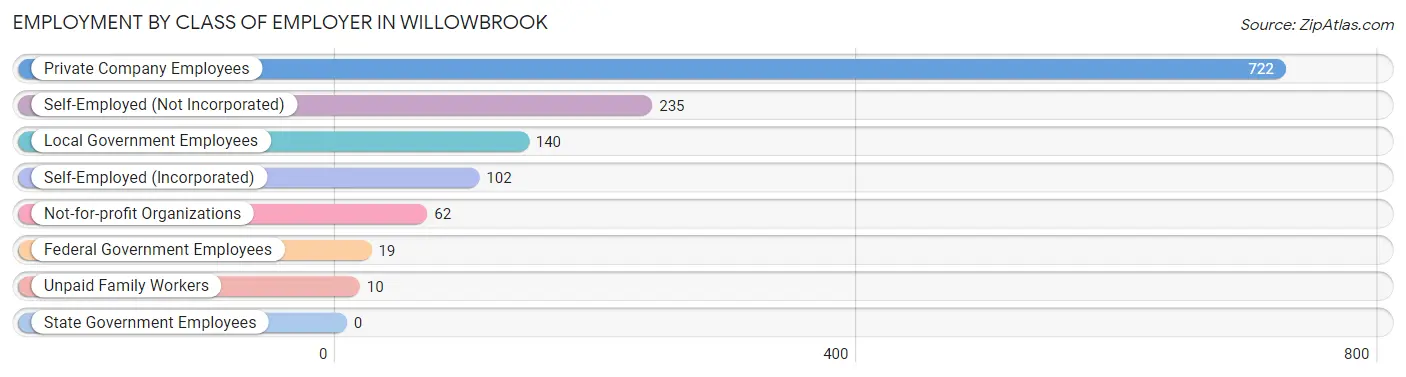
| Employer Class | # Employees | % Employees |
| Private Company Employees | 722 | 56.0% |
| Self-Employed (Incorporated) | 102 | 7.9% |
| Self-Employed (Not Incorporated) | 235 | 18.2% |
| Not-for-profit Organizations | 62 | 4.8% |
| Local Government Employees | 140 | 10.8% |
| State Government Employees | 0 | 0.0% |
| Federal Government Employees | 19 | 1.5% |
| Unpaid Family Workers | 10 | 0.8% |
| Total | 1,290 | 100.0% |
Employment Status by Age in Willowbrook
According to the labor force statistics for Willowbrook, out of the total population over 16 years of age (2,122), 63.8% or 1,354 individuals are in the labor force, with 3.2% or 43 of them unemployed. The age group with the highest labor force participation rate is 55 to 59 years, with 100.0% or 60 individuals in the labor force. Within the labor force, the 35 to 44 years age range has the highest percentage of unemployed individuals, with 12.9% or 23 of them being unemployed.
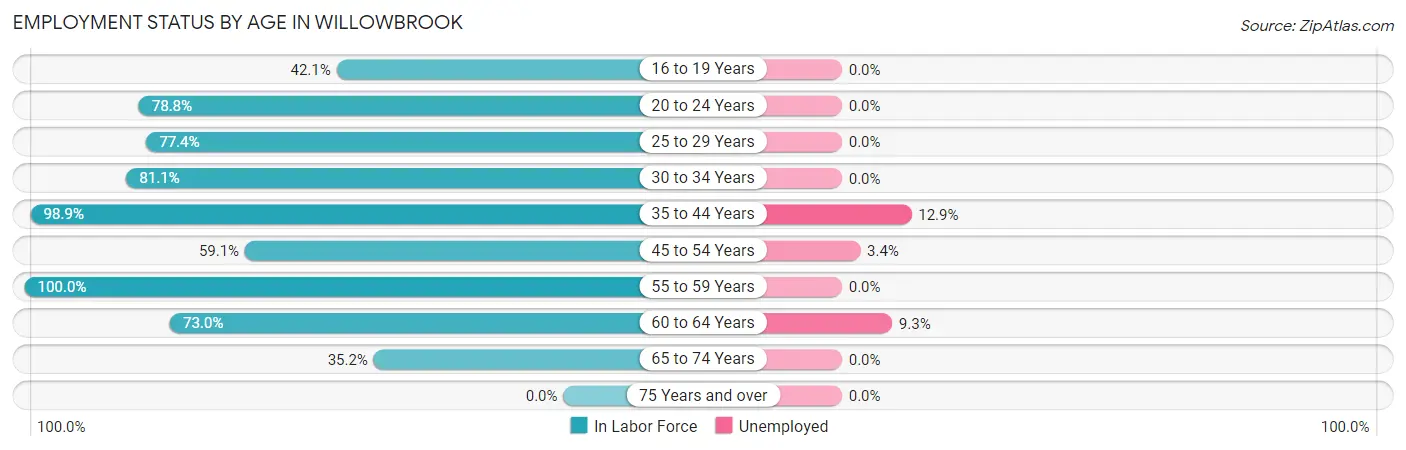
| Age Bracket | In Labor Force | Unemployed |
| 16 to 19 Years | 56 (42.1%) | 0 (0.0%) |
| 20 to 24 Years | 234 (78.8%) | 0 (0.0%) |
| 25 to 29 Years | 123 (77.4%) | 0 (0.0%) |
| 30 to 34 Years | 185 (81.1%) | 0 (0.0%) |
| 35 to 44 Years | 178 (98.9%) | 23 (12.9%) |
| 45 to 54 Years | 298 (59.1%) | 10 (3.4%) |
| 55 to 59 Years | 60 (100.0%) | 0 (0.0%) |
| 60 to 64 Years | 108 (73.0%) | 10 (9.3%) |
| 65 to 74 Years | 111 (35.2%) | 0 (0.0%) |
| 75 Years and over | 0 (0.0%) | 0 (0.0%) |
| Total | 1,354 (63.8%) | 43 (3.2%) |
Employment Status by Educational Attainment in Willowbrook
According to labor force statistics for Willowbrook, 74.4% of individuals (952) out of the total population between 25 and 64 years of age (1,279) are in the labor force, with 4.5% or 43 of them being unemployed. The group with the highest labor force participation rate are those with the educational attainment of bachelor's degree or higher, with 100.0% or 268 individuals in the labor force. Within the labor force, individuals with less than high school education have the highest percentage of unemployment, with 69.7% or 23 of them being unemployed.
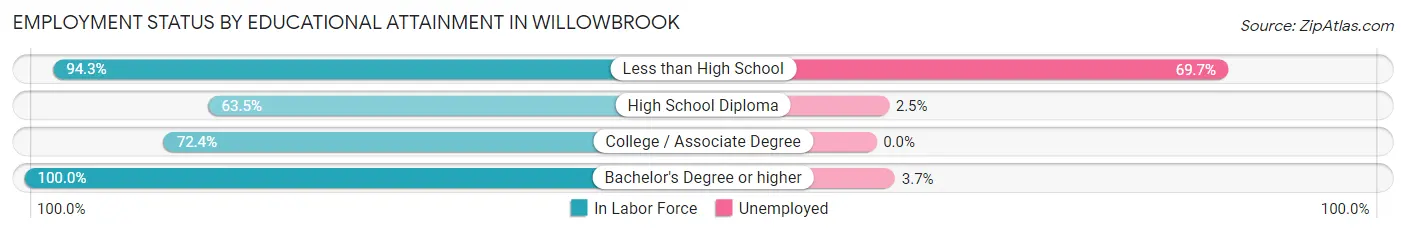
| Educational Attainment | In Labor Force | Unemployed |
| Less than High School | 33 (94.3%) | 24 (69.7%) |
| High School Diploma | 396 (63.5%) | 16 (2.5%) |
| College / Associate Degree | 255 (72.4%) | 0 (0.0%) |
| Bachelor's Degree or higher | 268 (100.0%) | 10 (3.7%) |
| Total | 952 (74.4%) | 58 (4.5%) |
Employment Occupations by Sex in Willowbrook
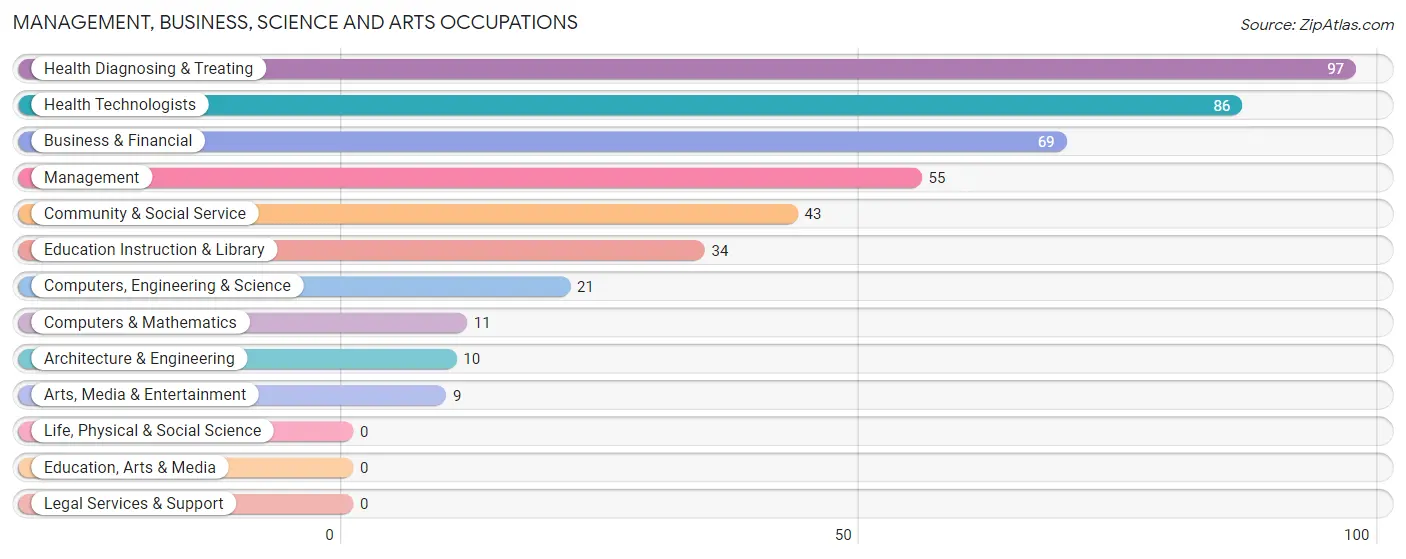
Management, Business, Science and Arts Occupations
The most common Management, Business, Science and Arts occupations in Willowbrook are Health Diagnosing & Treating (97 | 7.4%), Health Technologists (86 | 6.6%), Business & Financial (69 | 5.3%), Management (55 | 4.2%), and Community & Social Service (43 | 3.3%).
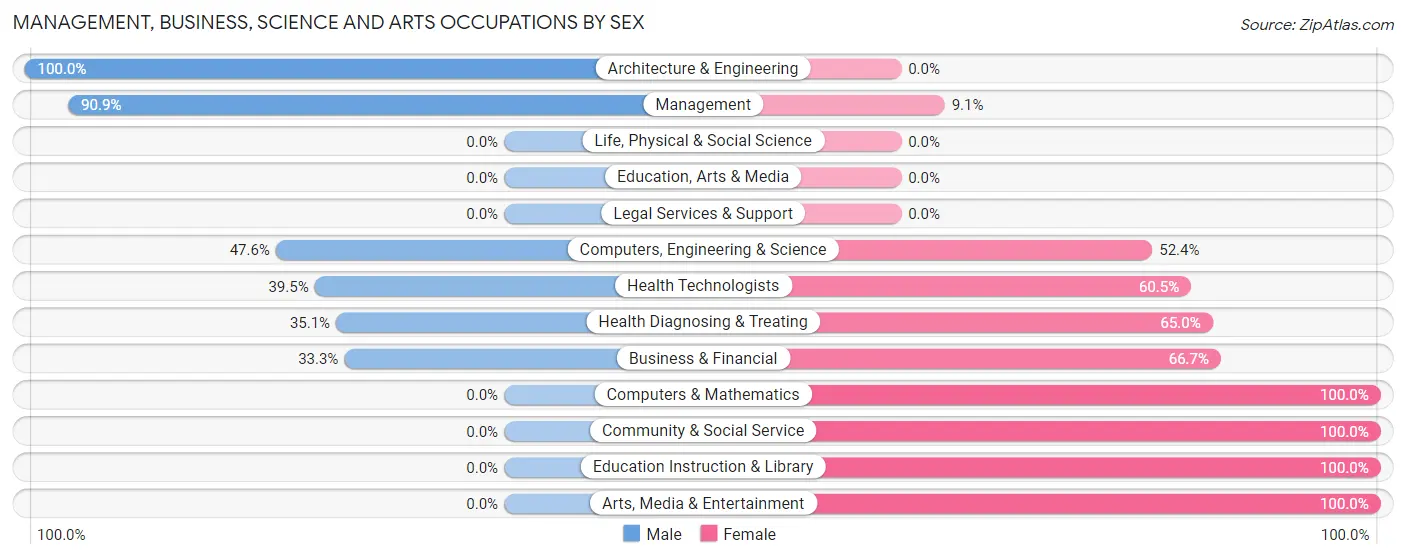
Management, Business, Science and Arts Occupations by Sex
Within the Management, Business, Science and Arts occupations in Willowbrook, the most male-oriented occupations are Architecture & Engineering (100.0%), Management (90.9%), and Computers, Engineering & Science (47.6%), while the most female-oriented occupations are Computers & Mathematics (100.0%), Community & Social Service (100.0%), and Education Instruction & Library (100.0%).
| Occupation | Male | Female |
| Management | 50 (90.9%) | 5 (9.1%) |
| Business & Financial | 23 (33.3%) | 46 (66.7%) |
| Computers, Engineering & Science | 10 (47.6%) | 11 (52.4%) |
| Computers & Mathematics | 0 (0.0%) | 11 (100.0%) |
| Architecture & Engineering | 10 (100.0%) | 0 (0.0%) |
| Life, Physical & Social Science | 0 (0.0%) | 0 (0.0%) |
| Community & Social Service | 0 (0.0%) | 43 (100.0%) |
| Education, Arts & Media | 0 (0.0%) | 0 (0.0%) |
| Legal Services & Support | 0 (0.0%) | 0 (0.0%) |
| Education Instruction & Library | 0 (0.0%) | 34 (100.0%) |
| Arts, Media & Entertainment | 0 (0.0%) | 9 (100.0%) |
| Health Diagnosing & Treating | 34 (35.0%) | 63 (64.9%) |
| Health Technologists | 34 (39.5%) | 52 (60.5%) |
| Total (Category) | 117 (41.0%) | 168 (59.0%) |
| Total (Overall) | 692 (52.8%) | 618 (47.2%) |
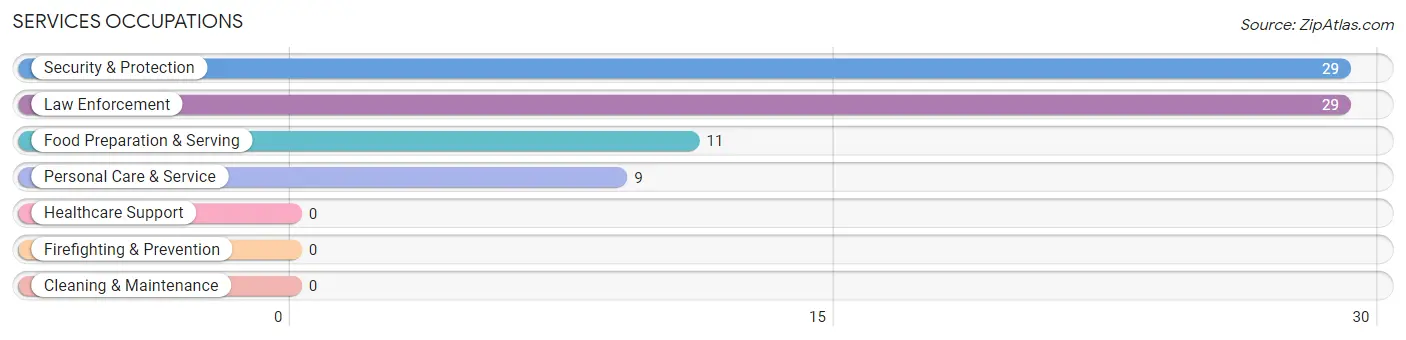
Services Occupations
The most common Services occupations in Willowbrook are Security & Protection (29 | 2.2%), Law Enforcement (29 | 2.2%), Food Preparation & Serving (11 | 0.8%), and Personal Care & Service (9 | 0.7%).
Services Occupations by Sex
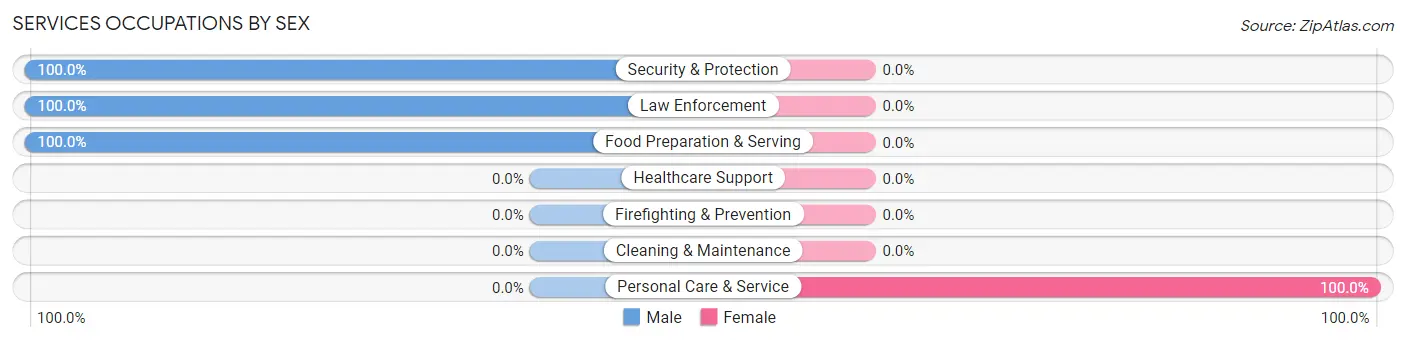
| Occupation | Male | Female |
| Healthcare Support | 0 (0.0%) | 0 (0.0%) |
| Security & Protection | 29 (100.0%) | 0 (0.0%) |
| Firefighting & Prevention | 0 (0.0%) | 0 (0.0%) |
| Law Enforcement | 29 (100.0%) | 0 (0.0%) |
| Food Preparation & Serving | 11 (100.0%) | 0 (0.0%) |
| Cleaning & Maintenance | 0 (0.0%) | 0 (0.0%) |
| Personal Care & Service | 0 (0.0%) | 9 (100.0%) |
| Total (Category) | 40 (81.6%) | 9 (18.4%) |
| Total (Overall) | 692 (52.8%) | 618 (47.2%) |
Sales and Office Occupations
The most common Sales and Office occupations in Willowbrook are Sales & Related (277 | 21.1%), and Office & Administration (178 | 13.6%).

Sales and Office Occupations by Sex

| Occupation | Male | Female |
| Sales & Related | 9 (3.3%) | 268 (96.8%) |
| Office & Administration | 36 (20.2%) | 142 (79.8%) |
| Total (Category) | 45 (9.9%) | 410 (90.1%) |
| Total (Overall) | 692 (52.8%) | 618 (47.2%) |
Natural Resources, Construction and Maintenance Occupations
The most common Natural Resources, Construction and Maintenance occupations in Willowbrook are Installation, Maintenance & Repair (93 | 7.1%), and Construction & Extraction (35 | 2.7%).
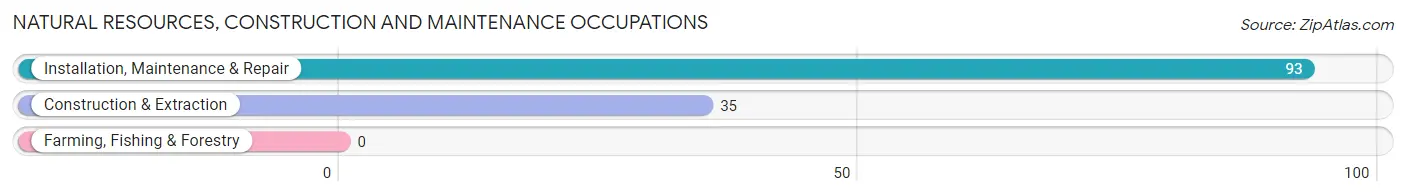
Natural Resources, Construction and Maintenance Occupations by Sex

| Occupation | Male | Female |
| Farming, Fishing & Forestry | 0 (0.0%) | 0 (0.0%) |
| Construction & Extraction | 35 (100.0%) | 0 (0.0%) |
| Installation, Maintenance & Repair | 93 (100.0%) | 0 (0.0%) |
| Total (Category) | 128 (100.0%) | 0 (0.0%) |
| Total (Overall) | 692 (52.8%) | 618 (47.2%) |
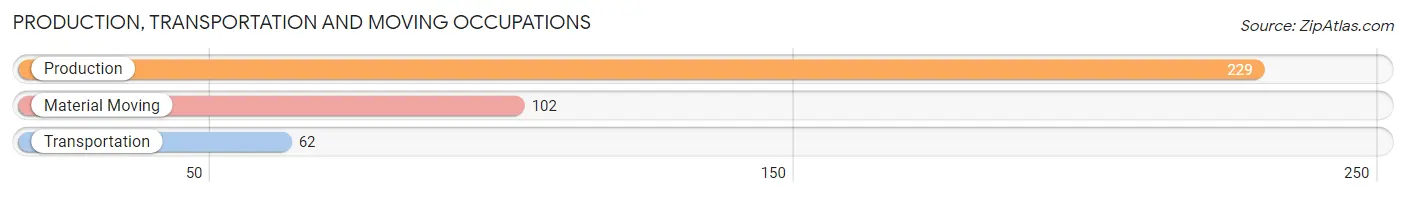
Production, Transportation and Moving Occupations
The most common Production, Transportation and Moving occupations in Willowbrook are Production (229 | 17.5%), Material Moving (102 | 7.8%), and Transportation (62 | 4.7%).
Production, Transportation and Moving Occupations by Sex
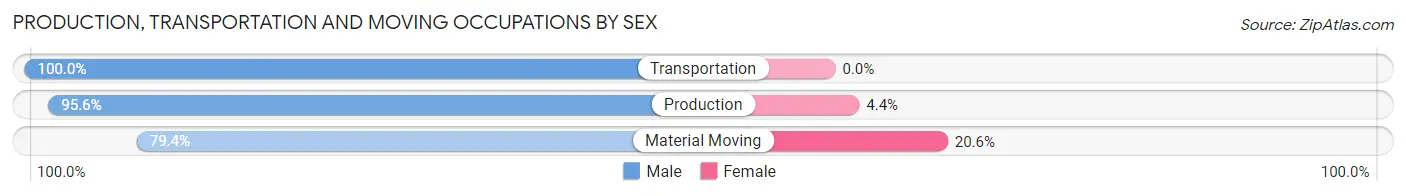
| Occupation | Male | Female |
| Production | 219 (95.6%) | 10 (4.4%) |
| Transportation | 62 (100.0%) | 0 (0.0%) |
| Material Moving | 81 (79.4%) | 21 (20.6%) |
| Total (Category) | 362 (92.1%) | 31 (7.9%) |
| Total (Overall) | 692 (52.8%) | 618 (47.2%) |
Employment Industries by Sex in Willowbrook
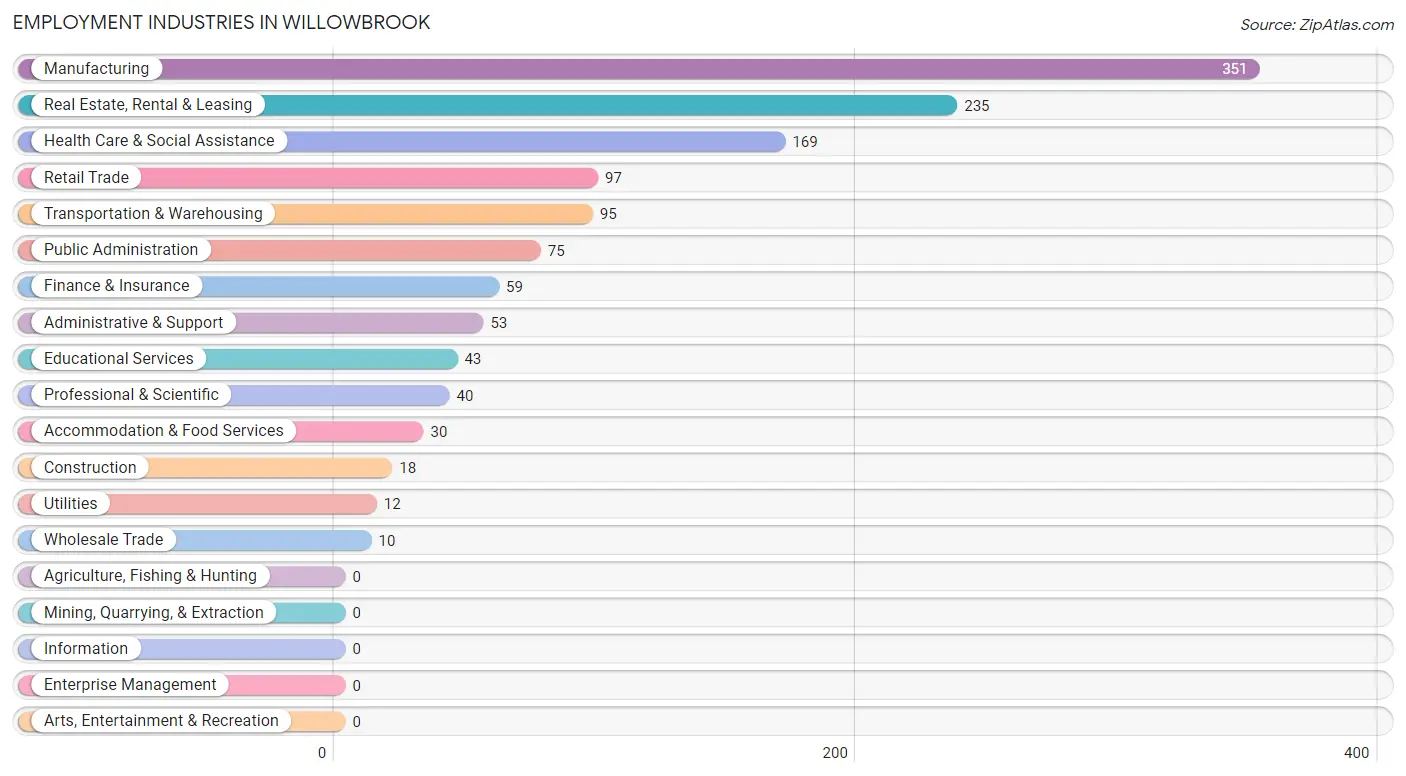
Employment Industries in Willowbrook
The major employment industries in Willowbrook include Manufacturing (351 | 26.8%), Real Estate, Rental & Leasing (235 | 17.9%), Health Care & Social Assistance (169 | 12.9%), Retail Trade (97 | 7.4%), and Transportation & Warehousing (95 | 7.2%).
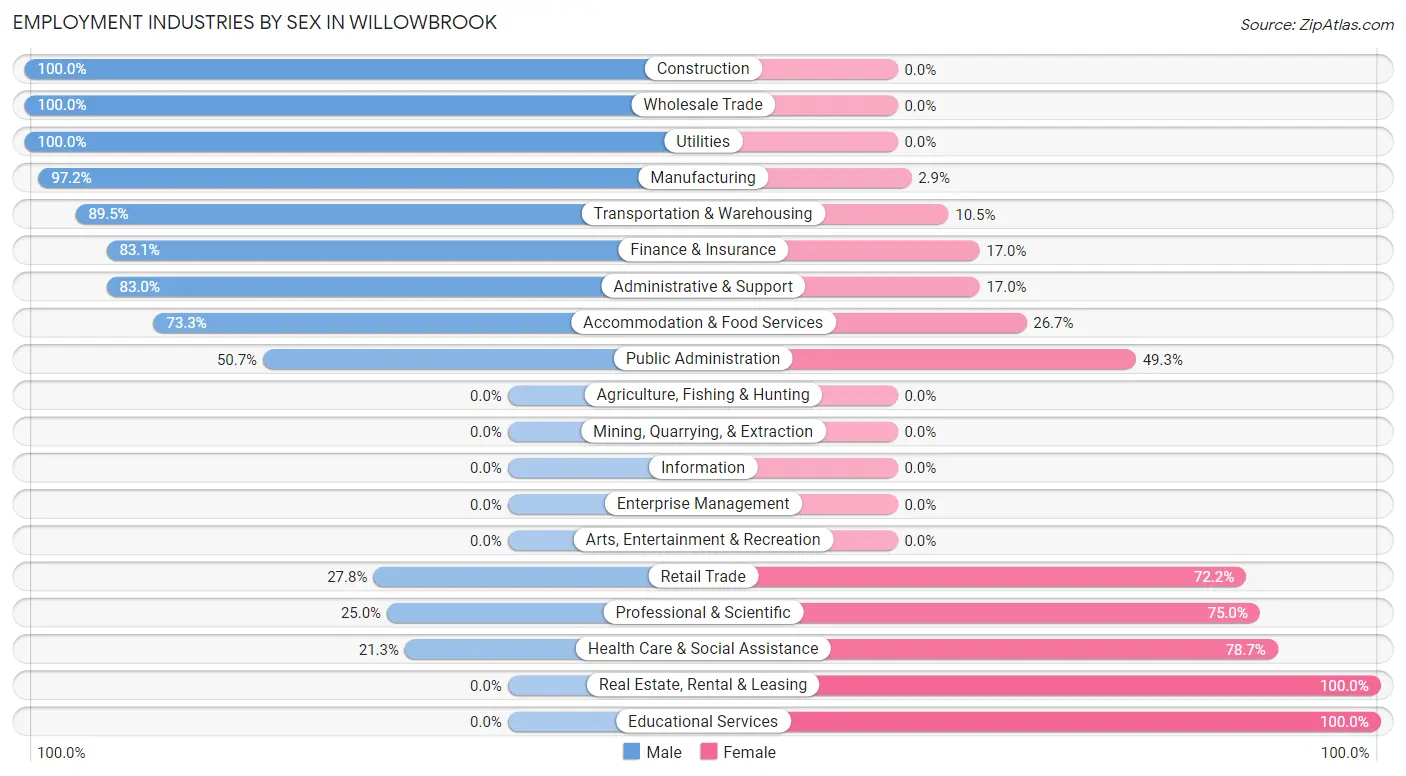
Employment Industries by Sex in Willowbrook
The Willowbrook industries that see more men than women are Construction (100.0%), Wholesale Trade (100.0%), and Utilities (100.0%), whereas the industries that tend to have a higher number of women are Real Estate, Rental & Leasing (100.0%), Educational Services (100.0%), and Health Care & Social Assistance (78.7%).
| Industry | Male | Female |
| Agriculture, Fishing & Hunting | 0 (0.0%) | 0 (0.0%) |
| Mining, Quarrying, & Extraction | 0 (0.0%) | 0 (0.0%) |
| Construction | 18 (100.0%) | 0 (0.0%) |
| Manufacturing | 341 (97.2%) | 10 (2.9%) |
| Wholesale Trade | 10 (100.0%) | 0 (0.0%) |
| Retail Trade | 27 (27.8%) | 70 (72.2%) |
| Transportation & Warehousing | 85 (89.5%) | 10 (10.5%) |
| Utilities | 12 (100.0%) | 0 (0.0%) |
| Information | 0 (0.0%) | 0 (0.0%) |
| Finance & Insurance | 49 (83.1%) | 10 (17.0%) |
| Real Estate, Rental & Leasing | 0 (0.0%) | 235 (100.0%) |
| Professional & Scientific | 10 (25.0%) | 30 (75.0%) |
| Enterprise Management | 0 (0.0%) | 0 (0.0%) |
| Administrative & Support | 44 (83.0%) | 9 (17.0%) |
| Educational Services | 0 (0.0%) | 43 (100.0%) |
| Health Care & Social Assistance | 36 (21.3%) | 133 (78.7%) |
| Arts, Entertainment & Recreation | 0 (0.0%) | 0 (0.0%) |
| Accommodation & Food Services | 22 (73.3%) | 8 (26.7%) |
| Public Administration | 38 (50.7%) | 37 (49.3%) |
| Total | 692 (52.8%) | 618 (47.2%) |
Education in Willowbrook
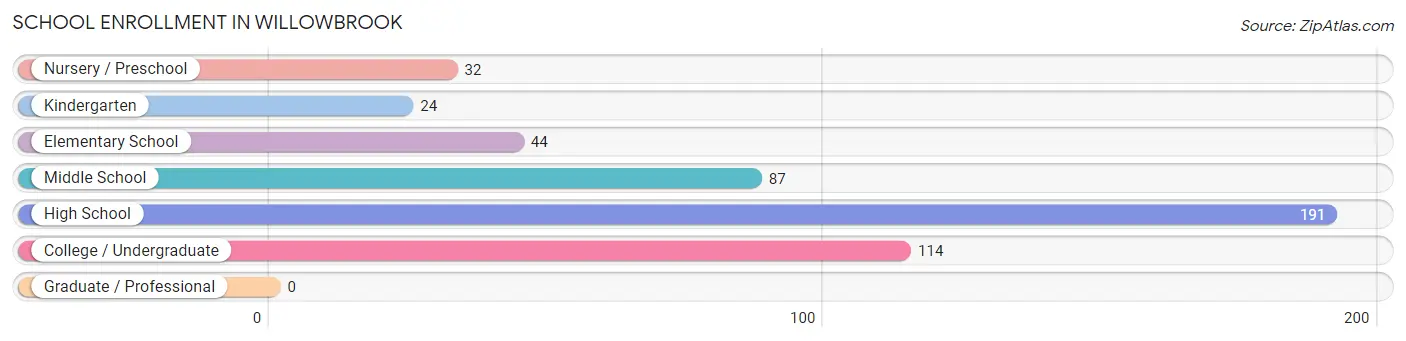
School Enrollment in Willowbrook
The most common levels of schooling among the 492 students in Willowbrook are high school (191 | 38.8%), college / undergraduate (114 | 23.2%), and middle school (87 | 17.7%).
| School Level | # Students | % Students |
| Nursery / Preschool | 32 | 6.5% |
| Kindergarten | 24 | 4.9% |
| Elementary School | 44 | 8.9% |
| Middle School | 87 | 17.7% |
| High School | 191 | 38.8% |
| College / Undergraduate | 114 | 23.2% |
| Graduate / Professional | 0 | 0.0% |
| Total | 492 | 100.0% |
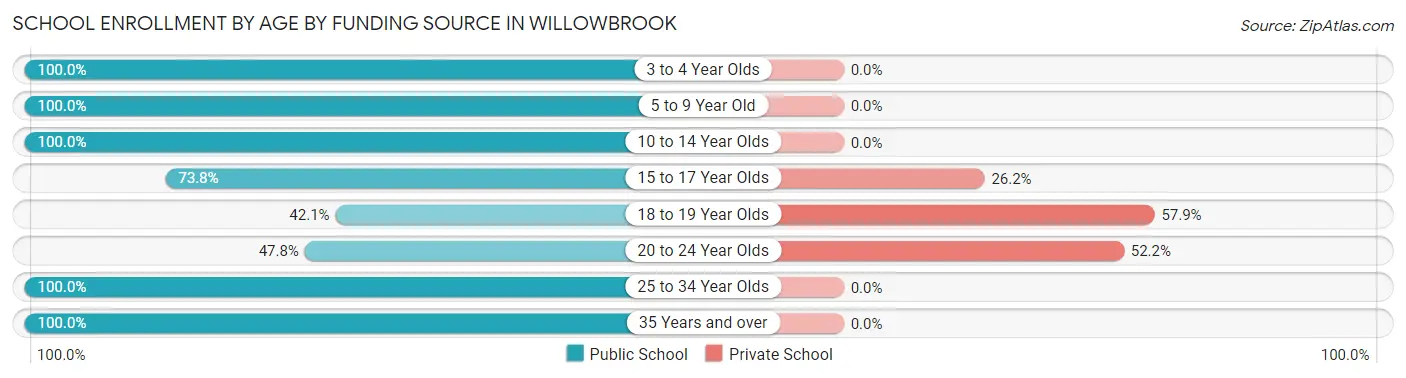
School Enrollment by Age by Funding Source in Willowbrook
Out of a total of 492 students who are enrolled in schools in Willowbrook, 66 (13.4%) attend a private institution, while the remaining 426 (86.6%) are enrolled in public schools. The age group of 18 to 19 year olds has the highest likelihood of being enrolled in private schools, with 11 (57.9% in the age bracket) enrolled. Conversely, the age group of 3 to 4 year olds has the lowest likelihood of being enrolled in a private school, with 10 (100.0% in the age bracket) attending a public institution.
| Age Bracket | Public School | Private School |
| 3 to 4 Year Olds | 10 (100.0%) | 0 (0.0%) |
| 5 to 9 Year Old | 57 (100.0%) | 0 (0.0%) |
| 10 to 14 Year Olds | 120 (100.0%) | 0 (0.0%) |
| 15 to 17 Year Olds | 121 (73.8%) | 43 (26.2%) |
| 18 to 19 Year Olds | 8 (42.1%) | 11 (57.9%) |
| 20 to 24 Year Olds | 11 (47.8%) | 12 (52.2%) |
| 25 to 34 Year Olds | 91 (100.0%) | 0 (0.0%) |
| 35 Years and over | 8 (100.0%) | 0 (0.0%) |
| Total | 426 (86.6%) | 66 (13.4%) |
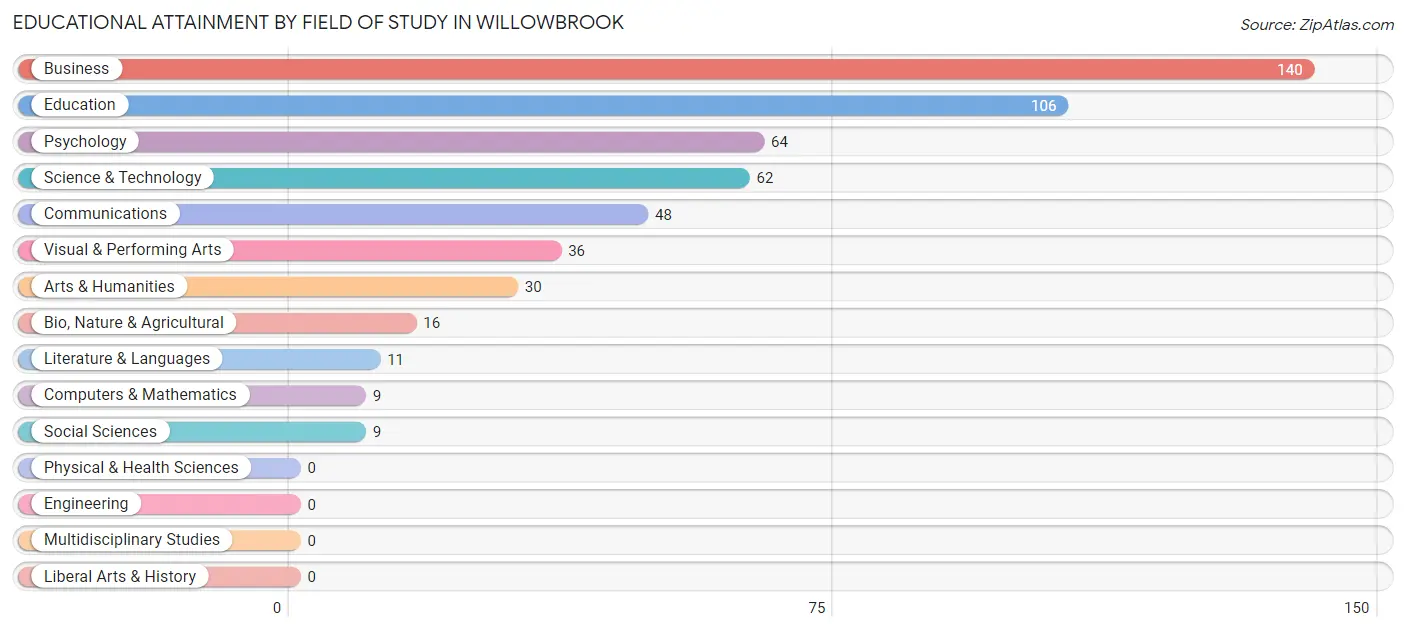
Educational Attainment by Field of Study in Willowbrook
Business (140 | 26.4%), education (106 | 20.0%), psychology (64 | 12.0%), science & technology (62 | 11.7%), and communications (48 | 9.0%) are the most common fields of study among 531 individuals in Willowbrook who have obtained a bachelor's degree or higher.
| Field of Study | # Graduates | % Graduates |
| Computers & Mathematics | 9 | 1.7% |
| Bio, Nature & Agricultural | 16 | 3.0% |
| Physical & Health Sciences | 0 | 0.0% |
| Psychology | 64 | 12.0% |
| Social Sciences | 9 | 1.7% |
| Engineering | 0 | 0.0% |
| Multidisciplinary Studies | 0 | 0.0% |
| Science & Technology | 62 | 11.7% |
| Business | 140 | 26.4% |
| Education | 106 | 20.0% |
| Literature & Languages | 11 | 2.1% |
| Liberal Arts & History | 0 | 0.0% |
| Visual & Performing Arts | 36 | 6.8% |
| Communications | 48 | 9.0% |
| Arts & Humanities | 30 | 5.7% |
| Total | 531 | 100.0% |
Transportation & Commute in Willowbrook
Vehicle Availability by Sex in Willowbrook
The most prevalent vehicle ownership categories in Willowbrook are males with 3 vehicles (357, accounting for 52.6%) and females with 3 vehicles (321, making up 58.5%).
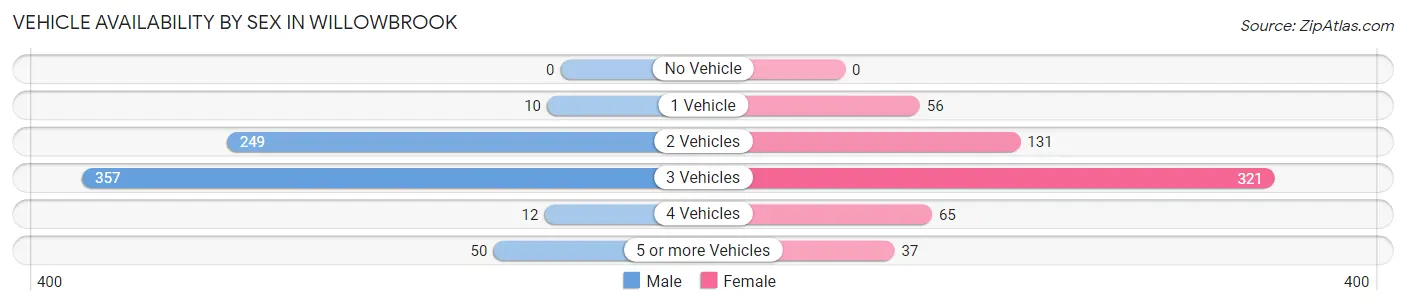
| Vehicles Available | Male | Female |
| No Vehicle | 0 (0.0%) | 0 (0.0%) |
| 1 Vehicle | 10 (1.5%) | 56 (9.2%) |
| 2 Vehicles | 249 (36.7%) | 131 (21.5%) |
| 3 Vehicles | 357 (52.6%) | 321 (52.6%) |
| 4 Vehicles | 12 (1.8%) | 65 (10.7%) |
| 5 or more Vehicles | 50 (7.4%) | 37 (6.1%) |
| Total | 678 (100.0%) | 610 (100.0%) |
Commute Time in Willowbrook
The most frequently occuring commute durations in Willowbrook are 25 to 29 minutes (310 commuters, 29.4%), 30 to 34 minutes (144 commuters, 13.6%), and 45 to 59 minutes (140 commuters, 13.3%).
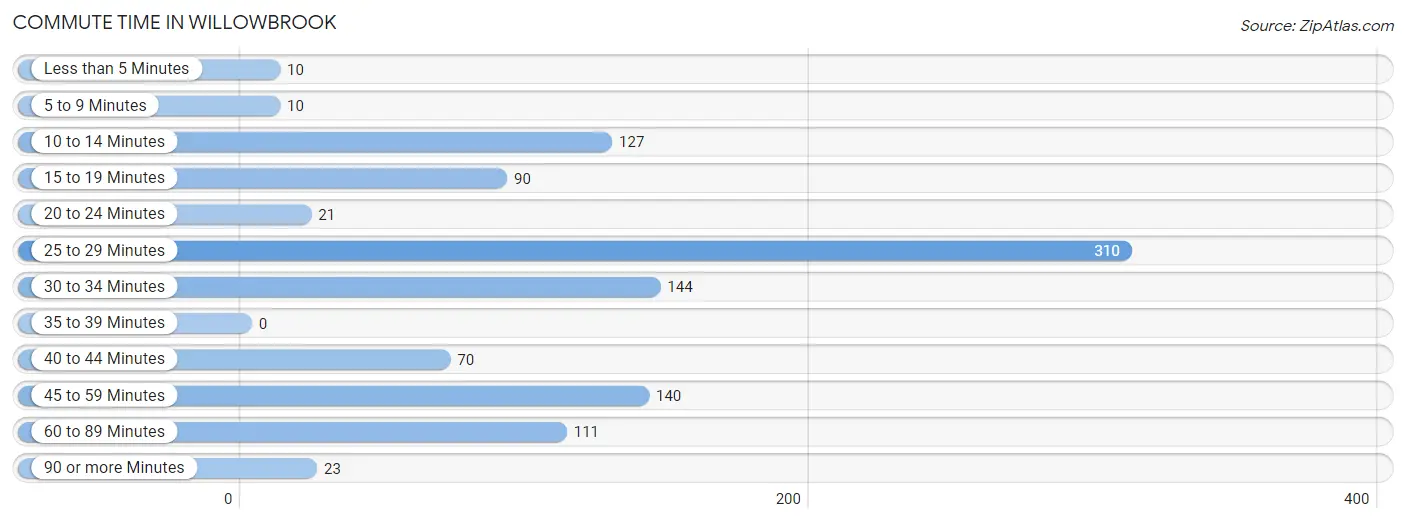
| Commute Time | # Commuters | % Commuters |
| Less than 5 Minutes | 10 | 0.9% |
| 5 to 9 Minutes | 10 | 0.9% |
| 10 to 14 Minutes | 127 | 12.0% |
| 15 to 19 Minutes | 90 | 8.5% |
| 20 to 24 Minutes | 21 | 2.0% |
| 25 to 29 Minutes | 310 | 29.4% |
| 30 to 34 Minutes | 144 | 13.6% |
| 35 to 39 Minutes | 0 | 0.0% |
| 40 to 44 Minutes | 70 | 6.6% |
| 45 to 59 Minutes | 140 | 13.3% |
| 60 to 89 Minutes | 111 | 10.5% |
| 90 or more Minutes | 23 | 2.2% |
Commute Time by Sex in Willowbrook
The most common commute times in Willowbrook are 25 to 29 minutes (310 commuters, 45.6%) for males and 60 to 89 minutes (101 commuters, 26.9%) for females.
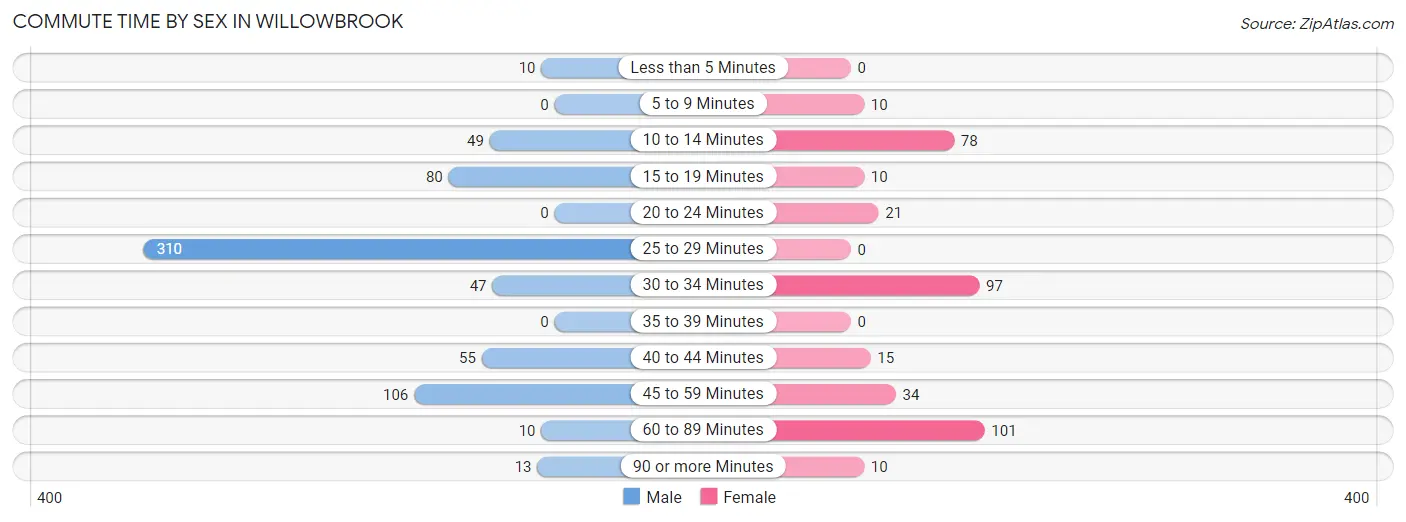
| Commute Time | Male | Female |
| Less than 5 Minutes | 10 (1.5%) | 0 (0.0%) |
| 5 to 9 Minutes | 0 (0.0%) | 10 (2.7%) |
| 10 to 14 Minutes | 49 (7.2%) | 78 (20.7%) |
| 15 to 19 Minutes | 80 (11.8%) | 10 (2.7%) |
| 20 to 24 Minutes | 0 (0.0%) | 21 (5.6%) |
| 25 to 29 Minutes | 310 (45.6%) | 0 (0.0%) |
| 30 to 34 Minutes | 47 (6.9%) | 97 (25.8%) |
| 35 to 39 Minutes | 0 (0.0%) | 0 (0.0%) |
| 40 to 44 Minutes | 55 (8.1%) | 15 (4.0%) |
| 45 to 59 Minutes | 106 (15.6%) | 34 (9.0%) |
| 60 to 89 Minutes | 10 (1.5%) | 101 (26.9%) |
| 90 or more Minutes | 13 (1.9%) | 10 (2.7%) |
Time of Departure to Work by Sex in Willowbrook
The most frequent times of departure to work in Willowbrook are 6:30 AM to 6:59 AM (257, 37.8%) for males and 6:30 AM to 6:59 AM (81, 21.5%) for females.
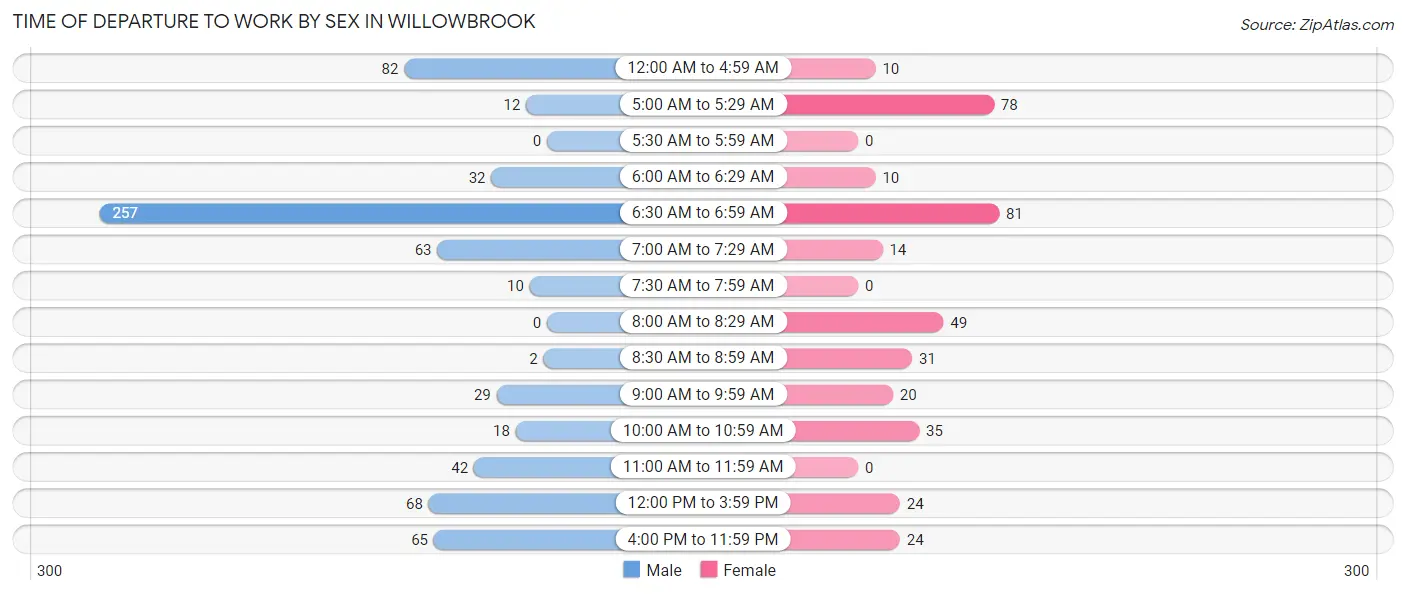
| Time of Departure | Male | Female |
| 12:00 AM to 4:59 AM | 82 (12.1%) | 10 (2.7%) |
| 5:00 AM to 5:29 AM | 12 (1.8%) | 78 (20.7%) |
| 5:30 AM to 5:59 AM | 0 (0.0%) | 0 (0.0%) |
| 6:00 AM to 6:29 AM | 32 (4.7%) | 10 (2.7%) |
| 6:30 AM to 6:59 AM | 257 (37.8%) | 81 (21.5%) |
| 7:00 AM to 7:29 AM | 63 (9.3%) | 14 (3.7%) |
| 7:30 AM to 7:59 AM | 10 (1.5%) | 0 (0.0%) |
| 8:00 AM to 8:29 AM | 0 (0.0%) | 49 (13.0%) |
| 8:30 AM to 8:59 AM | 2 (0.3%) | 31 (8.2%) |
| 9:00 AM to 9:59 AM | 29 (4.3%) | 20 (5.3%) |
| 10:00 AM to 10:59 AM | 18 (2.6%) | 35 (9.3%) |
| 11:00 AM to 11:59 AM | 42 (6.2%) | 0 (0.0%) |
| 12:00 PM to 3:59 PM | 68 (10.0%) | 24 (6.4%) |
| 4:00 PM to 11:59 PM | 65 (9.6%) | 24 (6.4%) |
| Total | 680 (100.0%) | 376 (100.0%) |
Housing Occupancy in Willowbrook
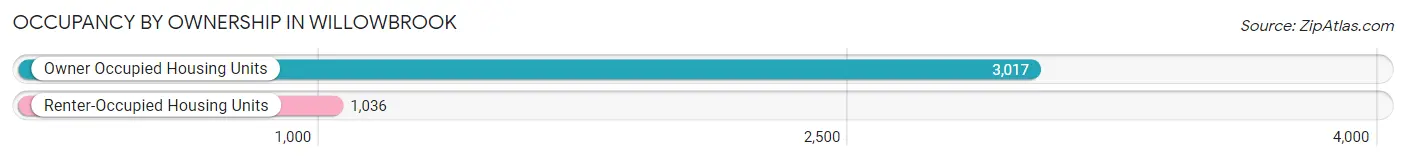
Occupancy by Ownership in Willowbrook
Of the total 4,053 dwellings in Willowbrook, owner-occupied units account for 3,017 (74.4%), while renter-occupied units make up 1,036 (25.6%).
| Occupancy | # Housing Units | % Housing Units |
| Owner Occupied Housing Units | 3,017 | 74.4% |
| Renter-Occupied Housing Units | 1,036 | 25.6% |
| Total Occupied Housing Units | 4,053 | 100.0% |
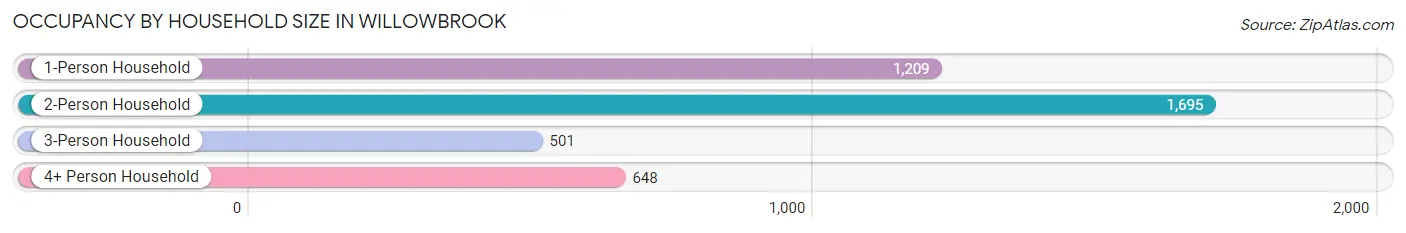
Occupancy by Household Size in Willowbrook
| Household Size | # Housing Units | % Housing Units |
| 1-Person Household | 1,209 | 29.8% |
| 2-Person Household | 1,695 | 41.8% |
| 3-Person Household | 501 | 12.4% |
| 4+ Person Household | 648 | 16.0% |
| Total Housing Units | 4,053 | 100.0% |
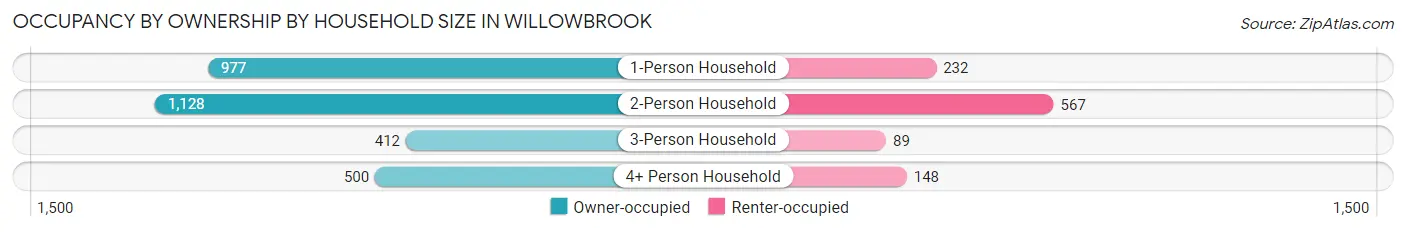
Occupancy by Ownership by Household Size in Willowbrook
| Household Size | Owner-occupied | Renter-occupied |
| 1-Person Household | 977 (80.8%) | 232 (19.2%) |
| 2-Person Household | 1,128 (66.5%) | 567 (33.5%) |
| 3-Person Household | 412 (82.2%) | 89 (17.8%) |
| 4+ Person Household | 500 (77.2%) | 148 (22.8%) |
| Total Housing Units | 3,017 (74.4%) | 1,036 (25.6%) |
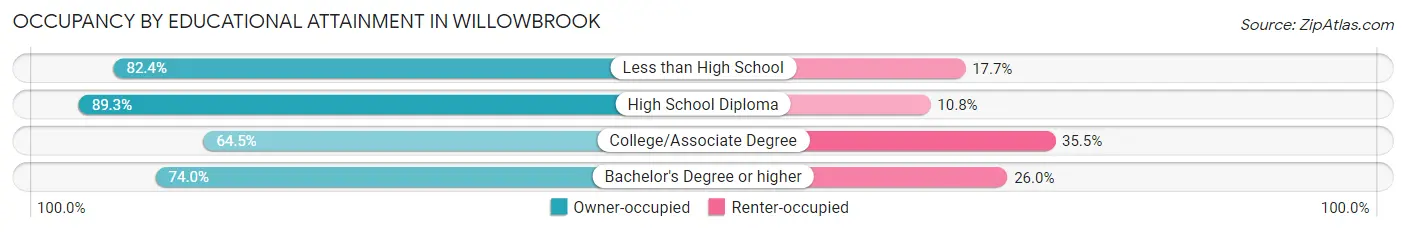
Occupancy by Educational Attainment in Willowbrook
| Household Size | Owner-occupied | Renter-occupied |
| Less than High School | 42 (82.4%) | 9 (17.6%) |
| High School Diploma | 606 (89.2%) | 73 (10.7%) |
| College/Associate Degree | 615 (64.5%) | 338 (35.5%) |
| Bachelor's Degree or higher | 1,754 (74.0%) | 616 (26.0%) |
Occupancy by Age of Householder in Willowbrook
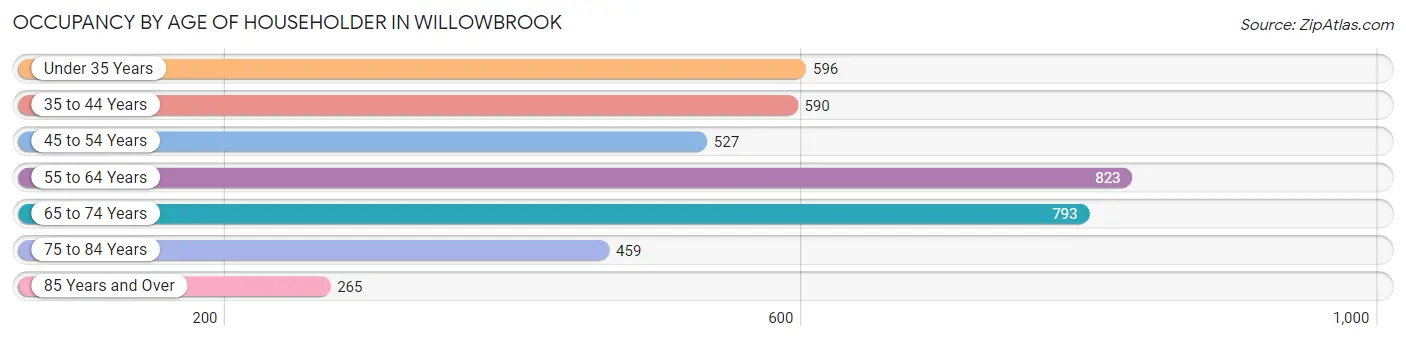
| Age Bracket | # Households | % Households |
| Under 35 Years | 596 | 14.7% |
| 35 to 44 Years | 590 | 14.6% |
| 45 to 54 Years | 527 | 13.0% |
| 55 to 64 Years | 823 | 20.3% |
| 65 to 74 Years | 793 | 19.6% |
| 75 to 84 Years | 459 | 11.3% |
| 85 Years and Over | 265 | 6.5% |
| Total | 4,053 | 100.0% |
Housing Finances in Willowbrook
Median Income by Occupancy in Willowbrook
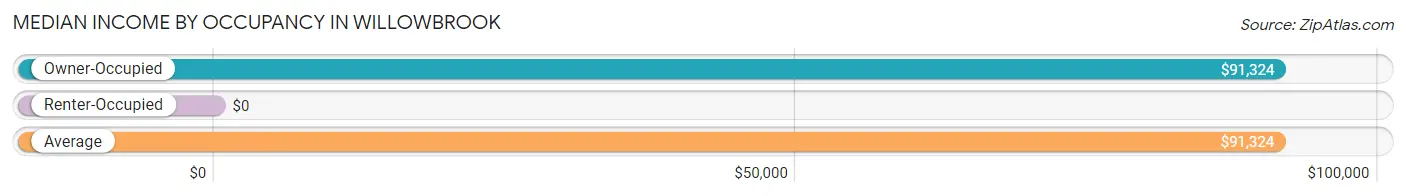
| Occupancy Type | # Households | Median Income |
| Owner-Occupied | 784 (100.0%) | $91,324 |
| Renter-Occupied | 0 (0.0%) | $0 |
| Average | 784 (100.0%) | $91,324 |
Occupancy by Householder Income Bracket in Willowbrook
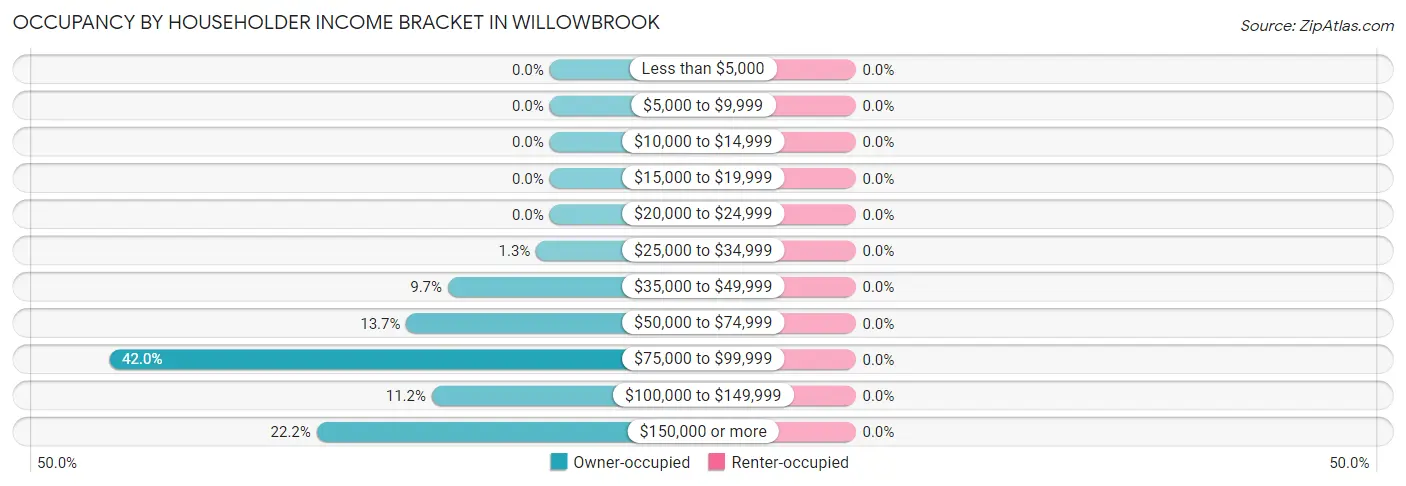
| Income Bracket | Owner-occupied | Renter-occupied |
| Less than $5,000 | 0 (0.0%) | 0 (0.0%) |
| $5,000 to $9,999 | 0 (0.0%) | 0 (0.0%) |
| $10,000 to $14,999 | 0 (0.0%) | 0 (0.0%) |
| $15,000 to $19,999 | 0 (0.0%) | 0 (0.0%) |
| $20,000 to $24,999 | 0 (0.0%) | 0 (0.0%) |
| $25,000 to $34,999 | 10 (1.3%) | 0 (0.0%) |
| $35,000 to $49,999 | 76 (9.7%) | 0 (0.0%) |
| $50,000 to $74,999 | 107 (13.7%) | 0 (0.0%) |
| $75,000 to $99,999 | 329 (42.0%) | 0 (0.0%) |
| $100,000 to $149,999 | 88 (11.2%) | 0 (0.0%) |
| $150,000 or more | 174 (22.2%) | 0 (0.0%) |
| Total | 784 (100.0%) | 0 (0.0%) |
Monthly Housing Cost Tiers in Willowbrook
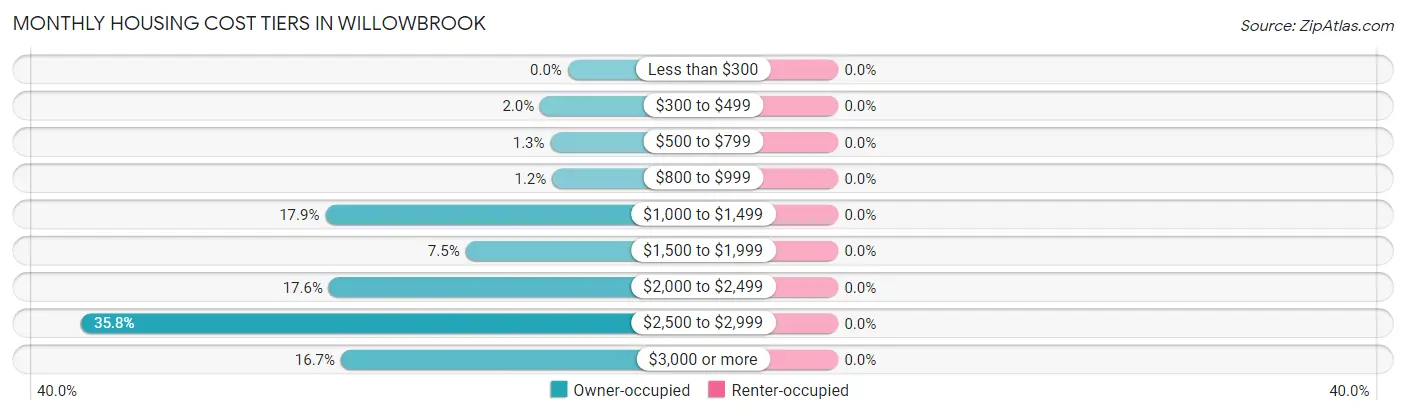
| Monthly Cost | Owner-occupied | Renter-occupied |
| Less than $300 | 0 (0.0%) | 0 (0.0%) |
| $300 to $499 | 16 (2.0%) | 0 (0.0%) |
| $500 to $799 | 10 (1.3%) | 0 (0.0%) |
| $800 to $999 | 9 (1.1%) | 0 (0.0%) |
| $1,000 to $1,499 | 140 (17.9%) | 0 (0.0%) |
| $1,500 to $1,999 | 59 (7.5%) | 0 (0.0%) |
| $2,000 to $2,499 | 138 (17.6%) | 0 (0.0%) |
| $2,500 to $2,999 | 281 (35.8%) | 0 (0.0%) |
| $3,000 or more | 131 (16.7%) | 0 (0.0%) |
| Total | 784 (100.0%) | 0 (0.0%) |
Physical Housing Characteristics in Willowbrook
Housing Structures in Willowbrook
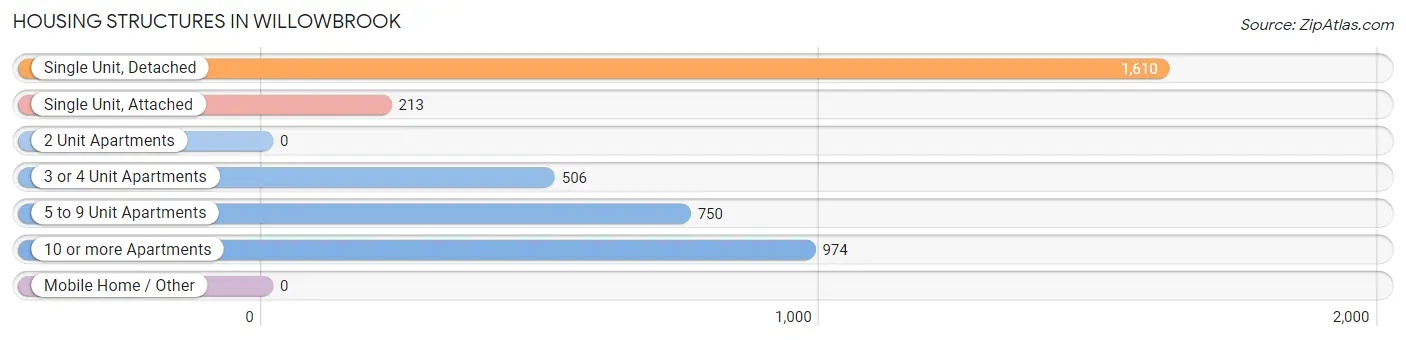
| Structure Type | # Housing Units | % Housing Units |
| Single Unit, Detached | 1,610 | 39.7% |
| Single Unit, Attached | 213 | 5.3% |
| 2 Unit Apartments | 0 | 0.0% |
| 3 or 4 Unit Apartments | 506 | 12.5% |
| 5 to 9 Unit Apartments | 750 | 18.5% |
| 10 or more Apartments | 974 | 24.0% |
| Mobile Home / Other | 0 | 0.0% |
| Total | 4,053 | 100.0% |
Housing Structures by Occupancy in Willowbrook
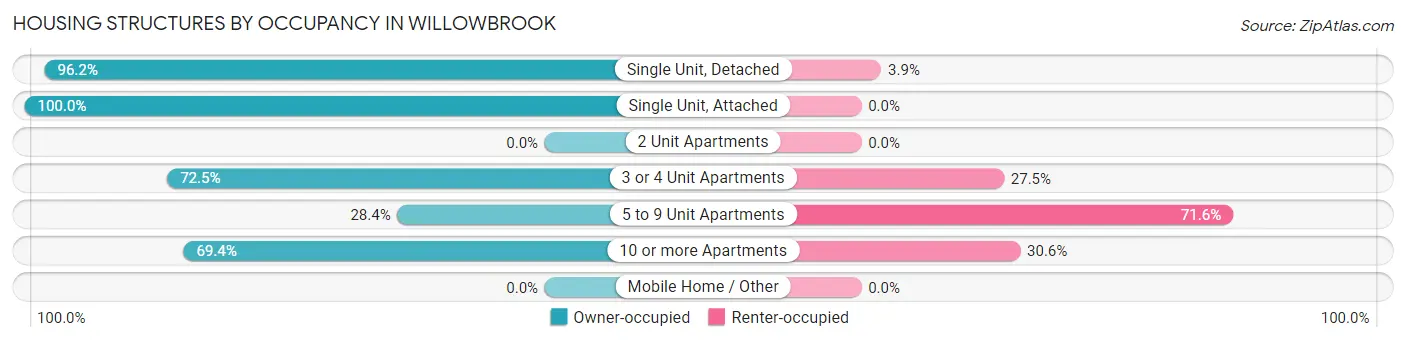
| Structure Type | Owner-occupied | Renter-occupied |
| Single Unit, Detached | 1,548 (96.2%) | 62 (3.8%) |
| Single Unit, Attached | 213 (100.0%) | 0 (0.0%) |
| 2 Unit Apartments | 0 (0.0%) | 0 (0.0%) |
| 3 or 4 Unit Apartments | 367 (72.5%) | 139 (27.5%) |
| 5 to 9 Unit Apartments | 213 (28.4%) | 537 (71.6%) |
| 10 or more Apartments | 676 (69.4%) | 298 (30.6%) |
| Mobile Home / Other | 0 (0.0%) | 0 (0.0%) |
| Total | 3,017 (74.4%) | 1,036 (25.6%) |
Housing Structures by Number of Rooms in Willowbrook
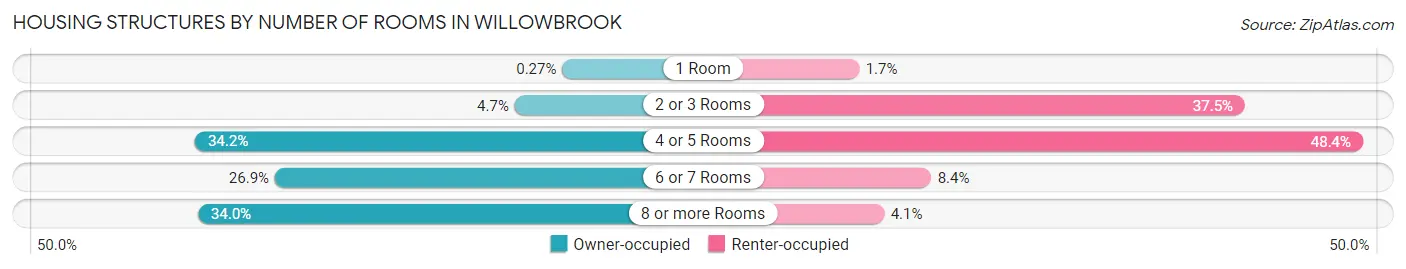
| Number of Rooms | Owner-occupied | Renter-occupied |
| 1 Room | 8 (0.3%) | 18 (1.7%) |
| 2 or 3 Rooms | 141 (4.7%) | 388 (37.4%) |
| 4 or 5 Rooms | 1,033 (34.2%) | 501 (48.4%) |
| 6 or 7 Rooms | 810 (26.9%) | 87 (8.4%) |
| 8 or more Rooms | 1,025 (34.0%) | 42 (4.1%) |
| Total | 3,017 (100.0%) | 1,036 (100.0%) |
Housing Structure by Heating Type in Willowbrook
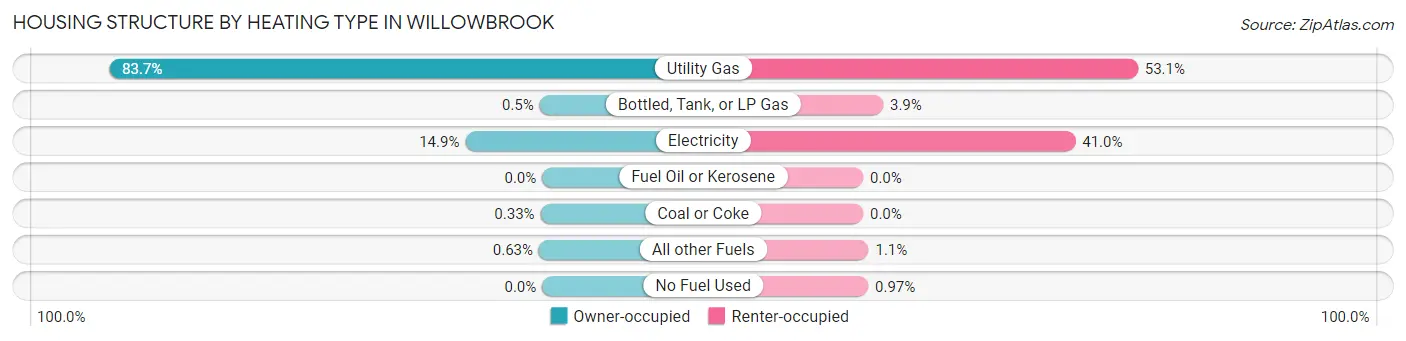
| Heating Type | Owner-occupied | Renter-occupied |
| Utility Gas | 2,525 (83.7%) | 550 (53.1%) |
| Bottled, Tank, or LP Gas | 15 (0.5%) | 40 (3.9%) |
| Electricity | 448 (14.8%) | 425 (41.0%) |
| Fuel Oil or Kerosene | 0 (0.0%) | 0 (0.0%) |
| Coal or Coke | 10 (0.3%) | 0 (0.0%) |
| All other Fuels | 19 (0.6%) | 11 (1.1%) |
| No Fuel Used | 0 (0.0%) | 10 (1.0%) |
| Total | 3,017 (100.0%) | 1,036 (100.0%) |
Household Vehicle Usage in Willowbrook
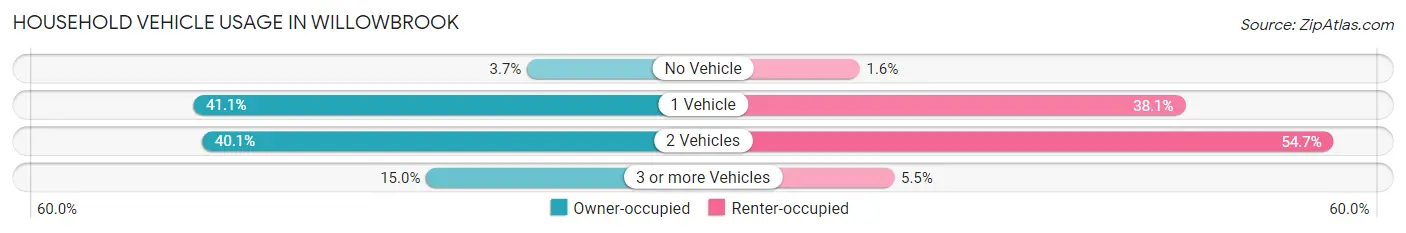
| Vehicles per Household | Owner-occupied | Renter-occupied |
| No Vehicle | 112 (3.7%) | 17 (1.6%) |
| 1 Vehicle | 1,241 (41.1%) | 395 (38.1%) |
| 2 Vehicles | 1,211 (40.1%) | 567 (54.7%) |
| 3 or more Vehicles | 453 (15.0%) | 57 (5.5%) |
| Total | 3,017 (100.0%) | 1,036 (100.0%) |
Real Estate & Mortgages in Willowbrook
Real Estate and Mortgage Overview in Willowbrook
| Characteristic | Without Mortgage | With Mortgage |
| Housing Units | 1,515 | 635 |
| Median Property Value | $337,200 | $276,700 |
| Median Household Income | $93,229 | $129 |
| Monthly Housing Costs | $876 | $131 |
| Real Estate Taxes | $3,867 | $0 |
Property Value by Mortgage Status in Willowbrook
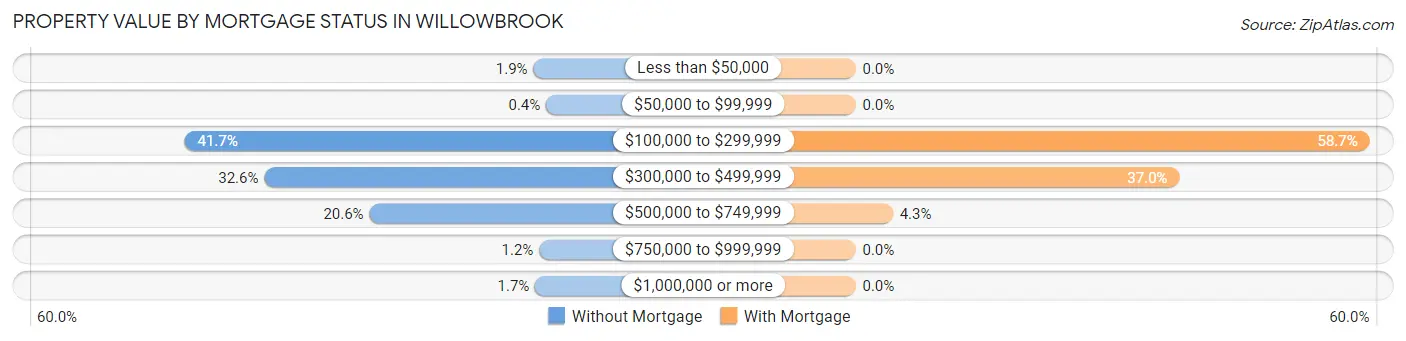
| Property Value | Without Mortgage | With Mortgage |
| Less than $50,000 | 28 (1.8%) | 0 (0.0%) |
| $50,000 to $99,999 | 6 (0.4%) | 0 (0.0%) |
| $100,000 to $299,999 | 632 (41.7%) | 373 (58.7%) |
| $300,000 to $499,999 | 494 (32.6%) | 235 (37.0%) |
| $500,000 to $749,999 | 312 (20.6%) | 27 (4.3%) |
| $750,000 to $999,999 | 18 (1.2%) | 0 (0.0%) |
| $1,000,000 or more | 25 (1.7%) | 0 (0.0%) |
| Total | 1,515 (100.0%) | 635 (100.0%) |
Household Income by Mortgage Status in Willowbrook
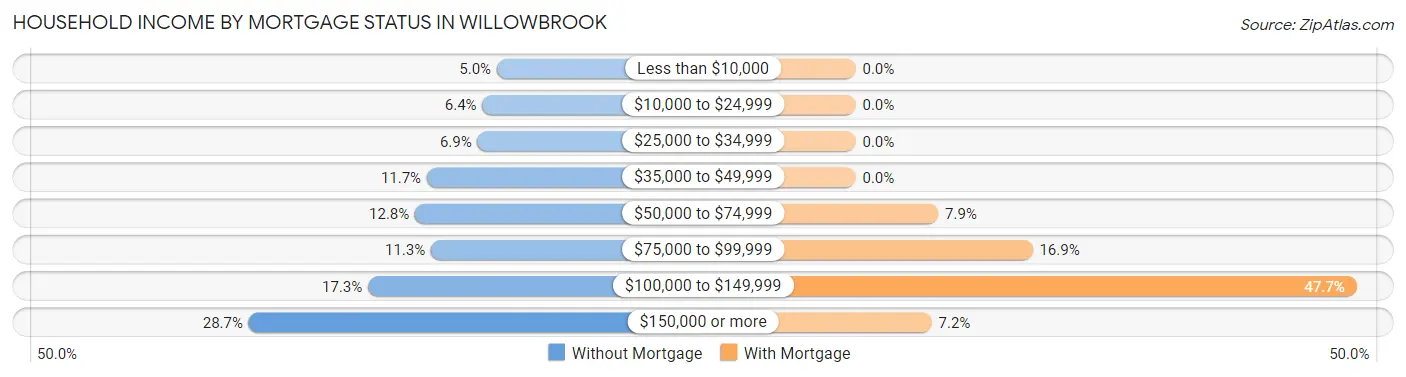
| Household Income | Without Mortgage | With Mortgage |
| Less than $10,000 | 76 (5.0%) | 0 (0.0%) |
| $10,000 to $24,999 | 97 (6.4%) | 0 (0.0%) |
| $25,000 to $34,999 | 104 (6.9%) | 0 (0.0%) |
| $35,000 to $49,999 | 177 (11.7%) | 0 (0.0%) |
| $50,000 to $74,999 | 194 (12.8%) | 50 (7.9%) |
| $75,000 to $99,999 | 171 (11.3%) | 107 (16.9%) |
| $100,000 to $149,999 | 262 (17.3%) | 303 (47.7%) |
| $150,000 or more | 434 (28.6%) | 46 (7.2%) |
| Total | 1,515 (100.0%) | 635 (100.0%) |
Property Value to Household Income Ratio in Willowbrook
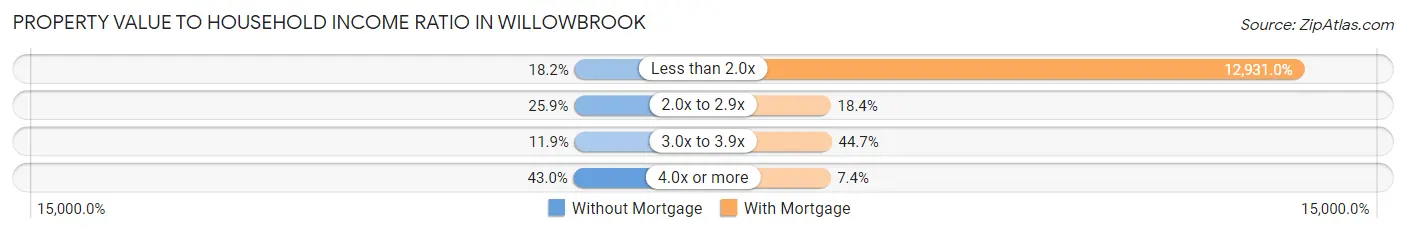
| Value-to-Income Ratio | Without Mortgage | With Mortgage |
| Less than 2.0x | 275 (18.1%) | 82,112 (12,931.0%) |
| 2.0x to 2.9x | 393 (25.9%) | 117 (18.4%) |
| 3.0x to 3.9x | 180 (11.9%) | 284 (44.7%) |
| 4.0x or more | 652 (43.0%) | 47 (7.4%) |
| Total | 1,515 (100.0%) | 635 (100.0%) |
Real Estate Taxes by Mortgage Status in Willowbrook
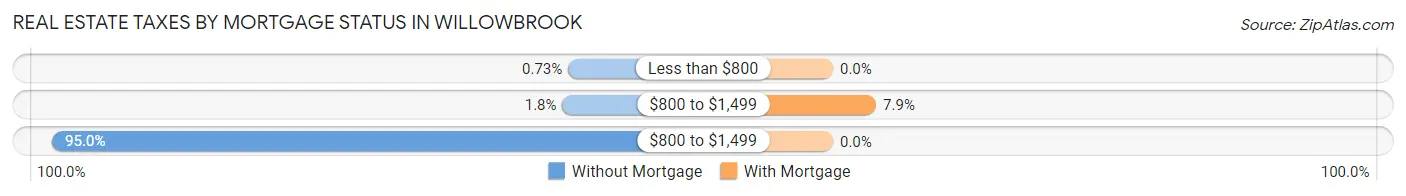
| Property Taxes | Without Mortgage | With Mortgage |
| Less than $800 | 11 (0.7%) | 0 (0.0%) |
| $800 to $1,499 | 27 (1.8%) | 50 (7.9%) |
| $800 to $1,499 | 1,439 (95.0%) | 0 (0.0%) |
| Total | 1,515 (100.0%) | 635 (100.0%) |
Health & Disability in Willowbrook
Health Insurance Coverage by Age in Willowbrook
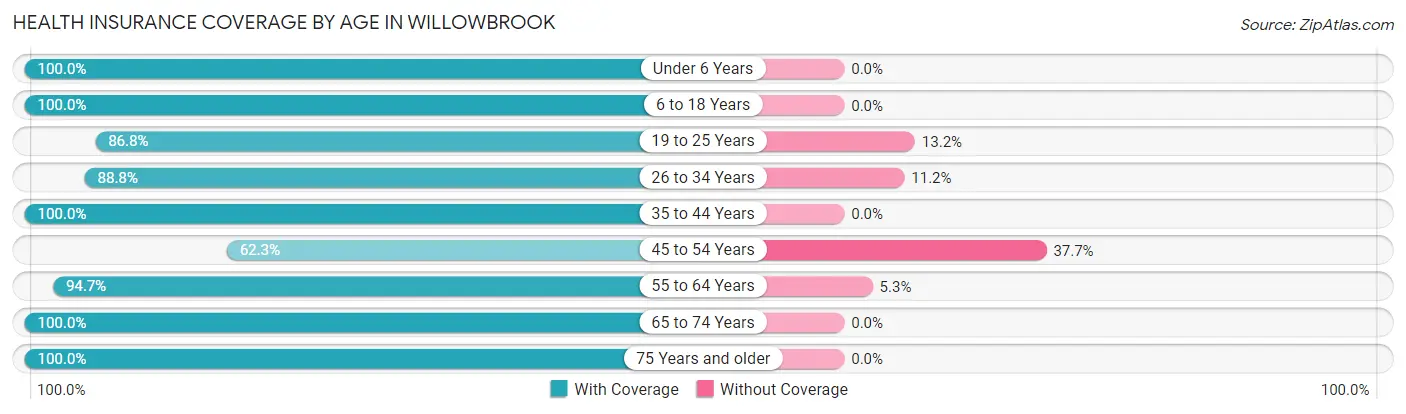
| Age Bracket | With Coverage | Without Coverage |
| Under 6 Years | 164 (100.0%) | 0 (0.0%) |
| 6 to 18 Years | 338 (100.0%) | 0 (0.0%) |
| 19 to 25 Years | 310 (86.8%) | 47 (13.2%) |
| 26 to 34 Years | 333 (88.8%) | 42 (11.2%) |
| 35 to 44 Years | 180 (100.0%) | 0 (0.0%) |
| 45 to 54 Years | 314 (62.3%) | 190 (37.7%) |
| 55 to 64 Years | 197 (94.7%) | 11 (5.3%) |
| 65 to 74 Years | 315 (100.0%) | 0 (0.0%) |
| 75 Years and older | 98 (100.0%) | 0 (0.0%) |
| Total | 2,249 (88.6%) | 290 (11.4%) |
Health Insurance Coverage by Citizenship Status in Willowbrook
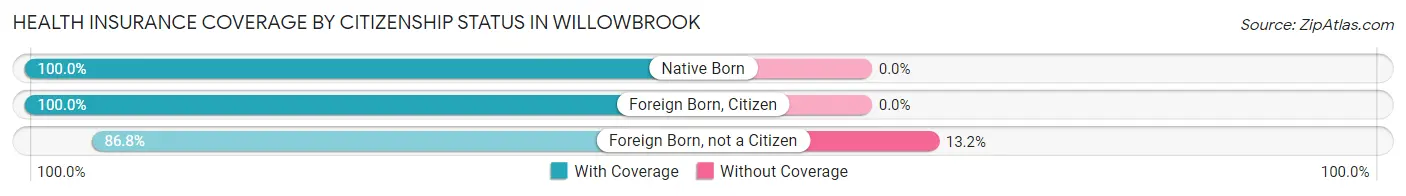
| Citizenship Status | With Coverage | Without Coverage |
| Native Born | 164 (100.0%) | 0 (0.0%) |
| Foreign Born, Citizen | 338 (100.0%) | 0 (0.0%) |
| Foreign Born, not a Citizen | 310 (86.8%) | 47 (13.2%) |
Health Insurance Coverage by Household Income in Willowbrook
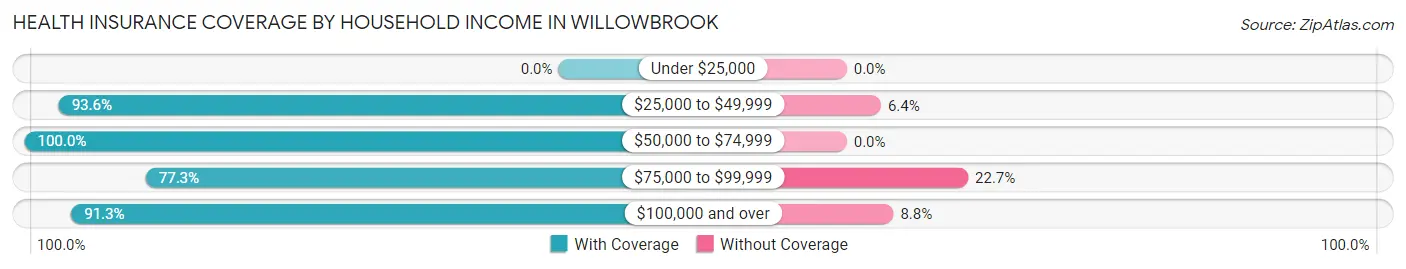
| Household Income | With Coverage | Without Coverage |
| Under $25,000 | 0 (0.0%) | 0 (0.0%) |
| $25,000 to $49,999 | 161 (93.6%) | 11 (6.4%) |
| $50,000 to $74,999 | 503 (100.0%) | 0 (0.0%) |
| $75,000 to $99,999 | 646 (77.3%) | 190 (22.7%) |
| $100,000 and over | 928 (91.2%) | 89 (8.7%) |
Public vs Private Health Insurance Coverage by Age in Willowbrook
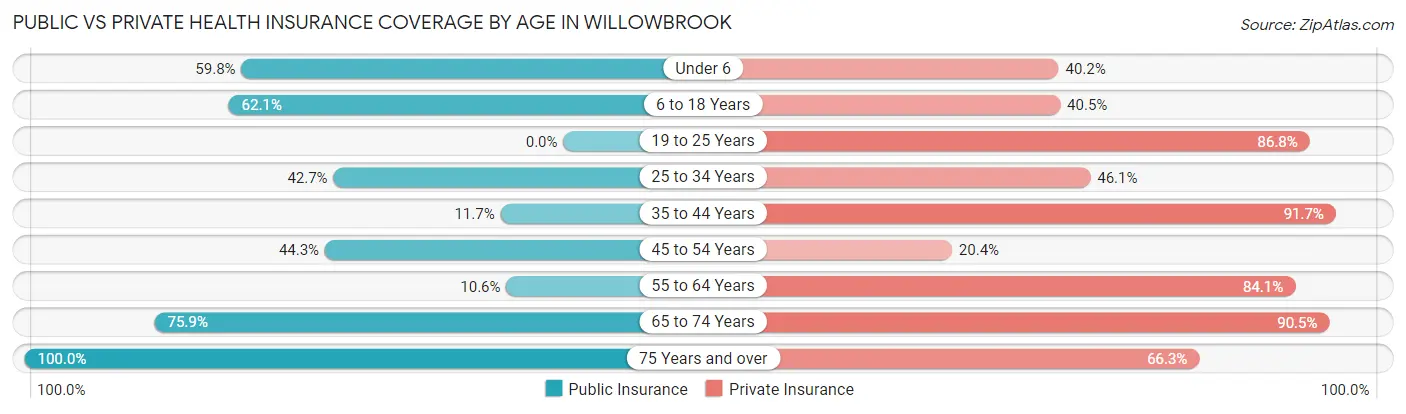
| Age Bracket | Public Insurance | Private Insurance |
| Under 6 | 98 (59.8%) | 66 (40.2%) |
| 6 to 18 Years | 210 (62.1%) | 137 (40.5%) |
| 19 to 25 Years | 0 (0.0%) | 310 (86.8%) |
| 25 to 34 Years | 160 (42.7%) | 173 (46.1%) |
| 35 to 44 Years | 21 (11.7%) | 165 (91.7%) |
| 45 to 54 Years | 223 (44.3%) | 103 (20.4%) |
| 55 to 64 Years | 22 (10.6%) | 175 (84.1%) |
| 65 to 74 Years | 239 (75.9%) | 285 (90.5%) |
| 75 Years and over | 98 (100.0%) | 65 (66.3%) |
| Total | 1,071 (42.2%) | 1,479 (58.3%) |
Disability Status by Sex by Age in Willowbrook
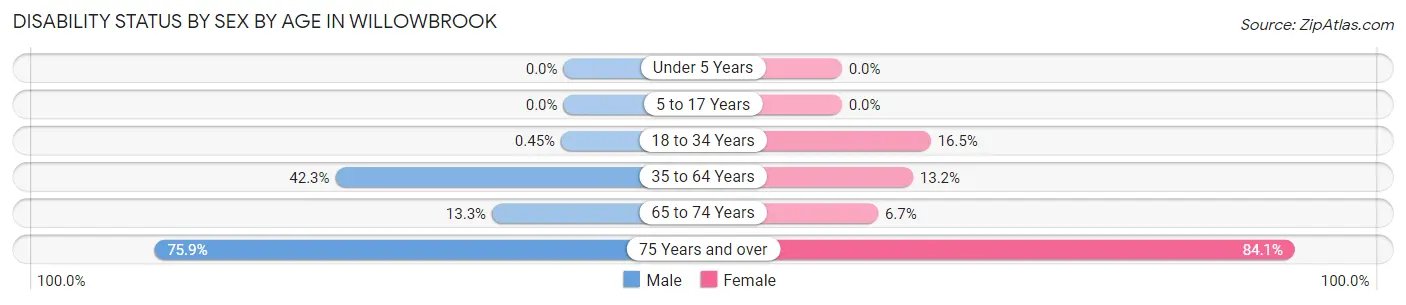
| Age Bracket | Male | Female |
| Under 5 Years | 0 (0.0%) | 0 (0.0%) |
| 5 to 17 Years | 0 (0.0%) | 0 (0.0%) |
| 18 to 34 Years | 2 (0.4%) | 51 (16.5%) |
| 35 to 64 Years | 201 (42.3%) | 55 (13.2%) |
| 65 to 74 Years | 24 (13.3%) | 9 (6.7%) |
| 75 Years and over | 41 (75.9%) | 37 (84.1%) |
Disability Class by Sex by Age in Willowbrook
Disability Class: Hearing Difficulty
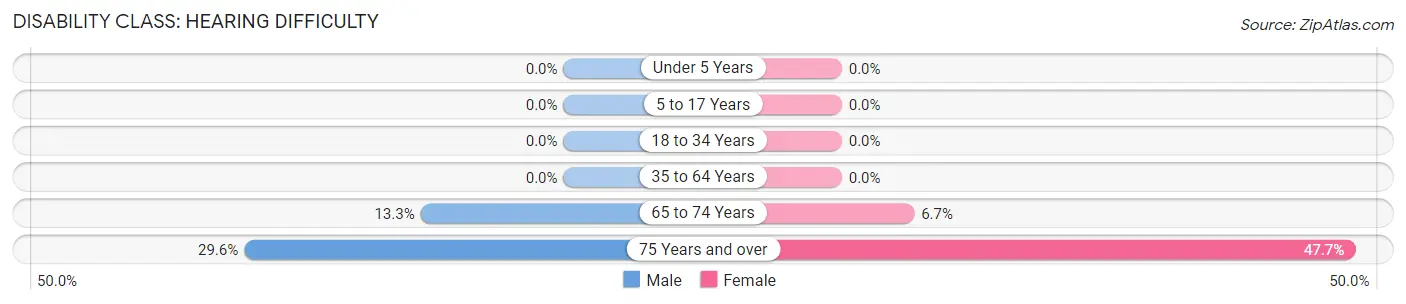
| Age Bracket | Male | Female |
| Under 5 Years | 0 (0.0%) | 0 (0.0%) |
| 5 to 17 Years | 0 (0.0%) | 0 (0.0%) |
| 18 to 34 Years | 0 (0.0%) | 0 (0.0%) |
| 35 to 64 Years | 0 (0.0%) | 0 (0.0%) |
| 65 to 74 Years | 24 (13.3%) | 9 (6.7%) |
| 75 Years and over | 16 (29.6%) | 21 (47.7%) |
Disability Class: Vision Difficulty
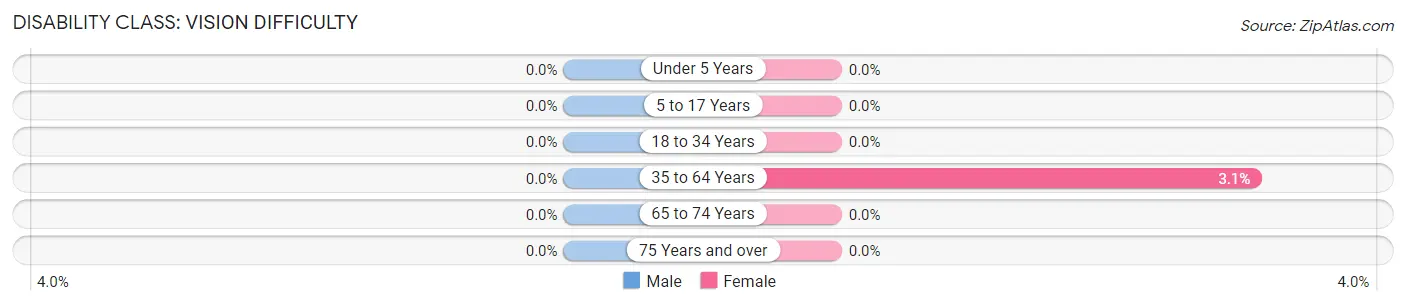
| Age Bracket | Male | Female |
| Under 5 Years | 0 (0.0%) | 0 (0.0%) |
| 5 to 17 Years | 0 (0.0%) | 0 (0.0%) |
| 18 to 34 Years | 0 (0.0%) | 0 (0.0%) |
| 35 to 64 Years | 0 (0.0%) | 13 (3.1%) |
| 65 to 74 Years | 0 (0.0%) | 0 (0.0%) |
| 75 Years and over | 0 (0.0%) | 0 (0.0%) |
Disability Class: Cognitive Difficulty
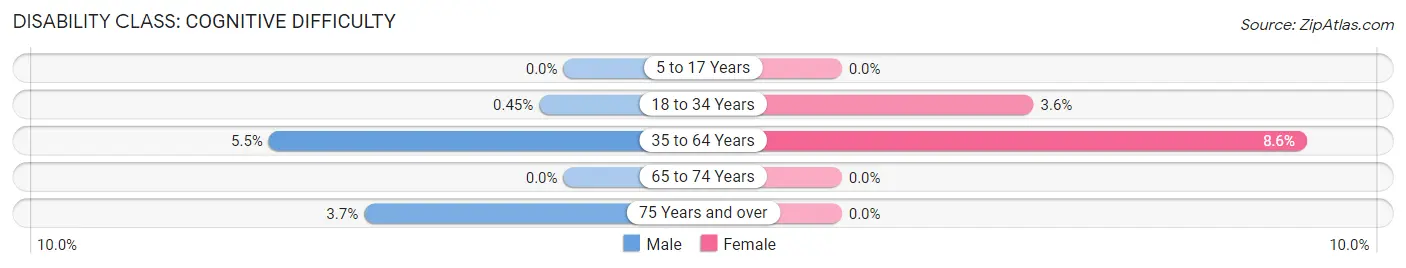
| Age Bracket | Male | Female |
| 5 to 17 Years | 0 (0.0%) | 0 (0.0%) |
| 18 to 34 Years | 2 (0.4%) | 11 (3.6%) |
| 35 to 64 Years | 26 (5.5%) | 36 (8.6%) |
| 65 to 74 Years | 0 (0.0%) | 0 (0.0%) |
| 75 Years and over | 2 (3.7%) | 0 (0.0%) |
Disability Class: Ambulatory Difficulty
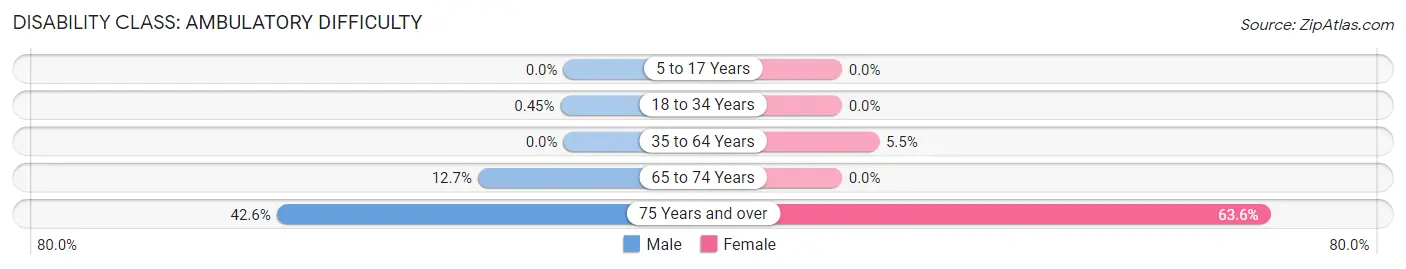
| Age Bracket | Male | Female |
| 5 to 17 Years | 0 (0.0%) | 0 (0.0%) |
| 18 to 34 Years | 2 (0.4%) | 0 (0.0%) |
| 35 to 64 Years | 0 (0.0%) | 23 (5.5%) |
| 65 to 74 Years | 23 (12.7%) | 0 (0.0%) |
| 75 Years and over | 23 (42.6%) | 28 (63.6%) |
Disability Class: Self-Care Difficulty
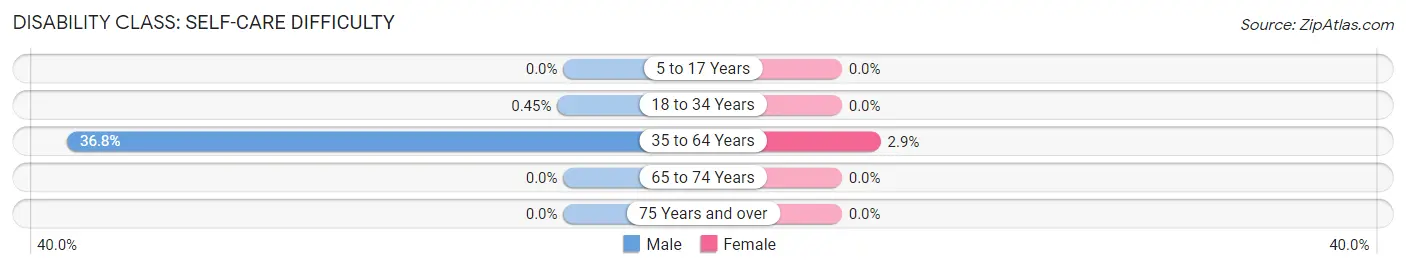
| Age Bracket | Male | Female |
| 5 to 17 Years | 0 (0.0%) | 0 (0.0%) |
| 18 to 34 Years | 2 (0.4%) | 0 (0.0%) |
| 35 to 64 Years | 175 (36.8%) | 12 (2.9%) |
| 65 to 74 Years | 0 (0.0%) | 0 (0.0%) |
| 75 Years and over | 0 (0.0%) | 0 (0.0%) |
Technology Access in Willowbrook
Computing Device Access in Willowbrook
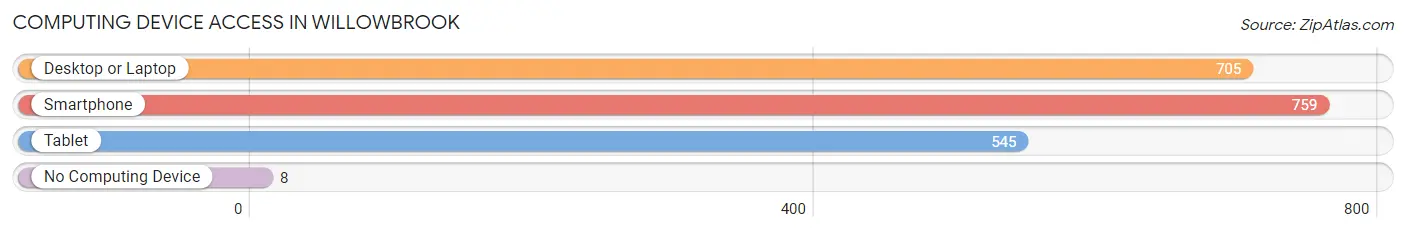
| Device Type | # Households | % Households |
| Desktop or Laptop | 705 | 89.9% |
| Smartphone | 759 | 96.8% |
| Tablet | 545 | 69.5% |
| No Computing Device | 8 | 1.0% |
| Total | 784 | 100.0% |
Internet Access in Willowbrook
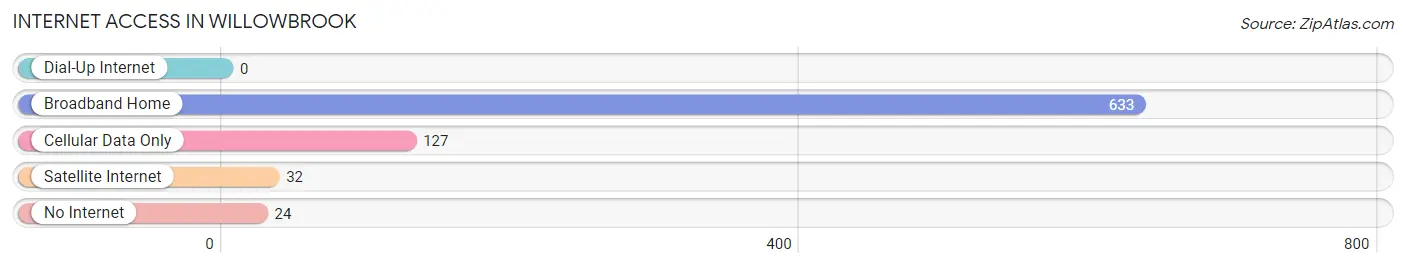
| Internet Type | # Households | % Households |
| Dial-Up Internet | 0 | 0.0% |
| Broadband Home | 633 | 80.7% |
| Cellular Data Only | 127 | 16.2% |
| Satellite Internet | 32 | 4.1% |
| No Internet | 24 | 3.1% |
| Total | 784 | 100.0% |
Willowbrook Summary
Willowbrook, Illinois is a small village located in DuPage County, approximately 25 miles west of Chicago. The village was incorporated in 1960 and has a population of approximately 8,000 people. The village is known for its small-town charm and is home to a variety of businesses, parks, and recreational activities.
History
The area that is now Willowbrook was first settled in the early 1800s by German immigrants. The village was originally known as “Hainesville” and was part of the larger unincorporated area of Hinsdale. In the late 1800s, the area was renamed “Willowbrook” after the willow trees that grew along the banks of the nearby Salt Creek.
In the early 1900s, the village began to grow and develop. The first post office was established in 1910 and the first school was built in 1912. The village was officially incorporated in 1960 and the population has grown steadily since then.
Geography
Willowbrook is located in DuPage County, approximately 25 miles west of Chicago. The village is bordered by the villages of Burr Ridge, Hinsdale, and Darien. The village is situated on the banks of the Salt Creek and is surrounded by rolling hills and wooded areas.
The village covers an area of approximately 3.5 square miles and has a population density of 2,400 people per square mile. The village is located at an elevation of 690 feet above sea level.
Economy
Willowbrook is home to a variety of businesses and industries. The village is home to several corporate headquarters, including the headquarters of the American Academy of Pediatrics and the American College of Surgeons. The village is also home to a variety of retail stores, restaurants, and other businesses.
The village is served by two major highways, Interstate 55 and Interstate 294. The village is also served by the Metra commuter rail line, which provides access to downtown Chicago.
Demographics
As of the 2010 census, the population of Willowbrook was 8,000 people. The racial makeup of the village was 87.3% White, 4.2% African American, 0.3% Native American, 4.2% Asian, and 4.0% from other races. Hispanic or Latino of any race were 8.2% of the population.
The median household income in Willowbrook was $90,000, and the median family income was $103,000. The per capita income was $41,000. About 4.2% of families and 5.2% of the population were below the poverty line.
Willowbrook is a small village with a rich history and a vibrant economy. The village is home to a variety of businesses, parks, and recreational activities. The village is served by two major highways and the Metra commuter rail line, providing access to downtown Chicago. The village has a diverse population and a median household income of $90,000.
Common Questions
What is Per Capita Income in Willowbrook?
Per Capita income in Willowbrook is $35,418.
What is the Median Family Income in Willowbrook?
Median Family Income in Willowbrook is $93,084.
What is the Median Household income in Willowbrook?
Median Household Income in Willowbrook is $91,324.
What is Income or Wage Gap in Willowbrook?
Income or Wage Gap in Willowbrook is 27.0%.
Women in Willowbrook earn 73.0 cents for every dollar earned by a man.
What is Inequality or Gini Index in Willowbrook?
Inequality or Gini Index in Willowbrook is 0.30.
What is the Total Population of Willowbrook?
Total Population of Willowbrook is 2,539.
What is the Total Male Population of Willowbrook?
Total Male Population of Willowbrook is 1,309.
What is the Total Female Population of Willowbrook?
Total Female Population of Willowbrook is 1,230.
What is the Ratio of Males per 100 Females in Willowbrook?
There are 106.42 Males per 100 Females in Willowbrook.
What is the Ratio of Females per 100 Males in Willowbrook?
There are 93.96 Females per 100 Males in Willowbrook.
What is the Median Population Age in Willowbrook?
Median Population Age in Willowbrook is 36.7 Years.
What is the Average Family Size in Willowbrook
Average Family Size in Willowbrook is 3.5 People.
What is the Average Household Size in Willowbrook
Average Household Size in Willowbrook is 3.2 People.
How Large is the Labor Force in Willowbrook?
There are 1,354 People in the Labor Forcein in Willowbrook.
What is the Percentage of People in the Labor Force in Willowbrook?
63.8% of People are in the Labor Force in Willowbrook.
What is the Unemployment Rate in Willowbrook?
Unemployment Rate in Willowbrook is 3.2%.