Zip Codes with the Highest Percentage of Population Employed in Real Estate, Rental & Leasing in Peoria, IL
RELATED REPORTS & OPTIONS
Real Estate, Rental & Leasing
Peoria
Compare Zip Codes
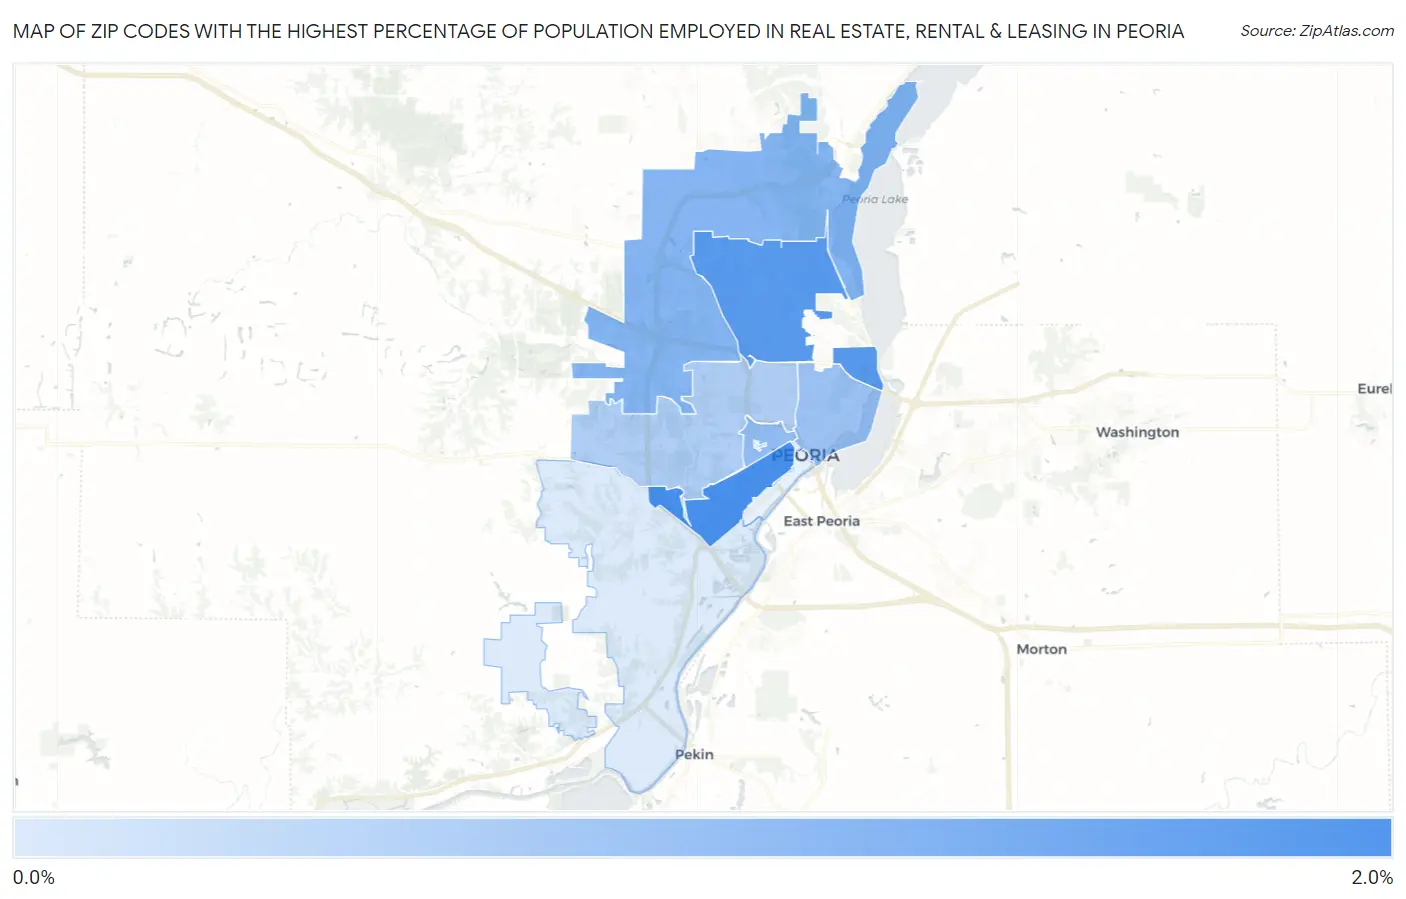
Map of Zip Codes with the Highest Percentage of Population Employed in Real Estate, Rental & Leasing in Peoria
0.79%
1.6%
Zip Codes with the Highest Percentage of Population Employed in Real Estate, Rental & Leasing in Peoria, IL
| Zip Code | % Employed | vs State | vs National | |
| 1. | 61605 | 1.6% | 1.7%(-0.120)#324 | 1.9%(-0.306)#10,546 |
| 2. | 61614 | 1.5% | 1.7%(-0.206)#349 | 1.9%(-0.393)#11,164 |
| 3. | 61615 | 1.3% | 1.7%(-0.448)#431 | 1.9%(-0.635)#13,040 |
| 4. | 61606 | 1.2% | 1.7%(-0.518)#455 | 1.9%(-0.704)#13,587 |
| 5. | 61603 | 1.1% | 1.7%(-0.575)#479 | 1.9%(-0.762)#14,034 |
| 6. | 61604 | 1.0% | 1.7%(-0.675)#515 | 1.9%(-0.861)#14,896 |
| 7. | 61607 | 0.79% | 1.7%(-0.919)#613 | 1.9%(-1.11)#16,812 |
1
Common Questions
What are the Top 5 Zip Codes with the Highest Percentage of Population Employed in Real Estate, Rental & Leasing in Peoria, IL?
Top 5 Zip Codes with the Highest Percentage of Population Employed in Real Estate, Rental & Leasing in Peoria, IL are:
What zip code has the Highest Percentage of Population Employed in Real Estate, Rental & Leasing in Peoria, IL?
61605 has the Highest Percentage of Population Employed in Real Estate, Rental & Leasing in Peoria, IL with 1.6%.
What is the Percentage of Population Employed in Real Estate, Rental & Leasing in Peoria, IL?
Percentage of Population Employed in Real Estate, Rental & Leasing in Peoria is 1.1%.
What is the Percentage of Population Employed in Real Estate, Rental & Leasing in Illinois?
Percentage of Population Employed in Real Estate, Rental & Leasing in Illinois is 1.7%.
What is the Percentage of Population Employed in Real Estate, Rental & Leasing in the United States?
Percentage of Population Employed in Real Estate, Rental & Leasing in the United States is 1.9%.