Apple Canyon Lake, IL Map & Demographics
Apple Canyon Lake Map
Apple Canyon Lake Overview
$48,858
PER CAPITA INCOME
$107,878
AVG FAMILY INCOME
$98,214
AVG HOUSEHOLD INCOME
62.6%
WAGE / INCOME GAP [ % ]
37.4¢/ $1
WAGE / INCOME GAP [ $ ]
0.38
INEQUALITY / GINI INDEX
704
TOTAL POPULATION
296
MALE POPULATION
408
FEMALE POPULATION
72.55
MALES / 100 FEMALES
137.84
FEMALES / 100 MALES
59.1
MEDIAN AGE
2.4
AVG FAMILY SIZE
2.1
AVG HOUSEHOLD SIZE
229
LABOR FORCE [ PEOPLE ]
35.3%
PERCENT IN LABOR FORCE
Income in Apple Canyon Lake
Income Overview in Apple Canyon Lake
Per Capita Income in Apple Canyon Lake is $48,858, while median incomes of families and households are $107,878 and $98,214 respectively.
| Characteristic | Number | Measure |
| Per Capita Income | 704 | $48,858 |
| Median Family Income | 247 | $107,878 |
| Mean Family Income | 247 | $104,280 |
| Median Household Income | 336 | $98,214 |
| Mean Household Income | 336 | $97,847 |
| Income Deficit | 247 | $0 |
| Wage / Income Gap (%) | 704 | 62.63% |
| Wage / Income Gap ($) | 704 | 37.37¢ per $1 |
| Gini / Inequality Index | 704 | 0.38 |
Earnings by Sex in Apple Canyon Lake
Average Earnings in Apple Canyon Lake are $36,927, $83,625 for men and $31,250 for women, a difference of 62.6%.

| Sex | Number | Average Earnings |
| Male | 137 (49.8%) | $83,625 |
| Female | 138 (50.2%) | $31,250 |
| Total | 275 (100.0%) | $36,927 |
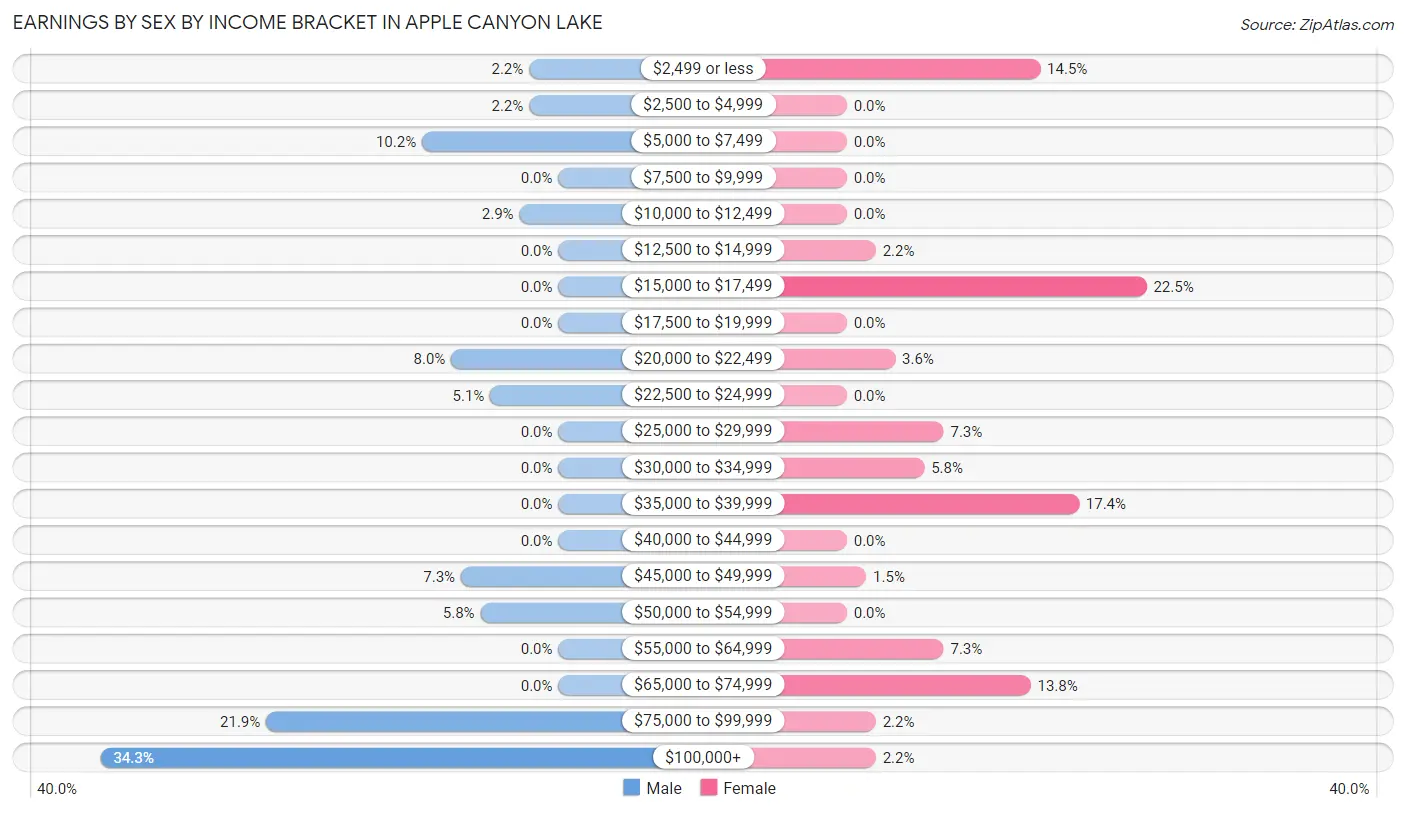
Earnings by Sex by Income Bracket in Apple Canyon Lake
The most common earnings brackets in Apple Canyon Lake are $100,000+ for men (47 | 34.3%) and $15,000 to $17,499 for women (31 | 22.5%).
| Income | Male | Female |
| $2,499 or less | 3 (2.2%) | 20 (14.5%) |
| $2,500 to $4,999 | 3 (2.2%) | 0 (0.0%) |
| $5,000 to $7,499 | 14 (10.2%) | 0 (0.0%) |
| $7,500 to $9,999 | 0 (0.0%) | 0 (0.0%) |
| $10,000 to $12,499 | 4 (2.9%) | 0 (0.0%) |
| $12,500 to $14,999 | 0 (0.0%) | 3 (2.2%) |
| $15,000 to $17,499 | 0 (0.0%) | 31 (22.5%) |
| $17,500 to $19,999 | 0 (0.0%) | 0 (0.0%) |
| $20,000 to $22,499 | 11 (8.0%) | 5 (3.6%) |
| $22,500 to $24,999 | 7 (5.1%) | 0 (0.0%) |
| $25,000 to $29,999 | 0 (0.0%) | 10 (7.2%) |
| $30,000 to $34,999 | 0 (0.0%) | 8 (5.8%) |
| $35,000 to $39,999 | 0 (0.0%) | 24 (17.4%) |
| $40,000 to $44,999 | 0 (0.0%) | 0 (0.0%) |
| $45,000 to $49,999 | 10 (7.3%) | 2 (1.5%) |
| $50,000 to $54,999 | 8 (5.8%) | 0 (0.0%) |
| $55,000 to $64,999 | 0 (0.0%) | 10 (7.2%) |
| $65,000 to $74,999 | 0 (0.0%) | 19 (13.8%) |
| $75,000 to $99,999 | 30 (21.9%) | 3 (2.2%) |
| $100,000+ | 47 (34.3%) | 3 (2.2%) |
| Total | 137 (100.0%) | 138 (100.0%) |
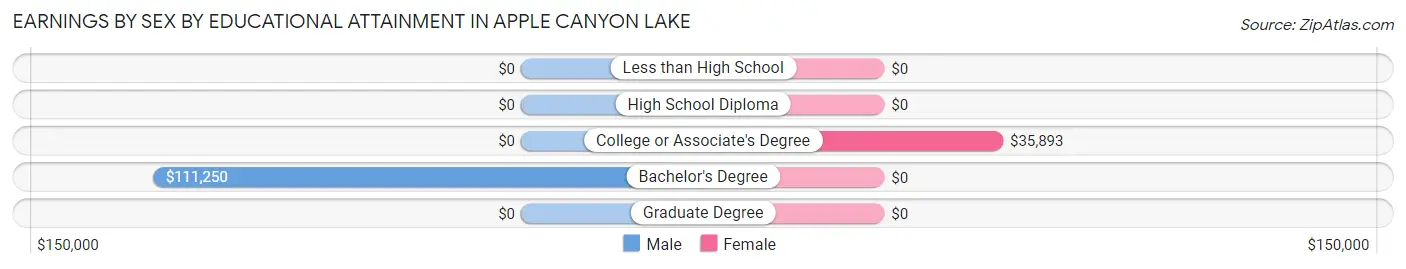
Earnings by Sex by Educational Attainment in Apple Canyon Lake
Average earnings in Apple Canyon Lake are $84,875 for men and $31,250 for women, a difference of 63.2%. Men with an educational attainment of bachelor's degree enjoy the highest average annual earnings of $111,250, while those with bachelor's degree education earn the least with $111,250. Women with an educational attainment of college or associate's degree earn the most with the average annual earnings of $35,893, while those with college or associate's degree education have the smallest earnings of $35,893.
| Educational Attainment | Male Income | Female Income |
| Less than High School | - | - |
| High School Diploma | - | - |
| College or Associate's Degree | - | - |
| Bachelor's Degree | $111,250 | $0 |
| Graduate Degree | - | - |
| Total | $84,875 | $31,250 |
Family Income in Apple Canyon Lake
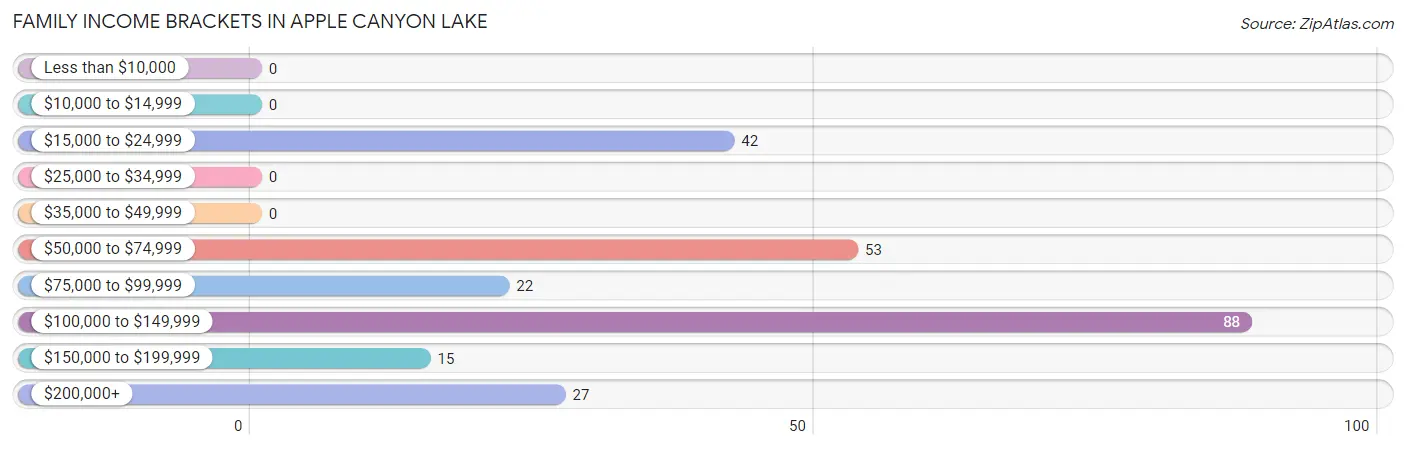
Family Income Brackets in Apple Canyon Lake
According to the Apple Canyon Lake family income data, there are 88 families falling into the $100,000 to $149,999 income range, which is the most common income bracket and makes up 35.6% of all families.
| Income Bracket | # Families | % Families |
| Less than $10,000 | 0 | 0.0% |
| $10,000 to $14,999 | 0 | 0.0% |
| $15,000 to $24,999 | 42 | 17.0% |
| $25,000 to $34,999 | 0 | 0.0% |
| $35,000 to $49,999 | 0 | 0.0% |
| $50,000 to $74,999 | 53 | 21.5% |
| $75,000 to $99,999 | 22 | 8.9% |
| $100,000 to $149,999 | 88 | 35.6% |
| $150,000 to $199,999 | 15 | 6.1% |
| $200,000+ | 27 | 10.9% |
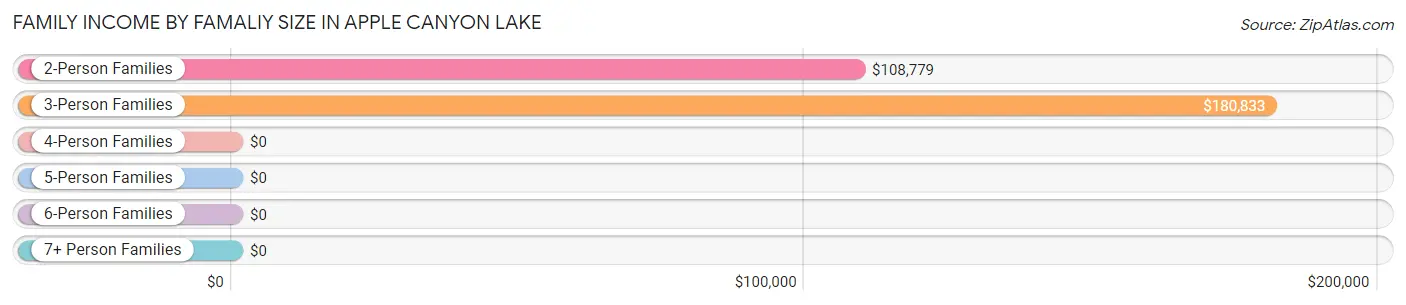
Family Income by Famaliy Size in Apple Canyon Lake
3-person families (16 | 6.5%) account for the highest median family income in Apple Canyon Lake with $180,833 per family, while 3-person families (16 | 6.5%) have the highest median income of $60,278 per family member.
| Income Bracket | # Families | Median Income |
| 2-Person Families | 188 (76.1%) | $108,779 |
| 3-Person Families | 16 (6.5%) | $180,833 |
| 4-Person Families | 43 (17.4%) | $0 |
| 5-Person Families | 0 (0.0%) | $0 |
| 6-Person Families | 0 (0.0%) | $0 |
| 7+ Person Families | 0 (0.0%) | $0 |
| Total | 247 (100.0%) | $107,878 |
Family Income by Number of Earners in Apple Canyon Lake
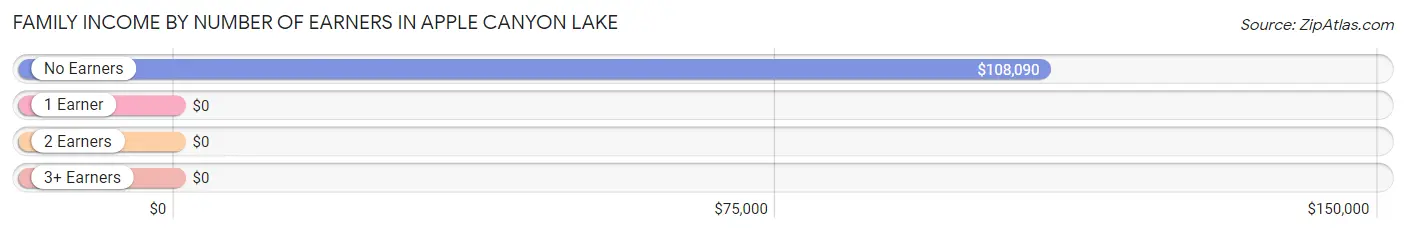
| Number of Earners | # Families | Median Income |
| No Earners | 97 (39.3%) | $108,090 |
| 1 Earner | 105 (42.5%) | $0 |
| 2 Earners | 41 (16.6%) | $0 |
| 3+ Earners | 4 (1.6%) | $0 |
| Total | 247 (100.0%) | $107,878 |
Household Income in Apple Canyon Lake
Household Income Brackets in Apple Canyon Lake
With 106 households falling in the category, the $100,000 to $149,999 income range is the most frequent in Apple Canyon Lake, accounting for 31.6% of all households.
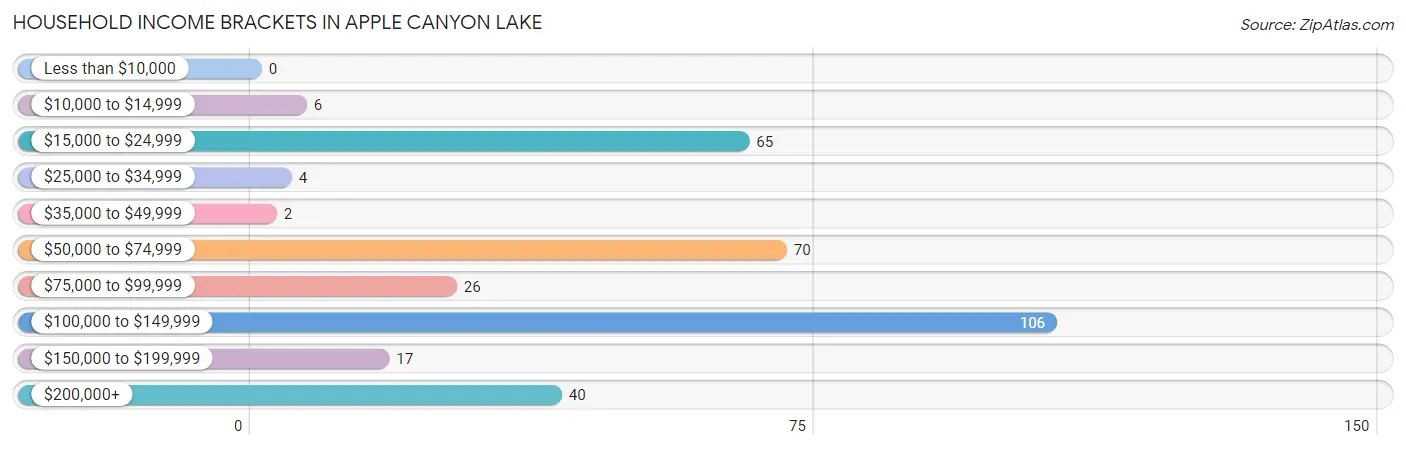
| Income Bracket | # Households | % Households |
| Less than $10,000 | 0 | 0.0% |
| $10,000 to $14,999 | 6 | 1.8% |
| $15,000 to $24,999 | 65 | 19.3% |
| $25,000 to $34,999 | 4 | 1.2% |
| $35,000 to $49,999 | 2 | 0.6% |
| $50,000 to $74,999 | 70 | 20.8% |
| $75,000 to $99,999 | 26 | 7.7% |
| $100,000 to $149,999 | 106 | 31.5% |
| $150,000 to $199,999 | 17 | 5.1% |
| $200,000+ | 40 | 11.9% |
Household Income by Householder Age in Apple Canyon Lake
The median household income in Apple Canyon Lake is $98,214, with the highest median household income of $108,993 found in the 45 to 64 years age bracket for the primary householder. A total of 131 households (39.0%) fall into this category.
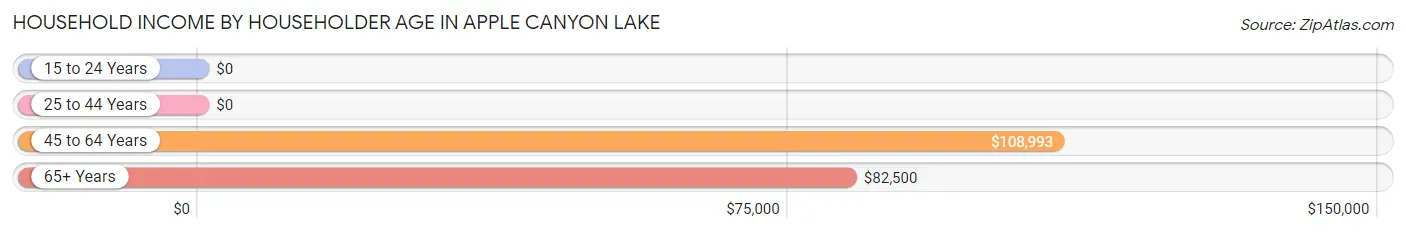
| Income Bracket | # Households | Median Income |
| 15 to 24 Years | 0 (0.0%) | $0 |
| 25 to 44 Years | 49 (14.6%) | $0 |
| 45 to 64 Years | 131 (39.0%) | $108,993 |
| 65+ Years | 156 (46.4%) | $82,500 |
| Total | 336 (100.0%) | $98,214 |
Poverty in Apple Canyon Lake
Income Below Poverty by Sex and Age in Apple Canyon Lake
With 11.8% poverty level for males and 24.3% for females among the residents of Apple Canyon Lake, 18 to 24 year old males and 16 and 17 year old females are the most vulnerable to poverty, with 26 males (72.2%) and 34 females (100.0%) in their respective age groups living below the poverty level.
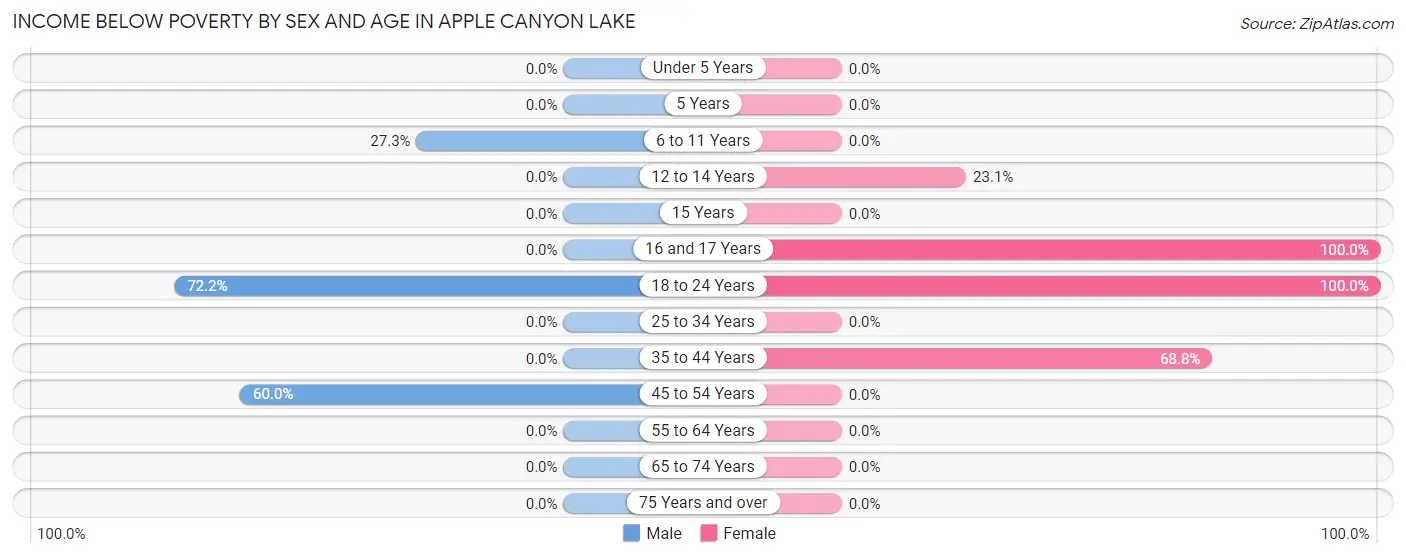
| Age Bracket | Male | Female |
| Under 5 Years | 0 (0.0%) | 0 (0.0%) |
| 5 Years | 0 (0.0%) | 0 (0.0%) |
| 6 to 11 Years | 3 (27.3%) | 0 (0.0%) |
| 12 to 14 Years | 0 (0.0%) | 6 (23.1%) |
| 15 Years | 0 (0.0%) | 0 (0.0%) |
| 16 and 17 Years | 0 (0.0%) | 34 (100.0%) |
| 18 to 24 Years | 26 (72.2%) | 26 (100.0%) |
| 25 to 34 Years | 0 (0.0%) | 0 (0.0%) |
| 35 to 44 Years | 0 (0.0%) | 33 (68.8%) |
| 45 to 54 Years | 6 (60.0%) | 0 (0.0%) |
| 55 to 64 Years | 0 (0.0%) | 0 (0.0%) |
| 65 to 74 Years | 0 (0.0%) | 0 (0.0%) |
| 75 Years and over | 0 (0.0%) | 0 (0.0%) |
| Total | 35 (11.8%) | 99 (24.3%) |
Income Above Poverty by Sex and Age in Apple Canyon Lake
According to the poverty statistics in Apple Canyon Lake, males aged under 5 years and females aged 6 to 11 years are the age groups that are most secure financially, with 100.0% of males and 100.0% of females in these age groups living above the poverty line.
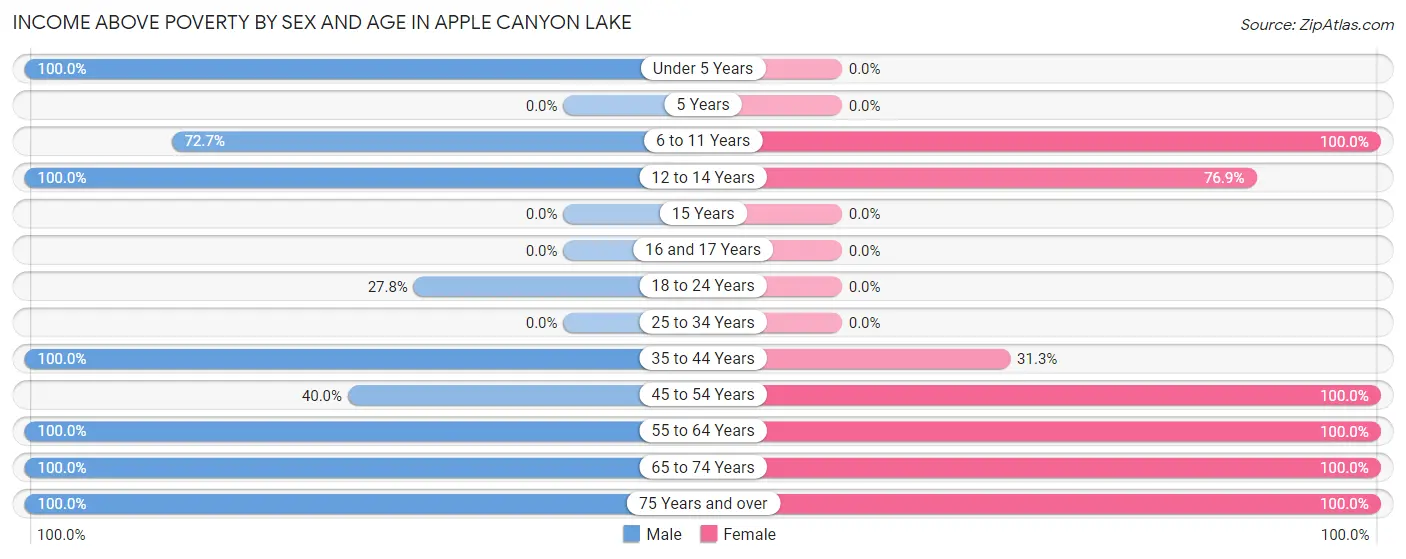
| Age Bracket | Male | Female |
| Under 5 Years | 4 (100.0%) | 0 (0.0%) |
| 5 Years | 0 (0.0%) | 0 (0.0%) |
| 6 to 11 Years | 8 (72.7%) | 6 (100.0%) |
| 12 to 14 Years | 9 (100.0%) | 20 (76.9%) |
| 15 Years | 0 (0.0%) | 0 (0.0%) |
| 16 and 17 Years | 0 (0.0%) | 0 (0.0%) |
| 18 to 24 Years | 10 (27.8%) | 0 (0.0%) |
| 25 to 34 Years | 0 (0.0%) | 0 (0.0%) |
| 35 to 44 Years | 22 (100.0%) | 15 (31.2%) |
| 45 to 54 Years | 4 (40.0%) | 83 (100.0%) |
| 55 to 64 Years | 70 (100.0%) | 60 (100.0%) |
| 65 to 74 Years | 61 (100.0%) | 57 (100.0%) |
| 75 Years and over | 73 (100.0%) | 68 (100.0%) |
| Total | 261 (88.2%) | 309 (75.7%) |
Income Below Poverty Among Married-Couple Families in Apple Canyon Lake
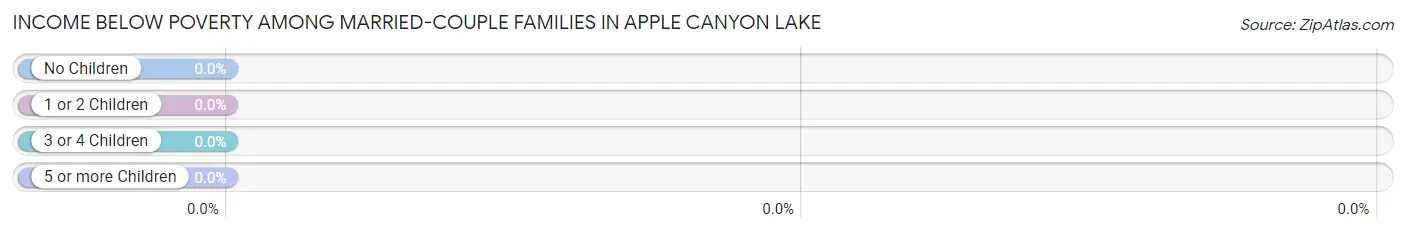
| Children | Above Poverty | Below Poverty |
| No Children | 151 (100.0%) | 0 (0.0%) |
| 1 or 2 Children | 18 (100.0%) | 0 (0.0%) |
| 3 or 4 Children | 0 (0.0%) | 0 (0.0%) |
| 5 or more Children | 0 (0.0%) | 0 (0.0%) |
| Total | 169 (100.0%) | 0 (0.0%) |
Income Below Poverty Among Single-Parent Households in Apple Canyon Lake
According to the poverty data in Apple Canyon Lake, 100.0% or 6 single-father households and 43.1% or 31 single-mother households are living below the poverty line. Among single-father households, those with 1 or 2 children have the highest poverty rate, with 6 households (100.0%) experiencing poverty. Likewise, among single-mother households, those with 1 or 2 children have the highest poverty rate, with 31 households (46.3%) falling below the poverty line.
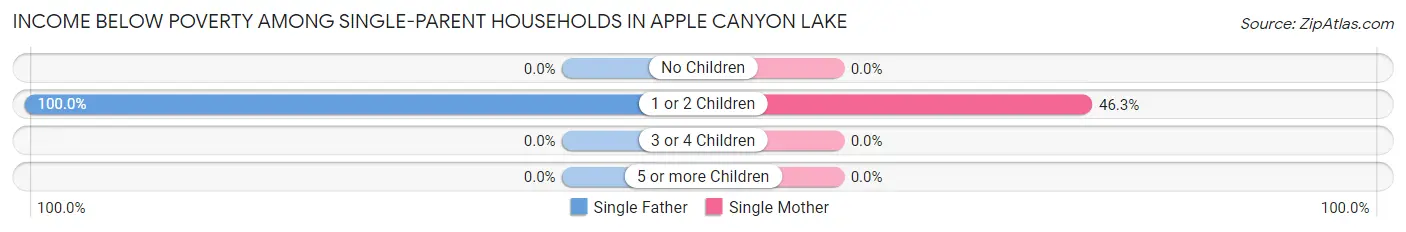
| Children | Single Father | Single Mother |
| No Children | 0 (0.0%) | 0 (0.0%) |
| 1 or 2 Children | 6 (100.0%) | 31 (46.3%) |
| 3 or 4 Children | 0 (0.0%) | 0 (0.0%) |
| 5 or more Children | 0 (0.0%) | 0 (0.0%) |
| Total | 6 (100.0%) | 31 (43.1%) |
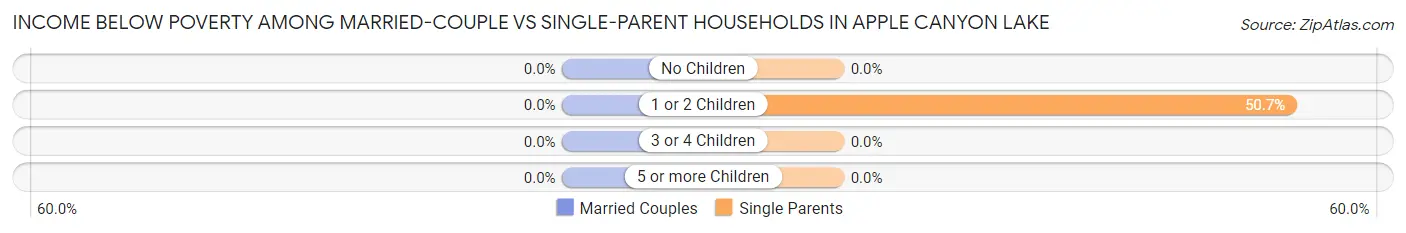
Income Below Poverty Among Married-Couple vs Single-Parent Households in Apple Canyon Lake
| Children | Married-Couple Families | Single-Parent Households |
| No Children | 0 (0.0%) | 0 (0.0%) |
| 1 or 2 Children | 0 (0.0%) | 37 (50.7%) |
| 3 or 4 Children | 0 (0.0%) | 0 (0.0%) |
| 5 or more Children | 0 (0.0%) | 0 (0.0%) |
| Total | 0 (0.0%) | 37 (47.4%) |
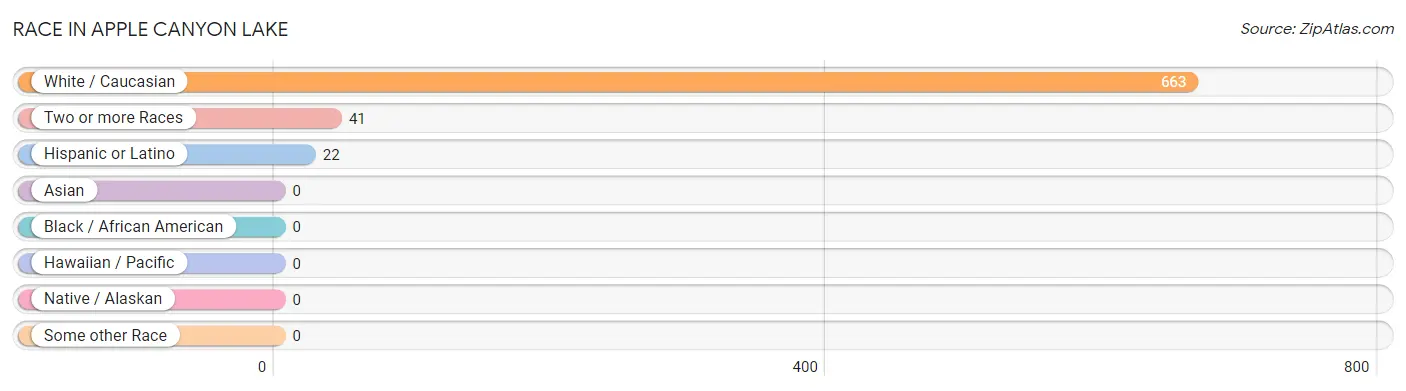
Race in Apple Canyon Lake
The most populous races in Apple Canyon Lake are White / Caucasian (663 | 94.2%), Two or more Races (41 | 5.8%), and Hispanic or Latino (22 | 3.1%).
| Race | # Population | % Population |
| Asian | 0 | 0.0% |
| Black / African American | 0 | 0.0% |
| Hawaiian / Pacific | 0 | 0.0% |
| Hispanic or Latino | 22 | 3.1% |
| Native / Alaskan | 0 | 0.0% |
| White / Caucasian | 663 | 94.2% |
| Two or more Races | 41 | 5.8% |
| Some other Race | 0 | 0.0% |
| Total | 704 | 100.0% |
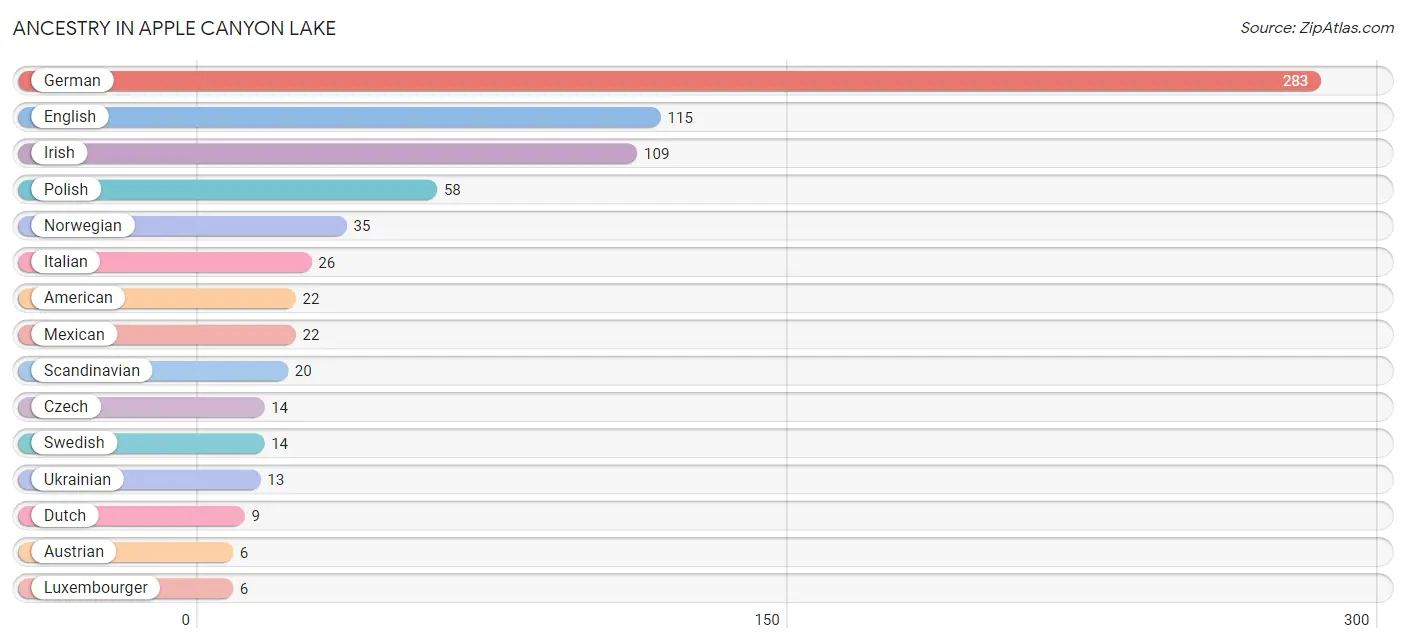
Ancestry in Apple Canyon Lake
The most populous ancestries reported in Apple Canyon Lake are German (283 | 40.2%), English (115 | 16.3%), Irish (109 | 15.5%), Polish (58 | 8.2%), and Norwegian (35 | 5.0%), together accounting for 85.2% of all Apple Canyon Lake residents.
| Ancestry | # Population | % Population |
| American | 22 | 3.1% |
| Arab | 2 | 0.3% |
| Austrian | 6 | 0.9% |
| Czech | 14 | 2.0% |
| Dutch | 9 | 1.3% |
| English | 115 | 16.3% |
| French | 5 | 0.7% |
| German | 283 | 40.2% |
| Irish | 109 | 15.5% |
| Italian | 26 | 3.7% |
| Lebanese | 2 | 0.3% |
| Luxembourger | 6 | 0.9% |
| Mexican | 22 | 3.1% |
| Norwegian | 35 | 5.0% |
| Polish | 58 | 8.2% |
| Scandinavian | 20 | 2.8% |
| Scottish | 2 | 0.3% |
| Swedish | 14 | 2.0% |
| Swiss | 6 | 0.9% |
| Ukrainian | 13 | 1.8% |
| Welsh | 2 | 0.3% | View All 21 Rows |
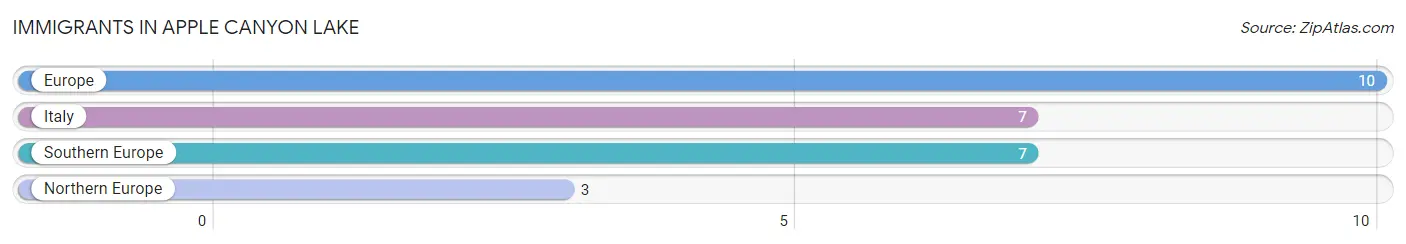
Immigrants in Apple Canyon Lake
The most numerous immigrant groups reported in Apple Canyon Lake came from Europe (10 | 1.4%), Italy (7 | 1.0%), Southern Europe (7 | 1.0%), and Northern Europe (3 | 0.4%), together accounting for 3.8% of all Apple Canyon Lake residents.
| Immigration Origin | # Population | % Population |
| Europe | 10 | 1.4% |
| Italy | 7 | 1.0% |
| Northern Europe | 3 | 0.4% |
| Southern Europe | 7 | 1.0% | View All 4 Rows |
Sex and Age in Apple Canyon Lake
Sex and Age in Apple Canyon Lake
The most populous age groups in Apple Canyon Lake are 60 to 64 Years (41 | 13.9%) for men and 50 to 54 Years (77 | 18.9%) for women.
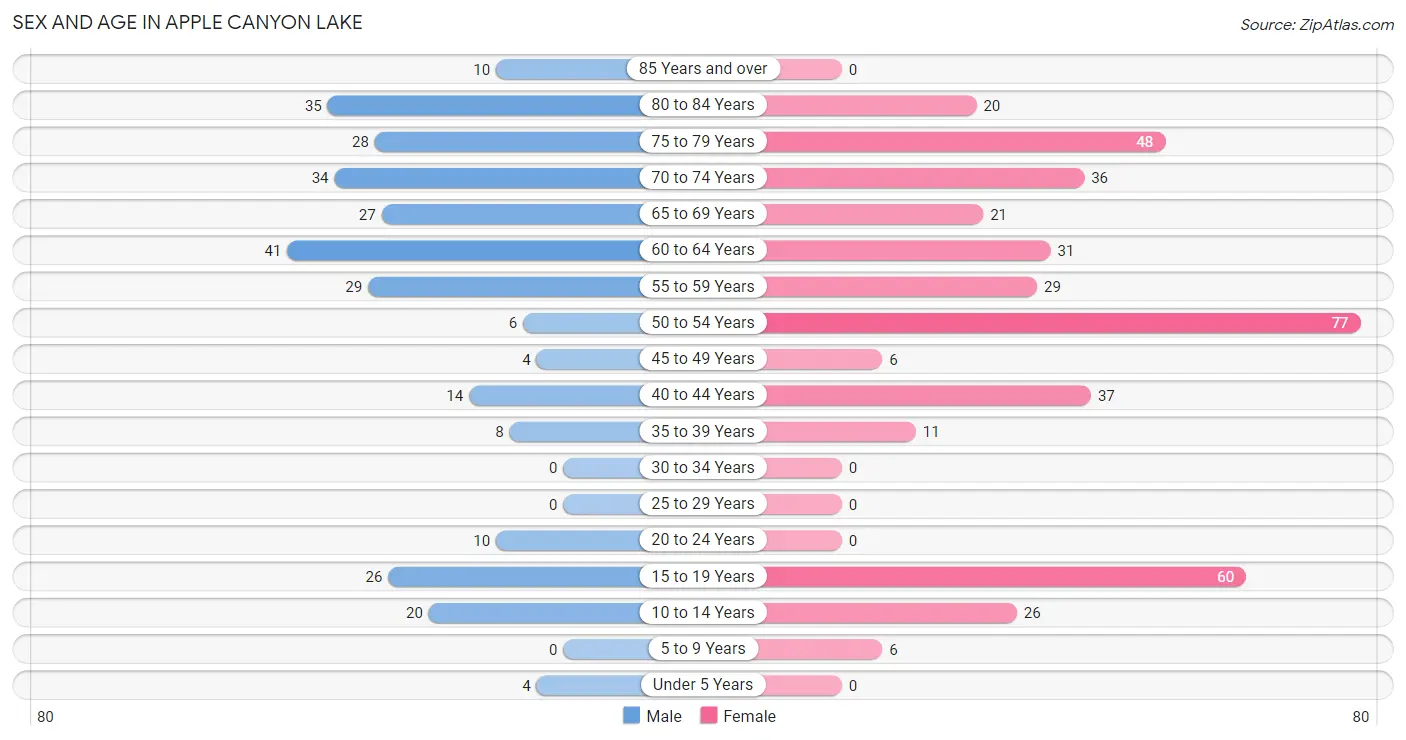
| Age Bracket | Male | Female |
| Under 5 Years | 4 (1.3%) | 0 (0.0%) |
| 5 to 9 Years | 0 (0.0%) | 6 (1.5%) |
| 10 to 14 Years | 20 (6.8%) | 26 (6.4%) |
| 15 to 19 Years | 26 (8.8%) | 60 (14.7%) |
| 20 to 24 Years | 10 (3.4%) | 0 (0.0%) |
| 25 to 29 Years | 0 (0.0%) | 0 (0.0%) |
| 30 to 34 Years | 0 (0.0%) | 0 (0.0%) |
| 35 to 39 Years | 8 (2.7%) | 11 (2.7%) |
| 40 to 44 Years | 14 (4.7%) | 37 (9.1%) |
| 45 to 49 Years | 4 (1.3%) | 6 (1.5%) |
| 50 to 54 Years | 6 (2.0%) | 77 (18.9%) |
| 55 to 59 Years | 29 (9.8%) | 29 (7.1%) |
| 60 to 64 Years | 41 (13.9%) | 31 (7.6%) |
| 65 to 69 Years | 27 (9.1%) | 21 (5.1%) |
| 70 to 74 Years | 34 (11.5%) | 36 (8.8%) |
| 75 to 79 Years | 28 (9.5%) | 48 (11.8%) |
| 80 to 84 Years | 35 (11.8%) | 20 (4.9%) |
| 85 Years and over | 10 (3.4%) | 0 (0.0%) |
| Total | 296 (100.0%) | 408 (100.0%) |
Families and Households in Apple Canyon Lake
Median Family Size in Apple Canyon Lake
The median family size in Apple Canyon Lake is 2.41 persons per family, with single female/mother families (72 | 29.1%) accounting for the largest median family size of 2.71 persons per family. On the other hand, married-couple families (169 | 68.4%) represent the smallest median family size with 2.28 persons per family.
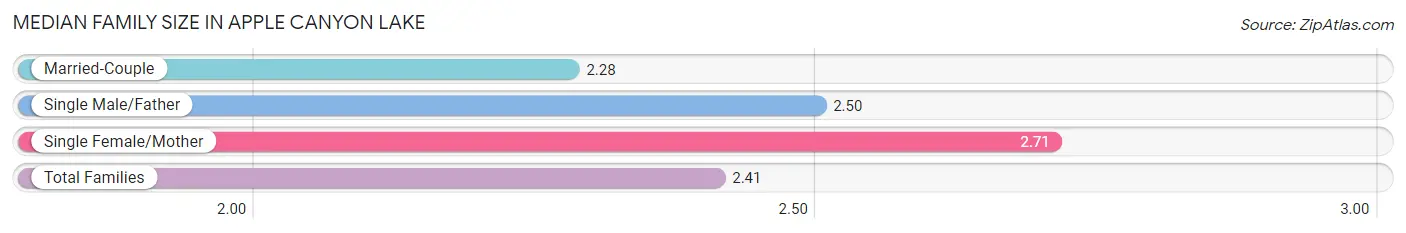
| Family Type | # Families | Family Size |
| Married-Couple | 169 (68.4%) | 2.28 |
| Single Male/Father | 6 (2.4%) | 2.50 |
| Single Female/Mother | 72 (29.1%) | 2.71 |
| Total Families | 247 (100.0%) | 2.41 |
Median Household Size in Apple Canyon Lake
The median household size in Apple Canyon Lake is 2.10 persons per household, with single male/father households (6 | 1.8%) accounting for the largest median household size of 2.83 persons per household. non-family households (89 | 26.5%) represent the smallest median household size with 1.20 persons per household.
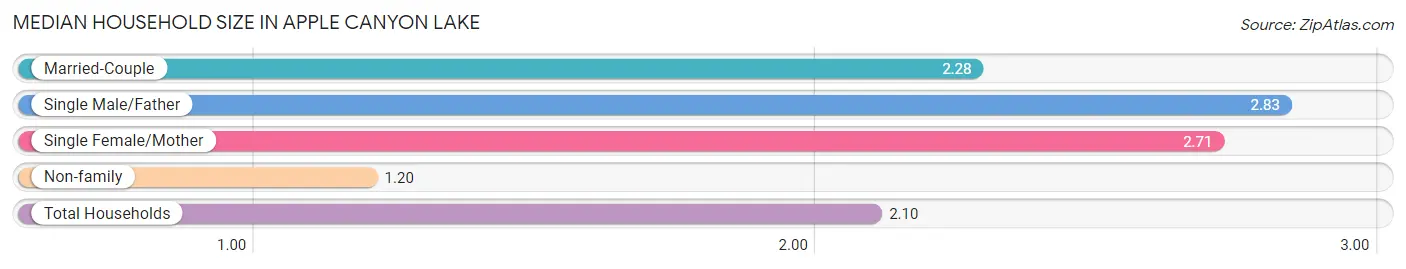
| Household Type | # Households | Household Size |
| Married-Couple | 169 (50.3%) | 2.28 |
| Single Male/Father | 6 (1.8%) | 2.83 |
| Single Female/Mother | 72 (21.4%) | 2.71 |
| Non-family | 89 (26.5%) | 1.20 |
| Total Households | 336 (100.0%) | 2.10 |
Household Size by Marriage Status in Apple Canyon Lake
Out of a total of 336 households in Apple Canyon Lake, 247 (73.5%) are family households, while 89 (26.5%) are nonfamily households. The most numerous type of family households are 2-person households, comprising 188, and the most common type of nonfamily households are 1-person households, comprising 72.
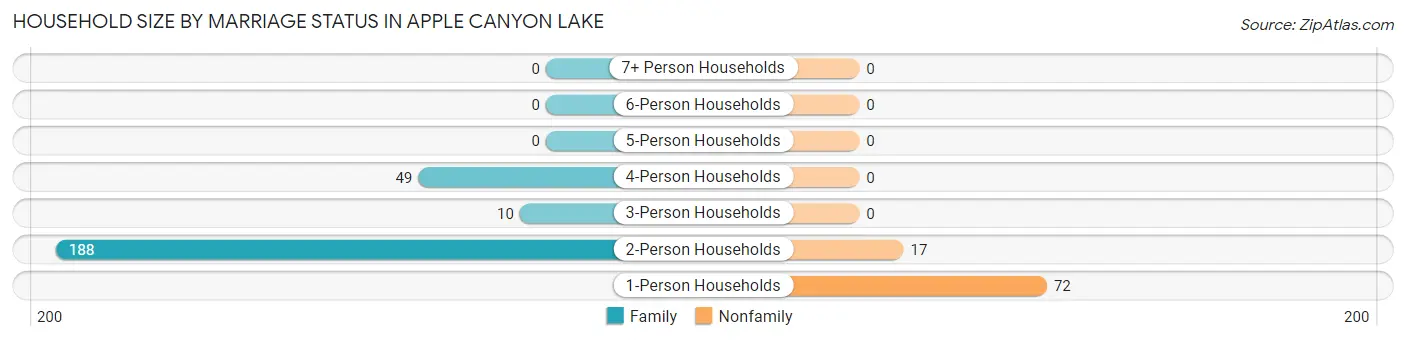
| Household Size | Family Households | Nonfamily Households |
| 1-Person Households | - | 72 (21.4%) |
| 2-Person Households | 188 (55.9%) | 17 (5.1%) |
| 3-Person Households | 10 (3.0%) | 0 (0.0%) |
| 4-Person Households | 49 (14.6%) | 0 (0.0%) |
| 5-Person Households | 0 (0.0%) | 0 (0.0%) |
| 6-Person Households | 0 (0.0%) | 0 (0.0%) |
| 7+ Person Households | 0 (0.0%) | 0 (0.0%) |
| Total | 247 (73.5%) | 89 (26.5%) |
Female Fertility in Apple Canyon Lake
Fertility by Age in Apple Canyon Lake
| Age Bracket | Women with Births | Births / 1,000 Women |
| 15 to 19 years | 0 (0.0%) | 0.0 |
| 20 to 34 years | 0 (0.0%) | 0.0 |
| 35 to 50 years | 0 (0.0%) | 0.0 |
| Total | 0 (0.0%) | 0.0 |
Fertility by Age by Marriage Status in Apple Canyon Lake
| Age Bracket | Married | Unmarried |
| 15 to 19 years | 0 (0.0%) | 0 (0.0%) |
| 20 to 34 years | 0 (0.0%) | 0 (0.0%) |
| 35 to 50 years | 0 (0.0%) | 0 (0.0%) |
| Total | 0 (0.0%) | 0 (0.0%) |
Fertility by Education in Apple Canyon Lake
| Educational Attainment | Women with Births | Births / 1,000 Women |
| Less than High School | 0 (0.0%) | 0.0 |
| High School Diploma | 0 (0.0%) | 0.0 |
| College or Associate's Degree | 0 (0.0%) | 0.0 |
| Bachelor's Degree | 0 (0.0%) | 0.0 |
| Graduate Degree | 0 (0.0%) | 0.0 |
| Total | 0 (0.0%) | 0.0 |
Fertility by Education by Marriage Status in Apple Canyon Lake
| Educational Attainment | Married | Unmarried |
| Less than High School | 0 (0.0%) | 0 (0.0%) |
| High School Diploma | 0 (0.0%) | 0 (0.0%) |
| College or Associate's Degree | 0 (0.0%) | 0 (0.0%) |
| Bachelor's Degree | 0 (0.0%) | 0 (0.0%) |
| Graduate Degree | 0 (0.0%) | 0 (0.0%) |
| Total | 0 (0.0%) | 0 (0.0%) |
Employment Characteristics in Apple Canyon Lake
Employment by Class of Employer in Apple Canyon Lake
Among the 226 employed individuals in Apple Canyon Lake, private company employees (122 | 54.0%), self-employed (not incorporated) (44 | 19.5%), and self-employed (incorporated) (27 | 11.9%) make up the most common classes of employment.
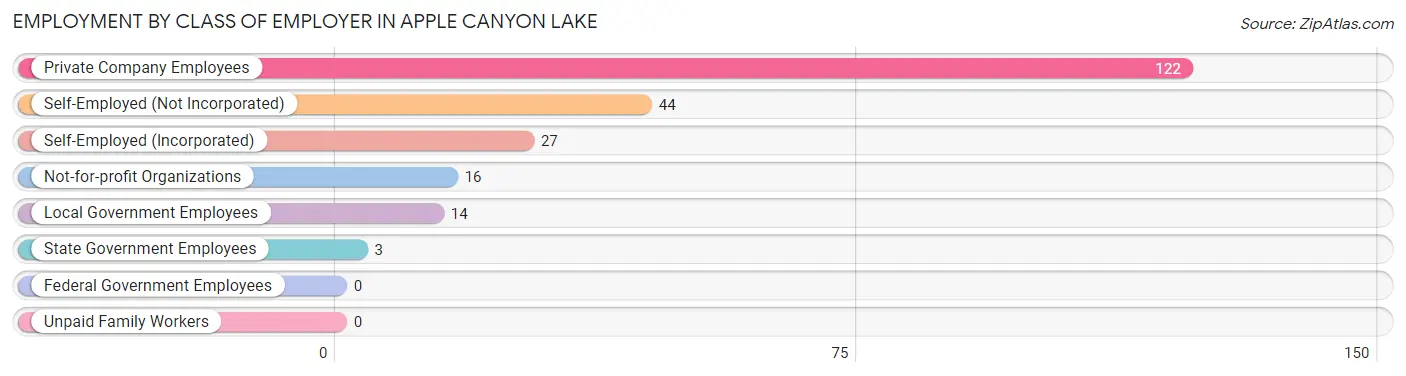
| Employer Class | # Employees | % Employees |
| Private Company Employees | 122 | 54.0% |
| Self-Employed (Incorporated) | 27 | 11.9% |
| Self-Employed (Not Incorporated) | 44 | 19.5% |
| Not-for-profit Organizations | 16 | 7.1% |
| Local Government Employees | 14 | 6.2% |
| State Government Employees | 3 | 1.3% |
| Federal Government Employees | 0 | 0.0% |
| Unpaid Family Workers | 0 | 0.0% |
| Total | 226 | 100.0% |
Employment Status by Age in Apple Canyon Lake
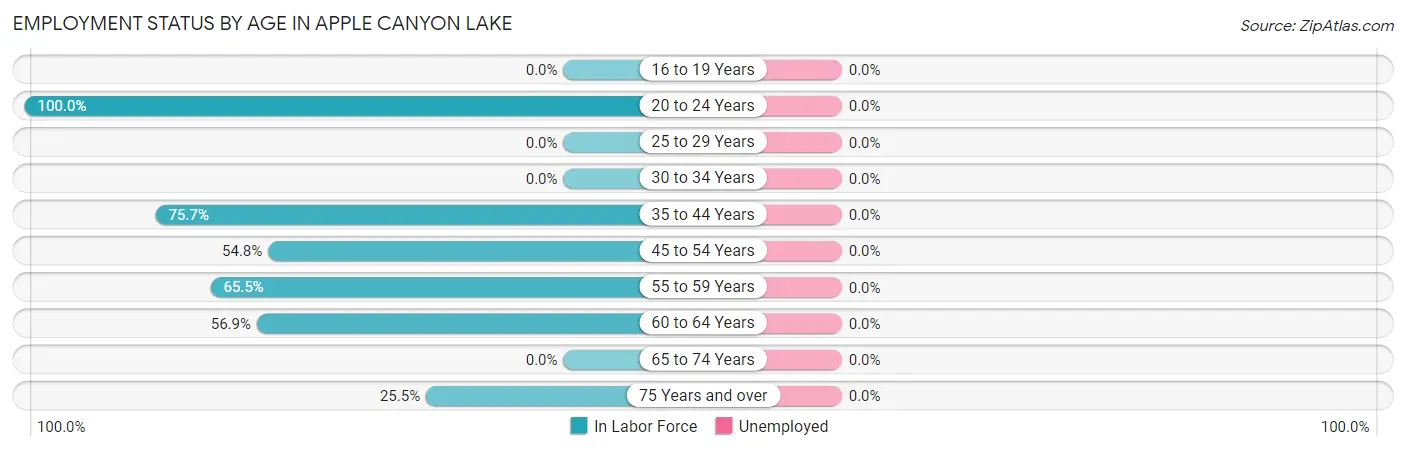
| Age Bracket | In Labor Force | Unemployed |
| 16 to 19 Years | 0 (0.0%) | 0 (0.0%) |
| 20 to 24 Years | 10 (100.0%) | 0 (0.0%) |
| 25 to 29 Years | 0 (0.0%) | 0 (0.0%) |
| 30 to 34 Years | 0 (0.0%) | 0 (0.0%) |
| 35 to 44 Years | 53 (75.7%) | 0 (0.0%) |
| 45 to 54 Years | 51 (54.8%) | 0 (0.0%) |
| 55 to 59 Years | 38 (65.5%) | 0 (0.0%) |
| 60 to 64 Years | 41 (56.9%) | 0 (0.0%) |
| 65 to 74 Years | 0 (0.0%) | 0 (0.0%) |
| 75 Years and over | 36 (25.5%) | 0 (0.0%) |
| Total | 229 (35.3%) | 0 (0.0%) |
Employment Status by Educational Attainment in Apple Canyon Lake
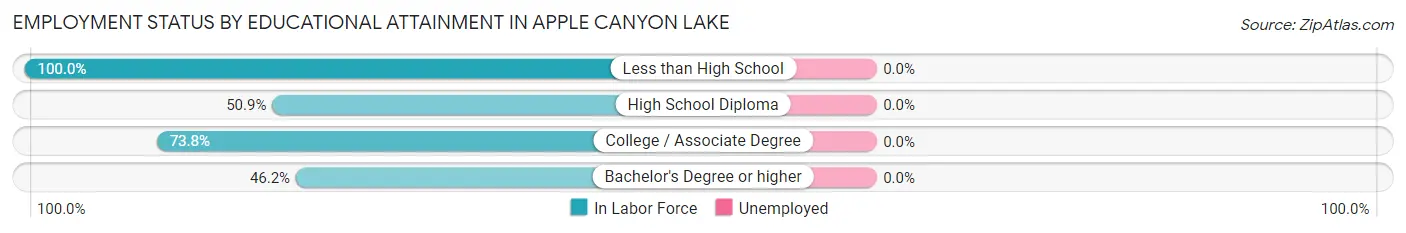
| Educational Attainment | In Labor Force | Unemployed |
| Less than High School | 31 (100.0%) | 0 (0.0%) |
| High School Diploma | 28 (50.9%) | 0 (0.0%) |
| College / Associate Degree | 76 (73.8%) | 0 (0.0%) |
| Bachelor's Degree or higher | 48 (46.2%) | 0 (0.0%) |
| Total | 183 (62.5%) | 0 (0.0%) |
Employment Occupations by Sex in Apple Canyon Lake
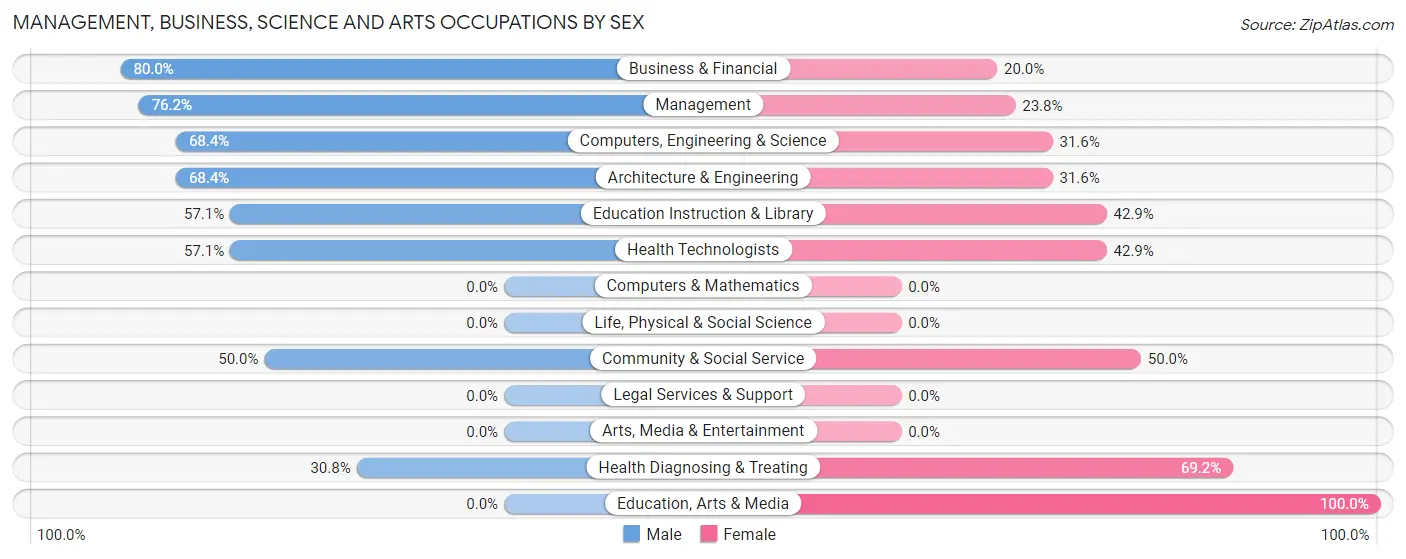
Management, Business, Science and Arts Occupations
The most common Management, Business, Science and Arts occupations in Apple Canyon Lake are Management (21 | 9.2%), Computers, Engineering & Science (19 | 8.3%), Architecture & Engineering (19 | 8.3%), Community & Social Service (16 | 7.0%), and Education Instruction & Library (14 | 6.1%).
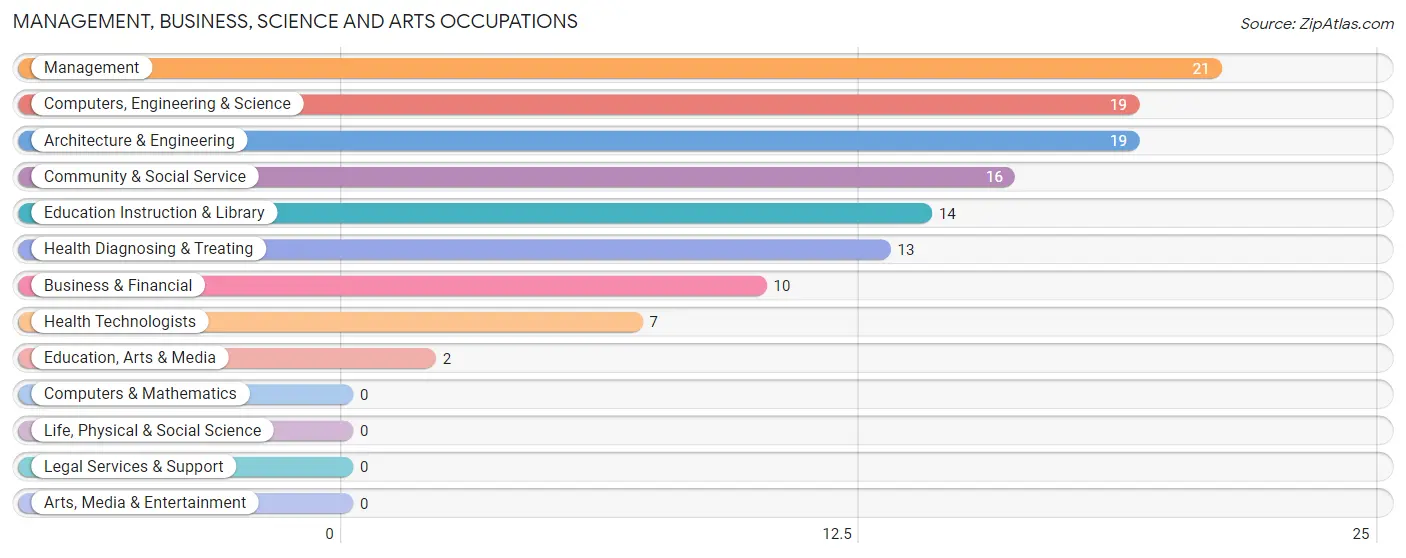
Management, Business, Science and Arts Occupations by Sex
Within the Management, Business, Science and Arts occupations in Apple Canyon Lake, the most male-oriented occupations are Business & Financial (80.0%), Management (76.2%), and Computers, Engineering & Science (68.4%), while the most female-oriented occupations are Education, Arts & Media (100.0%), Health Diagnosing & Treating (69.2%), and Community & Social Service (50.0%).
| Occupation | Male | Female |
| Management | 16 (76.2%) | 5 (23.8%) |
| Business & Financial | 8 (80.0%) | 2 (20.0%) |
| Computers, Engineering & Science | 13 (68.4%) | 6 (31.6%) |
| Computers & Mathematics | 0 (0.0%) | 0 (0.0%) |
| Architecture & Engineering | 13 (68.4%) | 6 (31.6%) |
| Life, Physical & Social Science | 0 (0.0%) | 0 (0.0%) |
| Community & Social Service | 8 (50.0%) | 8 (50.0%) |
| Education, Arts & Media | 0 (0.0%) | 2 (100.0%) |
| Legal Services & Support | 0 (0.0%) | 0 (0.0%) |
| Education Instruction & Library | 8 (57.1%) | 6 (42.9%) |
| Arts, Media & Entertainment | 0 (0.0%) | 0 (0.0%) |
| Health Diagnosing & Treating | 4 (30.8%) | 9 (69.2%) |
| Health Technologists | 4 (57.1%) | 3 (42.9%) |
| Total (Category) | 49 (62.0%) | 30 (38.0%) |
| Total (Overall) | 114 (49.8%) | 115 (50.2%) |
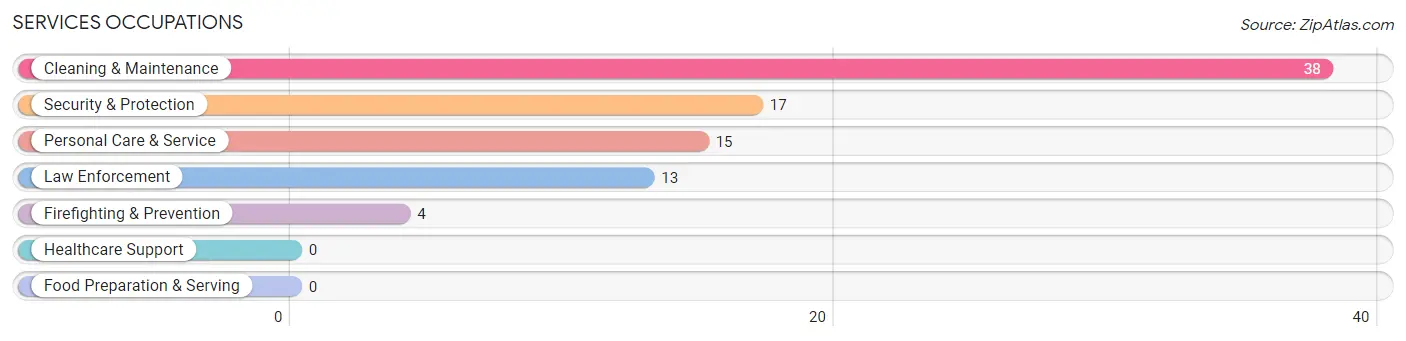
Services Occupations
The most common Services occupations in Apple Canyon Lake are Cleaning & Maintenance (38 | 16.6%), Security & Protection (17 | 7.4%), Personal Care & Service (15 | 6.6%), Law Enforcement (13 | 5.7%), and Firefighting & Prevention (4 | 1.8%).
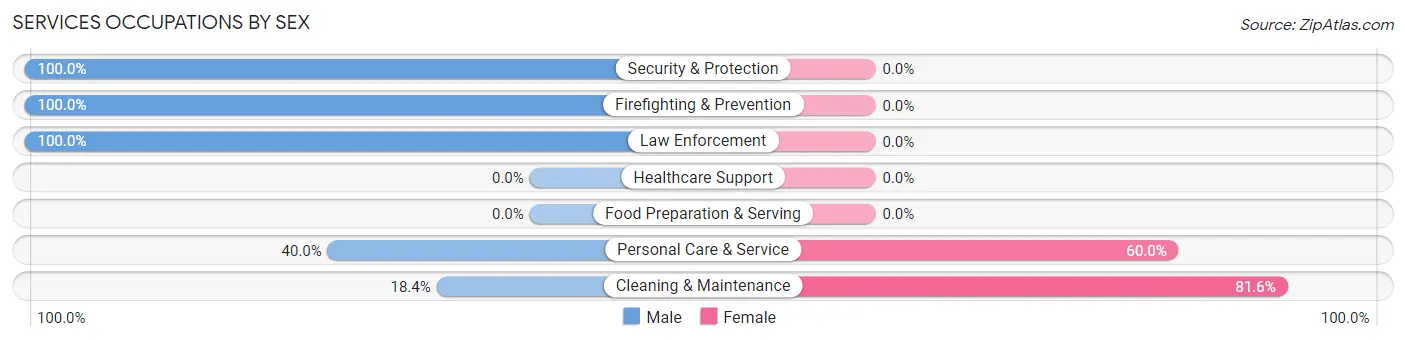
Services Occupations by Sex
Within the Services occupations in Apple Canyon Lake, the most male-oriented occupations are Security & Protection (100.0%), Firefighting & Prevention (100.0%), and Law Enforcement (100.0%), while the most female-oriented occupations are Cleaning & Maintenance (81.6%), and Personal Care & Service (60.0%).
| Occupation | Male | Female |
| Healthcare Support | 0 (0.0%) | 0 (0.0%) |
| Security & Protection | 17 (100.0%) | 0 (0.0%) |
| Firefighting & Prevention | 4 (100.0%) | 0 (0.0%) |
| Law Enforcement | 13 (100.0%) | 0 (0.0%) |
| Food Preparation & Serving | 0 (0.0%) | 0 (0.0%) |
| Cleaning & Maintenance | 7 (18.4%) | 31 (81.6%) |
| Personal Care & Service | 6 (40.0%) | 9 (60.0%) |
| Total (Category) | 30 (42.9%) | 40 (57.1%) |
| Total (Overall) | 114 (49.8%) | 115 (50.2%) |
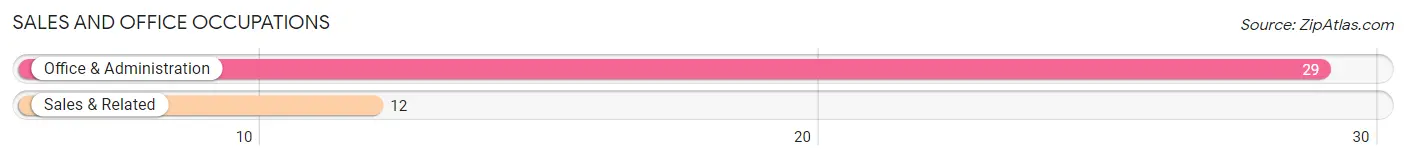
Sales and Office Occupations
The most common Sales and Office occupations in Apple Canyon Lake are Office & Administration (29 | 12.7%), and Sales & Related (12 | 5.2%).
Sales and Office Occupations by Sex
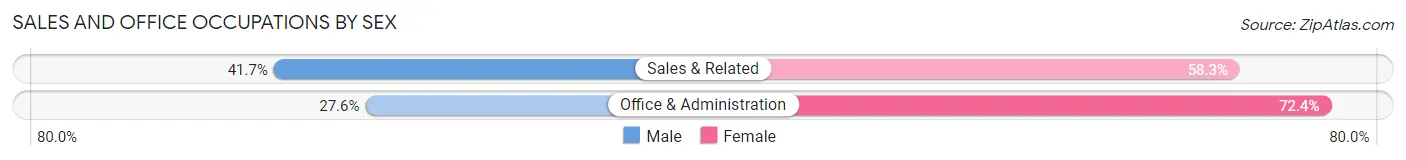
| Occupation | Male | Female |
| Sales & Related | 5 (41.7%) | 7 (58.3%) |
| Office & Administration | 8 (27.6%) | 21 (72.4%) |
| Total (Category) | 13 (31.7%) | 28 (68.3%) |
| Total (Overall) | 114 (49.8%) | 115 (50.2%) |
Natural Resources, Construction and Maintenance Occupations
Natural Resources, Construction and Maintenance Occupations by Sex
| Occupation | Male | Female |
| Farming, Fishing & Forestry | 0 (0.0%) | 0 (0.0%) |
| Construction & Extraction | 0 (0.0%) | 0 (0.0%) |
| Installation, Maintenance & Repair | 0 (0.0%) | 0 (0.0%) |
| Total (Category) | 0 (0.0%) | 0 (0.0%) |
| Total (Overall) | 114 (49.8%) | 115 (50.2%) |
Production, Transportation and Moving Occupations
The most common Production, Transportation and Moving occupations in Apple Canyon Lake are Production (36 | 15.7%), and Material Moving (3 | 1.3%).
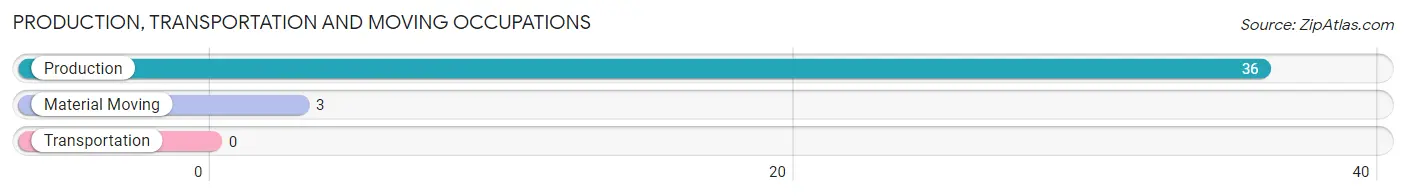
Production, Transportation and Moving Occupations by Sex
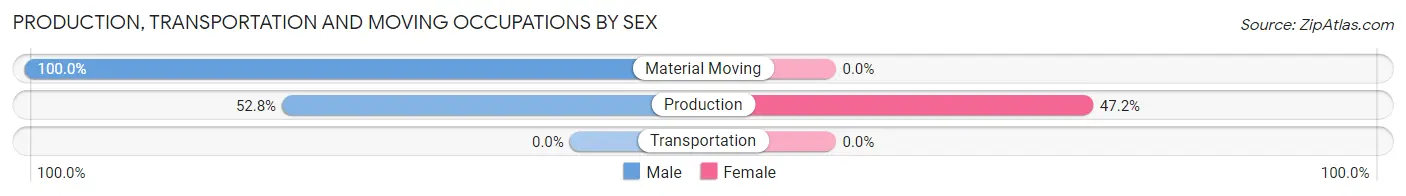
| Occupation | Male | Female |
| Production | 19 (52.8%) | 17 (47.2%) |
| Transportation | 0 (0.0%) | 0 (0.0%) |
| Material Moving | 3 (100.0%) | 0 (0.0%) |
| Total (Category) | 22 (56.4%) | 17 (43.6%) |
| Total (Overall) | 114 (49.8%) | 115 (50.2%) |
Employment Industries by Sex in Apple Canyon Lake
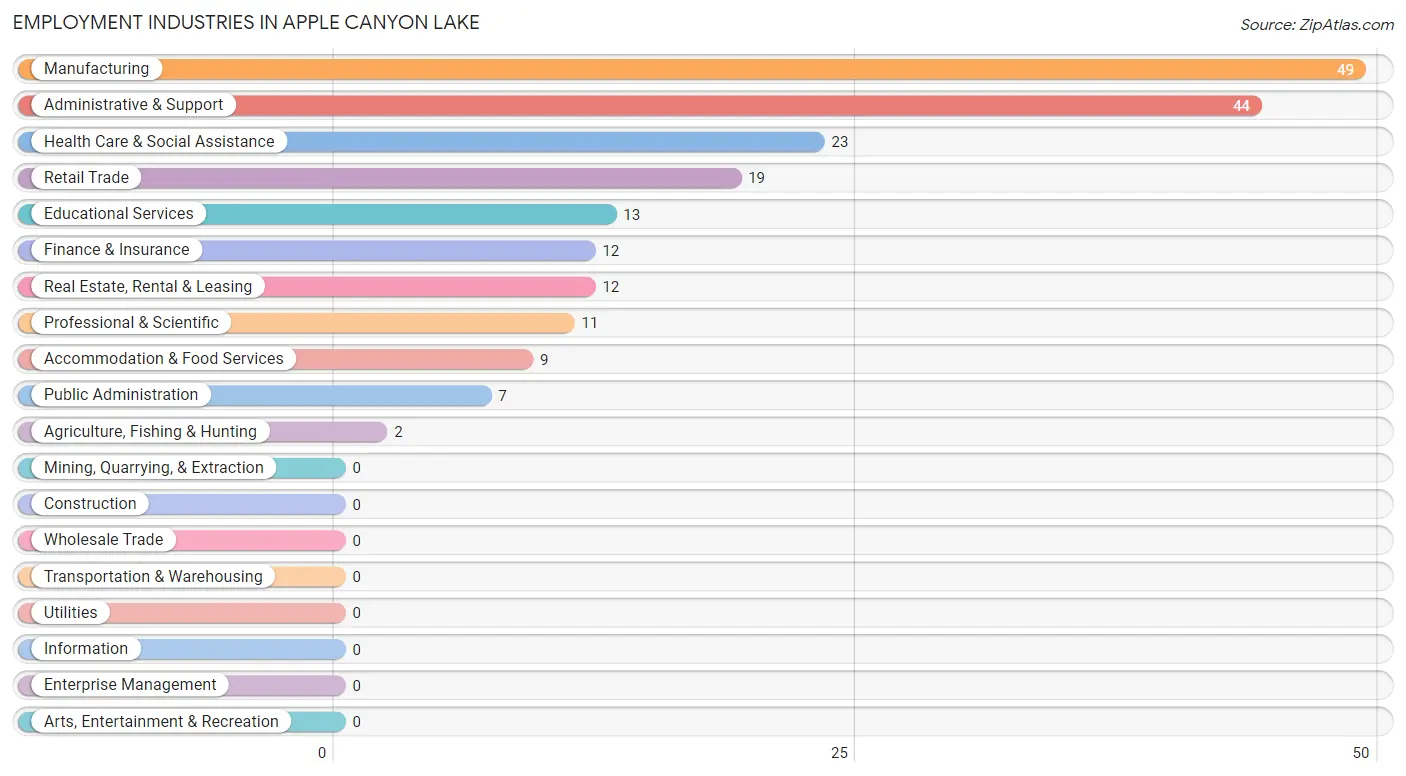
Employment Industries in Apple Canyon Lake
The major employment industries in Apple Canyon Lake include Manufacturing (49 | 21.4%), Administrative & Support (44 | 19.2%), Health Care & Social Assistance (23 | 10.0%), Retail Trade (19 | 8.3%), and Educational Services (13 | 5.7%).
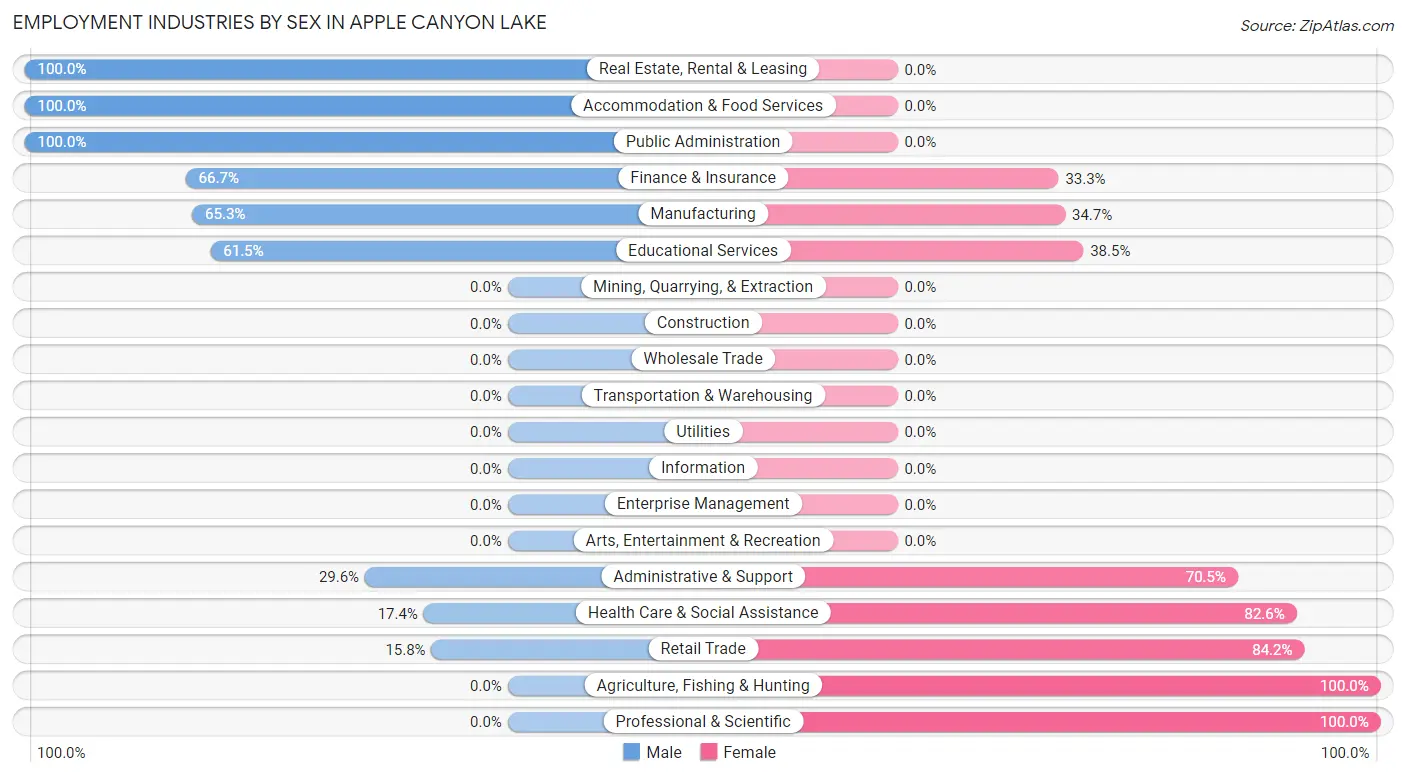
Employment Industries by Sex in Apple Canyon Lake
The Apple Canyon Lake industries that see more men than women are Real Estate, Rental & Leasing (100.0%), Accommodation & Food Services (100.0%), and Public Administration (100.0%), whereas the industries that tend to have a higher number of women are Agriculture, Fishing & Hunting (100.0%), Professional & Scientific (100.0%), and Retail Trade (84.2%).
| Industry | Male | Female |
| Agriculture, Fishing & Hunting | 0 (0.0%) | 2 (100.0%) |
| Mining, Quarrying, & Extraction | 0 (0.0%) | 0 (0.0%) |
| Construction | 0 (0.0%) | 0 (0.0%) |
| Manufacturing | 32 (65.3%) | 17 (34.7%) |
| Wholesale Trade | 0 (0.0%) | 0 (0.0%) |
| Retail Trade | 3 (15.8%) | 16 (84.2%) |
| Transportation & Warehousing | 0 (0.0%) | 0 (0.0%) |
| Utilities | 0 (0.0%) | 0 (0.0%) |
| Information | 0 (0.0%) | 0 (0.0%) |
| Finance & Insurance | 8 (66.7%) | 4 (33.3%) |
| Real Estate, Rental & Leasing | 12 (100.0%) | 0 (0.0%) |
| Professional & Scientific | 0 (0.0%) | 11 (100.0%) |
| Enterprise Management | 0 (0.0%) | 0 (0.0%) |
| Administrative & Support | 13 (29.5%) | 31 (70.5%) |
| Educational Services | 8 (61.5%) | 5 (38.5%) |
| Health Care & Social Assistance | 4 (17.4%) | 19 (82.6%) |
| Arts, Entertainment & Recreation | 0 (0.0%) | 0 (0.0%) |
| Accommodation & Food Services | 9 (100.0%) | 0 (0.0%) |
| Public Administration | 7 (100.0%) | 0 (0.0%) |
| Total | 114 (49.8%) | 115 (50.2%) |
Education in Apple Canyon Lake
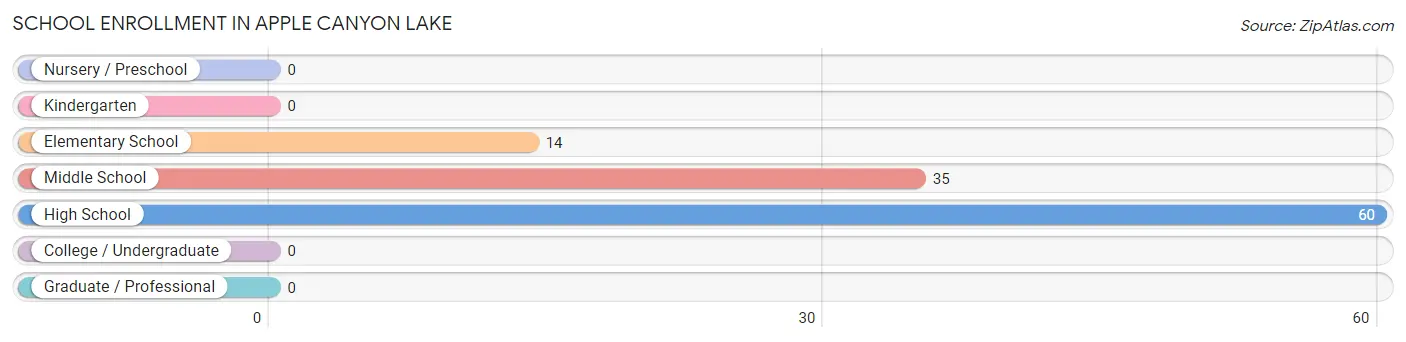
School Enrollment in Apple Canyon Lake
The most common levels of schooling among the 109 students in Apple Canyon Lake are high school (60 | 55.0%), middle school (35 | 32.1%), and elementary school (14 | 12.8%).
| School Level | # Students | % Students |
| Nursery / Preschool | 0 | 0.0% |
| Kindergarten | 0 | 0.0% |
| Elementary School | 14 | 12.8% |
| Middle School | 35 | 32.1% |
| High School | 60 | 55.0% |
| College / Undergraduate | 0 | 0.0% |
| Graduate / Professional | 0 | 0.0% |
| Total | 109 | 100.0% |
School Enrollment by Age by Funding Source in Apple Canyon Lake
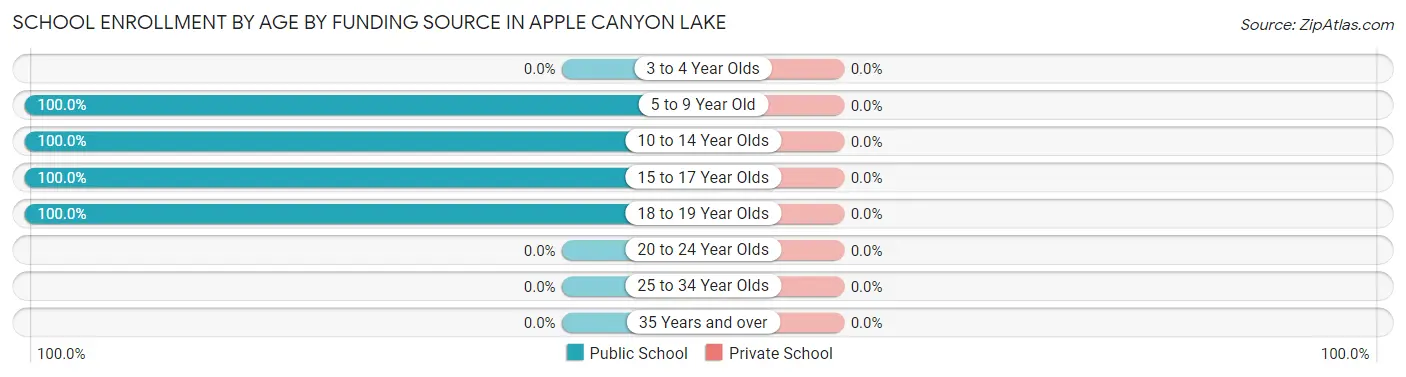
| Age Bracket | Public School | Private School |
| 3 to 4 Year Olds | 0 (0.0%) | 0 (0.0%) |
| 5 to 9 Year Old | 6 (100.0%) | 0 (0.0%) |
| 10 to 14 Year Olds | 43 (100.0%) | 0 (0.0%) |
| 15 to 17 Year Olds | 34 (100.0%) | 0 (0.0%) |
| 18 to 19 Year Olds | 26 (100.0%) | 0 (0.0%) |
| 20 to 24 Year Olds | 0 (0.0%) | 0 (0.0%) |
| 25 to 34 Year Olds | 0 (0.0%) | 0 (0.0%) |
| 35 Years and over | 0 (0.0%) | 0 (0.0%) |
| Total | 109 (100.0%) | 0 (0.0%) |
Educational Attainment by Field of Study in Apple Canyon Lake
Arts & humanities (56 | 22.2%), business (51 | 20.2%), education (45 | 17.9%), social sciences (39 | 15.5%), and physical & health sciences (16 | 6.4%) are the most common fields of study among 252 individuals in Apple Canyon Lake who have obtained a bachelor's degree or higher.
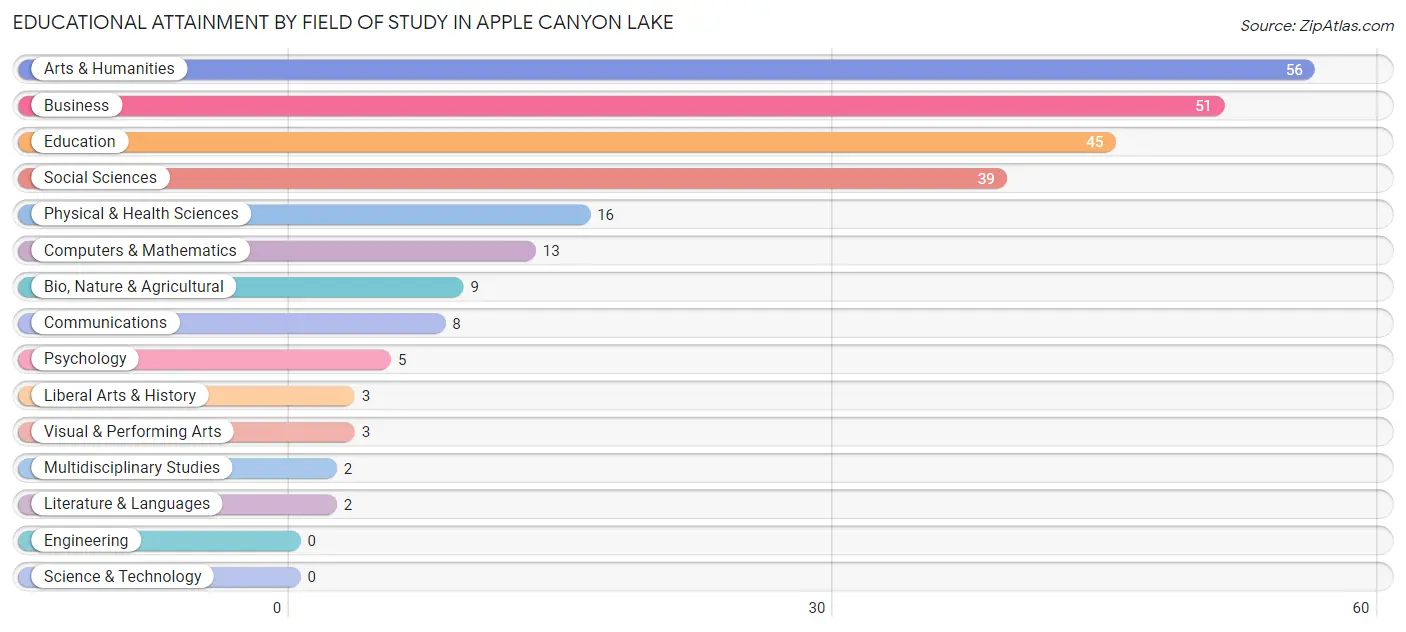
| Field of Study | # Graduates | % Graduates |
| Computers & Mathematics | 13 | 5.2% |
| Bio, Nature & Agricultural | 9 | 3.6% |
| Physical & Health Sciences | 16 | 6.4% |
| Psychology | 5 | 2.0% |
| Social Sciences | 39 | 15.5% |
| Engineering | 0 | 0.0% |
| Multidisciplinary Studies | 2 | 0.8% |
| Science & Technology | 0 | 0.0% |
| Business | 51 | 20.2% |
| Education | 45 | 17.9% |
| Literature & Languages | 2 | 0.8% |
| Liberal Arts & History | 3 | 1.2% |
| Visual & Performing Arts | 3 | 1.2% |
| Communications | 8 | 3.2% |
| Arts & Humanities | 56 | 22.2% |
| Total | 252 | 100.0% |
Transportation & Commute in Apple Canyon Lake
Vehicle Availability by Sex in Apple Canyon Lake
The most prevalent vehicle ownership categories in Apple Canyon Lake are males with 2 vehicles (71, accounting for 64.0%) and females with 2 vehicles (56, making up 61.7%).
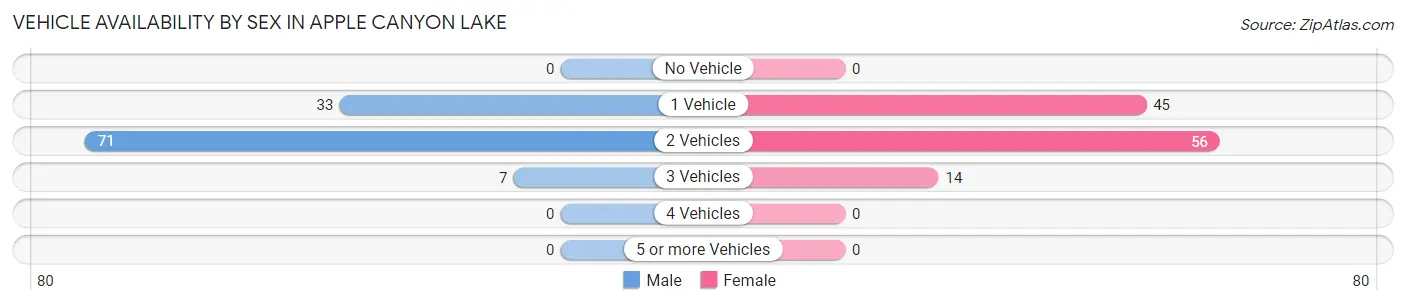
| Vehicles Available | Male | Female |
| No Vehicle | 0 (0.0%) | 0 (0.0%) |
| 1 Vehicle | 33 (29.7%) | 45 (39.1%) |
| 2 Vehicles | 71 (64.0%) | 56 (48.7%) |
| 3 Vehicles | 7 (6.3%) | 14 (12.2%) |
| 4 Vehicles | 0 (0.0%) | 0 (0.0%) |
| 5 or more Vehicles | 0 (0.0%) | 0 (0.0%) |
| Total | 111 (100.0%) | 115 (100.0%) |
Commute Time in Apple Canyon Lake
The most frequently occuring commute durations in Apple Canyon Lake are 45 to 59 minutes (46 commuters, 22.1%), 60 to 89 minutes (41 commuters, 19.7%), and 30 to 34 minutes (34 commuters, 16.4%).
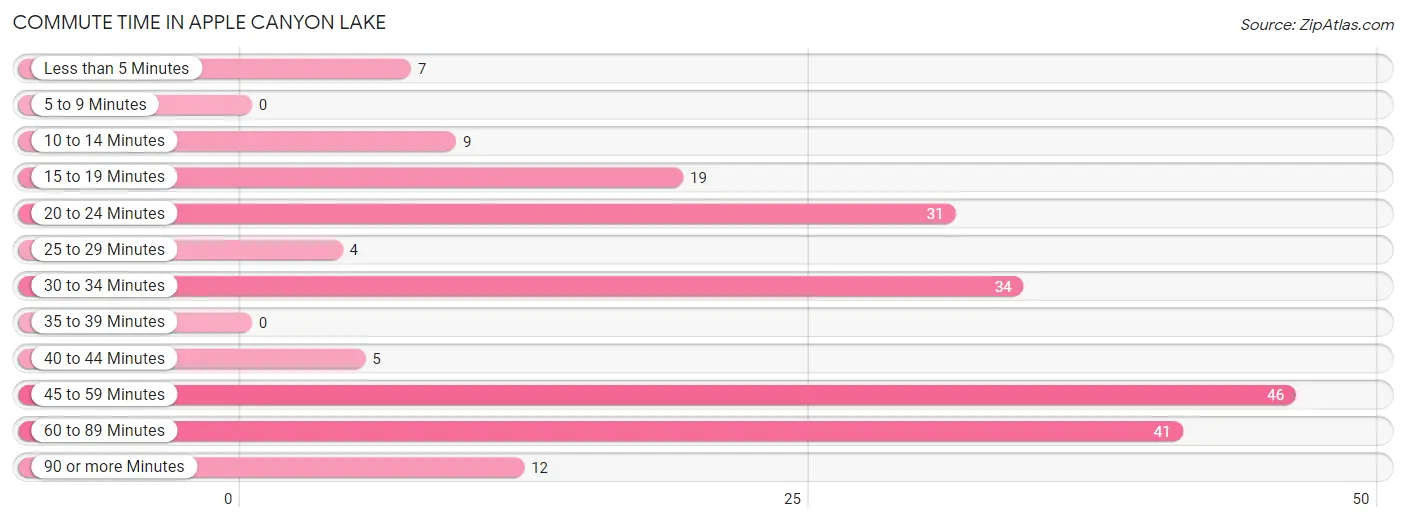
| Commute Time | # Commuters | % Commuters |
| Less than 5 Minutes | 7 | 3.4% |
| 5 to 9 Minutes | 0 | 0.0% |
| 10 to 14 Minutes | 9 | 4.3% |
| 15 to 19 Minutes | 19 | 9.1% |
| 20 to 24 Minutes | 31 | 14.9% |
| 25 to 29 Minutes | 4 | 1.9% |
| 30 to 34 Minutes | 34 | 16.4% |
| 35 to 39 Minutes | 0 | 0.0% |
| 40 to 44 Minutes | 5 | 2.4% |
| 45 to 59 Minutes | 46 | 22.1% |
| 60 to 89 Minutes | 41 | 19.7% |
| 90 or more Minutes | 12 | 5.8% |
Commute Time by Sex in Apple Canyon Lake
The most common commute times in Apple Canyon Lake are 30 to 34 minutes (31 commuters, 31.0%) for males and 45 to 59 minutes (42 commuters, 38.9%) for females.
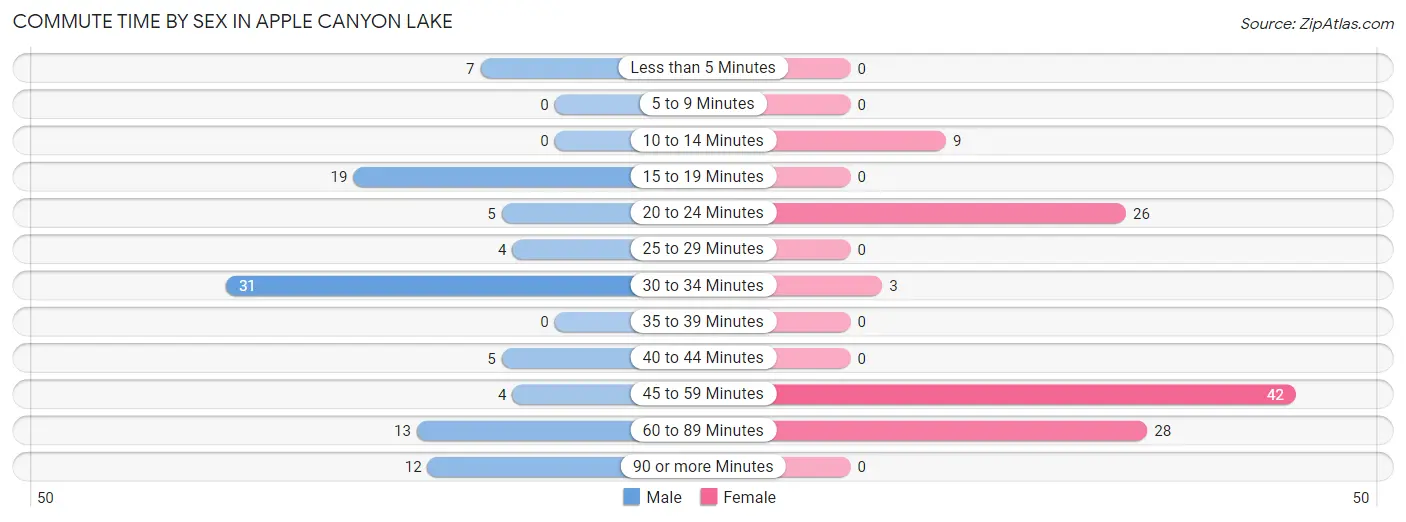
| Commute Time | Male | Female |
| Less than 5 Minutes | 7 (7.0%) | 0 (0.0%) |
| 5 to 9 Minutes | 0 (0.0%) | 0 (0.0%) |
| 10 to 14 Minutes | 0 (0.0%) | 9 (8.3%) |
| 15 to 19 Minutes | 19 (19.0%) | 0 (0.0%) |
| 20 to 24 Minutes | 5 (5.0%) | 26 (24.1%) |
| 25 to 29 Minutes | 4 (4.0%) | 0 (0.0%) |
| 30 to 34 Minutes | 31 (31.0%) | 3 (2.8%) |
| 35 to 39 Minutes | 0 (0.0%) | 0 (0.0%) |
| 40 to 44 Minutes | 5 (5.0%) | 0 (0.0%) |
| 45 to 59 Minutes | 4 (4.0%) | 42 (38.9%) |
| 60 to 89 Minutes | 13 (13.0%) | 28 (25.9%) |
| 90 or more Minutes | 12 (12.0%) | 0 (0.0%) |
Time of Departure to Work by Sex in Apple Canyon Lake
The most frequent times of departure to work in Apple Canyon Lake are 6:00 AM to 6:29 AM (26, 26.0%) for males and 11:00 AM to 11:59 AM (31, 28.7%) for females.
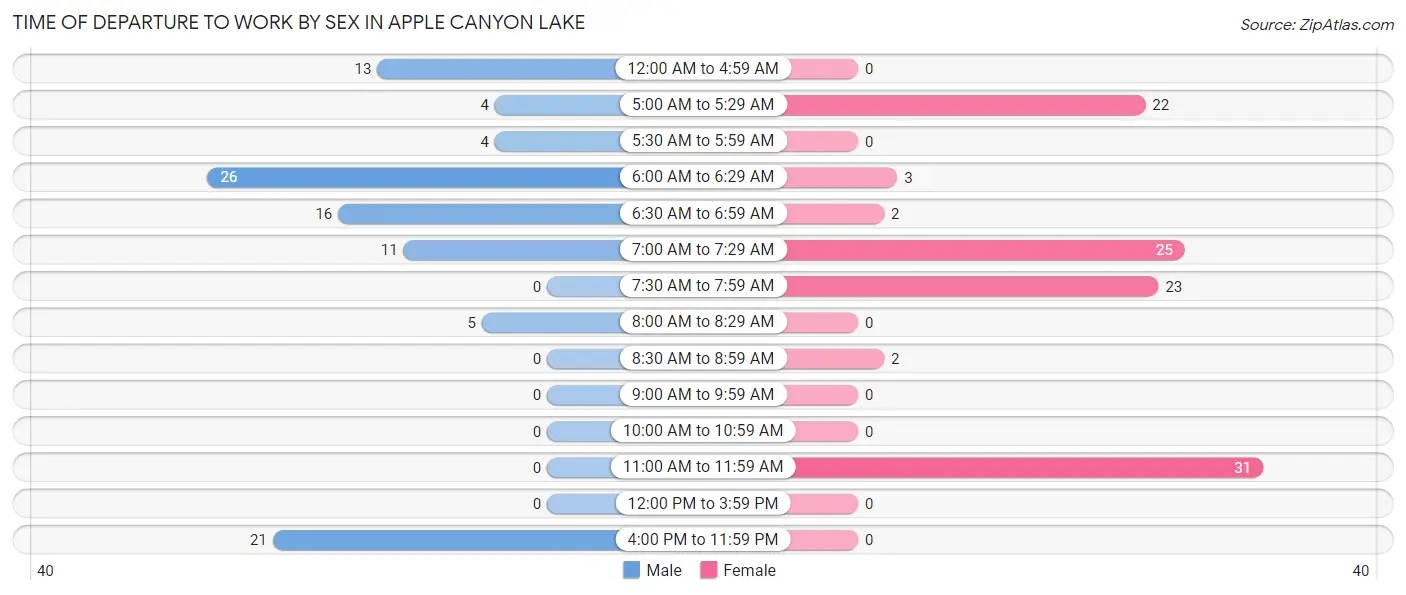
| Time of Departure | Male | Female |
| 12:00 AM to 4:59 AM | 13 (13.0%) | 0 (0.0%) |
| 5:00 AM to 5:29 AM | 4 (4.0%) | 22 (20.4%) |
| 5:30 AM to 5:59 AM | 4 (4.0%) | 0 (0.0%) |
| 6:00 AM to 6:29 AM | 26 (26.0%) | 3 (2.8%) |
| 6:30 AM to 6:59 AM | 16 (16.0%) | 2 (1.8%) |
| 7:00 AM to 7:29 AM | 11 (11.0%) | 25 (23.2%) |
| 7:30 AM to 7:59 AM | 0 (0.0%) | 23 (21.3%) |
| 8:00 AM to 8:29 AM | 5 (5.0%) | 0 (0.0%) |
| 8:30 AM to 8:59 AM | 0 (0.0%) | 2 (1.8%) |
| 9:00 AM to 9:59 AM | 0 (0.0%) | 0 (0.0%) |
| 10:00 AM to 10:59 AM | 0 (0.0%) | 0 (0.0%) |
| 11:00 AM to 11:59 AM | 0 (0.0%) | 31 (28.7%) |
| 12:00 PM to 3:59 PM | 0 (0.0%) | 0 (0.0%) |
| 4:00 PM to 11:59 PM | 21 (21.0%) | 0 (0.0%) |
| Total | 100 (100.0%) | 108 (100.0%) |
Housing Occupancy in Apple Canyon Lake
Occupancy by Ownership in Apple Canyon Lake
Of the total 336 dwellings in Apple Canyon Lake, owner-occupied units account for 299 (89.0%), while renter-occupied units make up 37 (11.0%).
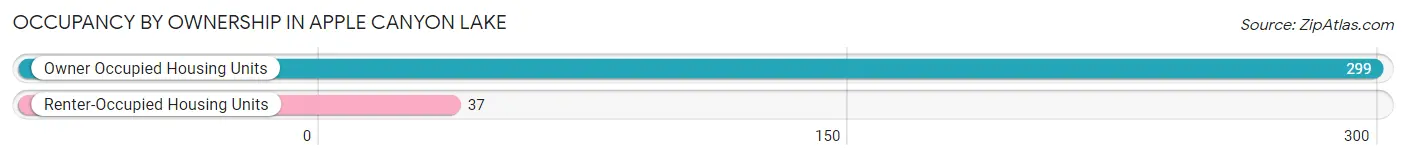
| Occupancy | # Housing Units | % Housing Units |
| Owner Occupied Housing Units | 299 | 89.0% |
| Renter-Occupied Housing Units | 37 | 11.0% |
| Total Occupied Housing Units | 336 | 100.0% |
Occupancy by Household Size in Apple Canyon Lake
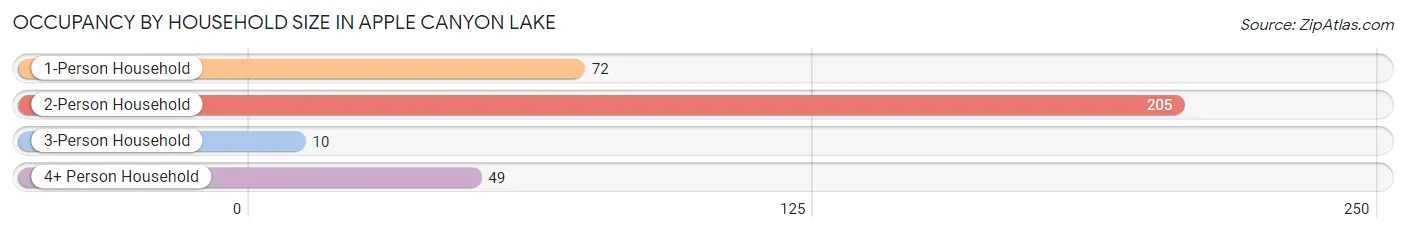
| Household Size | # Housing Units | % Housing Units |
| 1-Person Household | 72 | 21.4% |
| 2-Person Household | 205 | 61.0% |
| 3-Person Household | 10 | 3.0% |
| 4+ Person Household | 49 | 14.6% |
| Total Housing Units | 336 | 100.0% |
Occupancy by Ownership by Household Size in Apple Canyon Lake
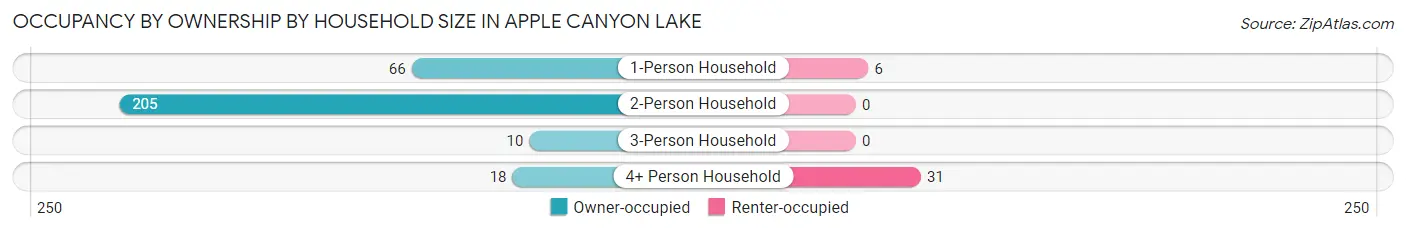
| Household Size | Owner-occupied | Renter-occupied |
| 1-Person Household | 66 (91.7%) | 6 (8.3%) |
| 2-Person Household | 205 (100.0%) | 0 (0.0%) |
| 3-Person Household | 10 (100.0%) | 0 (0.0%) |
| 4+ Person Household | 18 (36.7%) | 31 (63.3%) |
| Total Housing Units | 299 (89.0%) | 37 (11.0%) |
Occupancy by Educational Attainment in Apple Canyon Lake
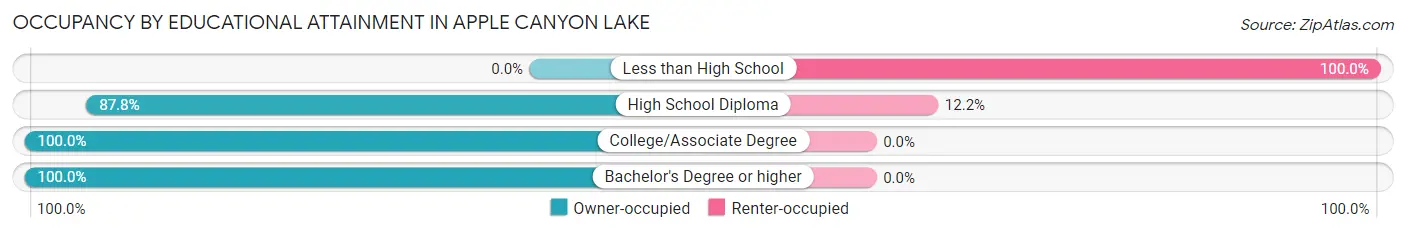
| Household Size | Owner-occupied | Renter-occupied |
| Less than High School | 0 (0.0%) | 31 (100.0%) |
| High School Diploma | 43 (87.8%) | 6 (12.2%) |
| College/Associate Degree | 114 (100.0%) | 0 (0.0%) |
| Bachelor's Degree or higher | 142 (100.0%) | 0 (0.0%) |
Occupancy by Age of Householder in Apple Canyon Lake
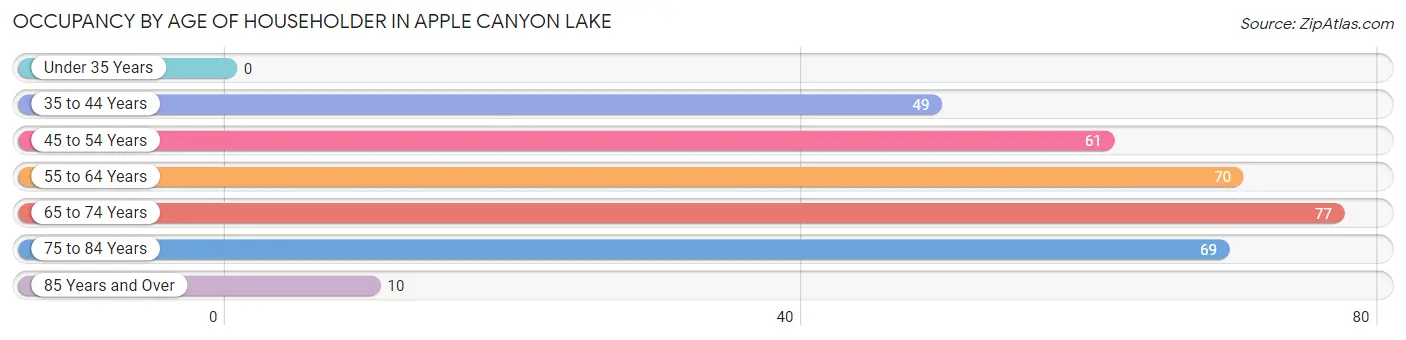
| Age Bracket | # Households | % Households |
| Under 35 Years | 0 | 0.0% |
| 35 to 44 Years | 49 | 14.6% |
| 45 to 54 Years | 61 | 18.1% |
| 55 to 64 Years | 70 | 20.8% |
| 65 to 74 Years | 77 | 22.9% |
| 75 to 84 Years | 69 | 20.5% |
| 85 Years and Over | 10 | 3.0% |
| Total | 336 | 100.0% |
Housing Finances in Apple Canyon Lake
Median Income by Occupancy in Apple Canyon Lake
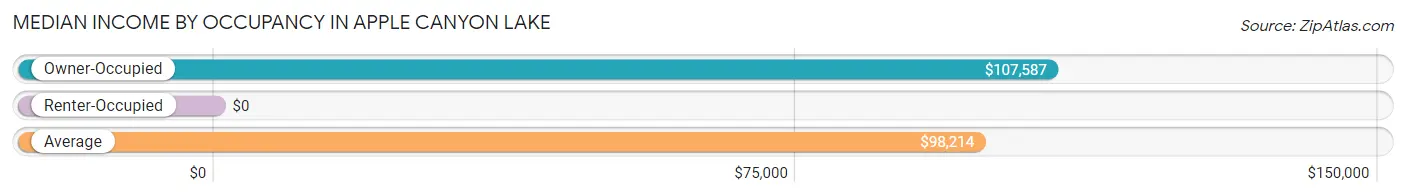
| Occupancy Type | # Households | Median Income |
| Owner-Occupied | 299 (89.0%) | $107,587 |
| Renter-Occupied | 37 (11.0%) | $0 |
| Average | 336 (100.0%) | $98,214 |
Occupancy by Householder Income Bracket in Apple Canyon Lake
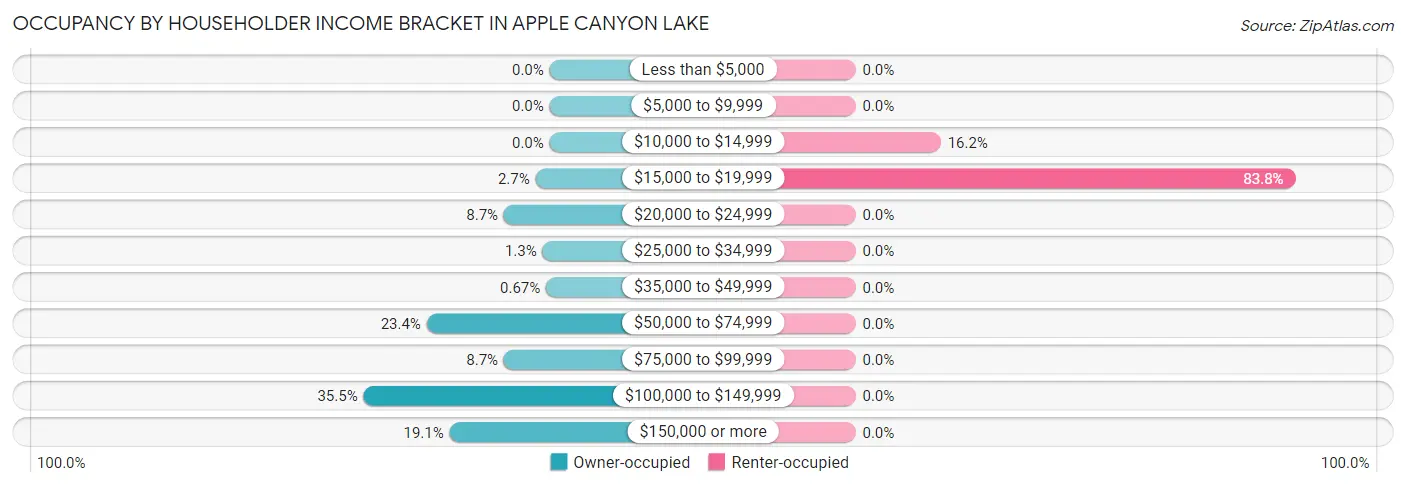
| Income Bracket | Owner-occupied | Renter-occupied |
| Less than $5,000 | 0 (0.0%) | 0 (0.0%) |
| $5,000 to $9,999 | 0 (0.0%) | 0 (0.0%) |
| $10,000 to $14,999 | 0 (0.0%) | 6 (16.2%) |
| $15,000 to $19,999 | 8 (2.7%) | 31 (83.8%) |
| $20,000 to $24,999 | 26 (8.7%) | 0 (0.0%) |
| $25,000 to $34,999 | 4 (1.3%) | 0 (0.0%) |
| $35,000 to $49,999 | 2 (0.7%) | 0 (0.0%) |
| $50,000 to $74,999 | 70 (23.4%) | 0 (0.0%) |
| $75,000 to $99,999 | 26 (8.7%) | 0 (0.0%) |
| $100,000 to $149,999 | 106 (35.4%) | 0 (0.0%) |
| $150,000 or more | 57 (19.1%) | 0 (0.0%) |
| Total | 299 (100.0%) | 37 (100.0%) |
Monthly Housing Cost Tiers in Apple Canyon Lake
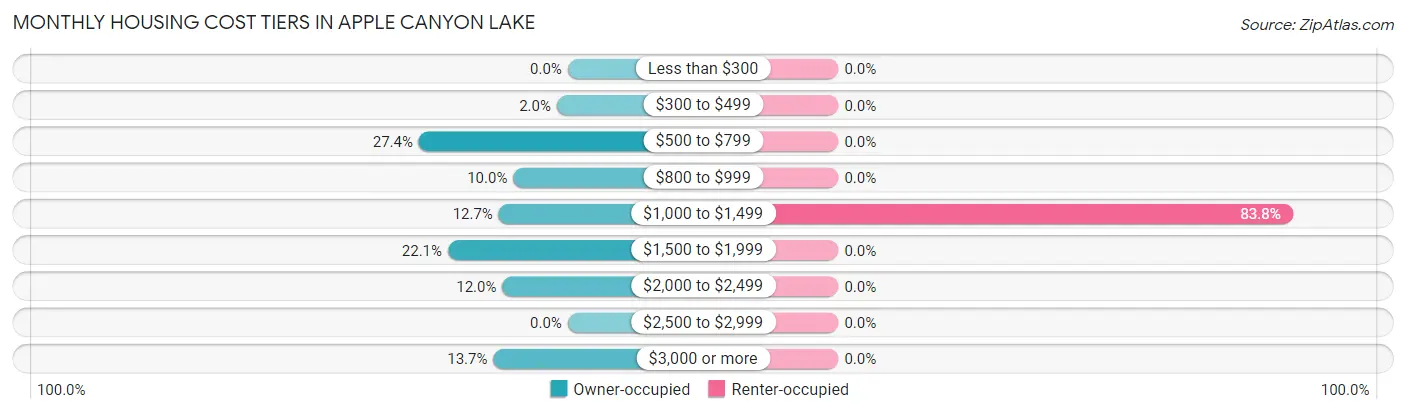
| Monthly Cost | Owner-occupied | Renter-occupied |
| Less than $300 | 0 (0.0%) | 0 (0.0%) |
| $300 to $499 | 6 (2.0%) | 0 (0.0%) |
| $500 to $799 | 82 (27.4%) | 0 (0.0%) |
| $800 to $999 | 30 (10.0%) | 0 (0.0%) |
| $1,000 to $1,499 | 38 (12.7%) | 31 (83.8%) |
| $1,500 to $1,999 | 66 (22.1%) | 0 (0.0%) |
| $2,000 to $2,499 | 36 (12.0%) | 0 (0.0%) |
| $2,500 to $2,999 | 0 (0.0%) | 0 (0.0%) |
| $3,000 or more | 41 (13.7%) | 0 (0.0%) |
| Total | 299 (100.0%) | 37 (100.0%) |
Physical Housing Characteristics in Apple Canyon Lake
Housing Structures in Apple Canyon Lake
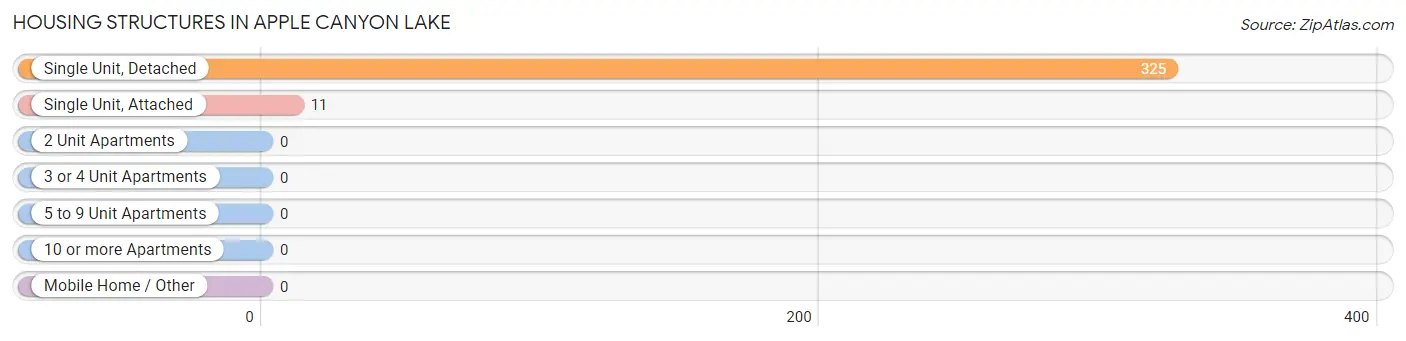
| Structure Type | # Housing Units | % Housing Units |
| Single Unit, Detached | 325 | 96.7% |
| Single Unit, Attached | 11 | 3.3% |
| 2 Unit Apartments | 0 | 0.0% |
| 3 or 4 Unit Apartments | 0 | 0.0% |
| 5 to 9 Unit Apartments | 0 | 0.0% |
| 10 or more Apartments | 0 | 0.0% |
| Mobile Home / Other | 0 | 0.0% |
| Total | 336 | 100.0% |
Housing Structures by Occupancy in Apple Canyon Lake
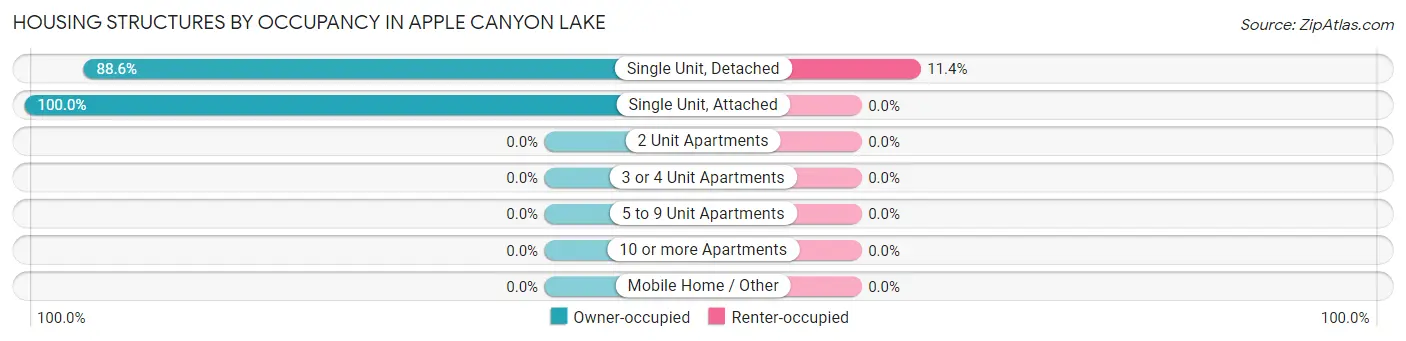
| Structure Type | Owner-occupied | Renter-occupied |
| Single Unit, Detached | 288 (88.6%) | 37 (11.4%) |
| Single Unit, Attached | 11 (100.0%) | 0 (0.0%) |
| 2 Unit Apartments | 0 (0.0%) | 0 (0.0%) |
| 3 or 4 Unit Apartments | 0 (0.0%) | 0 (0.0%) |
| 5 to 9 Unit Apartments | 0 (0.0%) | 0 (0.0%) |
| 10 or more Apartments | 0 (0.0%) | 0 (0.0%) |
| Mobile Home / Other | 0 (0.0%) | 0 (0.0%) |
| Total | 299 (89.0%) | 37 (11.0%) |
Housing Structures by Number of Rooms in Apple Canyon Lake
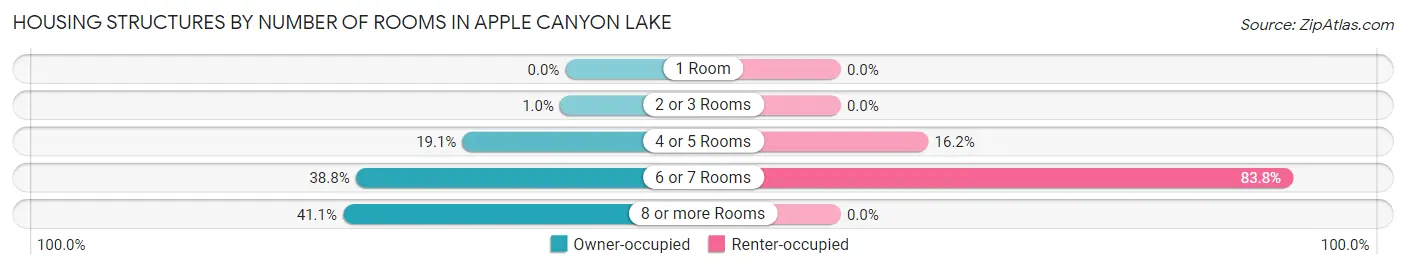
| Number of Rooms | Owner-occupied | Renter-occupied |
| 1 Room | 0 (0.0%) | 0 (0.0%) |
| 2 or 3 Rooms | 3 (1.0%) | 0 (0.0%) |
| 4 or 5 Rooms | 57 (19.1%) | 6 (16.2%) |
| 6 or 7 Rooms | 116 (38.8%) | 31 (83.8%) |
| 8 or more Rooms | 123 (41.1%) | 0 (0.0%) |
| Total | 299 (100.0%) | 37 (100.0%) |
Housing Structure by Heating Type in Apple Canyon Lake
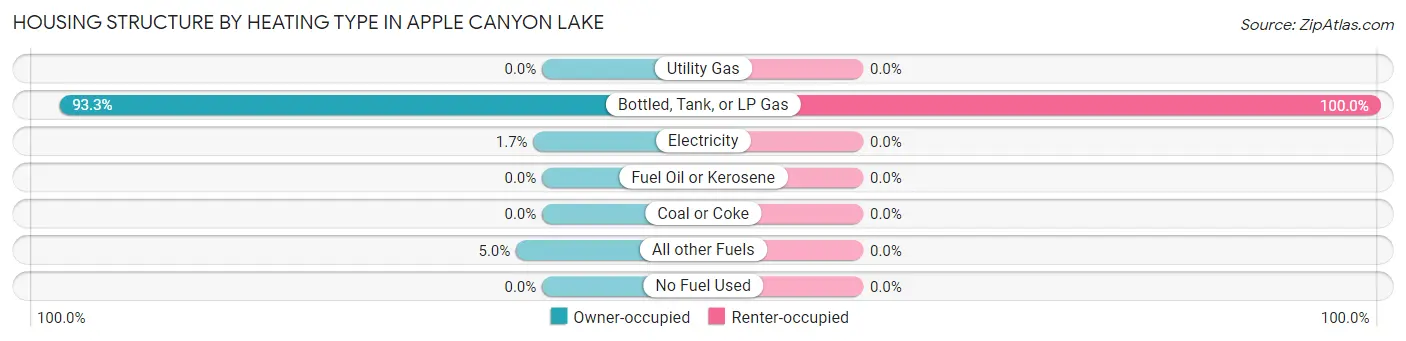
| Heating Type | Owner-occupied | Renter-occupied |
| Utility Gas | 0 (0.0%) | 0 (0.0%) |
| Bottled, Tank, or LP Gas | 279 (93.3%) | 37 (100.0%) |
| Electricity | 5 (1.7%) | 0 (0.0%) |
| Fuel Oil or Kerosene | 0 (0.0%) | 0 (0.0%) |
| Coal or Coke | 0 (0.0%) | 0 (0.0%) |
| All other Fuels | 15 (5.0%) | 0 (0.0%) |
| No Fuel Used | 0 (0.0%) | 0 (0.0%) |
| Total | 299 (100.0%) | 37 (100.0%) |
Household Vehicle Usage in Apple Canyon Lake
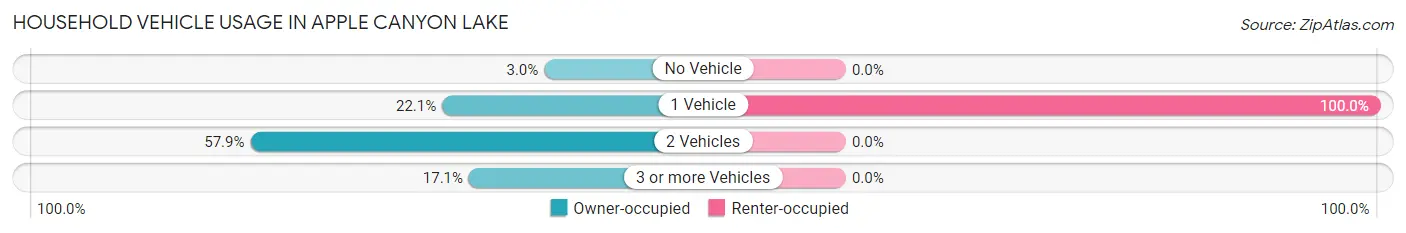
| Vehicles per Household | Owner-occupied | Renter-occupied |
| No Vehicle | 9 (3.0%) | 0 (0.0%) |
| 1 Vehicle | 66 (22.1%) | 37 (100.0%) |
| 2 Vehicles | 173 (57.9%) | 0 (0.0%) |
| 3 or more Vehicles | 51 (17.1%) | 0 (0.0%) |
| Total | 299 (100.0%) | 37 (100.0%) |
Real Estate & Mortgages in Apple Canyon Lake
Real Estate and Mortgage Overview in Apple Canyon Lake
| Characteristic | Without Mortgage | With Mortgage |
| Housing Units | 130 | 169 |
| Median Property Value | $266,700 | $325,500 |
| Median Household Income | $98,571 | $45 |
| Monthly Housing Costs | $721 | $41 |
| Real Estate Taxes | $3,821 | $0 |
Property Value by Mortgage Status in Apple Canyon Lake
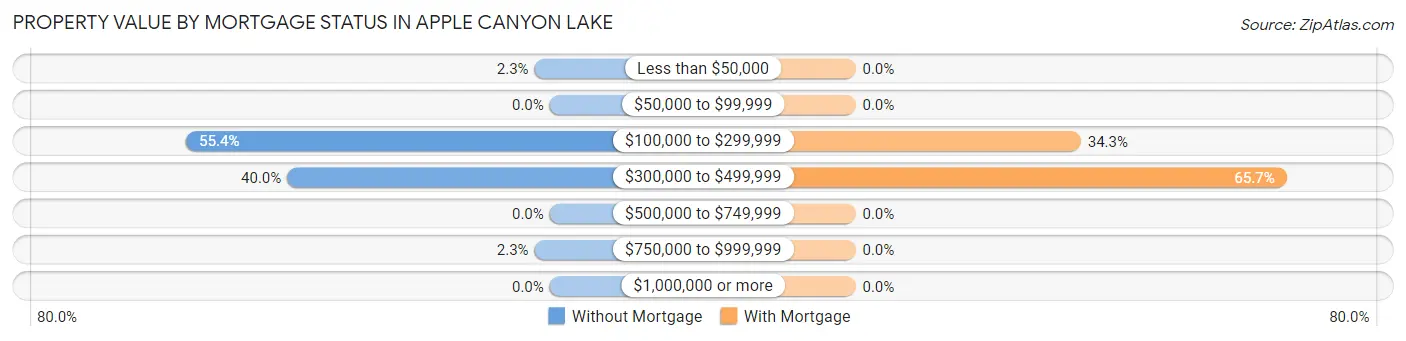
| Property Value | Without Mortgage | With Mortgage |
| Less than $50,000 | 3 (2.3%) | 0 (0.0%) |
| $50,000 to $99,999 | 0 (0.0%) | 0 (0.0%) |
| $100,000 to $299,999 | 72 (55.4%) | 58 (34.3%) |
| $300,000 to $499,999 | 52 (40.0%) | 111 (65.7%) |
| $500,000 to $749,999 | 0 (0.0%) | 0 (0.0%) |
| $750,000 to $999,999 | 3 (2.3%) | 0 (0.0%) |
| $1,000,000 or more | 0 (0.0%) | 0 (0.0%) |
| Total | 130 (100.0%) | 169 (100.0%) |
Household Income by Mortgage Status in Apple Canyon Lake
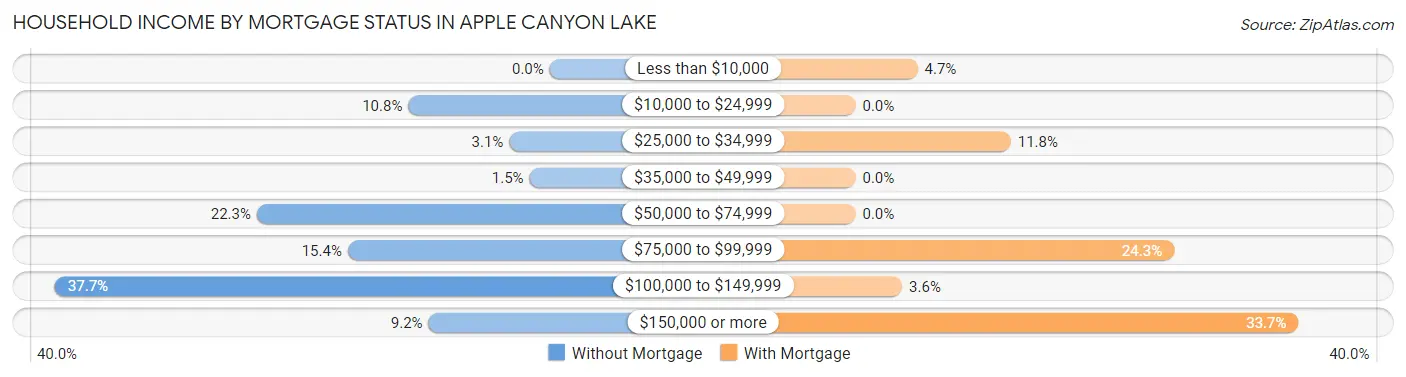
| Household Income | Without Mortgage | With Mortgage |
| Less than $10,000 | 0 (0.0%) | 8 (4.7%) |
| $10,000 to $24,999 | 14 (10.8%) | 0 (0.0%) |
| $25,000 to $34,999 | 4 (3.1%) | 20 (11.8%) |
| $35,000 to $49,999 | 2 (1.5%) | 0 (0.0%) |
| $50,000 to $74,999 | 29 (22.3%) | 0 (0.0%) |
| $75,000 to $99,999 | 20 (15.4%) | 41 (24.3%) |
| $100,000 to $149,999 | 49 (37.7%) | 6 (3.5%) |
| $150,000 or more | 12 (9.2%) | 57 (33.7%) |
| Total | 130 (100.0%) | 169 (100.0%) |
Property Value to Household Income Ratio in Apple Canyon Lake
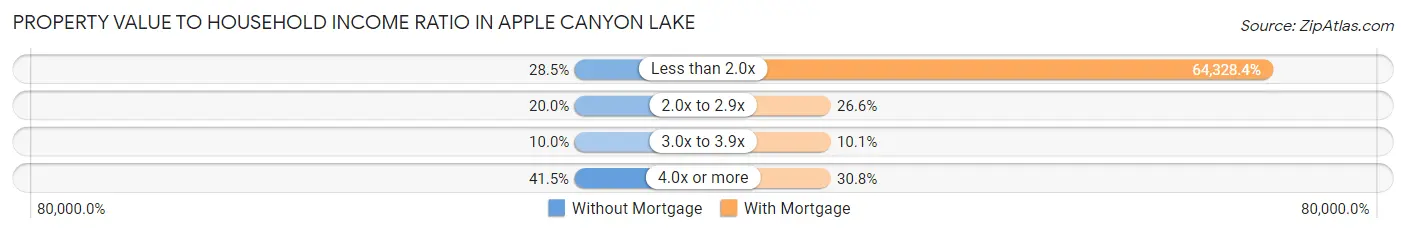
| Value-to-Income Ratio | Without Mortgage | With Mortgage |
| Less than 2.0x | 37 (28.5%) | 108,715 (64,328.4%) |
| 2.0x to 2.9x | 26 (20.0%) | 45 (26.6%) |
| 3.0x to 3.9x | 13 (10.0%) | 17 (10.1%) |
| 4.0x or more | 54 (41.5%) | 52 (30.8%) |
| Total | 130 (100.0%) | 169 (100.0%) |
Real Estate Taxes by Mortgage Status in Apple Canyon Lake
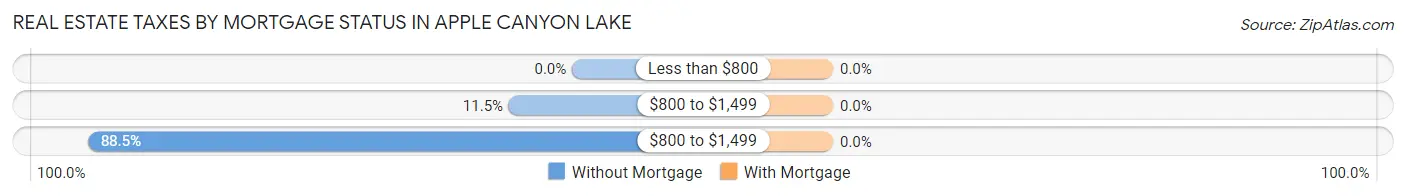
| Property Taxes | Without Mortgage | With Mortgage |
| Less than $800 | 0 (0.0%) | 0 (0.0%) |
| $800 to $1,499 | 15 (11.5%) | 0 (0.0%) |
| $800 to $1,499 | 115 (88.5%) | 0 (0.0%) |
| Total | 130 (100.0%) | 169 (100.0%) |
Health & Disability in Apple Canyon Lake
Health Insurance Coverage by Age in Apple Canyon Lake
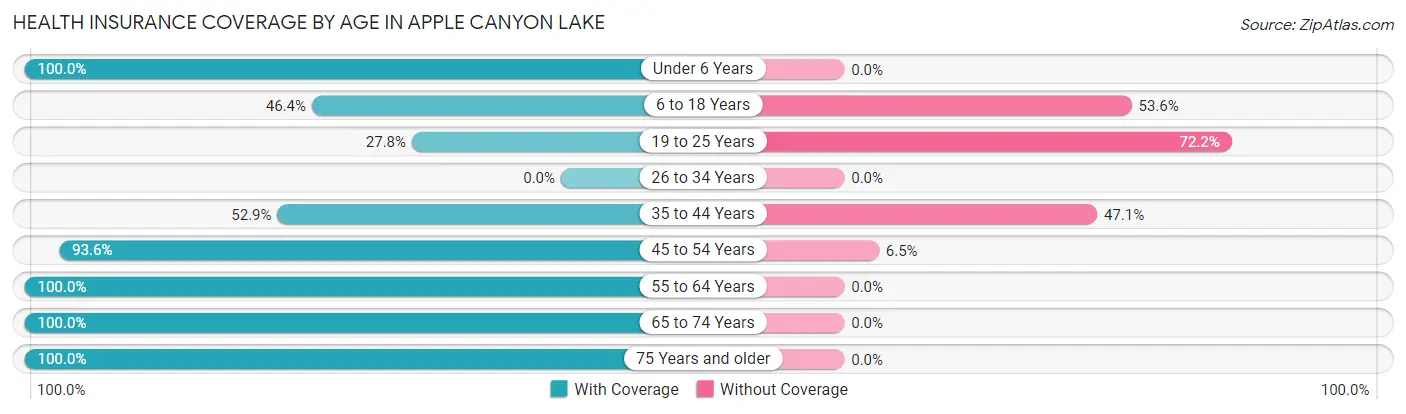
| Age Bracket | With Coverage | Without Coverage |
| Under 6 Years | 4 (100.0%) | 0 (0.0%) |
| 6 to 18 Years | 52 (46.4%) | 60 (53.6%) |
| 19 to 25 Years | 10 (27.8%) | 26 (72.2%) |
| 26 to 34 Years | 0 (0.0%) | 0 (0.0%) |
| 35 to 44 Years | 37 (52.9%) | 33 (47.1%) |
| 45 to 54 Years | 87 (93.5%) | 6 (6.5%) |
| 55 to 64 Years | 130 (100.0%) | 0 (0.0%) |
| 65 to 74 Years | 118 (100.0%) | 0 (0.0%) |
| 75 Years and older | 141 (100.0%) | 0 (0.0%) |
| Total | 579 (82.2%) | 125 (17.8%) |
Health Insurance Coverage by Citizenship Status in Apple Canyon Lake
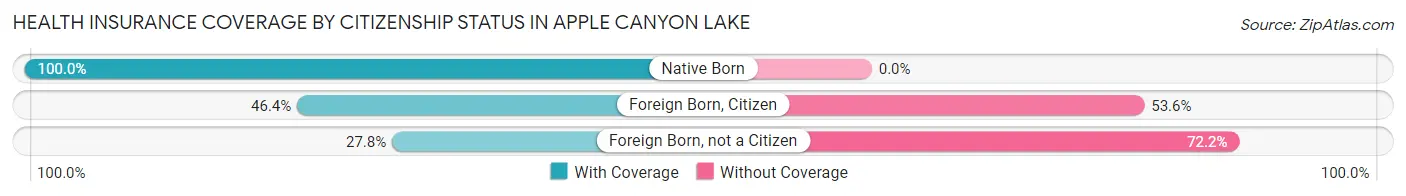
| Citizenship Status | With Coverage | Without Coverage |
| Native Born | 4 (100.0%) | 0 (0.0%) |
| Foreign Born, Citizen | 52 (46.4%) | 60 (53.6%) |
| Foreign Born, not a Citizen | 10 (27.8%) | 26 (72.2%) |
Health Insurance Coverage by Household Income in Apple Canyon Lake
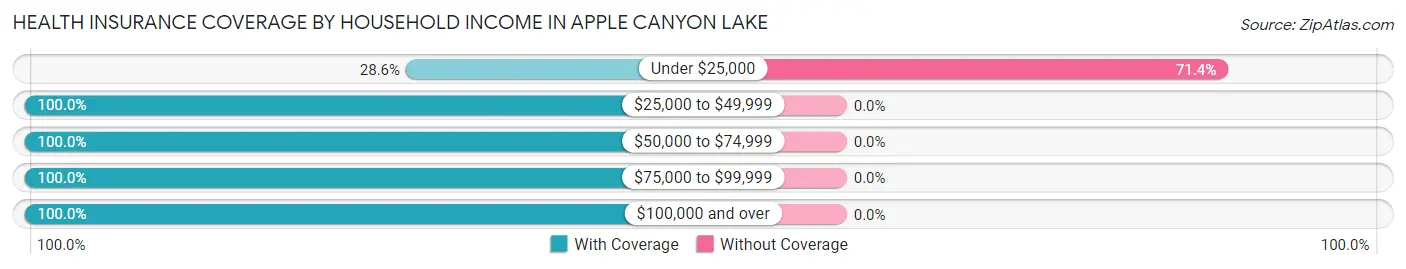
| Household Income | With Coverage | Without Coverage |
| Under $25,000 | 50 (28.6%) | 125 (71.4%) |
| $25,000 to $49,999 | 6 (100.0%) | 0 (0.0%) |
| $50,000 to $74,999 | 154 (100.0%) | 0 (0.0%) |
| $75,000 to $99,999 | 51 (100.0%) | 0 (0.0%) |
| $100,000 and over | 318 (100.0%) | 0 (0.0%) |
Public vs Private Health Insurance Coverage by Age in Apple Canyon Lake
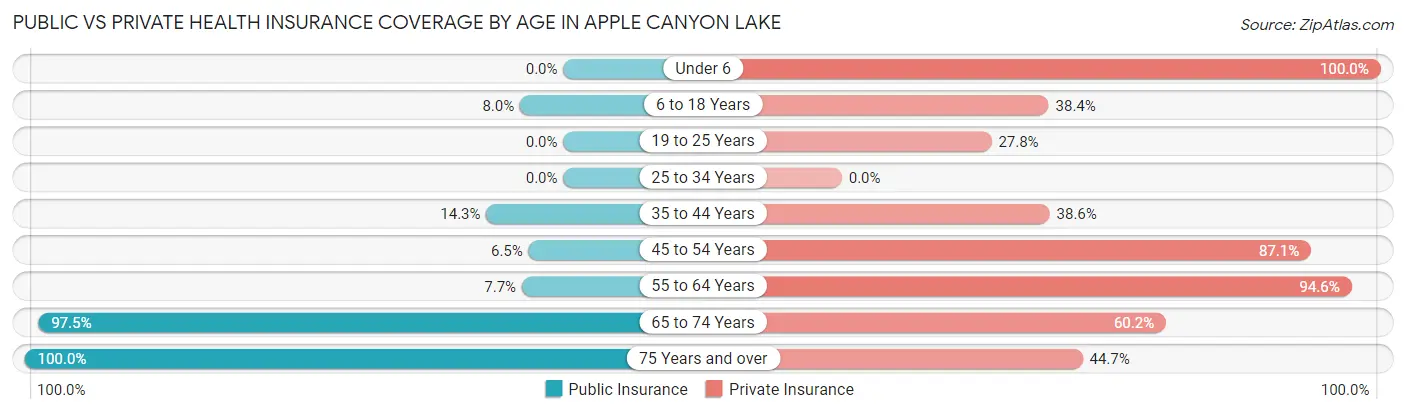
| Age Bracket | Public Insurance | Private Insurance |
| Under 6 | 0 (0.0%) | 4 (100.0%) |
| 6 to 18 Years | 9 (8.0%) | 43 (38.4%) |
| 19 to 25 Years | 0 (0.0%) | 10 (27.8%) |
| 25 to 34 Years | 0 (0.0%) | 0 (0.0%) |
| 35 to 44 Years | 10 (14.3%) | 27 (38.6%) |
| 45 to 54 Years | 6 (6.5%) | 81 (87.1%) |
| 55 to 64 Years | 10 (7.7%) | 123 (94.6%) |
| 65 to 74 Years | 115 (97.5%) | 71 (60.2%) |
| 75 Years and over | 141 (100.0%) | 63 (44.7%) |
| Total | 291 (41.3%) | 422 (59.9%) |
Disability Status by Sex by Age in Apple Canyon Lake
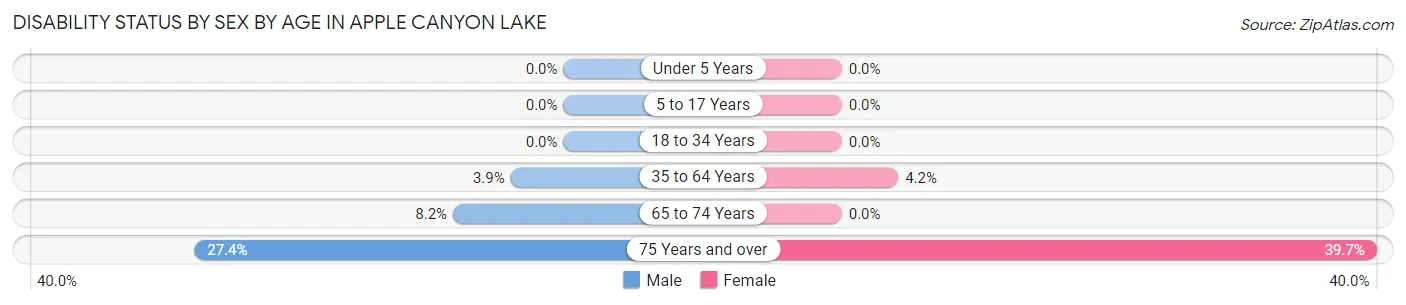
| Age Bracket | Male | Female |
| Under 5 Years | 0 (0.0%) | 0 (0.0%) |
| 5 to 17 Years | 0 (0.0%) | 0 (0.0%) |
| 18 to 34 Years | 0 (0.0%) | 0 (0.0%) |
| 35 to 64 Years | 4 (3.9%) | 8 (4.2%) |
| 65 to 74 Years | 5 (8.2%) | 0 (0.0%) |
| 75 Years and over | 20 (27.4%) | 27 (39.7%) |
Disability Class by Sex by Age in Apple Canyon Lake
Disability Class: Hearing Difficulty
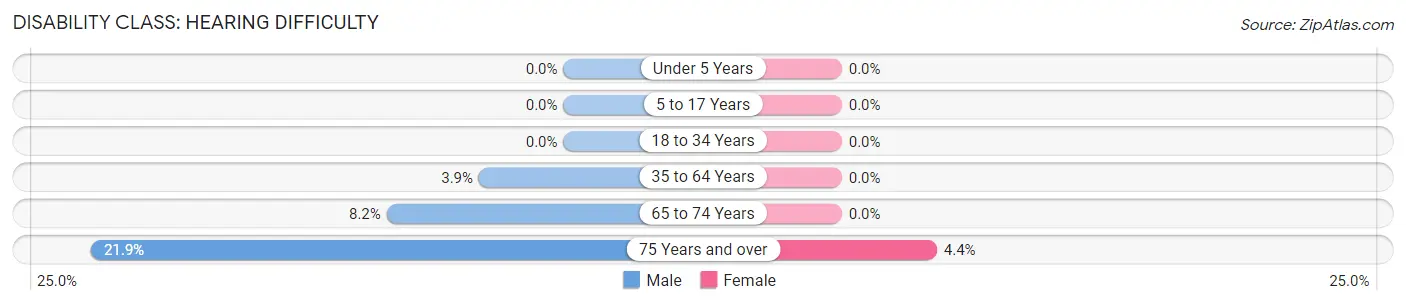
| Age Bracket | Male | Female |
| Under 5 Years | 0 (0.0%) | 0 (0.0%) |
| 5 to 17 Years | 0 (0.0%) | 0 (0.0%) |
| 18 to 34 Years | 0 (0.0%) | 0 (0.0%) |
| 35 to 64 Years | 4 (3.9%) | 0 (0.0%) |
| 65 to 74 Years | 5 (8.2%) | 0 (0.0%) |
| 75 Years and over | 16 (21.9%) | 3 (4.4%) |
Disability Class: Vision Difficulty
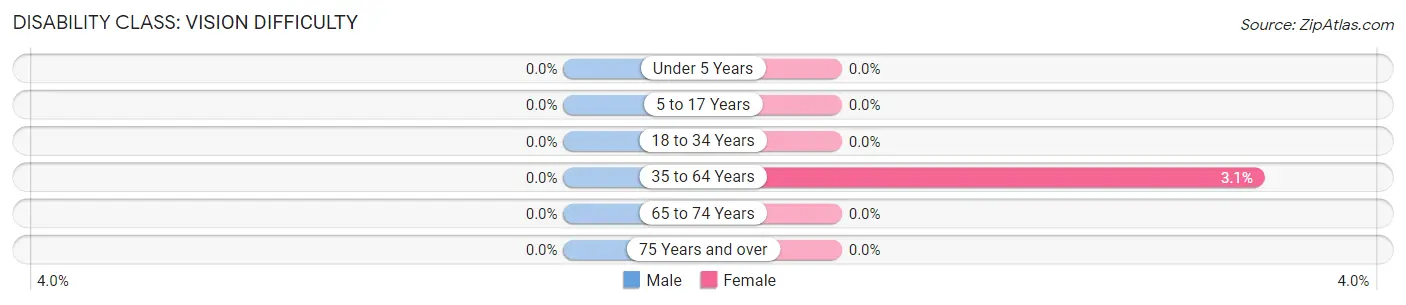
| Age Bracket | Male | Female |
| Under 5 Years | 0 (0.0%) | 0 (0.0%) |
| 5 to 17 Years | 0 (0.0%) | 0 (0.0%) |
| 18 to 34 Years | 0 (0.0%) | 0 (0.0%) |
| 35 to 64 Years | 0 (0.0%) | 6 (3.1%) |
| 65 to 74 Years | 0 (0.0%) | 0 (0.0%) |
| 75 Years and over | 0 (0.0%) | 0 (0.0%) |
Disability Class: Cognitive Difficulty
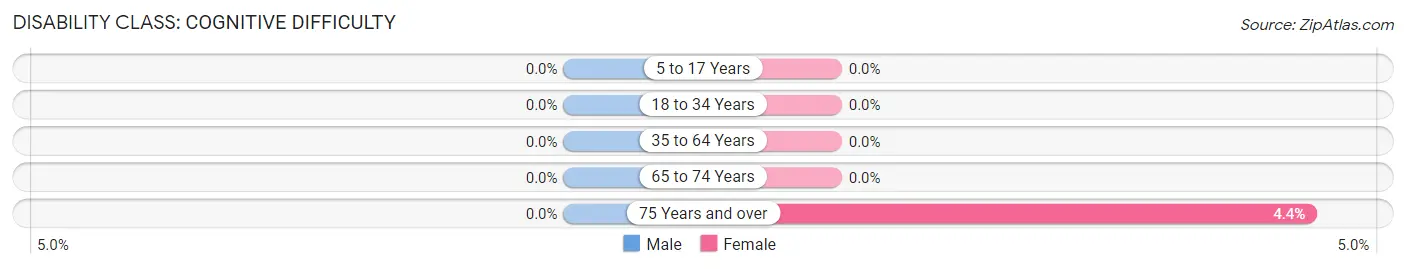
| Age Bracket | Male | Female |
| 5 to 17 Years | 0 (0.0%) | 0 (0.0%) |
| 18 to 34 Years | 0 (0.0%) | 0 (0.0%) |
| 35 to 64 Years | 0 (0.0%) | 0 (0.0%) |
| 65 to 74 Years | 0 (0.0%) | 0 (0.0%) |
| 75 Years and over | 0 (0.0%) | 3 (4.4%) |
Disability Class: Ambulatory Difficulty
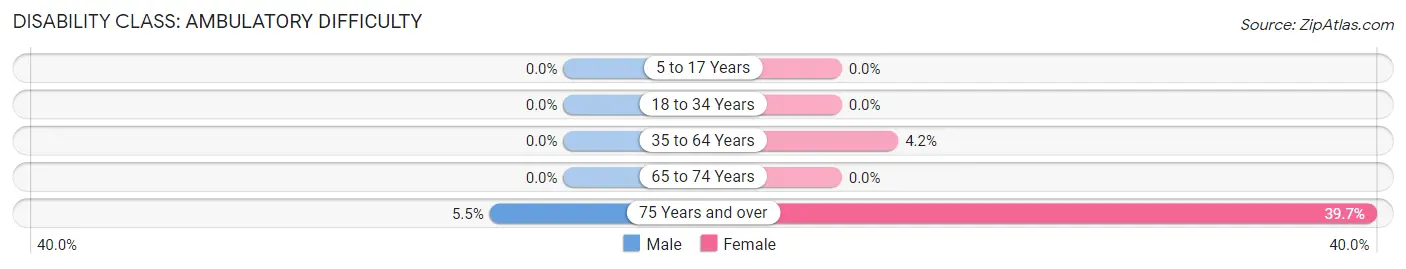
| Age Bracket | Male | Female |
| 5 to 17 Years | 0 (0.0%) | 0 (0.0%) |
| 18 to 34 Years | 0 (0.0%) | 0 (0.0%) |
| 35 to 64 Years | 0 (0.0%) | 8 (4.2%) |
| 65 to 74 Years | 0 (0.0%) | 0 (0.0%) |
| 75 Years and over | 4 (5.5%) | 27 (39.7%) |
Disability Class: Self-Care Difficulty
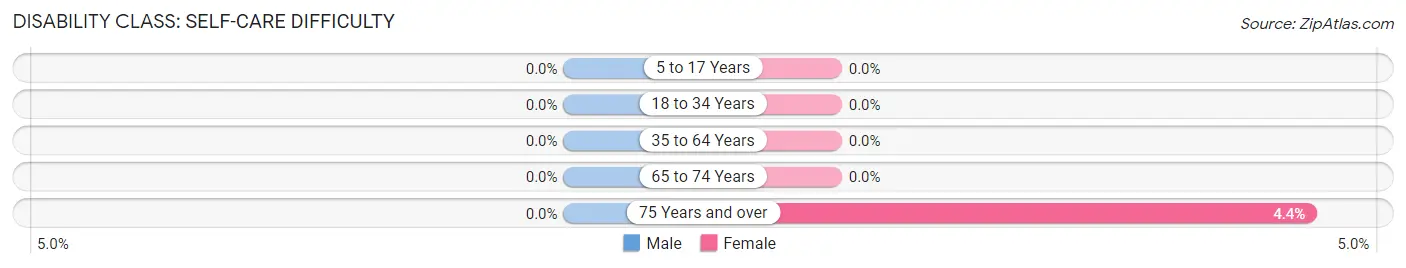
| Age Bracket | Male | Female |
| 5 to 17 Years | 0 (0.0%) | 0 (0.0%) |
| 18 to 34 Years | 0 (0.0%) | 0 (0.0%) |
| 35 to 64 Years | 0 (0.0%) | 0 (0.0%) |
| 65 to 74 Years | 0 (0.0%) | 0 (0.0%) |
| 75 Years and over | 0 (0.0%) | 3 (4.4%) |
Technology Access in Apple Canyon Lake
Computing Device Access in Apple Canyon Lake
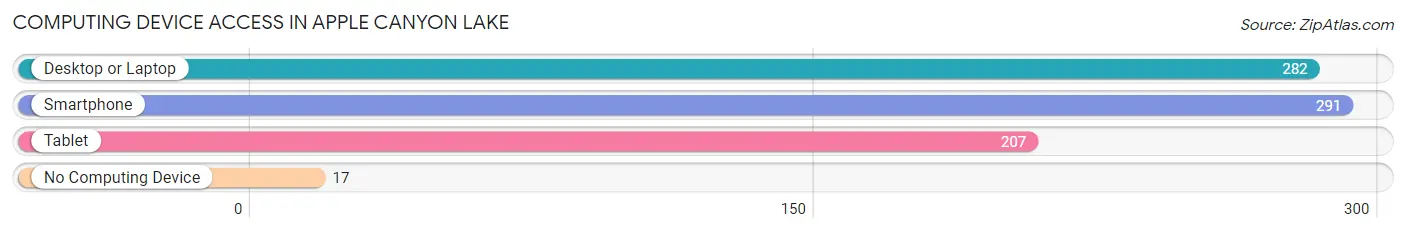
| Device Type | # Households | % Households |
| Desktop or Laptop | 282 | 83.9% |
| Smartphone | 291 | 86.6% |
| Tablet | 207 | 61.6% |
| No Computing Device | 17 | 5.1% |
| Total | 336 | 100.0% |
Internet Access in Apple Canyon Lake
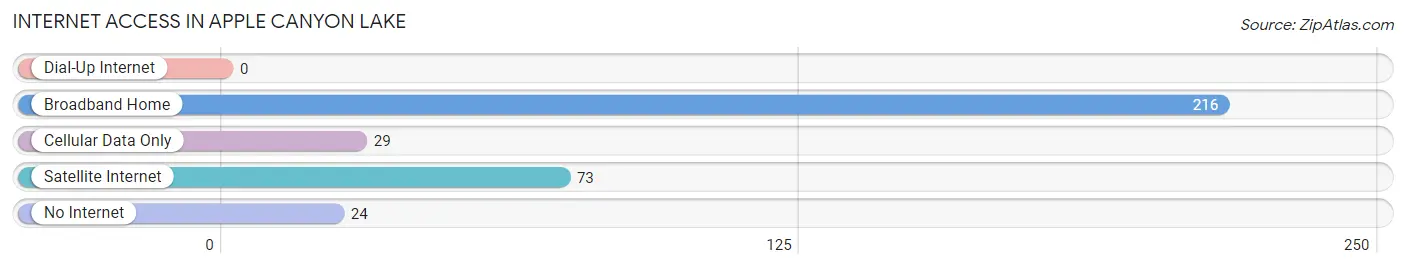
| Internet Type | # Households | % Households |
| Dial-Up Internet | 0 | 0.0% |
| Broadband Home | 216 | 64.3% |
| Cellular Data Only | 29 | 8.6% |
| Satellite Internet | 73 | 21.7% |
| No Internet | 24 | 7.1% |
| Total | 336 | 100.0% |
Apple Canyon Lake Summary
Apple Canyon Lake, IL is a small unincorporated community located in Jo Daviess County, Illinois. It is situated in the northwest corner of the state, approximately 25 miles east of Dubuque, Iowa and 25 miles west of Galena, Illinois. The community is located on the shores of Apple Canyon Lake, a man-made lake created in the 1950s. The lake is the centerpiece of the Apple Canyon Lake community, providing recreational activities such as fishing, boating, and swimming.
History
Apple Canyon Lake was first settled in the late 1800s by German immigrants. The area was originally known as Apple Creek, named after the nearby creek. In the 1950s, the Apple Creek area was developed into a recreational lake and the community was renamed Apple Canyon Lake. The lake was created by damming Apple Creek and was designed to provide recreational activities for the local residents.
The Apple Canyon Lake community was officially incorporated in 1959. The community was designed to be a self-contained resort community, with a variety of amenities such as a golf course, tennis courts, and a marina. The community also had its own post office, which opened in 1960.
Geography
Apple Canyon Lake is located in the northwest corner of Illinois, approximately 25 miles east of Dubuque, Iowa and 25 miles west of Galena, Illinois. The community is situated on the shores of Apple Canyon Lake, a man-made lake created in the 1950s. The lake is approximately 1,000 acres in size and is the centerpiece of the Apple Canyon Lake community.
The Apple Canyon Lake area is located in the Driftless Area of Illinois, which is characterized by rolling hills and valleys. The area is also home to a variety of wildlife, including deer, turkey, and a variety of waterfowl.
Economy
The economy of Apple Canyon Lake is largely based on tourism and recreation. The lake is the centerpiece of the community and provides a variety of recreational activities such as fishing, boating, and swimming. The community also has a golf course, tennis courts, and a marina.
The Apple Canyon Lake area is also home to a variety of small businesses, including restaurants, convenience stores, and other retail establishments. The community also has a post office, which opened in 1960.
Demographics
As of the 2010 census, the population of Apple Canyon Lake was 1,072. The racial makeup of the community was 97.3% White, 0.7% African American, 0.2% Native American, 0.2% Asian, 0.2% from other races, and 1.4% from two or more races. Hispanic or Latino of any race were 1.2% of the population.
The median household income in Apple Canyon Lake was $50,000, and the median family income was $54,000. The per capita income for the community was $25,000. Approximately 8.3% of the population was below the poverty line.
Common Questions
What is Per Capita Income in Apple Canyon Lake?
Per Capita income in Apple Canyon Lake is $48,858.
What is the Median Family Income in Apple Canyon Lake?
Median Family Income in Apple Canyon Lake is $107,878.
What is the Median Household income in Apple Canyon Lake?
Median Household Income in Apple Canyon Lake is $98,214.
What is Income or Wage Gap in Apple Canyon Lake?
Income or Wage Gap in Apple Canyon Lake is 62.6%.
Women in Apple Canyon Lake earn 37.4 cents for every dollar earned by a man.
What is Inequality or Gini Index in Apple Canyon Lake?
Inequality or Gini Index in Apple Canyon Lake is 0.38.
What is the Total Population of Apple Canyon Lake?
Total Population of Apple Canyon Lake is 704.
What is the Total Male Population of Apple Canyon Lake?
Total Male Population of Apple Canyon Lake is 296.
What is the Total Female Population of Apple Canyon Lake?
Total Female Population of Apple Canyon Lake is 408.
What is the Ratio of Males per 100 Females in Apple Canyon Lake?
There are 72.55 Males per 100 Females in Apple Canyon Lake.
What is the Ratio of Females per 100 Males in Apple Canyon Lake?
There are 137.84 Females per 100 Males in Apple Canyon Lake.
What is the Median Population Age in Apple Canyon Lake?
Median Population Age in Apple Canyon Lake is 59.1 Years.
What is the Average Family Size in Apple Canyon Lake
Average Family Size in Apple Canyon Lake is 2.4 People.
What is the Average Household Size in Apple Canyon Lake
Average Household Size in Apple Canyon Lake is 2.1 People.
How Large is the Labor Force in Apple Canyon Lake?
There are 229 People in the Labor Forcein in Apple Canyon Lake.
What is the Percentage of People in the Labor Force in Apple Canyon Lake?
35.3% of People are in the Labor Force in Apple Canyon Lake.