Lake Camelot, IL Map & Demographics
Lake Camelot Map
Lake Camelot Overview
$47,322
PER CAPITA INCOME
$117,303
AVG FAMILY INCOME
$138,043
AVG HOUSEHOLD INCOME
42.8%
WAGE / INCOME GAP [ % ]
57.2¢/ $1
WAGE / INCOME GAP [ $ ]
0.23
INEQUALITY / GINI INDEX
1,565
TOTAL POPULATION
810
MALE POPULATION
755
FEMALE POPULATION
107.28
MALES / 100 FEMALES
93.21
FEMALES / 100 MALES
40.1
MEDIAN AGE
3.0
AVG FAMILY SIZE
2.8
AVG HOUSEHOLD SIZE
751
LABOR FORCE [ PEOPLE ]
66.4%
PERCENT IN LABOR FORCE
2.1%
UNEMPLOYMENT RATE
Income in Lake Camelot
Income Overview in Lake Camelot
Per Capita Income in Lake Camelot is $47,322, while median incomes of families and households are $117,303 and $138,043 respectively.
| Characteristic | Number | Measure |
| Per Capita Income | 1,565 | $47,322 |
| Median Family Income | 463 | $117,303 |
| Mean Family Income | 463 | $127,332 |
| Median Household Income | 564 | $138,043 |
| Mean Household Income | 564 | $137,789 |
| Income Deficit | 463 | $0 |
| Wage / Income Gap (%) | 1,565 | 42.82% |
| Wage / Income Gap ($) | 1,565 | 57.18¢ per $1 |
| Gini / Inequality Index | 1,565 | 0.23 |
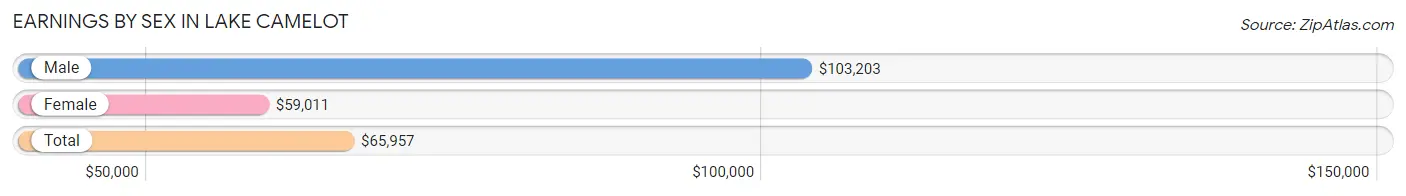
Earnings by Sex in Lake Camelot
Average Earnings in Lake Camelot are $65,957, $103,203 for men and $59,011 for women, a difference of 42.8%.
| Sex | Number | Average Earnings |
| Male | 378 (49.4%) | $103,203 |
| Female | 387 (50.6%) | $59,011 |
| Total | 765 (100.0%) | $65,957 |
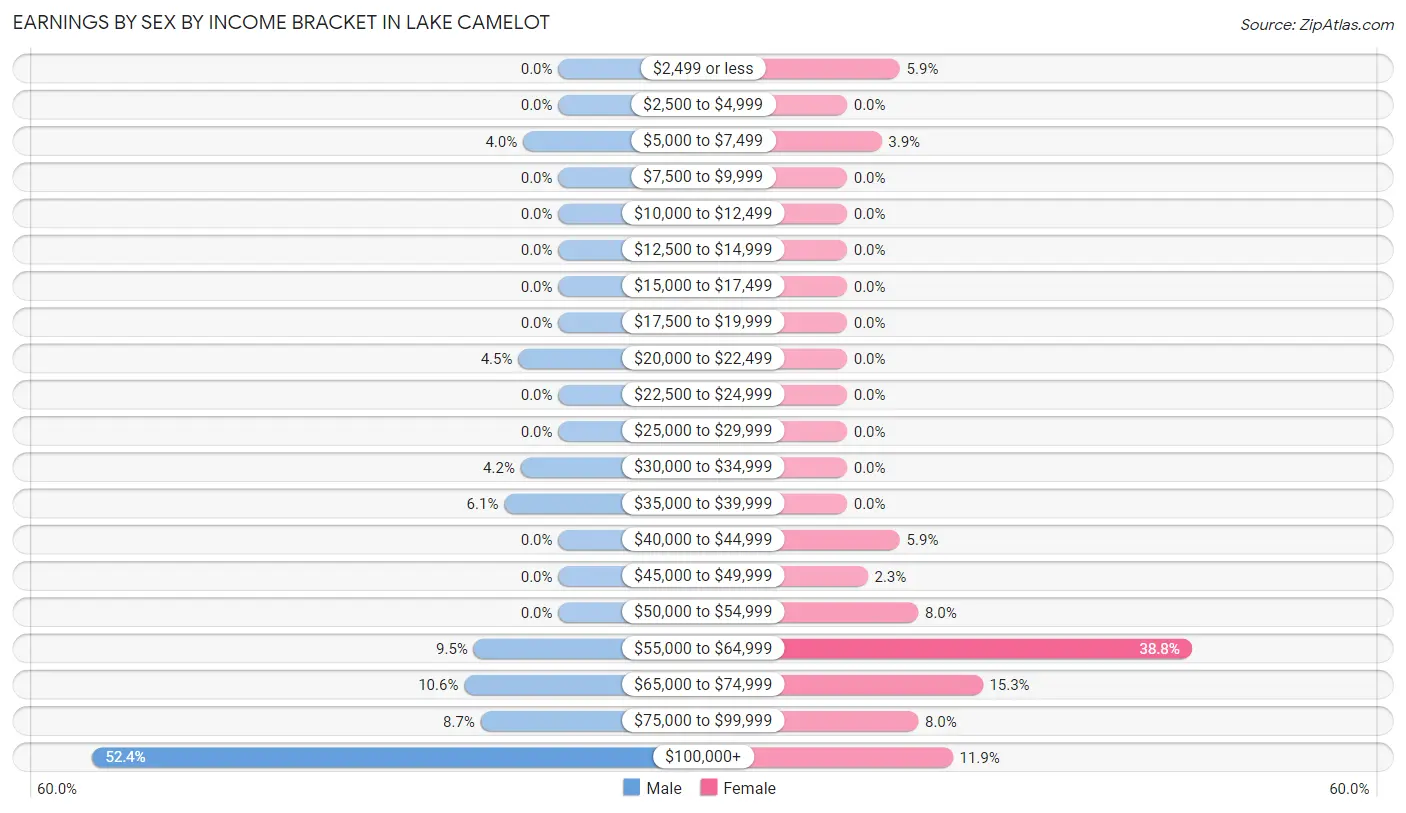
Earnings by Sex by Income Bracket in Lake Camelot
The most common earnings brackets in Lake Camelot are $100,000+ for men (198 | 52.4%) and $55,000 to $64,999 for women (150 | 38.8%).
| Income | Male | Female |
| $2,499 or less | 0 (0.0%) | 23 (5.9%) |
| $2,500 to $4,999 | 0 (0.0%) | 0 (0.0%) |
| $5,000 to $7,499 | 15 (4.0%) | 15 (3.9%) |
| $7,500 to $9,999 | 0 (0.0%) | 0 (0.0%) |
| $10,000 to $12,499 | 0 (0.0%) | 0 (0.0%) |
| $12,500 to $14,999 | 0 (0.0%) | 0 (0.0%) |
| $15,000 to $17,499 | 0 (0.0%) | 0 (0.0%) |
| $17,500 to $19,999 | 0 (0.0%) | 0 (0.0%) |
| $20,000 to $22,499 | 17 (4.5%) | 0 (0.0%) |
| $22,500 to $24,999 | 0 (0.0%) | 0 (0.0%) |
| $25,000 to $29,999 | 0 (0.0%) | 0 (0.0%) |
| $30,000 to $34,999 | 16 (4.2%) | 0 (0.0%) |
| $35,000 to $39,999 | 23 (6.1%) | 0 (0.0%) |
| $40,000 to $44,999 | 0 (0.0%) | 23 (5.9%) |
| $45,000 to $49,999 | 0 (0.0%) | 9 (2.3%) |
| $50,000 to $54,999 | 0 (0.0%) | 31 (8.0%) |
| $55,000 to $64,999 | 36 (9.5%) | 150 (38.8%) |
| $65,000 to $74,999 | 40 (10.6%) | 59 (15.2%) |
| $75,000 to $99,999 | 33 (8.7%) | 31 (8.0%) |
| $100,000+ | 198 (52.4%) | 46 (11.9%) |
| Total | 378 (100.0%) | 387 (100.0%) |
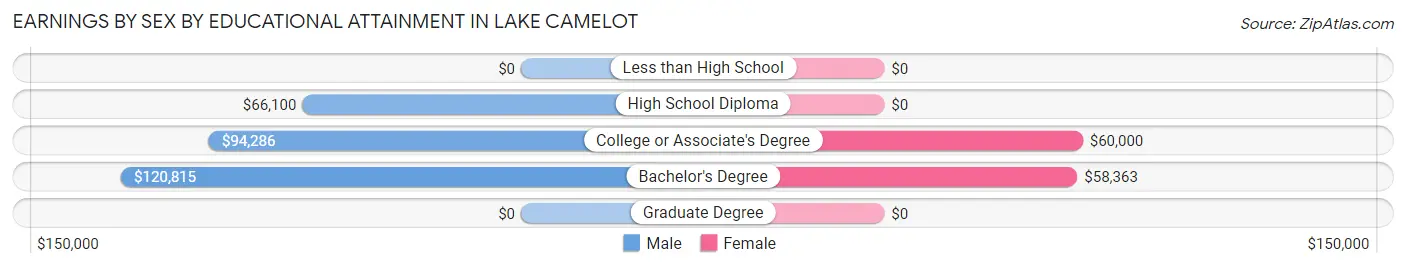
Earnings by Sex by Educational Attainment in Lake Camelot
Average earnings in Lake Camelot are $104,492 for men and $59,193 for women, a difference of 43.3%. Men with an educational attainment of bachelor's degree enjoy the highest average annual earnings of $120,815, while those with high school diploma education earn the least with $66,100. Women with an educational attainment of college or associate's degree earn the most with the average annual earnings of $60,000, while those with bachelor's degree education have the smallest earnings of $58,363.
| Educational Attainment | Male Income | Female Income |
| Less than High School | - | - |
| High School Diploma | $66,100 | $0 |
| College or Associate's Degree | $94,286 | $60,000 |
| Bachelor's Degree | $120,815 | $58,363 |
| Graduate Degree | - | - |
| Total | $104,492 | $59,193 |
Family Income in Lake Camelot
Family Income Brackets in Lake Camelot
According to the Lake Camelot family income data, there are 143 families falling into the $100,000 to $149,999 income range, which is the most common income bracket and makes up 30.9% of all families.
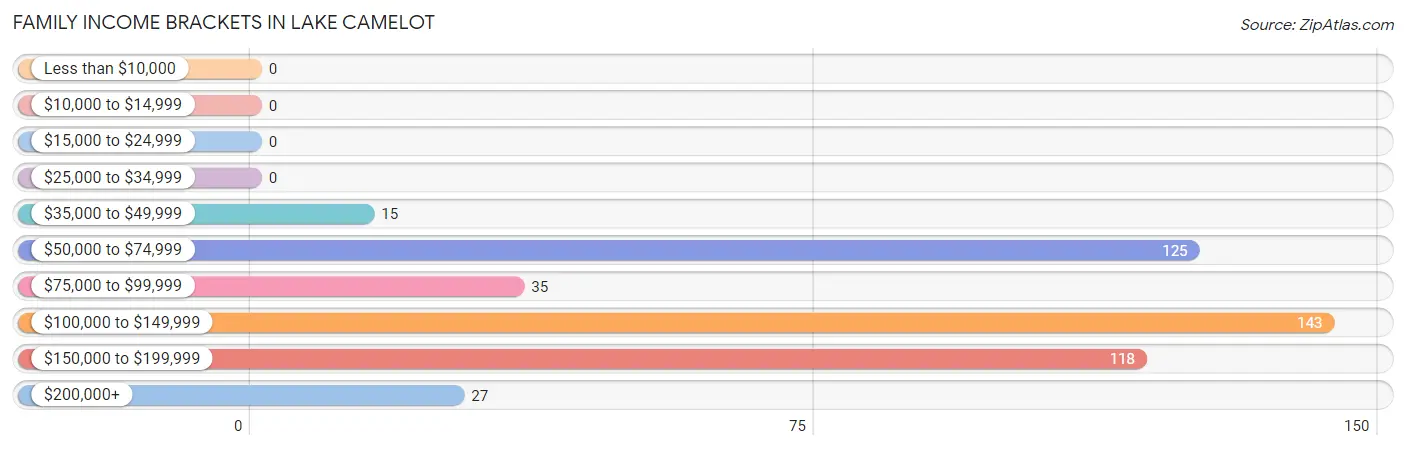
| Income Bracket | # Families | % Families |
| Less than $10,000 | 0 | 0.0% |
| $10,000 to $14,999 | 0 | 0.0% |
| $15,000 to $24,999 | 0 | 0.0% |
| $25,000 to $34,999 | 0 | 0.0% |
| $35,000 to $49,999 | 15 | 3.2% |
| $50,000 to $74,999 | 125 | 27.0% |
| $75,000 to $99,999 | 35 | 7.6% |
| $100,000 to $149,999 | 143 | 30.9% |
| $150,000 to $199,999 | 118 | 25.5% |
| $200,000+ | 27 | 5.8% |
Family Income by Famaliy Size in Lake Camelot
4-person families (137 | 29.6%) account for the highest median family income in Lake Camelot with $178,086 per family, while 4-person families (137 | 29.6%) have the highest median income of $44,522 per family member.
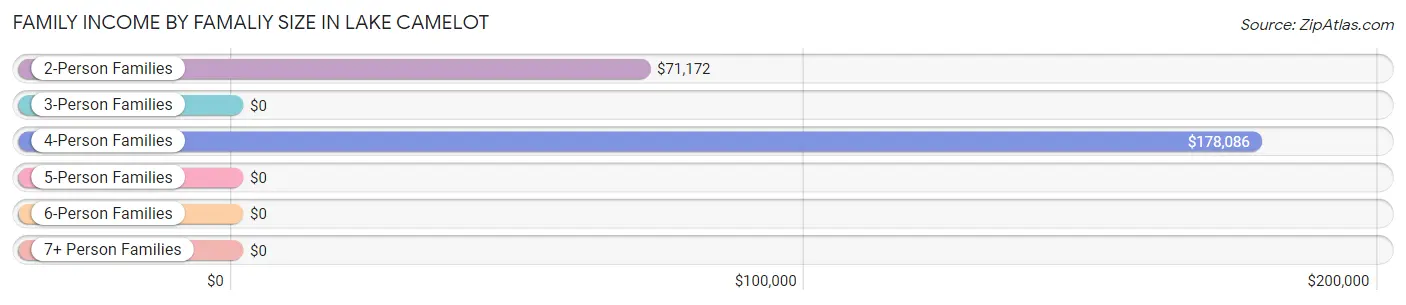
| Income Bracket | # Families | Median Income |
| 2-Person Families | 213 (46.0%) | $71,172 |
| 3-Person Families | 78 (16.9%) | $0 |
| 4-Person Families | 137 (29.6%) | $178,086 |
| 5-Person Families | 18 (3.9%) | $0 |
| 6-Person Families | 17 (3.7%) | $0 |
| 7+ Person Families | 0 (0.0%) | $0 |
| Total | 463 (100.0%) | $117,303 |
Family Income by Number of Earners in Lake Camelot
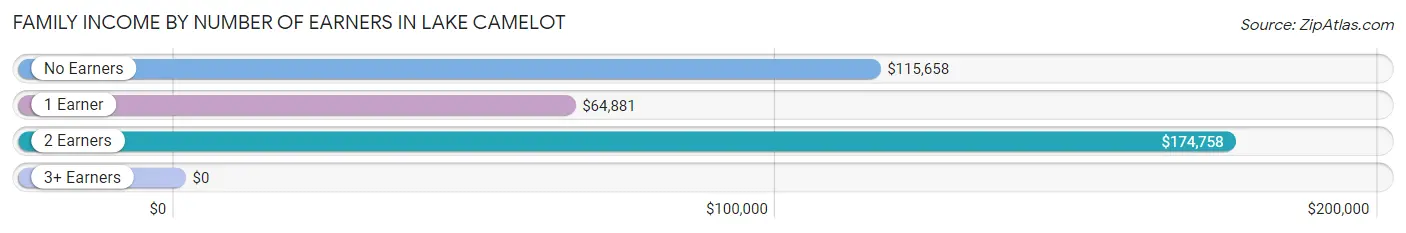
| Number of Earners | # Families | Median Income |
| No Earners | 72 (15.5%) | $115,658 |
| 1 Earner | 160 (34.6%) | $64,881 |
| 2 Earners | 198 (42.8%) | $174,758 |
| 3+ Earners | 33 (7.1%) | $0 |
| Total | 463 (100.0%) | $117,303 |
Household Income in Lake Camelot
Household Income Brackets in Lake Camelot
With 202 households falling in the category, the $150,000 to $199,999 income range is the most frequent in Lake Camelot, accounting for 35.8% of all households.
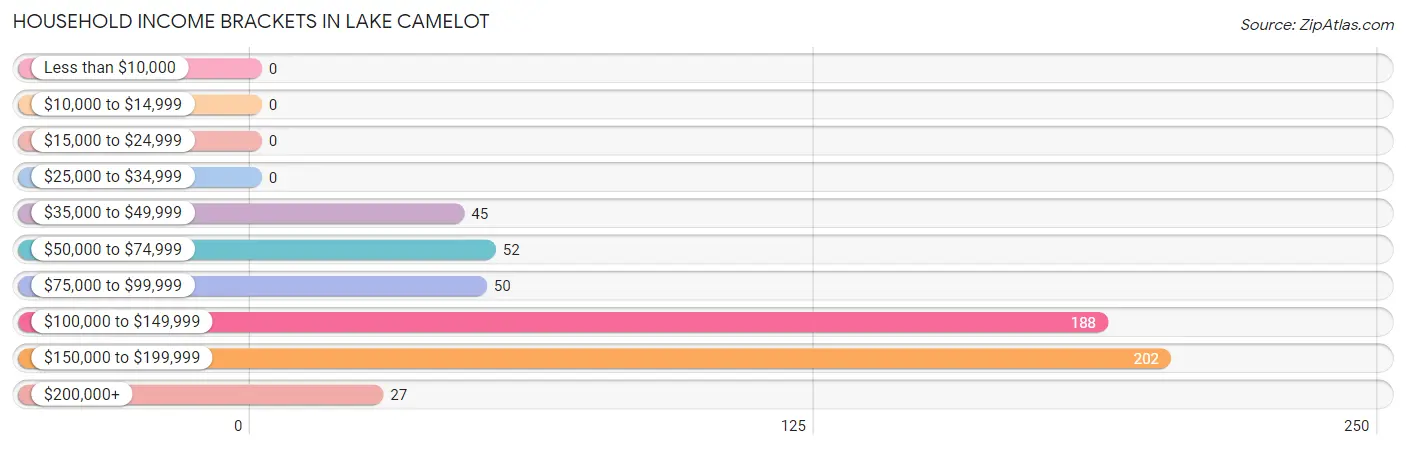
| Income Bracket | # Households | % Households |
| Less than $10,000 | 0 | 0.0% |
| $10,000 to $14,999 | 0 | 0.0% |
| $15,000 to $24,999 | 0 | 0.0% |
| $25,000 to $34,999 | 0 | 0.0% |
| $35,000 to $49,999 | 45 | 8.0% |
| $50,000 to $74,999 | 52 | 9.2% |
| $75,000 to $99,999 | 50 | 8.9% |
| $100,000 to $149,999 | 188 | 33.3% |
| $150,000 to $199,999 | 202 | 35.8% |
| $200,000+ | 27 | 4.8% |
Household Income by Householder Age in Lake Camelot
The median household income in Lake Camelot is $138,043, with the highest median household income of $179,063 found in the 25 to 44 years age bracket for the primary householder. A total of 282 households (50.0%) fall into this category.
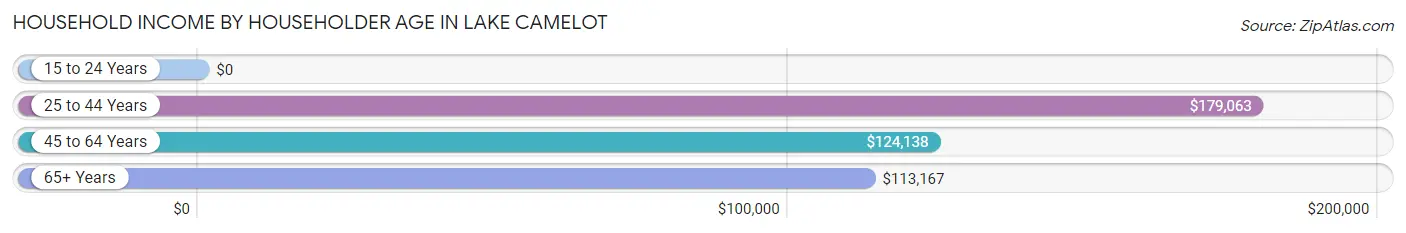
| Income Bracket | # Households | Median Income |
| 15 to 24 Years | 0 (0.0%) | $0 |
| 25 to 44 Years | 282 (50.0%) | $179,063 |
| 45 to 64 Years | 146 (25.9%) | $124,138 |
| 65+ Years | 136 (24.1%) | $113,167 |
| Total | 564 (100.0%) | $138,043 |
Poverty in Lake Camelot
Income Below Poverty by Sex and Age in Lake Camelot
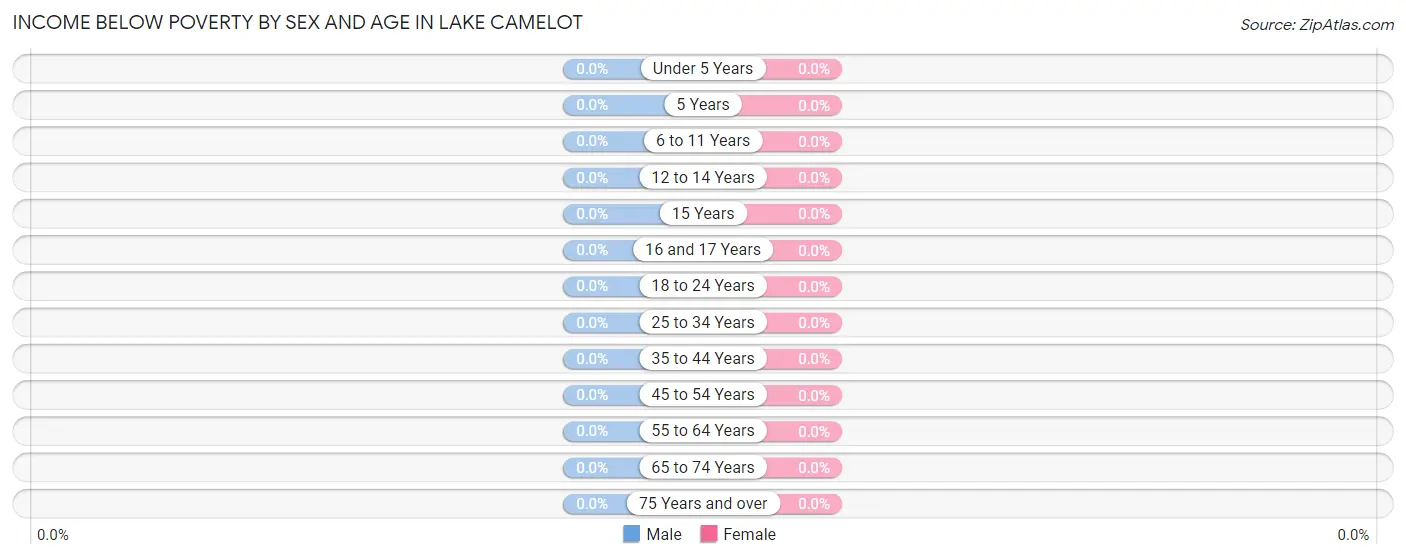
| Age Bracket | Male | Female |
| Under 5 Years | 0 (0.0%) | 0 (0.0%) |
| 5 Years | 0 (0.0%) | 0 (0.0%) |
| 6 to 11 Years | 0 (0.0%) | 0 (0.0%) |
| 12 to 14 Years | 0 (0.0%) | 0 (0.0%) |
| 15 Years | 0 (0.0%) | 0 (0.0%) |
| 16 and 17 Years | 0 (0.0%) | 0 (0.0%) |
| 18 to 24 Years | 0 (0.0%) | 0 (0.0%) |
| 25 to 34 Years | 0 (0.0%) | 0 (0.0%) |
| 35 to 44 Years | 0 (0.0%) | 0 (0.0%) |
| 45 to 54 Years | 0 (0.0%) | 0 (0.0%) |
| 55 to 64 Years | 0 (0.0%) | 0 (0.0%) |
| 65 to 74 Years | 0 (0.0%) | 0 (0.0%) |
| 75 Years and over | 0 (0.0%) | 0 (0.0%) |
| Total | 0 (0.0%) | 0 (0.0%) |
Income Above Poverty by Sex and Age in Lake Camelot
According to the poverty statistics in Lake Camelot, males aged under 5 years and females aged under 5 years are the age groups that are most secure financially, with 100.0% of males and 100.0% of females in these age groups living above the poverty line.
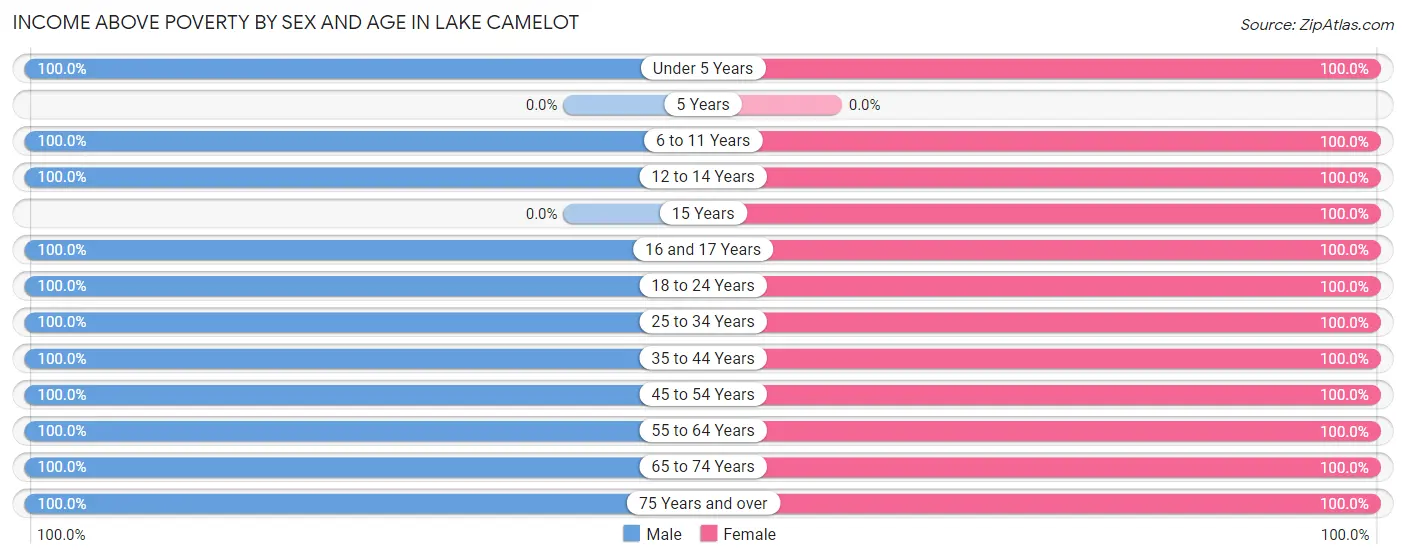
| Age Bracket | Male | Female |
| Under 5 Years | 72 (100.0%) | 90 (100.0%) |
| 5 Years | 0 (0.0%) | 0 (0.0%) |
| 6 to 11 Years | 68 (100.0%) | 87 (100.0%) |
| 12 to 14 Years | 59 (100.0%) | 49 (100.0%) |
| 15 Years | 0 (0.0%) | 9 (100.0%) |
| 16 and 17 Years | 71 (100.0%) | 46 (100.0%) |
| 18 to 24 Years | 33 (100.0%) | 7 (100.0%) |
| 25 to 34 Years | 95 (100.0%) | 65 (100.0%) |
| 35 to 44 Years | 75 (100.0%) | 174 (100.0%) |
| 45 to 54 Years | 158 (100.0%) | 53 (100.0%) |
| 55 to 64 Years | 16 (100.0%) | 127 (100.0%) |
| 65 to 74 Years | 125 (100.0%) | 30 (100.0%) |
| 75 Years and over | 38 (100.0%) | 18 (100.0%) |
| Total | 810 (100.0%) | 755 (100.0%) |
Income Below Poverty Among Married-Couple Families in Lake Camelot
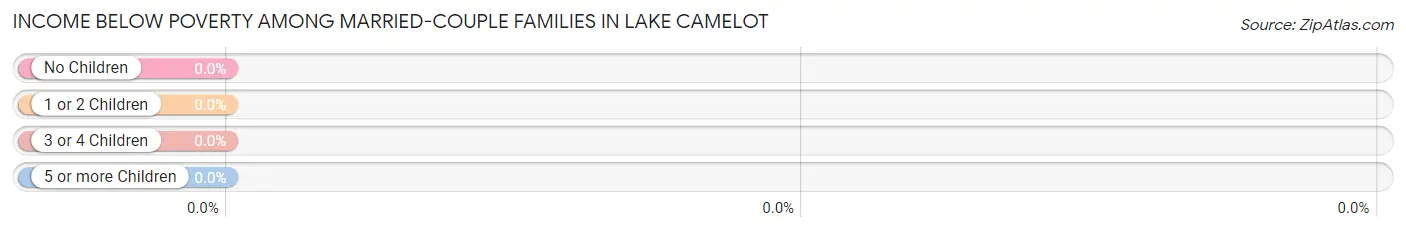
| Children | Above Poverty | Below Poverty |
| No Children | 129 (100.0%) | 0 (0.0%) |
| 1 or 2 Children | 175 (100.0%) | 0 (0.0%) |
| 3 or 4 Children | 35 (100.0%) | 0 (0.0%) |
| 5 or more Children | 0 (0.0%) | 0 (0.0%) |
| Total | 339 (100.0%) | 0 (0.0%) |
Income Below Poverty Among Single-Parent Households in Lake Camelot
| Children | Single Father | Single Mother |
| No Children | 0 (0.0%) | 0 (0.0%) |
| 1 or 2 Children | 0 (0.0%) | 0 (0.0%) |
| 3 or 4 Children | 0 (0.0%) | 0 (0.0%) |
| 5 or more Children | 0 (0.0%) | 0 (0.0%) |
| Total | 0 (0.0%) | 0 (0.0%) |
Income Below Poverty Among Married-Couple vs Single-Parent Households in Lake Camelot
| Children | Married-Couple Families | Single-Parent Households |
| No Children | 0 (0.0%) | 0 (0.0%) |
| 1 or 2 Children | 0 (0.0%) | 0 (0.0%) |
| 3 or 4 Children | 0 (0.0%) | 0 (0.0%) |
| 5 or more Children | 0 (0.0%) | 0 (0.0%) |
| Total | 0 (0.0%) | 0 (0.0%) |
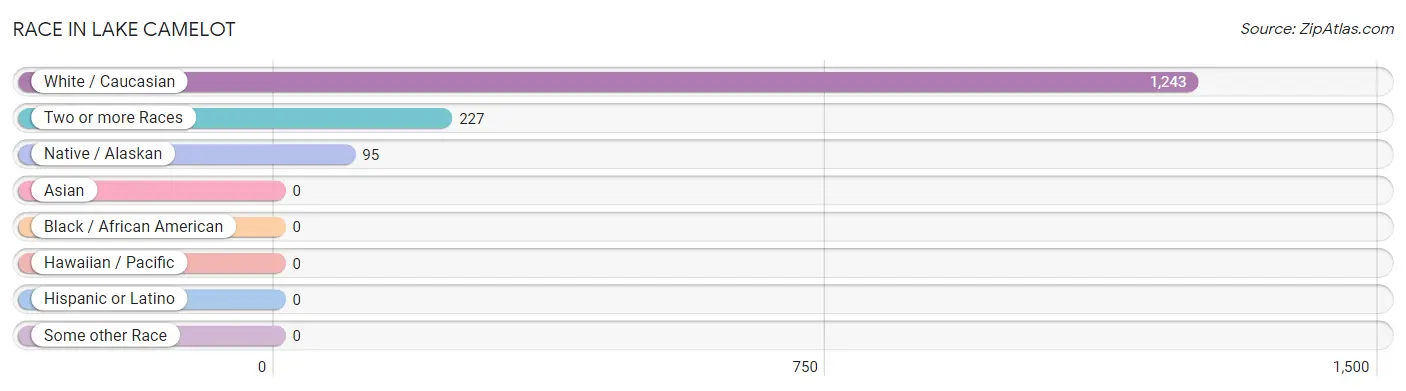
Race in Lake Camelot
The most populous races in Lake Camelot are White / Caucasian (1,243 | 79.4%), Two or more Races (227 | 14.5%), and Native / Alaskan (95 | 6.1%).
| Race | # Population | % Population |
| Asian | 0 | 0.0% |
| Black / African American | 0 | 0.0% |
| Hawaiian / Pacific | 0 | 0.0% |
| Hispanic or Latino | 0 | 0.0% |
| Native / Alaskan | 95 | 6.1% |
| White / Caucasian | 1,243 | 79.4% |
| Two or more Races | 227 | 14.5% |
| Some other Race | 0 | 0.0% |
| Total | 1,565 | 100.0% |
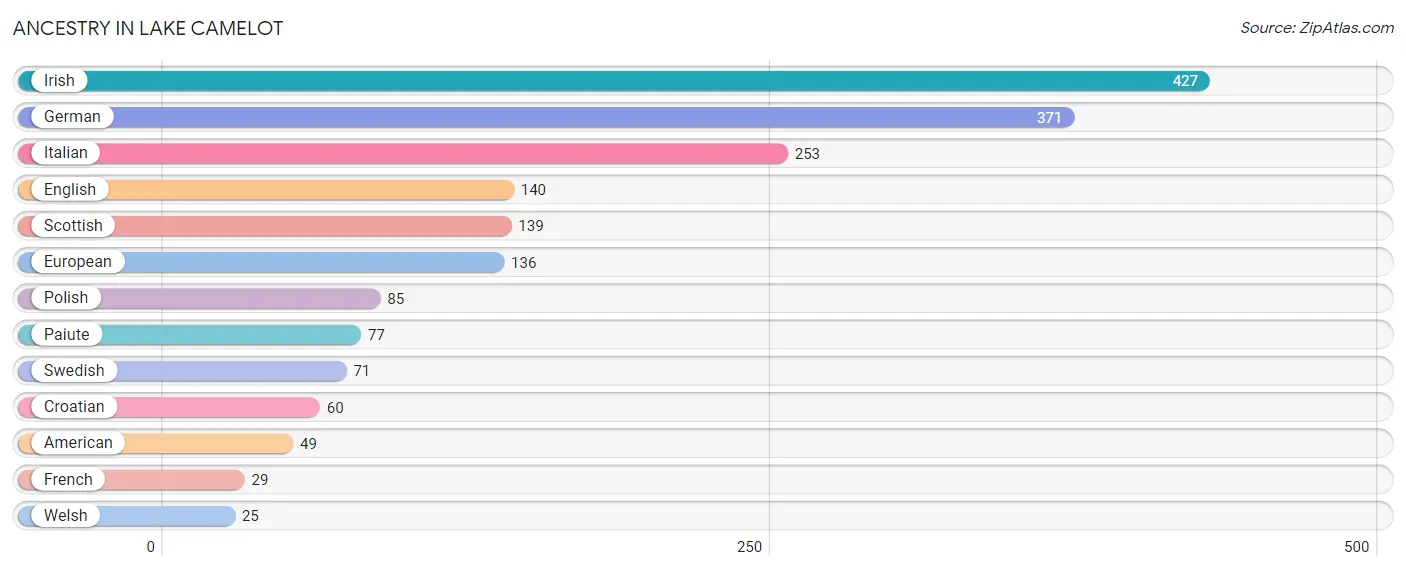
Ancestry in Lake Camelot
The most populous ancestries reported in Lake Camelot are Irish (427 | 27.3%), German (371 | 23.7%), Italian (253 | 16.2%), English (140 | 8.9%), and Scottish (139 | 8.9%), together accounting for 85.0% of all Lake Camelot residents.
| Ancestry | # Population | % Population |
| American | 49 | 3.1% |
| Croatian | 60 | 3.8% |
| English | 140 | 8.9% |
| European | 136 | 8.7% |
| French | 29 | 1.8% |
| German | 371 | 23.7% |
| Irish | 427 | 27.3% |
| Italian | 253 | 16.2% |
| Paiute | 77 | 4.9% |
| Polish | 85 | 5.4% |
| Scottish | 139 | 8.9% |
| Swedish | 71 | 4.5% |
| Welsh | 25 | 1.6% | View All 13 Rows |
Immigrants in Lake Camelot

| Immigration Origin | # Population | % Population | View All 0 Rows |
Sex and Age in Lake Camelot
Sex and Age in Lake Camelot
The most populous age groups in Lake Camelot are 45 to 49 Years (120 | 14.8%) for men and 40 to 44 Years (156 | 20.7%) for women.
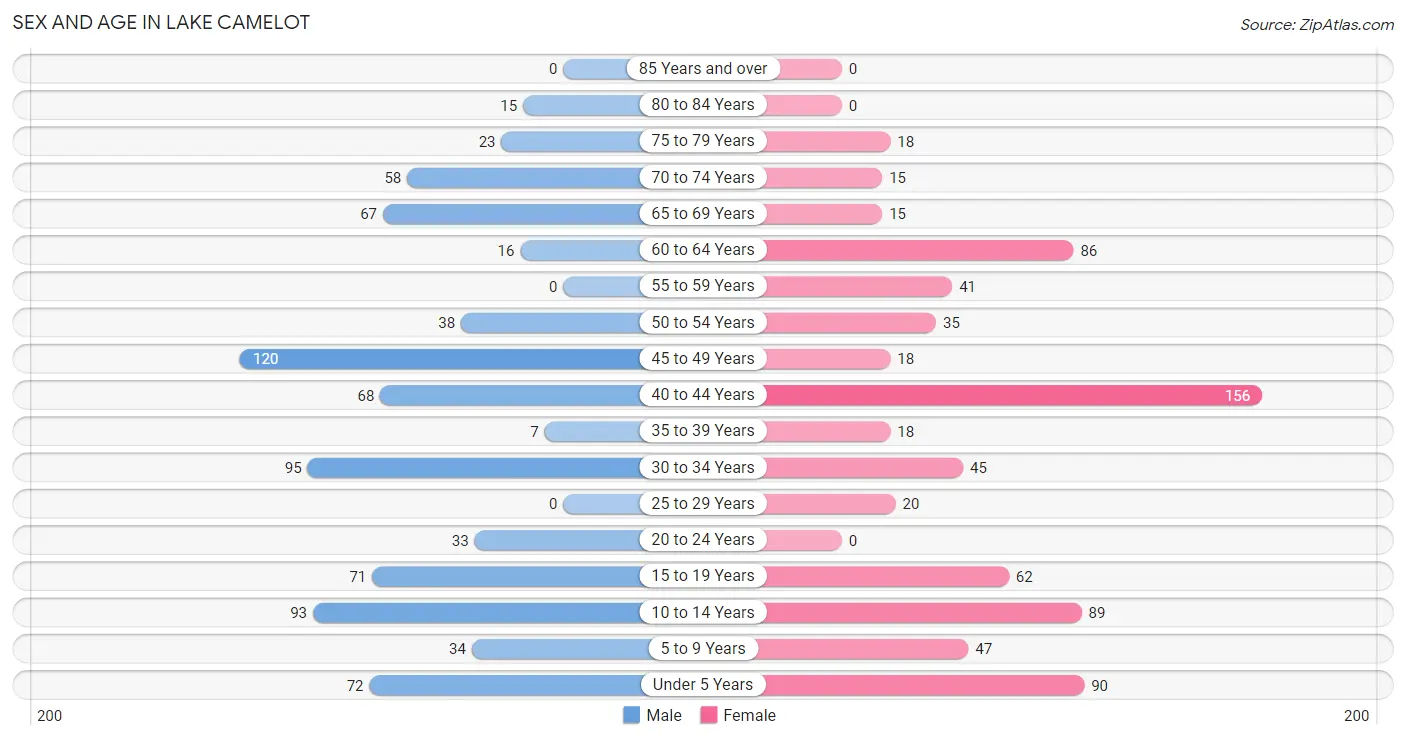
| Age Bracket | Male | Female |
| Under 5 Years | 72 (8.9%) | 90 (11.9%) |
| 5 to 9 Years | 34 (4.2%) | 47 (6.2%) |
| 10 to 14 Years | 93 (11.5%) | 89 (11.8%) |
| 15 to 19 Years | 71 (8.8%) | 62 (8.2%) |
| 20 to 24 Years | 33 (4.1%) | 0 (0.0%) |
| 25 to 29 Years | 0 (0.0%) | 20 (2.6%) |
| 30 to 34 Years | 95 (11.7%) | 45 (6.0%) |
| 35 to 39 Years | 7 (0.9%) | 18 (2.4%) |
| 40 to 44 Years | 68 (8.4%) | 156 (20.7%) |
| 45 to 49 Years | 120 (14.8%) | 18 (2.4%) |
| 50 to 54 Years | 38 (4.7%) | 35 (4.6%) |
| 55 to 59 Years | 0 (0.0%) | 41 (5.4%) |
| 60 to 64 Years | 16 (2.0%) | 86 (11.4%) |
| 65 to 69 Years | 67 (8.3%) | 15 (2.0%) |
| 70 to 74 Years | 58 (7.2%) | 15 (2.0%) |
| 75 to 79 Years | 23 (2.8%) | 18 (2.4%) |
| 80 to 84 Years | 15 (1.8%) | 0 (0.0%) |
| 85 Years and over | 0 (0.0%) | 0 (0.0%) |
| Total | 810 (100.0%) | 755 (100.0%) |
Families and Households in Lake Camelot
Median Family Size in Lake Camelot
The median family size in Lake Camelot is 2.98 persons per family, with single male/father families (25 | 5.4%) accounting for the largest median family size of 3.32 persons per family. On the other hand, single female/mother families (99 | 21.4%) represent the smallest median family size with 2.04 persons per family.
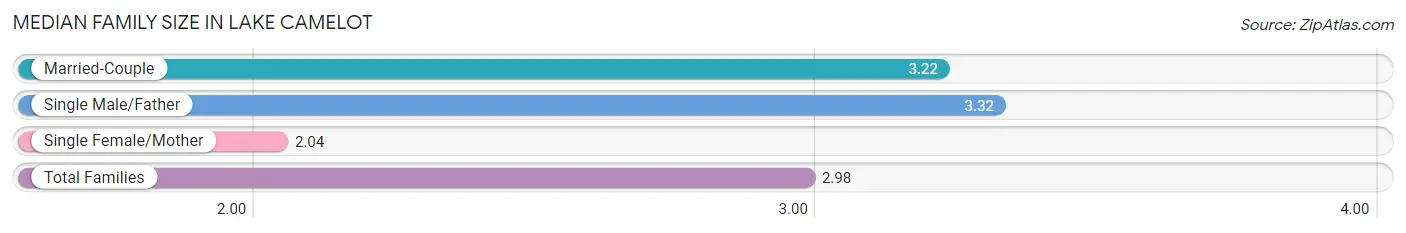
| Family Type | # Families | Family Size |
| Married-Couple | 339 (73.2%) | 3.22 |
| Single Male/Father | 25 (5.4%) | 3.32 |
| Single Female/Mother | 99 (21.4%) | 2.04 |
| Total Families | 463 (100.0%) | 2.98 |
Median Household Size in Lake Camelot
The median household size in Lake Camelot is 2.77 persons per household, with single male/father households (25 | 4.4%) accounting for the largest median household size of 3.32 persons per household. non-family households (101 | 17.9%) represent the smallest median household size with 1.17 persons per household.
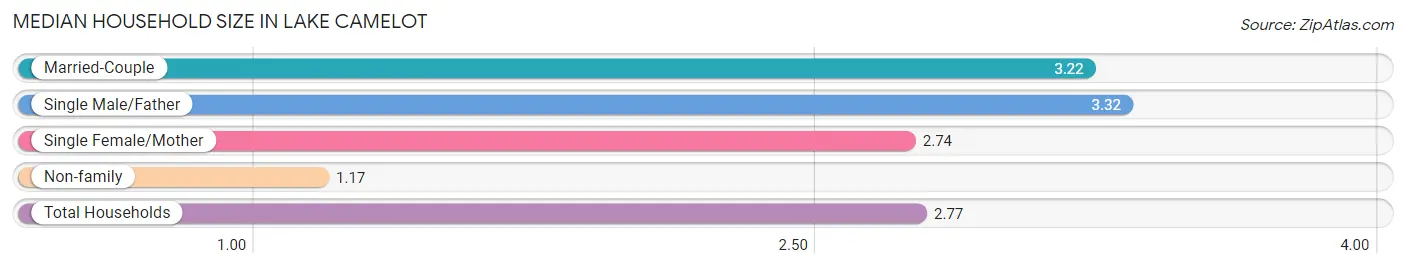
| Household Type | # Households | Household Size |
| Married-Couple | 339 (60.1%) | 3.22 |
| Single Male/Father | 25 (4.4%) | 3.32 |
| Single Female/Mother | 99 (17.5%) | 2.74 |
| Non-family | 101 (17.9%) | 1.17 |
| Total Households | 564 (100.0%) | 2.77 |
Household Size by Marriage Status in Lake Camelot
Out of a total of 564 households in Lake Camelot, 463 (82.1%) are family households, while 101 (17.9%) are nonfamily households. The most numerous type of family households are 3-person households, comprising 162, and the most common type of nonfamily households are 1-person households, comprising 86.
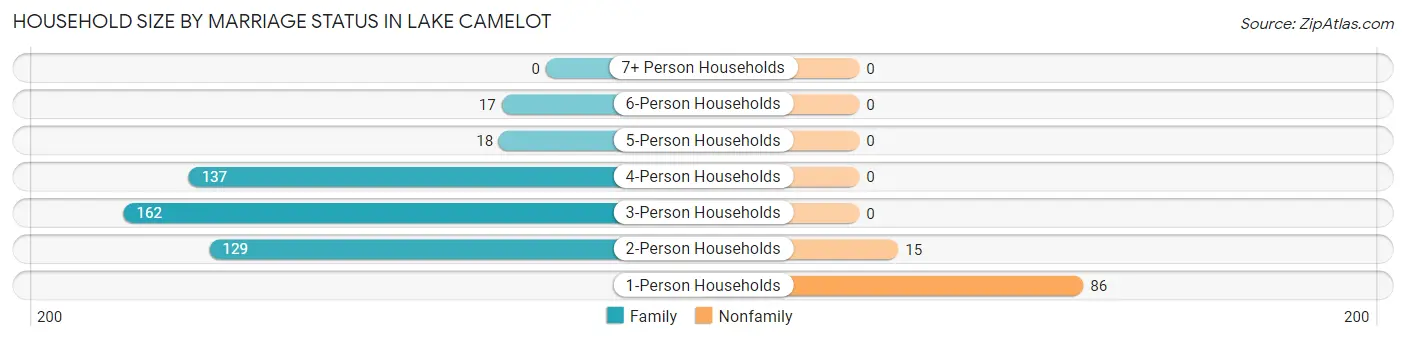
| Household Size | Family Households | Nonfamily Households |
| 1-Person Households | - | 86 (15.2%) |
| 2-Person Households | 129 (22.9%) | 15 (2.7%) |
| 3-Person Households | 162 (28.7%) | 0 (0.0%) |
| 4-Person Households | 137 (24.3%) | 0 (0.0%) |
| 5-Person Households | 18 (3.2%) | 0 (0.0%) |
| 6-Person Households | 17 (3.0%) | 0 (0.0%) |
| 7+ Person Households | 0 (0.0%) | 0 (0.0%) |
| Total | 463 (82.1%) | 101 (17.9%) |
Female Fertility in Lake Camelot
Fertility by Age in Lake Camelot
| Age Bracket | Women with Births | Births / 1,000 Women |
| 15 to 19 years | 0 (0.0%) | 0.0 |
| 20 to 34 years | 0 (0.0%) | 0.0 |
| 35 to 50 years | 0 (0.0%) | 0.0 |
| Total | 0 (0.0%) | 0.0 |
Fertility by Age by Marriage Status in Lake Camelot
| Age Bracket | Married | Unmarried |
| 15 to 19 years | 0 (0.0%) | 0 (0.0%) |
| 20 to 34 years | 0 (0.0%) | 0 (0.0%) |
| 35 to 50 years | 0 (0.0%) | 0 (0.0%) |
| Total | 0 (0.0%) | 0 (0.0%) |
Fertility by Education in Lake Camelot
| Educational Attainment | Women with Births | Births / 1,000 Women |
| Less than High School | 0 (0.0%) | 0.0 |
| High School Diploma | 0 (0.0%) | 0.0 |
| College or Associate's Degree | 0 (0.0%) | 0.0 |
| Bachelor's Degree | 0 (0.0%) | 0.0 |
| Graduate Degree | 0 (0.0%) | 0.0 |
| Total | 0 (0.0%) | 0.0 |
Fertility by Education by Marriage Status in Lake Camelot
| Educational Attainment | Married | Unmarried |
| Less than High School | 0 (0.0%) | 0 (0.0%) |
| High School Diploma | 0 (0.0%) | 0 (0.0%) |
| College or Associate's Degree | 0 (0.0%) | 0 (0.0%) |
| Bachelor's Degree | 0 (0.0%) | 0 (0.0%) |
| Graduate Degree | 0 (0.0%) | 0 (0.0%) |
| Total | 0 (0.0%) | 0 (0.0%) |
Employment Characteristics in Lake Camelot
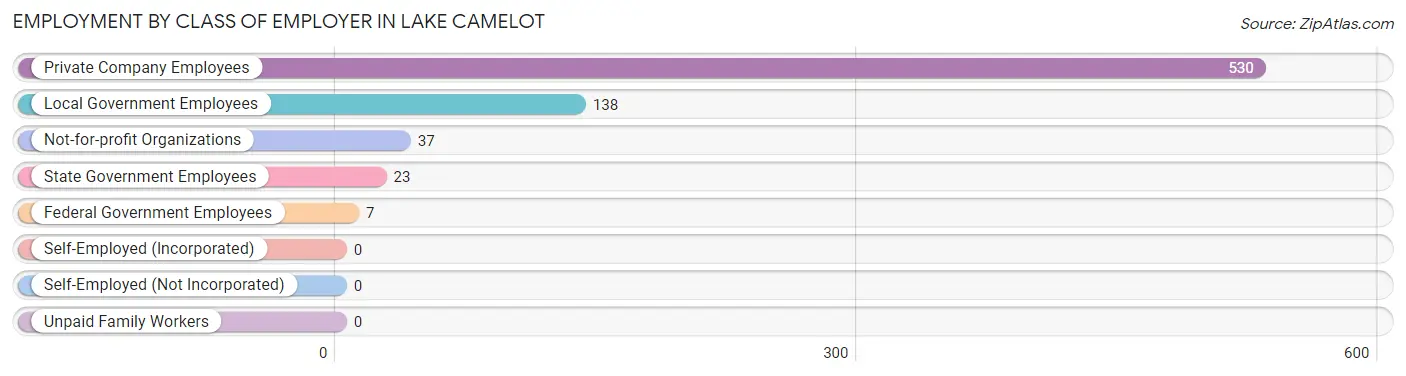
Employment by Class of Employer in Lake Camelot
Among the 735 employed individuals in Lake Camelot, private company employees (530 | 72.1%), local government employees (138 | 18.8%), and not-for-profit organizations (37 | 5.0%) make up the most common classes of employment.
| Employer Class | # Employees | % Employees |
| Private Company Employees | 530 | 72.1% |
| Self-Employed (Incorporated) | 0 | 0.0% |
| Self-Employed (Not Incorporated) | 0 | 0.0% |
| Not-for-profit Organizations | 37 | 5.0% |
| Local Government Employees | 138 | 18.8% |
| State Government Employees | 23 | 3.1% |
| Federal Government Employees | 7 | 0.9% |
| Unpaid Family Workers | 0 | 0.0% |
| Total | 735 | 100.0% |
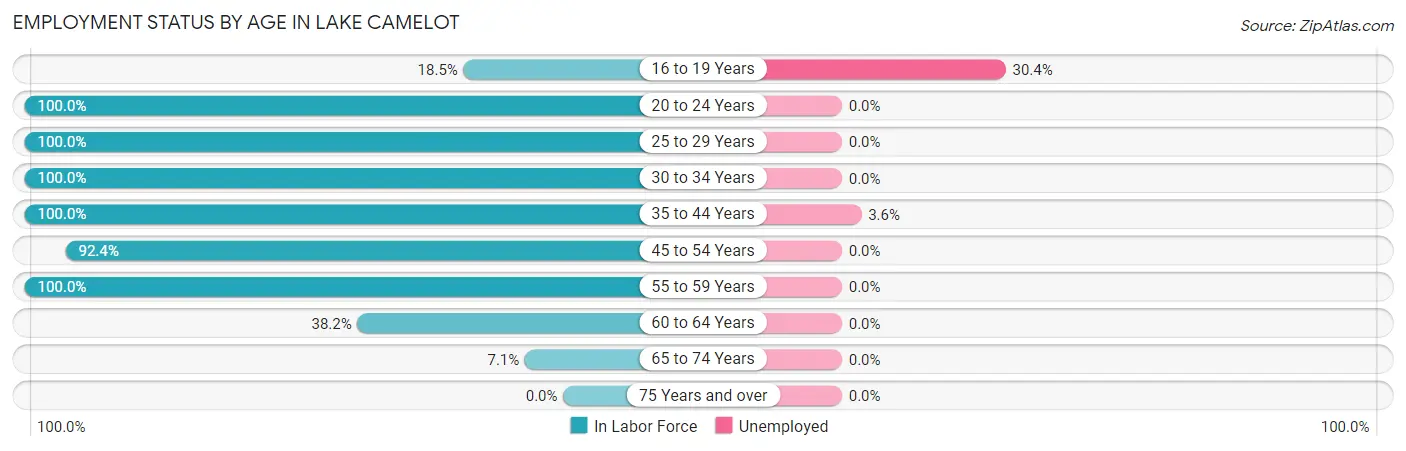
Employment Status by Age in Lake Camelot
According to the labor force statistics for Lake Camelot, out of the total population over 16 years of age (1,131), 66.4% or 751 individuals are in the labor force, with 2.1% or 16 of them unemployed. The age group with the highest labor force participation rate is 20 to 24 years, with 100.0% or 33 individuals in the labor force. Within the labor force, the 16 to 19 years age range has the highest percentage of unemployed individuals, with 30.4% or 7 of them being unemployed.
| Age Bracket | In Labor Force | Unemployed |
| 16 to 19 Years | 23 (18.5%) | 7 (30.4%) |
| 20 to 24 Years | 33 (100.0%) | 0 (0.0%) |
| 25 to 29 Years | 20 (100.0%) | 0 (0.0%) |
| 30 to 34 Years | 140 (100.0%) | 0 (0.0%) |
| 35 to 44 Years | 249 (100.0%) | 9 (3.6%) |
| 45 to 54 Years | 195 (92.4%) | 0 (0.0%) |
| 55 to 59 Years | 41 (100.0%) | 0 (0.0%) |
| 60 to 64 Years | 39 (38.2%) | 0 (0.0%) |
| 65 to 74 Years | 11 (7.1%) | 0 (0.0%) |
| 75 Years and over | 0 (0.0%) | 0 (0.0%) |
| Total | 751 (66.4%) | 16 (2.1%) |
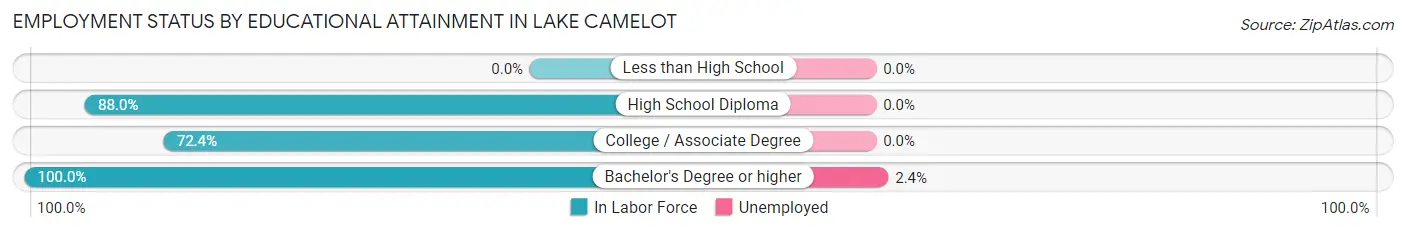
Employment Status by Educational Attainment in Lake Camelot
According to labor force statistics for Lake Camelot, 89.6% of individuals (684) out of the total population between 25 and 64 years of age (763) are in the labor force, with 1.3% or 9 of them being unemployed. The group with the highest labor force participation rate are those with the educational attainment of bachelor's degree or higher, with 100.0% or 369 individuals in the labor force. Within the labor force, individuals with bachelor's degree or higher education have the highest percentage of unemployment, with 2.4% or 9 of them being unemployed.
| Educational Attainment | In Labor Force | Unemployed |
| Less than High School | 0 (0.0%) | 0 (0.0%) |
| High School Diploma | 168 (88.0%) | 0 (0.0%) |
| College / Associate Degree | 147 (72.4%) | 0 (0.0%) |
| Bachelor's Degree or higher | 369 (100.0%) | 9 (2.4%) |
| Total | 684 (89.6%) | 10 (1.3%) |
Employment Occupations by Sex in Lake Camelot
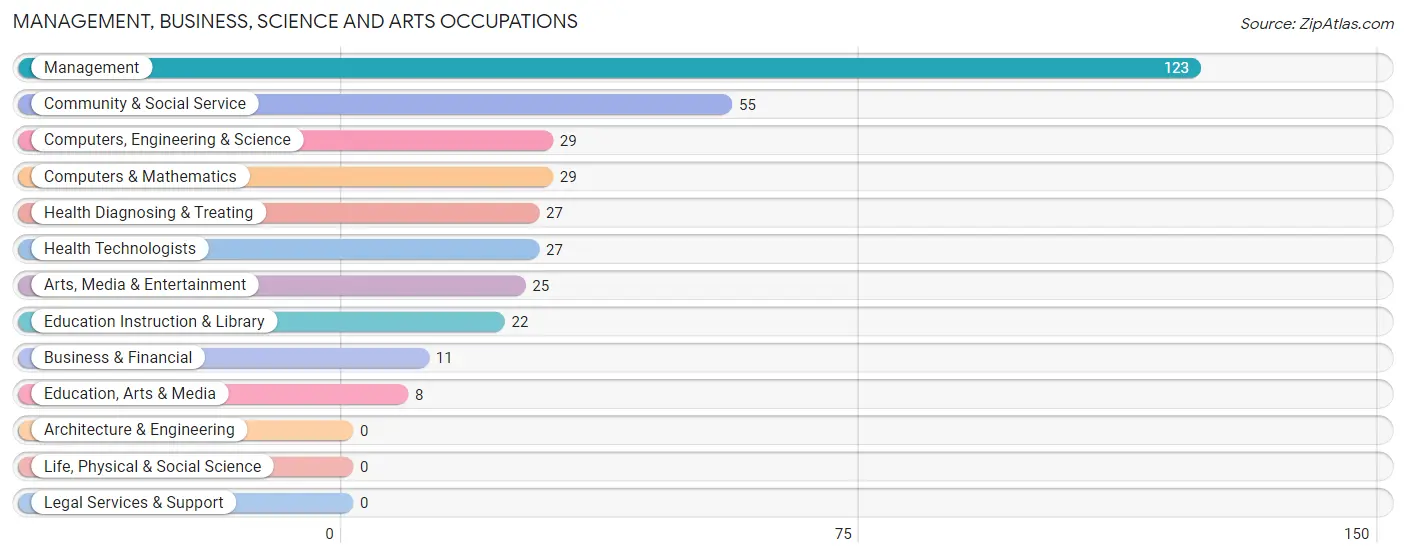
Management, Business, Science and Arts Occupations
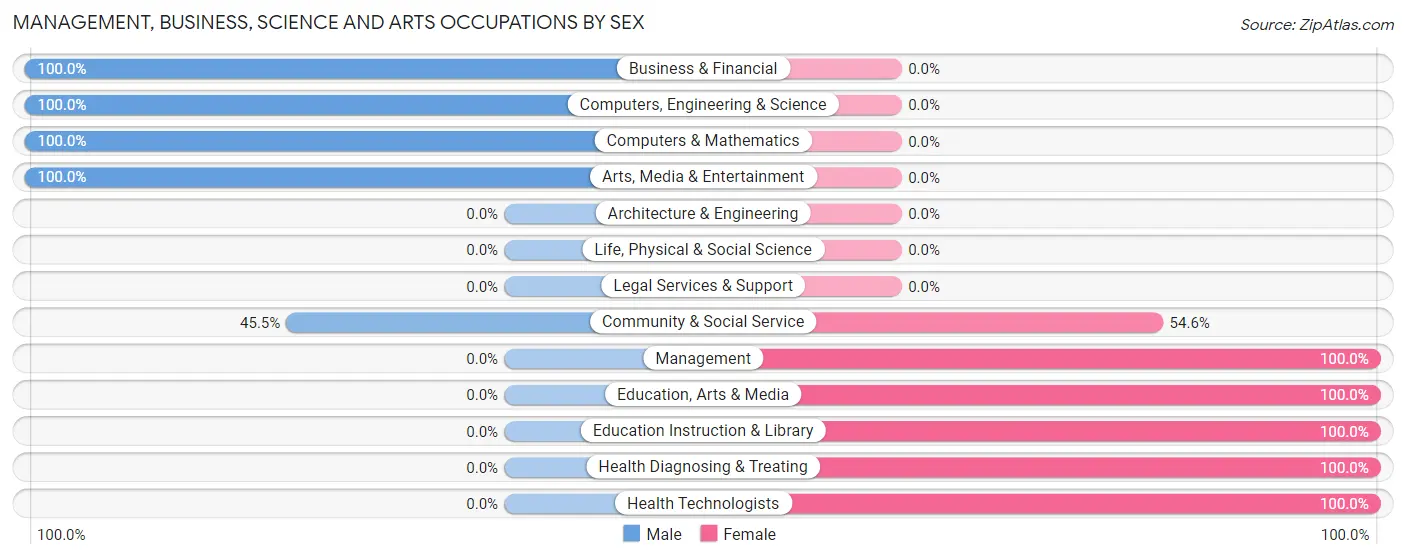
The most common Management, Business, Science and Arts occupations in Lake Camelot are Management (123 | 16.7%), Community & Social Service (55 | 7.5%), Computers, Engineering & Science (29 | 4.0%), Computers & Mathematics (29 | 4.0%), and Health Diagnosing & Treating (27 | 3.7%).
Management, Business, Science and Arts Occupations by Sex
Within the Management, Business, Science and Arts occupations in Lake Camelot, the most male-oriented occupations are Business & Financial (100.0%), Computers, Engineering & Science (100.0%), and Computers & Mathematics (100.0%), while the most female-oriented occupations are Management (100.0%), Education, Arts & Media (100.0%), and Education Instruction & Library (100.0%).
| Occupation | Male | Female |
| Management | 0 (0.0%) | 123 (100.0%) |
| Business & Financial | 11 (100.0%) | 0 (0.0%) |
| Computers, Engineering & Science | 29 (100.0%) | 0 (0.0%) |
| Computers & Mathematics | 29 (100.0%) | 0 (0.0%) |
| Architecture & Engineering | 0 (0.0%) | 0 (0.0%) |
| Life, Physical & Social Science | 0 (0.0%) | 0 (0.0%) |
| Community & Social Service | 25 (45.5%) | 30 (54.5%) |
| Education, Arts & Media | 0 (0.0%) | 8 (100.0%) |
| Legal Services & Support | 0 (0.0%) | 0 (0.0%) |
| Education Instruction & Library | 0 (0.0%) | 22 (100.0%) |
| Arts, Media & Entertainment | 25 (100.0%) | 0 (0.0%) |
| Health Diagnosing & Treating | 0 (0.0%) | 27 (100.0%) |
| Health Technologists | 0 (0.0%) | 27 (100.0%) |
| Total (Category) | 65 (26.5%) | 180 (73.5%) |
| Total (Overall) | 363 (49.4%) | 372 (50.6%) |
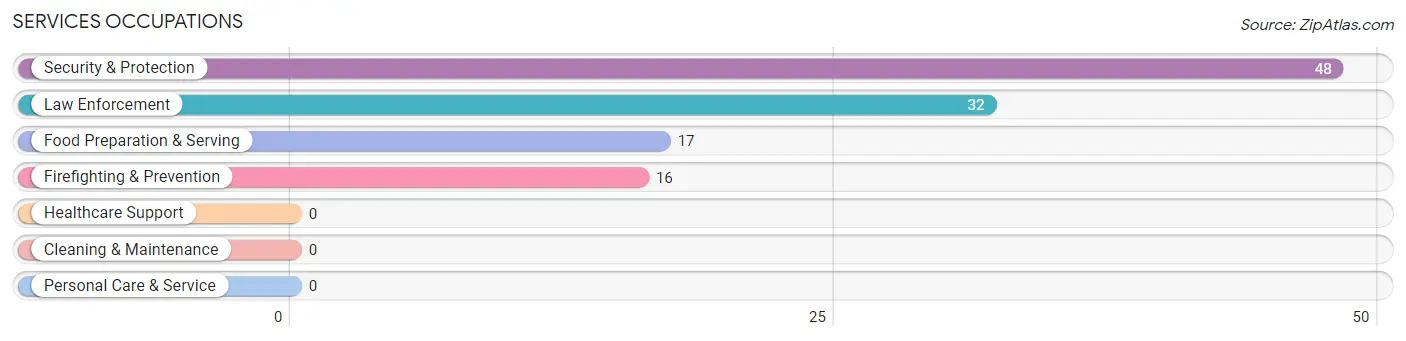
Services Occupations
The most common Services occupations in Lake Camelot are Security & Protection (48 | 6.5%), Law Enforcement (32 | 4.3%), Food Preparation & Serving (17 | 2.3%), and Firefighting & Prevention (16 | 2.2%).
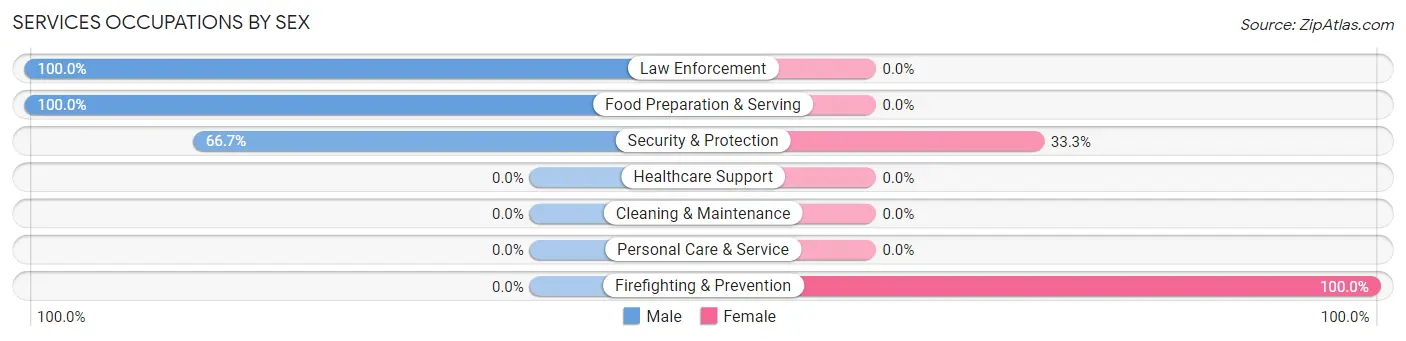
Services Occupations by Sex
Within the Services occupations in Lake Camelot, the most male-oriented occupations are Law Enforcement (100.0%), Food Preparation & Serving (100.0%), and Security & Protection (66.7%), while the most female-oriented occupations are Firefighting & Prevention (100.0%), and Security & Protection (33.3%).
| Occupation | Male | Female |
| Healthcare Support | 0 (0.0%) | 0 (0.0%) |
| Security & Protection | 32 (66.7%) | 16 (33.3%) |
| Firefighting & Prevention | 0 (0.0%) | 16 (100.0%) |
| Law Enforcement | 32 (100.0%) | 0 (0.0%) |
| Food Preparation & Serving | 17 (100.0%) | 0 (0.0%) |
| Cleaning & Maintenance | 0 (0.0%) | 0 (0.0%) |
| Personal Care & Service | 0 (0.0%) | 0 (0.0%) |
| Total (Category) | 49 (75.4%) | 16 (24.6%) |
| Total (Overall) | 363 (49.4%) | 372 (50.6%) |
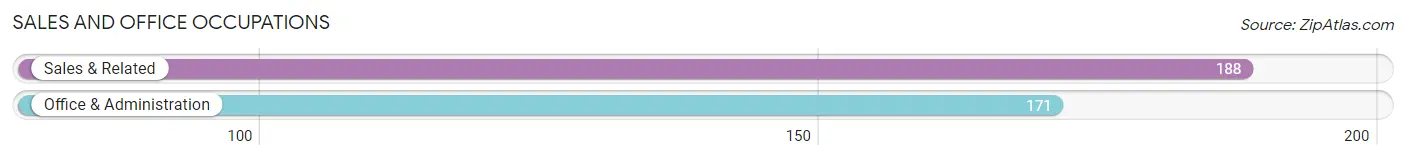
Sales and Office Occupations
The most common Sales and Office occupations in Lake Camelot are Sales & Related (188 | 25.6%), and Office & Administration (171 | 23.3%).
Sales and Office Occupations by Sex
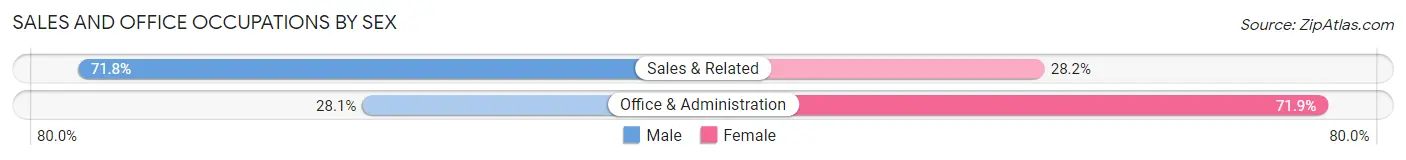
| Occupation | Male | Female |
| Sales & Related | 135 (71.8%) | 53 (28.2%) |
| Office & Administration | 48 (28.1%) | 123 (71.9%) |
| Total (Category) | 183 (51.0%) | 176 (49.0%) |
| Total (Overall) | 363 (49.4%) | 372 (50.6%) |
Natural Resources, Construction and Maintenance Occupations
The most common Natural Resources, Construction and Maintenance occupations in Lake Camelot are , and Construction & Extraction (43 | 5.9%).
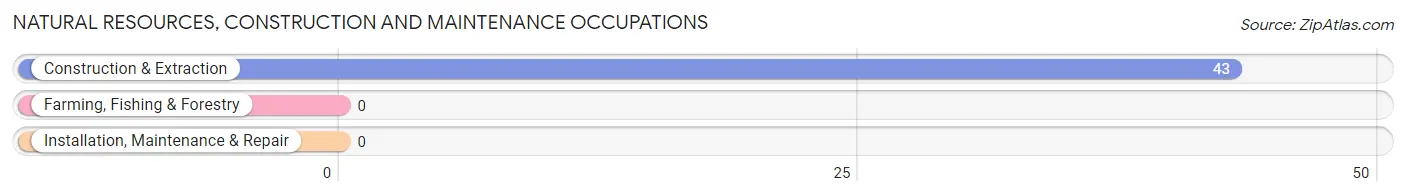
Natural Resources, Construction and Maintenance Occupations by Sex
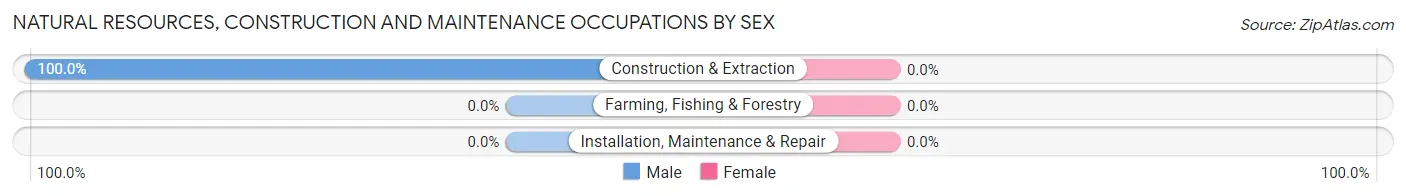
| Occupation | Male | Female |
| Farming, Fishing & Forestry | 0 (0.0%) | 0 (0.0%) |
| Construction & Extraction | 43 (100.0%) | 0 (0.0%) |
| Installation, Maintenance & Repair | 0 (0.0%) | 0 (0.0%) |
| Total (Category) | 43 (100.0%) | 0 (0.0%) |
| Total (Overall) | 363 (49.4%) | 372 (50.6%) |
Production, Transportation and Moving Occupations
The most common Production, Transportation and Moving occupations in Lake Camelot are , and Production (23 | 3.1%).
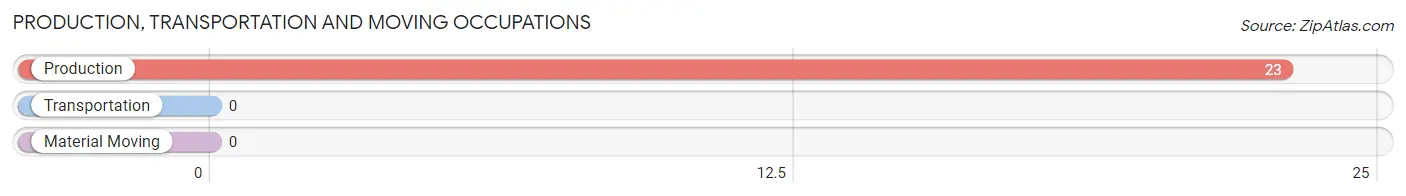
Production, Transportation and Moving Occupations by Sex
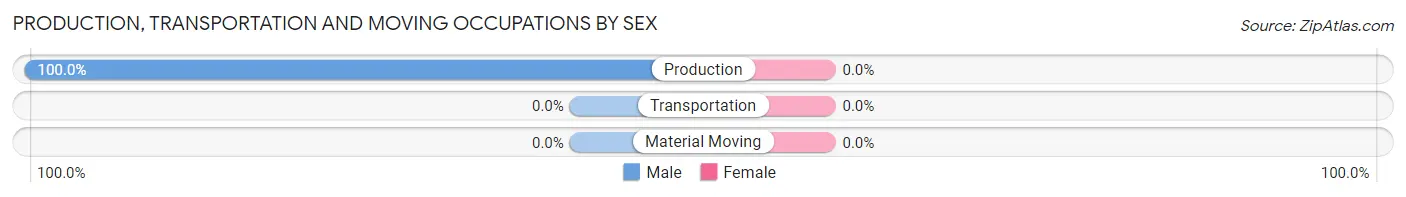
| Occupation | Male | Female |
| Production | 23 (100.0%) | 0 (0.0%) |
| Transportation | 0 (0.0%) | 0 (0.0%) |
| Material Moving | 0 (0.0%) | 0 (0.0%) |
| Total (Category) | 23 (100.0%) | 0 (0.0%) |
| Total (Overall) | 363 (49.4%) | 372 (50.6%) |
Employment Industries by Sex in Lake Camelot
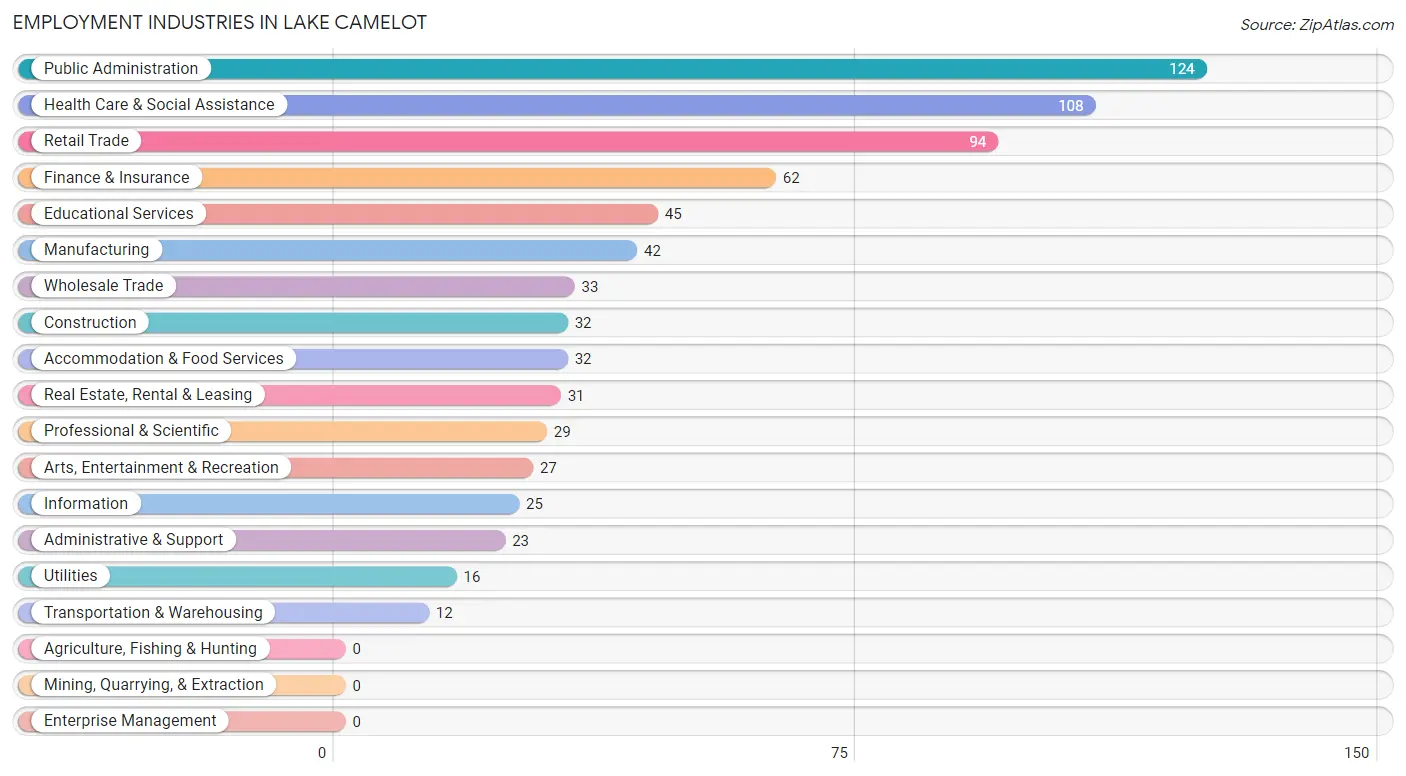
Employment Industries in Lake Camelot
The major employment industries in Lake Camelot include Public Administration (124 | 16.9%), Health Care & Social Assistance (108 | 14.7%), Retail Trade (94 | 12.8%), Finance & Insurance (62 | 8.4%), and Educational Services (45 | 6.1%).
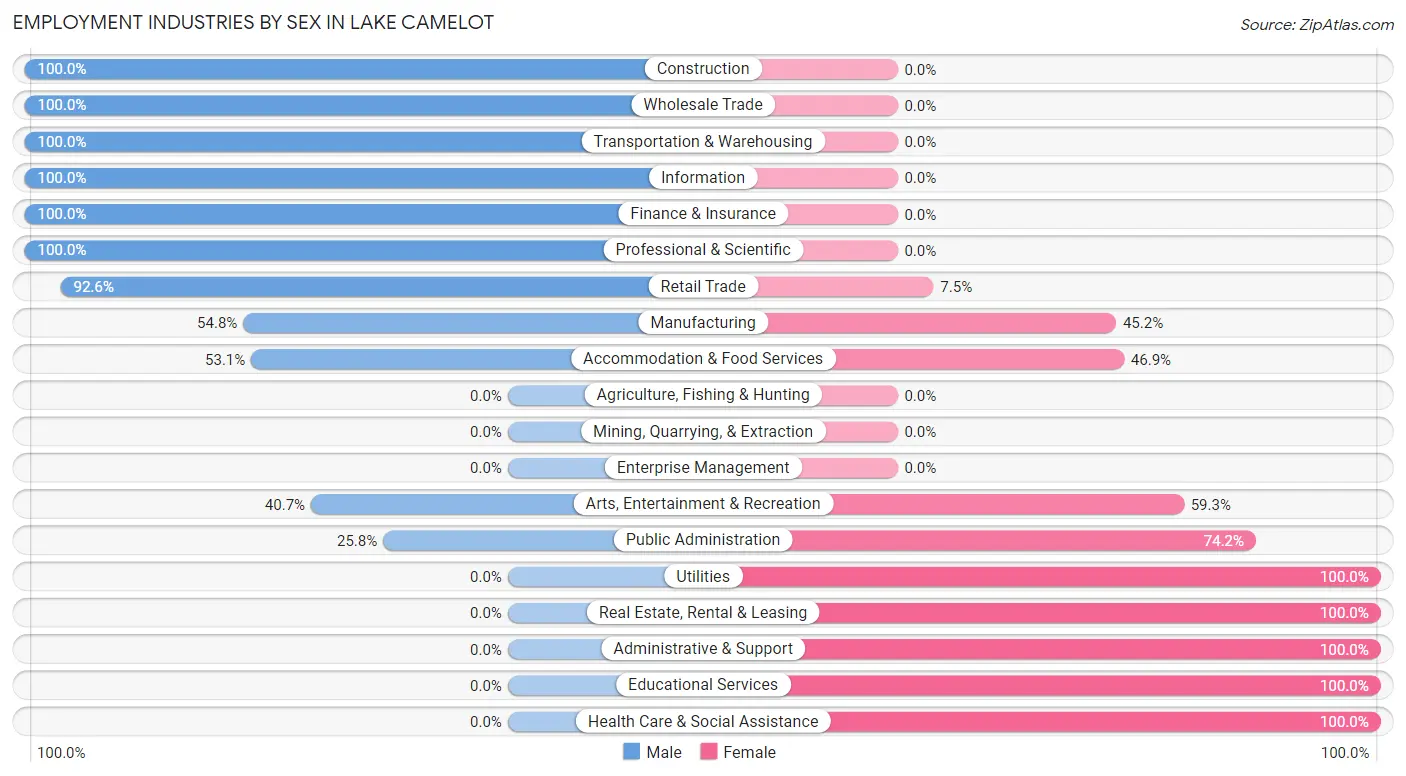
Employment Industries by Sex in Lake Camelot
The Lake Camelot industries that see more men than women are Construction (100.0%), Wholesale Trade (100.0%), and Transportation & Warehousing (100.0%), whereas the industries that tend to have a higher number of women are Utilities (100.0%), Real Estate, Rental & Leasing (100.0%), and Administrative & Support (100.0%).
| Industry | Male | Female |
| Agriculture, Fishing & Hunting | 0 (0.0%) | 0 (0.0%) |
| Mining, Quarrying, & Extraction | 0 (0.0%) | 0 (0.0%) |
| Construction | 32 (100.0%) | 0 (0.0%) |
| Manufacturing | 23 (54.8%) | 19 (45.2%) |
| Wholesale Trade | 33 (100.0%) | 0 (0.0%) |
| Retail Trade | 87 (92.5%) | 7 (7.4%) |
| Transportation & Warehousing | 12 (100.0%) | 0 (0.0%) |
| Utilities | 0 (0.0%) | 16 (100.0%) |
| Information | 25 (100.0%) | 0 (0.0%) |
| Finance & Insurance | 62 (100.0%) | 0 (0.0%) |
| Real Estate, Rental & Leasing | 0 (0.0%) | 31 (100.0%) |
| Professional & Scientific | 29 (100.0%) | 0 (0.0%) |
| Enterprise Management | 0 (0.0%) | 0 (0.0%) |
| Administrative & Support | 0 (0.0%) | 23 (100.0%) |
| Educational Services | 0 (0.0%) | 45 (100.0%) |
| Health Care & Social Assistance | 0 (0.0%) | 108 (100.0%) |
| Arts, Entertainment & Recreation | 11 (40.7%) | 16 (59.3%) |
| Accommodation & Food Services | 17 (53.1%) | 15 (46.9%) |
| Public Administration | 32 (25.8%) | 92 (74.2%) |
| Total | 363 (49.4%) | 372 (50.6%) |
Education in Lake Camelot
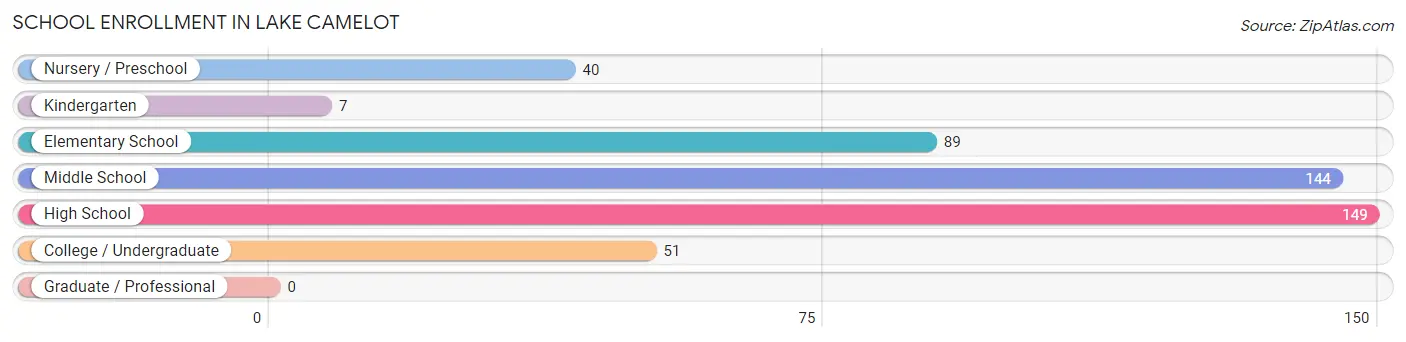
School Enrollment in Lake Camelot
The most common levels of schooling among the 480 students in Lake Camelot are high school (149 | 31.0%), middle school (144 | 30.0%), and elementary school (89 | 18.5%).
| School Level | # Students | % Students |
| Nursery / Preschool | 40 | 8.3% |
| Kindergarten | 7 | 1.5% |
| Elementary School | 89 | 18.5% |
| Middle School | 144 | 30.0% |
| High School | 149 | 31.0% |
| College / Undergraduate | 51 | 10.6% |
| Graduate / Professional | 0 | 0.0% |
| Total | 480 | 100.0% |
School Enrollment by Age by Funding Source in Lake Camelot
Out of a total of 480 students who are enrolled in schools in Lake Camelot, 88 (18.3%) attend a private institution, while the remaining 392 (81.7%) are enrolled in public schools. The age group of 3 to 4 year olds has the highest likelihood of being enrolled in private schools, with 32 (80.0% in the age bracket) enrolled. Conversely, the age group of 15 to 17 year olds has the lowest likelihood of being enrolled in a private school, with 126 (100.0% in the age bracket) attending a public institution.
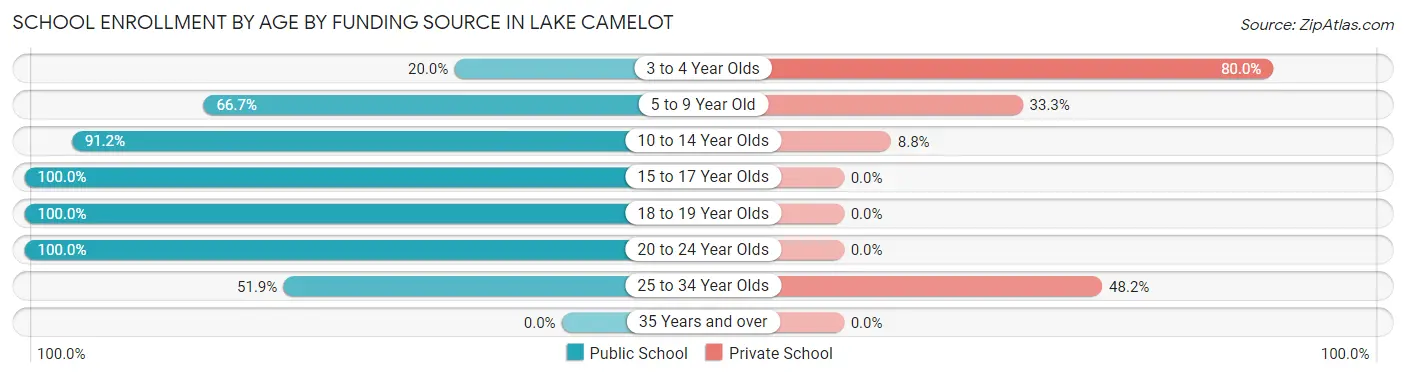
| Age Bracket | Public School | Private School |
| 3 to 4 Year Olds | 8 (20.0%) | 32 (80.0%) |
| 5 to 9 Year Old | 54 (66.7%) | 27 (33.3%) |
| 10 to 14 Year Olds | 166 (91.2%) | 16 (8.8%) |
| 15 to 17 Year Olds | 126 (100.0%) | 0 (0.0%) |
| 18 to 19 Year Olds | 7 (100.0%) | 0 (0.0%) |
| 20 to 24 Year Olds | 17 (100.0%) | 0 (0.0%) |
| 25 to 34 Year Olds | 14 (51.8%) | 13 (48.1%) |
| 35 Years and over | 0 (0.0%) | 0 (0.0%) |
| Total | 392 (81.7%) | 88 (18.3%) |
Educational Attainment by Field of Study in Lake Camelot
Business (199 | 49.5%), arts & humanities (97 | 24.1%), education (31 | 7.7%), computers & mathematics (19 | 4.7%), and psychology (18 | 4.5%) are the most common fields of study among 402 individuals in Lake Camelot who have obtained a bachelor's degree or higher.
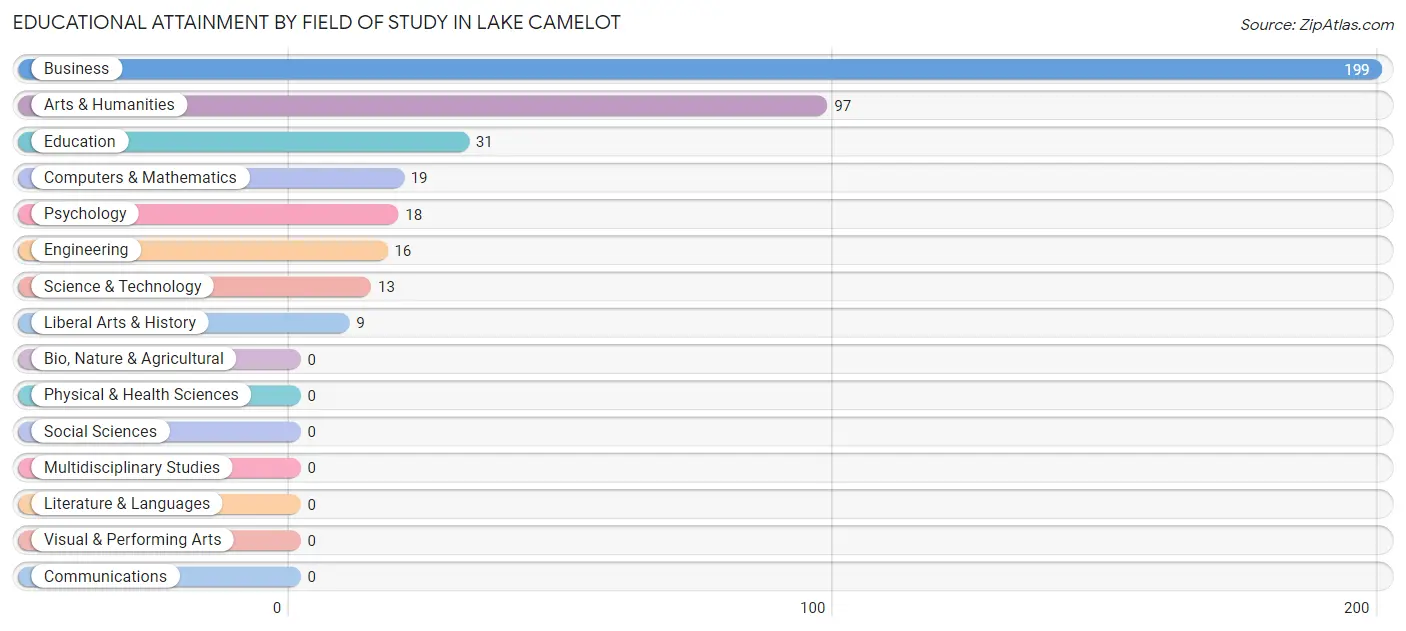
| Field of Study | # Graduates | % Graduates |
| Computers & Mathematics | 19 | 4.7% |
| Bio, Nature & Agricultural | 0 | 0.0% |
| Physical & Health Sciences | 0 | 0.0% |
| Psychology | 18 | 4.5% |
| Social Sciences | 0 | 0.0% |
| Engineering | 16 | 4.0% |
| Multidisciplinary Studies | 0 | 0.0% |
| Science & Technology | 13 | 3.2% |
| Business | 199 | 49.5% |
| Education | 31 | 7.7% |
| Literature & Languages | 0 | 0.0% |
| Liberal Arts & History | 9 | 2.2% |
| Visual & Performing Arts | 0 | 0.0% |
| Communications | 0 | 0.0% |
| Arts & Humanities | 97 | 24.1% |
| Total | 402 | 100.0% |
Transportation & Commute in Lake Camelot
Vehicle Availability by Sex in Lake Camelot
The most prevalent vehicle ownership categories in Lake Camelot are males with 3 vehicles (164, accounting for 45.2%) and females with 3 vehicles (192, making up 44.1%).
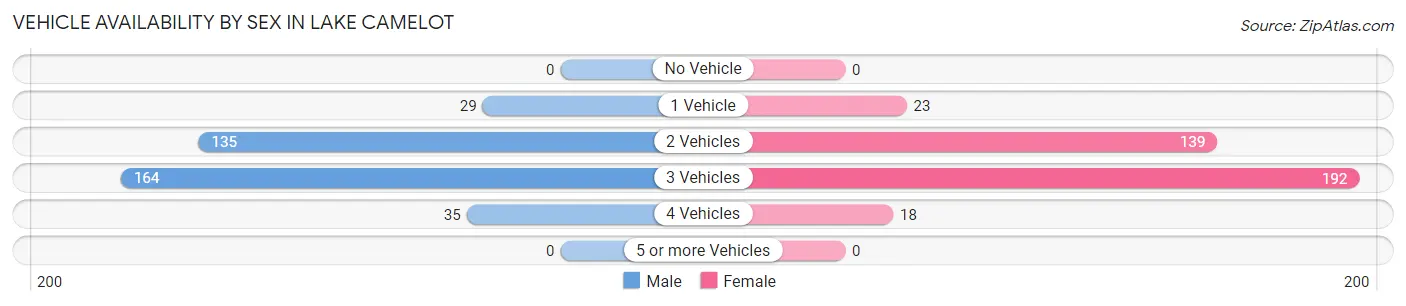
| Vehicles Available | Male | Female |
| No Vehicle | 0 (0.0%) | 0 (0.0%) |
| 1 Vehicle | 29 (8.0%) | 23 (6.2%) |
| 2 Vehicles | 135 (37.2%) | 139 (37.4%) |
| 3 Vehicles | 164 (45.2%) | 192 (51.6%) |
| 4 Vehicles | 35 (9.6%) | 18 (4.8%) |
| 5 or more Vehicles | 0 (0.0%) | 0 (0.0%) |
| Total | 363 (100.0%) | 372 (100.0%) |
Commute Time in Lake Camelot
The most frequently occuring commute durations in Lake Camelot are 30 to 34 minutes (163 commuters, 25.1%), 15 to 19 minutes (124 commuters, 19.1%), and 20 to 24 minutes (80 commuters, 12.3%).
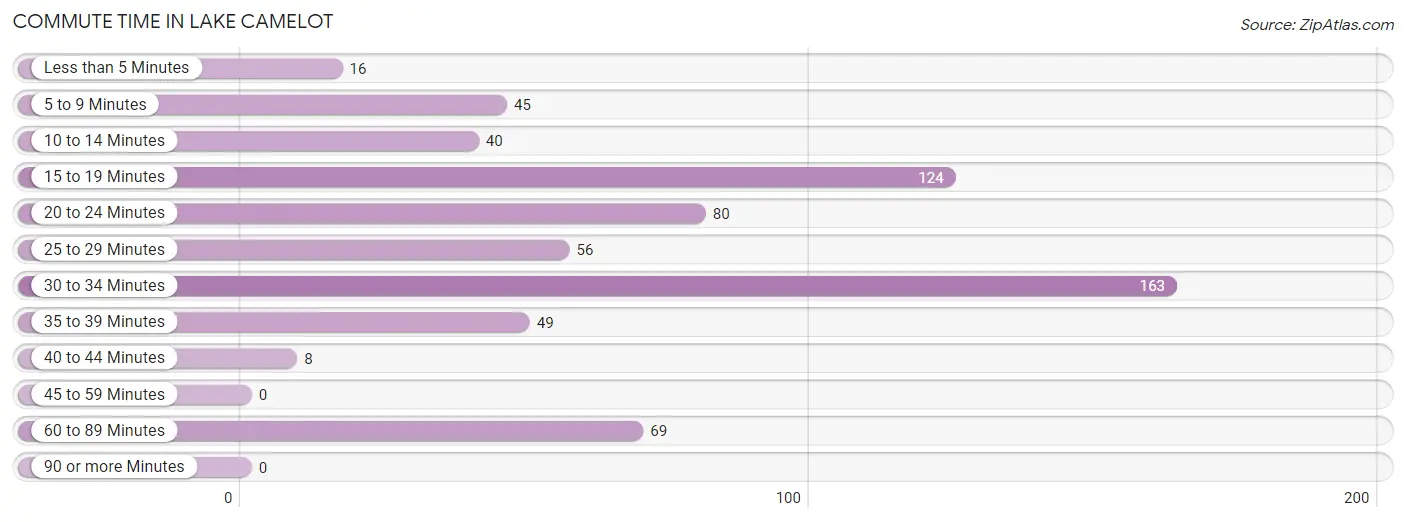
| Commute Time | # Commuters | % Commuters |
| Less than 5 Minutes | 16 | 2.5% |
| 5 to 9 Minutes | 45 | 6.9% |
| 10 to 14 Minutes | 40 | 6.1% |
| 15 to 19 Minutes | 124 | 19.1% |
| 20 to 24 Minutes | 80 | 12.3% |
| 25 to 29 Minutes | 56 | 8.6% |
| 30 to 34 Minutes | 163 | 25.1% |
| 35 to 39 Minutes | 49 | 7.5% |
| 40 to 44 Minutes | 8 | 1.2% |
| 45 to 59 Minutes | 0 | 0.0% |
| 60 to 89 Minutes | 69 | 10.6% |
| 90 or more Minutes | 0 | 0.0% |
Commute Time by Sex in Lake Camelot
The most common commute times in Lake Camelot are 30 to 34 minutes (99 commuters, 29.6%) for males and 15 to 19 minutes (92 commuters, 29.1%) for females.
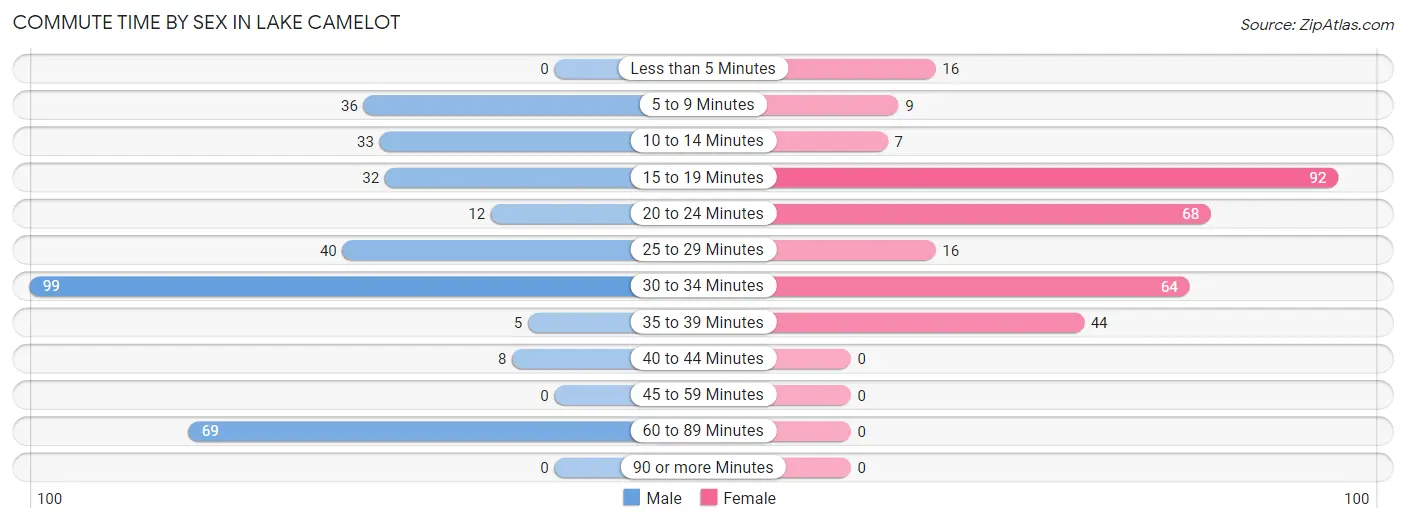
| Commute Time | Male | Female |
| Less than 5 Minutes | 0 (0.0%) | 16 (5.1%) |
| 5 to 9 Minutes | 36 (10.8%) | 9 (2.9%) |
| 10 to 14 Minutes | 33 (9.9%) | 7 (2.2%) |
| 15 to 19 Minutes | 32 (9.6%) | 92 (29.1%) |
| 20 to 24 Minutes | 12 (3.6%) | 68 (21.5%) |
| 25 to 29 Minutes | 40 (12.0%) | 16 (5.1%) |
| 30 to 34 Minutes | 99 (29.6%) | 64 (20.3%) |
| 35 to 39 Minutes | 5 (1.5%) | 44 (13.9%) |
| 40 to 44 Minutes | 8 (2.4%) | 0 (0.0%) |
| 45 to 59 Minutes | 0 (0.0%) | 0 (0.0%) |
| 60 to 89 Minutes | 69 (20.7%) | 0 (0.0%) |
| 90 or more Minutes | 0 (0.0%) | 0 (0.0%) |
Time of Departure to Work by Sex in Lake Camelot
The most frequent times of departure to work in Lake Camelot are 6:00 AM to 6:29 AM (81, 24.2%) for males and 7:30 AM to 7:59 AM (144, 45.6%) for females.
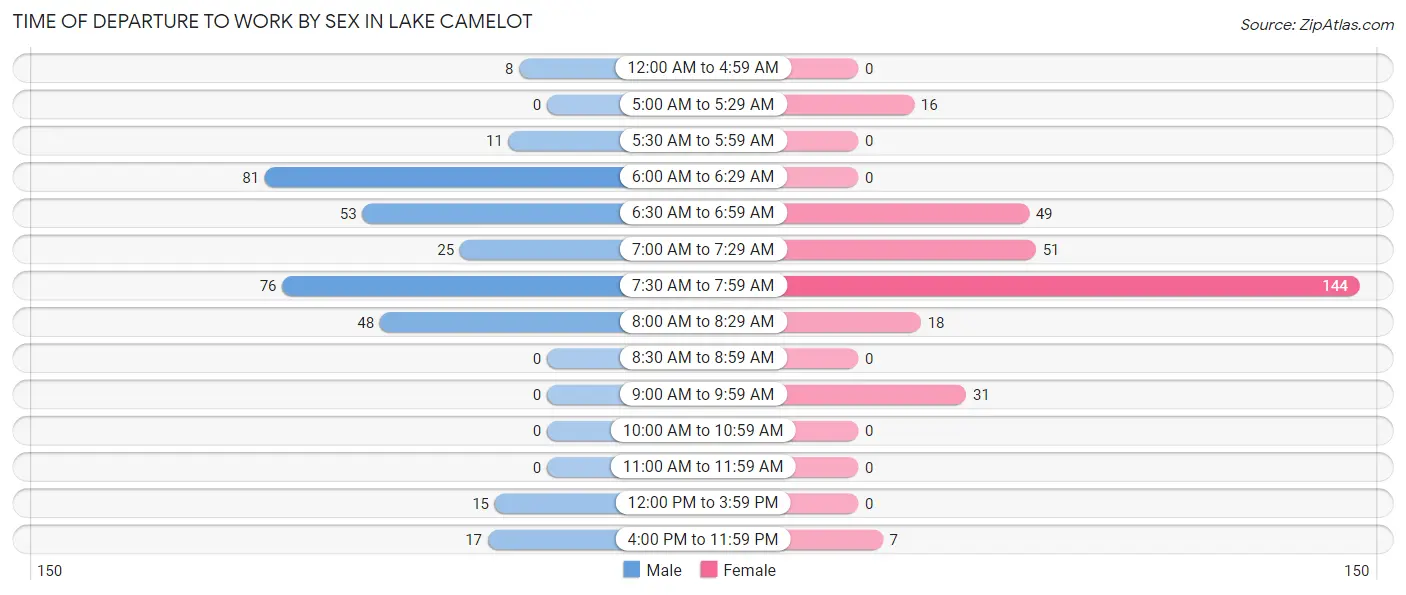
| Time of Departure | Male | Female |
| 12:00 AM to 4:59 AM | 8 (2.4%) | 0 (0.0%) |
| 5:00 AM to 5:29 AM | 0 (0.0%) | 16 (5.1%) |
| 5:30 AM to 5:59 AM | 11 (3.3%) | 0 (0.0%) |
| 6:00 AM to 6:29 AM | 81 (24.2%) | 0 (0.0%) |
| 6:30 AM to 6:59 AM | 53 (15.9%) | 49 (15.5%) |
| 7:00 AM to 7:29 AM | 25 (7.5%) | 51 (16.1%) |
| 7:30 AM to 7:59 AM | 76 (22.8%) | 144 (45.6%) |
| 8:00 AM to 8:29 AM | 48 (14.4%) | 18 (5.7%) |
| 8:30 AM to 8:59 AM | 0 (0.0%) | 0 (0.0%) |
| 9:00 AM to 9:59 AM | 0 (0.0%) | 31 (9.8%) |
| 10:00 AM to 10:59 AM | 0 (0.0%) | 0 (0.0%) |
| 11:00 AM to 11:59 AM | 0 (0.0%) | 0 (0.0%) |
| 12:00 PM to 3:59 PM | 15 (4.5%) | 0 (0.0%) |
| 4:00 PM to 11:59 PM | 17 (5.1%) | 7 (2.2%) |
| Total | 334 (100.0%) | 316 (100.0%) |
Housing Occupancy in Lake Camelot
Occupancy by Ownership in Lake Camelot
Of the total 564 dwellings in Lake Camelot, owner-occupied units account for 564 (100.0%), while renter-occupied units make up 0 (0.0%).

| Occupancy | # Housing Units | % Housing Units |
| Owner Occupied Housing Units | 564 | 100.0% |
| Renter-Occupied Housing Units | 0 | 0.0% |
| Total Occupied Housing Units | 564 | 100.0% |
Occupancy by Household Size in Lake Camelot
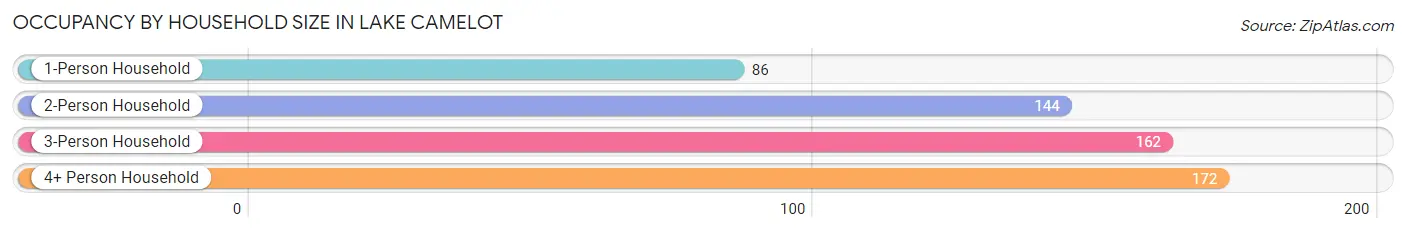
| Household Size | # Housing Units | % Housing Units |
| 1-Person Household | 86 | 15.2% |
| 2-Person Household | 144 | 25.5% |
| 3-Person Household | 162 | 28.7% |
| 4+ Person Household | 172 | 30.5% |
| Total Housing Units | 564 | 100.0% |
Occupancy by Ownership by Household Size in Lake Camelot
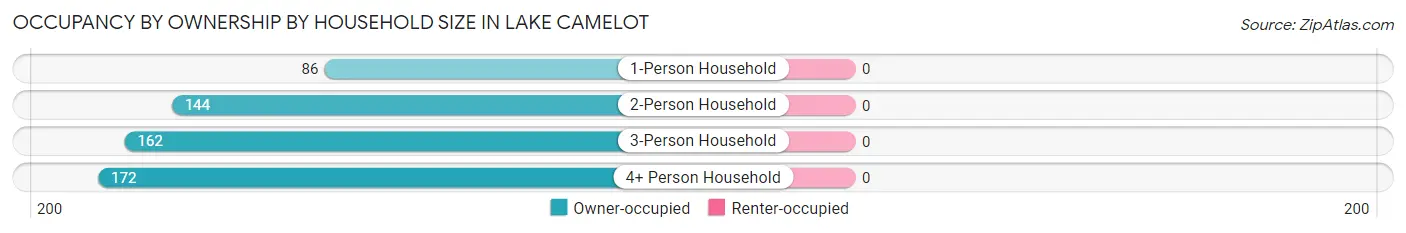
| Household Size | Owner-occupied | Renter-occupied |
| 1-Person Household | 86 (100.0%) | 0 (0.0%) |
| 2-Person Household | 144 (100.0%) | 0 (0.0%) |
| 3-Person Household | 162 (100.0%) | 0 (0.0%) |
| 4+ Person Household | 172 (100.0%) | 0 (0.0%) |
| Total Housing Units | 564 (100.0%) | 0 (0.0%) |
Occupancy by Educational Attainment in Lake Camelot
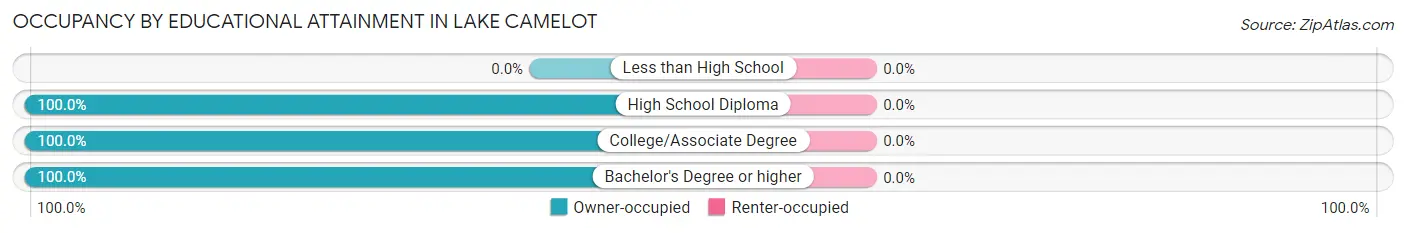
| Household Size | Owner-occupied | Renter-occupied |
| Less than High School | 0 (0.0%) | 0 (0.0%) |
| High School Diploma | 92 (100.0%) | 0 (0.0%) |
| College/Associate Degree | 228 (100.0%) | 0 (0.0%) |
| Bachelor's Degree or higher | 244 (100.0%) | 0 (0.0%) |
Occupancy by Age of Householder in Lake Camelot
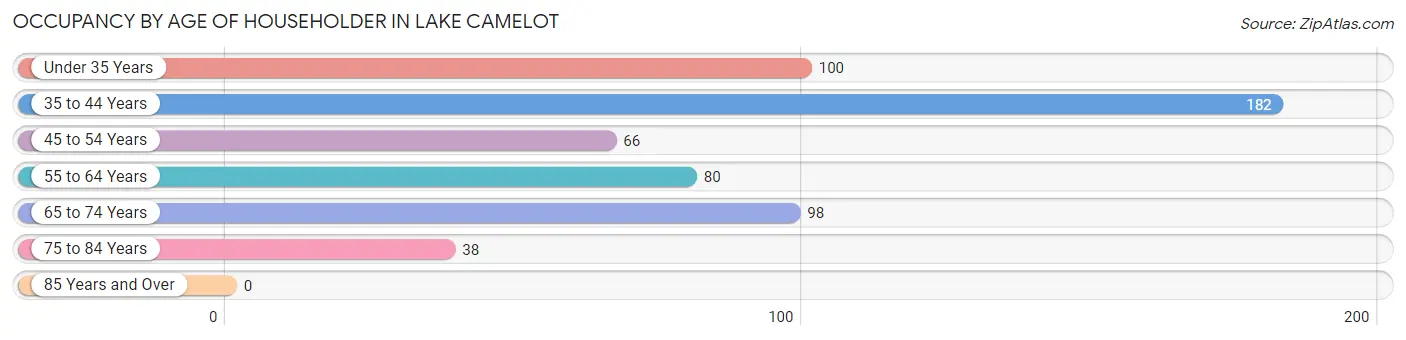
| Age Bracket | # Households | % Households |
| Under 35 Years | 100 | 17.7% |
| 35 to 44 Years | 182 | 32.3% |
| 45 to 54 Years | 66 | 11.7% |
| 55 to 64 Years | 80 | 14.2% |
| 65 to 74 Years | 98 | 17.4% |
| 75 to 84 Years | 38 | 6.7% |
| 85 Years and Over | 0 | 0.0% |
| Total | 564 | 100.0% |
Housing Finances in Lake Camelot
Median Income by Occupancy in Lake Camelot
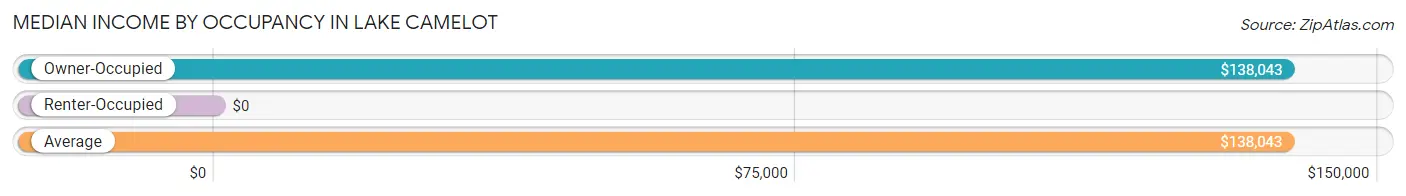
| Occupancy Type | # Households | Median Income |
| Owner-Occupied | 564 (100.0%) | $138,043 |
| Renter-Occupied | 0 (0.0%) | $0 |
| Average | 564 (100.0%) | $138,043 |
Occupancy by Householder Income Bracket in Lake Camelot
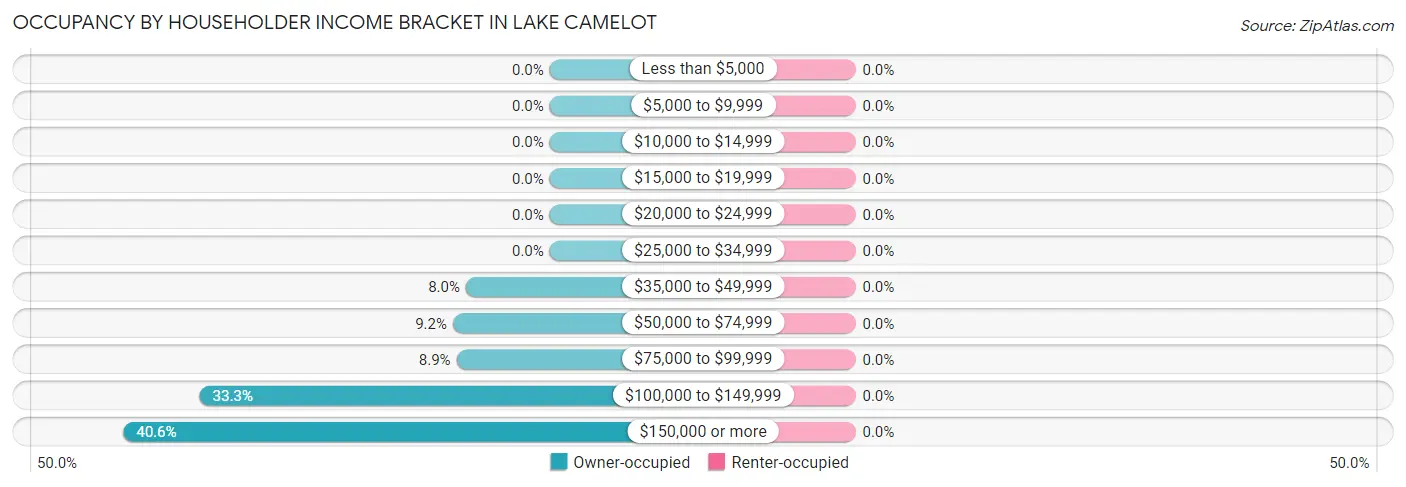
| Income Bracket | Owner-occupied | Renter-occupied |
| Less than $5,000 | 0 (0.0%) | 0 (0.0%) |
| $5,000 to $9,999 | 0 (0.0%) | 0 (0.0%) |
| $10,000 to $14,999 | 0 (0.0%) | 0 (0.0%) |
| $15,000 to $19,999 | 0 (0.0%) | 0 (0.0%) |
| $20,000 to $24,999 | 0 (0.0%) | 0 (0.0%) |
| $25,000 to $34,999 | 0 (0.0%) | 0 (0.0%) |
| $35,000 to $49,999 | 45 (8.0%) | 0 (0.0%) |
| $50,000 to $74,999 | 52 (9.2%) | 0 (0.0%) |
| $75,000 to $99,999 | 50 (8.9%) | 0 (0.0%) |
| $100,000 to $149,999 | 188 (33.3%) | 0 (0.0%) |
| $150,000 or more | 229 (40.6%) | 0 (0.0%) |
| Total | 564 (100.0%) | 0 (0.0%) |
Monthly Housing Cost Tiers in Lake Camelot
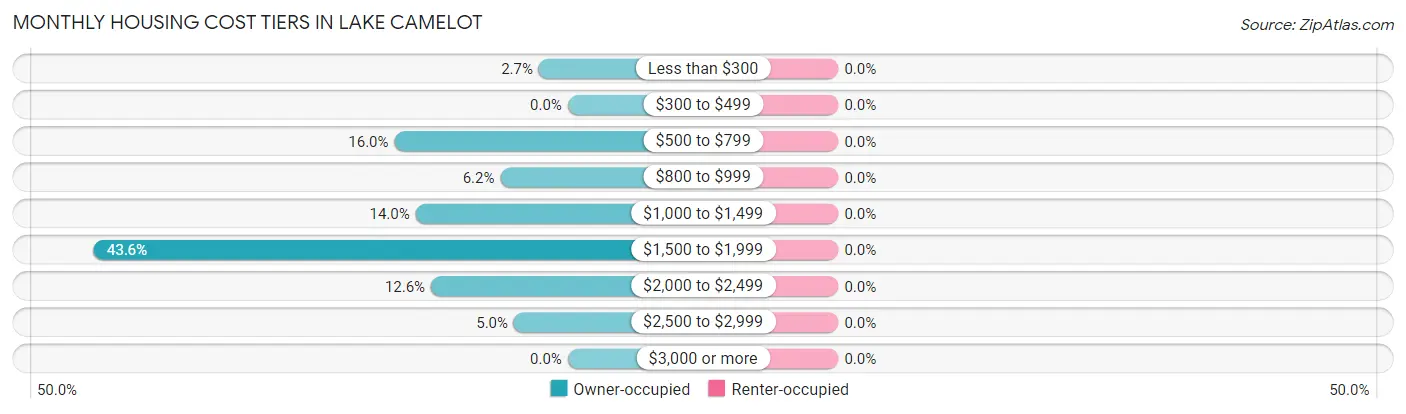
| Monthly Cost | Owner-occupied | Renter-occupied |
| Less than $300 | 15 (2.7%) | 0 (0.0%) |
| $300 to $499 | 0 (0.0%) | 0 (0.0%) |
| $500 to $799 | 90 (16.0%) | 0 (0.0%) |
| $800 to $999 | 35 (6.2%) | 0 (0.0%) |
| $1,000 to $1,499 | 79 (14.0%) | 0 (0.0%) |
| $1,500 to $1,999 | 246 (43.6%) | 0 (0.0%) |
| $2,000 to $2,499 | 71 (12.6%) | 0 (0.0%) |
| $2,500 to $2,999 | 28 (5.0%) | 0 (0.0%) |
| $3,000 or more | 0 (0.0%) | 0 (0.0%) |
| Total | 564 (100.0%) | 0 (0.0%) |
Physical Housing Characteristics in Lake Camelot
Housing Structures in Lake Camelot
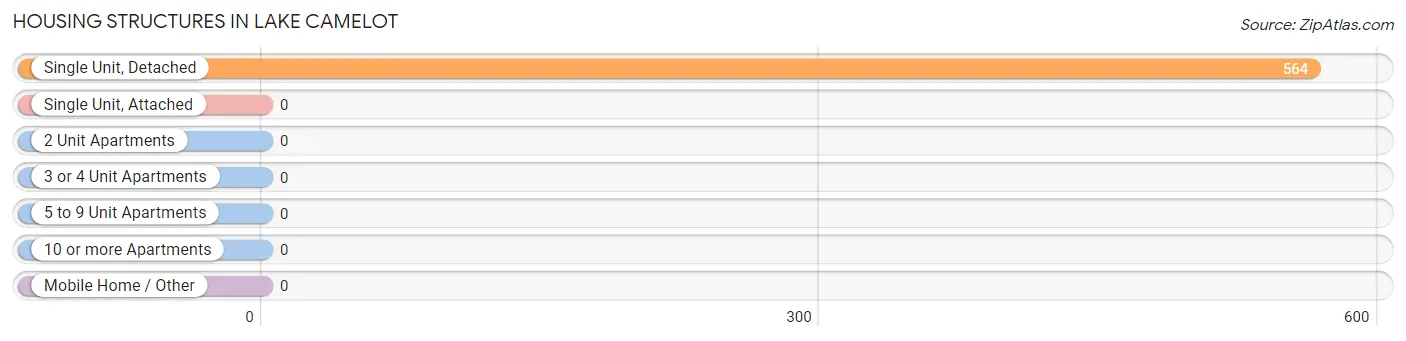
| Structure Type | # Housing Units | % Housing Units |
| Single Unit, Detached | 564 | 100.0% |
| Single Unit, Attached | 0 | 0.0% |
| 2 Unit Apartments | 0 | 0.0% |
| 3 or 4 Unit Apartments | 0 | 0.0% |
| 5 to 9 Unit Apartments | 0 | 0.0% |
| 10 or more Apartments | 0 | 0.0% |
| Mobile Home / Other | 0 | 0.0% |
| Total | 564 | 100.0% |
Housing Structures by Occupancy in Lake Camelot
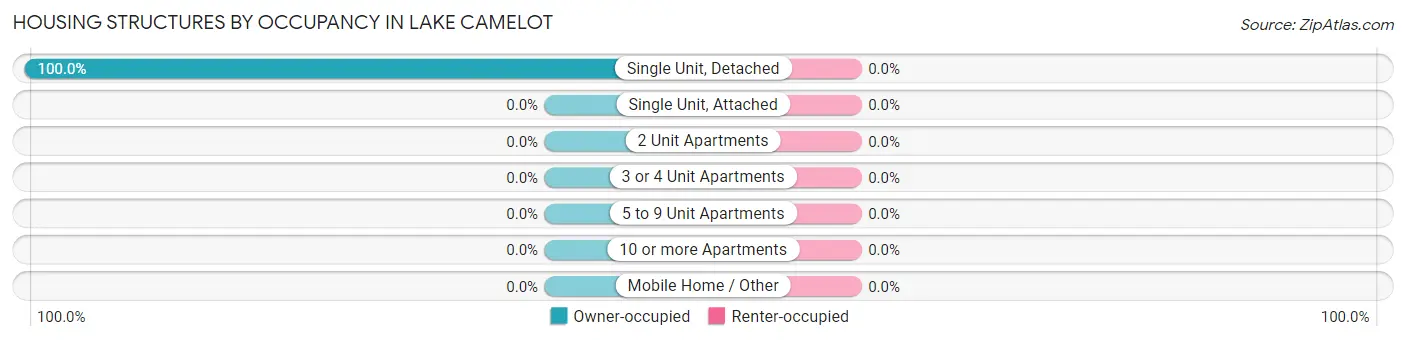
| Structure Type | Owner-occupied | Renter-occupied |
| Single Unit, Detached | 564 (100.0%) | 0 (0.0%) |
| Single Unit, Attached | 0 (0.0%) | 0 (0.0%) |
| 2 Unit Apartments | 0 (0.0%) | 0 (0.0%) |
| 3 or 4 Unit Apartments | 0 (0.0%) | 0 (0.0%) |
| 5 to 9 Unit Apartments | 0 (0.0%) | 0 (0.0%) |
| 10 or more Apartments | 0 (0.0%) | 0 (0.0%) |
| Mobile Home / Other | 0 (0.0%) | 0 (0.0%) |
| Total | 564 (100.0%) | 0 (0.0%) |
Housing Structures by Number of Rooms in Lake Camelot
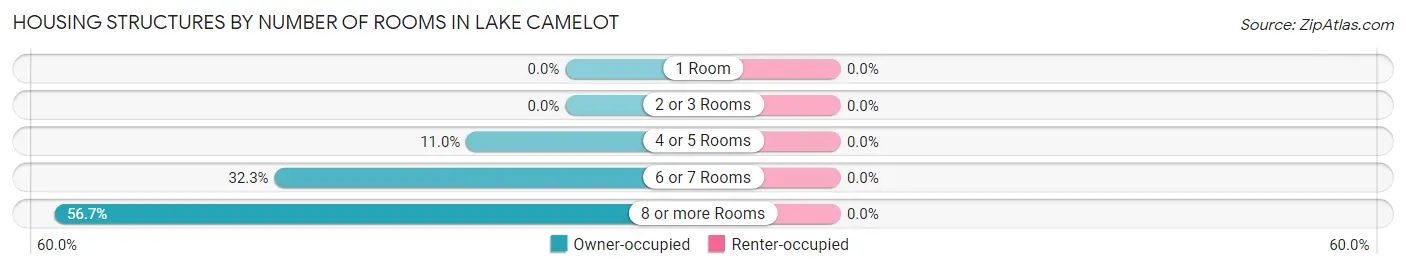
| Number of Rooms | Owner-occupied | Renter-occupied |
| 1 Room | 0 (0.0%) | 0 (0.0%) |
| 2 or 3 Rooms | 0 (0.0%) | 0 (0.0%) |
| 4 or 5 Rooms | 62 (11.0%) | 0 (0.0%) |
| 6 or 7 Rooms | 182 (32.3%) | 0 (0.0%) |
| 8 or more Rooms | 320 (56.7%) | 0 (0.0%) |
| Total | 564 (100.0%) | 0 (0.0%) |
Housing Structure by Heating Type in Lake Camelot
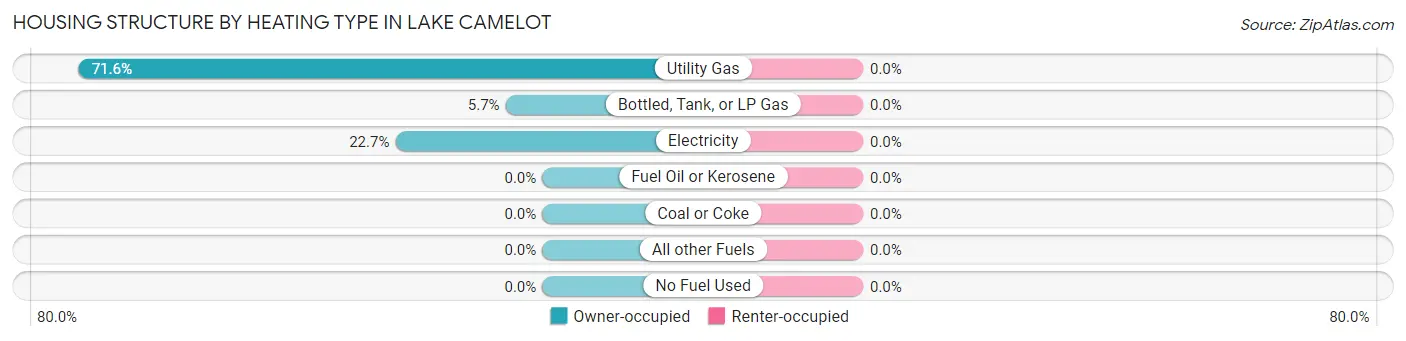
| Heating Type | Owner-occupied | Renter-occupied |
| Utility Gas | 404 (71.6%) | 0 (0.0%) |
| Bottled, Tank, or LP Gas | 32 (5.7%) | 0 (0.0%) |
| Electricity | 128 (22.7%) | 0 (0.0%) |
| Fuel Oil or Kerosene | 0 (0.0%) | 0 (0.0%) |
| Coal or Coke | 0 (0.0%) | 0 (0.0%) |
| All other Fuels | 0 (0.0%) | 0 (0.0%) |
| No Fuel Used | 0 (0.0%) | 0 (0.0%) |
| Total | 564 (100.0%) | 0 (0.0%) |
Household Vehicle Usage in Lake Camelot
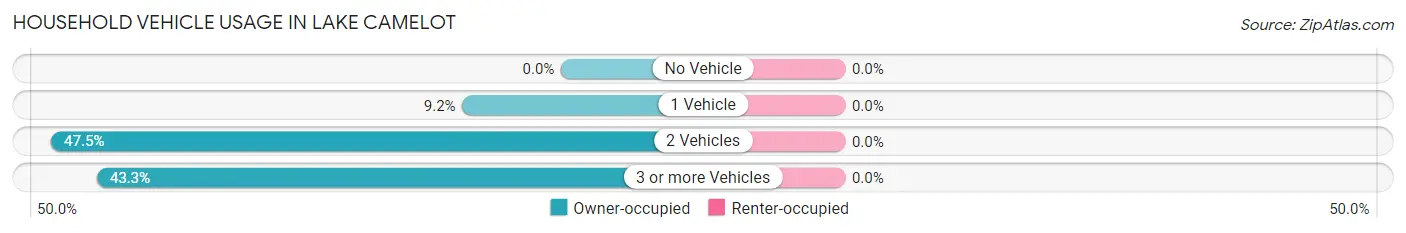
| Vehicles per Household | Owner-occupied | Renter-occupied |
| No Vehicle | 0 (0.0%) | 0 (0.0%) |
| 1 Vehicle | 52 (9.2%) | 0 (0.0%) |
| 2 Vehicles | 268 (47.5%) | 0 (0.0%) |
| 3 or more Vehicles | 244 (43.3%) | 0 (0.0%) |
| Total | 564 (100.0%) | 0 (0.0%) |
Real Estate & Mortgages in Lake Camelot
Real Estate and Mortgage Overview in Lake Camelot
| Characteristic | Without Mortgage | With Mortgage |
| Housing Units | 156 | 408 |
| Median Property Value | $209,200 | $227,000 |
| Median Household Income | $114,667 | $210 |
| Monthly Housing Costs | $734 | $0 |
| Real Estate Taxes | $4,750 | $0 |
Property Value by Mortgage Status in Lake Camelot
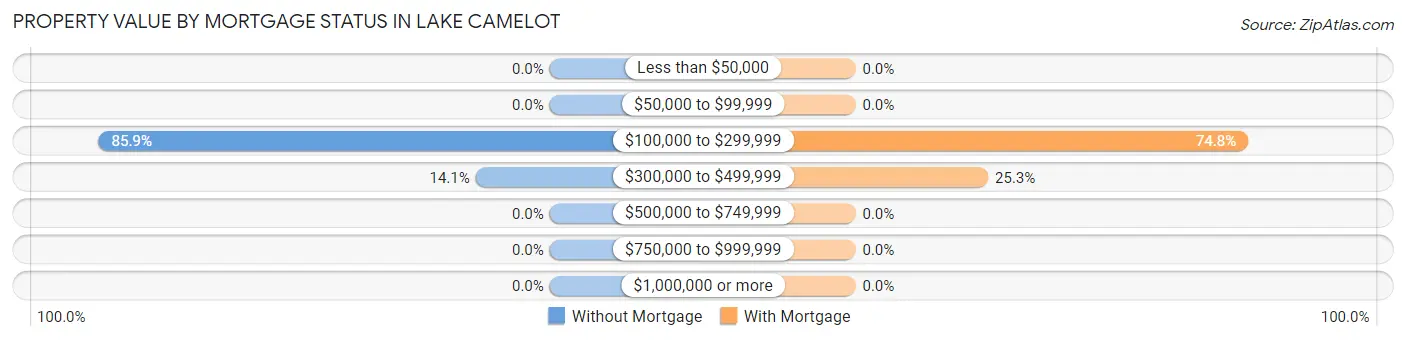
| Property Value | Without Mortgage | With Mortgage |
| Less than $50,000 | 0 (0.0%) | 0 (0.0%) |
| $50,000 to $99,999 | 0 (0.0%) | 0 (0.0%) |
| $100,000 to $299,999 | 134 (85.9%) | 305 (74.8%) |
| $300,000 to $499,999 | 22 (14.1%) | 103 (25.3%) |
| $500,000 to $749,999 | 0 (0.0%) | 0 (0.0%) |
| $750,000 to $999,999 | 0 (0.0%) | 0 (0.0%) |
| $1,000,000 or more | 0 (0.0%) | 0 (0.0%) |
| Total | 156 (100.0%) | 408 (100.0%) |
Household Income by Mortgage Status in Lake Camelot
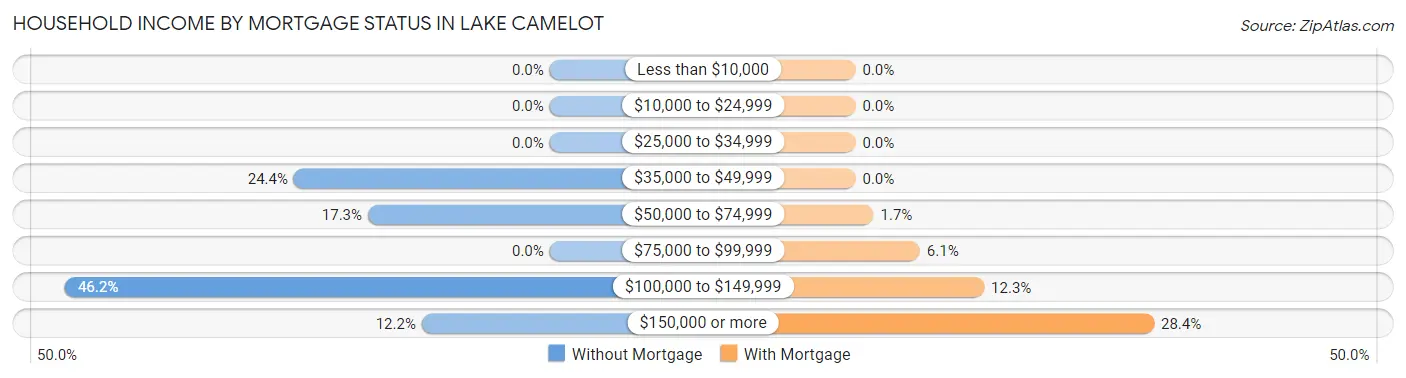
| Household Income | Without Mortgage | With Mortgage |
| Less than $10,000 | 0 (0.0%) | 0 (0.0%) |
| $10,000 to $24,999 | 0 (0.0%) | 0 (0.0%) |
| $25,000 to $34,999 | 0 (0.0%) | 0 (0.0%) |
| $35,000 to $49,999 | 38 (24.4%) | 0 (0.0%) |
| $50,000 to $74,999 | 27 (17.3%) | 7 (1.7%) |
| $75,000 to $99,999 | 0 (0.0%) | 25 (6.1%) |
| $100,000 to $149,999 | 72 (46.2%) | 50 (12.2%) |
| $150,000 or more | 19 (12.2%) | 116 (28.4%) |
| Total | 156 (100.0%) | 408 (100.0%) |
Property Value to Household Income Ratio in Lake Camelot
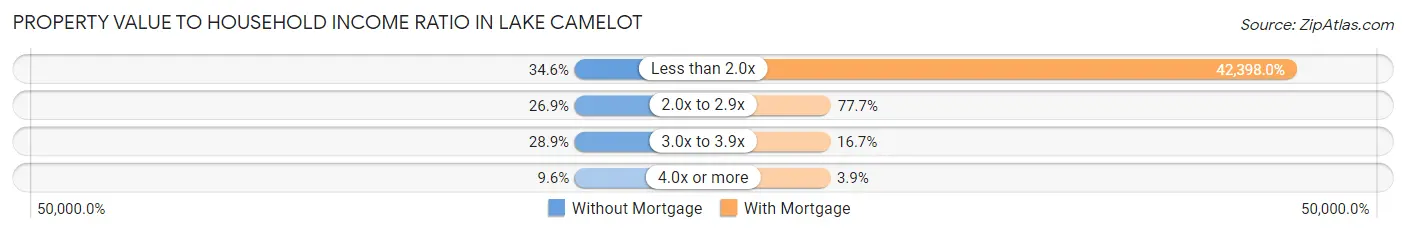
| Value-to-Income Ratio | Without Mortgage | With Mortgage |
| Less than 2.0x | 54 (34.6%) | 172,984 (42,398.0%) |
| 2.0x to 2.9x | 42 (26.9%) | 317 (77.7%) |
| 3.0x to 3.9x | 45 (28.8%) | 68 (16.7%) |
| 4.0x or more | 15 (9.6%) | 16 (3.9%) |
| Total | 156 (100.0%) | 408 (100.0%) |
Real Estate Taxes by Mortgage Status in Lake Camelot
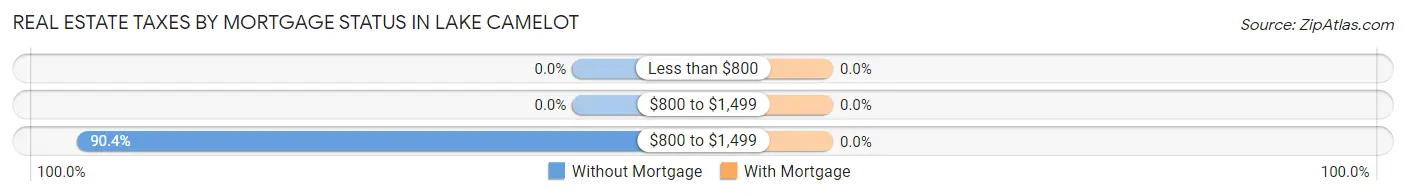
| Property Taxes | Without Mortgage | With Mortgage |
| Less than $800 | 0 (0.0%) | 0 (0.0%) |
| $800 to $1,499 | 0 (0.0%) | 0 (0.0%) |
| $800 to $1,499 | 141 (90.4%) | 0 (0.0%) |
| Total | 156 (100.0%) | 408 (100.0%) |
Health & Disability in Lake Camelot
Health Insurance Coverage by Age in Lake Camelot
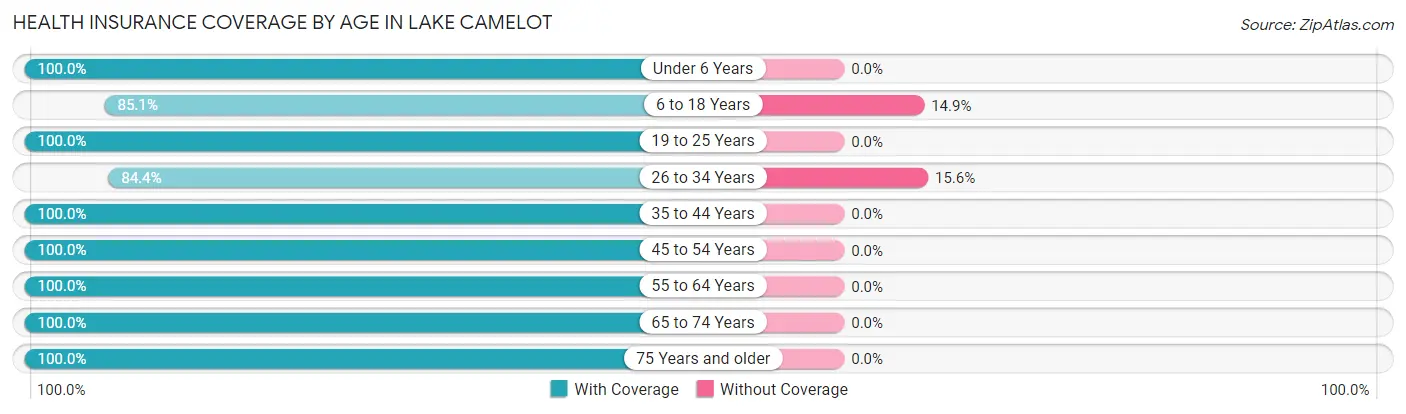
| Age Bracket | With Coverage | Without Coverage |
| Under 6 Years | 162 (100.0%) | 0 (0.0%) |
| 6 to 18 Years | 331 (85.1%) | 58 (14.9%) |
| 19 to 25 Years | 40 (100.0%) | 0 (0.0%) |
| 26 to 34 Years | 135 (84.4%) | 25 (15.6%) |
| 35 to 44 Years | 249 (100.0%) | 0 (0.0%) |
| 45 to 54 Years | 211 (100.0%) | 0 (0.0%) |
| 55 to 64 Years | 143 (100.0%) | 0 (0.0%) |
| 65 to 74 Years | 155 (100.0%) | 0 (0.0%) |
| 75 Years and older | 56 (100.0%) | 0 (0.0%) |
| Total | 1,482 (94.7%) | 83 (5.3%) |
Health Insurance Coverage by Citizenship Status in Lake Camelot
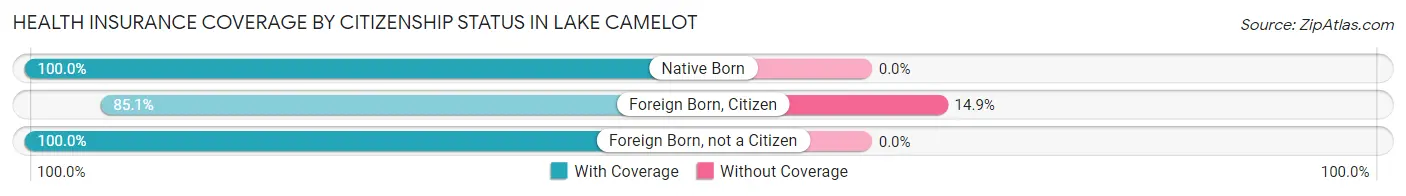
| Citizenship Status | With Coverage | Without Coverage |
| Native Born | 162 (100.0%) | 0 (0.0%) |
| Foreign Born, Citizen | 331 (85.1%) | 58 (14.9%) |
| Foreign Born, not a Citizen | 40 (100.0%) | 0 (0.0%) |
Health Insurance Coverage by Household Income in Lake Camelot
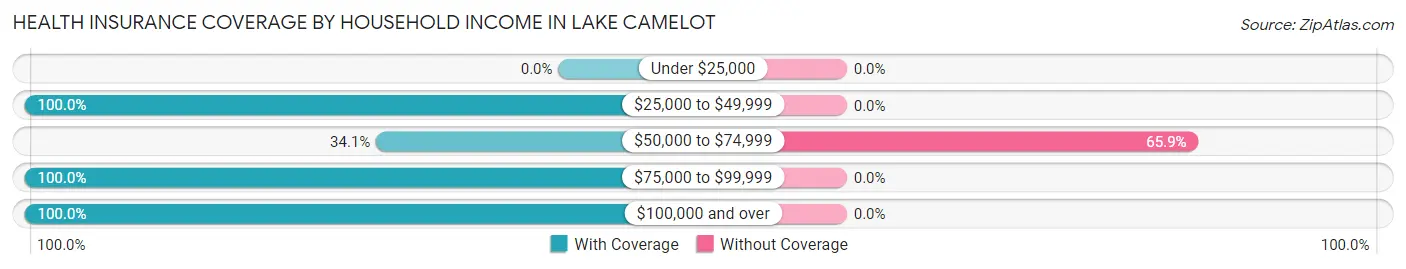
| Household Income | With Coverage | Without Coverage |
| Under $25,000 | 0 (0.0%) | 0 (0.0%) |
| $25,000 to $49,999 | 63 (100.0%) | 0 (0.0%) |
| $50,000 to $74,999 | 43 (34.1%) | 83 (65.9%) |
| $75,000 to $99,999 | 176 (100.0%) | 0 (0.0%) |
| $100,000 and over | 1,200 (100.0%) | 0 (0.0%) |
Public vs Private Health Insurance Coverage by Age in Lake Camelot
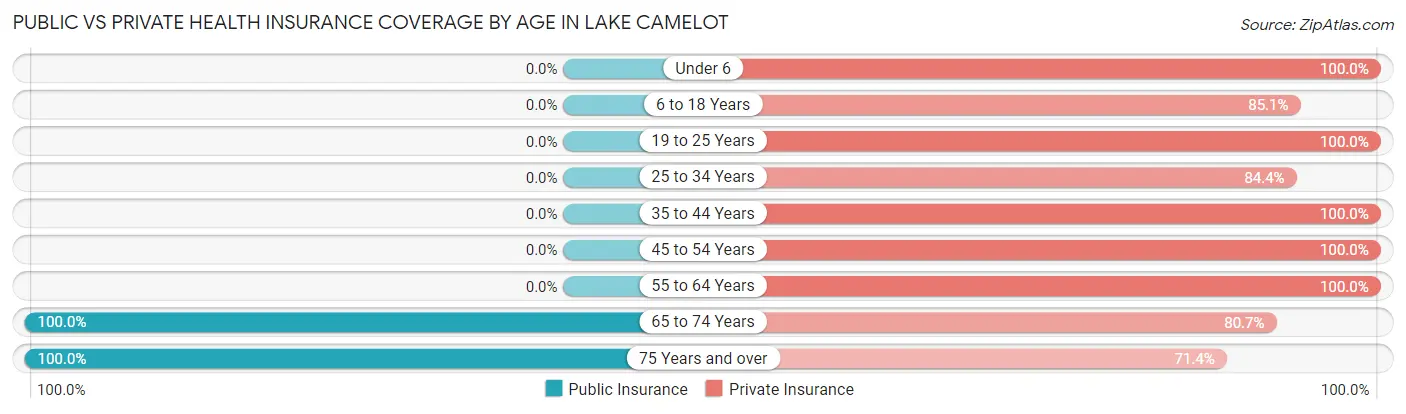
| Age Bracket | Public Insurance | Private Insurance |
| Under 6 | 0 (0.0%) | 162 (100.0%) |
| 6 to 18 Years | 0 (0.0%) | 331 (85.1%) |
| 19 to 25 Years | 0 (0.0%) | 40 (100.0%) |
| 25 to 34 Years | 0 (0.0%) | 135 (84.4%) |
| 35 to 44 Years | 0 (0.0%) | 249 (100.0%) |
| 45 to 54 Years | 0 (0.0%) | 211 (100.0%) |
| 55 to 64 Years | 0 (0.0%) | 143 (100.0%) |
| 65 to 74 Years | 155 (100.0%) | 125 (80.6%) |
| 75 Years and over | 56 (100.0%) | 40 (71.4%) |
| Total | 211 (13.5%) | 1,436 (91.8%) |
Disability Status by Sex by Age in Lake Camelot
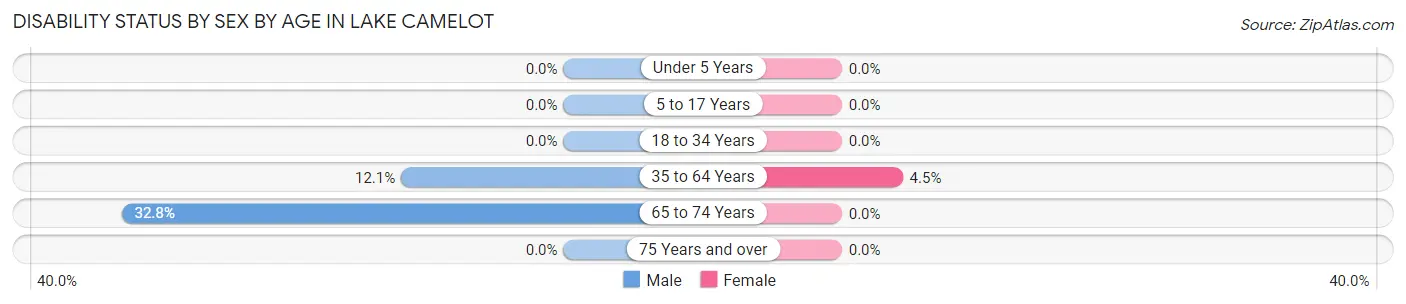
| Age Bracket | Male | Female |
| Under 5 Years | 0 (0.0%) | 0 (0.0%) |
| 5 to 17 Years | 0 (0.0%) | 0 (0.0%) |
| 18 to 34 Years | 0 (0.0%) | 0 (0.0%) |
| 35 to 64 Years | 30 (12.0%) | 16 (4.5%) |
| 65 to 74 Years | 41 (32.8%) | 0 (0.0%) |
| 75 Years and over | 0 (0.0%) | 0 (0.0%) |
Disability Class by Sex by Age in Lake Camelot
Disability Class: Hearing Difficulty
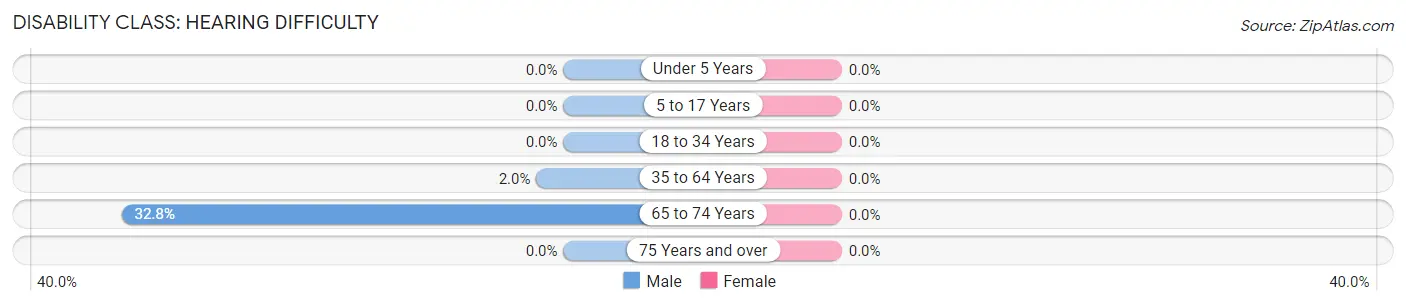
| Age Bracket | Male | Female |
| Under 5 Years | 0 (0.0%) | 0 (0.0%) |
| 5 to 17 Years | 0 (0.0%) | 0 (0.0%) |
| 18 to 34 Years | 0 (0.0%) | 0 (0.0%) |
| 35 to 64 Years | 5 (2.0%) | 0 (0.0%) |
| 65 to 74 Years | 41 (32.8%) | 0 (0.0%) |
| 75 Years and over | 0 (0.0%) | 0 (0.0%) |
Disability Class: Vision Difficulty
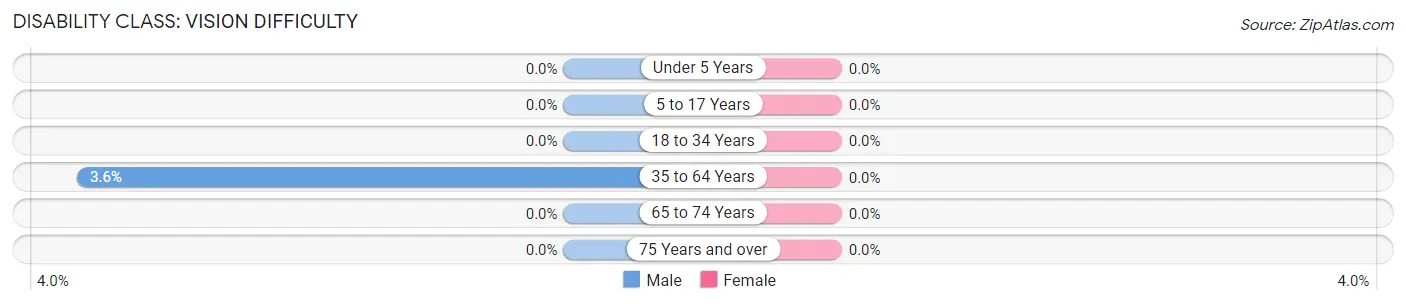
| Age Bracket | Male | Female |
| Under 5 Years | 0 (0.0%) | 0 (0.0%) |
| 5 to 17 Years | 0 (0.0%) | 0 (0.0%) |
| 18 to 34 Years | 0 (0.0%) | 0 (0.0%) |
| 35 to 64 Years | 9 (3.6%) | 0 (0.0%) |
| 65 to 74 Years | 0 (0.0%) | 0 (0.0%) |
| 75 Years and over | 0 (0.0%) | 0 (0.0%) |
Disability Class: Cognitive Difficulty
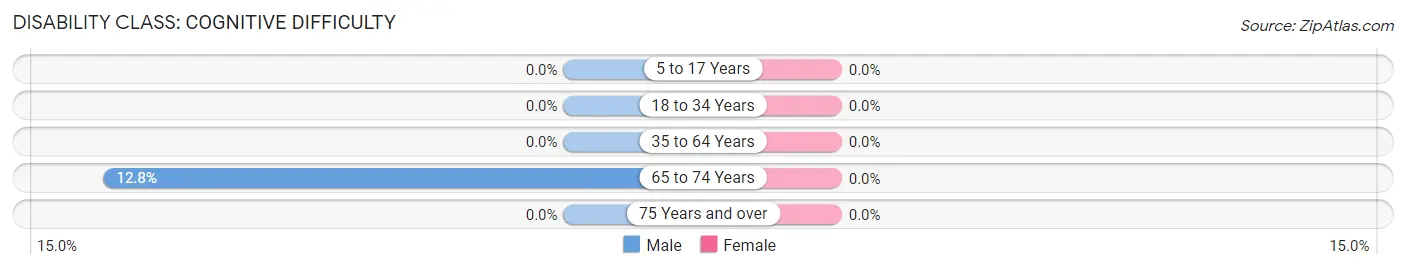
| Age Bracket | Male | Female |
| 5 to 17 Years | 0 (0.0%) | 0 (0.0%) |
| 18 to 34 Years | 0 (0.0%) | 0 (0.0%) |
| 35 to 64 Years | 0 (0.0%) | 0 (0.0%) |
| 65 to 74 Years | 16 (12.8%) | 0 (0.0%) |
| 75 Years and over | 0 (0.0%) | 0 (0.0%) |
Disability Class: Ambulatory Difficulty
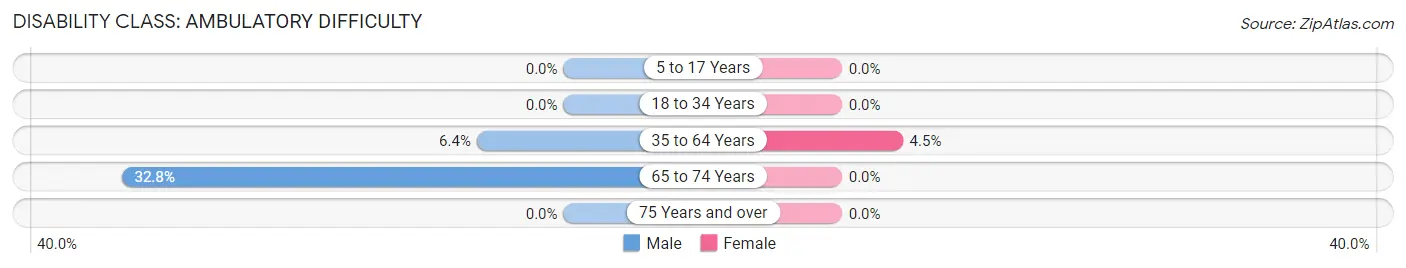
| Age Bracket | Male | Female |
| 5 to 17 Years | 0 (0.0%) | 0 (0.0%) |
| 18 to 34 Years | 0 (0.0%) | 0 (0.0%) |
| 35 to 64 Years | 16 (6.4%) | 16 (4.5%) |
| 65 to 74 Years | 41 (32.8%) | 0 (0.0%) |
| 75 Years and over | 0 (0.0%) | 0 (0.0%) |
Disability Class: Self-Care Difficulty
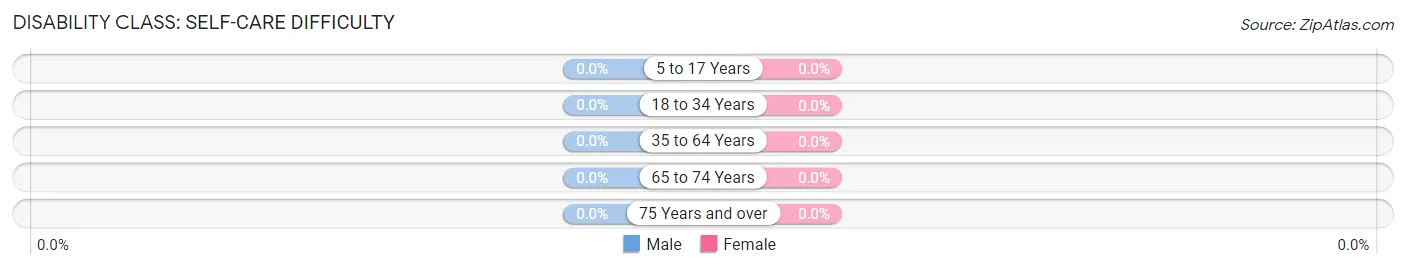
| Age Bracket | Male | Female |
| 5 to 17 Years | 0 (0.0%) | 0 (0.0%) |
| 18 to 34 Years | 0 (0.0%) | 0 (0.0%) |
| 35 to 64 Years | 0 (0.0%) | 0 (0.0%) |
| 65 to 74 Years | 0 (0.0%) | 0 (0.0%) |
| 75 Years and over | 0 (0.0%) | 0 (0.0%) |
Technology Access in Lake Camelot
Computing Device Access in Lake Camelot
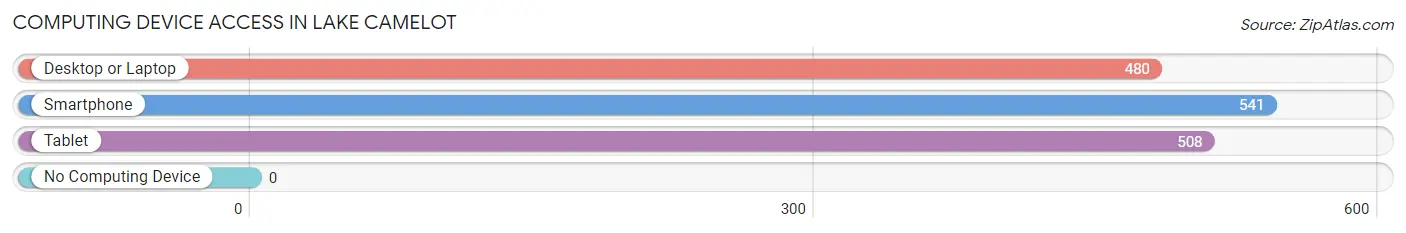
| Device Type | # Households | % Households |
| Desktop or Laptop | 480 | 85.1% |
| Smartphone | 541 | 95.9% |
| Tablet | 508 | 90.1% |
| No Computing Device | 0 | 0.0% |
| Total | 564 | 100.0% |
Internet Access in Lake Camelot
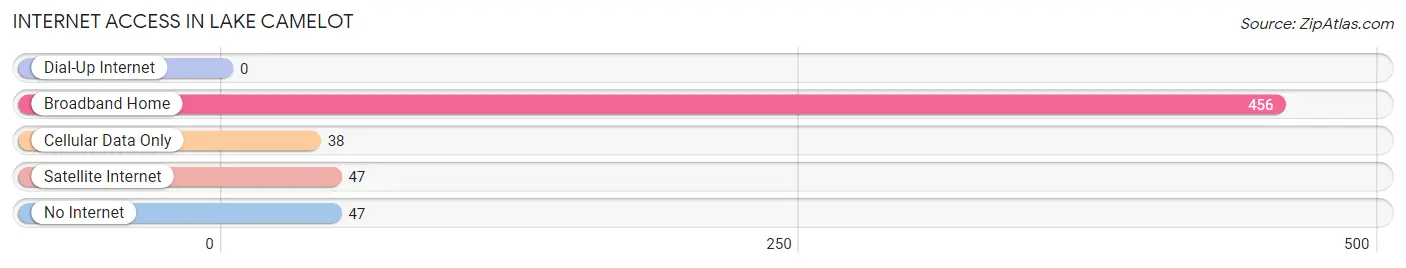
| Internet Type | # Households | % Households |
| Dial-Up Internet | 0 | 0.0% |
| Broadband Home | 456 | 80.8% |
| Cellular Data Only | 38 | 6.7% |
| Satellite Internet | 47 | 8.3% |
| No Internet | 47 | 8.3% |
| Total | 564 | 100.0% |
Lake Camelot Summary
Camelot, Illinois is a small village located in the northern part of Lake County, Illinois. It is situated on the banks of the Fox River, about 40 miles northwest of Chicago. The village was founded in 1836 and incorporated in 1837. It is named after the legendary castle of King Arthur, and is home to a population of about 1,500 people.
History
The area that is now Camelot was originally inhabited by the Potawatomi Native American tribe. The first settlers arrived in the area in the early 1800s, and the village was officially founded in 1836. The village was named after the legendary castle of King Arthur, and was incorporated in 1837.
The village was originally a farming community, and the main crops grown were wheat, corn, and oats. The village also had a sawmill, a gristmill, and a blacksmith shop. In the late 1800s, the village began to grow and develop, and the first school was built in 1876.
In the early 1900s, the village began to experience a period of growth and development. The first bank was established in 1906, and the first telephone service was established in 1908. The village also had a post office, a library, and a fire department.
In the 1950s, the village began to experience a period of decline. The population began to decline, and many businesses began to close. In the late 1970s, the village began to experience a period of revitalization, and the population began to increase.
Geography
Camelot is located in the northern part of Lake County, Illinois. It is situated on the banks of the Fox River, about 40 miles northwest of Chicago. The village covers an area of 1.2 square miles, and has a population of about 1,500 people.
The village is located in a rural area, and is surrounded by farmland and woodlands. The terrain is mostly flat, with some rolling hills. The climate is humid continental, with hot summers and cold winters.
Economy
The economy of Camelot is largely based on agriculture. The main crops grown in the area are wheat, corn, and oats. The village also has a few small businesses, including a grocery store, a hardware store, and a few restaurants.
The village also has a few small manufacturing businesses, including a furniture factory and a printing company. The village also has a few small service businesses, including a gas station and a car repair shop.
Demographics
As of the 2010 census, the population of Camelot was 1,500 people. The racial makeup of the village was 97.3% White, 0.7% African American, 0.3% Native American, 0.3% Asian, and 1.3% from other races. The median household income was $50,000, and the median family income was $60,000.
The village has a high rate of homeownership, with about 75% of the population owning their own homes. The village also has a high rate of educational attainment, with about 90% of the population having at least a high school diploma. The village also has a low rate of unemployment, with about 4% of the population being unemployed.
Common Questions
What is Per Capita Income in Lake Camelot?
Per Capita income in Lake Camelot is $47,322.
What is the Median Family Income in Lake Camelot?
Median Family Income in Lake Camelot is $117,303.
What is the Median Household income in Lake Camelot?
Median Household Income in Lake Camelot is $138,043.
What is Income or Wage Gap in Lake Camelot?
Income or Wage Gap in Lake Camelot is 42.8%.
Women in Lake Camelot earn 57.2 cents for every dollar earned by a man.
What is Inequality or Gini Index in Lake Camelot?
Inequality or Gini Index in Lake Camelot is 0.23.
What is the Total Population of Lake Camelot?
Total Population of Lake Camelot is 1,565.
What is the Total Male Population of Lake Camelot?
Total Male Population of Lake Camelot is 810.
What is the Total Female Population of Lake Camelot?
Total Female Population of Lake Camelot is 755.
What is the Ratio of Males per 100 Females in Lake Camelot?
There are 107.28 Males per 100 Females in Lake Camelot.
What is the Ratio of Females per 100 Males in Lake Camelot?
There are 93.21 Females per 100 Males in Lake Camelot.
What is the Median Population Age in Lake Camelot?
Median Population Age in Lake Camelot is 40.1 Years.
What is the Average Family Size in Lake Camelot
Average Family Size in Lake Camelot is 3.0 People.
What is the Average Household Size in Lake Camelot
Average Household Size in Lake Camelot is 2.8 People.
How Large is the Labor Force in Lake Camelot?
There are 751 People in the Labor Forcein in Lake Camelot.
What is the Percentage of People in the Labor Force in Lake Camelot?
66.4% of People are in the Labor Force in Lake Camelot.
What is the Unemployment Rate in Lake Camelot?
Unemployment Rate in Lake Camelot is 2.1%.