Markham, IL Map & Demographics
Markham Map
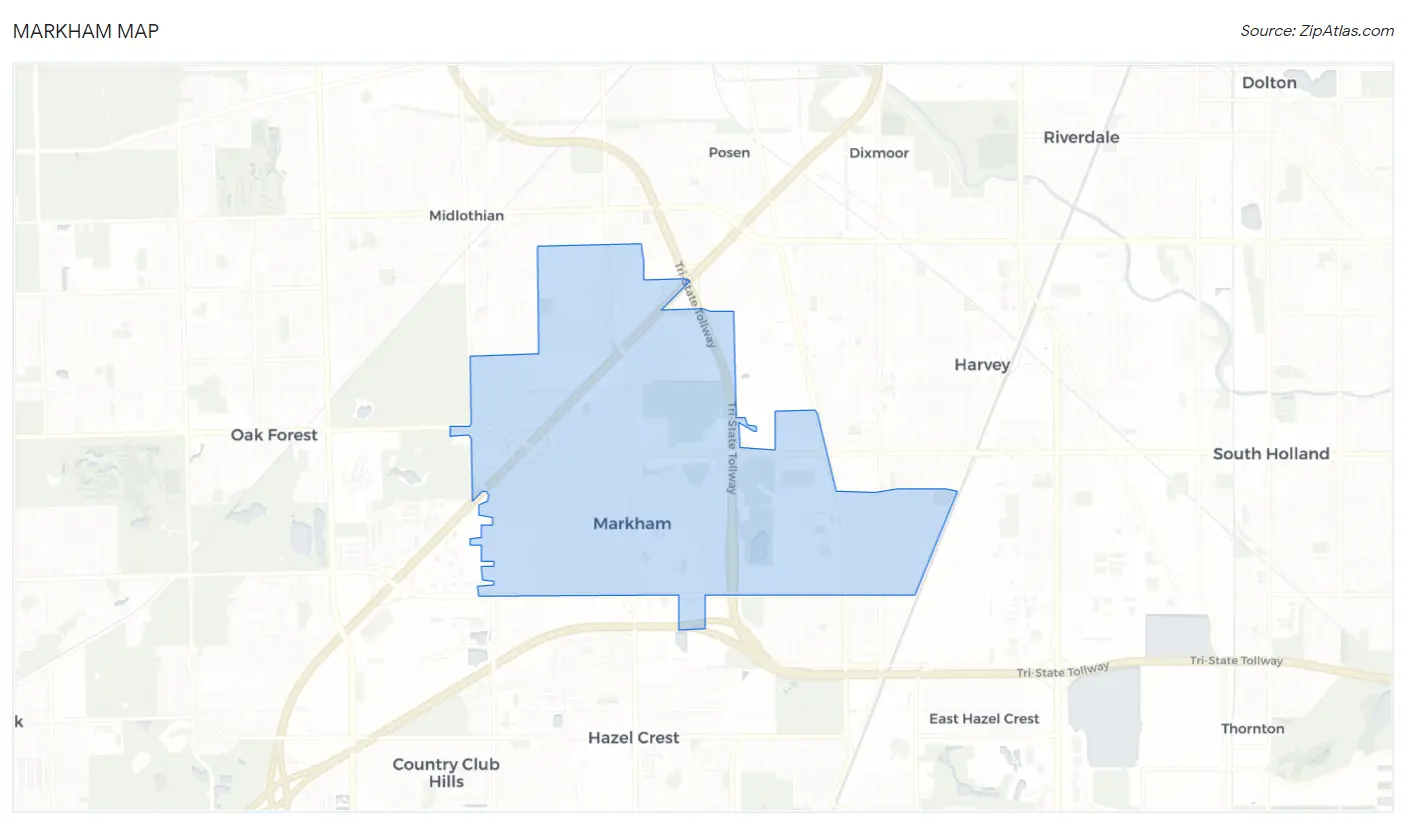
Markham Overview
$22,794
PER CAPITA INCOME
$51,400
AVG FAMILY INCOME
$47,955
AVG HOUSEHOLD INCOME
15.6%
WAGE / INCOME GAP [ % ]
84.4¢/ $1
WAGE / INCOME GAP [ $ ]
0.49
INEQUALITY / GINI INDEX
11,592
TOTAL POPULATION
5,453
MALE POPULATION
6,139
FEMALE POPULATION
88.83
MALES / 100 FEMALES
112.58
FEMALES / 100 MALES
33.2
MEDIAN AGE
3.8
AVG FAMILY SIZE
3.1
AVG HOUSEHOLD SIZE
4,928
LABOR FORCE [ PEOPLE ]
59.1%
PERCENT IN LABOR FORCE
14.0%
UNEMPLOYMENT RATE
Markham Zip Codes
Markham Area Codes
Income in Markham
Income Overview in Markham
Per Capita Income in Markham is $22,794, while median incomes of families and households are $51,400 and $47,955 respectively.
| Characteristic | Number | Measure |
| Per Capita Income | 11,592 | $22,794 |
| Median Family Income | 2,610 | $51,400 |
| Mean Family Income | 2,610 | $66,130 |
| Median Household Income | 3,703 | $47,955 |
| Mean Household Income | 3,703 | $68,091 |
| Income Deficit | 2,610 | $0 |
| Wage / Income Gap (%) | 11,592 | 15.65% |
| Wage / Income Gap ($) | 11,592 | 84.35¢ per $1 |
| Gini / Inequality Index | 11,592 | 0.49 |
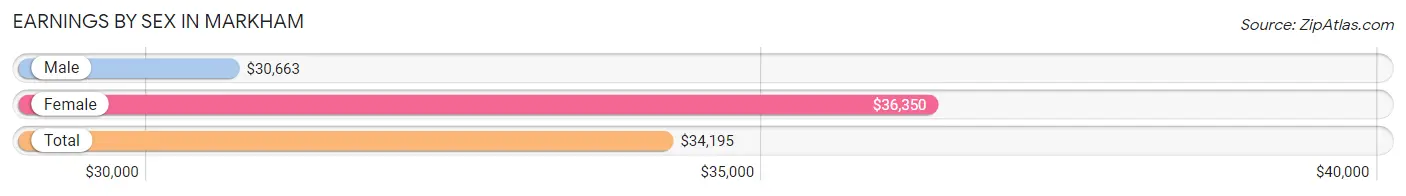
Earnings by Sex in Markham
Average Earnings in Markham are $34,195, $30,663 for men and $36,350 for women, a difference of 15.7%.
| Sex | Number | Average Earnings |
| Male | 2,040 (44.6%) | $30,663 |
| Female | 2,539 (55.4%) | $36,350 |
| Total | 4,579 (100.0%) | $34,195 |
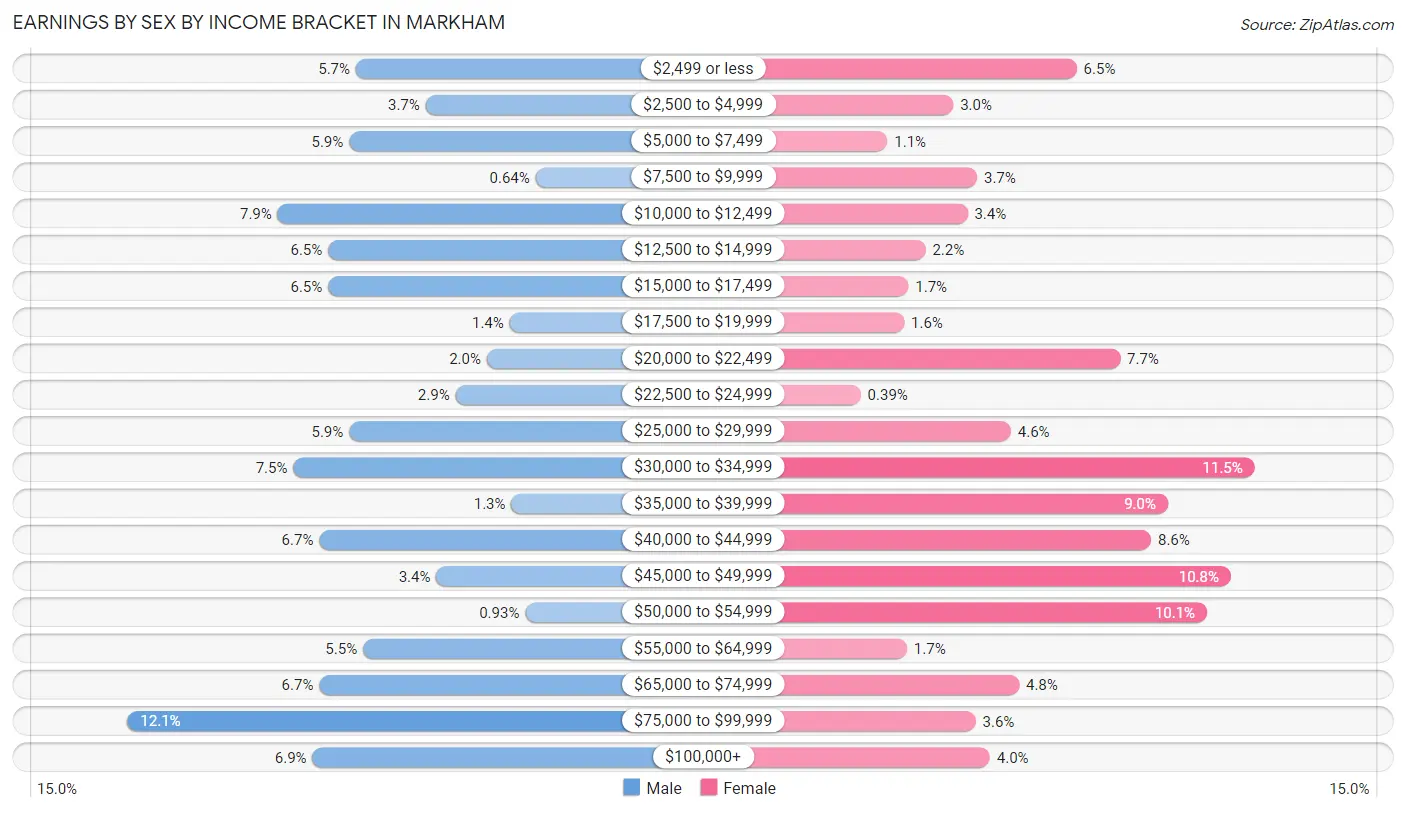
Earnings by Sex by Income Bracket in Markham
The most common earnings brackets in Markham are $75,000 to $99,999 for men (247 | 12.1%) and $30,000 to $34,999 for women (291 | 11.5%).
| Income | Male | Female |
| $2,499 or less | 116 (5.7%) | 164 (6.5%) |
| $2,500 to $4,999 | 76 (3.7%) | 76 (3.0%) |
| $5,000 to $7,499 | 120 (5.9%) | 29 (1.1%) |
| $7,500 to $9,999 | 13 (0.6%) | 93 (3.7%) |
| $10,000 to $12,499 | 161 (7.9%) | 86 (3.4%) |
| $12,500 to $14,999 | 132 (6.5%) | 56 (2.2%) |
| $15,000 to $17,499 | 132 (6.5%) | 44 (1.7%) |
| $17,500 to $19,999 | 28 (1.4%) | 41 (1.6%) |
| $20,000 to $22,499 | 41 (2.0%) | 195 (7.7%) |
| $22,500 to $24,999 | 59 (2.9%) | 10 (0.4%) |
| $25,000 to $29,999 | 120 (5.9%) | 117 (4.6%) |
| $30,000 to $34,999 | 152 (7.4%) | 291 (11.5%) |
| $35,000 to $39,999 | 27 (1.3%) | 229 (9.0%) |
| $40,000 to $44,999 | 137 (6.7%) | 217 (8.6%) |
| $45,000 to $49,999 | 70 (3.4%) | 274 (10.8%) |
| $50,000 to $54,999 | 19 (0.9%) | 257 (10.1%) |
| $55,000 to $64,999 | 112 (5.5%) | 43 (1.7%) |
| $65,000 to $74,999 | 137 (6.7%) | 123 (4.8%) |
| $75,000 to $99,999 | 247 (12.1%) | 92 (3.6%) |
| $100,000+ | 141 (6.9%) | 102 (4.0%) |
| Total | 2,040 (100.0%) | 2,539 (100.0%) |
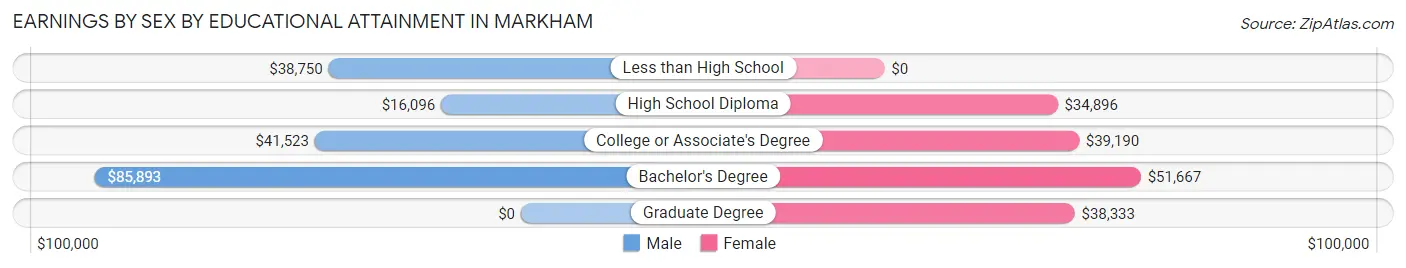
Earnings by Sex by Educational Attainment in Markham
Average earnings in Markham are $32,482 for men and $38,293 for women, a difference of 15.2%. Men with an educational attainment of bachelor's degree enjoy the highest average annual earnings of $85,893, while those with high school diploma education earn the least with $16,096. Women with an educational attainment of bachelor's degree earn the most with the average annual earnings of $51,667, while those with high school diploma education have the smallest earnings of $34,896.
| Educational Attainment | Male Income | Female Income |
| Less than High School | $38,750 | $0 |
| High School Diploma | $16,096 | $34,896 |
| College or Associate's Degree | $41,523 | $39,190 |
| Bachelor's Degree | $85,893 | $51,667 |
| Graduate Degree | - | - |
| Total | $32,482 | $38,293 |
Family Income in Markham
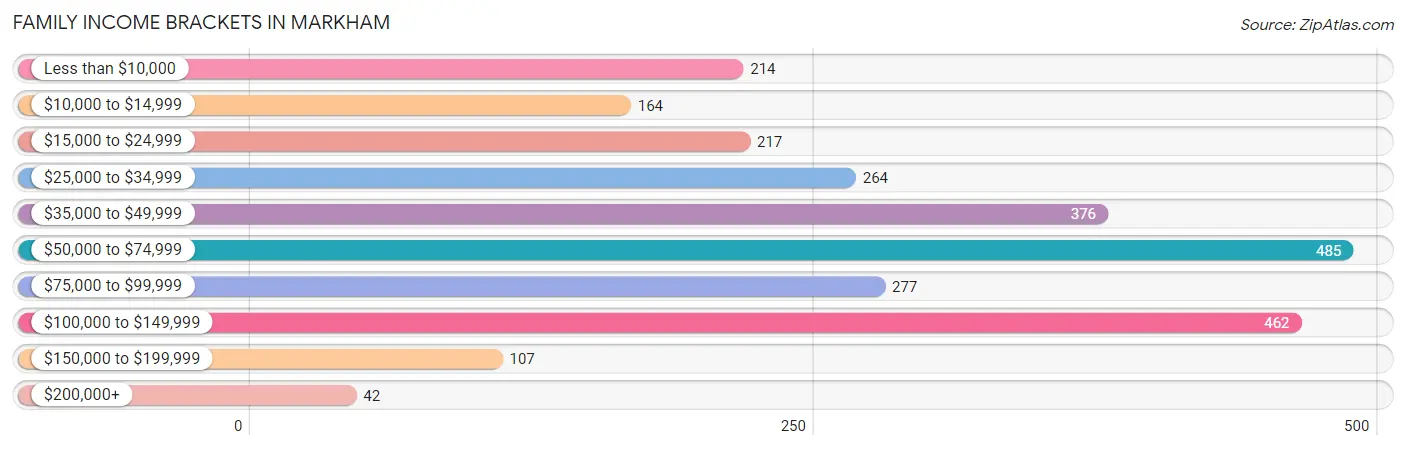
Family Income Brackets in Markham
According to the Markham family income data, there are 485 families falling into the $50,000 to $74,999 income range, which is the most common income bracket and makes up 18.6% of all families. Conversely, the $200,000+ income bracket is the least frequent group with only 42 families (1.6%) belonging to this category.
| Income Bracket | # Families | % Families |
| Less than $10,000 | 214 | 8.2% |
| $10,000 to $14,999 | 164 | 6.3% |
| $15,000 to $24,999 | 217 | 8.3% |
| $25,000 to $34,999 | 264 | 10.1% |
| $35,000 to $49,999 | 376 | 14.4% |
| $50,000 to $74,999 | 485 | 18.6% |
| $75,000 to $99,999 | 277 | 10.6% |
| $100,000 to $149,999 | 462 | 17.7% |
| $150,000 to $199,999 | 107 | 4.1% |
| $200,000+ | 42 | 1.6% |
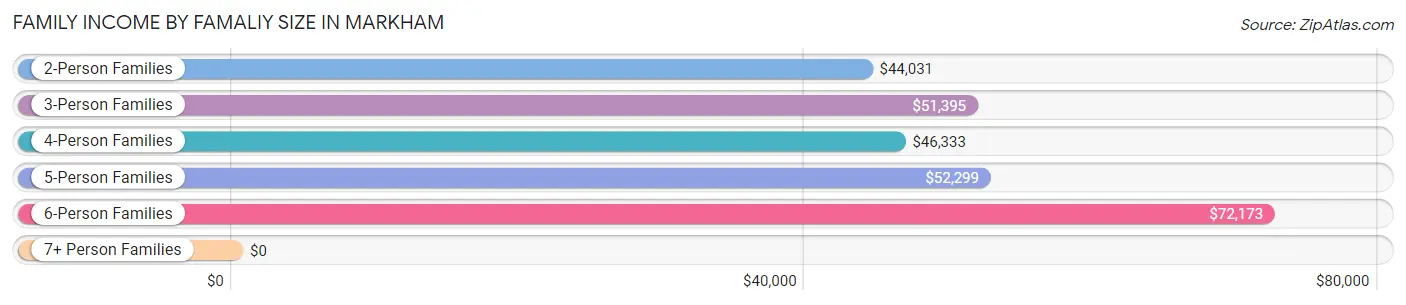
Family Income by Famaliy Size in Markham
6-person families (147 | 5.6%) account for the highest median family income in Markham with $72,173 per family, while 2-person families (872 | 33.4%) have the highest median income of $22,016 per family member.
| Income Bracket | # Families | Median Income |
| 2-Person Families | 872 (33.4%) | $44,031 |
| 3-Person Families | 711 (27.2%) | $51,395 |
| 4-Person Families | 544 (20.8%) | $46,333 |
| 5-Person Families | 185 (7.1%) | $52,299 |
| 6-Person Families | 147 (5.6%) | $72,173 |
| 7+ Person Families | 151 (5.8%) | $0 |
| Total | 2,610 (100.0%) | $51,400 |
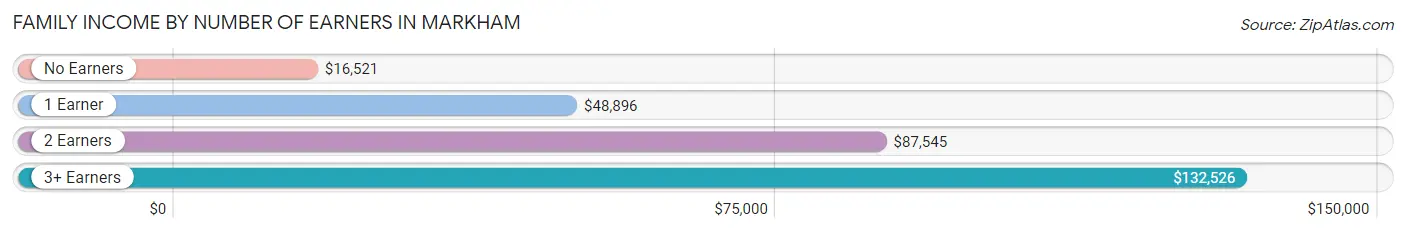
Family Income by Number of Earners in Markham
The median family income in Markham is $51,400, with families comprising 3+ earners (369) having the highest median family income of $132,526, while families with no earners (551) have the lowest median family income of $16,521, accounting for 14.1% and 21.1% of families, respectively.
| Number of Earners | # Families | Median Income |
| No Earners | 551 (21.1%) | $16,521 |
| 1 Earner | 1,062 (40.7%) | $48,896 |
| 2 Earners | 628 (24.1%) | $87,545 |
| 3+ Earners | 369 (14.1%) | $132,526 |
| Total | 2,610 (100.0%) | $51,400 |
Household Income in Markham
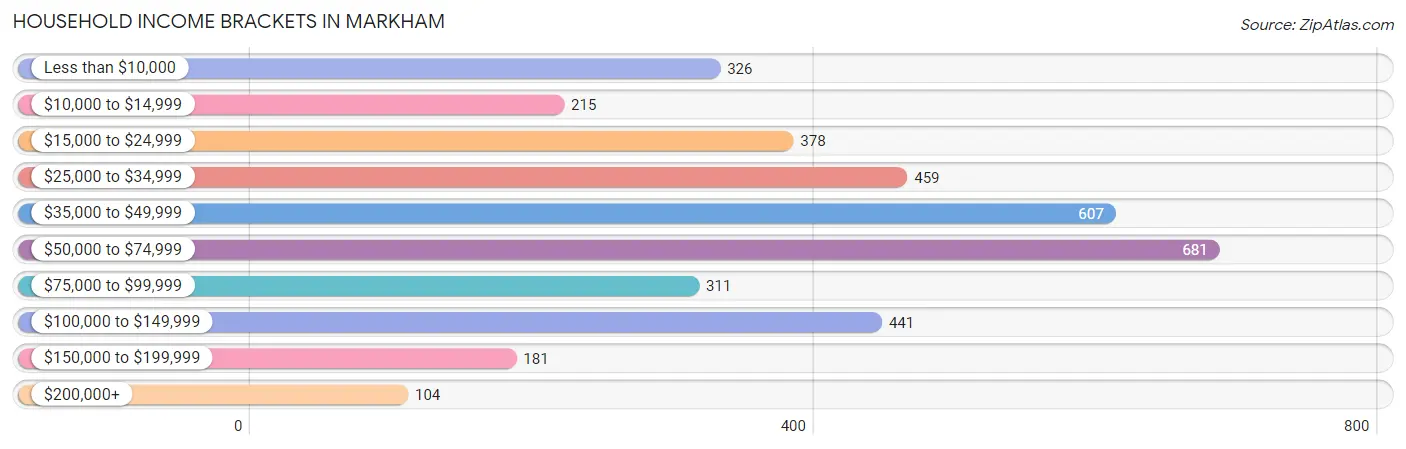
Household Income Brackets in Markham
With 681 households falling in the category, the $50,000 to $74,999 income range is the most frequent in Markham, accounting for 18.4% of all households. In contrast, only 104 households (2.8%) fall into the $200,000+ income bracket, making it the least populous group.
| Income Bracket | # Households | % Households |
| Less than $10,000 | 326 | 8.8% |
| $10,000 to $14,999 | 215 | 5.8% |
| $15,000 to $24,999 | 378 | 10.2% |
| $25,000 to $34,999 | 459 | 12.4% |
| $35,000 to $49,999 | 607 | 16.4% |
| $50,000 to $74,999 | 681 | 18.4% |
| $75,000 to $99,999 | 311 | 8.4% |
| $100,000 to $149,999 | 441 | 11.9% |
| $150,000 to $199,999 | 181 | 4.9% |
| $200,000+ | 104 | 2.8% |
Household Income by Householder Age in Markham
The median household income in Markham is $47,955, with the highest median household income of $63,889 found in the 45 to 64 years age bracket for the primary householder. A total of 1,266 households (34.2%) fall into this category. Meanwhile, the 15 to 24 years age bracket for the primary householder has the lowest median household income of $0, with 38 households (1.0%) in this group.
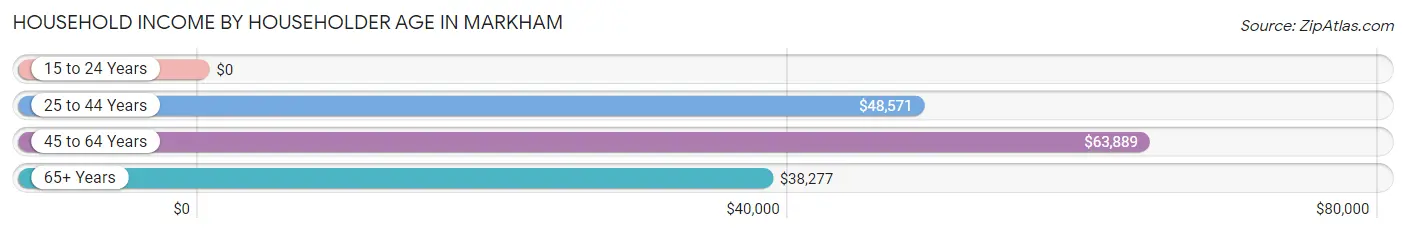
| Income Bracket | # Households | Median Income |
| 15 to 24 Years | 38 (1.0%) | $0 |
| 25 to 44 Years | 1,212 (32.7%) | $48,571 |
| 45 to 64 Years | 1,266 (34.2%) | $63,889 |
| 65+ Years | 1,187 (32.1%) | $38,277 |
| Total | 3,703 (100.0%) | $47,955 |
Poverty in Markham
Income Below Poverty by Sex and Age in Markham
With 26.3% poverty level for males and 20.5% for females among the residents of Markham, under 5 year old males and under 5 year old females are the most vulnerable to poverty, with 389 males (59.8%) and 195 females (60.0%) in their respective age groups living below the poverty level.
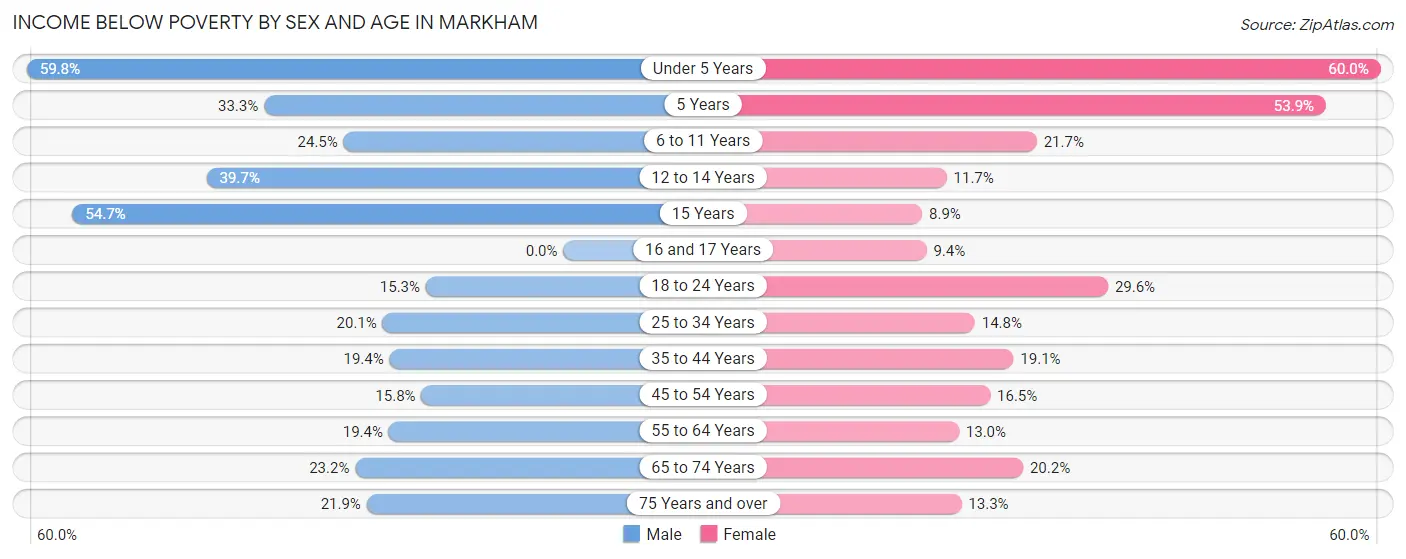
| Age Bracket | Male | Female |
| Under 5 Years | 389 (59.8%) | 195 (60.0%) |
| 5 Years | 13 (33.3%) | 62 (53.9%) |
| 6 to 11 Years | 185 (24.5%) | 89 (21.7%) |
| 12 to 14 Years | 120 (39.7%) | 35 (11.7%) |
| 15 Years | 41 (54.7%) | 11 (8.9%) |
| 16 and 17 Years | 0 (0.0%) | 10 (9.4%) |
| 18 to 24 Years | 81 (15.3%) | 174 (29.6%) |
| 25 to 34 Years | 126 (20.1%) | 150 (14.8%) |
| 35 to 44 Years | 109 (19.4%) | 159 (19.1%) |
| 45 to 54 Years | 74 (15.8%) | 92 (16.5%) |
| 55 to 64 Years | 111 (19.4%) | 88 (13.0%) |
| 65 to 74 Years | 70 (23.2%) | 137 (20.2%) |
| 75 Years and over | 76 (21.9%) | 53 (13.3%) |
| Total | 1,395 (26.3%) | 1,255 (20.5%) |
Income Above Poverty by Sex and Age in Markham
According to the poverty statistics in Markham, males aged 16 and 17 years and females aged 15 years are the age groups that are most secure financially, with 100.0% of males and 91.1% of females in these age groups living above the poverty line.
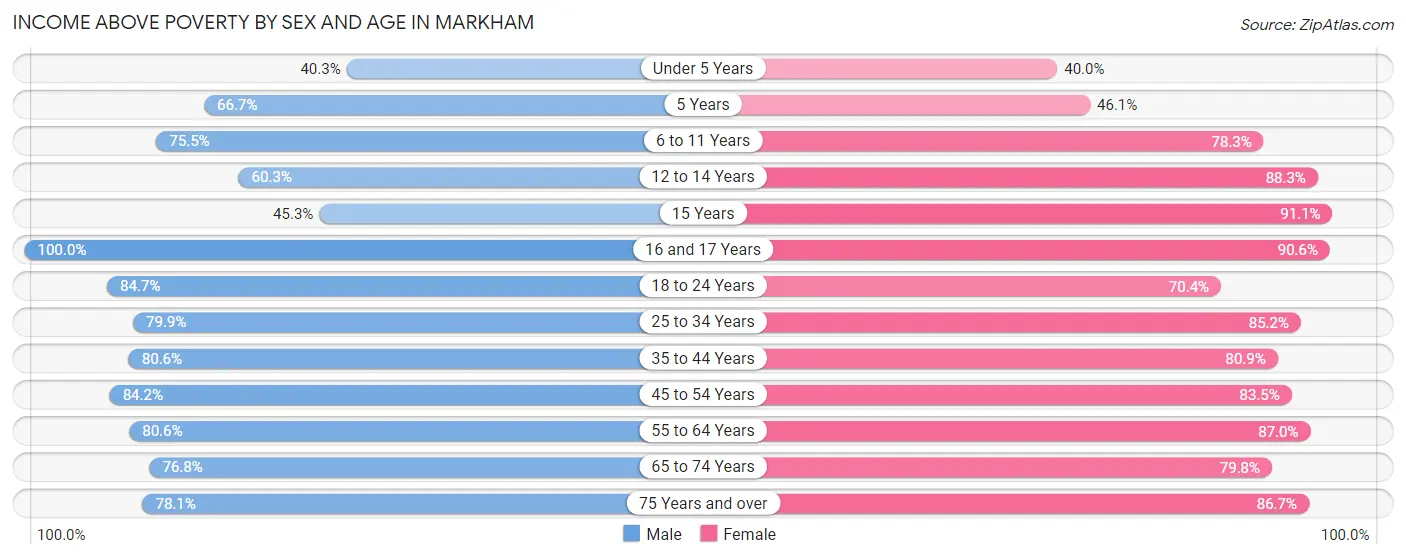
| Age Bracket | Male | Female |
| Under 5 Years | 262 (40.3%) | 130 (40.0%) |
| 5 Years | 26 (66.7%) | 53 (46.1%) |
| 6 to 11 Years | 571 (75.5%) | 321 (78.3%) |
| 12 to 14 Years | 182 (60.3%) | 265 (88.3%) |
| 15 Years | 34 (45.3%) | 112 (91.1%) |
| 16 and 17 Years | 85 (100.0%) | 96 (90.6%) |
| 18 to 24 Years | 448 (84.7%) | 413 (70.4%) |
| 25 to 34 Years | 500 (79.9%) | 863 (85.2%) |
| 35 to 44 Years | 454 (80.6%) | 673 (80.9%) |
| 45 to 54 Years | 394 (84.2%) | 465 (83.5%) |
| 55 to 64 Years | 460 (80.6%) | 587 (87.0%) |
| 65 to 74 Years | 232 (76.8%) | 542 (79.8%) |
| 75 Years and over | 271 (78.1%) | 345 (86.7%) |
| Total | 3,919 (73.8%) | 4,865 (79.5%) |
Income Below Poverty Among Married-Couple Families in Markham
The poverty statistics for married-couple families in Markham show that 17.6% or 181 of the total 1,028 families live below the poverty line. Families with 3 or 4 children have the highest poverty rate of 36.5%, comprising of 31 families. On the other hand, families with 1 or 2 children have the lowest poverty rate of 0.0%, which includes 0 families.
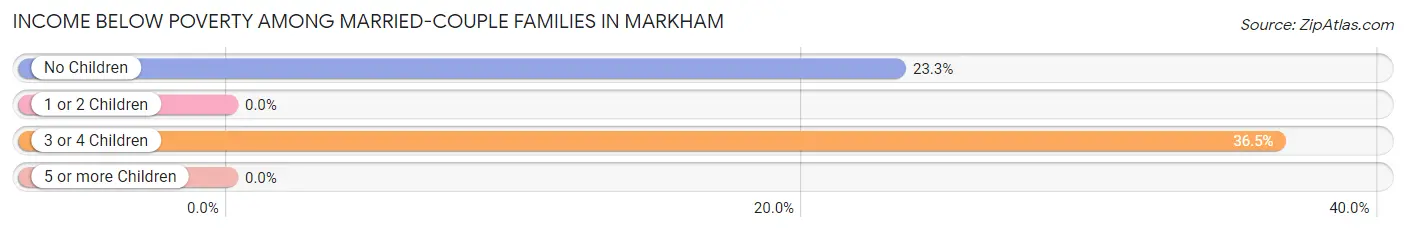
| Children | Above Poverty | Below Poverty |
| No Children | 495 (76.7%) | 150 (23.3%) |
| 1 or 2 Children | 298 (100.0%) | 0 (0.0%) |
| 3 or 4 Children | 54 (63.5%) | 31 (36.5%) |
| 5 or more Children | 0 (0.0%) | 0 (0.0%) |
| Total | 847 (82.4%) | 181 (17.6%) |
Income Below Poverty Among Single-Parent Households in Markham
According to the poverty data in Markham, 10.0% or 26 single-father households and 29.8% or 394 single-mother households are living below the poverty line. Among single-father households, those with no children have the highest poverty rate, with 26 households (16.1%) experiencing poverty. Likewise, among single-mother households, those with 5 or more children have the highest poverty rate, with 79 households (100.0%) falling below the poverty line.
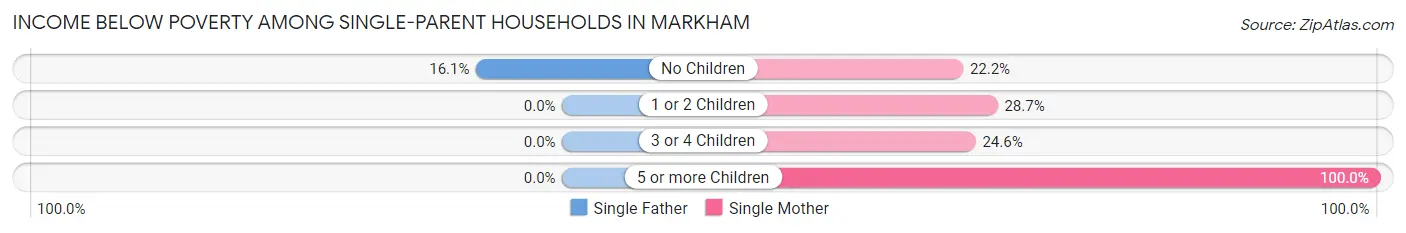
| Children | Single Father | Single Mother |
| No Children | 26 (16.1%) | 110 (22.2%) |
| 1 or 2 Children | 0 (0.0%) | 151 (28.6%) |
| 3 or 4 Children | 0 (0.0%) | 54 (24.5%) |
| 5 or more Children | 0 (0.0%) | 79 (100.0%) |
| Total | 26 (10.0%) | 394 (29.8%) |
Income Below Poverty Among Married-Couple vs Single-Parent Households in Markham
The poverty data for Markham shows that 181 of the married-couple family households (17.6%) and 420 of the single-parent households (26.6%) are living below the poverty level. Within the married-couple family households, those with 3 or 4 children have the highest poverty rate, with 31 households (36.5%) falling below the poverty line. Among the single-parent households, those with 5 or more children have the highest poverty rate, with 79 household (100.0%) living below poverty.
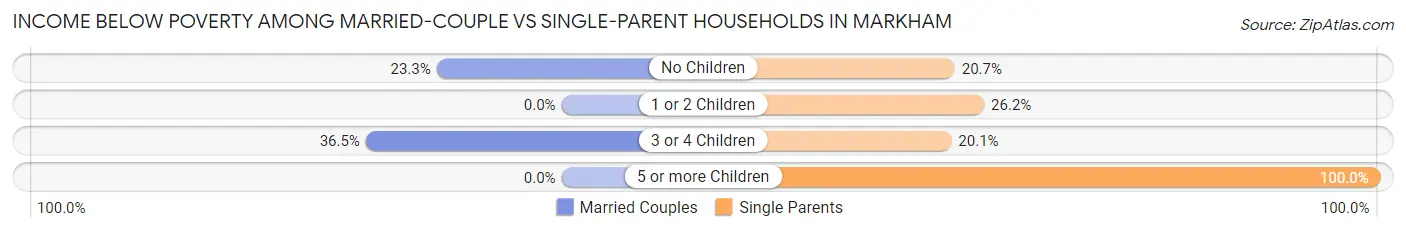
| Children | Married-Couple Families | Single-Parent Households |
| No Children | 150 (23.3%) | 136 (20.7%) |
| 1 or 2 Children | 0 (0.0%) | 151 (26.2%) |
| 3 or 4 Children | 31 (36.5%) | 54 (20.1%) |
| 5 or more Children | 0 (0.0%) | 79 (100.0%) |
| Total | 181 (17.6%) | 420 (26.6%) |
Race in Markham
The most populous races in Markham are Black / African American (8,527 | 73.6%), White / Caucasian (1,957 | 16.9%), and Hispanic or Latino (1,283 | 11.1%).
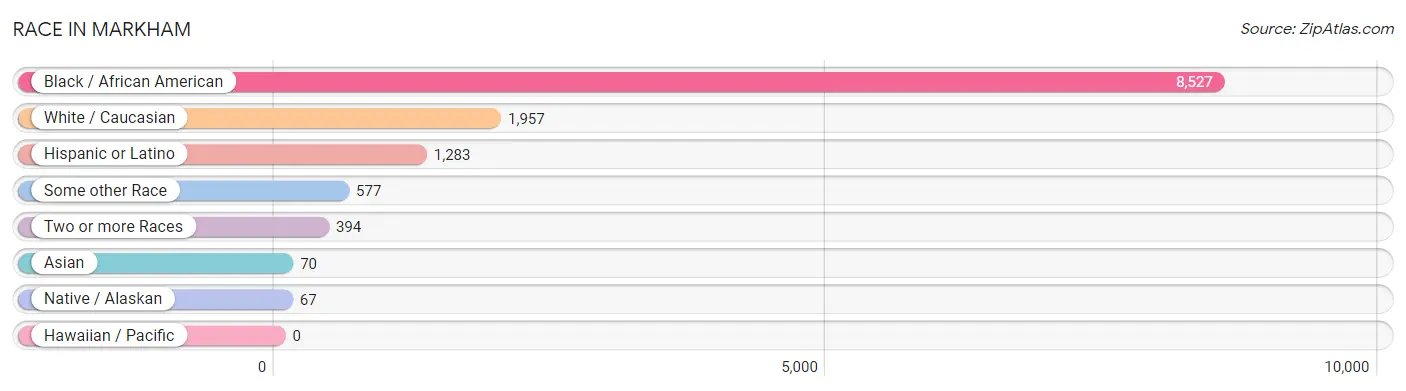
| Race | # Population | % Population |
| Asian | 70 | 0.6% |
| Black / African American | 8,527 | 73.6% |
| Hawaiian / Pacific | 0 | 0.0% |
| Hispanic or Latino | 1,283 | 11.1% |
| Native / Alaskan | 67 | 0.6% |
| White / Caucasian | 1,957 | 16.9% |
| Two or more Races | 394 | 3.4% |
| Some other Race | 577 | 5.0% |
| Total | 11,592 | 100.0% |
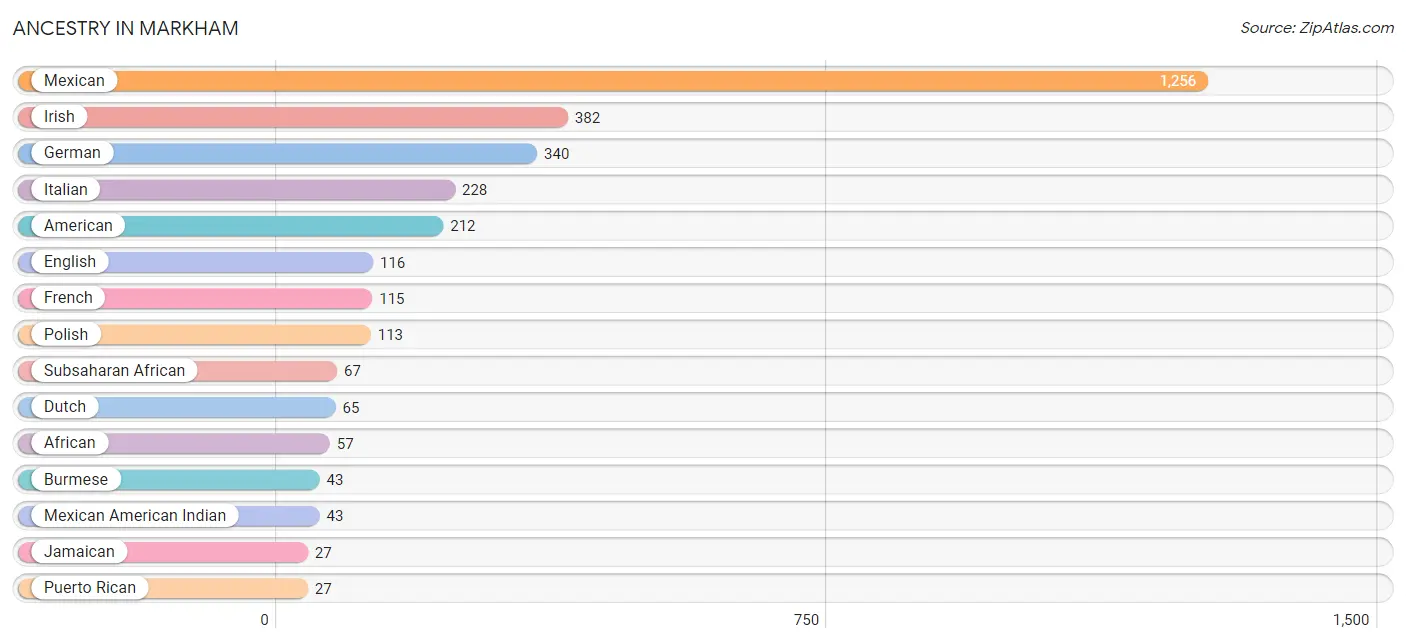
Ancestry in Markham
The most populous ancestries reported in Markham are Mexican (1,256 | 10.8%), Irish (382 | 3.3%), German (340 | 2.9%), Italian (228 | 2.0%), and American (212 | 1.8%), together accounting for 20.9% of all Markham residents.
| Ancestry | # Population | % Population |
| African | 57 | 0.5% |
| American | 212 | 1.8% |
| Arab | 22 | 0.2% |
| Austrian | 14 | 0.1% |
| Burmese | 43 | 0.4% |
| Croatian | 6 | 0.1% |
| Czech | 11 | 0.1% |
| Dutch | 65 | 0.6% |
| English | 116 | 1.0% |
| European | 1 | 0.0% |
| French | 115 | 1.0% |
| German | 340 | 2.9% |
| Greek | 1 | 0.0% |
| Irish | 382 | 3.3% |
| Italian | 228 | 2.0% |
| Jamaican | 27 | 0.2% |
| Mexican | 1,256 | 10.8% |
| Mexican American Indian | 43 | 0.4% |
| Moroccan | 13 | 0.1% |
| Nigerian | 10 | 0.1% |
| Norwegian | 16 | 0.1% |
| Polish | 113 | 1.0% |
| Puerto Rican | 27 | 0.2% |
| Russian | 14 | 0.1% |
| Subsaharan African | 67 | 0.6% |
| Swedish | 20 | 0.2% |
| Thai | 27 | 0.2% |
| West Indian | 4 | 0.0% | View All 28 Rows |
Immigrants in Markham
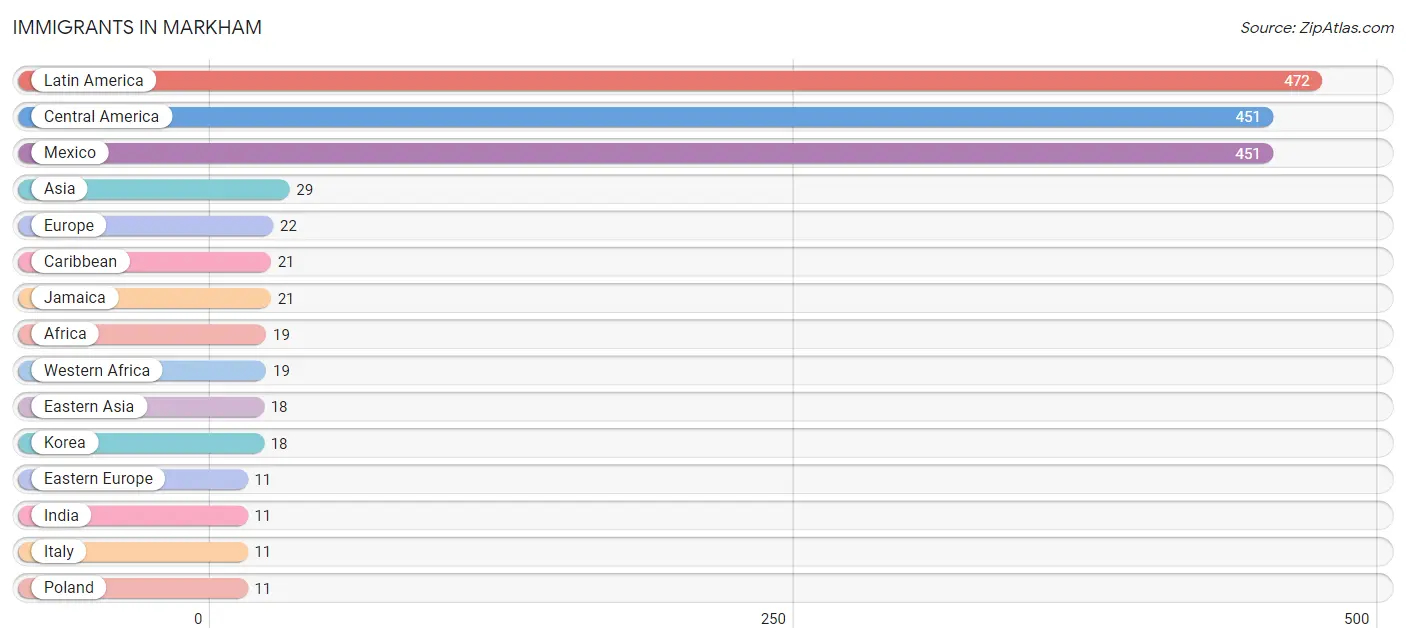
The most numerous immigrant groups reported in Markham came from Latin America (472 | 4.1%), Central America (451 | 3.9%), Mexico (451 | 3.9%), Asia (29 | 0.3%), and Europe (22 | 0.2%), together accounting for 12.3% of all Markham residents.
| Immigration Origin | # Population | % Population |
| Africa | 19 | 0.2% |
| Asia | 29 | 0.3% |
| Caribbean | 21 | 0.2% |
| Central America | 451 | 3.9% |
| Eastern Asia | 18 | 0.2% |
| Eastern Europe | 11 | 0.1% |
| Europe | 22 | 0.2% |
| Ghana | 9 | 0.1% |
| India | 11 | 0.1% |
| Italy | 11 | 0.1% |
| Jamaica | 21 | 0.2% |
| Korea | 18 | 0.2% |
| Latin America | 472 | 4.1% |
| Mexico | 451 | 3.9% |
| Nigeria | 10 | 0.1% |
| Poland | 11 | 0.1% |
| South Central Asia | 11 | 0.1% |
| Southern Europe | 11 | 0.1% |
| Western Africa | 19 | 0.2% | View All 19 Rows |
Sex and Age in Markham
Sex and Age in Markham
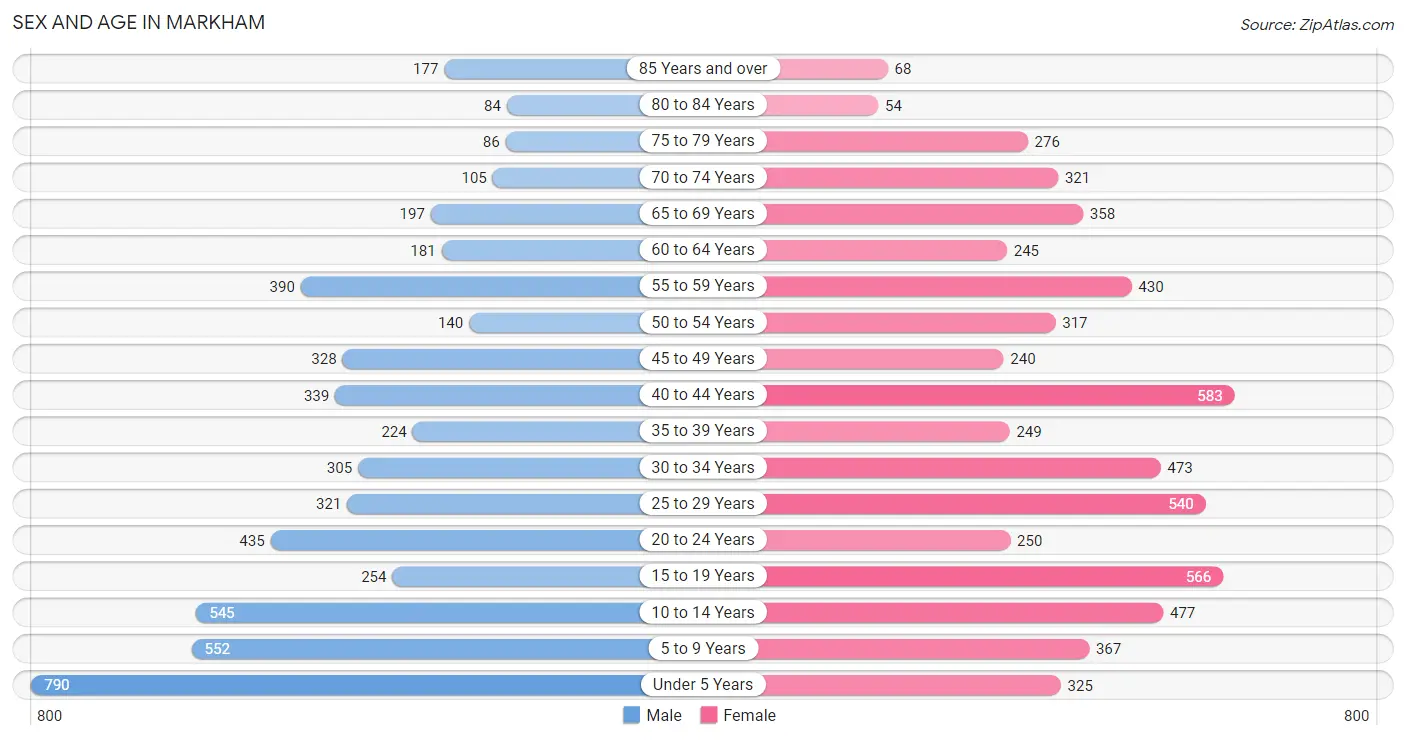
The most populous age groups in Markham are Under 5 Years (790 | 14.5%) for men and 40 to 44 Years (583 | 9.5%) for women.
| Age Bracket | Male | Female |
| Under 5 Years | 790 (14.5%) | 325 (5.3%) |
| 5 to 9 Years | 552 (10.1%) | 367 (6.0%) |
| 10 to 14 Years | 545 (10.0%) | 477 (7.8%) |
| 15 to 19 Years | 254 (4.7%) | 566 (9.2%) |
| 20 to 24 Years | 435 (8.0%) | 250 (4.1%) |
| 25 to 29 Years | 321 (5.9%) | 540 (8.8%) |
| 30 to 34 Years | 305 (5.6%) | 473 (7.7%) |
| 35 to 39 Years | 224 (4.1%) | 249 (4.1%) |
| 40 to 44 Years | 339 (6.2%) | 583 (9.5%) |
| 45 to 49 Years | 328 (6.0%) | 240 (3.9%) |
| 50 to 54 Years | 140 (2.6%) | 317 (5.2%) |
| 55 to 59 Years | 390 (7.1%) | 430 (7.0%) |
| 60 to 64 Years | 181 (3.3%) | 245 (4.0%) |
| 65 to 69 Years | 197 (3.6%) | 358 (5.8%) |
| 70 to 74 Years | 105 (1.9%) | 321 (5.2%) |
| 75 to 79 Years | 86 (1.6%) | 276 (4.5%) |
| 80 to 84 Years | 84 (1.5%) | 54 (0.9%) |
| 85 Years and over | 177 (3.3%) | 68 (1.1%) |
| Total | 5,453 (100.0%) | 6,139 (100.0%) |
Families and Households in Markham
Median Family Size in Markham
The median family size in Markham is 3.81 persons per family, with single female/mother families (1,321 | 50.6%) accounting for the largest median family size of 4.08 persons per family. On the other hand, single male/father families (261 | 10.0%) represent the smallest median family size with 3.34 persons per family.

| Family Type | # Families | Family Size |
| Married-Couple | 1,028 (39.4%) | 3.58 |
| Single Male/Father | 261 (10.0%) | 3.34 |
| Single Female/Mother | 1,321 (50.6%) | 4.08 |
| Total Families | 2,610 (100.0%) | 3.81 |
Median Household Size in Markham
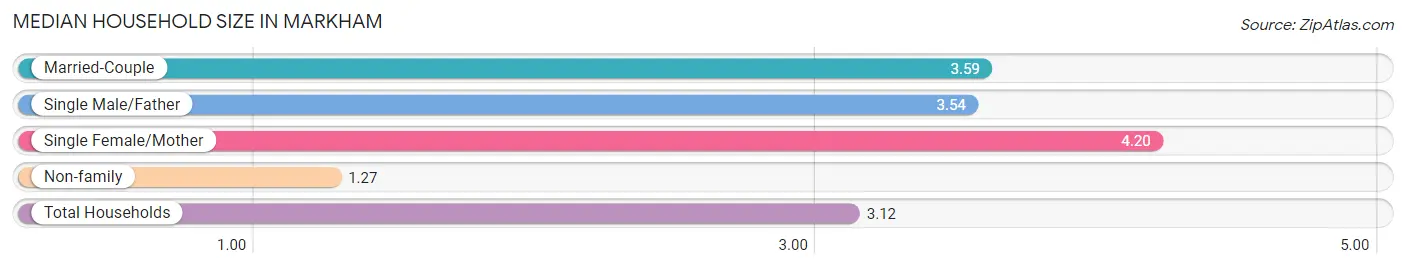
The median household size in Markham is 3.12 persons per household, with single female/mother households (1,321 | 35.7%) accounting for the largest median household size of 4.2 persons per household. non-family households (1,093 | 29.5%) represent the smallest median household size with 1.27 persons per household.
| Household Type | # Households | Household Size |
| Married-Couple | 1,028 (27.8%) | 3.59 |
| Single Male/Father | 261 (7.0%) | 3.54 |
| Single Female/Mother | 1,321 (35.7%) | 4.20 |
| Non-family | 1,093 (29.5%) | 1.27 |
| Total Households | 3,703 (100.0%) | 3.12 |
Household Size by Marriage Status in Markham
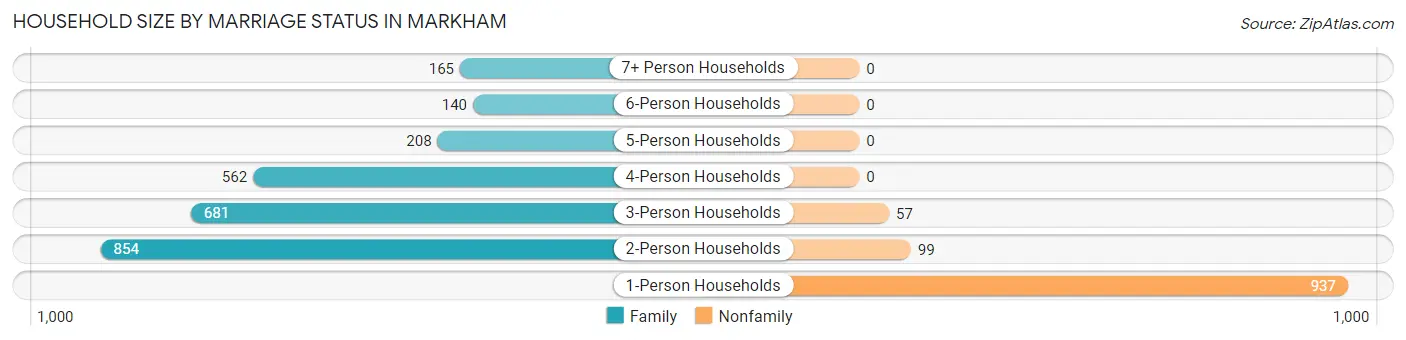
Out of a total of 3,703 households in Markham, 2,610 (70.5%) are family households, while 1,093 (29.5%) are nonfamily households. The most numerous type of family households are 2-person households, comprising 854, and the most common type of nonfamily households are 1-person households, comprising 937.
| Household Size | Family Households | Nonfamily Households |
| 1-Person Households | - | 937 (25.3%) |
| 2-Person Households | 854 (23.1%) | 99 (2.7%) |
| 3-Person Households | 681 (18.4%) | 57 (1.5%) |
| 4-Person Households | 562 (15.2%) | 0 (0.0%) |
| 5-Person Households | 208 (5.6%) | 0 (0.0%) |
| 6-Person Households | 140 (3.8%) | 0 (0.0%) |
| 7+ Person Households | 165 (4.5%) | 0 (0.0%) |
| Total | 2,610 (70.5%) | 1,093 (29.5%) |
Female Fertility in Markham
Fertility by Age in Markham
Average fertility rate in Markham is 95.0 births per 1,000 women. Women in the age bracket of 20 to 34 years have the highest fertility rate with 190.0 births per 1,000 women. Women in the age bracket of 20 to 34 years acount for 84.5% of all women with births.
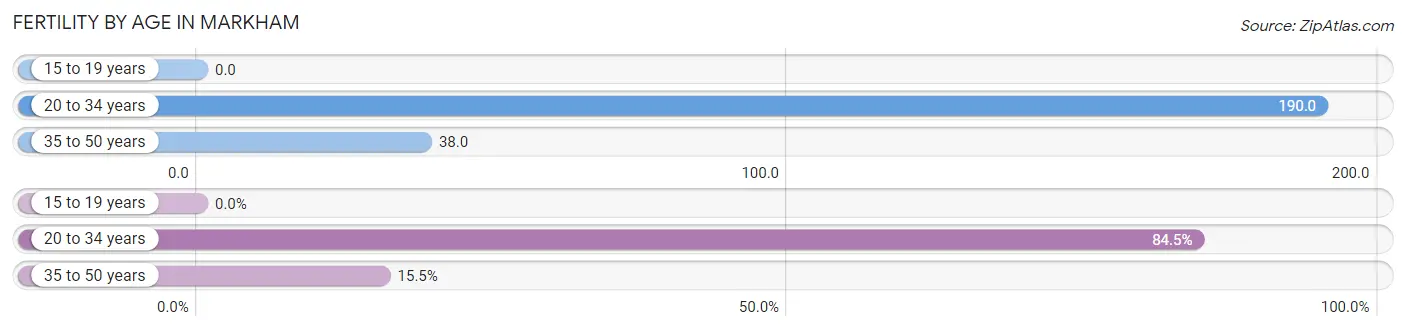
| Age Bracket | Women with Births | Births / 1,000 Women |
| 15 to 19 years | 0 (0.0%) | 0.0 |
| 20 to 34 years | 240 (84.5%) | 190.0 |
| 35 to 50 years | 44 (15.5%) | 38.0 |
| Total | 284 (100.0%) | 95.0 |
Fertility by Age by Marriage Status in Markham
20.8% of women with births (284) in Markham are married. The highest percentage of unmarried women with births falls into 20 to 34 years age bracket with 83.8% of them unmarried at the time of birth, while the lowest percentage of unmarried women with births belong to 35 to 50 years age bracket with 54.5% of them unmarried.
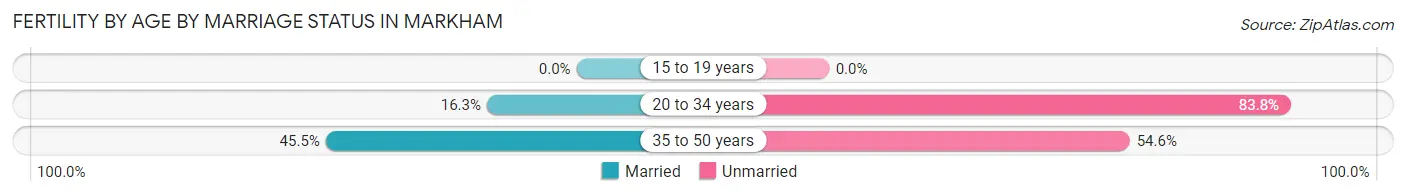
| Age Bracket | Married | Unmarried |
| 15 to 19 years | 0 (0.0%) | 0 (0.0%) |
| 20 to 34 years | 39 (16.3%) | 201 (83.8%) |
| 35 to 50 years | 20 (45.5%) | 24 (54.5%) |
| Total | 59 (20.8%) | 225 (79.2%) |
Fertility by Education in Markham
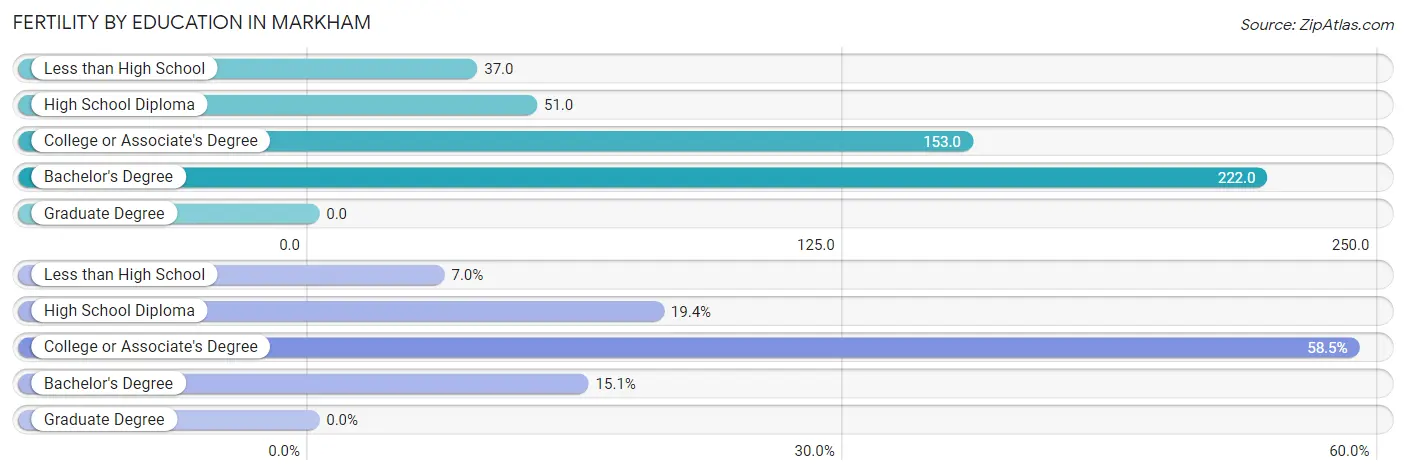
| Educational Attainment | Women with Births | Births / 1,000 Women |
| Less than High School | 20 (7.0%) | 37.0 |
| High School Diploma | 55 (19.4%) | 51.0 |
| College or Associate's Degree | 166 (58.5%) | 153.0 |
| Bachelor's Degree | 43 (15.1%) | 222.0 |
| Graduate Degree | 0 (0.0%) | 0.0 |
| Total | 284 (100.0%) | 95.0 |
Fertility by Education by Marriage Status in Markham
79.2% of women with births in Markham are unmarried. Women with the educational attainment of less than high school are most likely to be married with 100.0% of them married at childbirth, while women with the educational attainment of high school diploma are least likely to be married with 100.0% of them unmarried at childbirth.
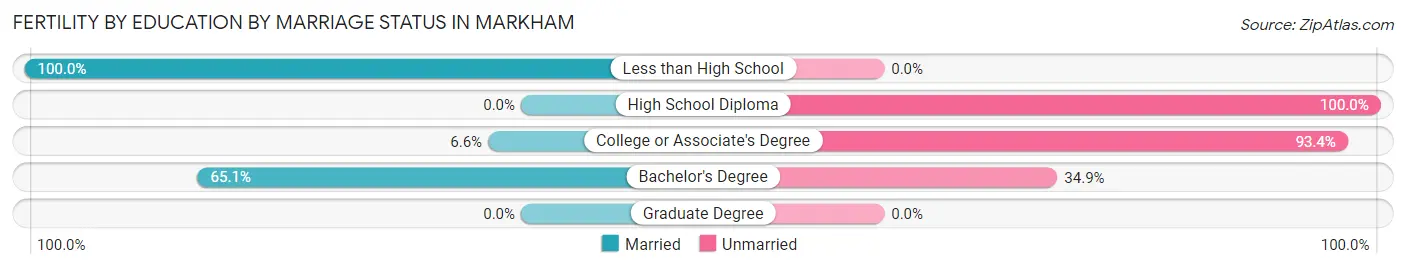
| Educational Attainment | Married | Unmarried |
| Less than High School | 20 (100.0%) | 0 (0.0%) |
| High School Diploma | 0 (0.0%) | 55 (100.0%) |
| College or Associate's Degree | 11 (6.6%) | 155 (93.4%) |
| Bachelor's Degree | 28 (65.1%) | 15 (34.9%) |
| Graduate Degree | 0 (0.0%) | 0 (0.0%) |
| Total | 59 (20.8%) | 225 (79.2%) |
Employment Characteristics in Markham
Employment by Class of Employer in Markham
Among the 4,088 employed individuals in Markham, private company employees (2,678 | 65.5%), not-for-profit organizations (500 | 12.2%), and local government employees (380 | 9.3%) make up the most common classes of employment.
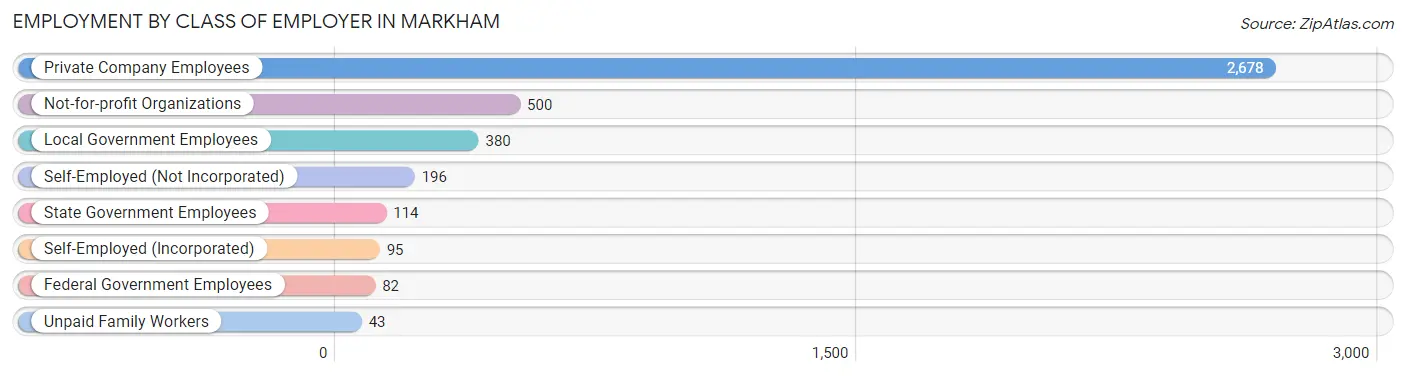
| Employer Class | # Employees | % Employees |
| Private Company Employees | 2,678 | 65.5% |
| Self-Employed (Incorporated) | 95 | 2.3% |
| Self-Employed (Not Incorporated) | 196 | 4.8% |
| Not-for-profit Organizations | 500 | 12.2% |
| Local Government Employees | 380 | 9.3% |
| State Government Employees | 114 | 2.8% |
| Federal Government Employees | 82 | 2.0% |
| Unpaid Family Workers | 43 | 1.1% |
| Total | 4,088 | 100.0% |
Employment Status by Age in Markham
According to the labor force statistics for Markham, out of the total population over 16 years of age (8,338), 59.1% or 4,928 individuals are in the labor force, with 14.0% or 690 of them unemployed. The age group with the highest labor force participation rate is 30 to 34 years, with 87.7% or 682 individuals in the labor force. Within the labor force, the 16 to 19 years age range has the highest percentage of unemployed individuals, with 50.7% or 150 of them being unemployed.
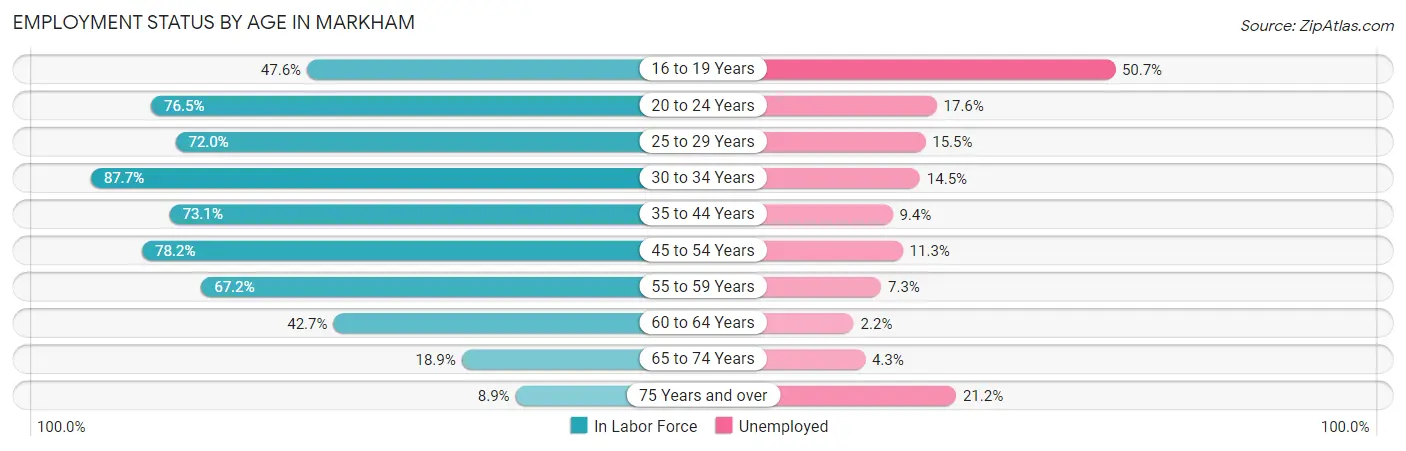
| Age Bracket | In Labor Force | Unemployed |
| 16 to 19 Years | 296 (47.6%) | 150 (50.7%) |
| 20 to 24 Years | 524 (76.5%) | 92 (17.6%) |
| 25 to 29 Years | 620 (72.0%) | 96 (15.5%) |
| 30 to 34 Years | 682 (87.7%) | 99 (14.5%) |
| 35 to 44 Years | 1,020 (73.1%) | 96 (9.4%) |
| 45 to 54 Years | 802 (78.2%) | 91 (11.3%) |
| 55 to 59 Years | 551 (67.2%) | 40 (7.3%) |
| 60 to 64 Years | 182 (42.7%) | 4 (2.2%) |
| 65 to 74 Years | 185 (18.9%) | 8 (4.3%) |
| 75 Years and over | 66 (8.9%) | 14 (21.2%) |
| Total | 4,928 (59.1%) | 690 (14.0%) |
Employment Status by Educational Attainment in Markham
According to labor force statistics for Markham, 72.7% of individuals (3,857) out of the total population between 25 and 64 years of age (5,305) are in the labor force, with 11.0% or 424 of them being unemployed. The group with the highest labor force participation rate are those with the educational attainment of college / associate degree, with 79.8% or 1,540 individuals in the labor force. Within the labor force, individuals with less than high school education have the highest percentage of unemployment, with 16.5% or 37 of them being unemployed.
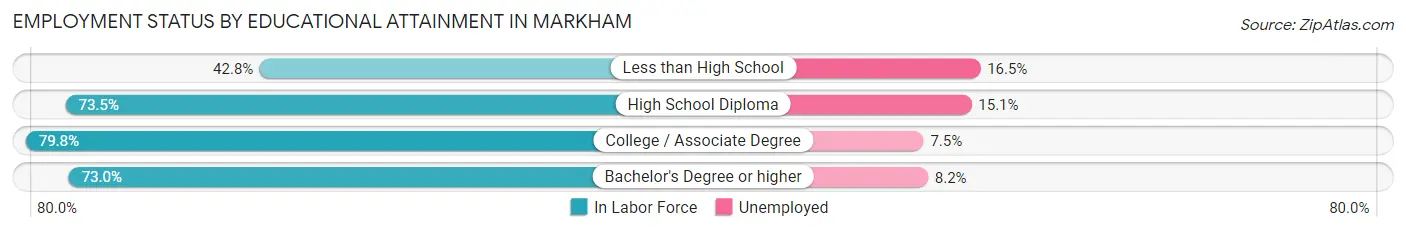
| Educational Attainment | In Labor Force | Unemployed |
| Less than High School | 224 (42.8%) | 86 (16.5%) |
| High School Diploma | 1,472 (73.5%) | 302 (15.1%) |
| College / Associate Degree | 1,540 (79.8%) | 145 (7.5%) |
| Bachelor's Degree or higher | 620 (73.0%) | 70 (8.2%) |
| Total | 3,857 (72.7%) | 584 (11.0%) |
Employment Occupations by Sex in Markham
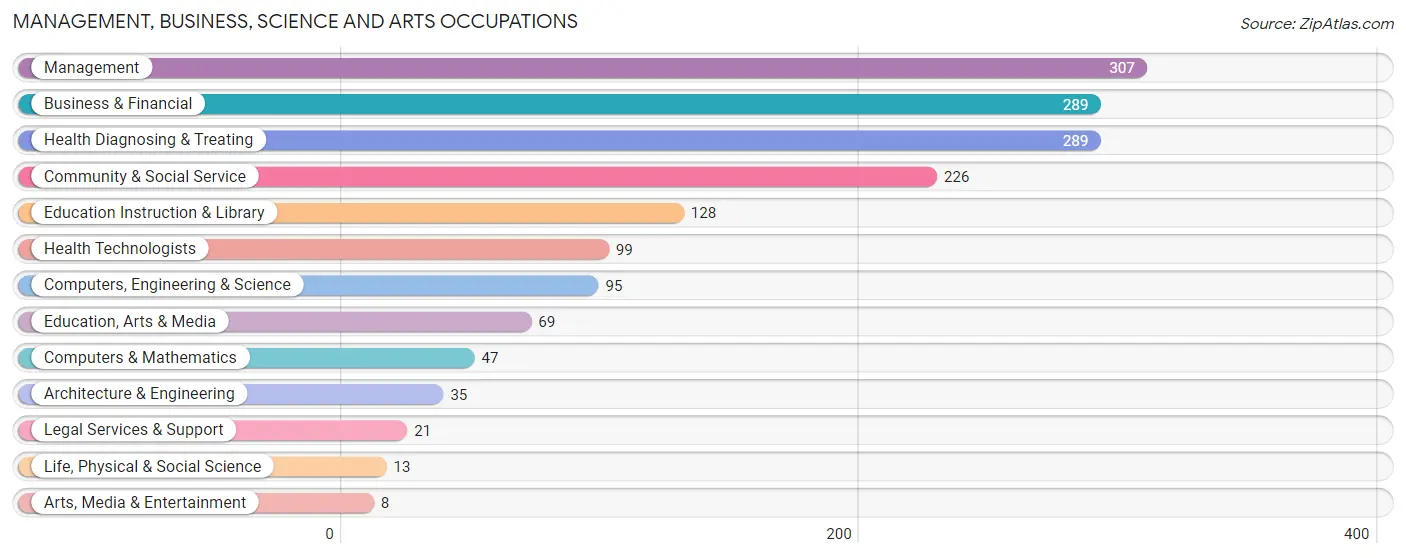
Management, Business, Science and Arts Occupations
The most common Management, Business, Science and Arts occupations in Markham are Management (307 | 7.2%), Business & Financial (289 | 6.8%), Health Diagnosing & Treating (289 | 6.8%), Community & Social Service (226 | 5.3%), and Education Instruction & Library (128 | 3.0%).
Management, Business, Science and Arts Occupations by Sex
Within the Management, Business, Science and Arts occupations in Markham, the most male-oriented occupations are Architecture & Engineering (100.0%), Arts, Media & Entertainment (87.5%), and Computers, Engineering & Science (57.9%), while the most female-oriented occupations are Life, Physical & Social Science (100.0%), Health Diagnosing & Treating (89.6%), and Health Technologists (86.9%).
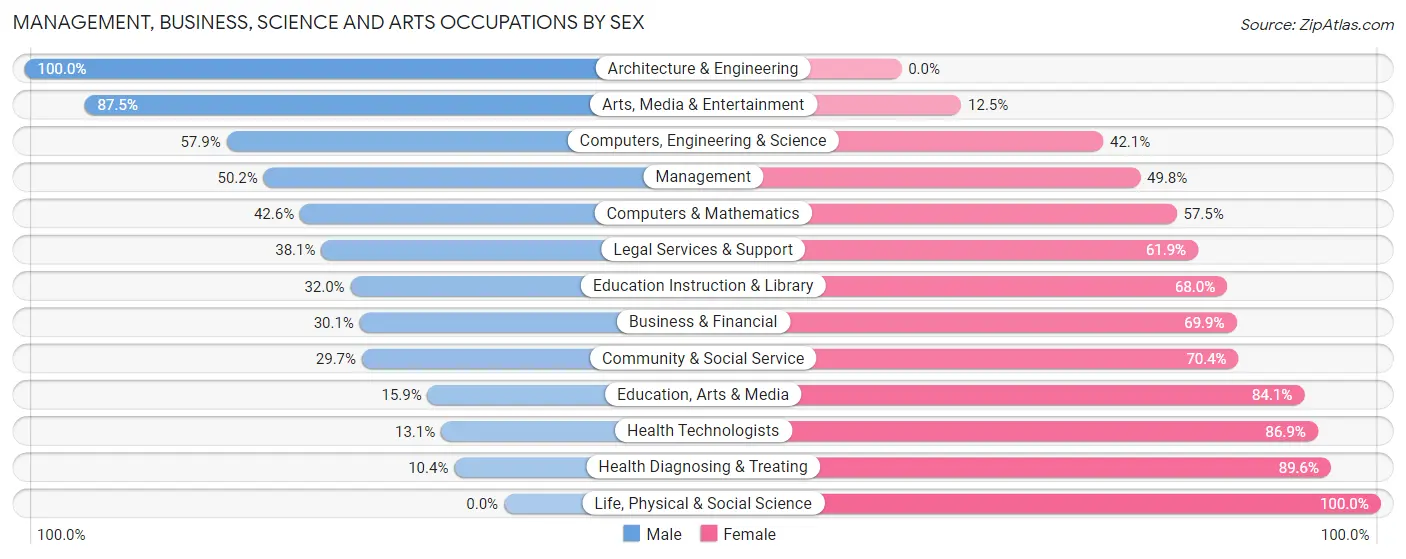
| Occupation | Male | Female |
| Management | 154 (50.2%) | 153 (49.8%) |
| Business & Financial | 87 (30.1%) | 202 (69.9%) |
| Computers, Engineering & Science | 55 (57.9%) | 40 (42.1%) |
| Computers & Mathematics | 20 (42.5%) | 27 (57.5%) |
| Architecture & Engineering | 35 (100.0%) | 0 (0.0%) |
| Life, Physical & Social Science | 0 (0.0%) | 13 (100.0%) |
| Community & Social Service | 67 (29.6%) | 159 (70.4%) |
| Education, Arts & Media | 11 (15.9%) | 58 (84.1%) |
| Legal Services & Support | 8 (38.1%) | 13 (61.9%) |
| Education Instruction & Library | 41 (32.0%) | 87 (68.0%) |
| Arts, Media & Entertainment | 7 (87.5%) | 1 (12.5%) |
| Health Diagnosing & Treating | 30 (10.4%) | 259 (89.6%) |
| Health Technologists | 13 (13.1%) | 86 (86.9%) |
| Total (Category) | 393 (32.6%) | 813 (67.4%) |
| Total (Overall) | 1,852 (43.7%) | 2,386 (56.3%) |
Services Occupations
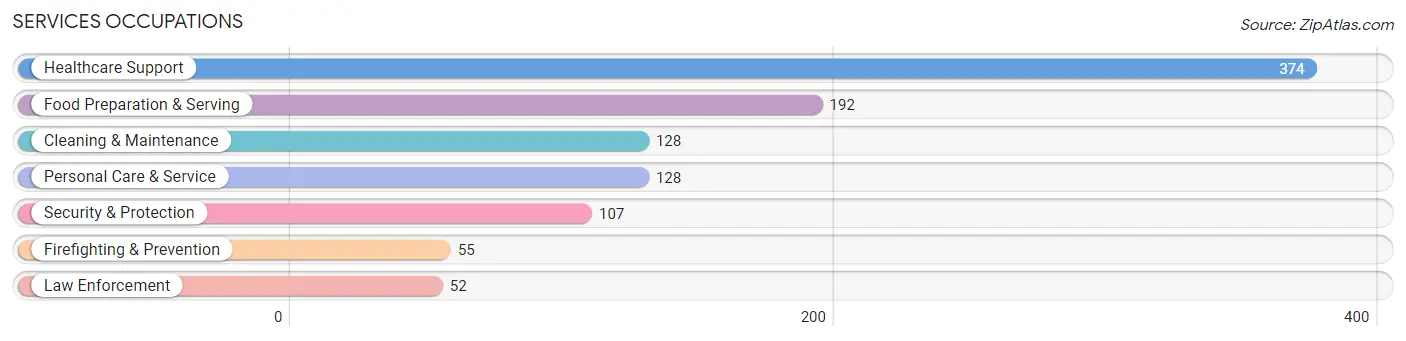
The most common Services occupations in Markham are Healthcare Support (374 | 8.8%), Food Preparation & Serving (192 | 4.5%), Cleaning & Maintenance (128 | 3.0%), Personal Care & Service (128 | 3.0%), and Security & Protection (107 | 2.5%).
Services Occupations by Sex
Within the Services occupations in Markham, the most male-oriented occupations are Law Enforcement (90.4%), Security & Protection (81.3%), and Firefighting & Prevention (72.7%), while the most female-oriented occupations are Healthcare Support (94.9%), Personal Care & Service (65.6%), and Cleaning & Maintenance (47.7%).
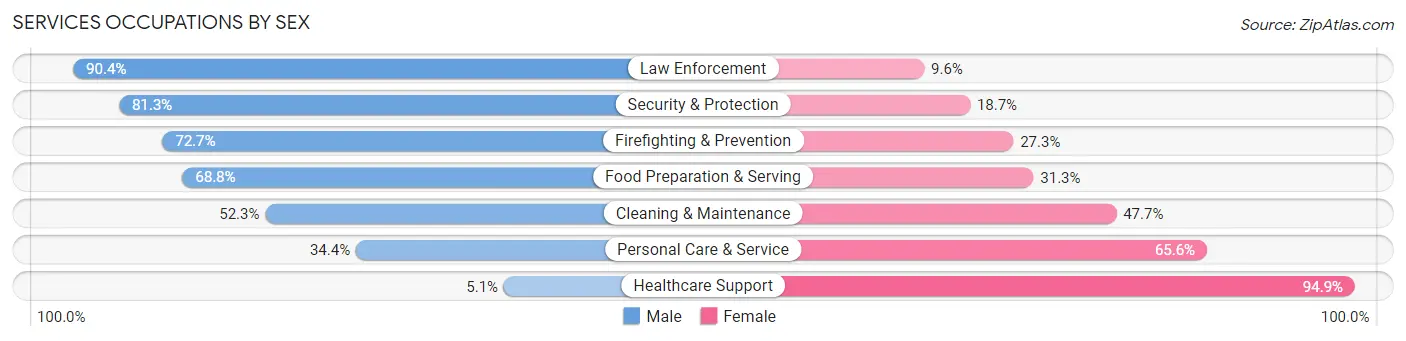
| Occupation | Male | Female |
| Healthcare Support | 19 (5.1%) | 355 (94.9%) |
| Security & Protection | 87 (81.3%) | 20 (18.7%) |
| Firefighting & Prevention | 40 (72.7%) | 15 (27.3%) |
| Law Enforcement | 47 (90.4%) | 5 (9.6%) |
| Food Preparation & Serving | 132 (68.8%) | 60 (31.2%) |
| Cleaning & Maintenance | 67 (52.3%) | 61 (47.7%) |
| Personal Care & Service | 44 (34.4%) | 84 (65.6%) |
| Total (Category) | 349 (37.6%) | 580 (62.4%) |
| Total (Overall) | 1,852 (43.7%) | 2,386 (56.3%) |
Sales and Office Occupations
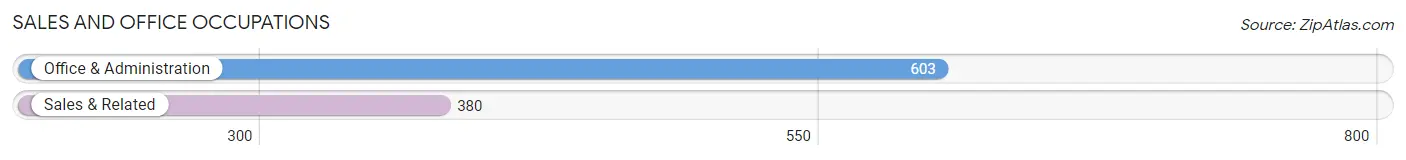
The most common Sales and Office occupations in Markham are Office & Administration (603 | 14.2%), and Sales & Related (380 | 9.0%).
Sales and Office Occupations by Sex
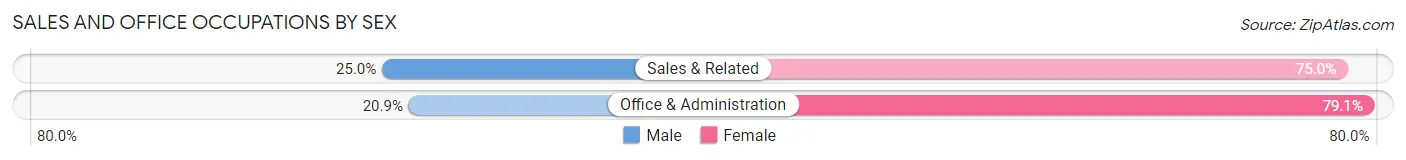
| Occupation | Male | Female |
| Sales & Related | 95 (25.0%) | 285 (75.0%) |
| Office & Administration | 126 (20.9%) | 477 (79.1%) |
| Total (Category) | 221 (22.5%) | 762 (77.5%) |
| Total (Overall) | 1,852 (43.7%) | 2,386 (56.3%) |
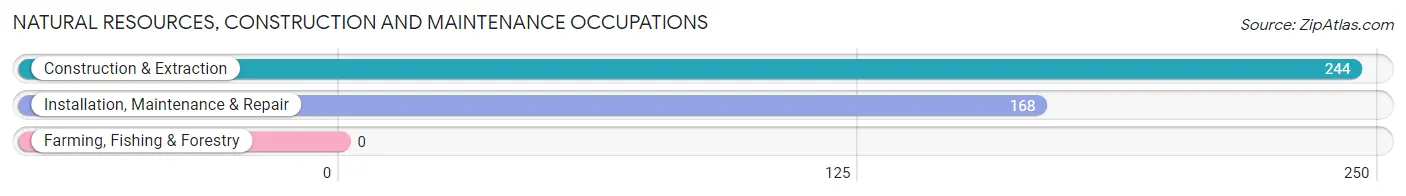
Natural Resources, Construction and Maintenance Occupations
The most common Natural Resources, Construction and Maintenance occupations in Markham are Construction & Extraction (244 | 5.8%), and Installation, Maintenance & Repair (168 | 4.0%).
Natural Resources, Construction and Maintenance Occupations by Sex
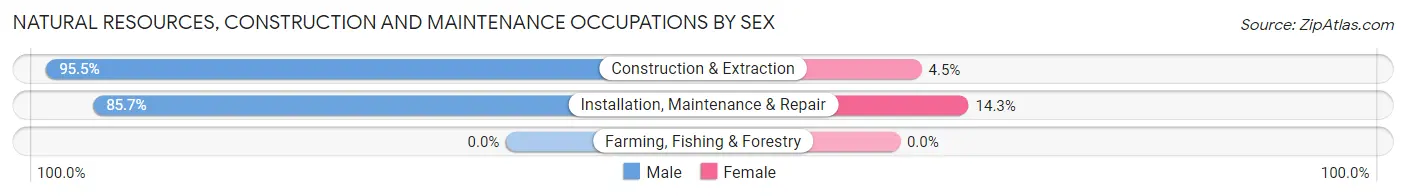
| Occupation | Male | Female |
| Farming, Fishing & Forestry | 0 (0.0%) | 0 (0.0%) |
| Construction & Extraction | 233 (95.5%) | 11 (4.5%) |
| Installation, Maintenance & Repair | 144 (85.7%) | 24 (14.3%) |
| Total (Category) | 377 (91.5%) | 35 (8.5%) |
| Total (Overall) | 1,852 (43.7%) | 2,386 (56.3%) |
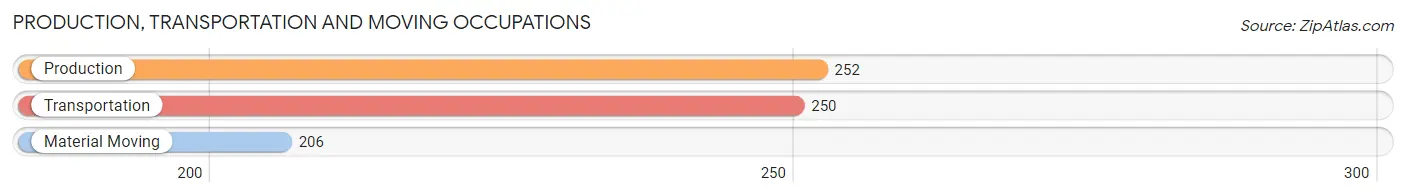
Production, Transportation and Moving Occupations
The most common Production, Transportation and Moving occupations in Markham are Production (252 | 5.9%), Transportation (250 | 5.9%), and Material Moving (206 | 4.9%).
Production, Transportation and Moving Occupations by Sex
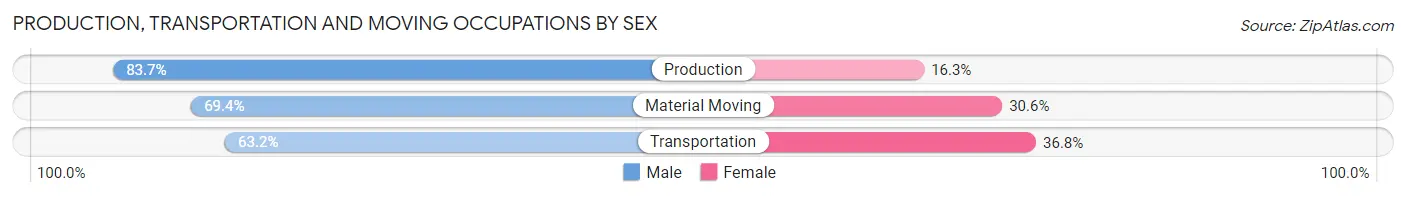
| Occupation | Male | Female |
| Production | 211 (83.7%) | 41 (16.3%) |
| Transportation | 158 (63.2%) | 92 (36.8%) |
| Material Moving | 143 (69.4%) | 63 (30.6%) |
| Total (Category) | 512 (72.3%) | 196 (27.7%) |
| Total (Overall) | 1,852 (43.7%) | 2,386 (56.3%) |
Employment Industries by Sex in Markham
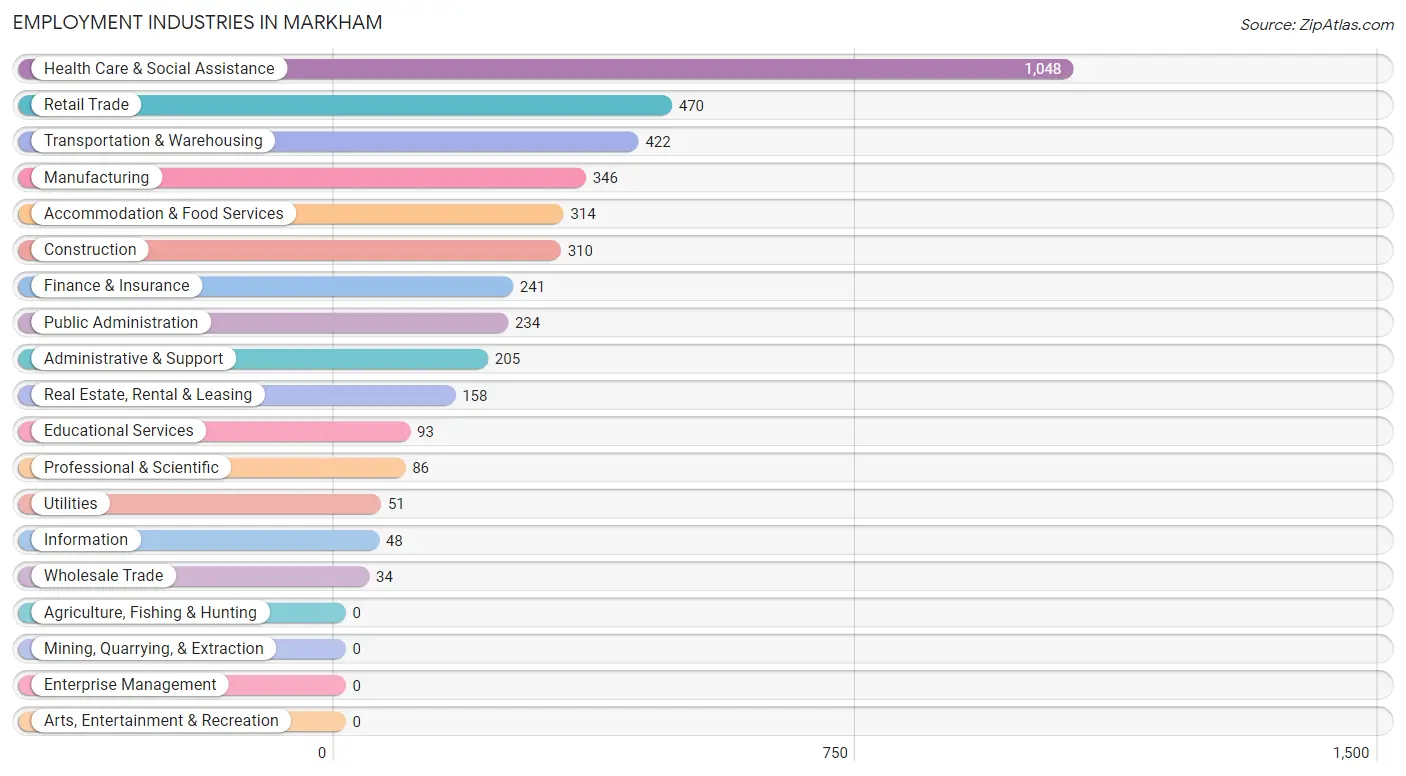
Employment Industries in Markham
The major employment industries in Markham include Health Care & Social Assistance (1,048 | 24.7%), Retail Trade (470 | 11.1%), Transportation & Warehousing (422 | 10.0%), Manufacturing (346 | 8.2%), and Accommodation & Food Services (314 | 7.4%).
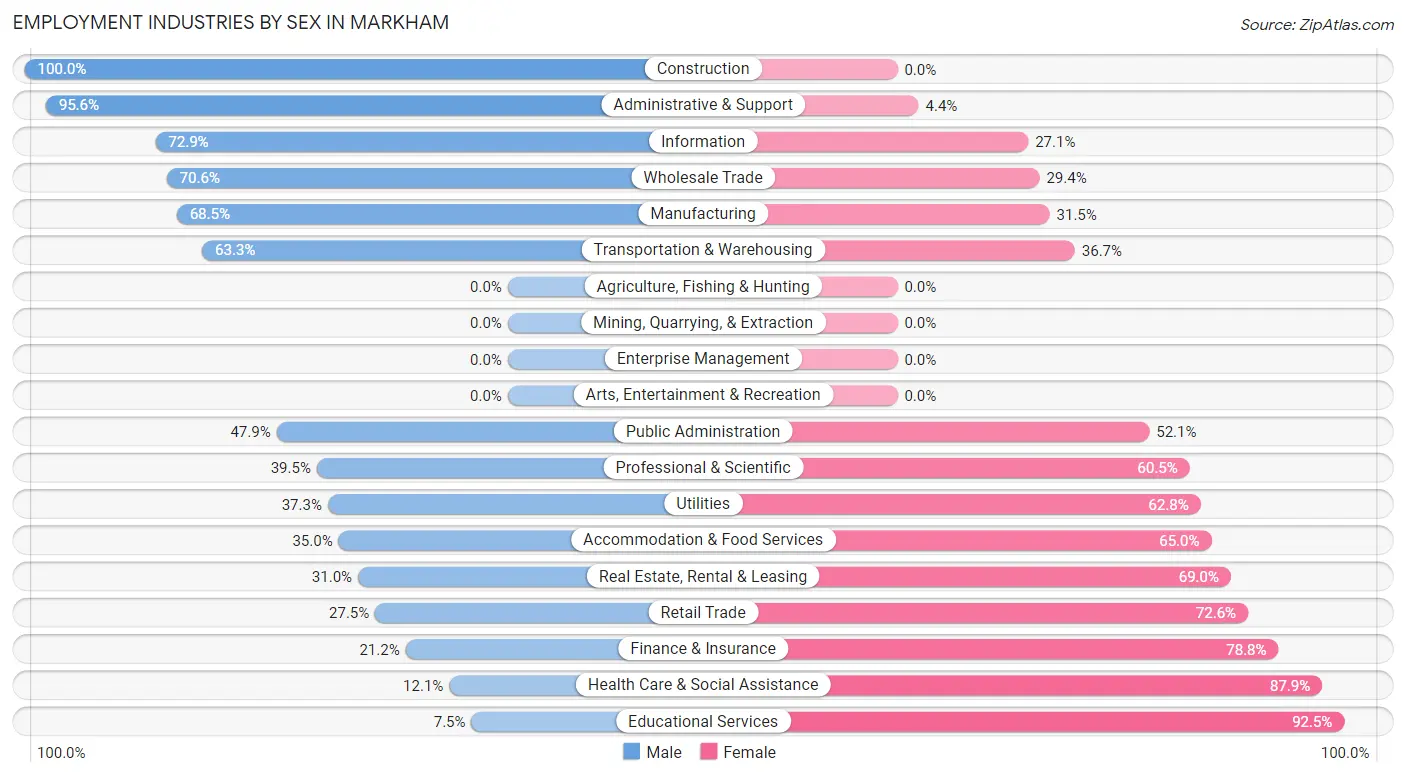
Employment Industries by Sex in Markham
The Markham industries that see more men than women are Construction (100.0%), Administrative & Support (95.6%), and Information (72.9%), whereas the industries that tend to have a higher number of women are Educational Services (92.5%), Health Care & Social Assistance (87.9%), and Finance & Insurance (78.8%).
| Industry | Male | Female |
| Agriculture, Fishing & Hunting | 0 (0.0%) | 0 (0.0%) |
| Mining, Quarrying, & Extraction | 0 (0.0%) | 0 (0.0%) |
| Construction | 310 (100.0%) | 0 (0.0%) |
| Manufacturing | 237 (68.5%) | 109 (31.5%) |
| Wholesale Trade | 24 (70.6%) | 10 (29.4%) |
| Retail Trade | 129 (27.5%) | 341 (72.6%) |
| Transportation & Warehousing | 267 (63.3%) | 155 (36.7%) |
| Utilities | 19 (37.2%) | 32 (62.7%) |
| Information | 35 (72.9%) | 13 (27.1%) |
| Finance & Insurance | 51 (21.2%) | 190 (78.8%) |
| Real Estate, Rental & Leasing | 49 (31.0%) | 109 (69.0%) |
| Professional & Scientific | 34 (39.5%) | 52 (60.5%) |
| Enterprise Management | 0 (0.0%) | 0 (0.0%) |
| Administrative & Support | 196 (95.6%) | 9 (4.4%) |
| Educational Services | 7 (7.5%) | 86 (92.5%) |
| Health Care & Social Assistance | 127 (12.1%) | 921 (87.9%) |
| Arts, Entertainment & Recreation | 0 (0.0%) | 0 (0.0%) |
| Accommodation & Food Services | 110 (35.0%) | 204 (65.0%) |
| Public Administration | 112 (47.9%) | 122 (52.1%) |
| Total | 1,852 (43.7%) | 2,386 (56.3%) |
Education in Markham
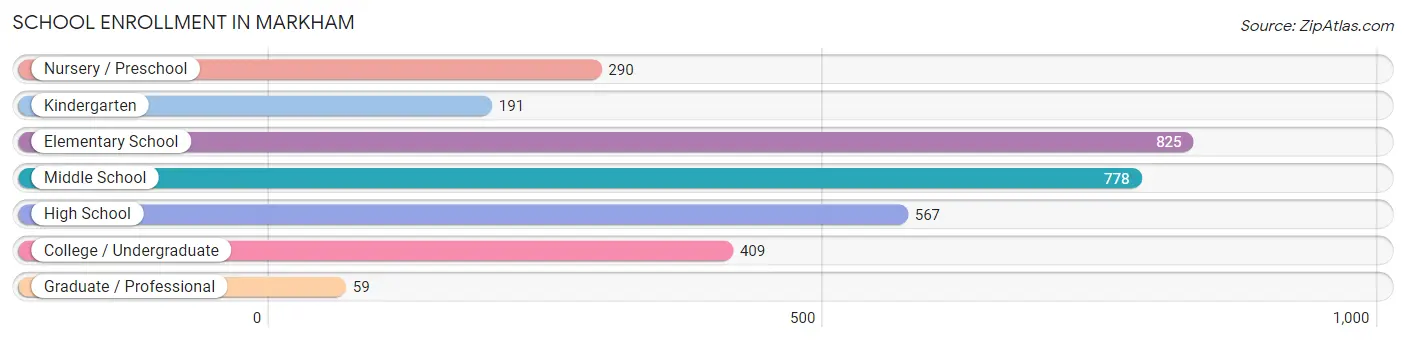
School Enrollment in Markham
The most common levels of schooling among the 3,119 students in Markham are elementary school (825 | 26.5%), middle school (778 | 24.9%), and high school (567 | 18.2%).
| School Level | # Students | % Students |
| Nursery / Preschool | 290 | 9.3% |
| Kindergarten | 191 | 6.1% |
| Elementary School | 825 | 26.5% |
| Middle School | 778 | 24.9% |
| High School | 567 | 18.2% |
| College / Undergraduate | 409 | 13.1% |
| Graduate / Professional | 59 | 1.9% |
| Total | 3,119 | 100.0% |
School Enrollment by Age by Funding Source in Markham
Out of a total of 3,119 students who are enrolled in schools in Markham, 446 (14.3%) attend a private institution, while the remaining 2,673 (85.7%) are enrolled in public schools. The age group of 18 to 19 year olds has the highest likelihood of being enrolled in private schools, with 87 (47.3% in the age bracket) enrolled. Conversely, the age group of 15 to 17 year olds has the lowest likelihood of being enrolled in a private school, with 389 (100.0% in the age bracket) attending a public institution.
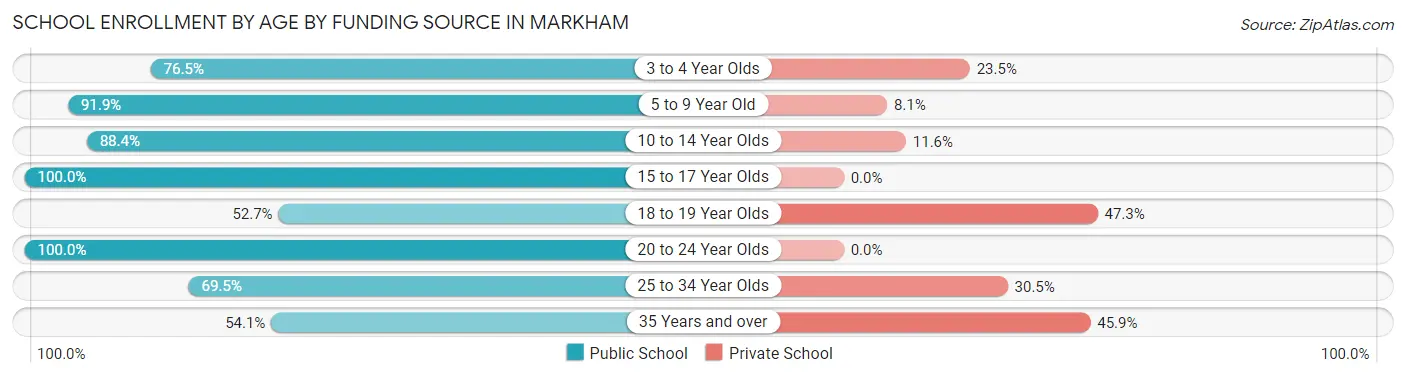
| Age Bracket | Public School | Private School |
| 3 to 4 Year Olds | 189 (76.5%) | 58 (23.5%) |
| 5 to 9 Year Old | 843 (91.9%) | 74 (8.1%) |
| 10 to 14 Year Olds | 878 (88.4%) | 115 (11.6%) |
| 15 to 17 Year Olds | 389 (100.0%) | 0 (0.0%) |
| 18 to 19 Year Olds | 97 (52.7%) | 87 (47.3%) |
| 20 to 24 Year Olds | 87 (100.0%) | 0 (0.0%) |
| 25 to 34 Year Olds | 116 (69.5%) | 51 (30.5%) |
| 35 Years and over | 73 (54.1%) | 62 (45.9%) |
| Total | 2,673 (85.7%) | 446 (14.3%) |
Educational Attainment by Field of Study in Markham
Business (334 | 28.4%), science & technology (310 | 26.4%), education (223 | 19.0%), arts & humanities (84 | 7.2%), and communications (63 | 5.4%) are the most common fields of study among 1,174 individuals in Markham who have obtained a bachelor's degree or higher.
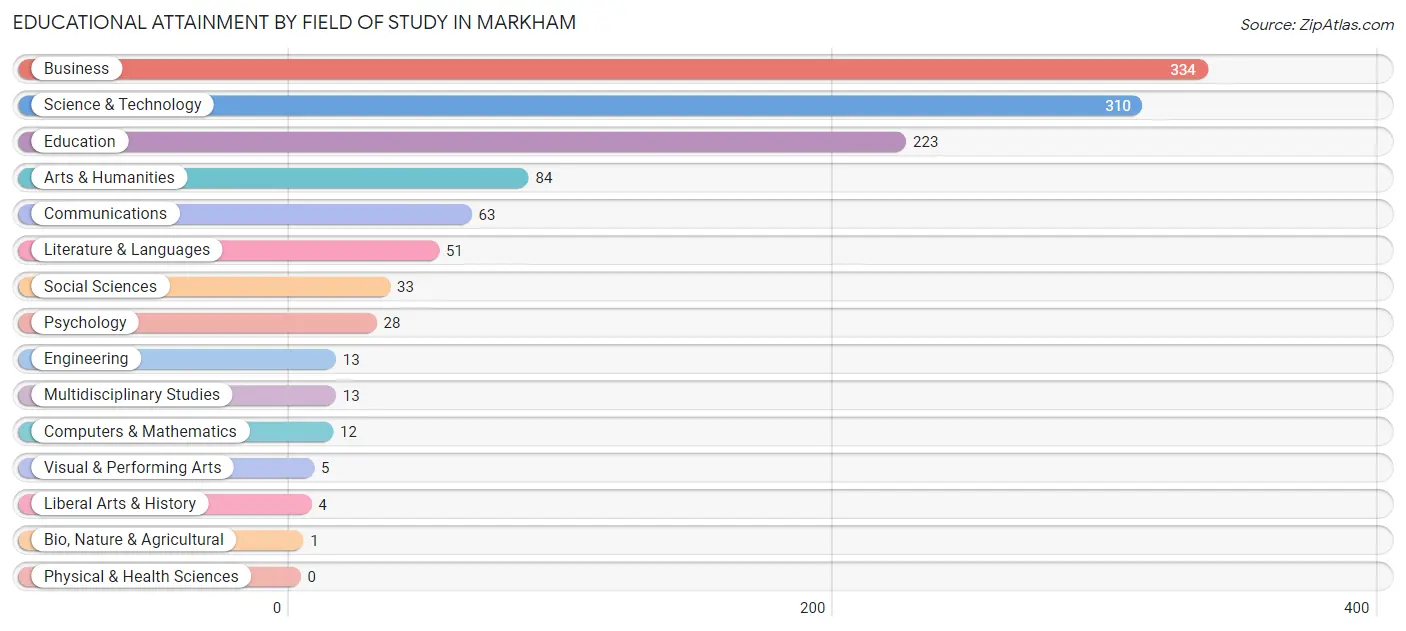
| Field of Study | # Graduates | % Graduates |
| Computers & Mathematics | 12 | 1.0% |
| Bio, Nature & Agricultural | 1 | 0.1% |
| Physical & Health Sciences | 0 | 0.0% |
| Psychology | 28 | 2.4% |
| Social Sciences | 33 | 2.8% |
| Engineering | 13 | 1.1% |
| Multidisciplinary Studies | 13 | 1.1% |
| Science & Technology | 310 | 26.4% |
| Business | 334 | 28.4% |
| Education | 223 | 19.0% |
| Literature & Languages | 51 | 4.3% |
| Liberal Arts & History | 4 | 0.3% |
| Visual & Performing Arts | 5 | 0.4% |
| Communications | 63 | 5.4% |
| Arts & Humanities | 84 | 7.2% |
| Total | 1,174 | 100.0% |
Transportation & Commute in Markham
Vehicle Availability by Sex in Markham
The most prevalent vehicle ownership categories in Markham are males with 2 vehicles (575, accounting for 31.5%) and females with 2 vehicles (889, making up 25.4%).
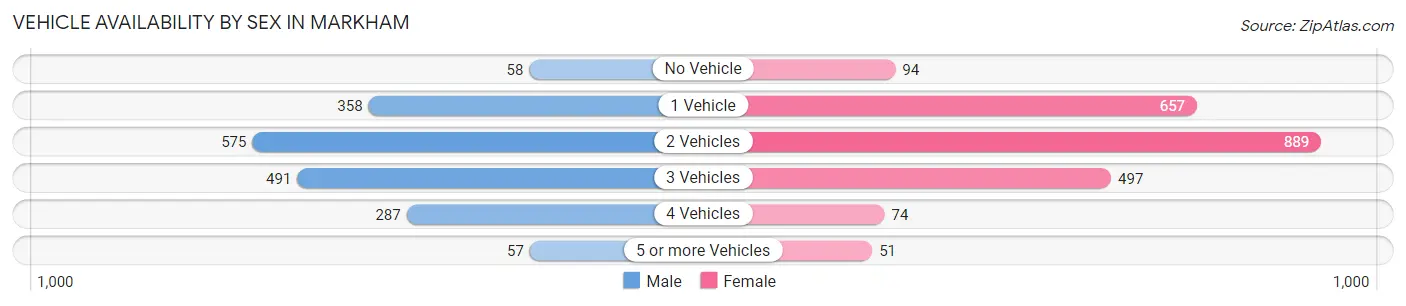
| Vehicles Available | Male | Female |
| No Vehicle | 58 (3.2%) | 94 (4.2%) |
| 1 Vehicle | 358 (19.6%) | 657 (29.0%) |
| 2 Vehicles | 575 (31.5%) | 889 (39.3%) |
| 3 Vehicles | 491 (26.9%) | 497 (22.0%) |
| 4 Vehicles | 287 (15.7%) | 74 (3.3%) |
| 5 or more Vehicles | 57 (3.1%) | 51 (2.2%) |
| Total | 1,826 (100.0%) | 2,262 (100.0%) |
Commute Time in Markham
The most frequently occuring commute durations in Markham are 20 to 24 minutes (690 commuters, 18.7%), 60 to 89 minutes (435 commuters, 11.8%), and 45 to 59 minutes (408 commuters, 11.1%).
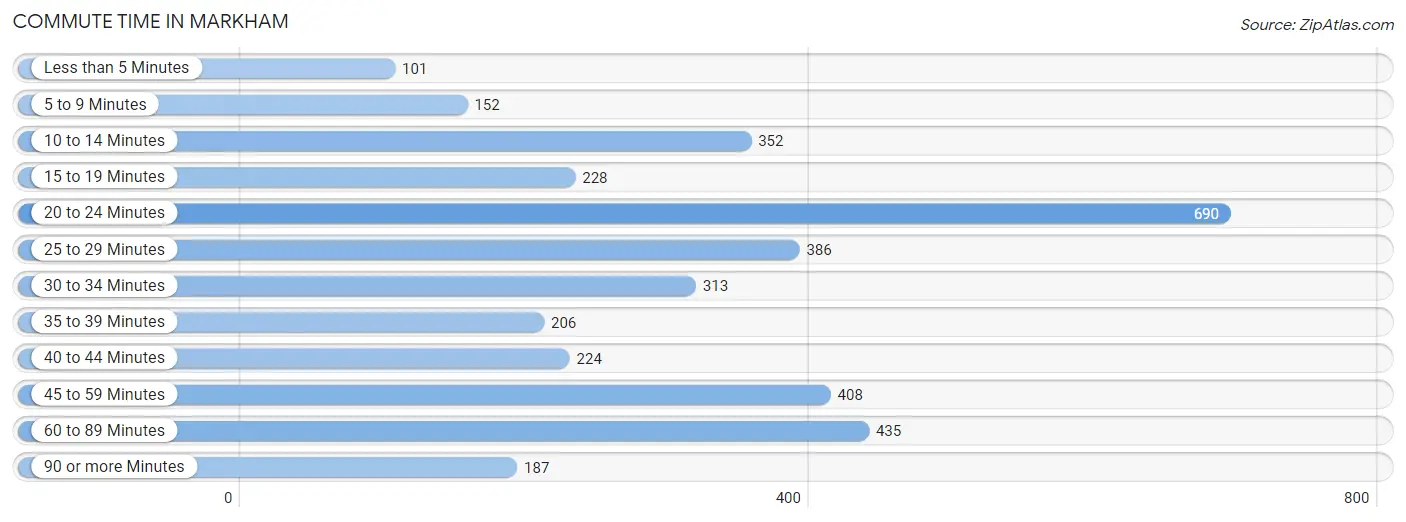
| Commute Time | # Commuters | % Commuters |
| Less than 5 Minutes | 101 | 2.7% |
| 5 to 9 Minutes | 152 | 4.1% |
| 10 to 14 Minutes | 352 | 9.6% |
| 15 to 19 Minutes | 228 | 6.2% |
| 20 to 24 Minutes | 690 | 18.7% |
| 25 to 29 Minutes | 386 | 10.5% |
| 30 to 34 Minutes | 313 | 8.5% |
| 35 to 39 Minutes | 206 | 5.6% |
| 40 to 44 Minutes | 224 | 6.1% |
| 45 to 59 Minutes | 408 | 11.1% |
| 60 to 89 Minutes | 435 | 11.8% |
| 90 or more Minutes | 187 | 5.1% |
Commute Time by Sex in Markham
The most common commute times in Markham are 20 to 24 minutes (308 commuters, 18.7%) for males and 20 to 24 minutes (382 commuters, 18.8%) for females.
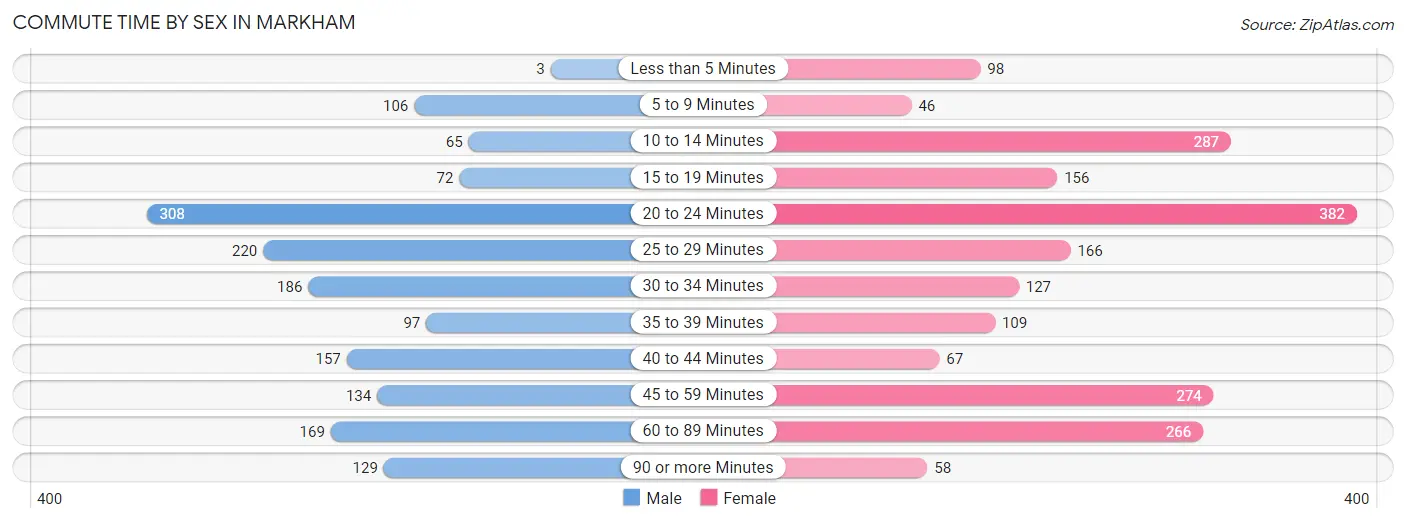
| Commute Time | Male | Female |
| Less than 5 Minutes | 3 (0.2%) | 98 (4.8%) |
| 5 to 9 Minutes | 106 (6.4%) | 46 (2.3%) |
| 10 to 14 Minutes | 65 (4.0%) | 287 (14.1%) |
| 15 to 19 Minutes | 72 (4.4%) | 156 (7.7%) |
| 20 to 24 Minutes | 308 (18.7%) | 382 (18.8%) |
| 25 to 29 Minutes | 220 (13.4%) | 166 (8.2%) |
| 30 to 34 Minutes | 186 (11.3%) | 127 (6.2%) |
| 35 to 39 Minutes | 97 (5.9%) | 109 (5.3%) |
| 40 to 44 Minutes | 157 (9.5%) | 67 (3.3%) |
| 45 to 59 Minutes | 134 (8.1%) | 274 (13.5%) |
| 60 to 89 Minutes | 169 (10.3%) | 266 (13.1%) |
| 90 or more Minutes | 129 (7.8%) | 58 (2.9%) |
Time of Departure to Work by Sex in Markham
The most frequent times of departure to work in Markham are 7:00 AM to 7:29 AM (288, 17.5%) for males and 7:00 AM to 7:29 AM (368, 18.1%) for females.
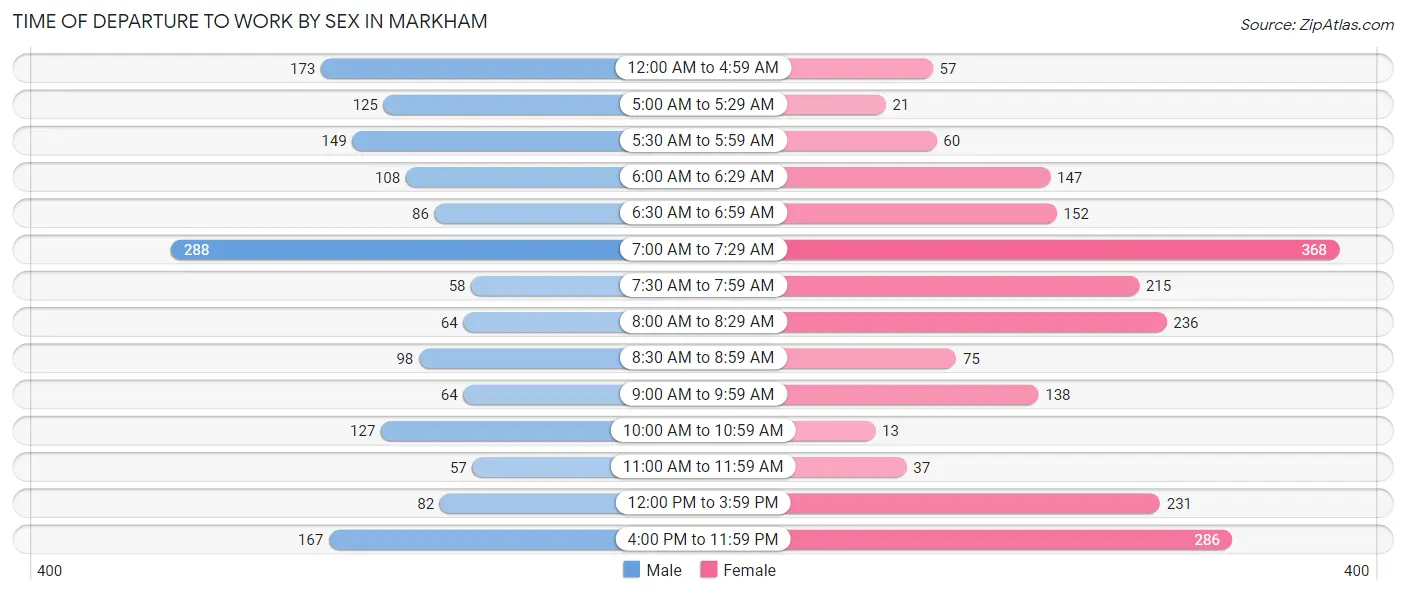
| Time of Departure | Male | Female |
| 12:00 AM to 4:59 AM | 173 (10.5%) | 57 (2.8%) |
| 5:00 AM to 5:29 AM | 125 (7.6%) | 21 (1.0%) |
| 5:30 AM to 5:59 AM | 149 (9.0%) | 60 (2.9%) |
| 6:00 AM to 6:29 AM | 108 (6.6%) | 147 (7.2%) |
| 6:30 AM to 6:59 AM | 86 (5.2%) | 152 (7.5%) |
| 7:00 AM to 7:29 AM | 288 (17.5%) | 368 (18.1%) |
| 7:30 AM to 7:59 AM | 58 (3.5%) | 215 (10.6%) |
| 8:00 AM to 8:29 AM | 64 (3.9%) | 236 (11.6%) |
| 8:30 AM to 8:59 AM | 98 (5.9%) | 75 (3.7%) |
| 9:00 AM to 9:59 AM | 64 (3.9%) | 138 (6.8%) |
| 10:00 AM to 10:59 AM | 127 (7.7%) | 13 (0.6%) |
| 11:00 AM to 11:59 AM | 57 (3.5%) | 37 (1.8%) |
| 12:00 PM to 3:59 PM | 82 (5.0%) | 231 (11.4%) |
| 4:00 PM to 11:59 PM | 167 (10.2%) | 286 (14.1%) |
| Total | 1,646 (100.0%) | 2,036 (100.0%) |
Housing Occupancy in Markham
Occupancy by Ownership in Markham
Of the total 3,703 dwellings in Markham, owner-occupied units account for 2,534 (68.4%), while renter-occupied units make up 1,169 (31.6%).
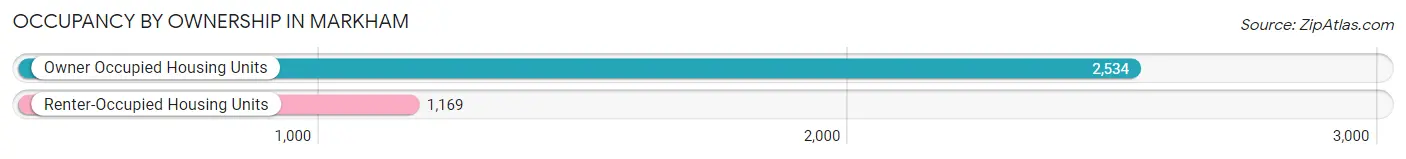
| Occupancy | # Housing Units | % Housing Units |
| Owner Occupied Housing Units | 2,534 | 68.4% |
| Renter-Occupied Housing Units | 1,169 | 31.6% |
| Total Occupied Housing Units | 3,703 | 100.0% |
Occupancy by Household Size in Markham
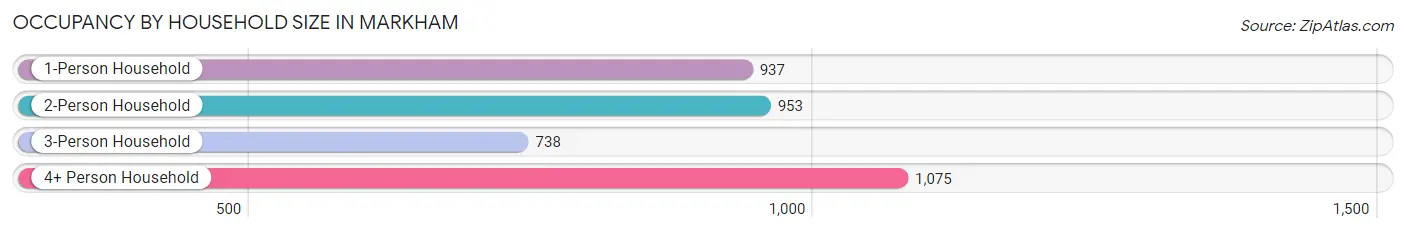
| Household Size | # Housing Units | % Housing Units |
| 1-Person Household | 937 | 25.3% |
| 2-Person Household | 953 | 25.7% |
| 3-Person Household | 738 | 19.9% |
| 4+ Person Household | 1,075 | 29.0% |
| Total Housing Units | 3,703 | 100.0% |
Occupancy by Ownership by Household Size in Markham
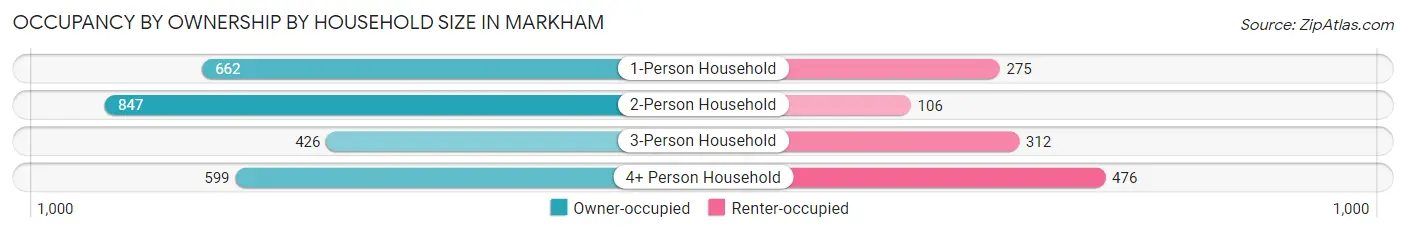
| Household Size | Owner-occupied | Renter-occupied |
| 1-Person Household | 662 (70.7%) | 275 (29.3%) |
| 2-Person Household | 847 (88.9%) | 106 (11.1%) |
| 3-Person Household | 426 (57.7%) | 312 (42.3%) |
| 4+ Person Household | 599 (55.7%) | 476 (44.3%) |
| Total Housing Units | 2,534 (68.4%) | 1,169 (31.6%) |
Occupancy by Educational Attainment in Markham
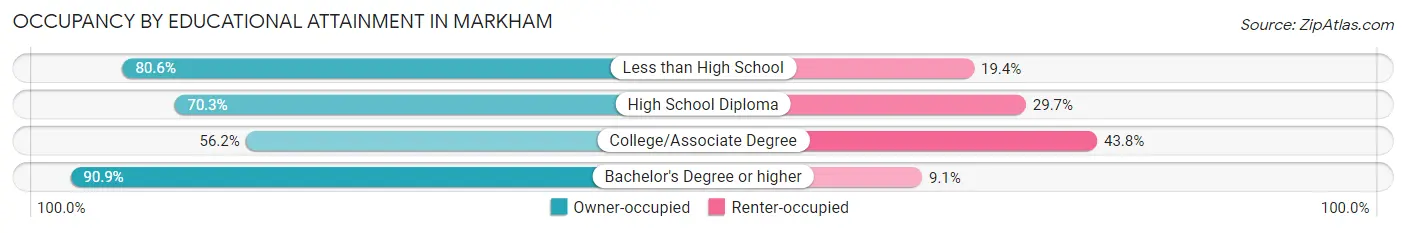
| Household Size | Owner-occupied | Renter-occupied |
| Less than High School | 191 (80.6%) | 46 (19.4%) |
| High School Diploma | 751 (70.3%) | 317 (29.7%) |
| College/Associate Degree | 952 (56.2%) | 742 (43.8%) |
| Bachelor's Degree or higher | 640 (90.9%) | 64 (9.1%) |
Occupancy by Age of Householder in Markham
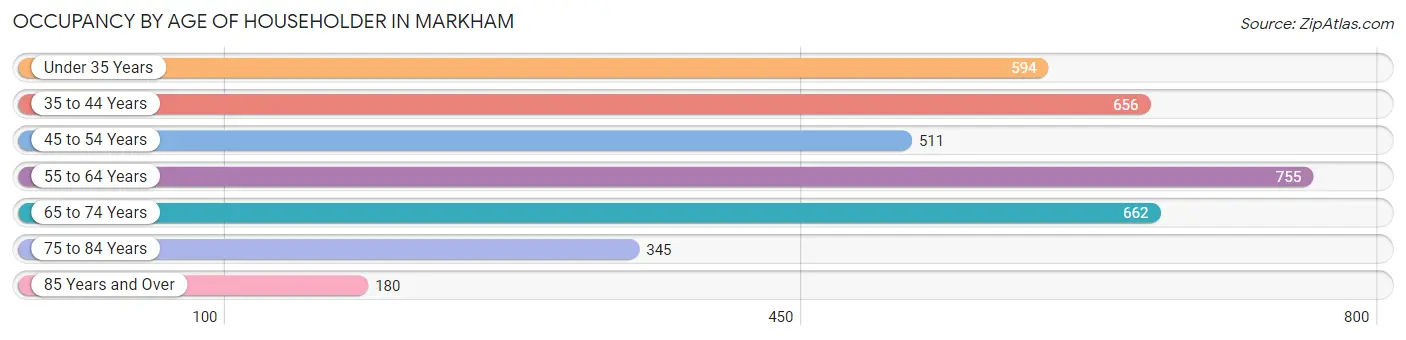
| Age Bracket | # Households | % Households |
| Under 35 Years | 594 | 16.0% |
| 35 to 44 Years | 656 | 17.7% |
| 45 to 54 Years | 511 | 13.8% |
| 55 to 64 Years | 755 | 20.4% |
| 65 to 74 Years | 662 | 17.9% |
| 75 to 84 Years | 345 | 9.3% |
| 85 Years and Over | 180 | 4.9% |
| Total | 3,703 | 100.0% |
Housing Finances in Markham
Median Income by Occupancy in Markham
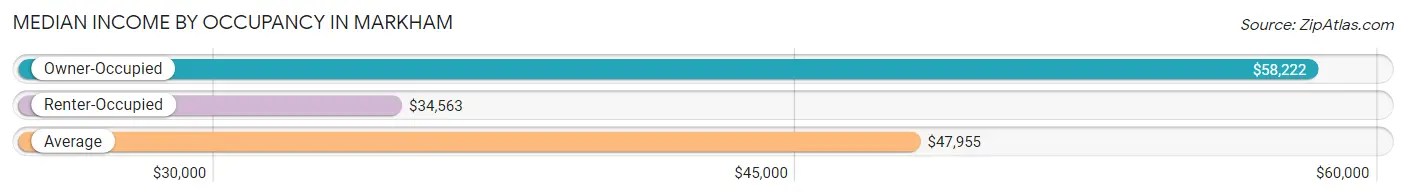
| Occupancy Type | # Households | Median Income |
| Owner-Occupied | 2,534 (68.4%) | $58,222 |
| Renter-Occupied | 1,169 (31.6%) | $34,563 |
| Average | 3,703 (100.0%) | $47,955 |
Occupancy by Householder Income Bracket in Markham
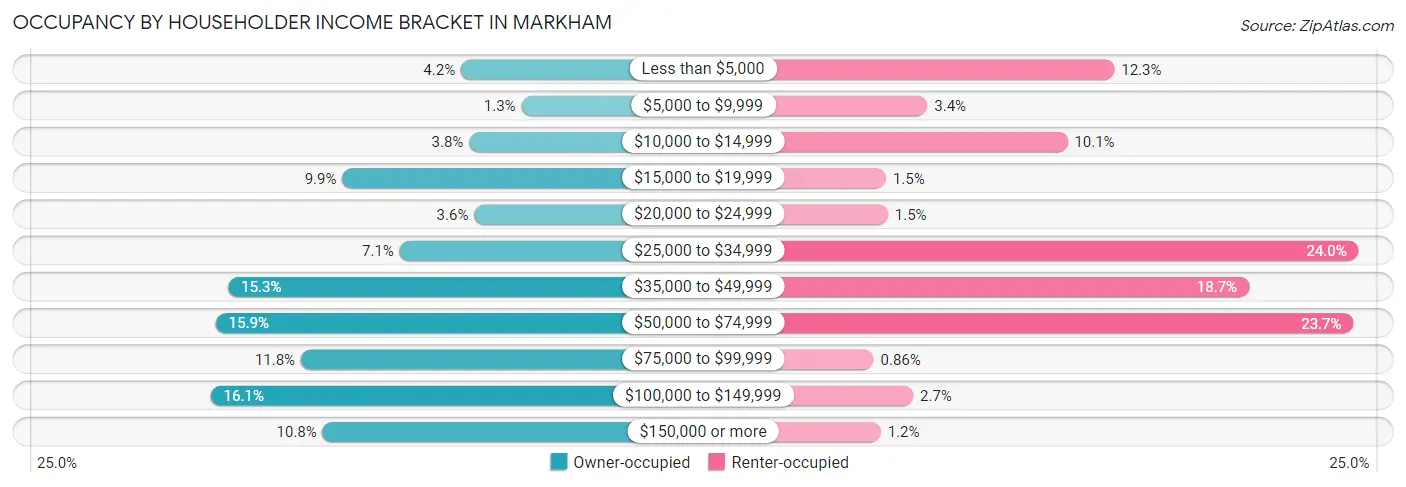
| Income Bracket | Owner-occupied | Renter-occupied |
| Less than $5,000 | 107 (4.2%) | 144 (12.3%) |
| $5,000 to $9,999 | 34 (1.3%) | 40 (3.4%) |
| $10,000 to $14,999 | 97 (3.8%) | 118 (10.1%) |
| $15,000 to $19,999 | 250 (9.9%) | 17 (1.5%) |
| $20,000 to $24,999 | 91 (3.6%) | 18 (1.5%) |
| $25,000 to $34,999 | 181 (7.1%) | 280 (23.9%) |
| $35,000 to $49,999 | 388 (15.3%) | 219 (18.7%) |
| $50,000 to $74,999 | 403 (15.9%) | 277 (23.7%) |
| $75,000 to $99,999 | 300 (11.8%) | 10 (0.9%) |
| $100,000 to $149,999 | 409 (16.1%) | 32 (2.7%) |
| $150,000 or more | 274 (10.8%) | 14 (1.2%) |
| Total | 2,534 (100.0%) | 1,169 (100.0%) |
Monthly Housing Cost Tiers in Markham
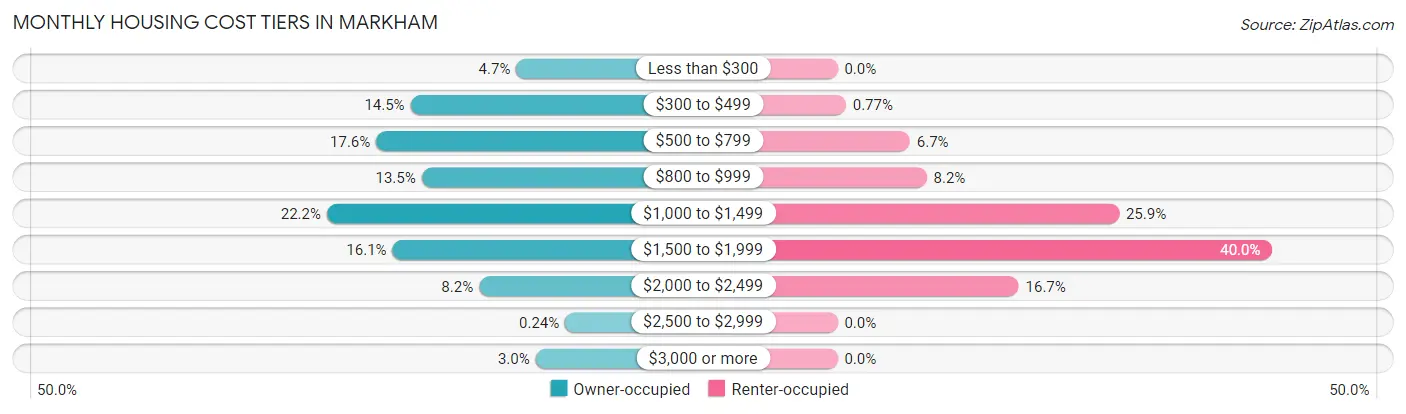
| Monthly Cost | Owner-occupied | Renter-occupied |
| Less than $300 | 120 (4.7%) | 0 (0.0%) |
| $300 to $499 | 367 (14.5%) | 9 (0.8%) |
| $500 to $799 | 447 (17.6%) | 78 (6.7%) |
| $800 to $999 | 341 (13.5%) | 96 (8.2%) |
| $1,000 to $1,499 | 562 (22.2%) | 303 (25.9%) |
| $1,500 to $1,999 | 409 (16.1%) | 468 (40.0%) |
| $2,000 to $2,499 | 207 (8.2%) | 195 (16.7%) |
| $2,500 to $2,999 | 6 (0.2%) | 0 (0.0%) |
| $3,000 or more | 75 (3.0%) | 0 (0.0%) |
| Total | 2,534 (100.0%) | 1,169 (100.0%) |
Physical Housing Characteristics in Markham
Housing Structures in Markham
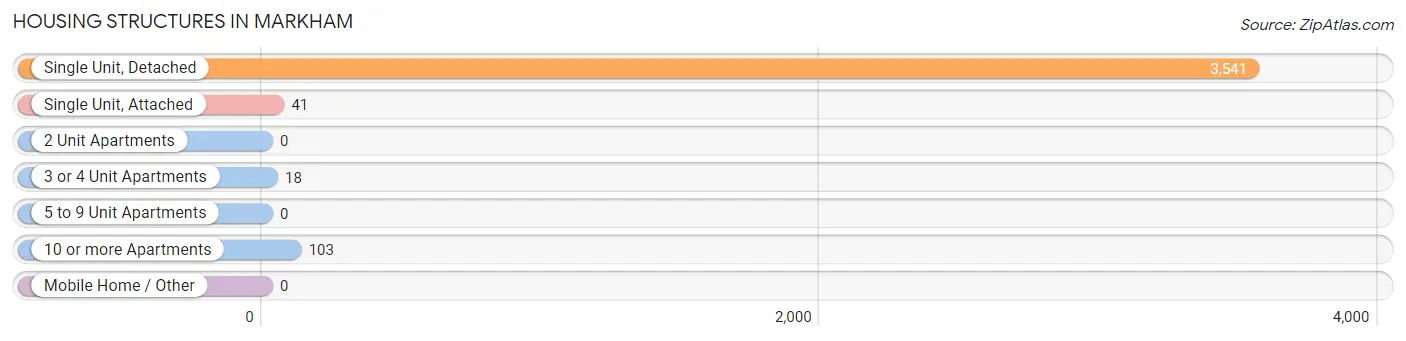
| Structure Type | # Housing Units | % Housing Units |
| Single Unit, Detached | 3,541 | 95.6% |
| Single Unit, Attached | 41 | 1.1% |
| 2 Unit Apartments | 0 | 0.0% |
| 3 or 4 Unit Apartments | 18 | 0.5% |
| 5 to 9 Unit Apartments | 0 | 0.0% |
| 10 or more Apartments | 103 | 2.8% |
| Mobile Home / Other | 0 | 0.0% |
| Total | 3,703 | 100.0% |
Housing Structures by Occupancy in Markham
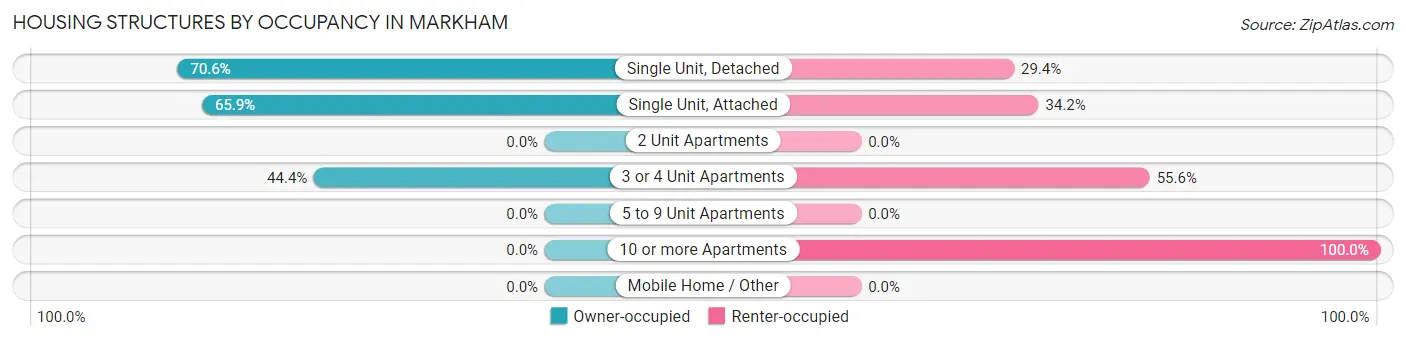
| Structure Type | Owner-occupied | Renter-occupied |
| Single Unit, Detached | 2,499 (70.6%) | 1,042 (29.4%) |
| Single Unit, Attached | 27 (65.8%) | 14 (34.2%) |
| 2 Unit Apartments | 0 (0.0%) | 0 (0.0%) |
| 3 or 4 Unit Apartments | 8 (44.4%) | 10 (55.6%) |
| 5 to 9 Unit Apartments | 0 (0.0%) | 0 (0.0%) |
| 10 or more Apartments | 0 (0.0%) | 103 (100.0%) |
| Mobile Home / Other | 0 (0.0%) | 0 (0.0%) |
| Total | 2,534 (68.4%) | 1,169 (31.6%) |
Housing Structures by Number of Rooms in Markham
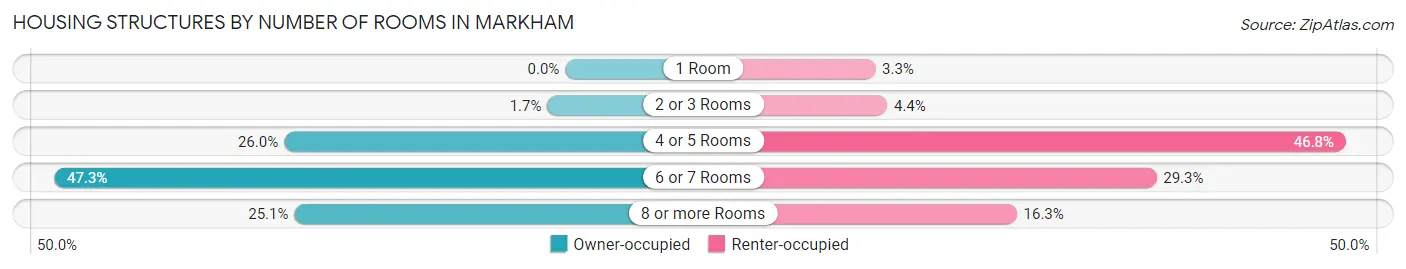
| Number of Rooms | Owner-occupied | Renter-occupied |
| 1 Room | 0 (0.0%) | 38 (3.3%) |
| 2 or 3 Rooms | 42 (1.7%) | 51 (4.4%) |
| 4 or 5 Rooms | 659 (26.0%) | 547 (46.8%) |
| 6 or 7 Rooms | 1,198 (47.3%) | 342 (29.3%) |
| 8 or more Rooms | 635 (25.1%) | 191 (16.3%) |
| Total | 2,534 (100.0%) | 1,169 (100.0%) |
Housing Structure by Heating Type in Markham
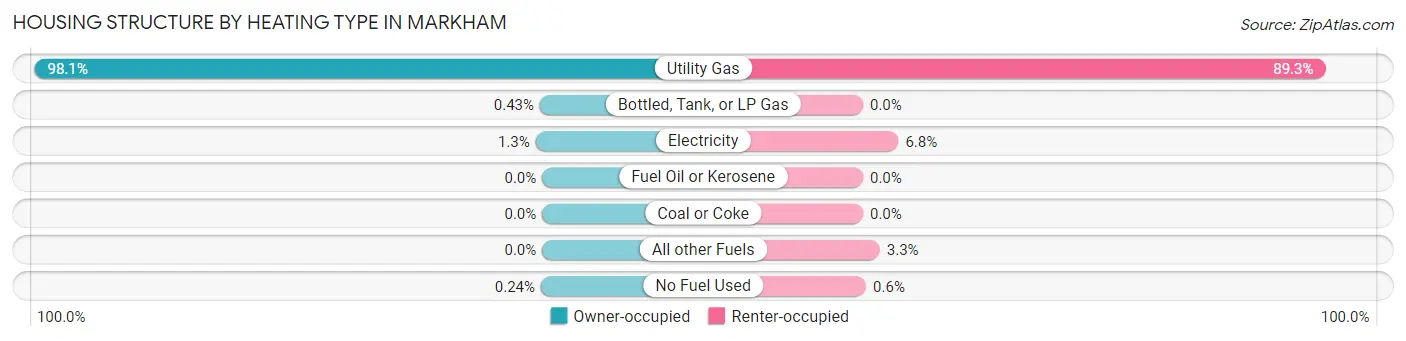
| Heating Type | Owner-occupied | Renter-occupied |
| Utility Gas | 2,485 (98.1%) | 1,044 (89.3%) |
| Bottled, Tank, or LP Gas | 11 (0.4%) | 0 (0.0%) |
| Electricity | 32 (1.3%) | 80 (6.8%) |
| Fuel Oil or Kerosene | 0 (0.0%) | 0 (0.0%) |
| Coal or Coke | 0 (0.0%) | 0 (0.0%) |
| All other Fuels | 0 (0.0%) | 38 (3.3%) |
| No Fuel Used | 6 (0.2%) | 7 (0.6%) |
| Total | 2,534 (100.0%) | 1,169 (100.0%) |
Household Vehicle Usage in Markham
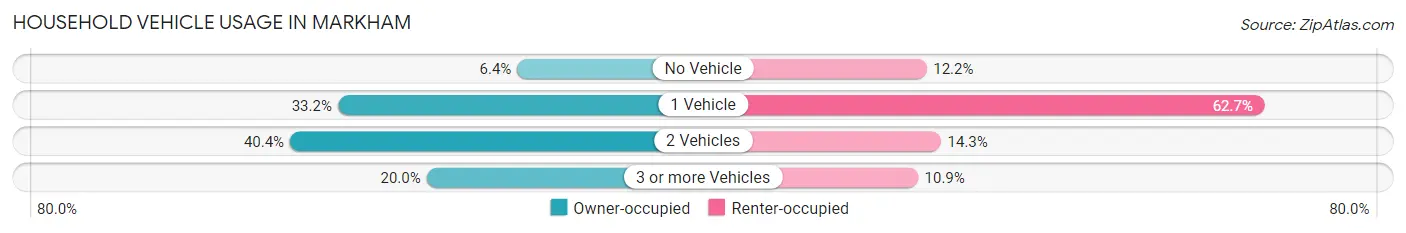
| Vehicles per Household | Owner-occupied | Renter-occupied |
| No Vehicle | 163 (6.4%) | 142 (12.1%) |
| 1 Vehicle | 842 (33.2%) | 733 (62.7%) |
| 2 Vehicles | 1,023 (40.4%) | 167 (14.3%) |
| 3 or more Vehicles | 506 (20.0%) | 127 (10.9%) |
| Total | 2,534 (100.0%) | 1,169 (100.0%) |
Real Estate & Mortgages in Markham
Real Estate and Mortgage Overview in Markham
| Characteristic | Without Mortgage | With Mortgage |
| Housing Units | 1,222 | 1,312 |
| Median Property Value | $87,300 | $117,700 |
| Median Household Income | $43,024 | $191 |
| Monthly Housing Costs | $601 | $75 |
| Real Estate Taxes | $3,433 | $41 |
Property Value by Mortgage Status in Markham
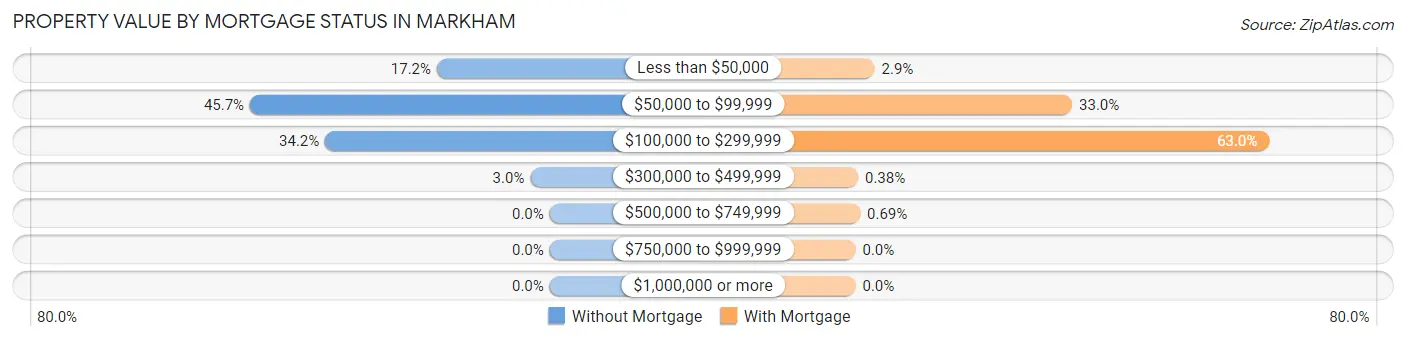
| Property Value | Without Mortgage | With Mortgage |
| Less than $50,000 | 210 (17.2%) | 38 (2.9%) |
| $50,000 to $99,999 | 558 (45.7%) | 433 (33.0%) |
| $100,000 to $299,999 | 418 (34.2%) | 827 (63.0%) |
| $300,000 to $499,999 | 36 (2.9%) | 5 (0.4%) |
| $500,000 to $749,999 | 0 (0.0%) | 9 (0.7%) |
| $750,000 to $999,999 | 0 (0.0%) | 0 (0.0%) |
| $1,000,000 or more | 0 (0.0%) | 0 (0.0%) |
| Total | 1,222 (100.0%) | 1,312 (100.0%) |
Household Income by Mortgage Status in Markham
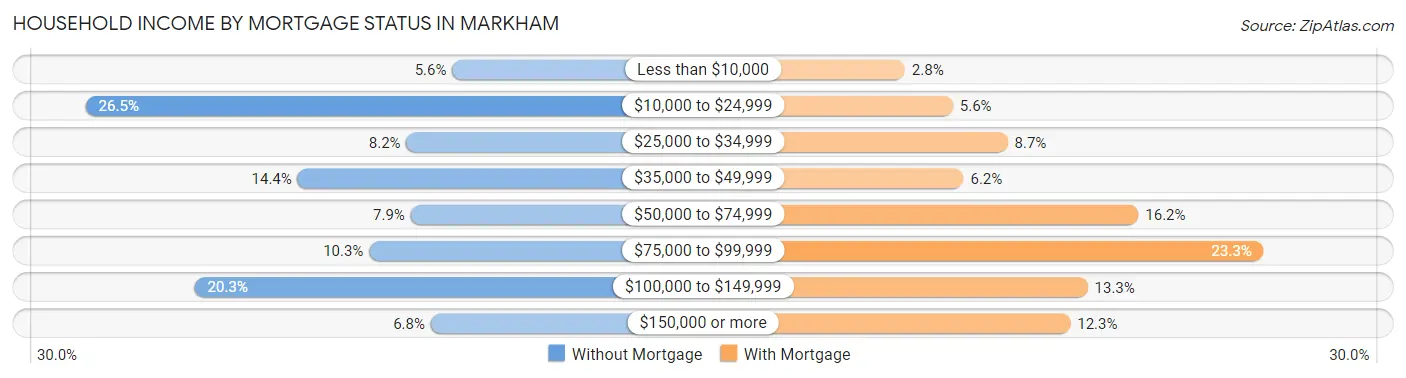
| Household Income | Without Mortgage | With Mortgage |
| Less than $10,000 | 68 (5.6%) | 37 (2.8%) |
| $10,000 to $24,999 | 324 (26.5%) | 73 (5.6%) |
| $25,000 to $34,999 | 100 (8.2%) | 114 (8.7%) |
| $35,000 to $49,999 | 176 (14.4%) | 81 (6.2%) |
| $50,000 to $74,999 | 97 (7.9%) | 212 (16.2%) |
| $75,000 to $99,999 | 126 (10.3%) | 306 (23.3%) |
| $100,000 to $149,999 | 248 (20.3%) | 174 (13.3%) |
| $150,000 or more | 83 (6.8%) | 161 (12.3%) |
| Total | 1,222 (100.0%) | 1,312 (100.0%) |
Property Value to Household Income Ratio in Markham
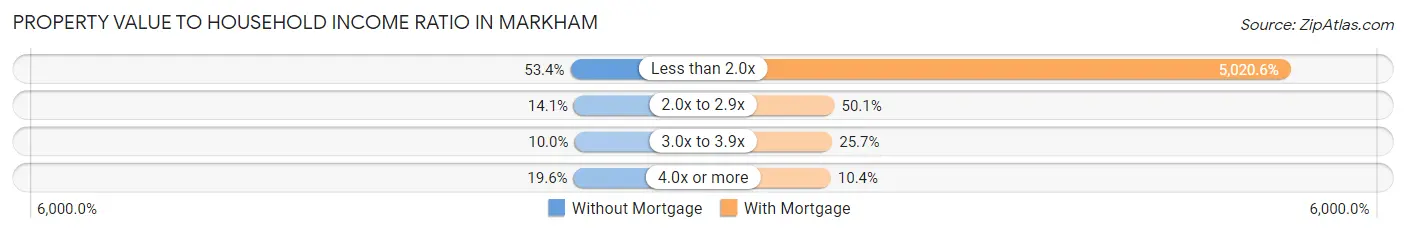
| Value-to-Income Ratio | Without Mortgage | With Mortgage |
| Less than 2.0x | 653 (53.4%) | 65,870 (5,020.6%) |
| 2.0x to 2.9x | 172 (14.1%) | 657 (50.1%) |
| 3.0x to 3.9x | 122 (10.0%) | 337 (25.7%) |
| 4.0x or more | 240 (19.6%) | 136 (10.4%) |
| Total | 1,222 (100.0%) | 1,312 (100.0%) |
Real Estate Taxes by Mortgage Status in Markham
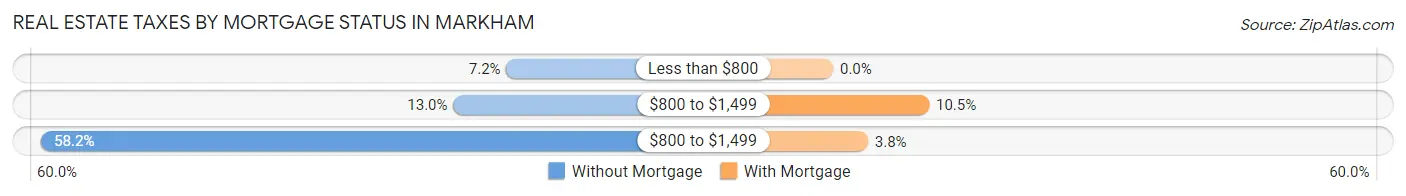
| Property Taxes | Without Mortgage | With Mortgage |
| Less than $800 | 88 (7.2%) | 0 (0.0%) |
| $800 to $1,499 | 159 (13.0%) | 138 (10.5%) |
| $800 to $1,499 | 711 (58.2%) | 50 (3.8%) |
| Total | 1,222 (100.0%) | 1,312 (100.0%) |
Health & Disability in Markham
Health Insurance Coverage by Age in Markham
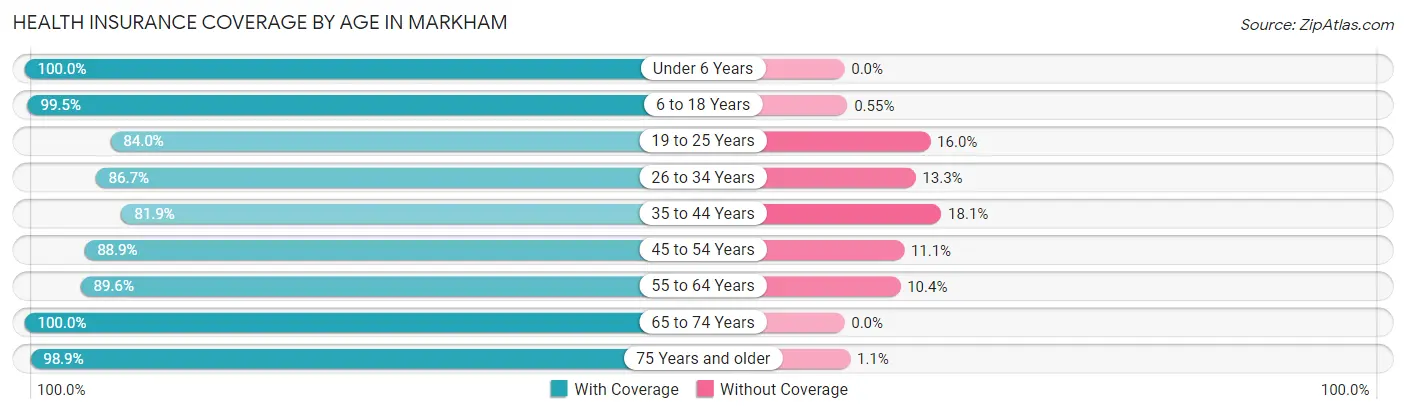
| Age Bracket | With Coverage | Without Coverage |
| Under 6 Years | 1,288 (100.0%) | 0 (0.0%) |
| 6 to 18 Years | 2,355 (99.5%) | 13 (0.5%) |
| 19 to 25 Years | 876 (84.0%) | 167 (16.0%) |
| 26 to 34 Years | 1,302 (86.7%) | 199 (13.3%) |
| 35 to 44 Years | 1,143 (81.9%) | 252 (18.1%) |
| 45 to 54 Years | 911 (88.9%) | 114 (11.1%) |
| 55 to 64 Years | 1,116 (89.6%) | 130 (10.4%) |
| 65 to 74 Years | 981 (100.0%) | 0 (0.0%) |
| 75 Years and older | 737 (98.9%) | 8 (1.1%) |
| Total | 10,709 (92.4%) | 883 (7.6%) |
Health Insurance Coverage by Citizenship Status in Markham
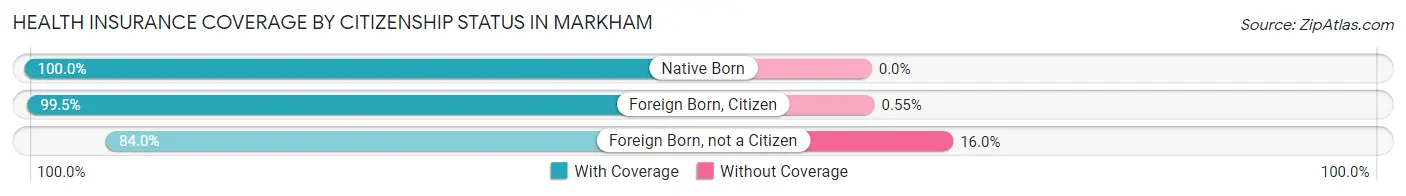
| Citizenship Status | With Coverage | Without Coverage |
| Native Born | 1,288 (100.0%) | 0 (0.0%) |
| Foreign Born, Citizen | 2,355 (99.5%) | 13 (0.5%) |
| Foreign Born, not a Citizen | 876 (84.0%) | 167 (16.0%) |
Health Insurance Coverage by Household Income in Markham
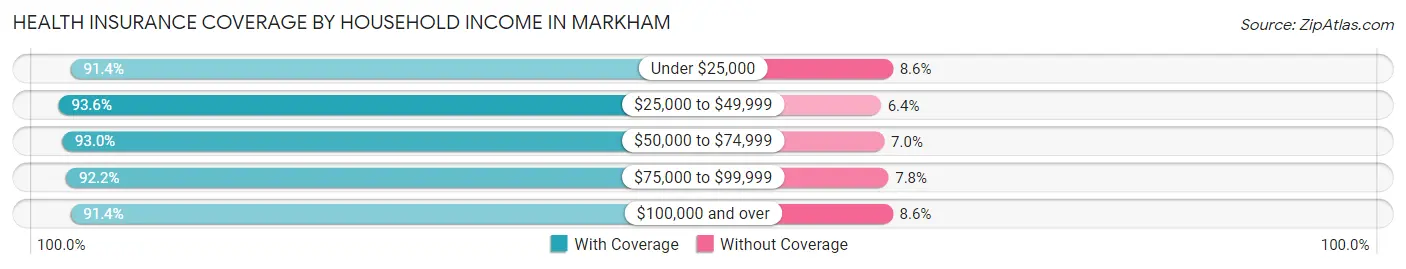
| Household Income | With Coverage | Without Coverage |
| Under $25,000 | 2,112 (91.4%) | 199 (8.6%) |
| $25,000 to $49,999 | 2,707 (93.6%) | 184 (6.4%) |
| $50,000 to $74,999 | 2,219 (93.0%) | 167 (7.0%) |
| $75,000 to $99,999 | 997 (92.2%) | 84 (7.8%) |
| $100,000 and over | 2,641 (91.4%) | 248 (8.6%) |
Public vs Private Health Insurance Coverage by Age in Markham
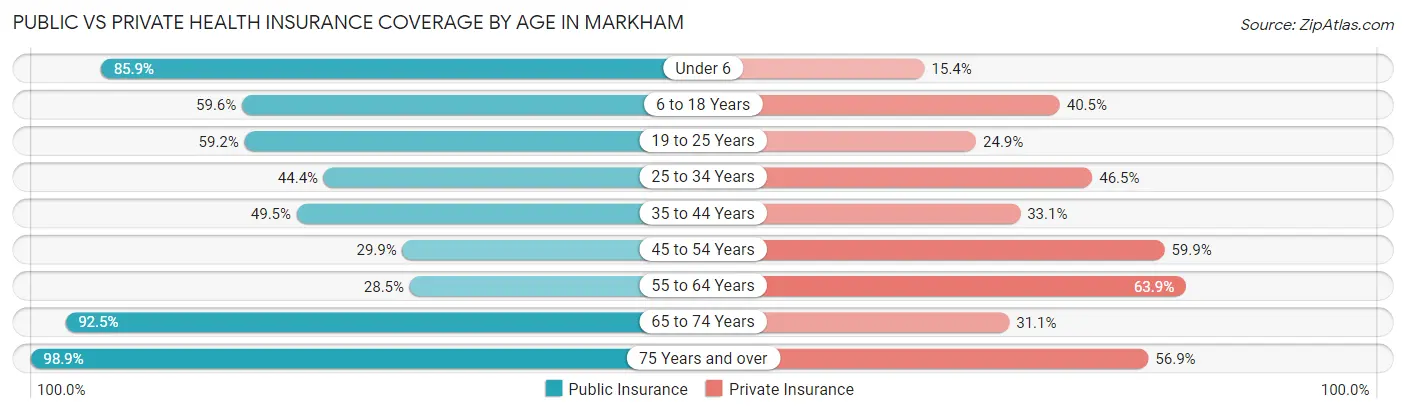
| Age Bracket | Public Insurance | Private Insurance |
| Under 6 | 1,106 (85.9%) | 198 (15.4%) |
| 6 to 18 Years | 1,412 (59.6%) | 958 (40.5%) |
| 19 to 25 Years | 617 (59.2%) | 260 (24.9%) |
| 25 to 34 Years | 667 (44.4%) | 698 (46.5%) |
| 35 to 44 Years | 690 (49.5%) | 462 (33.1%) |
| 45 to 54 Years | 306 (29.8%) | 614 (59.9%) |
| 55 to 64 Years | 355 (28.5%) | 796 (63.9%) |
| 65 to 74 Years | 907 (92.5%) | 305 (31.1%) |
| 75 Years and over | 737 (98.9%) | 424 (56.9%) |
| Total | 6,797 (58.6%) | 4,715 (40.7%) |
Disability Status by Sex by Age in Markham
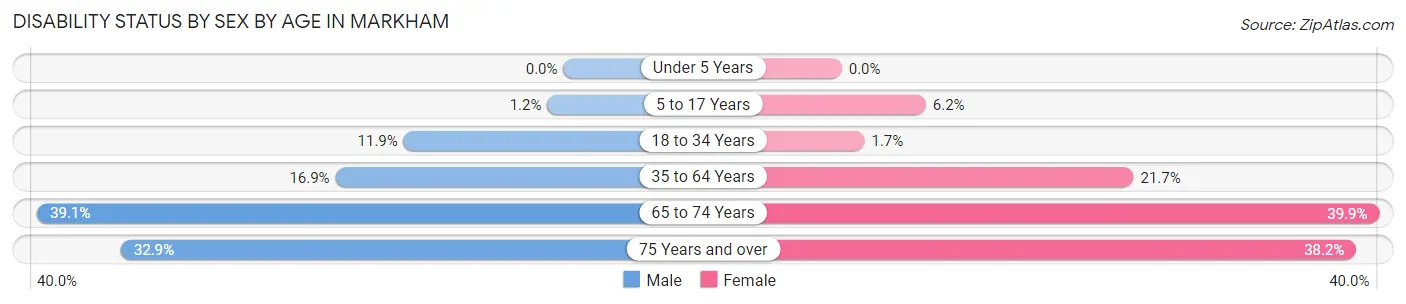
| Age Bracket | Male | Female |
| Under 5 Years | 0 (0.0%) | 0 (0.0%) |
| 5 to 17 Years | 15 (1.2%) | 67 (6.2%) |
| 18 to 34 Years | 137 (11.9%) | 27 (1.7%) |
| 35 to 64 Years | 271 (16.9%) | 447 (21.7%) |
| 65 to 74 Years | 118 (39.1%) | 271 (39.9%) |
| 75 Years and over | 114 (32.9%) | 152 (38.2%) |
Disability Class by Sex by Age in Markham
Disability Class: Hearing Difficulty
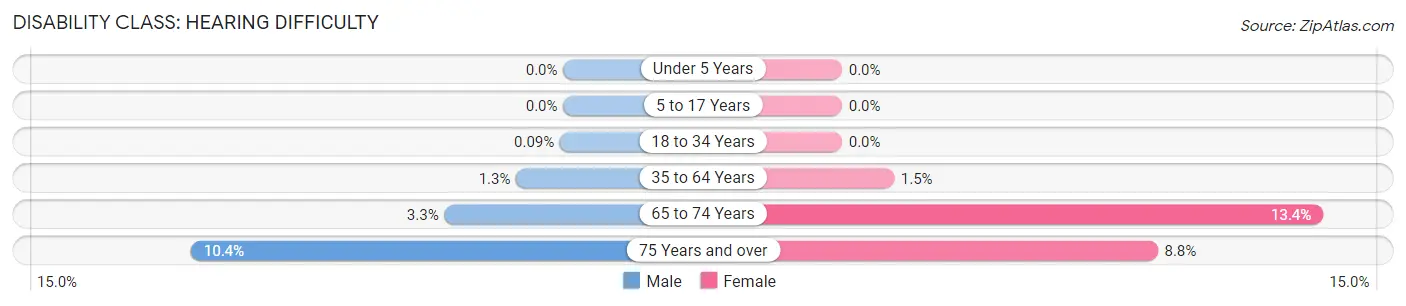
| Age Bracket | Male | Female |
| Under 5 Years | 0 (0.0%) | 0 (0.0%) |
| 5 to 17 Years | 0 (0.0%) | 0 (0.0%) |
| 18 to 34 Years | 1 (0.1%) | 0 (0.0%) |
| 35 to 64 Years | 21 (1.3%) | 30 (1.5%) |
| 65 to 74 Years | 10 (3.3%) | 91 (13.4%) |
| 75 Years and over | 36 (10.4%) | 35 (8.8%) |
Disability Class: Vision Difficulty
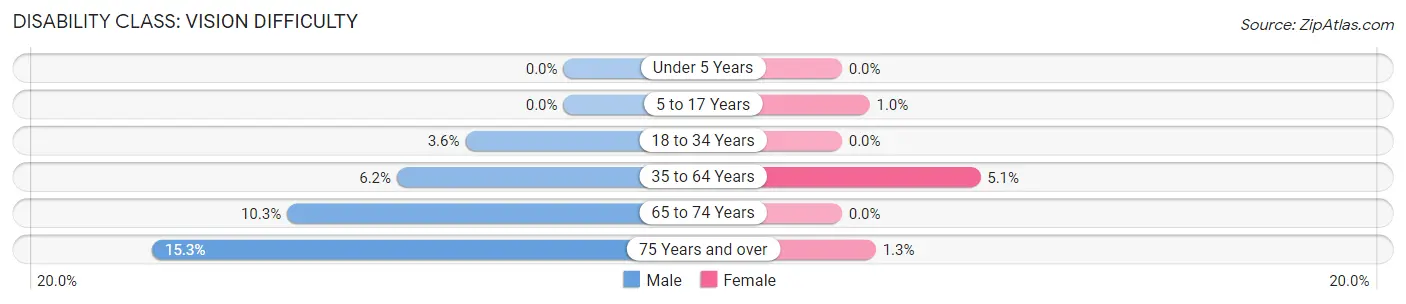
| Age Bracket | Male | Female |
| Under 5 Years | 0 (0.0%) | 0 (0.0%) |
| 5 to 17 Years | 0 (0.0%) | 11 (1.0%) |
| 18 to 34 Years | 42 (3.6%) | 0 (0.0%) |
| 35 to 64 Years | 99 (6.2%) | 106 (5.1%) |
| 65 to 74 Years | 31 (10.3%) | 0 (0.0%) |
| 75 Years and over | 53 (15.3%) | 5 (1.3%) |
Disability Class: Cognitive Difficulty
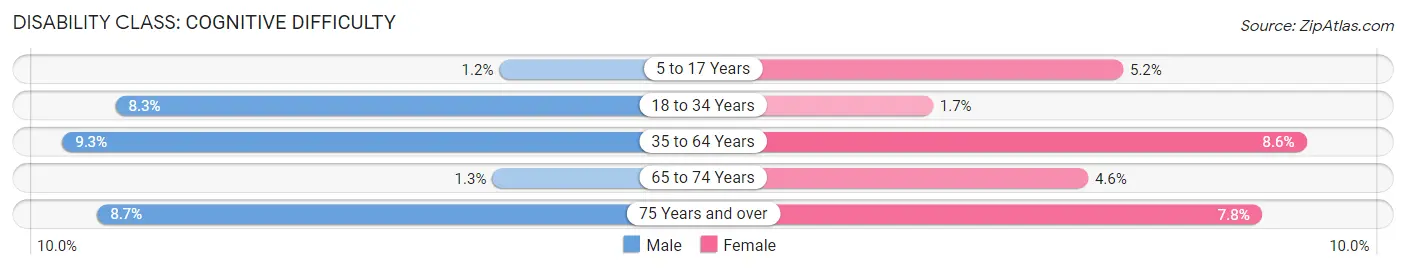
| Age Bracket | Male | Female |
| 5 to 17 Years | 15 (1.2%) | 56 (5.2%) |
| 18 to 34 Years | 96 (8.3%) | 27 (1.7%) |
| 35 to 64 Years | 149 (9.3%) | 178 (8.6%) |
| 65 to 74 Years | 4 (1.3%) | 31 (4.6%) |
| 75 Years and over | 30 (8.6%) | 31 (7.8%) |
Disability Class: Ambulatory Difficulty
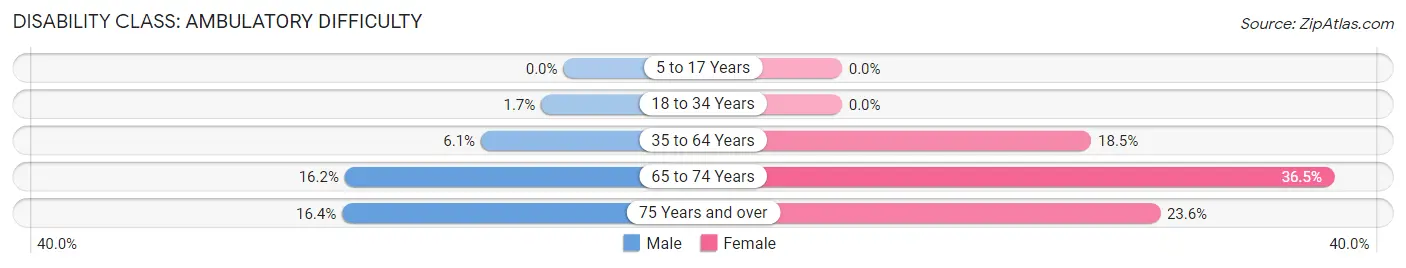
| Age Bracket | Male | Female |
| 5 to 17 Years | 0 (0.0%) | 0 (0.0%) |
| 18 to 34 Years | 19 (1.7%) | 0 (0.0%) |
| 35 to 64 Years | 98 (6.1%) | 382 (18.5%) |
| 65 to 74 Years | 49 (16.2%) | 248 (36.5%) |
| 75 Years and over | 57 (16.4%) | 94 (23.6%) |
Disability Class: Self-Care Difficulty
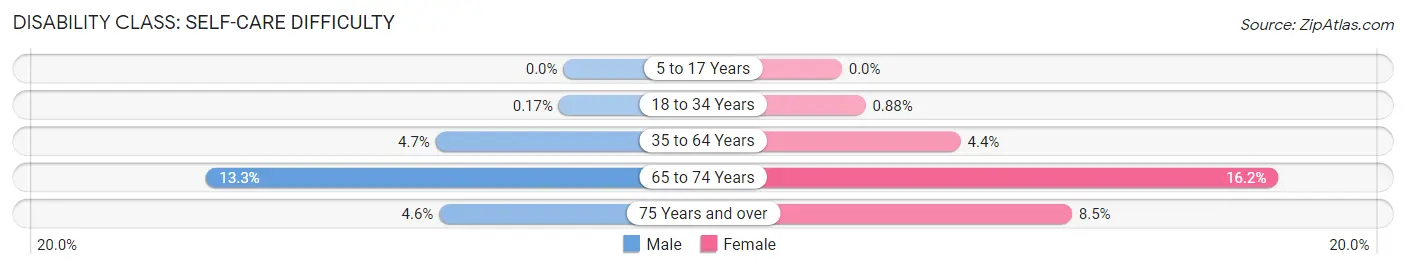
| Age Bracket | Male | Female |
| 5 to 17 Years | 0 (0.0%) | 0 (0.0%) |
| 18 to 34 Years | 2 (0.2%) | 14 (0.9%) |
| 35 to 64 Years | 76 (4.7%) | 91 (4.4%) |
| 65 to 74 Years | 40 (13.3%) | 110 (16.2%) |
| 75 Years and over | 16 (4.6%) | 34 (8.5%) |
Technology Access in Markham
Computing Device Access in Markham
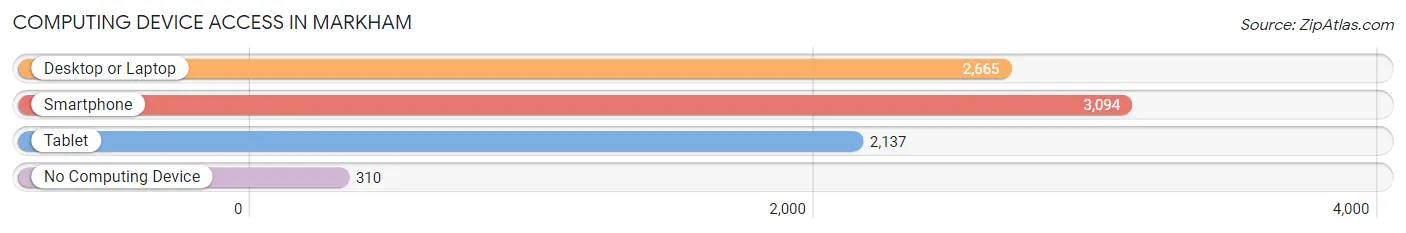
| Device Type | # Households | % Households |
| Desktop or Laptop | 2,665 | 72.0% |
| Smartphone | 3,094 | 83.6% |
| Tablet | 2,137 | 57.7% |
| No Computing Device | 310 | 8.4% |
| Total | 3,703 | 100.0% |
Internet Access in Markham
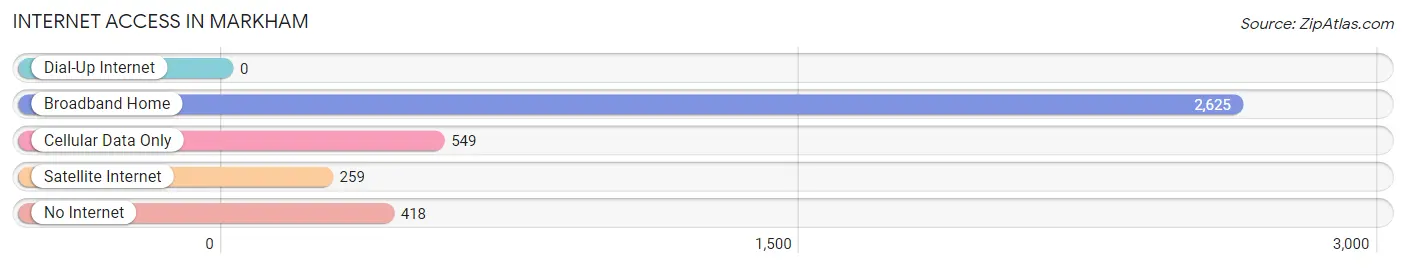
| Internet Type | # Households | % Households |
| Dial-Up Internet | 0 | 0.0% |
| Broadband Home | 2,625 | 70.9% |
| Cellular Data Only | 549 | 14.8% |
| Satellite Internet | 259 | 7.0% |
| No Internet | 418 | 11.3% |
| Total | 3,703 | 100.0% |
Markham Summary
Markham, Illinois is a small city located in Cook County, about 25 miles south of Chicago. It is a part of the Chicago metropolitan area and is home to a population of 12,508 people, according to the 2010 census. The city is known for its diverse population, with a large African American population, as well as a significant Hispanic population.
History
Markham was first settled in 1851 by a group of German immigrants. The city was named after Charles H. Markham, who was the first mayor of the city. The city was incorporated in 1925 and has since grown to become a thriving community.
Geography
Markham is located in the south suburbs of Chicago, in Cook County. It is bordered by the cities of Hazel Crest, Country Club Hills, and Tinley Park. The city is situated on the Calumet River, and is home to several parks and recreational areas. The city has a total area of 4.6 square miles, with 0.2 square miles of water.
Economy
Markham is home to a variety of businesses, including manufacturing, retail, and service industries. The city is home to several large employers, including the Ford Motor Company, which has a plant in the city. Other major employers include the University of Chicago Medical Center, the University of Illinois at Chicago, and the University of Chicago.
Demographics
As of the 2010 census, Markham had a population of 12,508 people. The racial makeup of the city was 57.2% African American, 28.2% White, 8.2% Hispanic or Latino, and 6.4% other. The median household income was $41,945, and the median family income was $50,945.
Markham is a diverse city, with a variety of cultures and backgrounds represented. The city is home to a large African American population, as well as a significant Hispanic population. The city is also home to a variety of religious institutions, including churches, mosques, and synagogues.
Markham is a vibrant city, with a variety of activities and attractions. The city is home to several parks and recreational areas, as well as a variety of restaurants and shops. The city is also home to a variety of cultural events, including the annual Markham Jazz Festival.
Common Questions
What is Per Capita Income in Markham?
Per Capita income in Markham is $22,794.
What is the Median Family Income in Markham?
Median Family Income in Markham is $51,400.
What is the Median Household income in Markham?
Median Household Income in Markham is $47,955.
What is Income or Wage Gap in Markham?
Income or Wage Gap in Markham is 15.6%.
Women in Markham earn 84.4 cents for every dollar earned by a man.
What is Inequality or Gini Index in Markham?
Inequality or Gini Index in Markham is 0.49.
What is the Total Population of Markham?
Total Population of Markham is 11,592.
What is the Total Male Population of Markham?
Total Male Population of Markham is 5,453.
What is the Total Female Population of Markham?
Total Female Population of Markham is 6,139.
What is the Ratio of Males per 100 Females in Markham?
There are 88.83 Males per 100 Females in Markham.
What is the Ratio of Females per 100 Males in Markham?
There are 112.58 Females per 100 Males in Markham.
What is the Median Population Age in Markham?
Median Population Age in Markham is 33.2 Years.
What is the Average Family Size in Markham
Average Family Size in Markham is 3.8 People.
What is the Average Household Size in Markham
Average Household Size in Markham is 3.1 People.
How Large is the Labor Force in Markham?
There are 4,928 People in the Labor Forcein in Markham.
What is the Percentage of People in the Labor Force in Markham?
59.1% of People are in the Labor Force in Markham.
What is the Unemployment Rate in Markham?
Unemployment Rate in Markham is 14.0%.