Lake Holiday, IL Map & Demographics
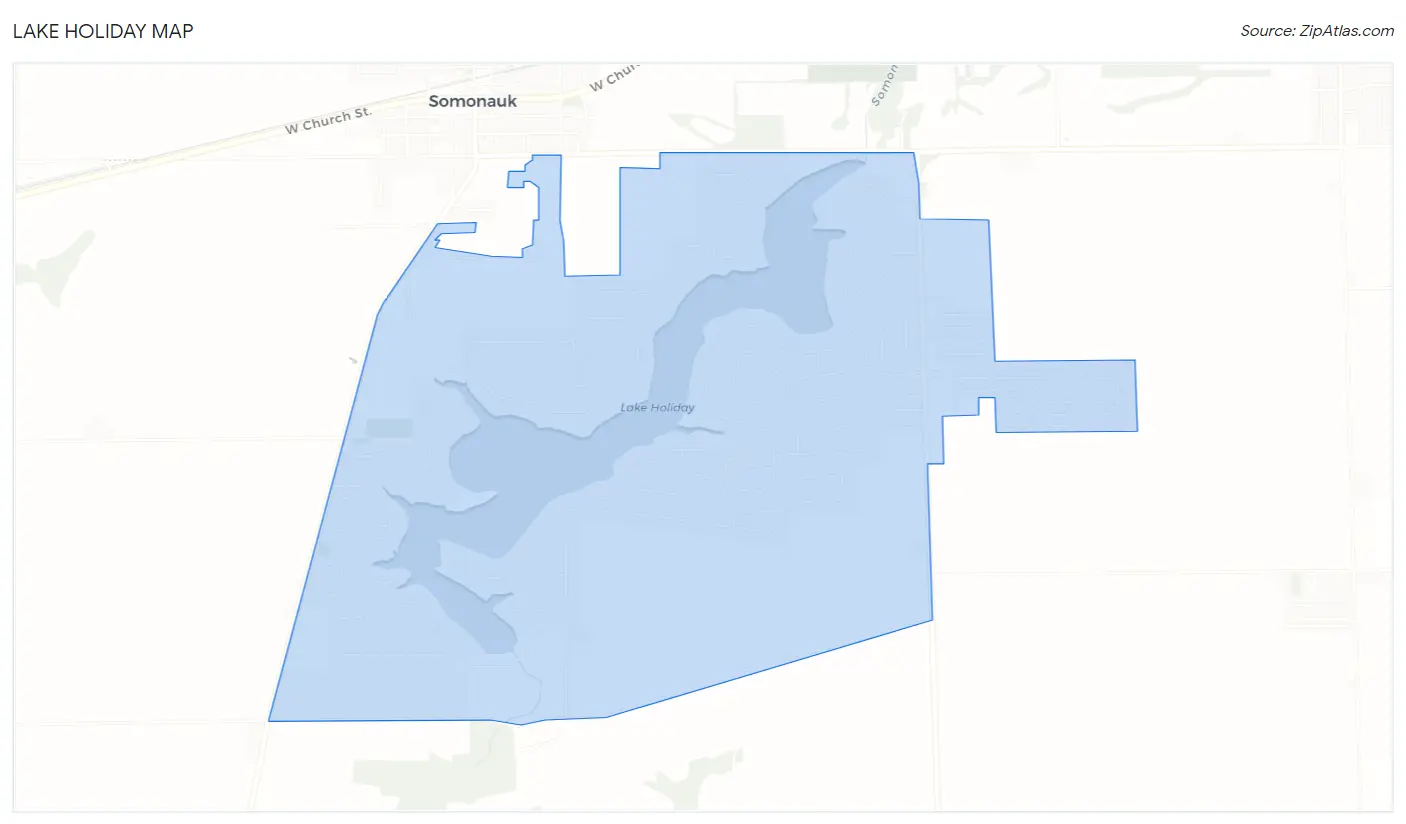
Lake Holiday Map
Lake Holiday Overview
$45,166
PER CAPITA INCOME
$130,086
AVG FAMILY INCOME
$105,580
AVG HOUSEHOLD INCOME
34.3%
WAGE / INCOME GAP [ % ]
65.7¢/ $1
WAGE / INCOME GAP [ $ ]
0.38
INEQUALITY / GINI INDEX
5,485
TOTAL POPULATION
2,757
MALE POPULATION
2,728
FEMALE POPULATION
101.06
MALES / 100 FEMALES
98.95
FEMALES / 100 MALES
43.3
MEDIAN AGE
3.1
AVG FAMILY SIZE
2.6
AVG HOUSEHOLD SIZE
3,021
LABOR FORCE [ PEOPLE ]
66.7%
PERCENT IN LABOR FORCE
7.1%
UNEMPLOYMENT RATE
Income in Lake Holiday
Income Overview in Lake Holiday
Per Capita Income in Lake Holiday is $45,166, while median incomes of families and households are $130,086 and $105,580 respectively.
| Characteristic | Number | Measure |
| Per Capita Income | 5,485 | $45,166 |
| Median Family Income | 1,472 | $130,086 |
| Mean Family Income | 1,472 | $128,258 |
| Median Household Income | 2,087 | $105,580 |
| Mean Household Income | 2,087 | $113,822 |
| Income Deficit | 1,472 | $0 |
| Wage / Income Gap (%) | 5,485 | 34.30% |
| Wage / Income Gap ($) | 5,485 | 65.70¢ per $1 |
| Gini / Inequality Index | 5,485 | 0.38 |
Earnings by Sex in Lake Holiday
Average Earnings in Lake Holiday are $56,233, $68,344 for men and $44,900 for women, a difference of 34.3%.
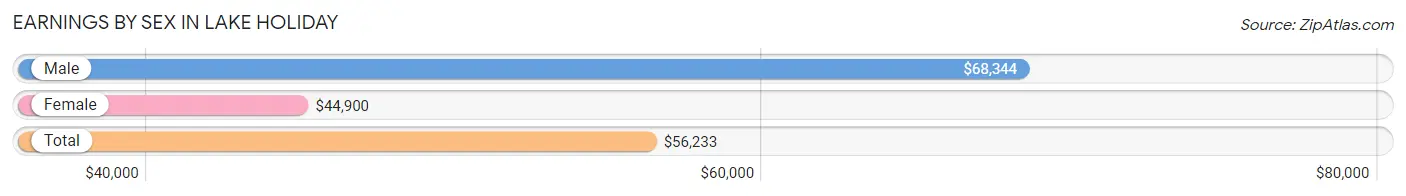
| Sex | Number | Average Earnings |
| Male | 1,690 (54.0%) | $68,344 |
| Female | 1,442 (46.0%) | $44,900 |
| Total | 3,132 (100.0%) | $56,233 |
Earnings by Sex by Income Bracket in Lake Holiday
The most common earnings brackets in Lake Holiday are $100,000+ for men (428 | 25.3%) and $100,000+ for women (226 | 15.7%).
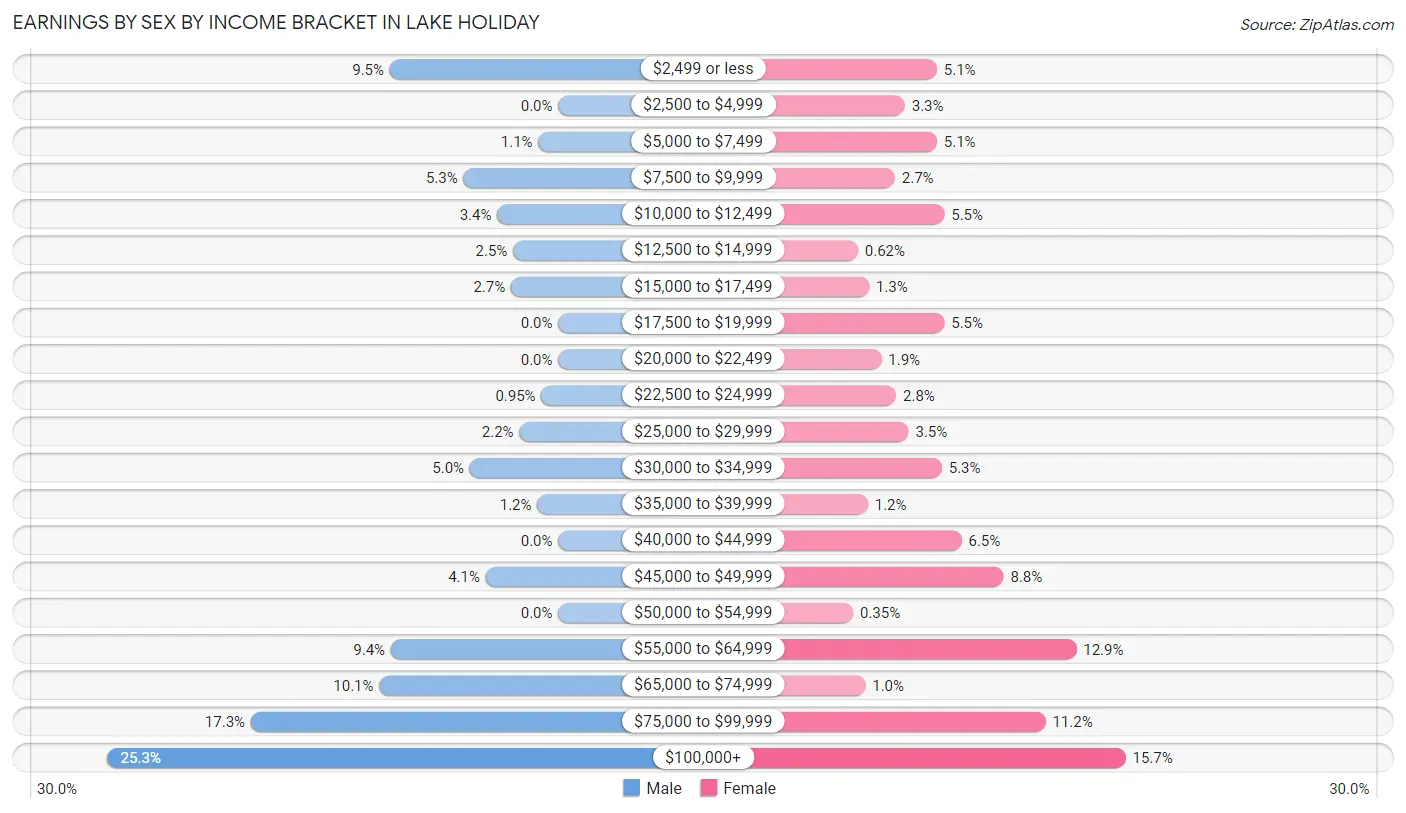
| Income | Male | Female |
| $2,499 or less | 160 (9.5%) | 73 (5.1%) |
| $2,500 to $4,999 | 0 (0.0%) | 47 (3.3%) |
| $5,000 to $7,499 | 19 (1.1%) | 73 (5.1%) |
| $7,500 to $9,999 | 90 (5.3%) | 39 (2.7%) |
| $10,000 to $12,499 | 58 (3.4%) | 79 (5.5%) |
| $12,500 to $14,999 | 43 (2.5%) | 9 (0.6%) |
| $15,000 to $17,499 | 45 (2.7%) | 18 (1.3%) |
| $17,500 to $19,999 | 0 (0.0%) | 79 (5.5%) |
| $20,000 to $22,499 | 0 (0.0%) | 28 (1.9%) |
| $22,500 to $24,999 | 16 (0.9%) | 40 (2.8%) |
| $25,000 to $29,999 | 37 (2.2%) | 50 (3.5%) |
| $30,000 to $34,999 | 84 (5.0%) | 77 (5.3%) |
| $35,000 to $39,999 | 20 (1.2%) | 17 (1.2%) |
| $40,000 to $44,999 | 0 (0.0%) | 93 (6.5%) |
| $45,000 to $49,999 | 69 (4.1%) | 127 (8.8%) |
| $50,000 to $54,999 | 0 (0.0%) | 5 (0.4%) |
| $55,000 to $64,999 | 159 (9.4%) | 186 (12.9%) |
| $65,000 to $74,999 | 170 (10.1%) | 15 (1.0%) |
| $75,000 to $99,999 | 292 (17.3%) | 161 (11.2%) |
| $100,000+ | 428 (25.3%) | 226 (15.7%) |
| Total | 1,690 (100.0%) | 1,442 (100.0%) |
Earnings by Sex by Educational Attainment in Lake Holiday
Average earnings in Lake Holiday are $76,780 for men and $46,740 for women, a difference of 39.1%. Men with an educational attainment of bachelor's degree enjoy the highest average annual earnings of $102,188, while those with graduate degree education earn the least with $71,823. Women with an educational attainment of high school diploma earn the most with the average annual earnings of $76,643, while those with college or associate's degree education have the smallest earnings of $45,506.
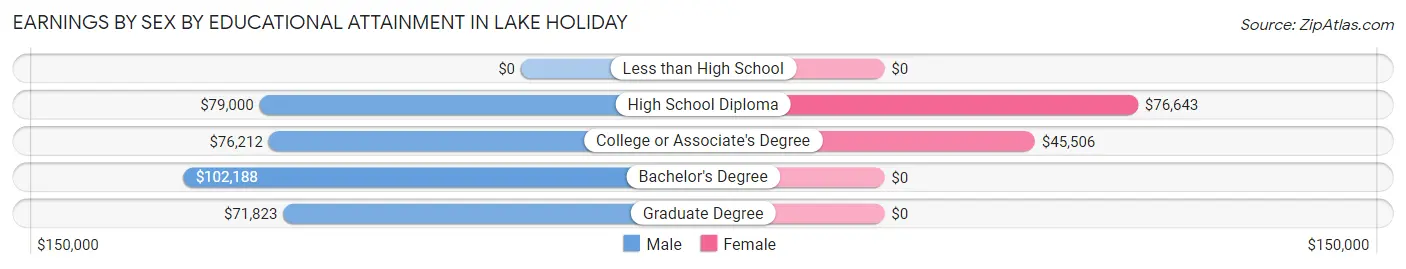
| Educational Attainment | Male Income | Female Income |
| Less than High School | - | - |
| High School Diploma | $79,000 | $76,643 |
| College or Associate's Degree | $76,212 | $45,506 |
| Bachelor's Degree | $102,188 | $0 |
| Graduate Degree | $71,823 | $0 |
| Total | $76,780 | $46,740 |
Family Income in Lake Holiday
Family Income Brackets in Lake Holiday
According to the Lake Holiday family income data, there are 484 families falling into the $100,000 to $149,999 income range, which is the most common income bracket and makes up 32.9% of all families.
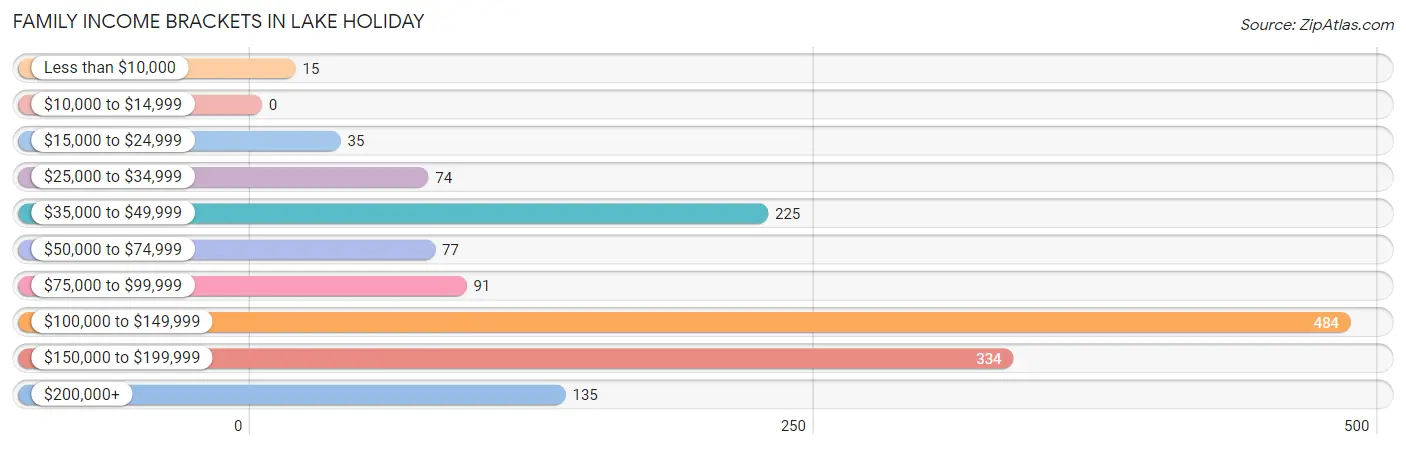
| Income Bracket | # Families | % Families |
| Less than $10,000 | 15 | 1.0% |
| $10,000 to $14,999 | 0 | 0.0% |
| $15,000 to $24,999 | 35 | 2.4% |
| $25,000 to $34,999 | 74 | 5.0% |
| $35,000 to $49,999 | 225 | 15.3% |
| $50,000 to $74,999 | 77 | 5.2% |
| $75,000 to $99,999 | 91 | 6.2% |
| $100,000 to $149,999 | 484 | 32.9% |
| $150,000 to $199,999 | 334 | 22.7% |
| $200,000+ | 135 | 9.2% |
Family Income by Famaliy Size in Lake Holiday
3-person families (351 | 23.8%) account for the highest median family income in Lake Holiday with $150,284 per family, while 2-person families (682 | 46.3%) have the highest median income of $53,296 per family member.
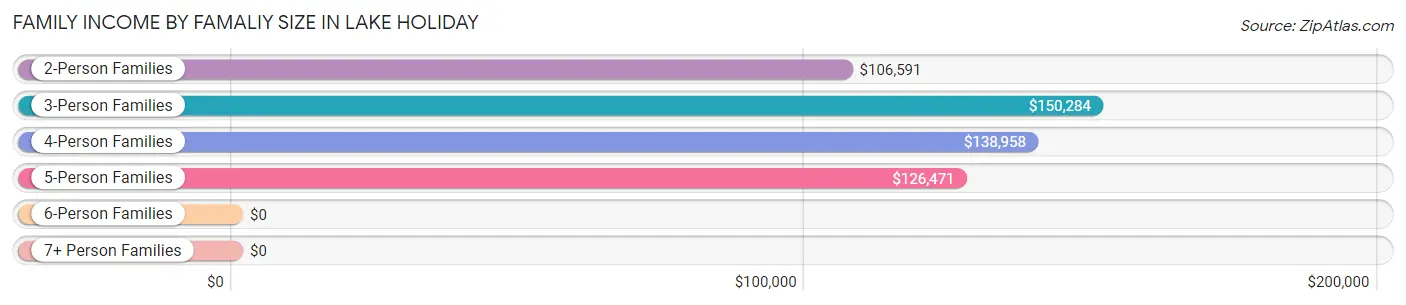
| Income Bracket | # Families | Median Income |
| 2-Person Families | 682 (46.3%) | $106,591 |
| 3-Person Families | 351 (23.8%) | $150,284 |
| 4-Person Families | 240 (16.3%) | $138,958 |
| 5-Person Families | 134 (9.1%) | $126,471 |
| 6-Person Families | 65 (4.4%) | $0 |
| 7+ Person Families | 0 (0.0%) | $0 |
| Total | 1,472 (100.0%) | $130,086 |
Family Income by Number of Earners in Lake Holiday
The median family income in Lake Holiday is $130,086, with families comprising 3+ earners (235) having the highest median family income of $155,871, while families with no earners (231) have the lowest median family income of $48,425, accounting for 16.0% and 15.7% of families, respectively.
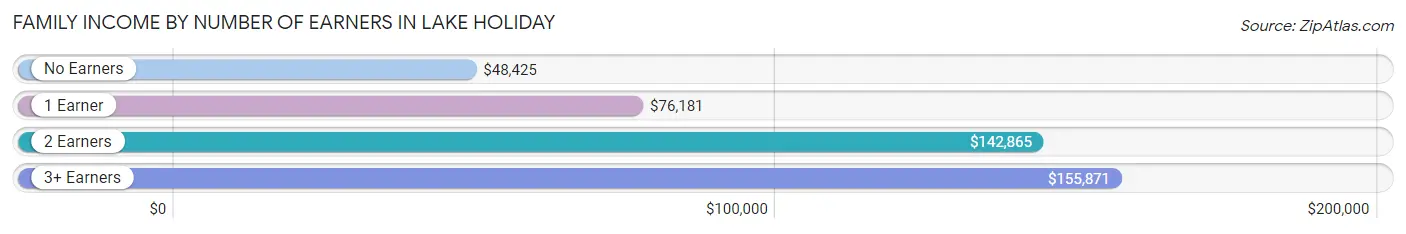
| Number of Earners | # Families | Median Income |
| No Earners | 231 (15.7%) | $48,425 |
| 1 Earner | 325 (22.1%) | $76,181 |
| 2 Earners | 681 (46.3%) | $142,865 |
| 3+ Earners | 235 (16.0%) | $155,871 |
| Total | 1,472 (100.0%) | $130,086 |
Household Income in Lake Holiday
Household Income Brackets in Lake Holiday
With 551 households falling in the category, the $100,000 to $149,999 income range is the most frequent in Lake Holiday, accounting for 26.4% of all households.
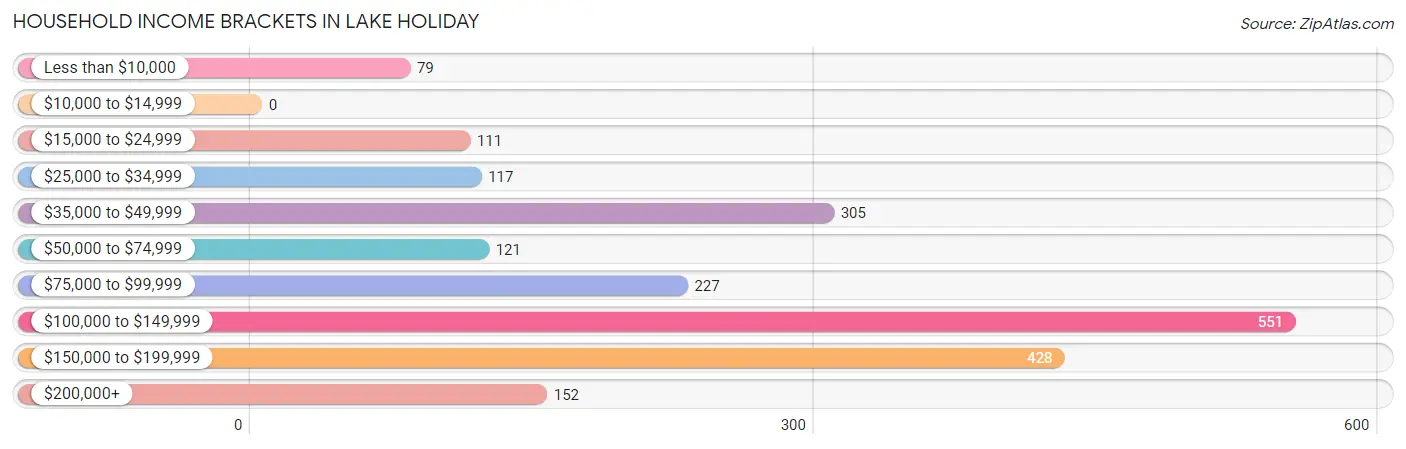
| Income Bracket | # Households | % Households |
| Less than $10,000 | 79 | 3.8% |
| $10,000 to $14,999 | 0 | 0.0% |
| $15,000 to $24,999 | 111 | 5.3% |
| $25,000 to $34,999 | 117 | 5.6% |
| $35,000 to $49,999 | 305 | 14.6% |
| $50,000 to $74,999 | 121 | 5.8% |
| $75,000 to $99,999 | 227 | 10.9% |
| $100,000 to $149,999 | 551 | 26.4% |
| $150,000 to $199,999 | 428 | 20.5% |
| $200,000+ | 152 | 7.3% |
Household Income by Householder Age in Lake Holiday
The median household income in Lake Holiday is $105,580, with the highest median household income of $143,016 found in the 45 to 64 years age bracket for the primary householder. A total of 815 households (39.1%) fall into this category. Meanwhile, the 15 to 24 years age bracket for the primary householder has the lowest median household income of $0, with 31 households (1.5%) in this group.
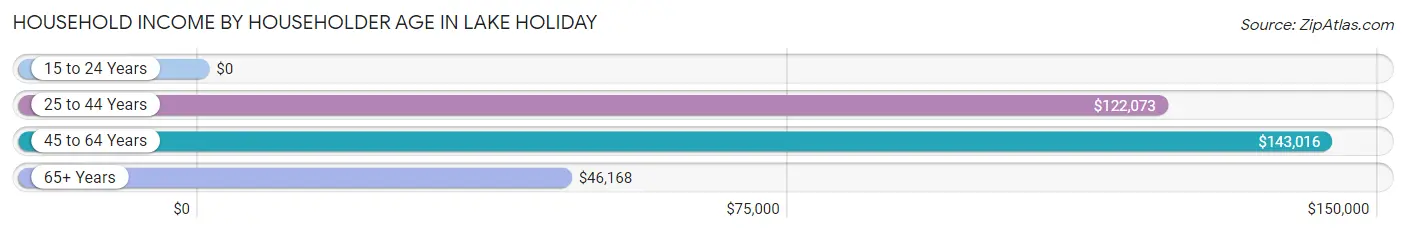
| Income Bracket | # Households | Median Income |
| 15 to 24 Years | 31 (1.5%) | $0 |
| 25 to 44 Years | 452 (21.7%) | $122,073 |
| 45 to 64 Years | 815 (39.1%) | $143,016 |
| 65+ Years | 789 (37.8%) | $46,168 |
| Total | 2,087 (100.0%) | $105,580 |
Poverty in Lake Holiday
Income Below Poverty by Sex and Age in Lake Holiday
With 13.9% poverty level for males and 6.4% for females among the residents of Lake Holiday, 16 and 17 year old males and 6 to 11 year old females are the most vulnerable to poverty, with 52 males (73.2%) and 84 females (49.7%) in their respective age groups living below the poverty level.
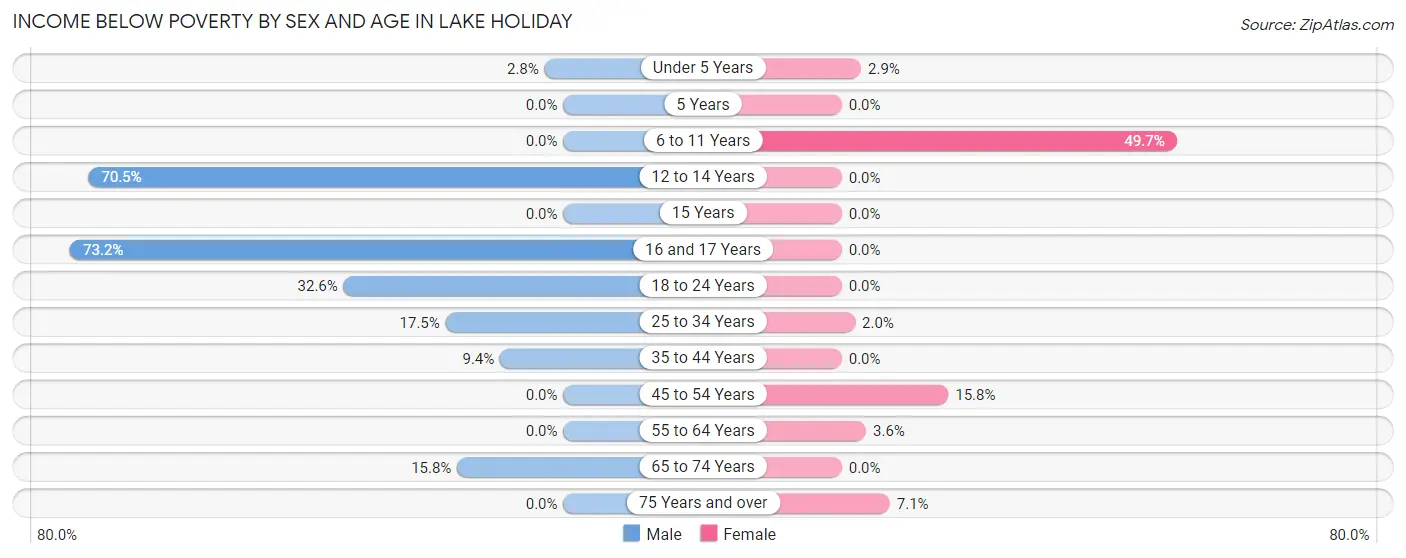
| Age Bracket | Male | Female |
| Under 5 Years | 3 (2.8%) | 6 (2.9%) |
| 5 Years | 0 (0.0%) | 0 (0.0%) |
| 6 to 11 Years | 0 (0.0%) | 84 (49.7%) |
| 12 to 14 Years | 67 (70.5%) | 0 (0.0%) |
| 15 Years | 0 (0.0%) | 0 (0.0%) |
| 16 and 17 Years | 52 (73.2%) | 0 (0.0%) |
| 18 to 24 Years | 123 (32.6%) | 0 (0.0%) |
| 25 to 34 Years | 36 (17.5%) | 4 (2.0%) |
| 35 to 44 Years | 34 (9.4%) | 0 (0.0%) |
| 45 to 54 Years | 0 (0.0%) | 47 (15.8%) |
| 55 to 64 Years | 0 (0.0%) | 19 (3.6%) |
| 65 to 74 Years | 64 (15.8%) | 0 (0.0%) |
| 75 Years and over | 0 (0.0%) | 15 (7.1%) |
| Total | 379 (13.9%) | 175 (6.4%) |
Income Above Poverty by Sex and Age in Lake Holiday
According to the poverty statistics in Lake Holiday, males aged 5 years and females aged 5 years are the age groups that are most secure financially, with 100.0% of males and 100.0% of females in these age groups living above the poverty line.
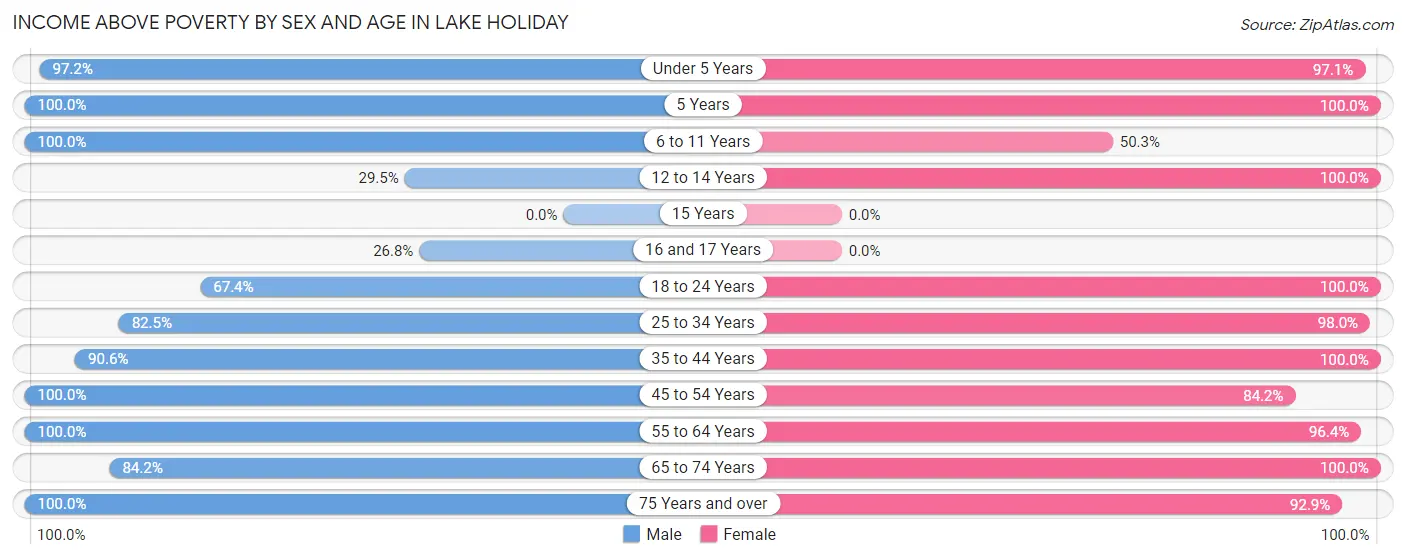
| Age Bracket | Male | Female |
| Under 5 Years | 105 (97.2%) | 203 (97.1%) |
| 5 Years | 96 (100.0%) | 19 (100.0%) |
| 6 to 11 Years | 170 (100.0%) | 85 (50.3%) |
| 12 to 14 Years | 28 (29.5%) | 67 (100.0%) |
| 15 Years | 0 (0.0%) | 0 (0.0%) |
| 16 and 17 Years | 19 (26.8%) | 0 (0.0%) |
| 18 to 24 Years | 254 (67.4%) | 290 (100.0%) |
| 25 to 34 Years | 170 (82.5%) | 198 (98.0%) |
| 35 to 44 Years | 328 (90.6%) | 345 (100.0%) |
| 45 to 54 Years | 434 (100.0%) | 250 (84.2%) |
| 55 to 64 Years | 304 (100.0%) | 508 (96.4%) |
| 65 to 74 Years | 342 (84.2%) | 393 (100.0%) |
| 75 Years and over | 105 (100.0%) | 195 (92.9%) |
| Total | 2,355 (86.1%) | 2,553 (93.6%) |
Income Below Poverty Among Married-Couple Families in Lake Holiday
The poverty statistics for married-couple families in Lake Holiday show that 0.3% or 4 of the total 1,216 families live below the poverty line. Families with 3 or 4 children have the highest poverty rate of 3.4%, comprising of 4 families. On the other hand, families with no children have the lowest poverty rate of 0.0%, which includes 0 families.
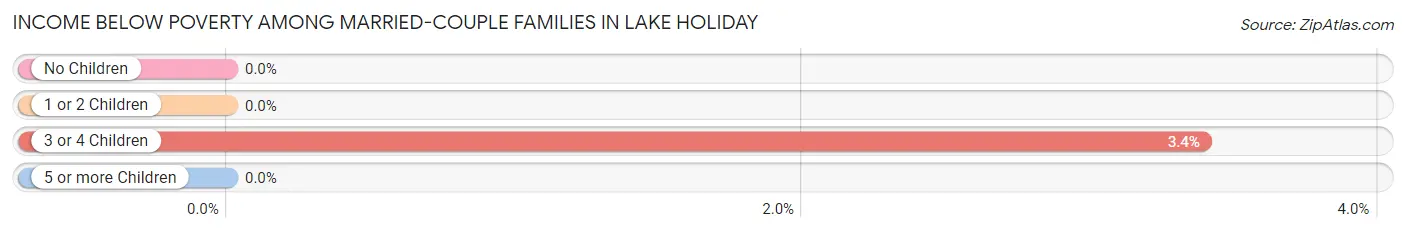
| Children | Above Poverty | Below Poverty |
| No Children | 855 (100.0%) | 0 (0.0%) |
| 1 or 2 Children | 243 (100.0%) | 0 (0.0%) |
| 3 or 4 Children | 114 (96.6%) | 4 (3.4%) |
| 5 or more Children | 0 (0.0%) | 0 (0.0%) |
| Total | 1,212 (99.7%) | 4 (0.3%) |
Income Below Poverty Among Single-Parent Households in Lake Holiday
According to the poverty data in Lake Holiday, 21.6% or 16 single-father households and 34.1% or 62 single-mother households are living below the poverty line. Among single-father households, those with 3 or 4 children have the highest poverty rate, with 16 households (100.0%) experiencing poverty. Likewise, among single-mother households, those with 3 or 4 children have the highest poverty rate, with 47 households (72.3%) falling below the poverty line.
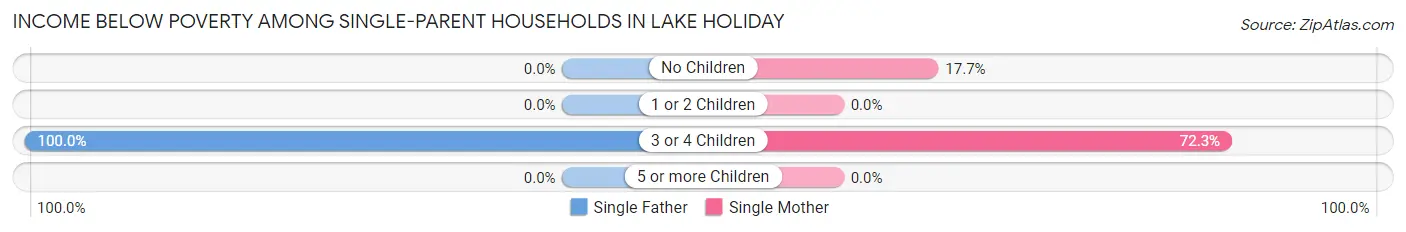
| Children | Single Father | Single Mother |
| No Children | 0 (0.0%) | 15 (17.6%) |
| 1 or 2 Children | 0 (0.0%) | 0 (0.0%) |
| 3 or 4 Children | 16 (100.0%) | 47 (72.3%) |
| 5 or more Children | 0 (0.0%) | 0 (0.0%) |
| Total | 16 (21.6%) | 62 (34.1%) |
Income Below Poverty Among Married-Couple vs Single-Parent Households in Lake Holiday
The poverty data for Lake Holiday shows that 4 of the married-couple family households (0.3%) and 78 of the single-parent households (30.5%) are living below the poverty level. Within the married-couple family households, those with 3 or 4 children have the highest poverty rate, with 4 households (3.4%) falling below the poverty line. Among the single-parent households, those with 3 or 4 children have the highest poverty rate, with 63 household (77.8%) living below poverty.
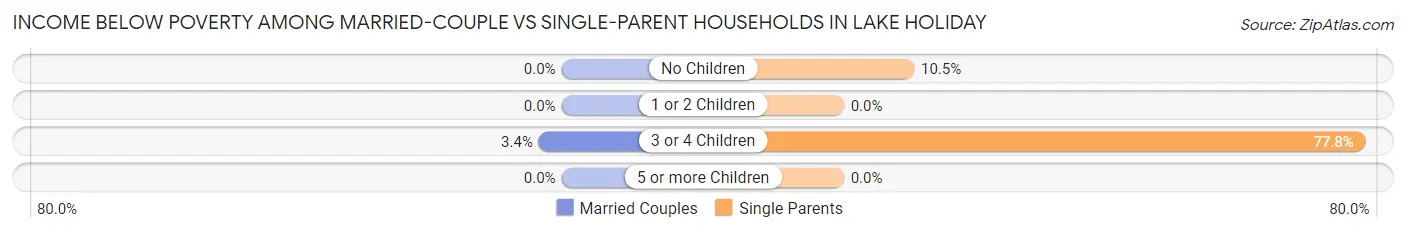
| Children | Married-Couple Families | Single-Parent Households |
| No Children | 0 (0.0%) | 15 (10.5%) |
| 1 or 2 Children | 0 (0.0%) | 0 (0.0%) |
| 3 or 4 Children | 4 (3.4%) | 63 (77.8%) |
| 5 or more Children | 0 (0.0%) | 0 (0.0%) |
| Total | 4 (0.3%) | 78 (30.5%) |
Race in Lake Holiday
The most populous races in Lake Holiday are White / Caucasian (5,217 | 95.1%), Black / African American (102 | 1.9%), and Two or more Races (97 | 1.8%).
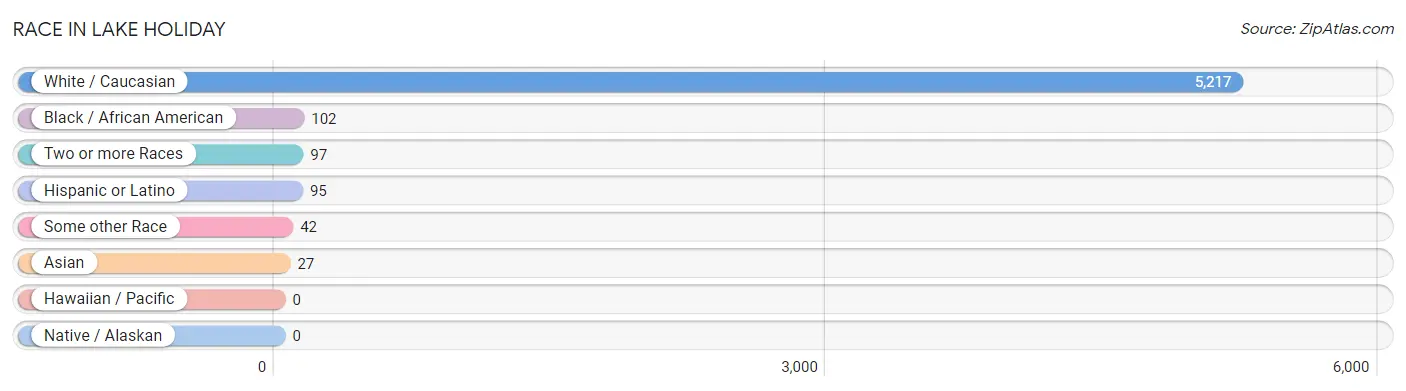
| Race | # Population | % Population |
| Asian | 27 | 0.5% |
| Black / African American | 102 | 1.9% |
| Hawaiian / Pacific | 0 | 0.0% |
| Hispanic or Latino | 95 | 1.7% |
| Native / Alaskan | 0 | 0.0% |
| White / Caucasian | 5,217 | 95.1% |
| Two or more Races | 97 | 1.8% |
| Some other Race | 42 | 0.8% |
| Total | 5,485 | 100.0% |
Ancestry in Lake Holiday
The most populous ancestries reported in Lake Holiday are German (1,459 | 26.6%), Irish (1,170 | 21.3%), Italian (694 | 12.7%), Polish (557 | 10.2%), and English (533 | 9.7%), together accounting for 80.4% of all Lake Holiday residents.
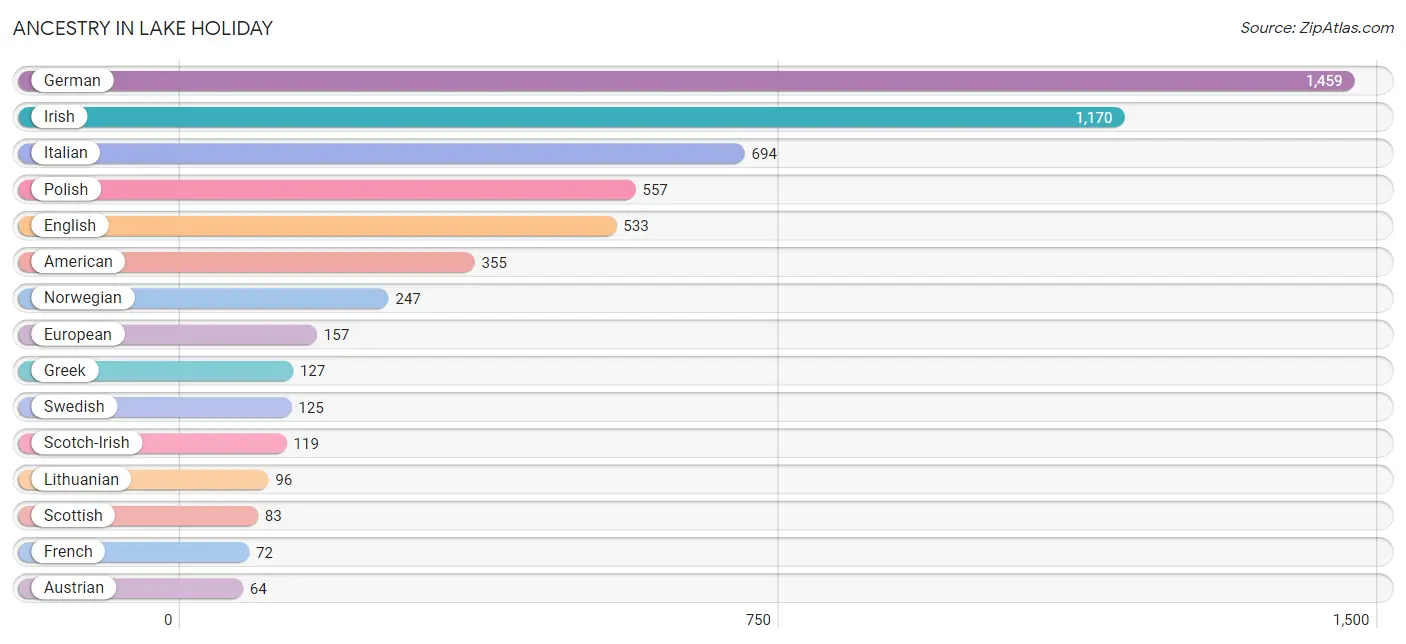
| Ancestry | # Population | % Population |
| Aleut | 9 | 0.2% |
| American | 355 | 6.5% |
| Austrian | 64 | 1.2% |
| British | 24 | 0.4% |
| Canadian | 22 | 0.4% |
| Croatian | 19 | 0.4% |
| Czech | 26 | 0.5% |
| Danish | 25 | 0.5% |
| Dutch | 14 | 0.3% |
| English | 533 | 9.7% |
| European | 157 | 2.9% |
| Finnish | 14 | 0.3% |
| French | 72 | 1.3% |
| German | 1,459 | 26.6% |
| Ghanaian | 44 | 0.8% |
| Greek | 127 | 2.3% |
| Hungarian | 21 | 0.4% |
| Irish | 1,170 | 21.3% |
| Iroquois | 12 | 0.2% |
| Italian | 694 | 12.7% |
| Jamaican | 13 | 0.2% |
| Korean | 27 | 0.5% |
| Latvian | 20 | 0.4% |
| Lithuanian | 96 | 1.8% |
| Luxembourger | 56 | 1.0% |
| Mexican | 56 | 1.0% |
| Norwegian | 247 | 4.5% |
| Polish | 557 | 10.2% |
| Puerto Rican | 39 | 0.7% |
| Romanian | 15 | 0.3% |
| Russian | 16 | 0.3% |
| Scandinavian | 40 | 0.7% |
| Scotch-Irish | 119 | 2.2% |
| Scottish | 83 | 1.5% |
| Subsaharan African | 44 | 0.8% |
| Swedish | 125 | 2.3% |
| Ukrainian | 12 | 0.2% | View All 37 Rows |
Immigrants in Lake Holiday
The most numerous immigrant groups reported in Lake Holiday came from Africa (44 | 0.8%), Ghana (44 | 0.8%), Western Africa (44 | 0.8%), Asia (27 | 0.5%), and Philippines (27 | 0.5%), together accounting for 3.4% of all Lake Holiday residents.
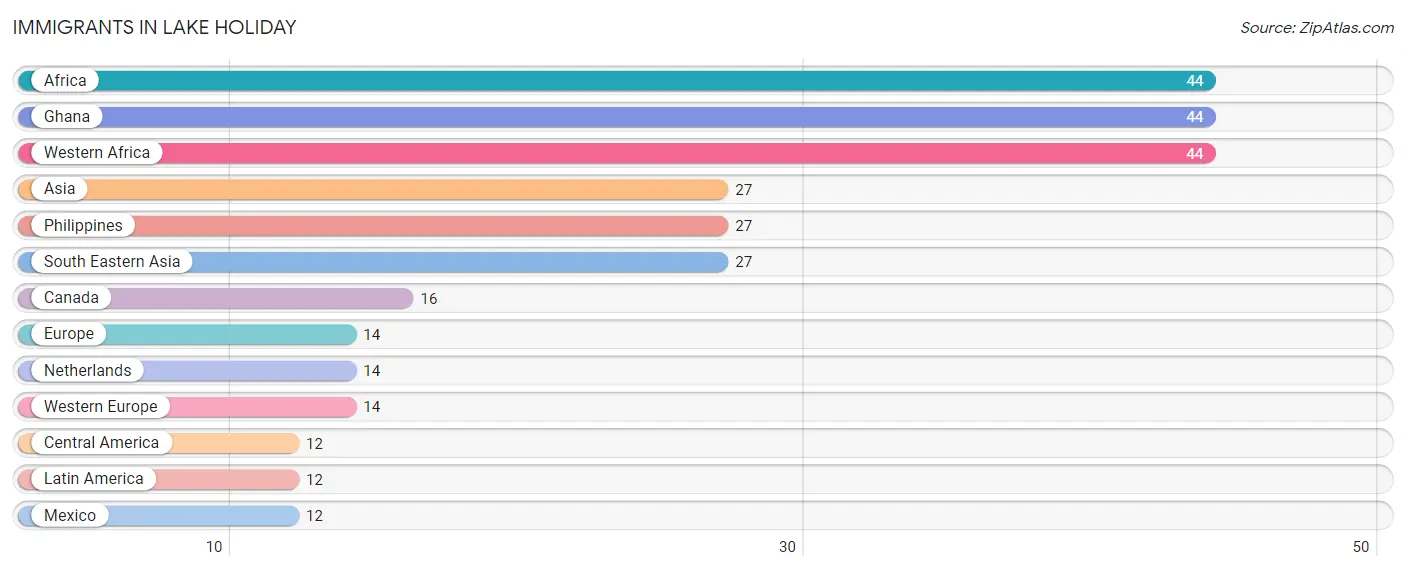
| Immigration Origin | # Population | % Population |
| Africa | 44 | 0.8% |
| Asia | 27 | 0.5% |
| Canada | 16 | 0.3% |
| Central America | 12 | 0.2% |
| Europe | 14 | 0.3% |
| Ghana | 44 | 0.8% |
| Latin America | 12 | 0.2% |
| Mexico | 12 | 0.2% |
| Netherlands | 14 | 0.3% |
| Philippines | 27 | 0.5% |
| South Eastern Asia | 27 | 0.5% |
| Western Africa | 44 | 0.8% |
| Western Europe | 14 | 0.3% | View All 13 Rows |
Sex and Age in Lake Holiday
Sex and Age in Lake Holiday
The most populous age groups in Lake Holiday are 20 to 24 Years (274 | 9.9%) for men and 55 to 59 Years (344 | 12.6%) for women.
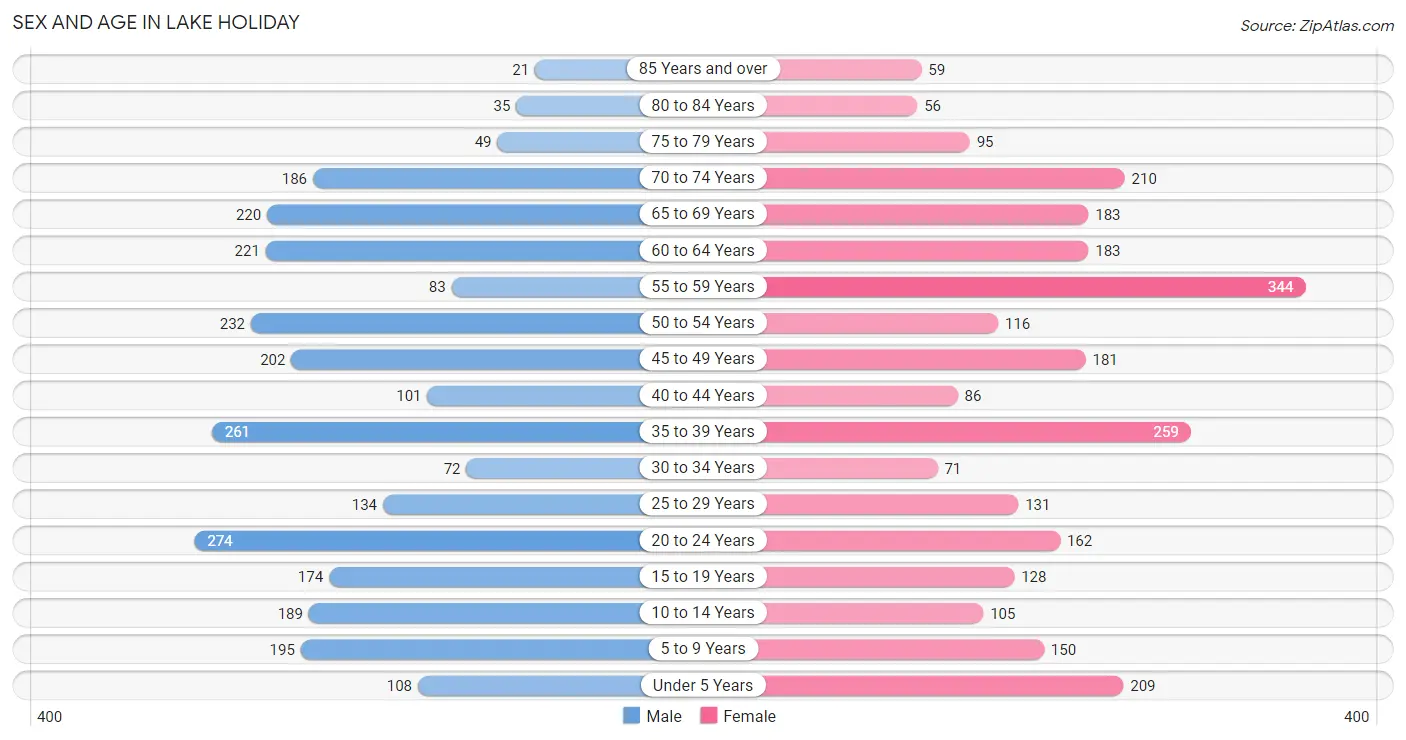
| Age Bracket | Male | Female |
| Under 5 Years | 108 (3.9%) | 209 (7.7%) |
| 5 to 9 Years | 195 (7.1%) | 150 (5.5%) |
| 10 to 14 Years | 189 (6.9%) | 105 (3.8%) |
| 15 to 19 Years | 174 (6.3%) | 128 (4.7%) |
| 20 to 24 Years | 274 (9.9%) | 162 (5.9%) |
| 25 to 29 Years | 134 (4.9%) | 131 (4.8%) |
| 30 to 34 Years | 72 (2.6%) | 71 (2.6%) |
| 35 to 39 Years | 261 (9.5%) | 259 (9.5%) |
| 40 to 44 Years | 101 (3.7%) | 86 (3.2%) |
| 45 to 49 Years | 202 (7.3%) | 181 (6.6%) |
| 50 to 54 Years | 232 (8.4%) | 116 (4.3%) |
| 55 to 59 Years | 83 (3.0%) | 344 (12.6%) |
| 60 to 64 Years | 221 (8.0%) | 183 (6.7%) |
| 65 to 69 Years | 220 (8.0%) | 183 (6.7%) |
| 70 to 74 Years | 186 (6.8%) | 210 (7.7%) |
| 75 to 79 Years | 49 (1.8%) | 95 (3.5%) |
| 80 to 84 Years | 35 (1.3%) | 56 (2.1%) |
| 85 Years and over | 21 (0.8%) | 59 (2.2%) |
| Total | 2,757 (100.0%) | 2,728 (100.0%) |
Families and Households in Lake Holiday
Median Family Size in Lake Holiday
The median family size in Lake Holiday is 3.11 persons per family, with single female/mother families (182 | 12.4%) accounting for the largest median family size of 3.91 persons per family. On the other hand, single male/father families (74 | 5.0%) represent the smallest median family size with 2.68 persons per family.
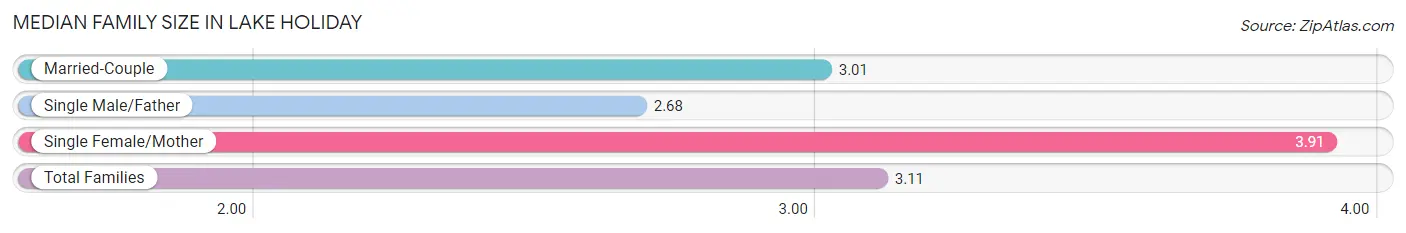
| Family Type | # Families | Family Size |
| Married-Couple | 1,216 (82.6%) | 3.01 |
| Single Male/Father | 74 (5.0%) | 2.68 |
| Single Female/Mother | 182 (12.4%) | 3.91 |
| Total Families | 1,472 (100.0%) | 3.11 |
Median Household Size in Lake Holiday
The median household size in Lake Holiday is 2.63 persons per household, with single female/mother households (182 | 8.7%) accounting for the largest median household size of 4.41 persons per household. non-family households (615 | 29.5%) represent the smallest median household size with 1.31 persons per household.
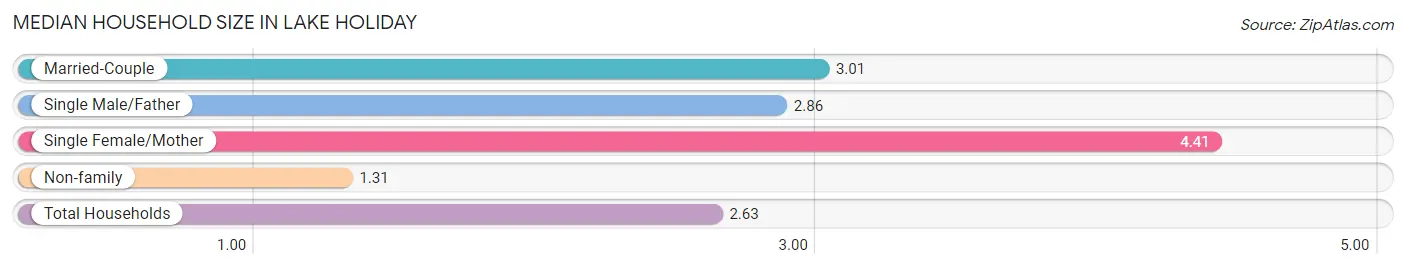
| Household Type | # Households | Household Size |
| Married-Couple | 1,216 (58.3%) | 3.01 |
| Single Male/Father | 74 (3.5%) | 2.86 |
| Single Female/Mother | 182 (8.7%) | 4.41 |
| Non-family | 615 (29.5%) | 1.31 |
| Total Households | 2,087 (100.0%) | 2.63 |
Household Size by Marriage Status in Lake Holiday
Out of a total of 2,087 households in Lake Holiday, 1,472 (70.5%) are family households, while 615 (29.5%) are nonfamily households. The most numerous type of family households are 2-person households, comprising 666, and the most common type of nonfamily households are 1-person households, comprising 464.
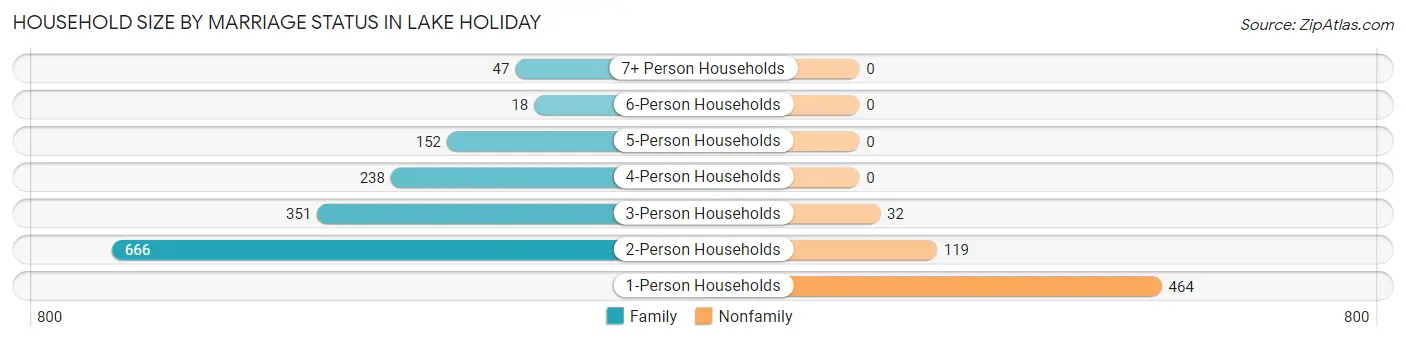
| Household Size | Family Households | Nonfamily Households |
| 1-Person Households | - | 464 (22.2%) |
| 2-Person Households | 666 (31.9%) | 119 (5.7%) |
| 3-Person Households | 351 (16.8%) | 32 (1.5%) |
| 4-Person Households | 238 (11.4%) | 0 (0.0%) |
| 5-Person Households | 152 (7.3%) | 0 (0.0%) |
| 6-Person Households | 18 (0.9%) | 0 (0.0%) |
| 7+ Person Households | 47 (2.2%) | 0 (0.0%) |
| Total | 1,472 (70.5%) | 615 (29.5%) |
Female Fertility in Lake Holiday
Fertility by Age in Lake Holiday
Average fertility rate in Lake Holiday is 114.0 births per 1,000 women. Women in the age bracket of 35 to 50 years have the highest fertility rate with 169.0 births per 1,000 women. Women in the age bracket of 35 to 50 years acount for 76.7% of all women with births.
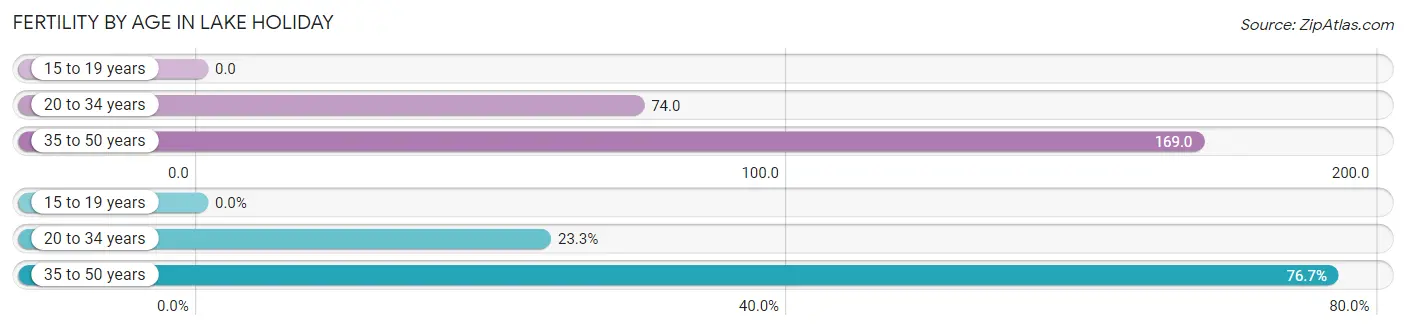
| Age Bracket | Women with Births | Births / 1,000 Women |
| 15 to 19 years | 0 (0.0%) | 0.0 |
| 20 to 34 years | 27 (23.3%) | 74.0 |
| 35 to 50 years | 89 (76.7%) | 169.0 |
| Total | 116 (100.0%) | 114.0 |
Fertility by Age by Marriage Status in Lake Holiday
84.5% of women with births (116) in Lake Holiday are married. The highest percentage of unmarried women with births falls into 35 to 50 years age bracket with 20.2% of them unmarried at the time of birth, while the lowest percentage of unmarried women with births belong to 20 to 34 years age bracket with 0.0% of them unmarried.
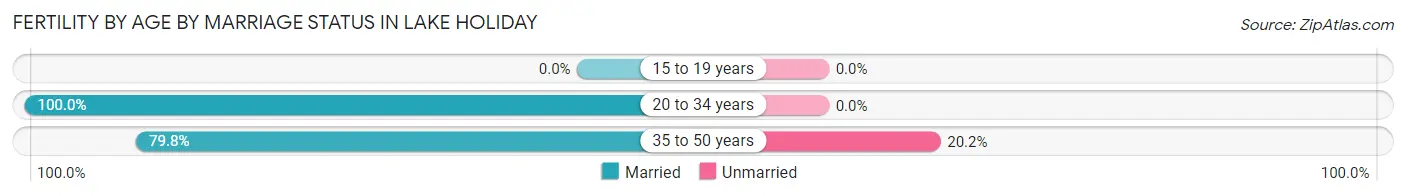
| Age Bracket | Married | Unmarried |
| 15 to 19 years | 0 (0.0%) | 0 (0.0%) |
| 20 to 34 years | 27 (100.0%) | 0 (0.0%) |
| 35 to 50 years | 71 (79.8%) | 18 (20.2%) |
| Total | 98 (84.5%) | 18 (15.5%) |
Fertility by Education in Lake Holiday
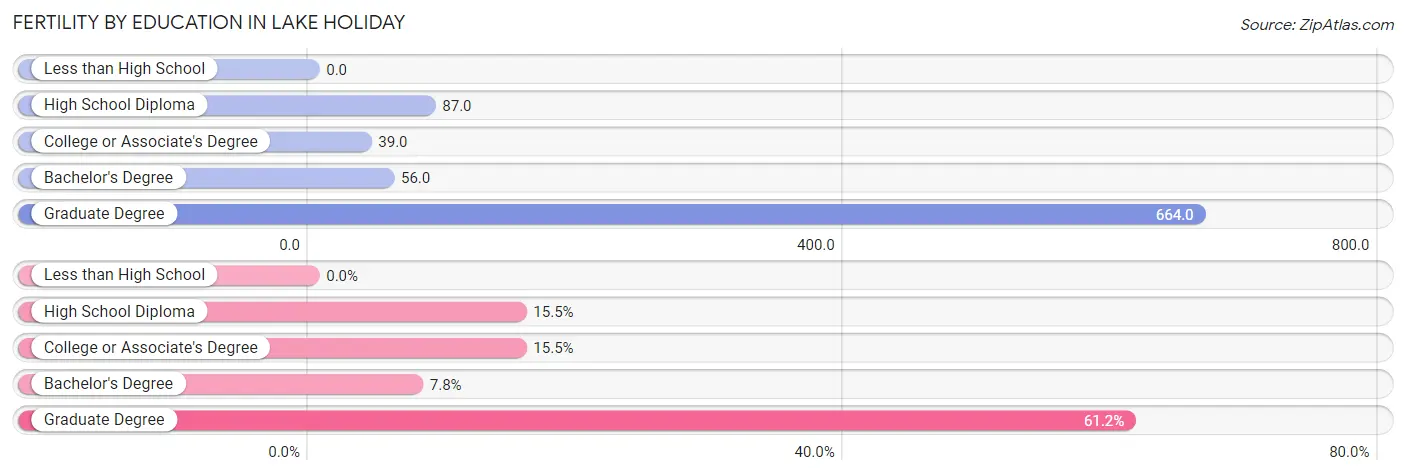
| Educational Attainment | Women with Births | Births / 1,000 Women |
| Less than High School | 0 (0.0%) | 0.0 |
| High School Diploma | 18 (15.5%) | 87.0 |
| College or Associate's Degree | 18 (15.5%) | 39.0 |
| Bachelor's Degree | 9 (7.8%) | 56.0 |
| Graduate Degree | 71 (61.2%) | 664.0 |
| Total | 116 (100.0%) | 114.0 |
Fertility by Education by Marriage Status in Lake Holiday
15.5% of women with births in Lake Holiday are unmarried. Women with the educational attainment of college or associate's degree are most likely to be married with 100.0% of them married at childbirth, while women with the educational attainment of high school diploma are least likely to be married with 100.0% of them unmarried at childbirth.
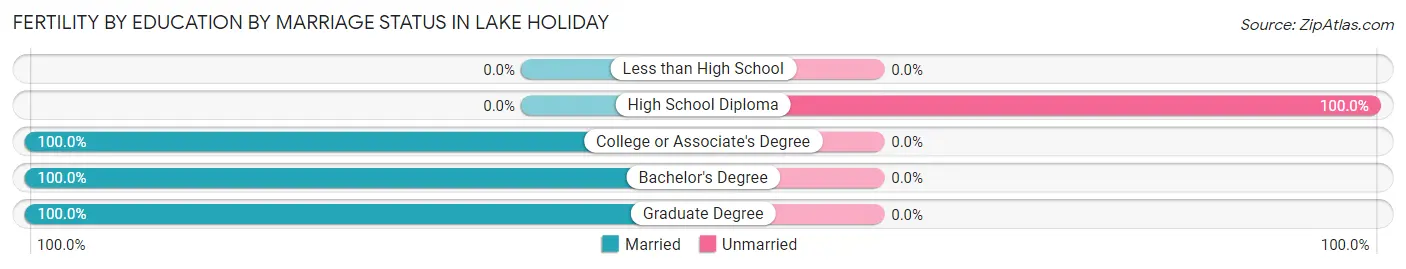
| Educational Attainment | Married | Unmarried |
| Less than High School | 0 (0.0%) | 0 (0.0%) |
| High School Diploma | 0 (0.0%) | 18 (100.0%) |
| College or Associate's Degree | 18 (100.0%) | 0 (0.0%) |
| Bachelor's Degree | 9 (100.0%) | 0 (0.0%) |
| Graduate Degree | 71 (100.0%) | 0 (0.0%) |
| Total | 98 (84.5%) | 18 (15.5%) |
Employment Characteristics in Lake Holiday
Employment by Class of Employer in Lake Holiday
Among the 2,773 employed individuals in Lake Holiday, private company employees (1,989 | 71.7%), not-for-profit organizations (279 | 10.1%), and self-employed (not incorporated) (169 | 6.1%) make up the most common classes of employment.
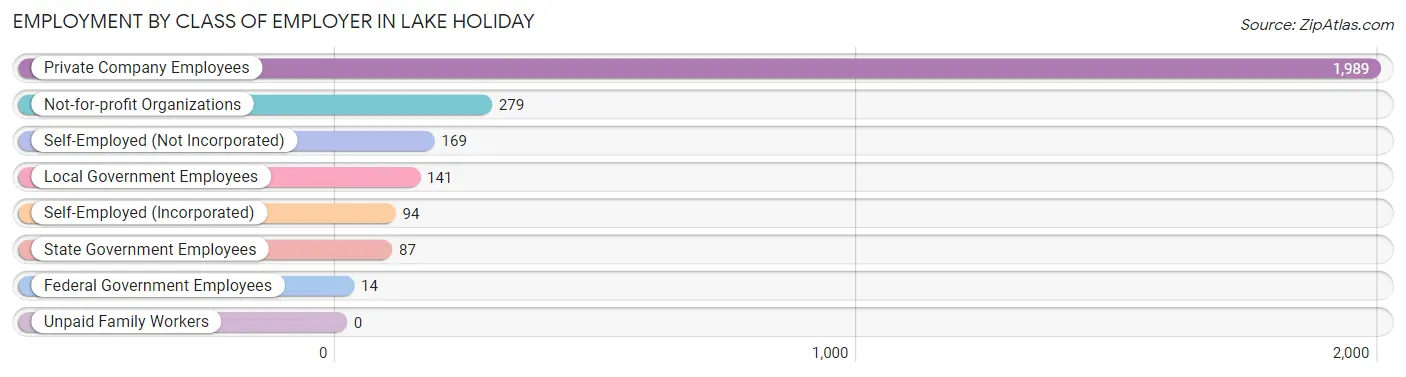
| Employer Class | # Employees | % Employees |
| Private Company Employees | 1,989 | 71.7% |
| Self-Employed (Incorporated) | 94 | 3.4% |
| Self-Employed (Not Incorporated) | 169 | 6.1% |
| Not-for-profit Organizations | 279 | 10.1% |
| Local Government Employees | 141 | 5.1% |
| State Government Employees | 87 | 3.1% |
| Federal Government Employees | 14 | 0.5% |
| Unpaid Family Workers | 0 | 0.0% |
| Total | 2,773 | 100.0% |
Employment Status by Age in Lake Holiday
According to the labor force statistics for Lake Holiday, out of the total population over 16 years of age (4,529), 66.7% or 3,021 individuals are in the labor force, with 7.1% or 214 of them unemployed. The age group with the highest labor force participation rate is 16 to 19 years, with 90.4% or 273 individuals in the labor force. Within the labor force, the 16 to 19 years age range has the highest percentage of unemployed individuals, with 32.6% or 89 of them being unemployed.
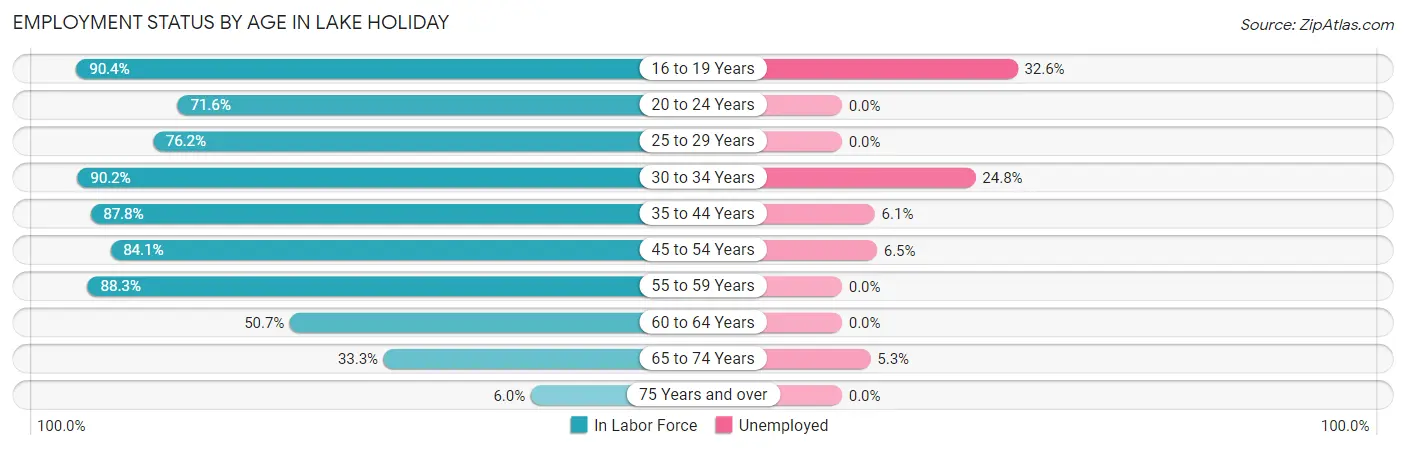
| Age Bracket | In Labor Force | Unemployed |
| 16 to 19 Years | 273 (90.4%) | 89 (32.6%) |
| 20 to 24 Years | 312 (71.6%) | 0 (0.0%) |
| 25 to 29 Years | 202 (76.2%) | 0 (0.0%) |
| 30 to 34 Years | 129 (90.2%) | 32 (24.8%) |
| 35 to 44 Years | 621 (87.8%) | 38 (6.1%) |
| 45 to 54 Years | 615 (84.1%) | 40 (6.5%) |
| 55 to 59 Years | 377 (88.3%) | 0 (0.0%) |
| 60 to 64 Years | 205 (50.7%) | 0 (0.0%) |
| 65 to 74 Years | 266 (33.3%) | 14 (5.3%) |
| 75 Years and over | 19 (6.0%) | 0 (0.0%) |
| Total | 3,021 (66.7%) | 214 (7.1%) |
Employment Status by Educational Attainment in Lake Holiday
According to labor force statistics for Lake Holiday, 80.3% of individuals (2,150) out of the total population between 25 and 64 years of age (2,677) are in the labor force, with 5.1% or 110 of them being unemployed. The group with the highest labor force participation rate are those with the educational attainment of less than high school, with 100.0% or 38 individuals in the labor force. Within the labor force, individuals with high school diploma education have the highest percentage of unemployment, with 8.5% or 38 of them being unemployed.
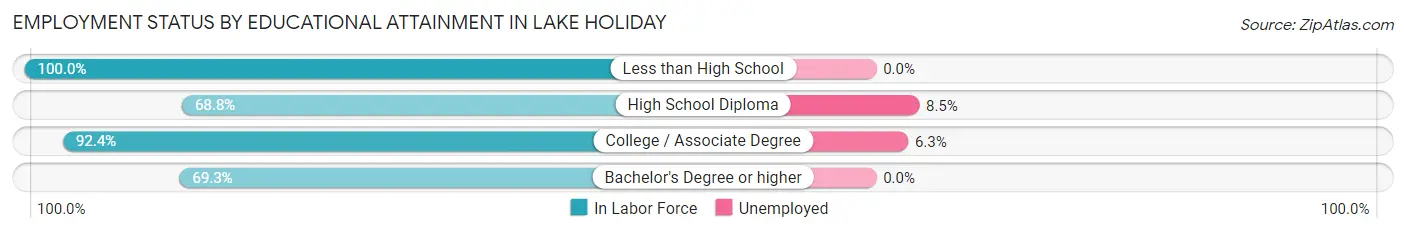
| Educational Attainment | In Labor Force | Unemployed |
| Less than High School | 38 (100.0%) | 0 (0.0%) |
| High School Diploma | 447 (68.8%) | 55 (8.5%) |
| College / Associate Degree | 1,142 (92.4%) | 78 (6.3%) |
| Bachelor's Degree or higher | 522 (69.3%) | 0 (0.0%) |
| Total | 2,150 (80.3%) | 137 (5.1%) |
Employment Occupations by Sex in Lake Holiday
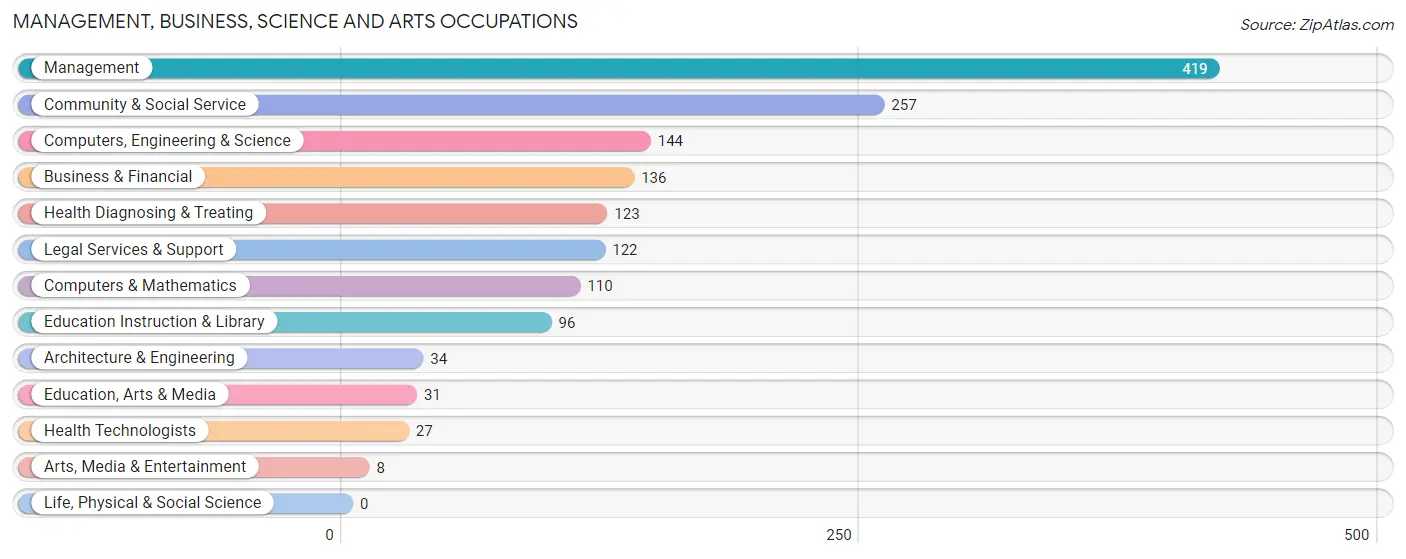
Management, Business, Science and Arts Occupations
The most common Management, Business, Science and Arts occupations in Lake Holiday are Management (419 | 14.9%), Community & Social Service (257 | 9.2%), Computers, Engineering & Science (144 | 5.1%), Business & Financial (136 | 4.9%), and Health Diagnosing & Treating (123 | 4.4%).
Management, Business, Science and Arts Occupations by Sex
Within the Management, Business, Science and Arts occupations in Lake Holiday, the most male-oriented occupations are Computers, Engineering & Science (100.0%), Computers & Mathematics (100.0%), and Architecture & Engineering (100.0%), while the most female-oriented occupations are Health Technologists (100.0%), Health Diagnosing & Treating (77.2%), and Education Instruction & Library (75.0%).
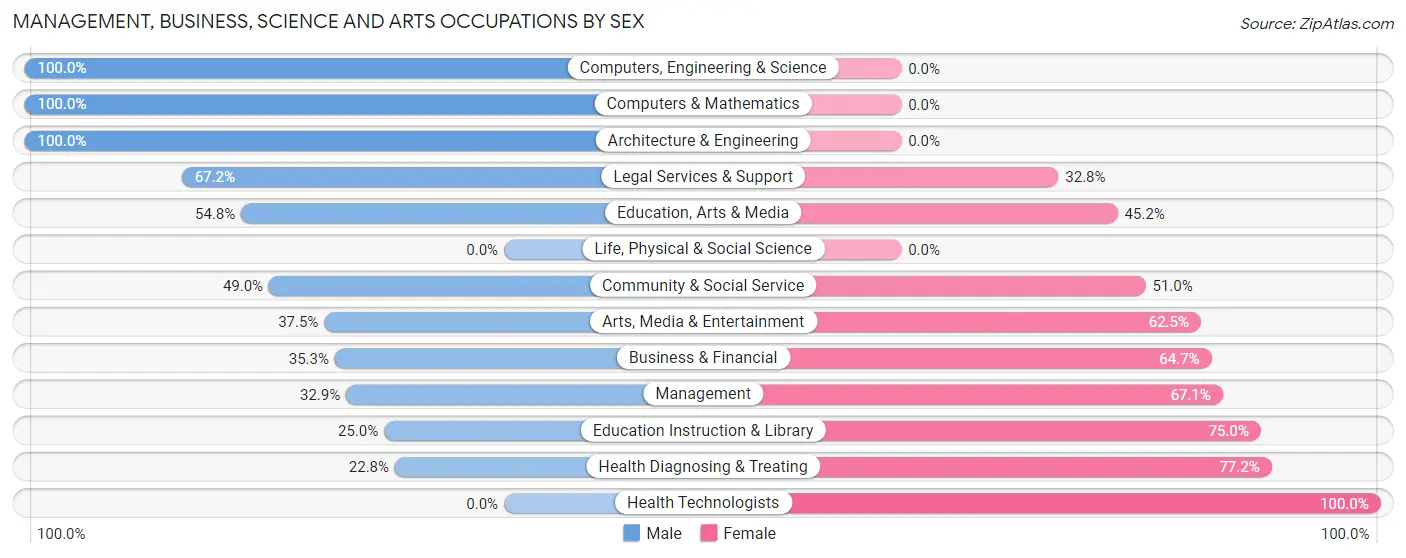
| Occupation | Male | Female |
| Management | 138 (32.9%) | 281 (67.1%) |
| Business & Financial | 48 (35.3%) | 88 (64.7%) |
| Computers, Engineering & Science | 144 (100.0%) | 0 (0.0%) |
| Computers & Mathematics | 110 (100.0%) | 0 (0.0%) |
| Architecture & Engineering | 34 (100.0%) | 0 (0.0%) |
| Life, Physical & Social Science | 0 (0.0%) | 0 (0.0%) |
| Community & Social Service | 126 (49.0%) | 131 (51.0%) |
| Education, Arts & Media | 17 (54.8%) | 14 (45.2%) |
| Legal Services & Support | 82 (67.2%) | 40 (32.8%) |
| Education Instruction & Library | 24 (25.0%) | 72 (75.0%) |
| Arts, Media & Entertainment | 3 (37.5%) | 5 (62.5%) |
| Health Diagnosing & Treating | 28 (22.8%) | 95 (77.2%) |
| Health Technologists | 0 (0.0%) | 27 (100.0%) |
| Total (Category) | 484 (44.9%) | 595 (55.1%) |
| Total (Overall) | 1,565 (55.8%) | 1,241 (44.2%) |
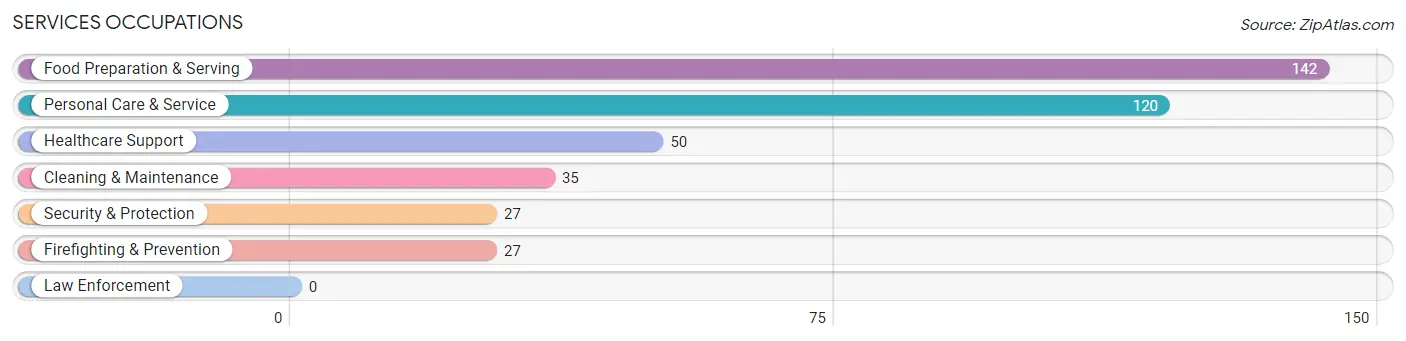
Services Occupations
The most common Services occupations in Lake Holiday are Food Preparation & Serving (142 | 5.1%), Personal Care & Service (120 | 4.3%), Healthcare Support (50 | 1.8%), Cleaning & Maintenance (35 | 1.3%), and Security & Protection (27 | 1.0%).
Services Occupations by Sex
Within the Services occupations in Lake Holiday, the most male-oriented occupations are Security & Protection (100.0%), Firefighting & Prevention (100.0%), and Cleaning & Maintenance (100.0%), while the most female-oriented occupations are Healthcare Support (100.0%), Food Preparation & Serving (57.0%), and Personal Care & Service (46.7%).
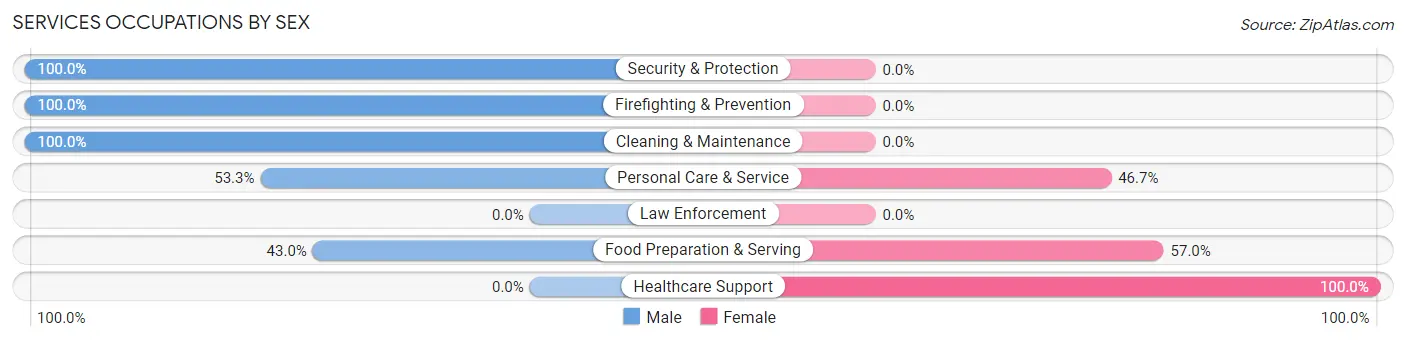
| Occupation | Male | Female |
| Healthcare Support | 0 (0.0%) | 50 (100.0%) |
| Security & Protection | 27 (100.0%) | 0 (0.0%) |
| Firefighting & Prevention | 27 (100.0%) | 0 (0.0%) |
| Law Enforcement | 0 (0.0%) | 0 (0.0%) |
| Food Preparation & Serving | 61 (43.0%) | 81 (57.0%) |
| Cleaning & Maintenance | 35 (100.0%) | 0 (0.0%) |
| Personal Care & Service | 64 (53.3%) | 56 (46.7%) |
| Total (Category) | 187 (50.0%) | 187 (50.0%) |
| Total (Overall) | 1,565 (55.8%) | 1,241 (44.2%) |
Sales and Office Occupations
The most common Sales and Office occupations in Lake Holiday are Office & Administration (315 | 11.2%), and Sales & Related (193 | 6.9%).
Sales and Office Occupations by Sex
| Occupation | Male | Female |
| Sales & Related | 38 (19.7%) | 155 (80.3%) |
| Office & Administration | 112 (35.6%) | 203 (64.4%) |
| Total (Category) | 150 (29.5%) | 358 (70.5%) |
| Total (Overall) | 1,565 (55.8%) | 1,241 (44.2%) |
Natural Resources, Construction and Maintenance Occupations
The most common Natural Resources, Construction and Maintenance occupations in Lake Holiday are Construction & Extraction (322 | 11.5%), and Installation, Maintenance & Repair (138 | 4.9%).
Natural Resources, Construction and Maintenance Occupations by Sex
| Occupation | Male | Female |
| Farming, Fishing & Forestry | 0 (0.0%) | 0 (0.0%) |
| Construction & Extraction | 322 (100.0%) | 0 (0.0%) |
| Installation, Maintenance & Repair | 120 (87.0%) | 18 (13.0%) |
| Total (Category) | 442 (96.1%) | 18 (3.9%) |
| Total (Overall) | 1,565 (55.8%) | 1,241 (44.2%) |
Production, Transportation and Moving Occupations
The most common Production, Transportation and Moving occupations in Lake Holiday are Material Moving (212 | 7.6%), Transportation (138 | 4.9%), and Production (35 | 1.3%).
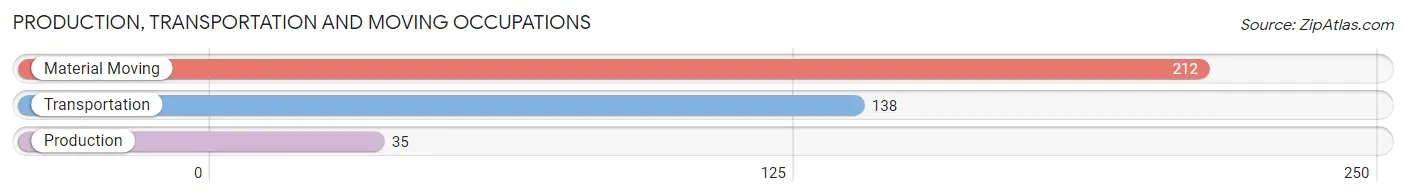
Production, Transportation and Moving Occupations by Sex
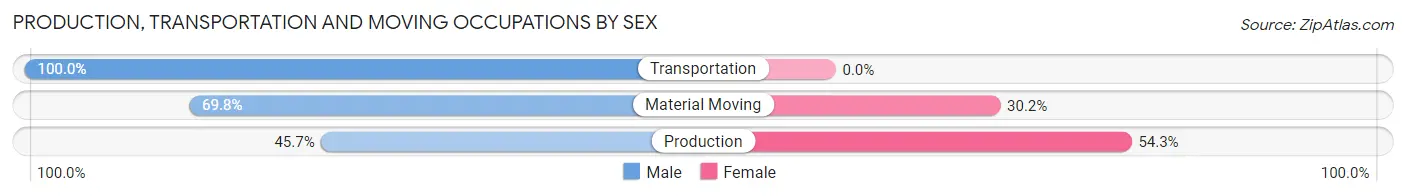
| Occupation | Male | Female |
| Production | 16 (45.7%) | 19 (54.3%) |
| Transportation | 138 (100.0%) | 0 (0.0%) |
| Material Moving | 148 (69.8%) | 64 (30.2%) |
| Total (Category) | 302 (78.4%) | 83 (21.6%) |
| Total (Overall) | 1,565 (55.8%) | 1,241 (44.2%) |
Employment Industries by Sex in Lake Holiday
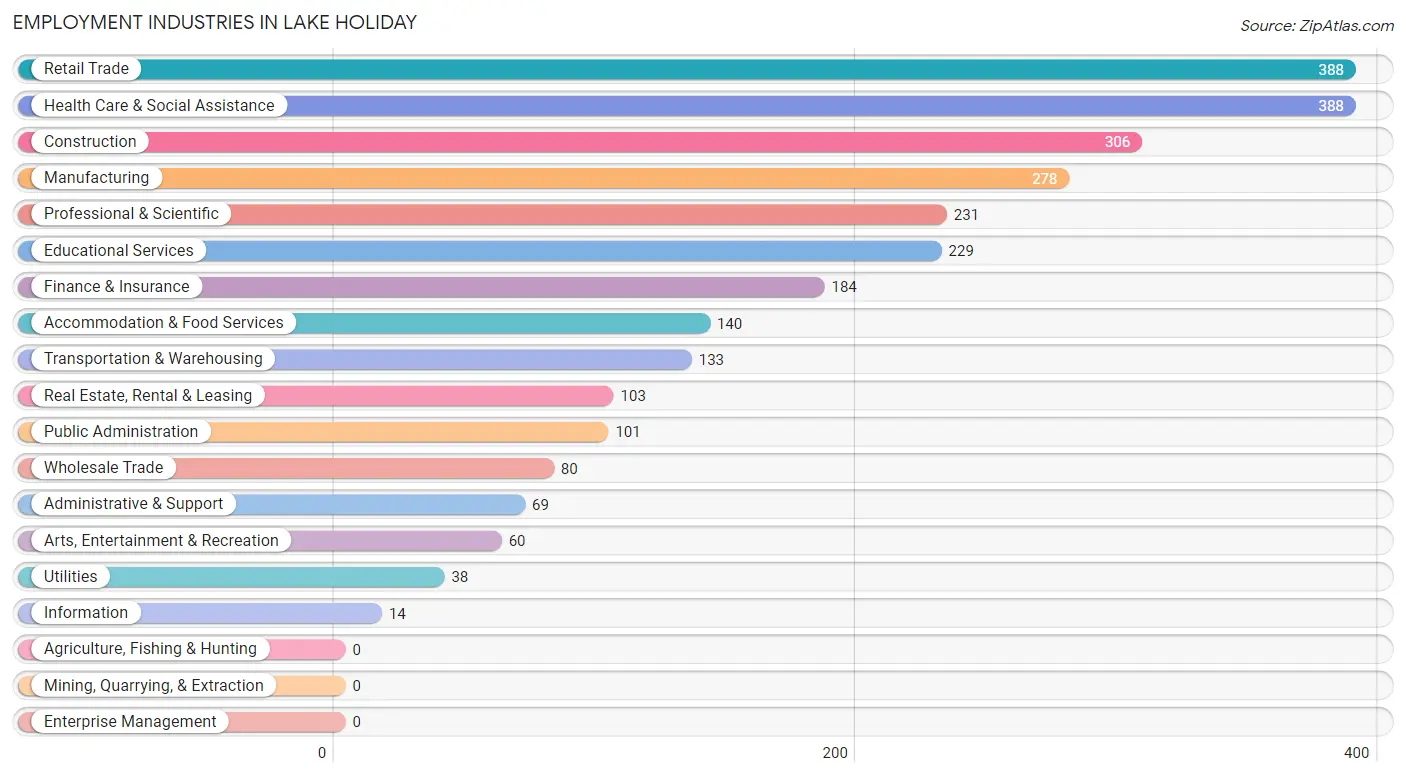
Employment Industries in Lake Holiday
The major employment industries in Lake Holiday include Retail Trade (388 | 13.8%), Health Care & Social Assistance (388 | 13.8%), Construction (306 | 10.9%), Manufacturing (278 | 9.9%), and Professional & Scientific (231 | 8.2%).
Employment Industries by Sex in Lake Holiday
The Lake Holiday industries that see more men than women are Utilities (100.0%), Administrative & Support (100.0%), and Construction (95.8%), whereas the industries that tend to have a higher number of women are Wholesale Trade (100.0%), Information (100.0%), and Arts, Entertainment & Recreation (100.0%).
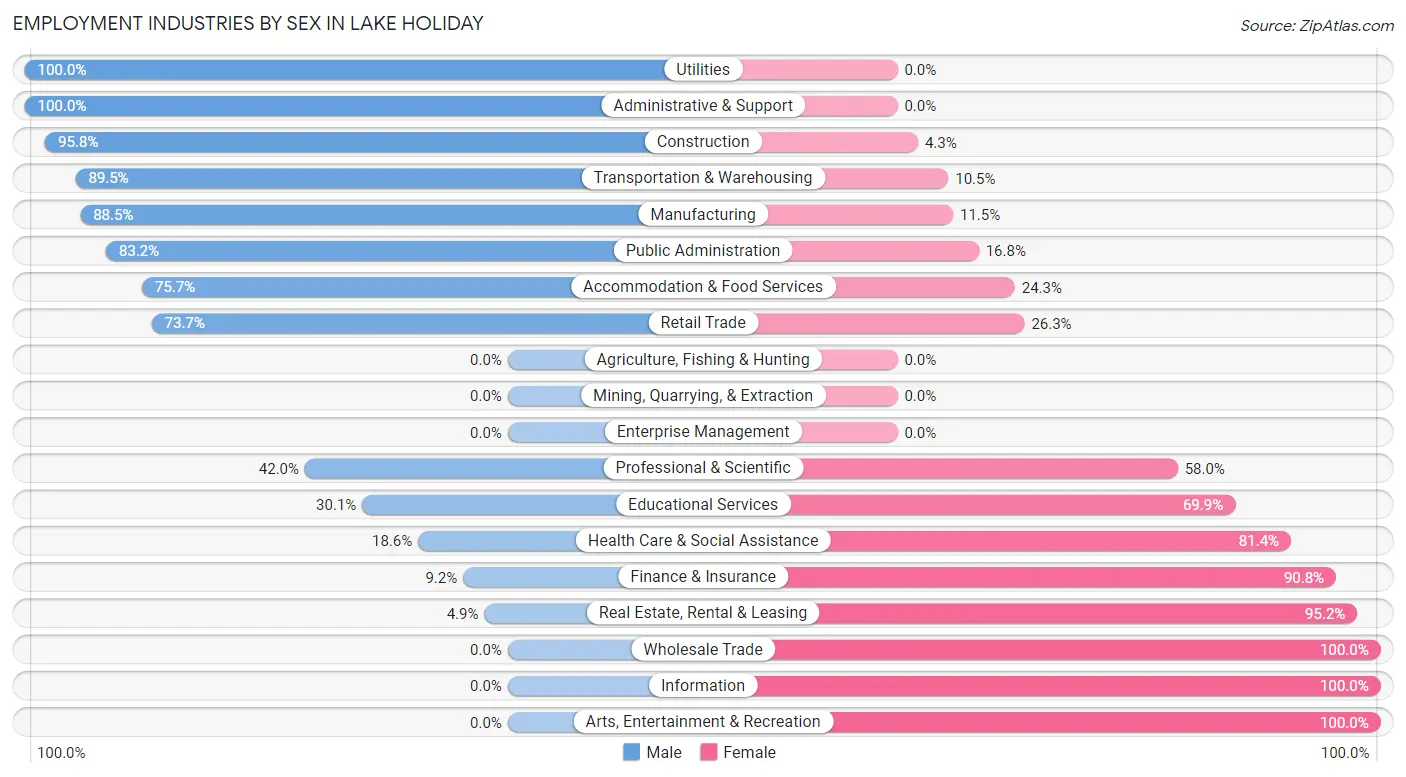
| Industry | Male | Female |
| Agriculture, Fishing & Hunting | 0 (0.0%) | 0 (0.0%) |
| Mining, Quarrying, & Extraction | 0 (0.0%) | 0 (0.0%) |
| Construction | 293 (95.8%) | 13 (4.3%) |
| Manufacturing | 246 (88.5%) | 32 (11.5%) |
| Wholesale Trade | 0 (0.0%) | 80 (100.0%) |
| Retail Trade | 286 (73.7%) | 102 (26.3%) |
| Transportation & Warehousing | 119 (89.5%) | 14 (10.5%) |
| Utilities | 38 (100.0%) | 0 (0.0%) |
| Information | 0 (0.0%) | 14 (100.0%) |
| Finance & Insurance | 17 (9.2%) | 167 (90.8%) |
| Real Estate, Rental & Leasing | 5 (4.9%) | 98 (95.2%) |
| Professional & Scientific | 97 (42.0%) | 134 (58.0%) |
| Enterprise Management | 0 (0.0%) | 0 (0.0%) |
| Administrative & Support | 69 (100.0%) | 0 (0.0%) |
| Educational Services | 69 (30.1%) | 160 (69.9%) |
| Health Care & Social Assistance | 72 (18.6%) | 316 (81.4%) |
| Arts, Entertainment & Recreation | 0 (0.0%) | 60 (100.0%) |
| Accommodation & Food Services | 106 (75.7%) | 34 (24.3%) |
| Public Administration | 84 (83.2%) | 17 (16.8%) |
| Total | 1,565 (55.8%) | 1,241 (44.2%) |
Education in Lake Holiday
School Enrollment in Lake Holiday
The most common levels of schooling among the 1,111 students in Lake Holiday are elementary school (271 | 24.4%), high school (233 | 21.0%), and middle school (224 | 20.2%).
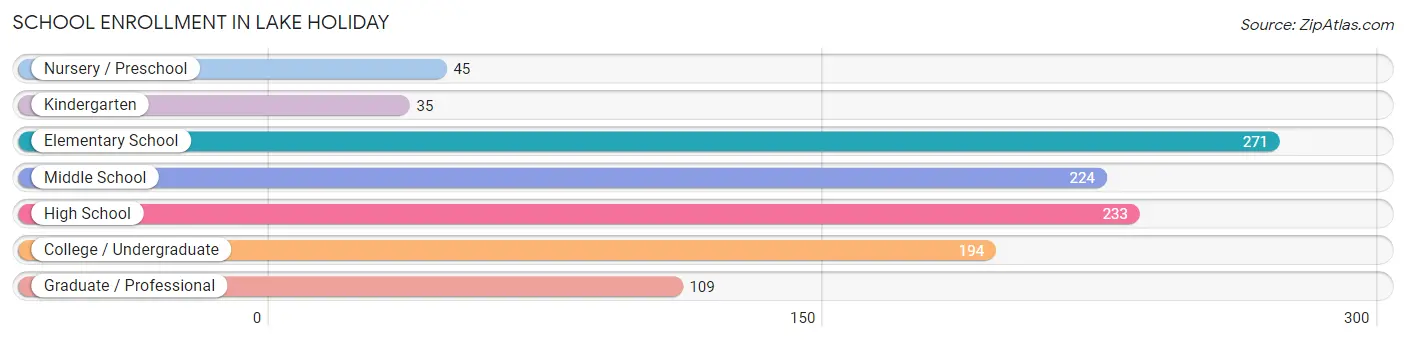
| School Level | # Students | % Students |
| Nursery / Preschool | 45 | 4.1% |
| Kindergarten | 35 | 3.2% |
| Elementary School | 271 | 24.4% |
| Middle School | 224 | 20.2% |
| High School | 233 | 21.0% |
| College / Undergraduate | 194 | 17.5% |
| Graduate / Professional | 109 | 9.8% |
| Total | 1,111 | 100.0% |
School Enrollment by Age by Funding Source in Lake Holiday
Out of a total of 1,111 students who are enrolled in schools in Lake Holiday, 76 (6.8%) attend a private institution, while the remaining 1,035 (93.2%) are enrolled in public schools. The age group of 3 to 4 year olds has the highest likelihood of being enrolled in private schools, with 3 (50.0% in the age bracket) enrolled. Conversely, the age group of 10 to 14 year olds has the lowest likelihood of being enrolled in a private school, with 294 (100.0% in the age bracket) attending a public institution.
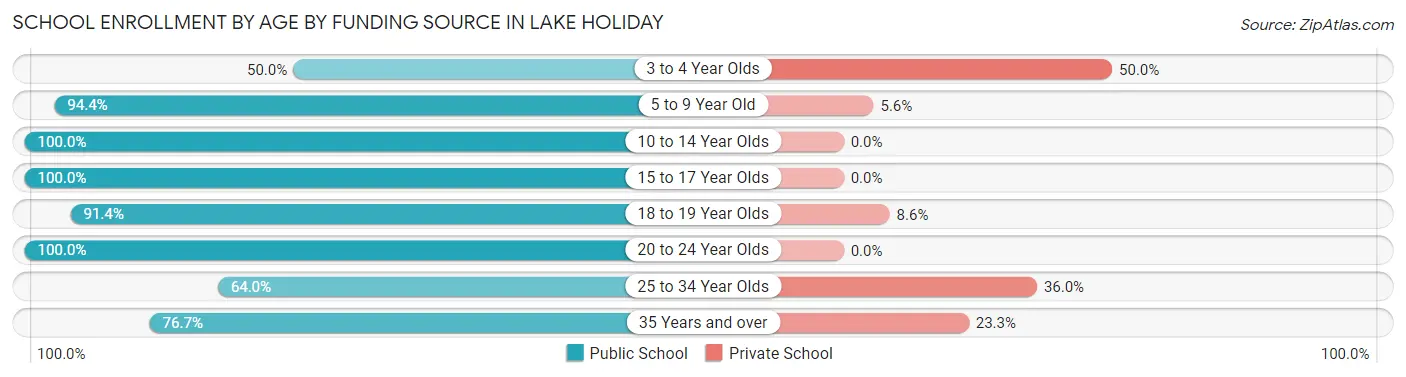
| Age Bracket | Public School | Private School |
| 3 to 4 Year Olds | 3 (50.0%) | 3 (50.0%) |
| 5 to 9 Year Old | 272 (94.4%) | 16 (5.6%) |
| 10 to 14 Year Olds | 294 (100.0%) | 0 (0.0%) |
| 15 to 17 Year Olds | 71 (100.0%) | 0 (0.0%) |
| 18 to 19 Year Olds | 160 (91.4%) | 15 (8.6%) |
| 20 to 24 Year Olds | 124 (100.0%) | 0 (0.0%) |
| 25 to 34 Year Olds | 32 (64.0%) | 18 (36.0%) |
| 35 Years and over | 79 (76.7%) | 24 (23.3%) |
| Total | 1,035 (93.2%) | 76 (6.8%) |
Educational Attainment by Field of Study in Lake Holiday
Business (253 | 23.8%), bio, nature & agricultural (151 | 14.2%), education (150 | 14.1%), science & technology (101 | 9.5%), and psychology (67 | 6.3%) are the most common fields of study among 1,063 individuals in Lake Holiday who have obtained a bachelor's degree or higher.
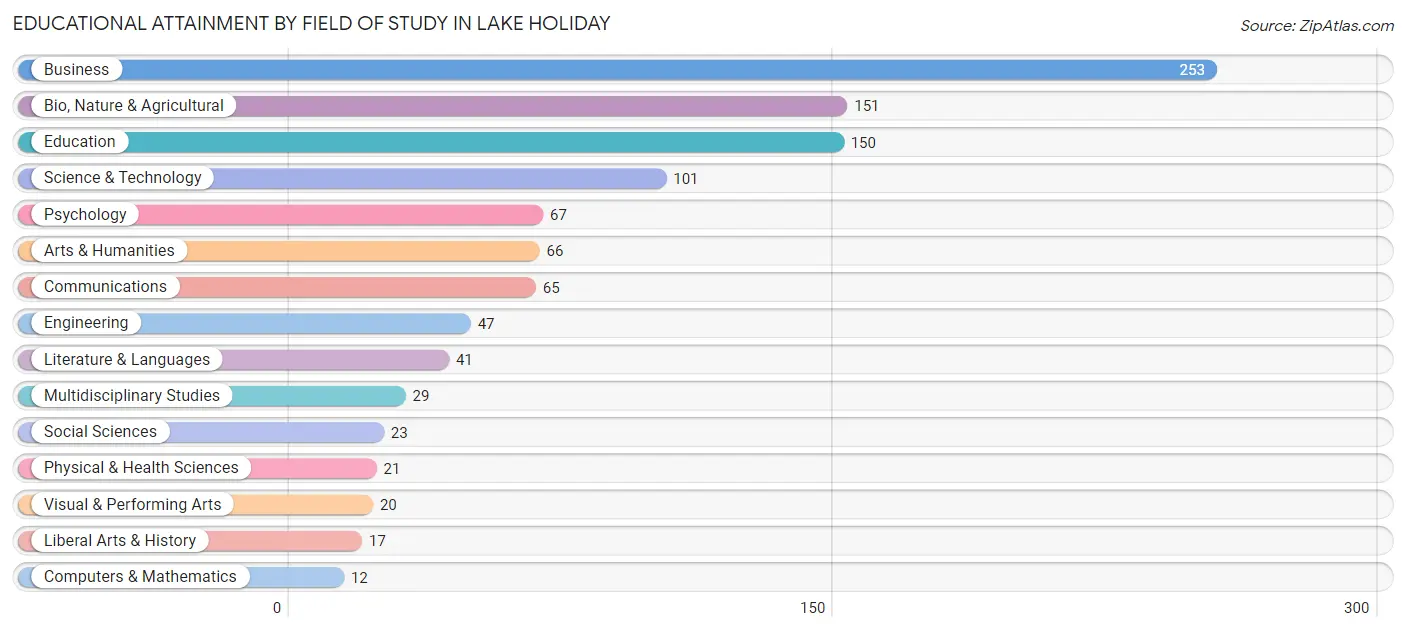
| Field of Study | # Graduates | % Graduates |
| Computers & Mathematics | 12 | 1.1% |
| Bio, Nature & Agricultural | 151 | 14.2% |
| Physical & Health Sciences | 21 | 2.0% |
| Psychology | 67 | 6.3% |
| Social Sciences | 23 | 2.2% |
| Engineering | 47 | 4.4% |
| Multidisciplinary Studies | 29 | 2.7% |
| Science & Technology | 101 | 9.5% |
| Business | 253 | 23.8% |
| Education | 150 | 14.1% |
| Literature & Languages | 41 | 3.9% |
| Liberal Arts & History | 17 | 1.6% |
| Visual & Performing Arts | 20 | 1.9% |
| Communications | 65 | 6.1% |
| Arts & Humanities | 66 | 6.2% |
| Total | 1,063 | 100.0% |
Transportation & Commute in Lake Holiday
Vehicle Availability by Sex in Lake Holiday
The most prevalent vehicle ownership categories in Lake Holiday are males with 2 vehicles (626, accounting for 40.4%) and females with 2 vehicles (509, making up 51.2%).
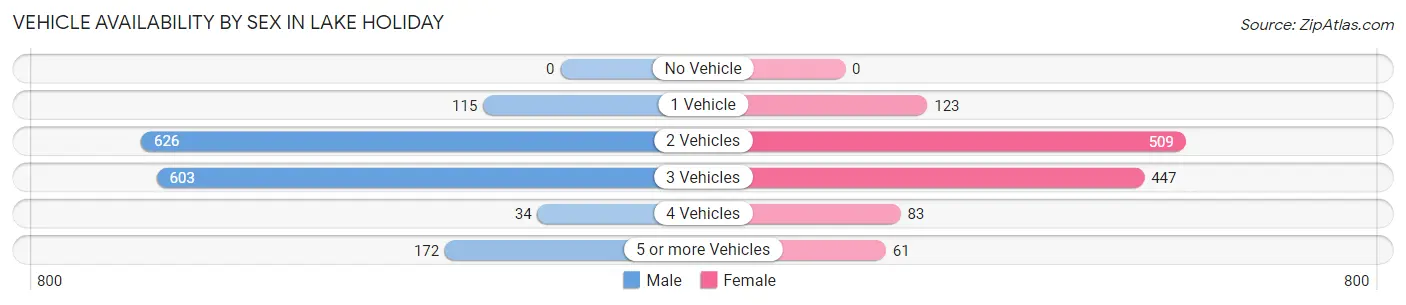
| Vehicles Available | Male | Female |
| No Vehicle | 0 (0.0%) | 0 (0.0%) |
| 1 Vehicle | 115 (7.4%) | 123 (10.1%) |
| 2 Vehicles | 626 (40.4%) | 509 (41.6%) |
| 3 Vehicles | 603 (38.9%) | 447 (36.5%) |
| 4 Vehicles | 34 (2.2%) | 83 (6.8%) |
| 5 or more Vehicles | 172 (11.1%) | 61 (5.0%) |
| Total | 1,550 (100.0%) | 1,223 (100.0%) |
Commute Time in Lake Holiday
The most frequently occuring commute durations in Lake Holiday are 45 to 59 minutes (538 commuters, 21.2%), 30 to 34 minutes (405 commuters, 16.0%), and 60 to 89 minutes (267 commuters, 10.5%).
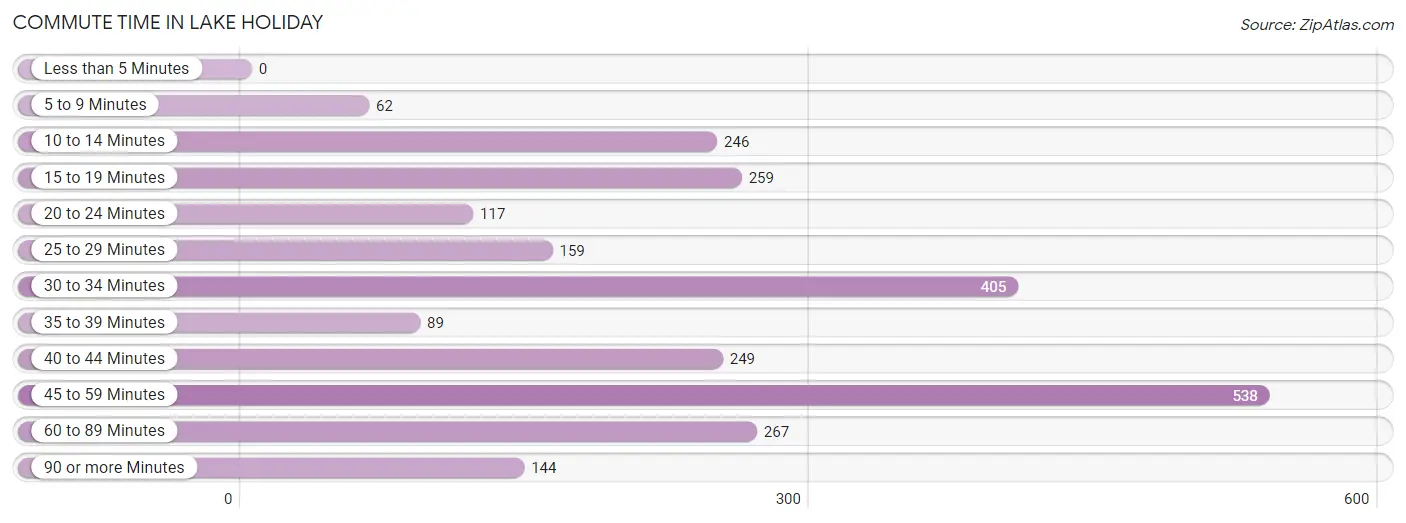
| Commute Time | # Commuters | % Commuters |
| Less than 5 Minutes | 0 | 0.0% |
| 5 to 9 Minutes | 62 | 2.5% |
| 10 to 14 Minutes | 246 | 9.7% |
| 15 to 19 Minutes | 259 | 10.2% |
| 20 to 24 Minutes | 117 | 4.6% |
| 25 to 29 Minutes | 159 | 6.3% |
| 30 to 34 Minutes | 405 | 16.0% |
| 35 to 39 Minutes | 89 | 3.5% |
| 40 to 44 Minutes | 249 | 9.8% |
| 45 to 59 Minutes | 538 | 21.2% |
| 60 to 89 Minutes | 267 | 10.5% |
| 90 or more Minutes | 144 | 5.7% |
Commute Time by Sex in Lake Holiday
The most common commute times in Lake Holiday are 45 to 59 minutes (265 commuters, 18.0%) for males and 45 to 59 minutes (273 commuters, 25.7%) for females.
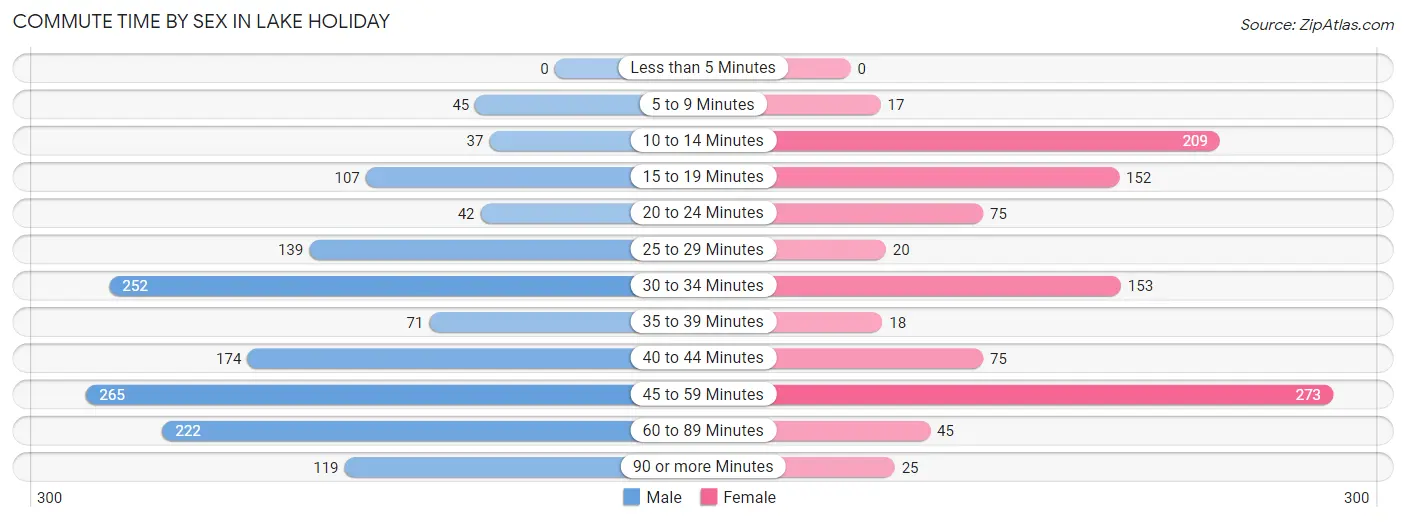
| Commute Time | Male | Female |
| Less than 5 Minutes | 0 (0.0%) | 0 (0.0%) |
| 5 to 9 Minutes | 45 (3.0%) | 17 (1.6%) |
| 10 to 14 Minutes | 37 (2.5%) | 209 (19.7%) |
| 15 to 19 Minutes | 107 (7.3%) | 152 (14.3%) |
| 20 to 24 Minutes | 42 (2.9%) | 75 (7.1%) |
| 25 to 29 Minutes | 139 (9.4%) | 20 (1.9%) |
| 30 to 34 Minutes | 252 (17.1%) | 153 (14.4%) |
| 35 to 39 Minutes | 71 (4.8%) | 18 (1.7%) |
| 40 to 44 Minutes | 174 (11.8%) | 75 (7.1%) |
| 45 to 59 Minutes | 265 (18.0%) | 273 (25.7%) |
| 60 to 89 Minutes | 222 (15.1%) | 45 (4.2%) |
| 90 or more Minutes | 119 (8.1%) | 25 (2.4%) |
Time of Departure to Work by Sex in Lake Holiday
The most frequent times of departure to work in Lake Holiday are 8:00 AM to 8:29 AM (301, 20.4%) for males and 7:00 AM to 7:29 AM (165, 15.5%) for females.
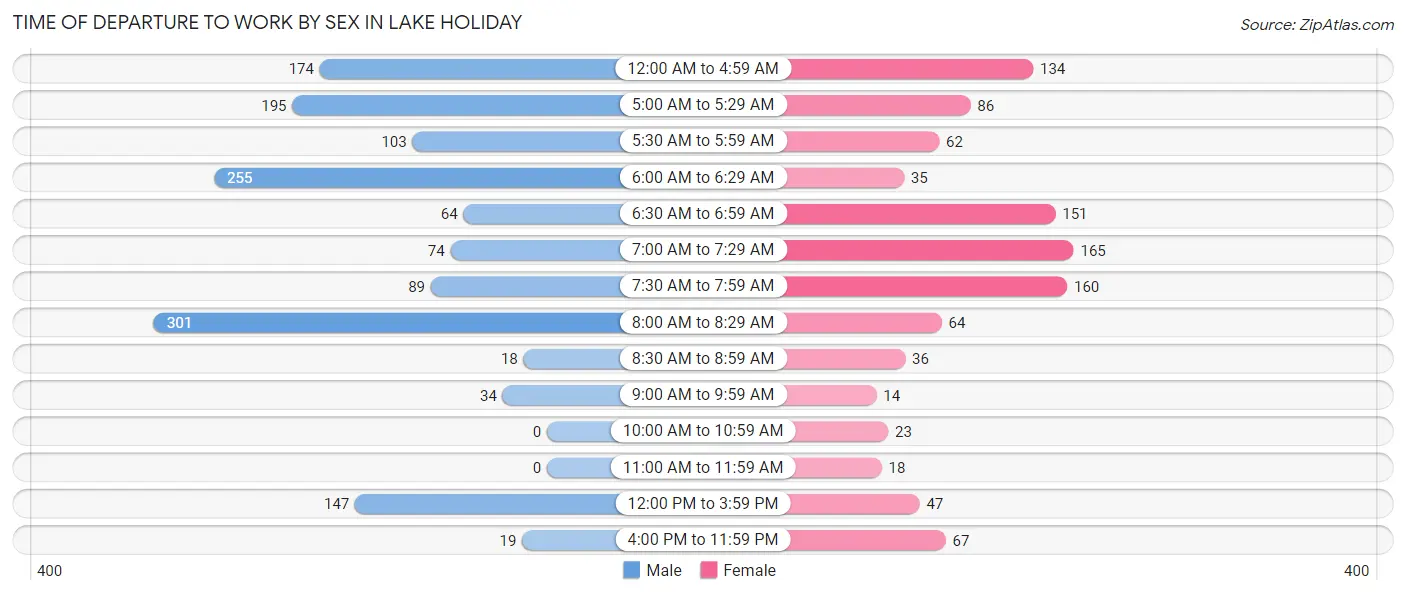
| Time of Departure | Male | Female |
| 12:00 AM to 4:59 AM | 174 (11.8%) | 134 (12.6%) |
| 5:00 AM to 5:29 AM | 195 (13.2%) | 86 (8.1%) |
| 5:30 AM to 5:59 AM | 103 (7.0%) | 62 (5.8%) |
| 6:00 AM to 6:29 AM | 255 (17.3%) | 35 (3.3%) |
| 6:30 AM to 6:59 AM | 64 (4.3%) | 151 (14.2%) |
| 7:00 AM to 7:29 AM | 74 (5.0%) | 165 (15.5%) |
| 7:30 AM to 7:59 AM | 89 (6.0%) | 160 (15.1%) |
| 8:00 AM to 8:29 AM | 301 (20.4%) | 64 (6.0%) |
| 8:30 AM to 8:59 AM | 18 (1.2%) | 36 (3.4%) |
| 9:00 AM to 9:59 AM | 34 (2.3%) | 14 (1.3%) |
| 10:00 AM to 10:59 AM | 0 (0.0%) | 23 (2.2%) |
| 11:00 AM to 11:59 AM | 0 (0.0%) | 18 (1.7%) |
| 12:00 PM to 3:59 PM | 147 (10.0%) | 47 (4.4%) |
| 4:00 PM to 11:59 PM | 19 (1.3%) | 67 (6.3%) |
| Total | 1,473 (100.0%) | 1,062 (100.0%) |
Housing Occupancy in Lake Holiday
Occupancy by Ownership in Lake Holiday
Of the total 2,087 dwellings in Lake Holiday, owner-occupied units account for 1,929 (92.4%), while renter-occupied units make up 158 (7.6%).
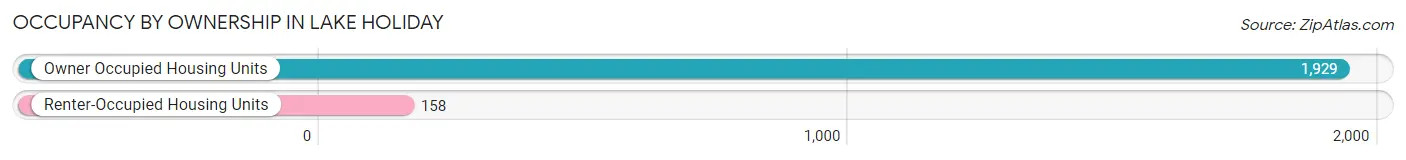
| Occupancy | # Housing Units | % Housing Units |
| Owner Occupied Housing Units | 1,929 | 92.4% |
| Renter-Occupied Housing Units | 158 | 7.6% |
| Total Occupied Housing Units | 2,087 | 100.0% |
Occupancy by Household Size in Lake Holiday
| Household Size | # Housing Units | % Housing Units |
| 1-Person Household | 464 | 22.2% |
| 2-Person Household | 785 | 37.6% |
| 3-Person Household | 383 | 18.3% |
| 4+ Person Household | 455 | 21.8% |
| Total Housing Units | 2,087 | 100.0% |
Occupancy by Ownership by Household Size in Lake Holiday
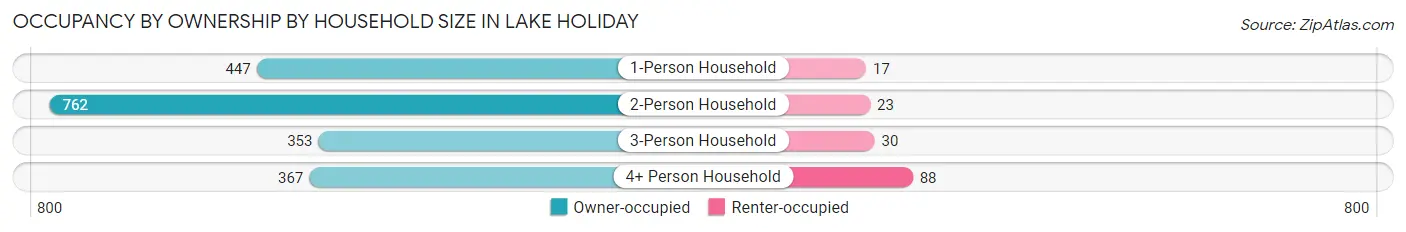
| Household Size | Owner-occupied | Renter-occupied |
| 1-Person Household | 447 (96.3%) | 17 (3.7%) |
| 2-Person Household | 762 (97.1%) | 23 (2.9%) |
| 3-Person Household | 353 (92.2%) | 30 (7.8%) |
| 4+ Person Household | 367 (80.7%) | 88 (19.3%) |
| Total Housing Units | 1,929 (92.4%) | 158 (7.6%) |
Occupancy by Educational Attainment in Lake Holiday
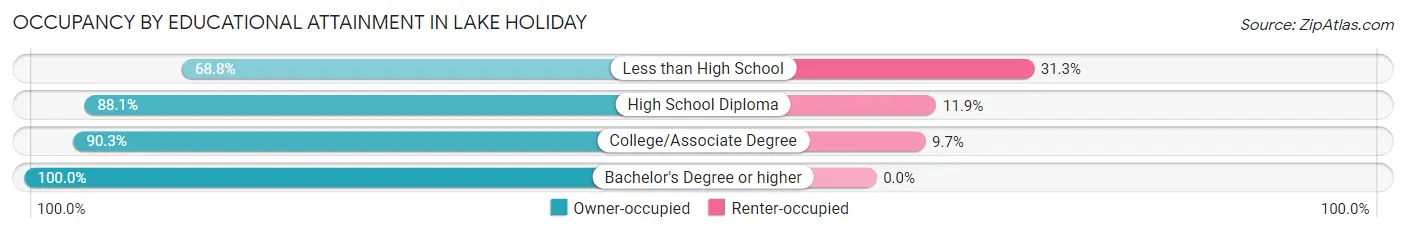
| Household Size | Owner-occupied | Renter-occupied |
| Less than High School | 22 (68.8%) | 10 (31.2%) |
| High School Diploma | 482 (88.1%) | 65 (11.9%) |
| College/Associate Degree | 773 (90.3%) | 83 (9.7%) |
| Bachelor's Degree or higher | 652 (100.0%) | 0 (0.0%) |
Occupancy by Age of Householder in Lake Holiday
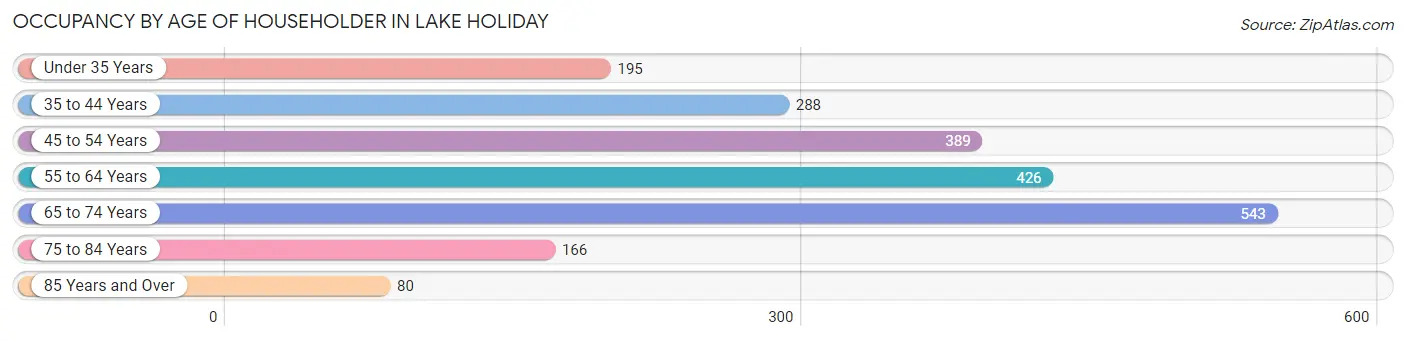
| Age Bracket | # Households | % Households |
| Under 35 Years | 195 | 9.3% |
| 35 to 44 Years | 288 | 13.8% |
| 45 to 54 Years | 389 | 18.6% |
| 55 to 64 Years | 426 | 20.4% |
| 65 to 74 Years | 543 | 26.0% |
| 75 to 84 Years | 166 | 8.0% |
| 85 Years and Over | 80 | 3.8% |
| Total | 2,087 | 100.0% |
Housing Finances in Lake Holiday
Median Income by Occupancy in Lake Holiday
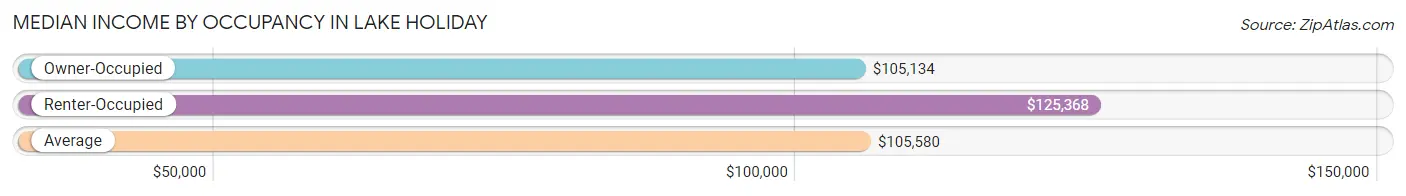
| Occupancy Type | # Households | Median Income |
| Owner-Occupied | 1,929 (92.4%) | $105,134 |
| Renter-Occupied | 158 (7.6%) | $125,368 |
| Average | 2,087 (100.0%) | $105,580 |
Occupancy by Householder Income Bracket in Lake Holiday
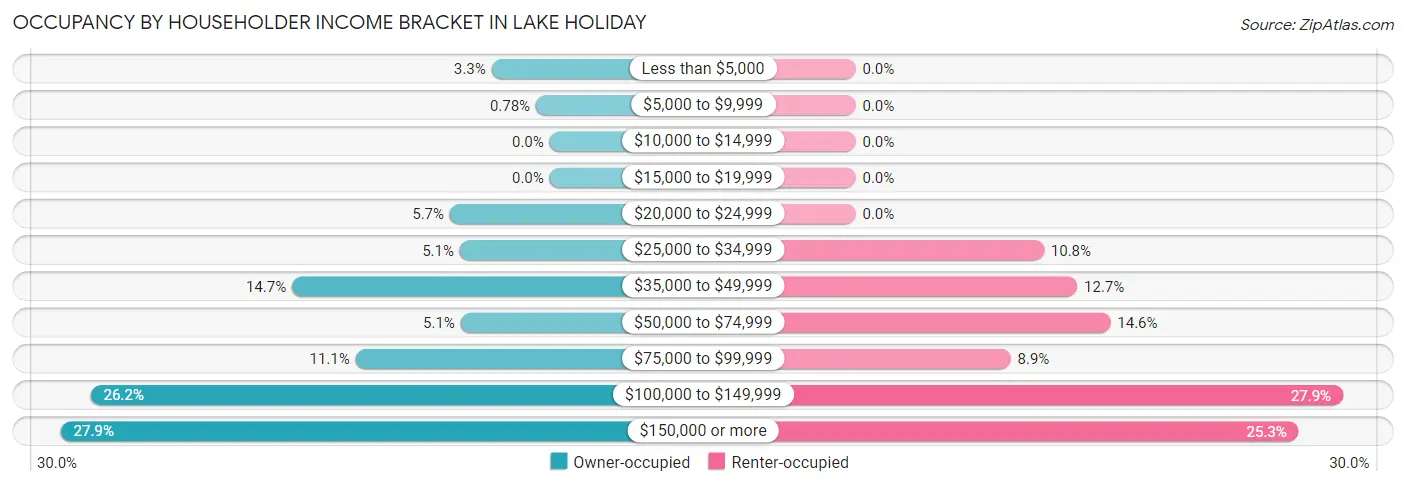
| Income Bracket | Owner-occupied | Renter-occupied |
| Less than $5,000 | 64 (3.3%) | 0 (0.0%) |
| $5,000 to $9,999 | 15 (0.8%) | 0 (0.0%) |
| $10,000 to $14,999 | 0 (0.0%) | 0 (0.0%) |
| $15,000 to $19,999 | 0 (0.0%) | 0 (0.0%) |
| $20,000 to $24,999 | 110 (5.7%) | 0 (0.0%) |
| $25,000 to $34,999 | 99 (5.1%) | 17 (10.8%) |
| $35,000 to $49,999 | 284 (14.7%) | 20 (12.7%) |
| $50,000 to $74,999 | 98 (5.1%) | 23 (14.6%) |
| $75,000 to $99,999 | 214 (11.1%) | 14 (8.9%) |
| $100,000 to $149,999 | 506 (26.2%) | 44 (27.9%) |
| $150,000 or more | 539 (27.9%) | 40 (25.3%) |
| Total | 1,929 (100.0%) | 158 (100.0%) |
Monthly Housing Cost Tiers in Lake Holiday
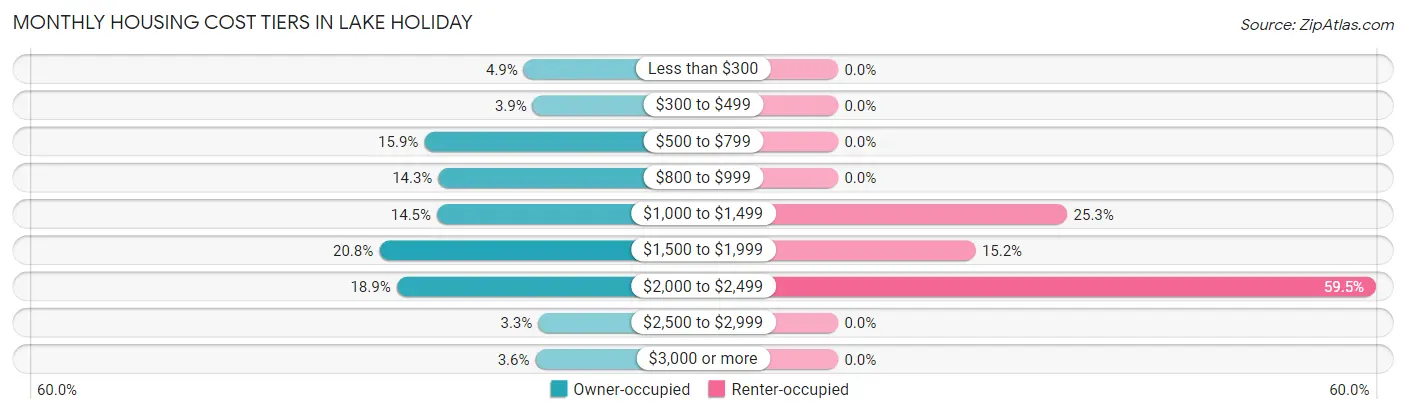
| Monthly Cost | Owner-occupied | Renter-occupied |
| Less than $300 | 94 (4.9%) | 0 (0.0%) |
| $300 to $499 | 75 (3.9%) | 0 (0.0%) |
| $500 to $799 | 306 (15.9%) | 0 (0.0%) |
| $800 to $999 | 276 (14.3%) | 0 (0.0%) |
| $1,000 to $1,499 | 279 (14.5%) | 40 (25.3%) |
| $1,500 to $1,999 | 402 (20.8%) | 24 (15.2%) |
| $2,000 to $2,499 | 365 (18.9%) | 94 (59.5%) |
| $2,500 to $2,999 | 63 (3.3%) | 0 (0.0%) |
| $3,000 or more | 69 (3.6%) | 0 (0.0%) |
| Total | 1,929 (100.0%) | 158 (100.0%) |
Physical Housing Characteristics in Lake Holiday
Housing Structures in Lake Holiday
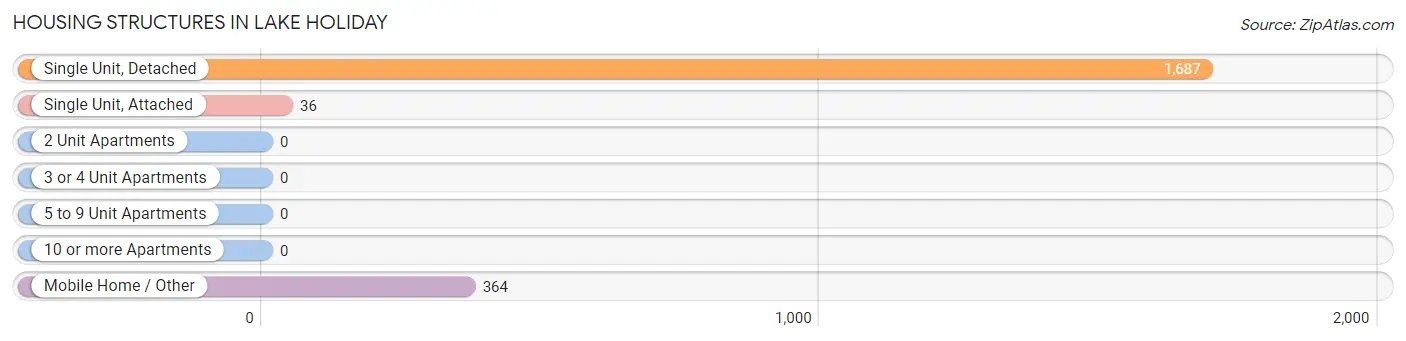
| Structure Type | # Housing Units | % Housing Units |
| Single Unit, Detached | 1,687 | 80.8% |
| Single Unit, Attached | 36 | 1.7% |
| 2 Unit Apartments | 0 | 0.0% |
| 3 or 4 Unit Apartments | 0 | 0.0% |
| 5 to 9 Unit Apartments | 0 | 0.0% |
| 10 or more Apartments | 0 | 0.0% |
| Mobile Home / Other | 364 | 17.4% |
| Total | 2,087 | 100.0% |
Housing Structures by Occupancy in Lake Holiday
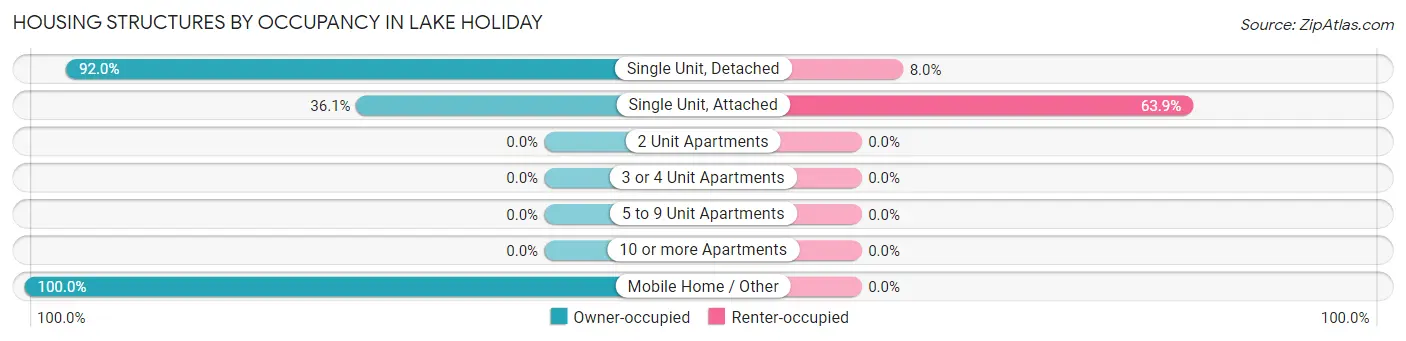
| Structure Type | Owner-occupied | Renter-occupied |
| Single Unit, Detached | 1,552 (92.0%) | 135 (8.0%) |
| Single Unit, Attached | 13 (36.1%) | 23 (63.9%) |
| 2 Unit Apartments | 0 (0.0%) | 0 (0.0%) |
| 3 or 4 Unit Apartments | 0 (0.0%) | 0 (0.0%) |
| 5 to 9 Unit Apartments | 0 (0.0%) | 0 (0.0%) |
| 10 or more Apartments | 0 (0.0%) | 0 (0.0%) |
| Mobile Home / Other | 364 (100.0%) | 0 (0.0%) |
| Total | 1,929 (92.4%) | 158 (7.6%) |
Housing Structures by Number of Rooms in Lake Holiday
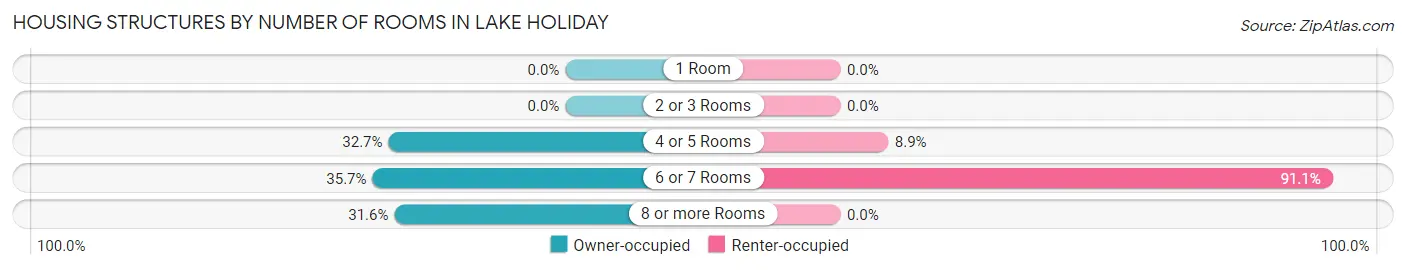
| Number of Rooms | Owner-occupied | Renter-occupied |
| 1 Room | 0 (0.0%) | 0 (0.0%) |
| 2 or 3 Rooms | 0 (0.0%) | 0 (0.0%) |
| 4 or 5 Rooms | 631 (32.7%) | 14 (8.9%) |
| 6 or 7 Rooms | 688 (35.7%) | 144 (91.1%) |
| 8 or more Rooms | 610 (31.6%) | 0 (0.0%) |
| Total | 1,929 (100.0%) | 158 (100.0%) |
Housing Structure by Heating Type in Lake Holiday
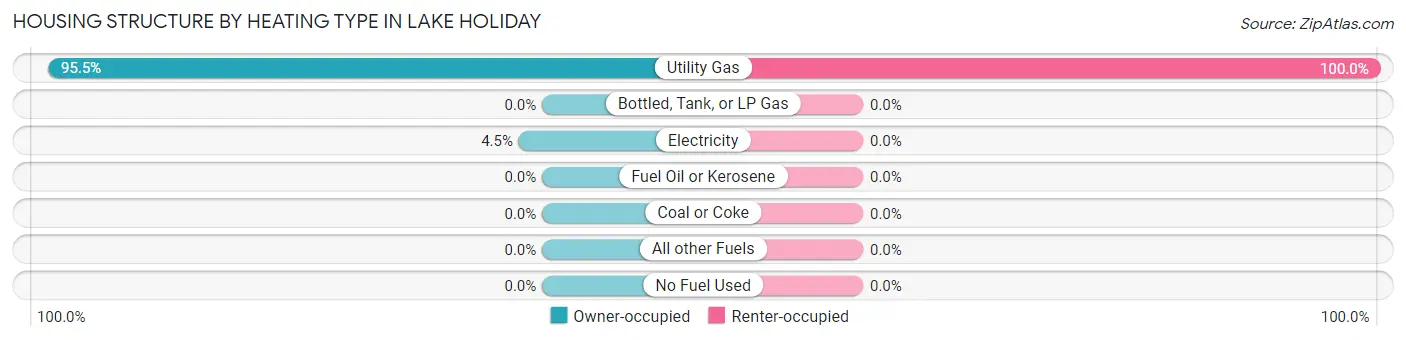
| Heating Type | Owner-occupied | Renter-occupied |
| Utility Gas | 1,842 (95.5%) | 158 (100.0%) |
| Bottled, Tank, or LP Gas | 0 (0.0%) | 0 (0.0%) |
| Electricity | 87 (4.5%) | 0 (0.0%) |
| Fuel Oil or Kerosene | 0 (0.0%) | 0 (0.0%) |
| Coal or Coke | 0 (0.0%) | 0 (0.0%) |
| All other Fuels | 0 (0.0%) | 0 (0.0%) |
| No Fuel Used | 0 (0.0%) | 0 (0.0%) |
| Total | 1,929 (100.0%) | 158 (100.0%) |
Household Vehicle Usage in Lake Holiday
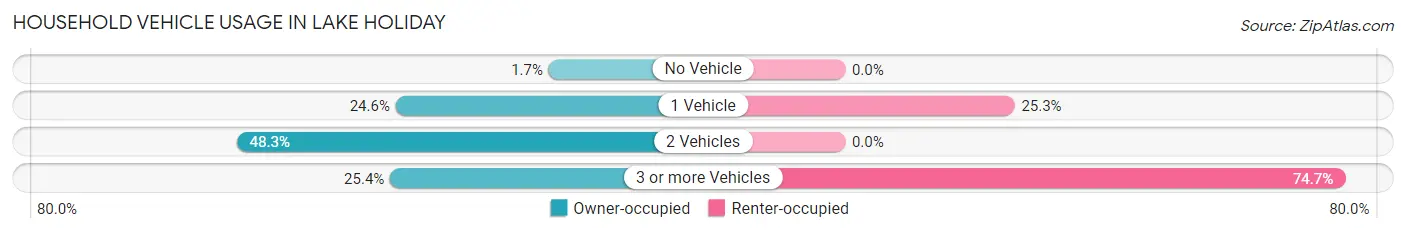
| Vehicles per Household | Owner-occupied | Renter-occupied |
| No Vehicle | 33 (1.7%) | 0 (0.0%) |
| 1 Vehicle | 474 (24.6%) | 40 (25.3%) |
| 2 Vehicles | 932 (48.3%) | 0 (0.0%) |
| 3 or more Vehicles | 490 (25.4%) | 118 (74.7%) |
| Total | 1,929 (100.0%) | 158 (100.0%) |
Real Estate & Mortgages in Lake Holiday
Real Estate and Mortgage Overview in Lake Holiday
| Characteristic | Without Mortgage | With Mortgage |
| Housing Units | 853 | 1,076 |
| Median Property Value | $140,900 | $232,800 |
| Median Household Income | $63,005 | $390 |
| Monthly Housing Costs | $750 | $69 |
| Real Estate Taxes | $3,545 | $0 |
Property Value by Mortgage Status in Lake Holiday
| Property Value | Without Mortgage | With Mortgage |
| Less than $50,000 | 169 (19.8%) | 30 (2.8%) |
| $50,000 to $99,999 | 227 (26.6%) | 22 (2.0%) |
| $100,000 to $299,999 | 333 (39.0%) | 755 (70.2%) |
| $300,000 to $499,999 | 92 (10.8%) | 230 (21.4%) |
| $500,000 to $749,999 | 11 (1.3%) | 39 (3.6%) |
| $750,000 to $999,999 | 21 (2.5%) | 0 (0.0%) |
| $1,000,000 or more | 0 (0.0%) | 0 (0.0%) |
| Total | 853 (100.0%) | 1,076 (100.0%) |
Household Income by Mortgage Status in Lake Holiday
| Household Income | Without Mortgage | With Mortgage |
| Less than $10,000 | 15 (1.8%) | 20 (1.9%) |
| $10,000 to $24,999 | 94 (11.0%) | 64 (5.9%) |
| $25,000 to $34,999 | 95 (11.1%) | 16 (1.5%) |
| $35,000 to $49,999 | 212 (24.8%) | 4 (0.4%) |
| $50,000 to $74,999 | 65 (7.6%) | 72 (6.7%) |
| $75,000 to $99,999 | 109 (12.8%) | 33 (3.1%) |
| $100,000 to $149,999 | 114 (13.4%) | 105 (9.8%) |
| $150,000 or more | 149 (17.5%) | 392 (36.4%) |
| Total | 853 (100.0%) | 1,076 (100.0%) |
Property Value to Household Income Ratio in Lake Holiday
| Value-to-Income Ratio | Without Mortgage | With Mortgage |
| Less than 2.0x | 502 (58.9%) | 137,941 (12,819.8%) |
| 2.0x to 2.9x | 141 (16.5%) | 439 (40.8%) |
| 3.0x to 3.9x | 71 (8.3%) | 425 (39.5%) |
| 4.0x or more | 139 (16.3%) | 59 (5.5%) |
| Total | 853 (100.0%) | 1,076 (100.0%) |
Real Estate Taxes by Mortgage Status in Lake Holiday
| Property Taxes | Without Mortgage | With Mortgage |
| Less than $800 | 310 (36.3%) | 0 (0.0%) |
| $800 to $1,499 | 30 (3.5%) | 30 (2.8%) |
| $800 to $1,499 | 414 (48.5%) | 0 (0.0%) |
| Total | 853 (100.0%) | 1,076 (100.0%) |
Health & Disability in Lake Holiday
Health Insurance Coverage by Age in Lake Holiday
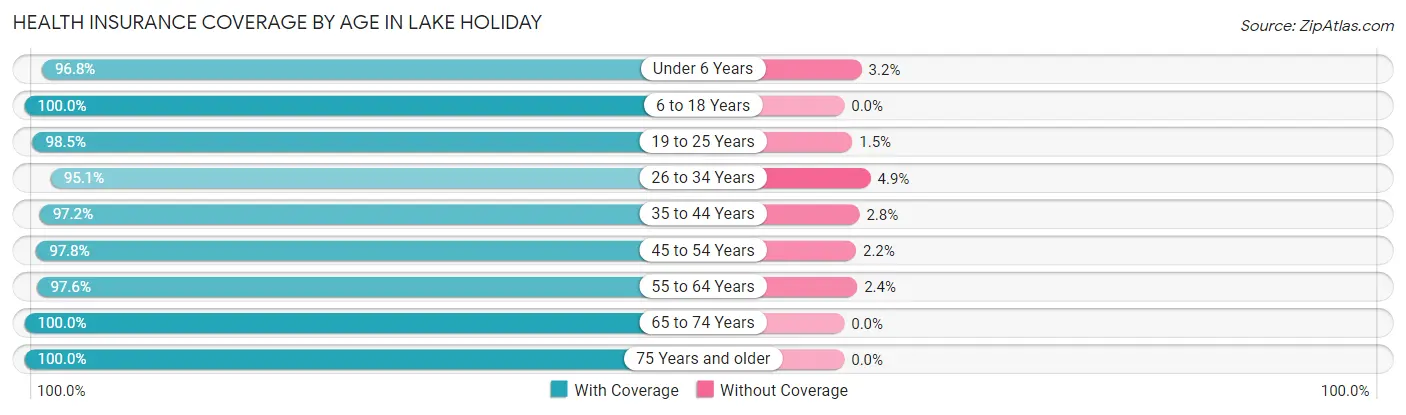
| Age Bracket | With Coverage | Without Coverage |
| Under 6 Years | 418 (96.8%) | 14 (3.2%) |
| 6 to 18 Years | 701 (100.0%) | 0 (0.0%) |
| 19 to 25 Years | 593 (98.5%) | 9 (1.5%) |
| 26 to 34 Years | 349 (95.1%) | 18 (4.9%) |
| 35 to 44 Years | 687 (97.2%) | 20 (2.8%) |
| 45 to 54 Years | 715 (97.8%) | 16 (2.2%) |
| 55 to 64 Years | 811 (97.6%) | 20 (2.4%) |
| 65 to 74 Years | 799 (100.0%) | 0 (0.0%) |
| 75 Years and older | 315 (100.0%) | 0 (0.0%) |
| Total | 5,388 (98.2%) | 97 (1.8%) |
Health Insurance Coverage by Citizenship Status in Lake Holiday
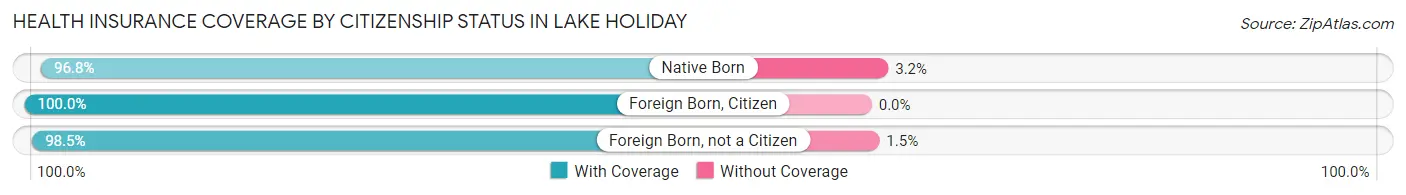
| Citizenship Status | With Coverage | Without Coverage |
| Native Born | 418 (96.8%) | 14 (3.2%) |
| Foreign Born, Citizen | 701 (100.0%) | 0 (0.0%) |
| Foreign Born, not a Citizen | 593 (98.5%) | 9 (1.5%) |
Health Insurance Coverage by Household Income in Lake Holiday
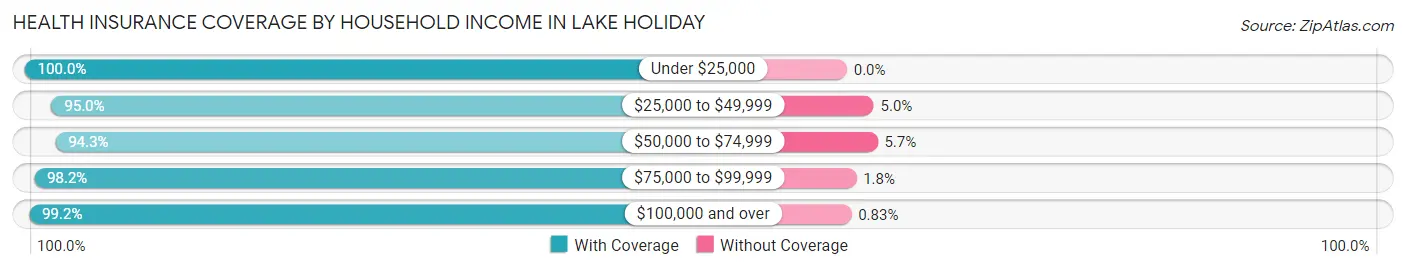
| Household Income | With Coverage | Without Coverage |
| Under $25,000 | 279 (100.0%) | 0 (0.0%) |
| $25,000 to $49,999 | 757 (95.0%) | 40 (5.0%) |
| $50,000 to $74,999 | 230 (94.3%) | 14 (5.7%) |
| $75,000 to $99,999 | 892 (98.2%) | 16 (1.8%) |
| $100,000 and over | 3,230 (99.2%) | 27 (0.8%) |
Public vs Private Health Insurance Coverage by Age in Lake Holiday
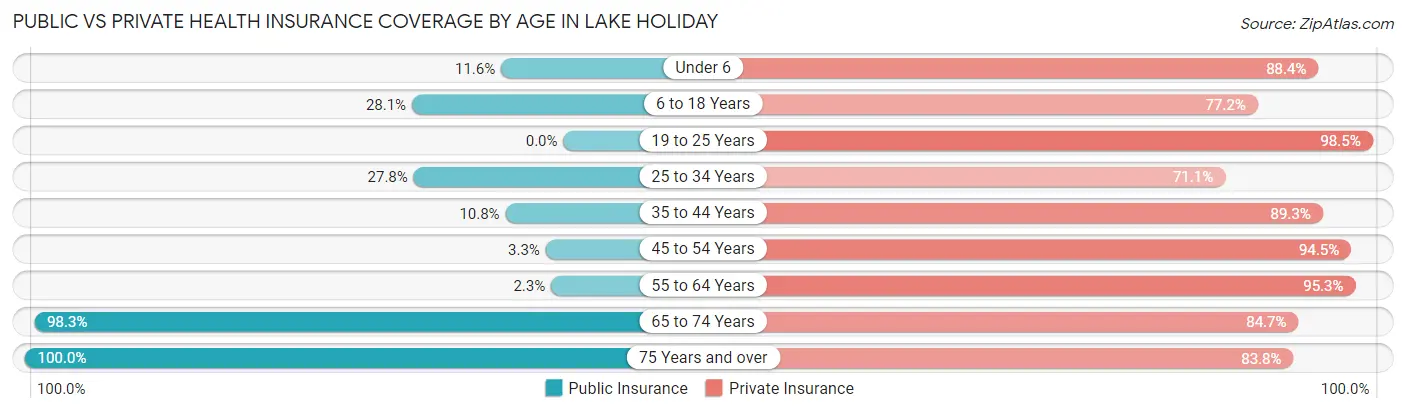
| Age Bracket | Public Insurance | Private Insurance |
| Under 6 | 50 (11.6%) | 382 (88.4%) |
| 6 to 18 Years | 197 (28.1%) | 541 (77.2%) |
| 19 to 25 Years | 0 (0.0%) | 593 (98.5%) |
| 25 to 34 Years | 102 (27.8%) | 261 (71.1%) |
| 35 to 44 Years | 76 (10.7%) | 631 (89.2%) |
| 45 to 54 Years | 24 (3.3%) | 691 (94.5%) |
| 55 to 64 Years | 19 (2.3%) | 792 (95.3%) |
| 65 to 74 Years | 785 (98.3%) | 677 (84.7%) |
| 75 Years and over | 315 (100.0%) | 264 (83.8%) |
| Total | 1,568 (28.6%) | 4,832 (88.1%) |
Disability Status by Sex by Age in Lake Holiday
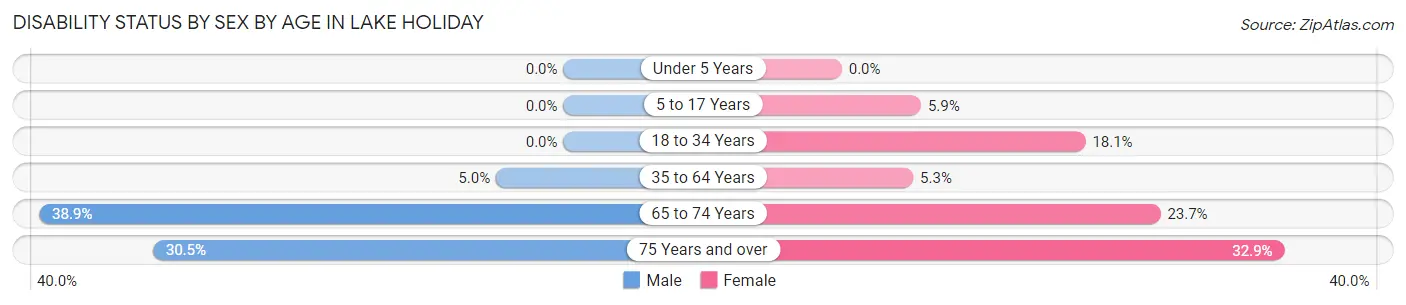
| Age Bracket | Male | Female |
| Under 5 Years | 0 (0.0%) | 0 (0.0%) |
| 5 to 17 Years | 0 (0.0%) | 15 (5.9%) |
| 18 to 34 Years | 0 (0.0%) | 89 (18.1%) |
| 35 to 64 Years | 55 (5.0%) | 62 (5.3%) |
| 65 to 74 Years | 158 (38.9%) | 93 (23.7%) |
| 75 Years and over | 32 (30.5%) | 69 (32.9%) |
Disability Class by Sex by Age in Lake Holiday
Disability Class: Hearing Difficulty
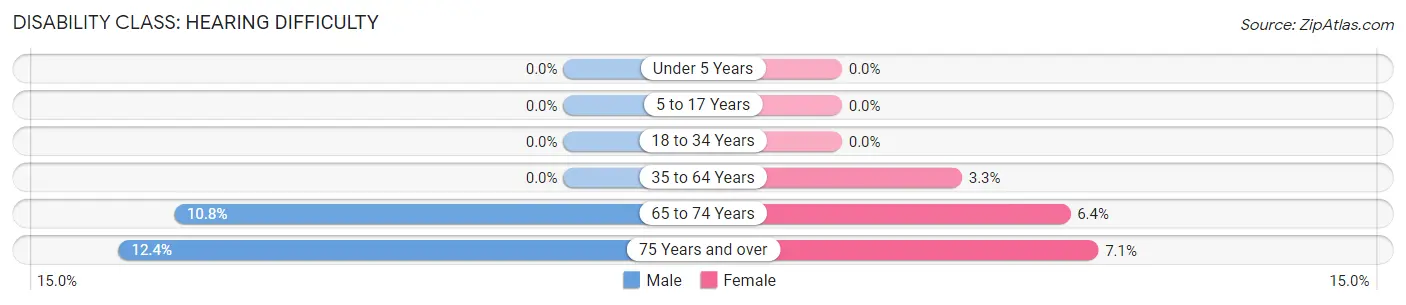
| Age Bracket | Male | Female |
| Under 5 Years | 0 (0.0%) | 0 (0.0%) |
| 5 to 17 Years | 0 (0.0%) | 0 (0.0%) |
| 18 to 34 Years | 0 (0.0%) | 0 (0.0%) |
| 35 to 64 Years | 0 (0.0%) | 39 (3.3%) |
| 65 to 74 Years | 44 (10.8%) | 25 (6.4%) |
| 75 Years and over | 13 (12.4%) | 15 (7.1%) |
Disability Class: Vision Difficulty
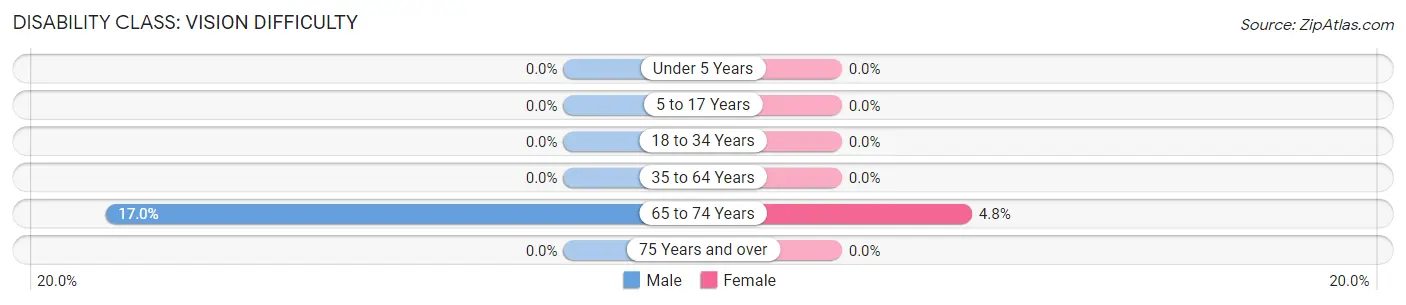
| Age Bracket | Male | Female |
| Under 5 Years | 0 (0.0%) | 0 (0.0%) |
| 5 to 17 Years | 0 (0.0%) | 0 (0.0%) |
| 18 to 34 Years | 0 (0.0%) | 0 (0.0%) |
| 35 to 64 Years | 0 (0.0%) | 0 (0.0%) |
| 65 to 74 Years | 69 (17.0%) | 19 (4.8%) |
| 75 Years and over | 0 (0.0%) | 0 (0.0%) |
Disability Class: Cognitive Difficulty
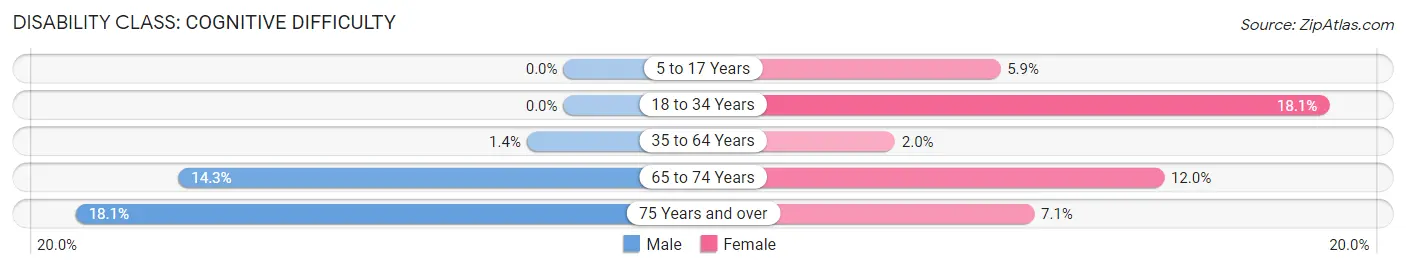
| Age Bracket | Male | Female |
| 5 to 17 Years | 0 (0.0%) | 15 (5.9%) |
| 18 to 34 Years | 0 (0.0%) | 89 (18.1%) |
| 35 to 64 Years | 15 (1.4%) | 23 (2.0%) |
| 65 to 74 Years | 58 (14.3%) | 47 (12.0%) |
| 75 Years and over | 19 (18.1%) | 15 (7.1%) |
Disability Class: Ambulatory Difficulty
| Age Bracket | Male | Female |
| 5 to 17 Years | 0 (0.0%) | 0 (0.0%) |
| 18 to 34 Years | 0 (0.0%) | 0 (0.0%) |
| 35 to 64 Years | 40 (3.6%) | 34 (2.9%) |
| 65 to 74 Years | 56 (13.8%) | 93 (23.7%) |
| 75 Years and over | 0 (0.0%) | 33 (15.7%) |
Disability Class: Self-Care Difficulty
| Age Bracket | Male | Female |
| 5 to 17 Years | 0 (0.0%) | 0 (0.0%) |
| 18 to 34 Years | 0 (0.0%) | 67 (13.6%) |
| 35 to 64 Years | 24 (2.2%) | 0 (0.0%) |
| 65 to 74 Years | 11 (2.7%) | 47 (12.0%) |
| 75 Years and over | 0 (0.0%) | 15 (7.1%) |
Technology Access in Lake Holiday
Computing Device Access in Lake Holiday
| Device Type | # Households | % Households |
| Desktop or Laptop | 1,826 | 87.5% |
| Smartphone | 1,792 | 85.9% |
| Tablet | 1,431 | 68.6% |
| No Computing Device | 110 | 5.3% |
| Total | 2,087 | 100.0% |
Internet Access in Lake Holiday
| Internet Type | # Households | % Households |
| Dial-Up Internet | 18 | 0.9% |
| Broadband Home | 1,839 | 88.1% |
| Cellular Data Only | 53 | 2.5% |
| Satellite Internet | 150 | 7.2% |
| No Internet | 134 | 6.4% |
| Total | 2,087 | 100.0% |
Lake Holiday Summary
History
Lake Holiday is a census-designated place located in DeKalb County, Illinois. It is situated on the banks of the Fox River, approximately 60 miles west of Chicago. The area was first settled in the early 1800s by a group of settlers from New York. The settlers were attracted to the area due to its abundance of natural resources, including timber, fish, and fertile soil. The first permanent settlement was established in 1835, and the area was officially incorporated as the Village of Lake Holiday in 1872.
The village was named after the nearby lake, which was created by the damming of the Fox River in 1845. The lake was used for recreational activities such as fishing and swimming, and it also served as a source of water for the village. The village grew steadily throughout the late 19th and early 20th centuries, and by the 1950s, it had become a popular summer destination for Chicagoans.
Geography
Lake Holiday is located in DeKalb County, Illinois, approximately 60 miles west of Chicago. It is situated on the banks of the Fox River, and is surrounded by rolling hills and farmland. The village is located at an elevation of 745 feet above sea level. The climate in the area is characterized by hot, humid summers and cold, snowy winters.
The village covers an area of 2.2 square miles, and is home to a population of approximately 1,500 people. The village is served by two major highways, US Route 20 and Illinois Route 38. The nearest major airport is Chicago O'Hare International Airport, located approximately 60 miles to the east.
Economy
The economy of Lake Holiday is largely based on agriculture and tourism. The village is home to several farms, which produce a variety of crops, including corn, soybeans, and wheat. The village is also home to several small businesses, including restaurants, shops, and a marina.
Tourism is an important part of the local economy, as the village is a popular destination for outdoor recreation. The lake is a popular spot for fishing, swimming, and boating, and the surrounding area is home to several parks and trails. The village also hosts several annual events, including a Fourth of July celebration and a summer music festival.
Demographics
As of the 2010 census, the population of Lake Holiday was 1,500. The racial makeup of the village was 97.3% White, 0.7% African American, 0.3% Native American, 0.3% Asian, and 1.3% from other races. The median household income was $50,000, and the median age was 40.
The village is served by two public schools, Lake Holiday Elementary School and Lake Holiday High School. The village is also home to several churches, including the First Baptist Church of Lake Holiday and the Church of the Nazarene. The village is served by the DeKalb County Sheriff's Office and the DeKalb County Fire Department.
Common Questions
What is Per Capita Income in Lake Holiday?
Per Capita income in Lake Holiday is $45,166.
What is the Median Family Income in Lake Holiday?
Median Family Income in Lake Holiday is $130,086.
What is the Median Household income in Lake Holiday?
Median Household Income in Lake Holiday is $105,580.
What is Income or Wage Gap in Lake Holiday?
Income or Wage Gap in Lake Holiday is 34.3%.
Women in Lake Holiday earn 65.7 cents for every dollar earned by a man.
What is Inequality or Gini Index in Lake Holiday?
Inequality or Gini Index in Lake Holiday is 0.38.
What is the Total Population of Lake Holiday?
Total Population of Lake Holiday is 5,485.
What is the Total Male Population of Lake Holiday?
Total Male Population of Lake Holiday is 2,757.
What is the Total Female Population of Lake Holiday?
Total Female Population of Lake Holiday is 2,728.
What is the Ratio of Males per 100 Females in Lake Holiday?
There are 101.06 Males per 100 Females in Lake Holiday.
What is the Ratio of Females per 100 Males in Lake Holiday?
There are 98.95 Females per 100 Males in Lake Holiday.
What is the Median Population Age in Lake Holiday?
Median Population Age in Lake Holiday is 43.3 Years.
What is the Average Family Size in Lake Holiday
Average Family Size in Lake Holiday is 3.1 People.
What is the Average Household Size in Lake Holiday
Average Household Size in Lake Holiday is 2.6 People.
How Large is the Labor Force in Lake Holiday?
There are 3,021 People in the Labor Forcein in Lake Holiday.
What is the Percentage of People in the Labor Force in Lake Holiday?
66.7% of People are in the Labor Force in Lake Holiday.
What is the Unemployment Rate in Lake Holiday?
Unemployment Rate in Lake Holiday is 7.1%.