East Dundee, IL Map & Demographics
East Dundee Map
East Dundee Overview
$59,855
PER CAPITA INCOME
$99,868
AVG FAMILY INCOME
$71,116
AVG HOUSEHOLD INCOME
46.0%
WAGE / INCOME GAP [ % ]
54.0¢/ $1
WAGE / INCOME GAP [ $ ]
0.57
INEQUALITY / GINI INDEX
3,157
TOTAL POPULATION
1,424
MALE POPULATION
1,733
FEMALE POPULATION
82.17
MALES / 100 FEMALES
121.70
FEMALES / 100 MALES
54.4
MEDIAN AGE
2.6
AVG FAMILY SIZE
2.0
AVG HOUSEHOLD SIZE
1,935
LABOR FORCE [ PEOPLE ]
66.2%
PERCENT IN LABOR FORCE
2.1%
UNEMPLOYMENT RATE
Income in East Dundee
Income Overview in East Dundee
Per Capita Income in East Dundee is $59,855, while median incomes of families and households are $99,868 and $71,116 respectively.
| Characteristic | Number | Measure |
| Per Capita Income | 3,157 | $59,855 |
| Median Family Income | 912 | $99,868 |
| Mean Family Income | 912 | $163,441 |
| Median Household Income | 1,595 | $71,116 |
| Mean Household Income | 1,595 | $117,684 |
| Income Deficit | 912 | $0 |
| Wage / Income Gap (%) | 3,157 | 46.01% |
| Wage / Income Gap ($) | 3,157 | 53.99¢ per $1 |
| Gini / Inequality Index | 3,157 | 0.57 |
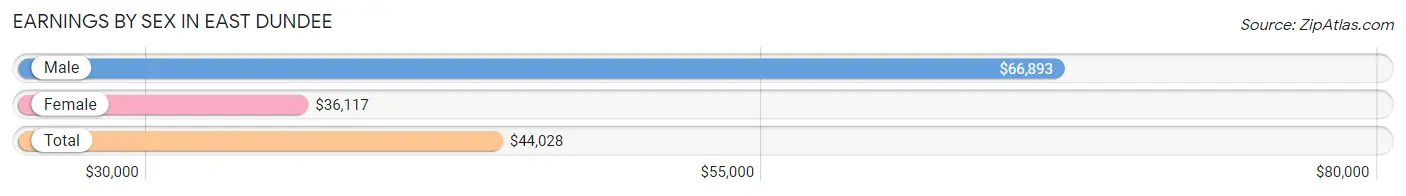
Earnings by Sex in East Dundee
Average Earnings in East Dundee are $44,028, $66,893 for men and $36,117 for women, a difference of 46.0%.
| Sex | Number | Average Earnings |
| Male | 847 (43.8%) | $66,893 |
| Female | 1,086 (56.2%) | $36,117 |
| Total | 1,933 (100.0%) | $44,028 |
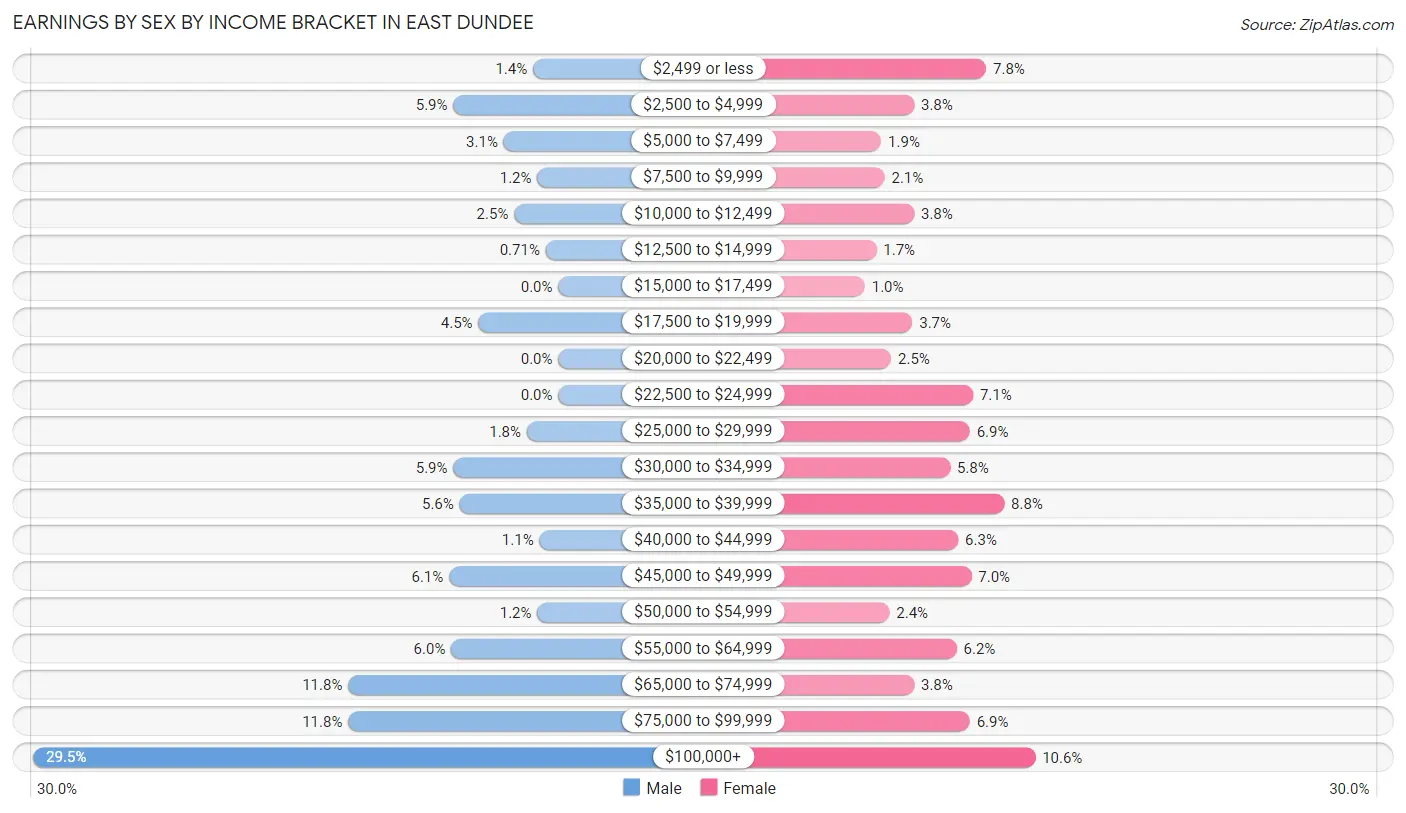
Earnings by Sex by Income Bracket in East Dundee
The most common earnings brackets in East Dundee are $100,000+ for men (250 | 29.5%) and $100,000+ for women (115 | 10.6%).
| Income | Male | Female |
| $2,499 or less | 12 (1.4%) | 85 (7.8%) |
| $2,500 to $4,999 | 50 (5.9%) | 41 (3.8%) |
| $5,000 to $7,499 | 26 (3.1%) | 21 (1.9%) |
| $7,500 to $9,999 | 10 (1.2%) | 23 (2.1%) |
| $10,000 to $12,499 | 21 (2.5%) | 41 (3.8%) |
| $12,500 to $14,999 | 6 (0.7%) | 18 (1.7%) |
| $15,000 to $17,499 | 0 (0.0%) | 11 (1.0%) |
| $17,500 to $19,999 | 38 (4.5%) | 40 (3.7%) |
| $20,000 to $22,499 | 0 (0.0%) | 27 (2.5%) |
| $22,500 to $24,999 | 0 (0.0%) | 77 (7.1%) |
| $25,000 to $29,999 | 15 (1.8%) | 75 (6.9%) |
| $30,000 to $34,999 | 50 (5.9%) | 63 (5.8%) |
| $35,000 to $39,999 | 47 (5.6%) | 96 (8.8%) |
| $40,000 to $44,999 | 9 (1.1%) | 68 (6.3%) |
| $45,000 to $49,999 | 52 (6.1%) | 76 (7.0%) |
| $50,000 to $54,999 | 10 (1.2%) | 26 (2.4%) |
| $55,000 to $64,999 | 51 (6.0%) | 67 (6.2%) |
| $65,000 to $74,999 | 100 (11.8%) | 41 (3.8%) |
| $75,000 to $99,999 | 100 (11.8%) | 75 (6.9%) |
| $100,000+ | 250 (29.5%) | 115 (10.6%) |
| Total | 847 (100.0%) | 1,086 (100.0%) |
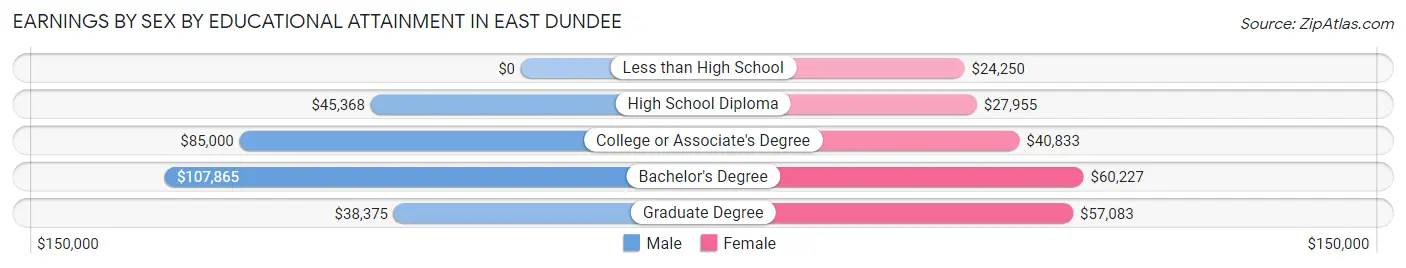
Earnings by Sex by Educational Attainment in East Dundee
Average earnings in East Dundee are $68,611 for men and $41,780 for women, a difference of 39.1%. Men with an educational attainment of bachelor's degree enjoy the highest average annual earnings of $107,865, while those with graduate degree education earn the least with $38,375. Women with an educational attainment of bachelor's degree earn the most with the average annual earnings of $60,227, while those with less than high school education have the smallest earnings of $24,250.
| Educational Attainment | Male Income | Female Income |
| Less than High School | - | - |
| High School Diploma | $45,368 | $27,955 |
| College or Associate's Degree | $85,000 | $40,833 |
| Bachelor's Degree | $107,865 | $60,227 |
| Graduate Degree | $38,375 | $57,083 |
| Total | $68,611 | $41,780 |
Family Income in East Dundee
Family Income Brackets in East Dundee
According to the East Dundee family income data, there are 195 families falling into the $100,000 to $149,999 income range, which is the most common income bracket and makes up 21.4% of all families. Conversely, the $25,000 to $34,999 income bracket is the least frequent group with only 13 families (1.4%) belonging to this category.
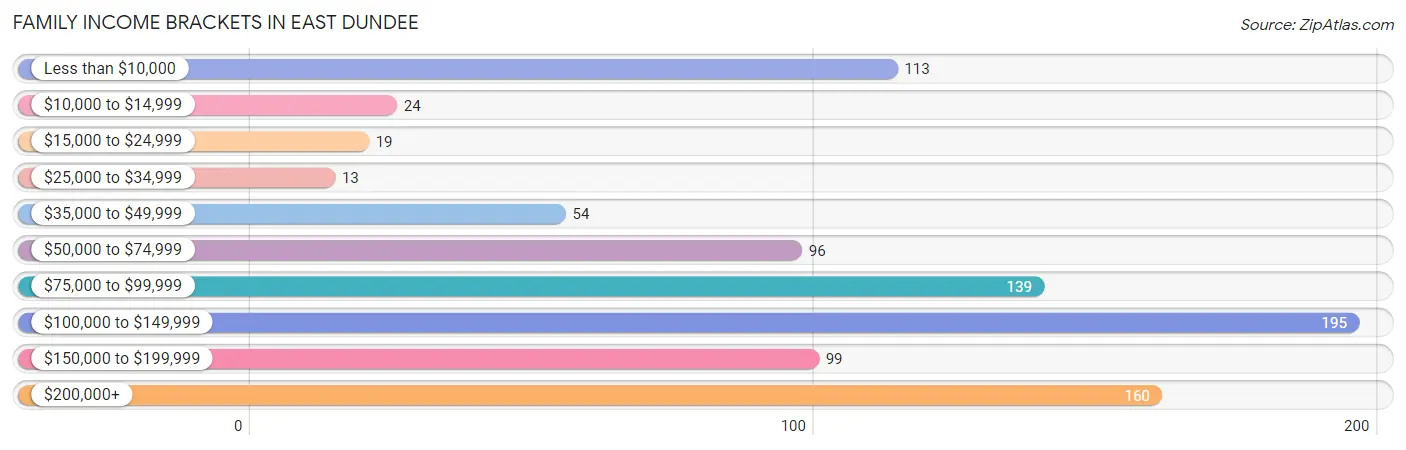
| Income Bracket | # Families | % Families |
| Less than $10,000 | 113 | 12.4% |
| $10,000 to $14,999 | 24 | 2.6% |
| $15,000 to $24,999 | 19 | 2.1% |
| $25,000 to $34,999 | 13 | 1.4% |
| $35,000 to $49,999 | 54 | 5.9% |
| $50,000 to $74,999 | 96 | 10.5% |
| $75,000 to $99,999 | 139 | 15.2% |
| $100,000 to $149,999 | 195 | 21.4% |
| $150,000 to $199,999 | 99 | 10.9% |
| $200,000+ | 160 | 17.5% |
Family Income by Famaliy Size in East Dundee
5-person families (47 | 5.1%) account for the highest median family income in East Dundee with $159,676 per family, while 2-person families (527 | 57.8%) have the highest median income of $43,920 per family member.
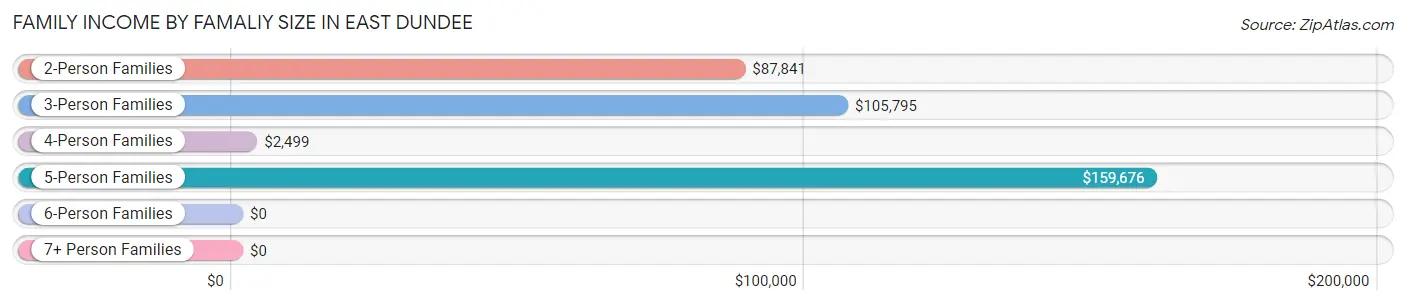
| Income Bracket | # Families | Median Income |
| 2-Person Families | 527 (57.8%) | $87,841 |
| 3-Person Families | 193 (21.2%) | $105,795 |
| 4-Person Families | 139 (15.2%) | $2,499 |
| 5-Person Families | 47 (5.1%) | $159,676 |
| 6-Person Families | 6 (0.7%) | $0 |
| 7+ Person Families | 0 (0.0%) | $0 |
| Total | 912 (100.0%) | $99,868 |
Family Income by Number of Earners in East Dundee
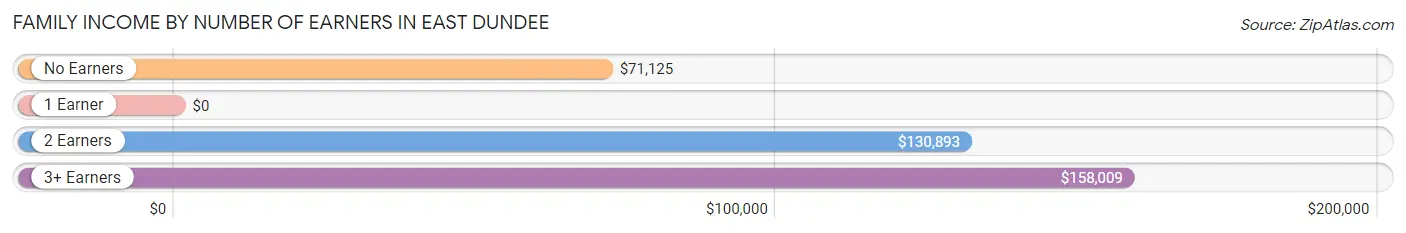
| Number of Earners | # Families | Median Income |
| No Earners | 147 (16.1%) | $71,125 |
| 1 Earner | 251 (27.5%) | $0 |
| 2 Earners | 329 (36.1%) | $130,893 |
| 3+ Earners | 185 (20.3%) | $158,009 |
| Total | 912 (100.0%) | $99,868 |
Household Income in East Dundee
Household Income Brackets in East Dundee
With 247 households falling in the category, the $100,000 to $149,999 income range is the most frequent in East Dundee, accounting for 15.5% of all households. In contrast, only 24 households (1.5%) fall into the $10,000 to $14,999 income bracket, making it the least populous group.
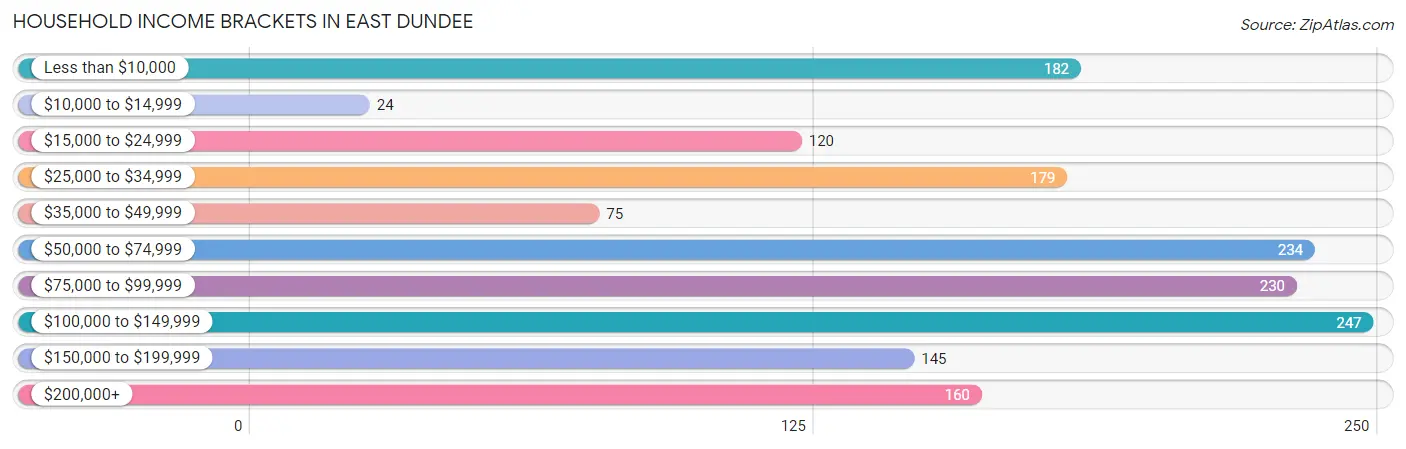
| Income Bracket | # Households | % Households |
| Less than $10,000 | 182 | 11.4% |
| $10,000 to $14,999 | 24 | 1.5% |
| $15,000 to $24,999 | 120 | 7.5% |
| $25,000 to $34,999 | 179 | 11.2% |
| $35,000 to $49,999 | 75 | 4.7% |
| $50,000 to $74,999 | 234 | 14.7% |
| $75,000 to $99,999 | 230 | 14.4% |
| $100,000 to $149,999 | 247 | 15.5% |
| $150,000 to $199,999 | 145 | 9.1% |
| $200,000+ | 160 | 10.0% |
Household Income by Householder Age in East Dundee
The median household income in East Dundee is $71,116, with the highest median household income of $111,719 found in the 45 to 64 years age bracket for the primary householder. A total of 575 households (36.0%) fall into this category. Meanwhile, the 15 to 24 years age bracket for the primary householder has the lowest median household income of $0, with 91 households (5.7%) in this group.
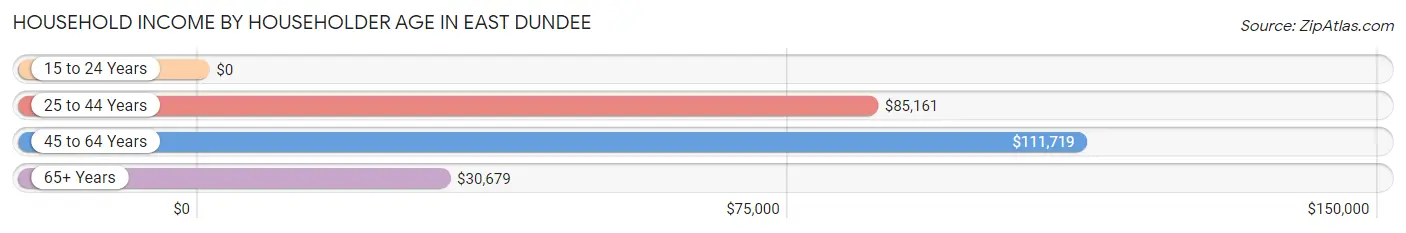
| Income Bracket | # Households | Median Income |
| 15 to 24 Years | 91 (5.7%) | $0 |
| 25 to 44 Years | 246 (15.4%) | $85,161 |
| 45 to 64 Years | 575 (36.0%) | $111,719 |
| 65+ Years | 683 (42.8%) | $30,679 |
| Total | 1,595 (100.0%) | $71,116 |
Poverty in East Dundee
Income Below Poverty by Sex and Age in East Dundee
With 17.2% poverty level for males and 11.3% for females among the residents of East Dundee, under 5 year old males and 18 to 24 year old females are the most vulnerable to poverty, with 47 males (95.9%) and 74 females (31.9%) in their respective age groups living below the poverty level.
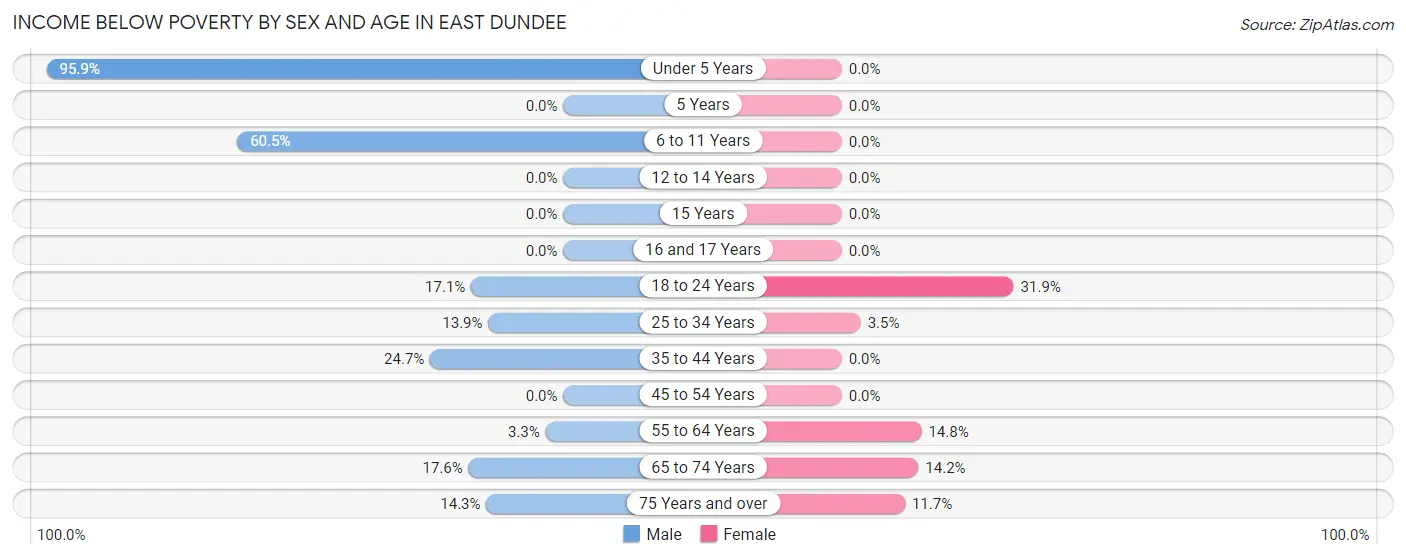
| Age Bracket | Male | Female |
| Under 5 Years | 47 (95.9%) | 0 (0.0%) |
| 5 Years | 0 (0.0%) | 0 (0.0%) |
| 6 to 11 Years | 46 (60.5%) | 0 (0.0%) |
| 12 to 14 Years | 0 (0.0%) | 0 (0.0%) |
| 15 Years | 0 (0.0%) | 0 (0.0%) |
| 16 and 17 Years | 0 (0.0%) | 0 (0.0%) |
| 18 to 24 Years | 13 (17.1%) | 74 (31.9%) |
| 25 to 34 Years | 22 (13.9%) | 8 (3.5%) |
| 35 to 44 Years | 44 (24.7%) | 0 (0.0%) |
| 45 to 54 Years | 0 (0.0%) | 0 (0.0%) |
| 55 to 64 Years | 10 (3.3%) | 42 (14.8%) |
| 65 to 74 Years | 48 (17.6%) | 31 (14.2%) |
| 75 Years and over | 15 (14.3%) | 40 (11.7%) |
| Total | 245 (17.2%) | 195 (11.3%) |
Income Above Poverty by Sex and Age in East Dundee
According to the poverty statistics in East Dundee, males aged 12 to 14 years and females aged under 5 years are the age groups that are most secure financially, with 100.0% of males and 100.0% of females in these age groups living above the poverty line.
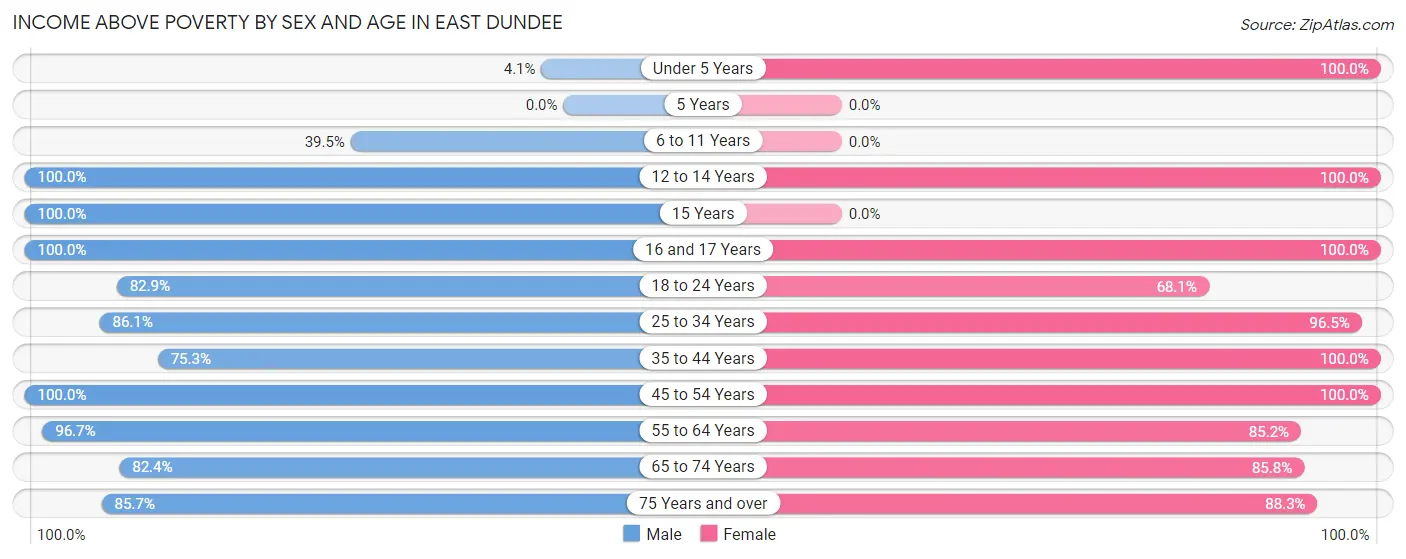
| Age Bracket | Male | Female |
| Under 5 Years | 2 (4.1%) | 58 (100.0%) |
| 5 Years | 0 (0.0%) | 0 (0.0%) |
| 6 to 11 Years | 30 (39.5%) | 0 (0.0%) |
| 12 to 14 Years | 33 (100.0%) | 9 (100.0%) |
| 15 Years | 9 (100.0%) | 0 (0.0%) |
| 16 and 17 Years | 10 (100.0%) | 22 (100.0%) |
| 18 to 24 Years | 63 (82.9%) | 158 (68.1%) |
| 25 to 34 Years | 136 (86.1%) | 220 (96.5%) |
| 35 to 44 Years | 134 (75.3%) | 98 (100.0%) |
| 45 to 54 Years | 153 (100.0%) | 243 (100.0%) |
| 55 to 64 Years | 294 (96.7%) | 242 (85.2%) |
| 65 to 74 Years | 225 (82.4%) | 187 (85.8%) |
| 75 Years and over | 90 (85.7%) | 301 (88.3%) |
| Total | 1,179 (82.8%) | 1,538 (88.7%) |
Income Below Poverty Among Married-Couple Families in East Dundee
The poverty statistics for married-couple families in East Dundee show that 3.9% or 24 of the total 622 families live below the poverty line. Families with no children have the highest poverty rate of 4.8%, comprising of 24 families. On the other hand, families with 1 or 2 children have the lowest poverty rate of 0.0%, which includes 0 families.
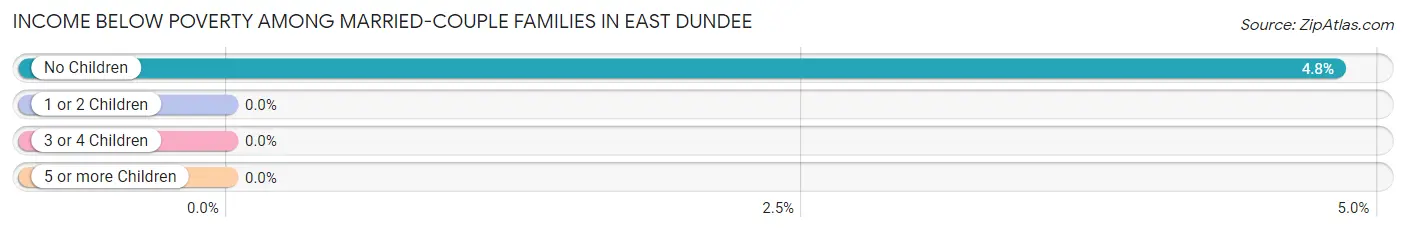
| Children | Above Poverty | Below Poverty |
| No Children | 474 (95.2%) | 24 (4.8%) |
| 1 or 2 Children | 124 (100.0%) | 0 (0.0%) |
| 3 or 4 Children | 0 (0.0%) | 0 (0.0%) |
| 5 or more Children | 0 (0.0%) | 0 (0.0%) |
| Total | 598 (96.1%) | 24 (3.9%) |
Income Below Poverty Among Single-Parent Households in East Dundee
According to the poverty data in East Dundee, 48.7% or 39 single-father households and 35.2% or 74 single-mother households are living below the poverty line. Among single-father households, those with no children have the highest poverty rate, with 39 households (48.7%) experiencing poverty. Likewise, among single-mother households, those with 1 or 2 children have the highest poverty rate, with 74 households (79.6%) falling below the poverty line.
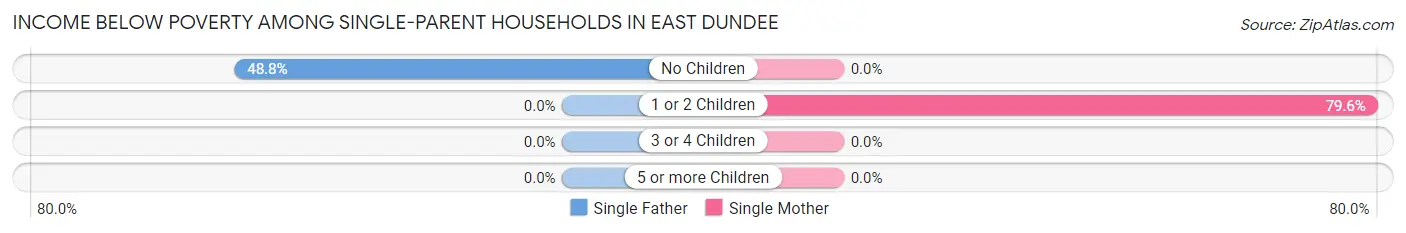
| Children | Single Father | Single Mother |
| No Children | 39 (48.7%) | 0 (0.0%) |
| 1 or 2 Children | 0 (0.0%) | 74 (79.6%) |
| 3 or 4 Children | 0 (0.0%) | 0 (0.0%) |
| 5 or more Children | 0 (0.0%) | 0 (0.0%) |
| Total | 39 (48.7%) | 74 (35.2%) |
Income Below Poverty Among Married-Couple vs Single-Parent Households in East Dundee
The poverty data for East Dundee shows that 24 of the married-couple family households (3.9%) and 113 of the single-parent households (39.0%) are living below the poverty level. Within the married-couple family households, those with no children have the highest poverty rate, with 24 households (4.8%) falling below the poverty line. Among the single-parent households, those with 1 or 2 children have the highest poverty rate, with 74 household (79.6%) living below poverty.
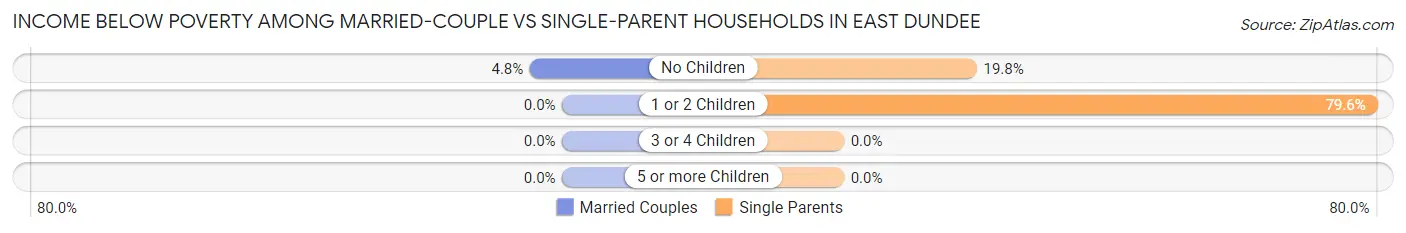
| Children | Married-Couple Families | Single-Parent Households |
| No Children | 24 (4.8%) | 39 (19.8%) |
| 1 or 2 Children | 0 (0.0%) | 74 (79.6%) |
| 3 or 4 Children | 0 (0.0%) | 0 (0.0%) |
| 5 or more Children | 0 (0.0%) | 0 (0.0%) |
| Total | 24 (3.9%) | 113 (39.0%) |
Race in East Dundee
The most populous races in East Dundee are White / Caucasian (2,341 | 74.2%), Hispanic or Latino (423 | 13.4%), and Some other Race (351 | 11.1%).
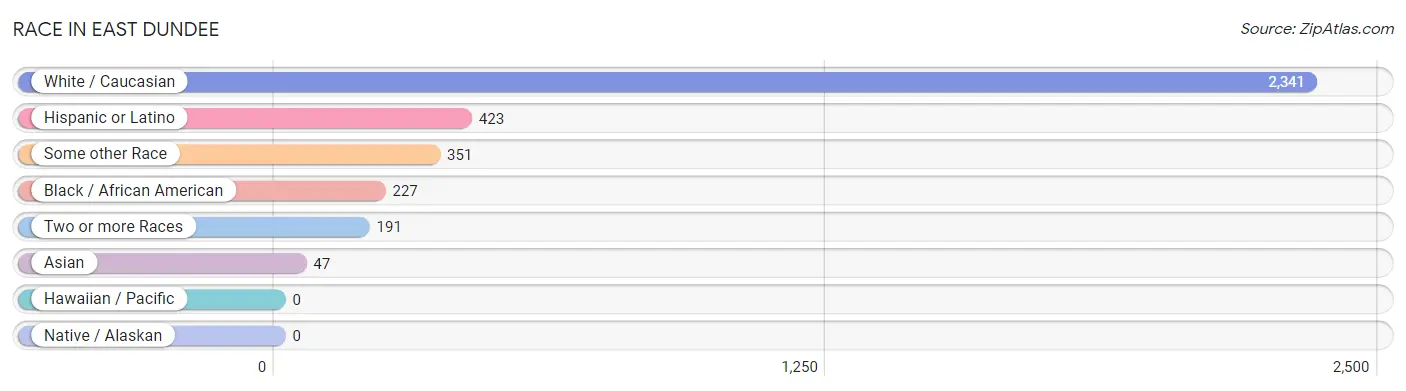
| Race | # Population | % Population |
| Asian | 47 | 1.5% |
| Black / African American | 227 | 7.2% |
| Hawaiian / Pacific | 0 | 0.0% |
| Hispanic or Latino | 423 | 13.4% |
| Native / Alaskan | 0 | 0.0% |
| White / Caucasian | 2,341 | 74.2% |
| Two or more Races | 191 | 6.0% |
| Some other Race | 351 | 11.1% |
| Total | 3,157 | 100.0% |
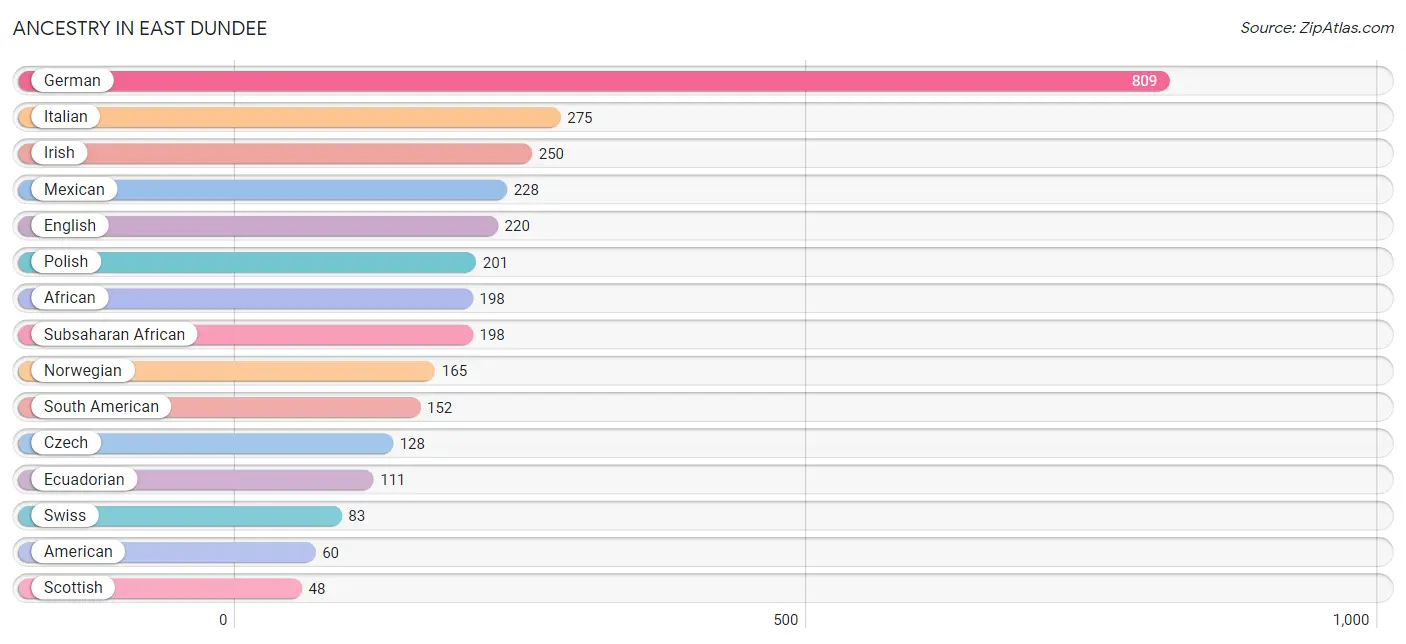
Ancestry in East Dundee
The most populous ancestries reported in East Dundee are German (809 | 25.6%), Italian (275 | 8.7%), Irish (250 | 7.9%), Mexican (228 | 7.2%), and English (220 | 7.0%), together accounting for 56.5% of all East Dundee residents.
| Ancestry | # Population | % Population |
| African | 198 | 6.3% |
| American | 60 | 1.9% |
| Arab | 8 | 0.3% |
| Armenian | 23 | 0.7% |
| Austrian | 33 | 1.1% |
| Belgian | 11 | 0.4% |
| Bolivian | 27 | 0.9% |
| Canadian | 11 | 0.4% |
| Celtic | 10 | 0.3% |
| Cherokee | 23 | 0.7% |
| Colombian | 14 | 0.4% |
| Cuban | 35 | 1.1% |
| Czech | 128 | 4.1% |
| Czechoslovakian | 33 | 1.1% |
| Danish | 29 | 0.9% |
| Dutch | 23 | 0.7% |
| Eastern European | 37 | 1.2% |
| Ecuadorian | 111 | 3.5% |
| English | 220 | 7.0% |
| European | 36 | 1.1% |
| French | 36 | 1.1% |
| German | 809 | 25.6% |
| Indian (Asian) | 12 | 0.4% |
| Iranian | 8 | 0.3% |
| Irish | 250 | 7.9% |
| Italian | 275 | 8.7% |
| Latvian | 8 | 0.3% |
| Mexican | 228 | 7.2% |
| Mongolian | 12 | 0.4% |
| Norwegian | 165 | 5.2% |
| Polish | 201 | 6.4% |
| Portuguese | 10 | 0.3% |
| Scottish | 48 | 1.5% |
| Slovak | 26 | 0.8% |
| South American | 152 | 4.8% |
| Subsaharan African | 198 | 6.3% |
| Swedish | 43 | 1.4% |
| Swiss | 83 | 2.6% |
| Thai | 12 | 0.4% |
| Turkish | 31 | 1.0% |
| Ukrainian | 29 | 0.9% |
| Welsh | 11 | 0.4% | View All 42 Rows |
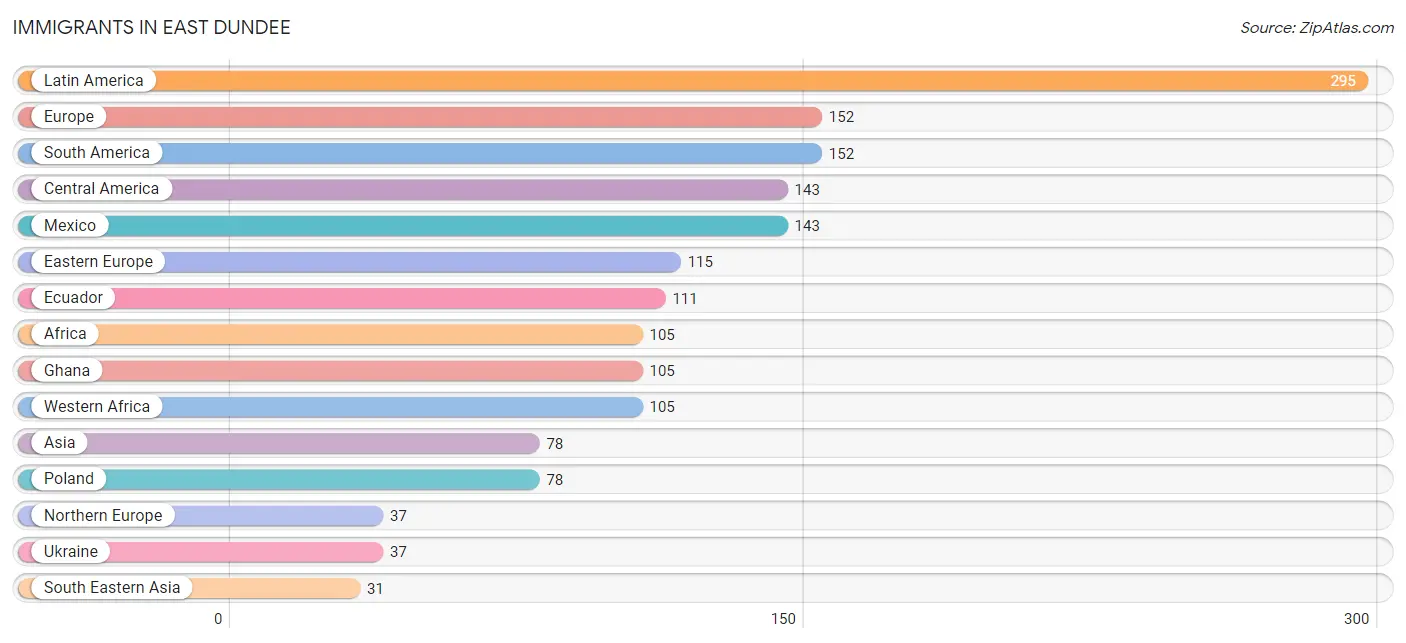
Immigrants in East Dundee
The most numerous immigrant groups reported in East Dundee came from Latin America (295 | 9.3%), Europe (152 | 4.8%), South America (152 | 4.8%), Central America (143 | 4.5%), and Mexico (143 | 4.5%), together accounting for 28.0% of all East Dundee residents.
| Immigration Origin | # Population | % Population |
| Africa | 105 | 3.3% |
| Asia | 78 | 2.5% |
| Bangladesh | 16 | 0.5% |
| Bolivia | 27 | 0.9% |
| Central America | 143 | 4.5% |
| Colombia | 14 | 0.4% |
| Eastern Europe | 115 | 3.6% |
| Ecuador | 111 | 3.5% |
| Europe | 152 | 4.8% |
| Ghana | 105 | 3.3% |
| Latin America | 295 | 9.3% |
| Malaysia | 12 | 0.4% |
| Mexico | 143 | 4.5% |
| Northern Europe | 37 | 1.2% |
| Norway | 7 | 0.2% |
| Philippines | 7 | 0.2% |
| Poland | 78 | 2.5% |
| Scotland | 30 | 0.9% |
| Singapore | 12 | 0.4% |
| South America | 152 | 4.8% |
| South Central Asia | 16 | 0.5% |
| South Eastern Asia | 31 | 1.0% |
| Turkey | 31 | 1.0% |
| Ukraine | 37 | 1.2% |
| Western Africa | 105 | 3.3% |
| Western Asia | 31 | 1.0% | View All 26 Rows |
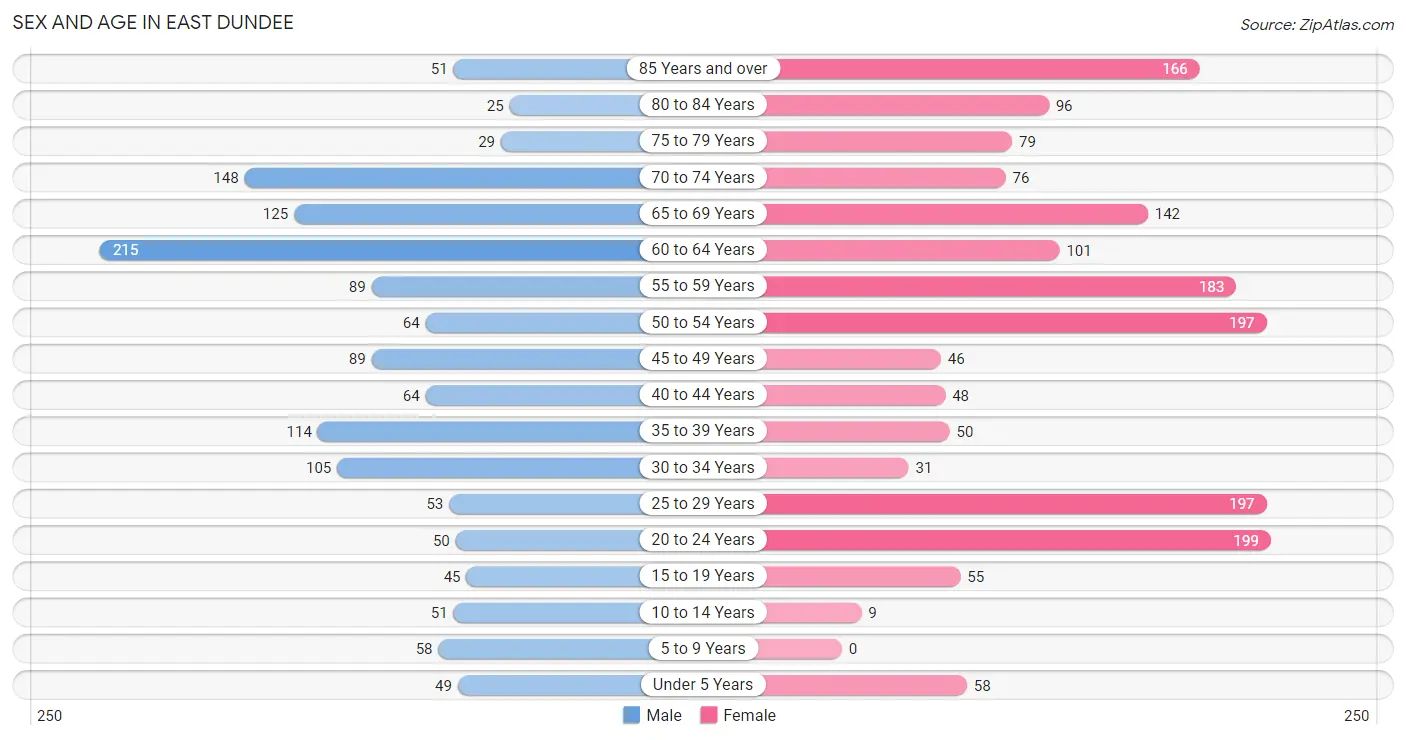
Sex and Age in East Dundee
Sex and Age in East Dundee
The most populous age groups in East Dundee are 60 to 64 Years (215 | 15.1%) for men and 20 to 24 Years (199 | 11.5%) for women.
| Age Bracket | Male | Female |
| Under 5 Years | 49 (3.4%) | 58 (3.4%) |
| 5 to 9 Years | 58 (4.1%) | 0 (0.0%) |
| 10 to 14 Years | 51 (3.6%) | 9 (0.5%) |
| 15 to 19 Years | 45 (3.2%) | 55 (3.2%) |
| 20 to 24 Years | 50 (3.5%) | 199 (11.5%) |
| 25 to 29 Years | 53 (3.7%) | 197 (11.4%) |
| 30 to 34 Years | 105 (7.4%) | 31 (1.8%) |
| 35 to 39 Years | 114 (8.0%) | 50 (2.9%) |
| 40 to 44 Years | 64 (4.5%) | 48 (2.8%) |
| 45 to 49 Years | 89 (6.2%) | 46 (2.6%) |
| 50 to 54 Years | 64 (4.5%) | 197 (11.4%) |
| 55 to 59 Years | 89 (6.2%) | 183 (10.6%) |
| 60 to 64 Years | 215 (15.1%) | 101 (5.8%) |
| 65 to 69 Years | 125 (8.8%) | 142 (8.2%) |
| 70 to 74 Years | 148 (10.4%) | 76 (4.4%) |
| 75 to 79 Years | 29 (2.0%) | 79 (4.6%) |
| 80 to 84 Years | 25 (1.8%) | 96 (5.5%) |
| 85 Years and over | 51 (3.6%) | 166 (9.6%) |
| Total | 1,424 (100.0%) | 1,733 (100.0%) |
Families and Households in East Dundee
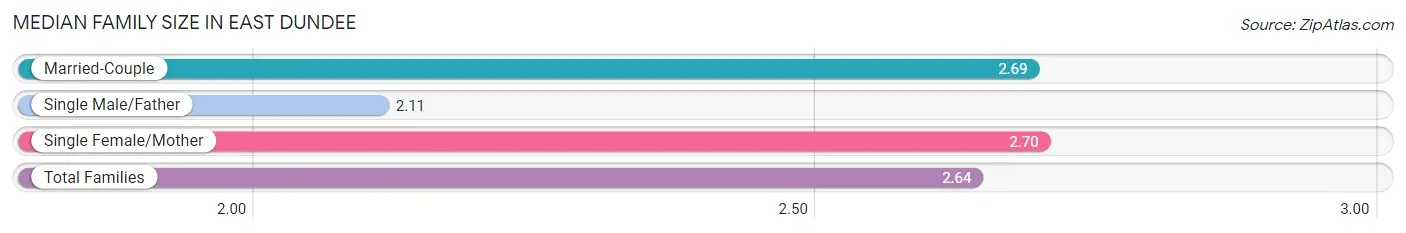
Median Family Size in East Dundee
The median family size in East Dundee is 2.64 persons per family, with single female/mother families (210 | 23.0%) accounting for the largest median family size of 2.7 persons per family. On the other hand, single male/father families (80 | 8.8%) represent the smallest median family size with 2.11 persons per family.
| Family Type | # Families | Family Size |
| Married-Couple | 622 (68.2%) | 2.69 |
| Single Male/Father | 80 (8.8%) | 2.11 |
| Single Female/Mother | 210 (23.0%) | 2.70 |
| Total Families | 912 (100.0%) | 2.64 |
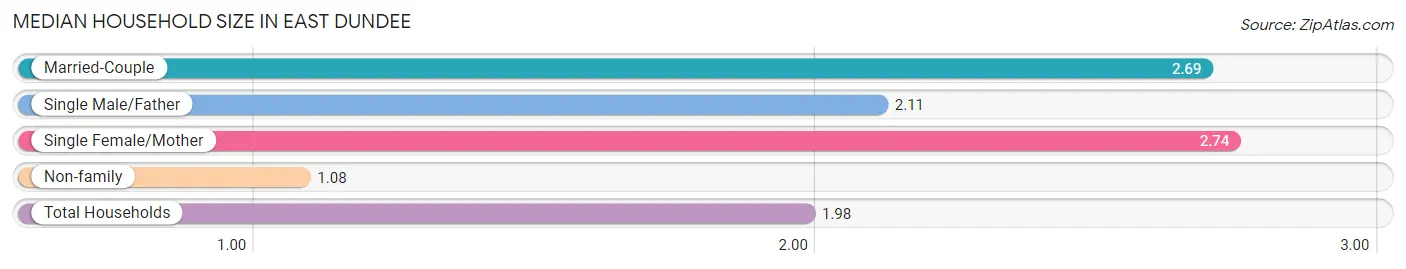
Median Household Size in East Dundee
The median household size in East Dundee is 1.98 persons per household, with single female/mother households (210 | 13.2%) accounting for the largest median household size of 2.74 persons per household. non-family households (683 | 42.8%) represent the smallest median household size with 1.08 persons per household.
| Household Type | # Households | Household Size |
| Married-Couple | 622 (39.0%) | 2.69 |
| Single Male/Father | 80 (5.0%) | 2.11 |
| Single Female/Mother | 210 (13.2%) | 2.74 |
| Non-family | 683 (42.8%) | 1.08 |
| Total Households | 1,595 (100.0%) | 1.98 |
Household Size by Marriage Status in East Dundee
Out of a total of 1,595 households in East Dundee, 912 (57.2%) are family households, while 683 (42.8%) are nonfamily households. The most numerous type of family households are 2-person households, comprising 527, and the most common type of nonfamily households are 1-person households, comprising 619.
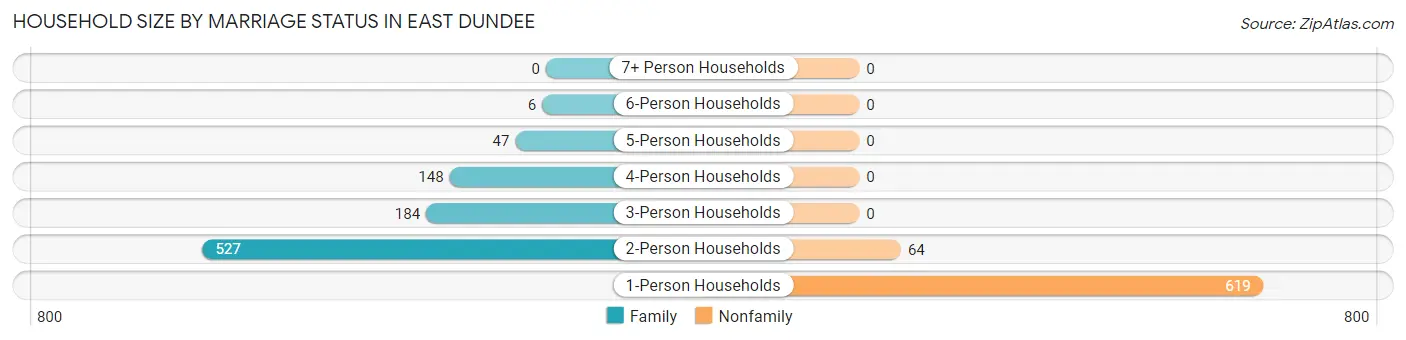
| Household Size | Family Households | Nonfamily Households |
| 1-Person Households | - | 619 (38.8%) |
| 2-Person Households | 527 (33.0%) | 64 (4.0%) |
| 3-Person Households | 184 (11.5%) | 0 (0.0%) |
| 4-Person Households | 148 (9.3%) | 0 (0.0%) |
| 5-Person Households | 47 (2.9%) | 0 (0.0%) |
| 6-Person Households | 6 (0.4%) | 0 (0.0%) |
| 7+ Person Households | 0 (0.0%) | 0 (0.0%) |
| Total | 912 (57.2%) | 683 (42.8%) |
Female Fertility in East Dundee
Fertility by Age in East Dundee
Average fertility rate in East Dundee is 14.0 births per 1,000 women. Women in the age bracket of 20 to 34 years have the highest fertility rate with 21.0 births per 1,000 women. Women in the age bracket of 20 to 34 years acount for 100.0% of all women with births.
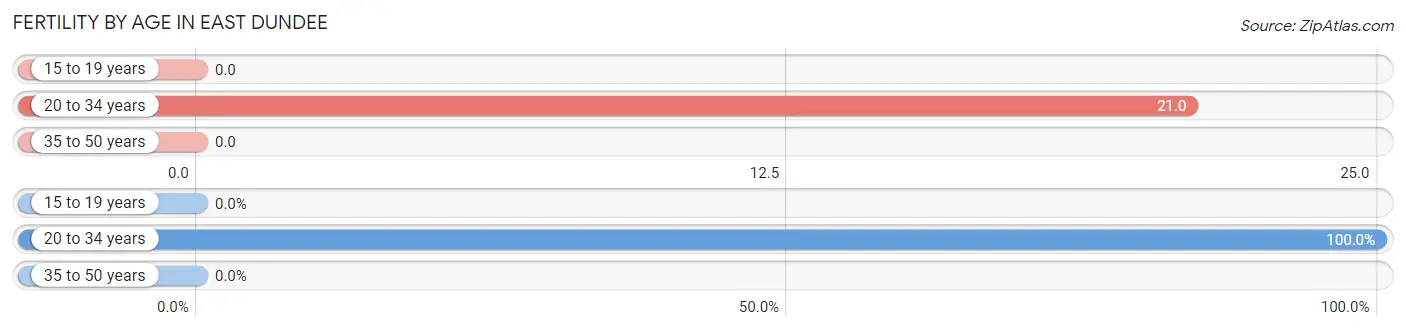
| Age Bracket | Women with Births | Births / 1,000 Women |
| 15 to 19 years | 0 (0.0%) | 0.0 |
| 20 to 34 years | 9 (100.0%) | 21.0 |
| 35 to 50 years | 0 (0.0%) | 0.0 |
| Total | 9 (100.0%) | 14.0 |
Fertility by Age by Marriage Status in East Dundee
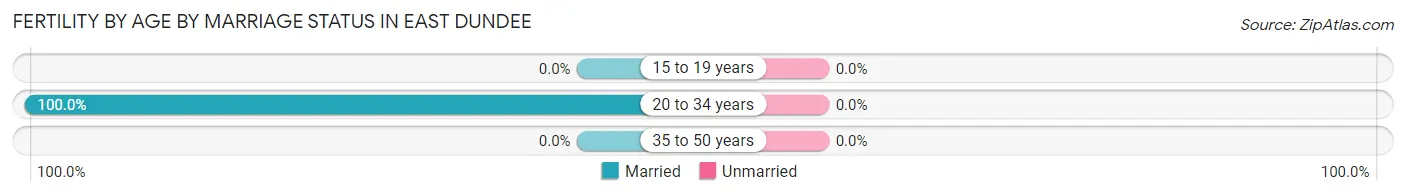
| Age Bracket | Married | Unmarried |
| 15 to 19 years | 0 (0.0%) | 0 (0.0%) |
| 20 to 34 years | 9 (100.0%) | 0 (0.0%) |
| 35 to 50 years | 0 (0.0%) | 0 (0.0%) |
| Total | 9 (100.0%) | 0 (0.0%) |
Fertility by Education in East Dundee
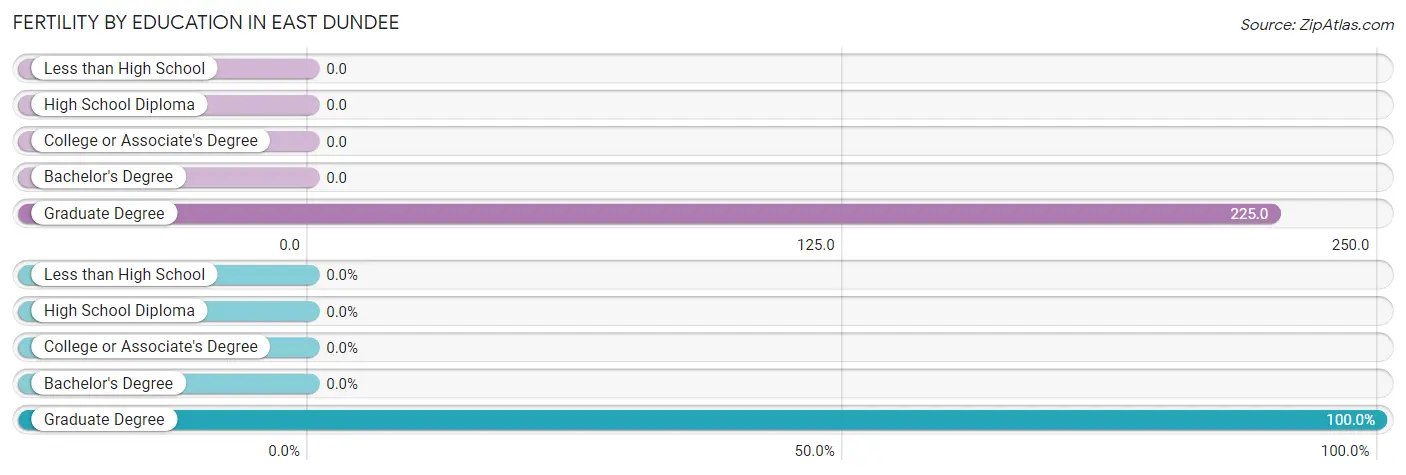
| Educational Attainment | Women with Births | Births / 1,000 Women |
| Less than High School | 0 (0.0%) | 0.0 |
| High School Diploma | 0 (0.0%) | 0.0 |
| College or Associate's Degree | 0 (0.0%) | 0.0 |
| Bachelor's Degree | 0 (0.0%) | 0.0 |
| Graduate Degree | 9 (100.0%) | 225.0 |
| Total | 9 (100.0%) | 14.0 |
Fertility by Education by Marriage Status in East Dundee
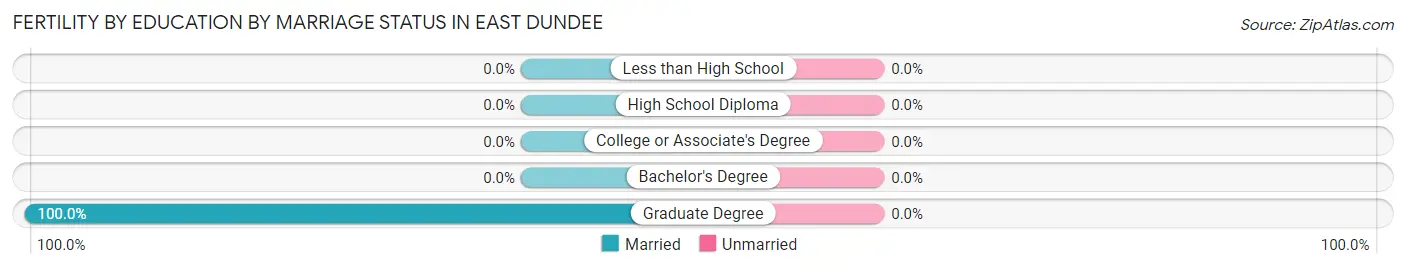
| Educational Attainment | Married | Unmarried |
| Less than High School | 0 (0.0%) | 0 (0.0%) |
| High School Diploma | 0 (0.0%) | 0 (0.0%) |
| College or Associate's Degree | 0 (0.0%) | 0 (0.0%) |
| Bachelor's Degree | 0 (0.0%) | 0 (0.0%) |
| Graduate Degree | 9 (100.0%) | 0 (0.0%) |
| Total | 9 (100.0%) | 0 (0.0%) |
Employment Characteristics in East Dundee
Employment by Class of Employer in East Dundee
Among the 1,840 employed individuals in East Dundee, private company employees (1,360 | 73.9%), local government employees (143 | 7.8%), and not-for-profit organizations (131 | 7.1%) make up the most common classes of employment.
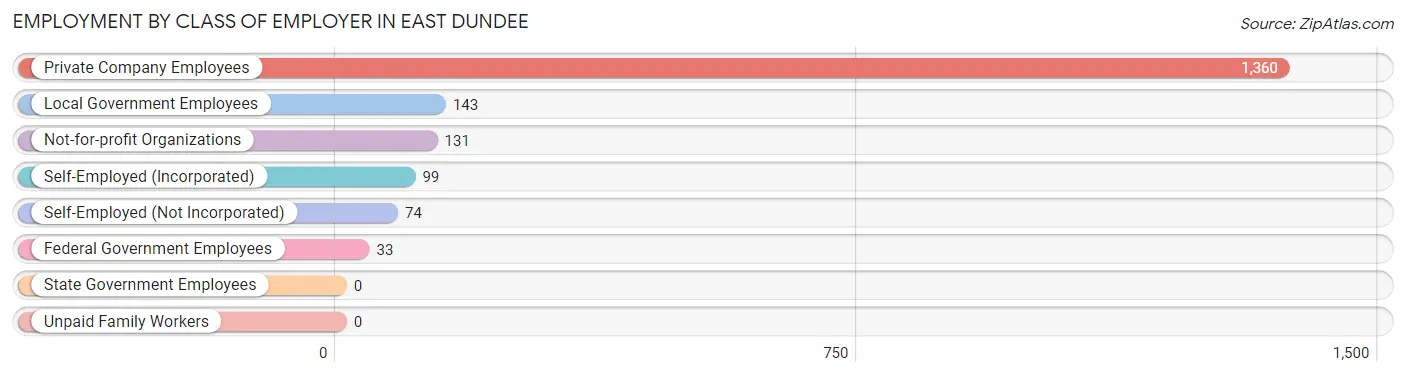
| Employer Class | # Employees | % Employees |
| Private Company Employees | 1,360 | 73.9% |
| Self-Employed (Incorporated) | 99 | 5.4% |
| Self-Employed (Not Incorporated) | 74 | 4.0% |
| Not-for-profit Organizations | 131 | 7.1% |
| Local Government Employees | 143 | 7.8% |
| State Government Employees | 0 | 0.0% |
| Federal Government Employees | 33 | 1.8% |
| Unpaid Family Workers | 0 | 0.0% |
| Total | 1,840 | 100.0% |
Employment Status by Age in East Dundee
According to the labor force statistics for East Dundee, out of the total population over 16 years of age (2,923), 66.2% or 1,935 individuals are in the labor force, with 2.1% or 41 of them unemployed. The age group with the highest labor force participation rate is 35 to 44 years, with 100.0% or 276 individuals in the labor force. Within the labor force, the 75 years and over age range has the highest percentage of unemployed individuals, with 26.5% or 13 of them being unemployed.
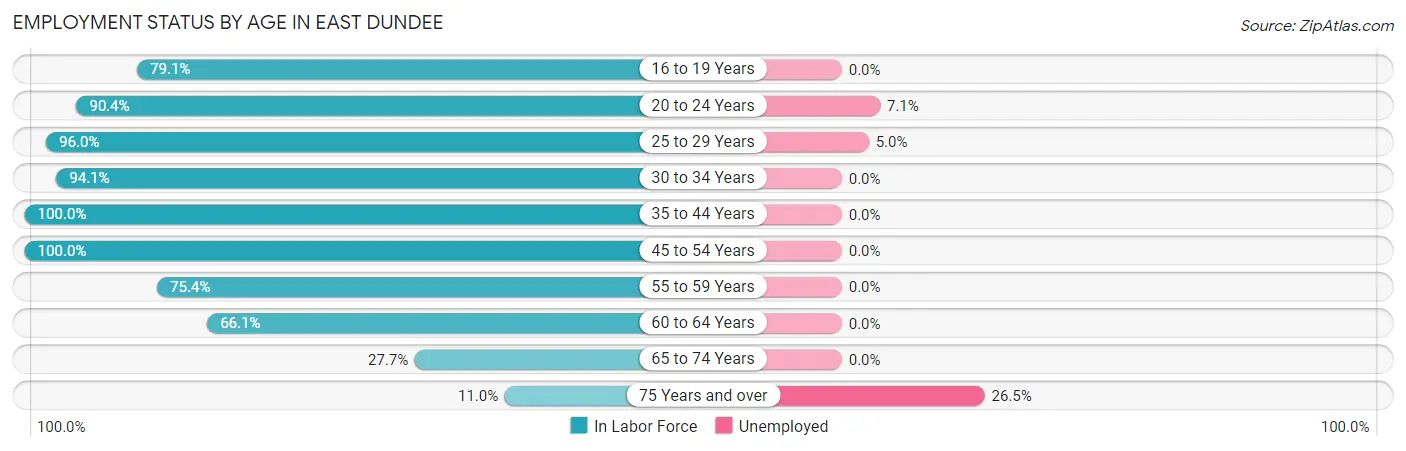
| Age Bracket | In Labor Force | Unemployed |
| 16 to 19 Years | 72 (79.1%) | 0 (0.0%) |
| 20 to 24 Years | 225 (90.4%) | 16 (7.1%) |
| 25 to 29 Years | 240 (96.0%) | 12 (5.0%) |
| 30 to 34 Years | 128 (94.1%) | 0 (0.0%) |
| 35 to 44 Years | 276 (100.0%) | 0 (0.0%) |
| 45 to 54 Years | 396 (100.0%) | 0 (0.0%) |
| 55 to 59 Years | 205 (75.4%) | 0 (0.0%) |
| 60 to 64 Years | 209 (66.1%) | 0 (0.0%) |
| 65 to 74 Years | 136 (27.7%) | 0 (0.0%) |
| 75 Years and over | 49 (11.0%) | 13 (26.5%) |
| Total | 1,935 (66.2%) | 41 (2.1%) |
Employment Status by Educational Attainment in East Dundee
According to labor force statistics for East Dundee, 88.3% of individuals (1,453) out of the total population between 25 and 64 years of age (1,646) are in the labor force, with 0.8% or 12 of them being unemployed. The group with the highest labor force participation rate are those with the educational attainment of bachelor's degree or higher, with 93.0% or 463 individuals in the labor force. Within the labor force, individuals with high school diploma education have the highest percentage of unemployment, with 3.1% or 12 of them being unemployed.
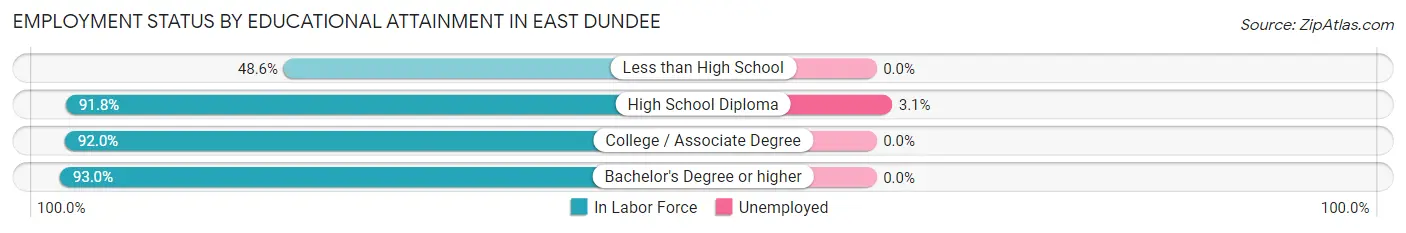
| Educational Attainment | In Labor Force | Unemployed |
| Less than High School | 72 (48.6%) | 0 (0.0%) |
| High School Diploma | 391 (91.8%) | 13 (3.1%) |
| College / Associate Degree | 528 (92.0%) | 0 (0.0%) |
| Bachelor's Degree or higher | 463 (93.0%) | 0 (0.0%) |
| Total | 1,453 (88.3%) | 13 (0.8%) |
Employment Occupations by Sex in East Dundee
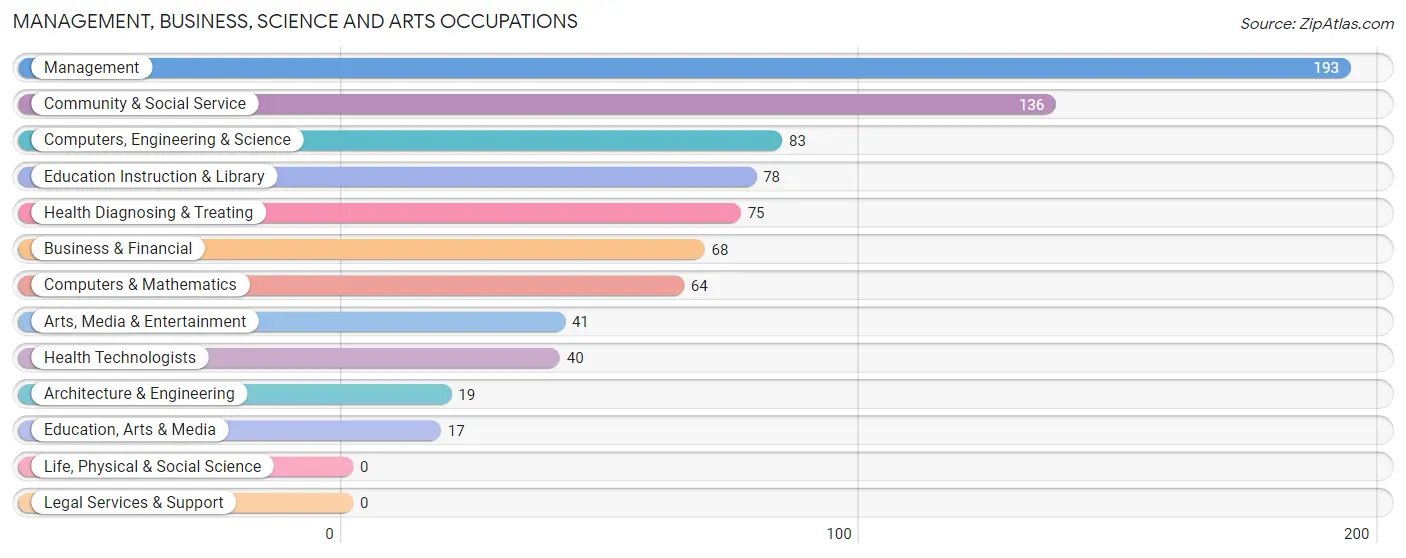
Management, Business, Science and Arts Occupations
The most common Management, Business, Science and Arts occupations in East Dundee are Management (193 | 10.2%), Community & Social Service (136 | 7.2%), Computers, Engineering & Science (83 | 4.4%), Education Instruction & Library (78 | 4.1%), and Health Diagnosing & Treating (75 | 4.0%).
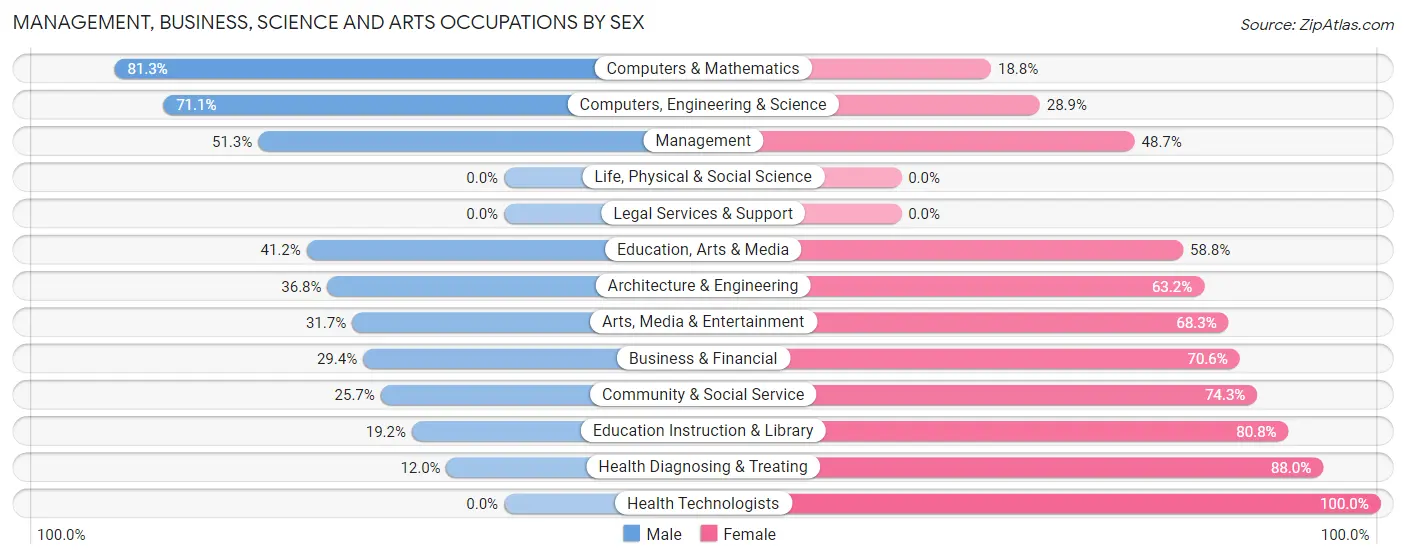
Management, Business, Science and Arts Occupations by Sex
Within the Management, Business, Science and Arts occupations in East Dundee, the most male-oriented occupations are Computers & Mathematics (81.2%), Computers, Engineering & Science (71.1%), and Management (51.3%), while the most female-oriented occupations are Health Technologists (100.0%), Health Diagnosing & Treating (88.0%), and Education Instruction & Library (80.8%).
| Occupation | Male | Female |
| Management | 99 (51.3%) | 94 (48.7%) |
| Business & Financial | 20 (29.4%) | 48 (70.6%) |
| Computers, Engineering & Science | 59 (71.1%) | 24 (28.9%) |
| Computers & Mathematics | 52 (81.2%) | 12 (18.8%) |
| Architecture & Engineering | 7 (36.8%) | 12 (63.2%) |
| Life, Physical & Social Science | 0 (0.0%) | 0 (0.0%) |
| Community & Social Service | 35 (25.7%) | 101 (74.3%) |
| Education, Arts & Media | 7 (41.2%) | 10 (58.8%) |
| Legal Services & Support | 0 (0.0%) | 0 (0.0%) |
| Education Instruction & Library | 15 (19.2%) | 63 (80.8%) |
| Arts, Media & Entertainment | 13 (31.7%) | 28 (68.3%) |
| Health Diagnosing & Treating | 9 (12.0%) | 66 (88.0%) |
| Health Technologists | 0 (0.0%) | 40 (100.0%) |
| Total (Category) | 222 (40.0%) | 333 (60.0%) |
| Total (Overall) | 825 (43.5%) | 1,070 (56.5%) |
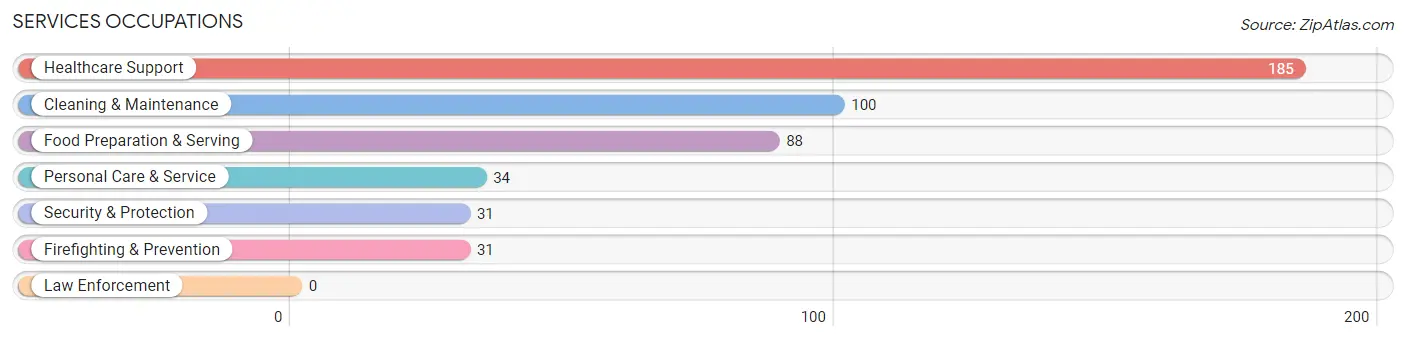
Services Occupations
The most common Services occupations in East Dundee are Healthcare Support (185 | 9.8%), Cleaning & Maintenance (100 | 5.3%), Food Preparation & Serving (88 | 4.6%), Personal Care & Service (34 | 1.8%), and Security & Protection (31 | 1.6%).
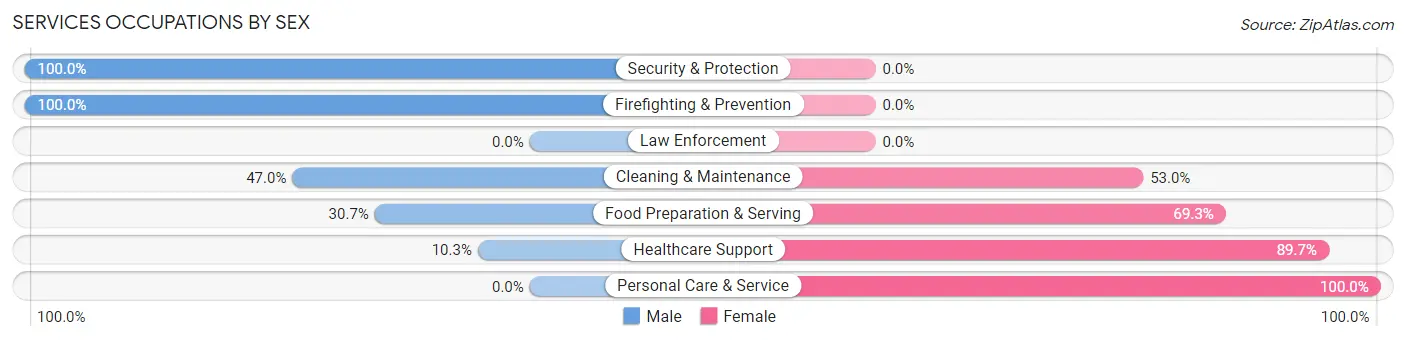
Services Occupations by Sex
Within the Services occupations in East Dundee, the most male-oriented occupations are Security & Protection (100.0%), Firefighting & Prevention (100.0%), and Cleaning & Maintenance (47.0%), while the most female-oriented occupations are Personal Care & Service (100.0%), Healthcare Support (89.7%), and Food Preparation & Serving (69.3%).
| Occupation | Male | Female |
| Healthcare Support | 19 (10.3%) | 166 (89.7%) |
| Security & Protection | 31 (100.0%) | 0 (0.0%) |
| Firefighting & Prevention | 31 (100.0%) | 0 (0.0%) |
| Law Enforcement | 0 (0.0%) | 0 (0.0%) |
| Food Preparation & Serving | 27 (30.7%) | 61 (69.3%) |
| Cleaning & Maintenance | 47 (47.0%) | 53 (53.0%) |
| Personal Care & Service | 0 (0.0%) | 34 (100.0%) |
| Total (Category) | 124 (28.3%) | 314 (71.7%) |
| Total (Overall) | 825 (43.5%) | 1,070 (56.5%) |
Sales and Office Occupations
The most common Sales and Office occupations in East Dundee are Sales & Related (335 | 17.7%), and Office & Administration (322 | 17.0%).

Sales and Office Occupations by Sex
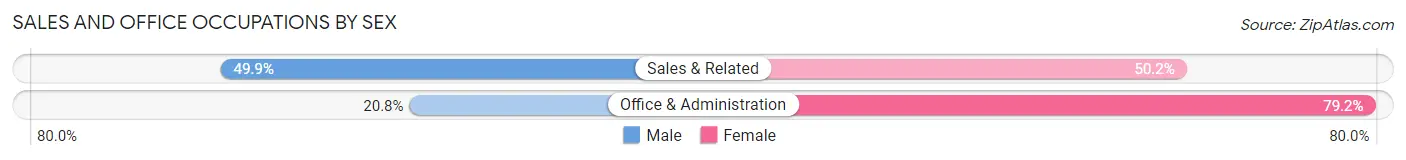
| Occupation | Male | Female |
| Sales & Related | 167 (49.8%) | 168 (50.1%) |
| Office & Administration | 67 (20.8%) | 255 (79.2%) |
| Total (Category) | 234 (35.6%) | 423 (64.4%) |
| Total (Overall) | 825 (43.5%) | 1,070 (56.5%) |
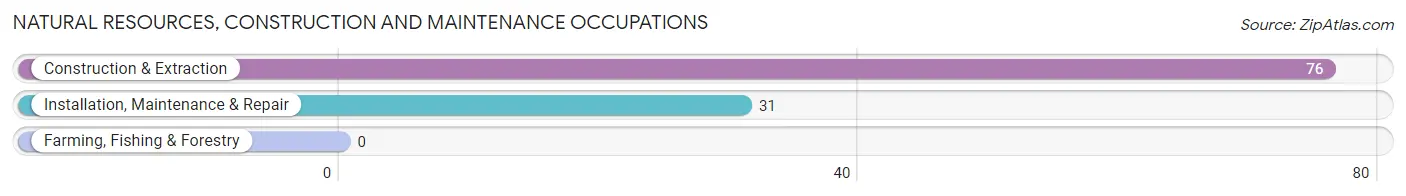
Natural Resources, Construction and Maintenance Occupations
The most common Natural Resources, Construction and Maintenance occupations in East Dundee are Construction & Extraction (76 | 4.0%), and Installation, Maintenance & Repair (31 | 1.6%).
Natural Resources, Construction and Maintenance Occupations by Sex
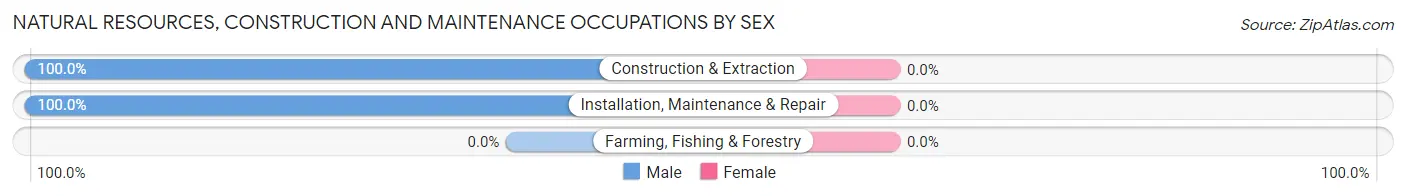
| Occupation | Male | Female |
| Farming, Fishing & Forestry | 0 (0.0%) | 0 (0.0%) |
| Construction & Extraction | 76 (100.0%) | 0 (0.0%) |
| Installation, Maintenance & Repair | 31 (100.0%) | 0 (0.0%) |
| Total (Category) | 107 (100.0%) | 0 (0.0%) |
| Total (Overall) | 825 (43.5%) | 1,070 (56.5%) |
Production, Transportation and Moving Occupations
The most common Production, Transportation and Moving occupations in East Dundee are Transportation (68 | 3.6%), Material Moving (38 | 2.0%), and Production (32 | 1.7%).
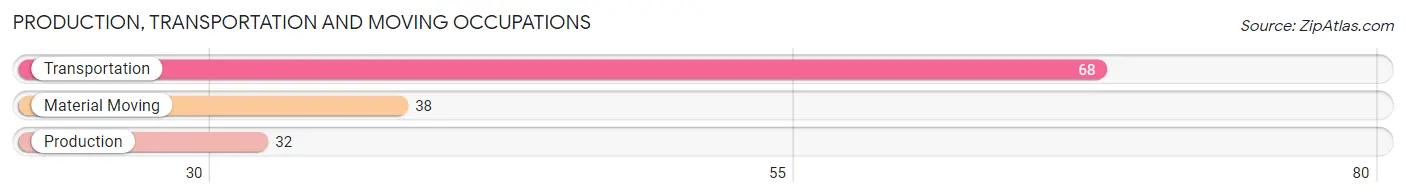
Production, Transportation and Moving Occupations by Sex
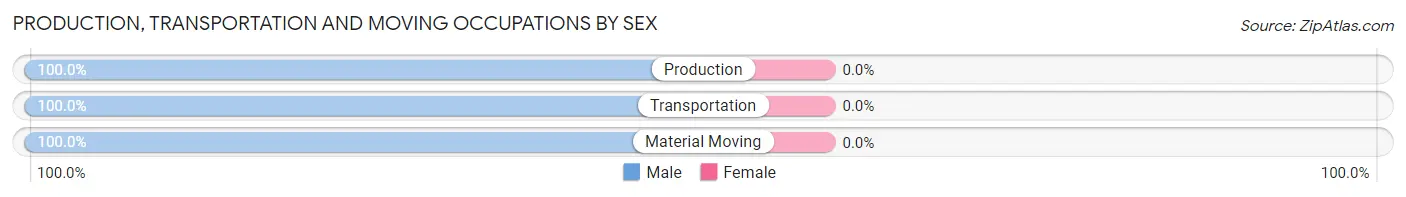
| Occupation | Male | Female |
| Production | 32 (100.0%) | 0 (0.0%) |
| Transportation | 68 (100.0%) | 0 (0.0%) |
| Material Moving | 38 (100.0%) | 0 (0.0%) |
| Total (Category) | 138 (100.0%) | 0 (0.0%) |
| Total (Overall) | 825 (43.5%) | 1,070 (56.5%) |
Employment Industries by Sex in East Dundee
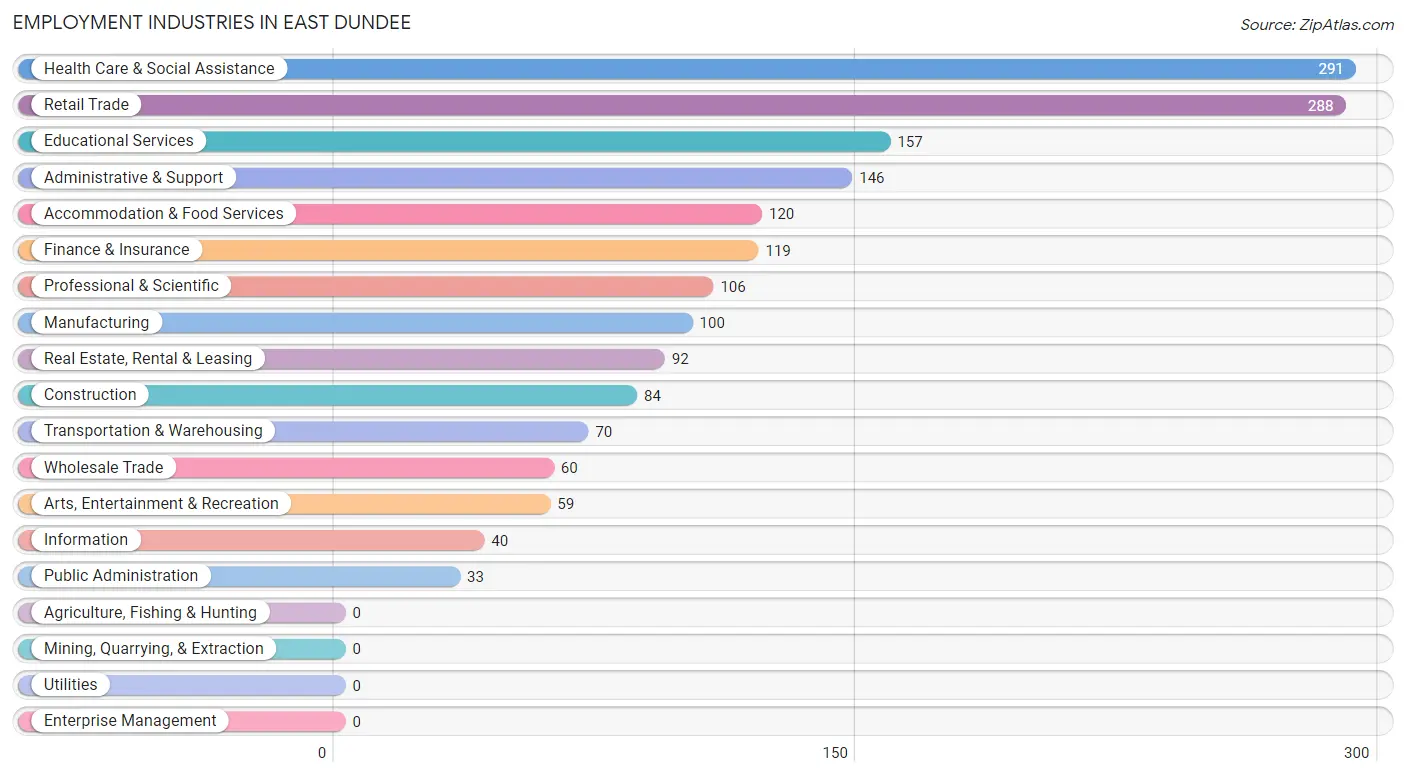
Employment Industries in East Dundee
The major employment industries in East Dundee include Health Care & Social Assistance (291 | 15.4%), Retail Trade (288 | 15.2%), Educational Services (157 | 8.3%), Administrative & Support (146 | 7.7%), and Accommodation & Food Services (120 | 6.3%).
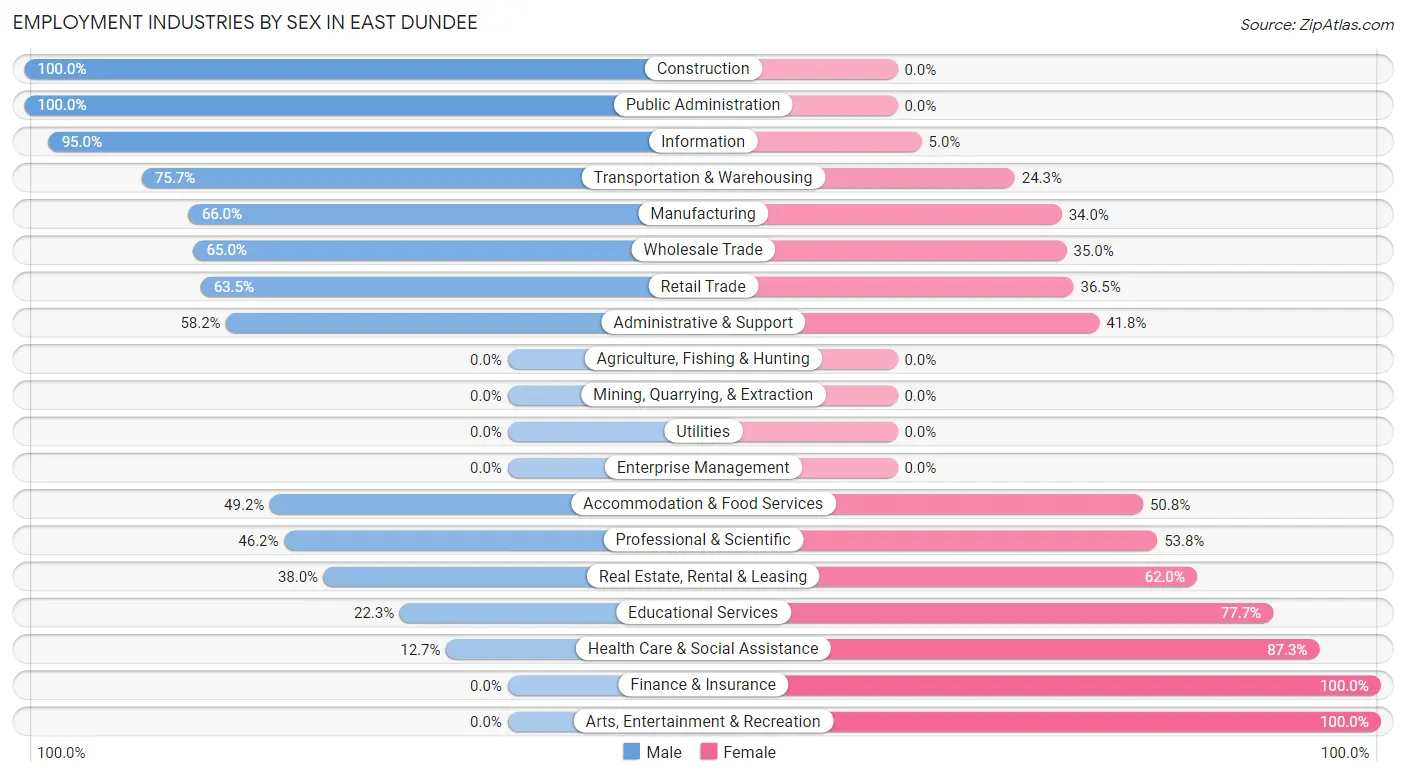
Employment Industries by Sex in East Dundee
The East Dundee industries that see more men than women are Construction (100.0%), Public Administration (100.0%), and Information (95.0%), whereas the industries that tend to have a higher number of women are Finance & Insurance (100.0%), Arts, Entertainment & Recreation (100.0%), and Health Care & Social Assistance (87.3%).
| Industry | Male | Female |
| Agriculture, Fishing & Hunting | 0 (0.0%) | 0 (0.0%) |
| Mining, Quarrying, & Extraction | 0 (0.0%) | 0 (0.0%) |
| Construction | 84 (100.0%) | 0 (0.0%) |
| Manufacturing | 66 (66.0%) | 34 (34.0%) |
| Wholesale Trade | 39 (65.0%) | 21 (35.0%) |
| Retail Trade | 183 (63.5%) | 105 (36.5%) |
| Transportation & Warehousing | 53 (75.7%) | 17 (24.3%) |
| Utilities | 0 (0.0%) | 0 (0.0%) |
| Information | 38 (95.0%) | 2 (5.0%) |
| Finance & Insurance | 0 (0.0%) | 119 (100.0%) |
| Real Estate, Rental & Leasing | 35 (38.0%) | 57 (62.0%) |
| Professional & Scientific | 49 (46.2%) | 57 (53.8%) |
| Enterprise Management | 0 (0.0%) | 0 (0.0%) |
| Administrative & Support | 85 (58.2%) | 61 (41.8%) |
| Educational Services | 35 (22.3%) | 122 (77.7%) |
| Health Care & Social Assistance | 37 (12.7%) | 254 (87.3%) |
| Arts, Entertainment & Recreation | 0 (0.0%) | 59 (100.0%) |
| Accommodation & Food Services | 59 (49.2%) | 61 (50.8%) |
| Public Administration | 33 (100.0%) | 0 (0.0%) |
| Total | 825 (43.5%) | 1,070 (56.5%) |
Education in East Dundee
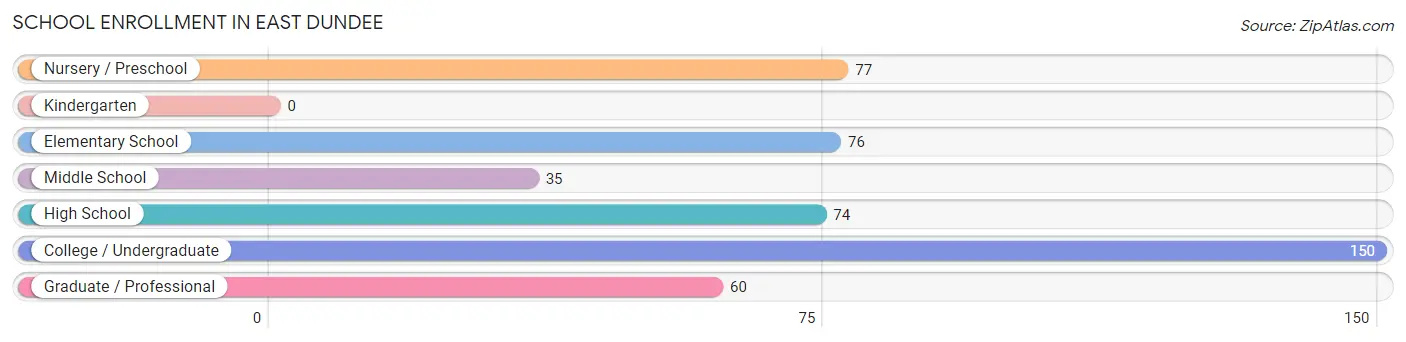
School Enrollment in East Dundee
The most common levels of schooling among the 472 students in East Dundee are college / undergraduate (150 | 31.8%), nursery / preschool (77 | 16.3%), and elementary school (76 | 16.1%).
| School Level | # Students | % Students |
| Nursery / Preschool | 77 | 16.3% |
| Kindergarten | 0 | 0.0% |
| Elementary School | 76 | 16.1% |
| Middle School | 35 | 7.4% |
| High School | 74 | 15.7% |
| College / Undergraduate | 150 | 31.8% |
| Graduate / Professional | 60 | 12.7% |
| Total | 472 | 100.0% |
School Enrollment by Age by Funding Source in East Dundee
Out of a total of 472 students who are enrolled in schools in East Dundee, 80 (16.9%) attend a private institution, while the remaining 392 (83.1%) are enrolled in public schools. The age group of 20 to 24 year olds has the highest likelihood of being enrolled in private schools, with 47 (52.2% in the age bracket) enrolled. Conversely, the age group of 5 to 9 year old has the lowest likelihood of being enrolled in a private school, with 58 (100.0% in the age bracket) attending a public institution.
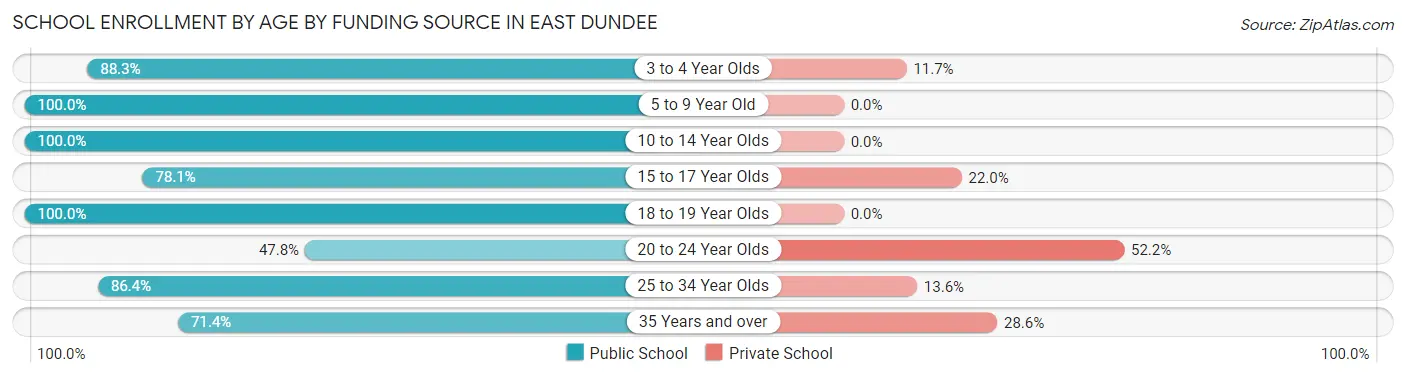
| Age Bracket | Public School | Private School |
| 3 to 4 Year Olds | 68 (88.3%) | 9 (11.7%) |
| 5 to 9 Year Old | 58 (100.0%) | 0 (0.0%) |
| 10 to 14 Year Olds | 60 (100.0%) | 0 (0.0%) |
| 15 to 17 Year Olds | 32 (78.0%) | 9 (22.0%) |
| 18 to 19 Year Olds | 59 (100.0%) | 0 (0.0%) |
| 20 to 24 Year Olds | 43 (47.8%) | 47 (52.2%) |
| 25 to 34 Year Olds | 57 (86.4%) | 9 (13.6%) |
| 35 Years and over | 15 (71.4%) | 6 (28.6%) |
| Total | 392 (83.1%) | 80 (16.9%) |
Educational Attainment by Field of Study in East Dundee
Business (195 | 21.7%), education (147 | 16.3%), computers & mathematics (87 | 9.7%), science & technology (76 | 8.4%), and engineering (69 | 7.7%) are the most common fields of study among 900 individuals in East Dundee who have obtained a bachelor's degree or higher.
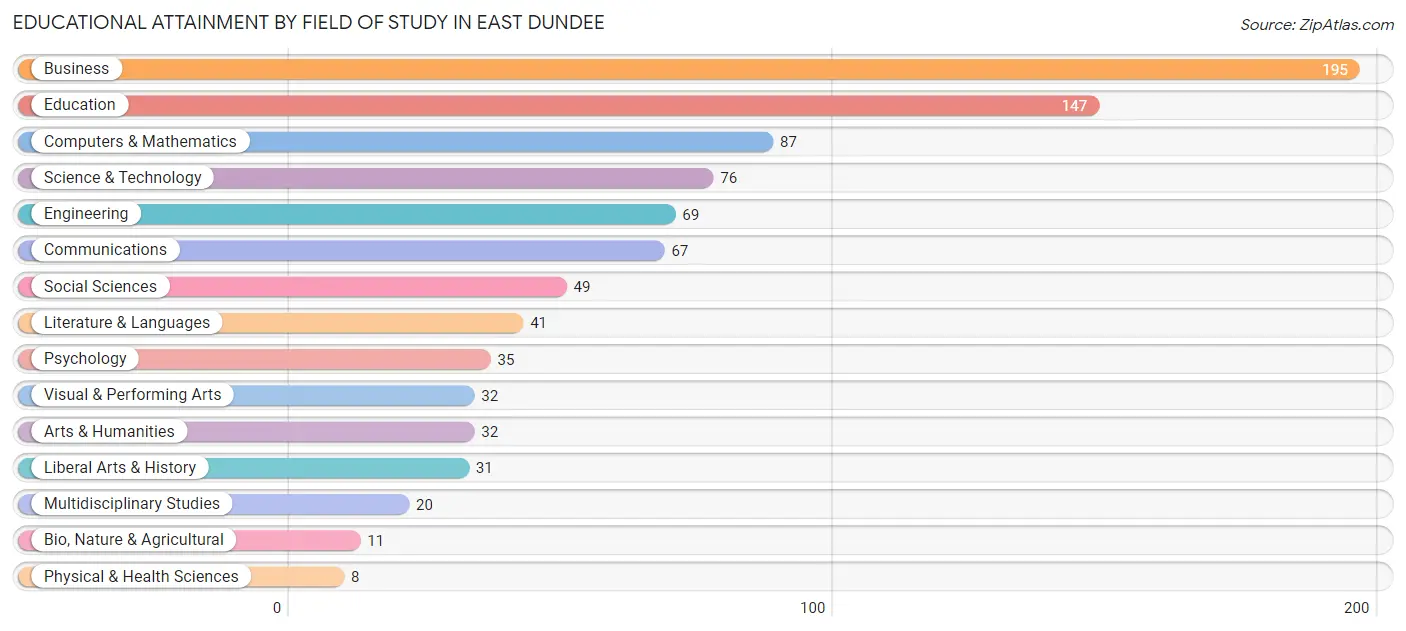
| Field of Study | # Graduates | % Graduates |
| Computers & Mathematics | 87 | 9.7% |
| Bio, Nature & Agricultural | 11 | 1.2% |
| Physical & Health Sciences | 8 | 0.9% |
| Psychology | 35 | 3.9% |
| Social Sciences | 49 | 5.4% |
| Engineering | 69 | 7.7% |
| Multidisciplinary Studies | 20 | 2.2% |
| Science & Technology | 76 | 8.4% |
| Business | 195 | 21.7% |
| Education | 147 | 16.3% |
| Literature & Languages | 41 | 4.6% |
| Liberal Arts & History | 31 | 3.4% |
| Visual & Performing Arts | 32 | 3.6% |
| Communications | 67 | 7.4% |
| Arts & Humanities | 32 | 3.6% |
| Total | 900 | 100.0% |
Transportation & Commute in East Dundee
Vehicle Availability by Sex in East Dundee
The most prevalent vehicle ownership categories in East Dundee are males with 2 vehicles (233, accounting for 29.8%) and females with 2 vehicles (328, making up 22.0%).
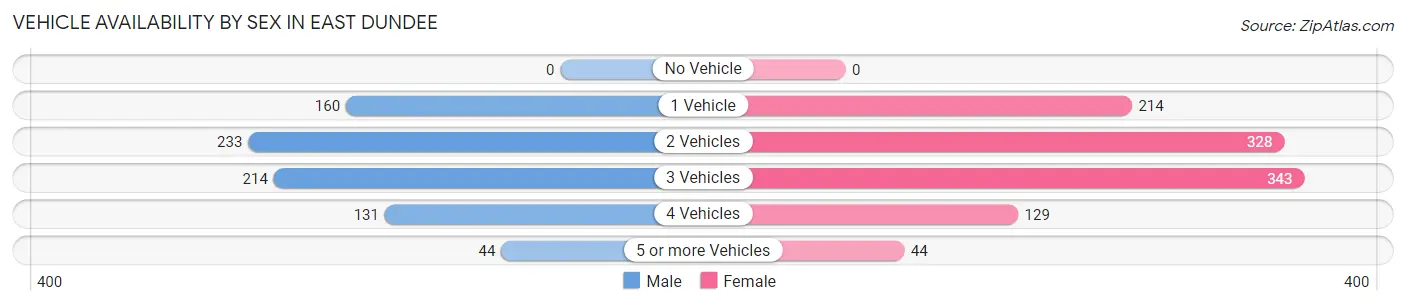
| Vehicles Available | Male | Female |
| No Vehicle | 0 (0.0%) | 0 (0.0%) |
| 1 Vehicle | 160 (20.5%) | 214 (20.2%) |
| 2 Vehicles | 233 (29.8%) | 328 (31.0%) |
| 3 Vehicles | 214 (27.4%) | 343 (32.4%) |
| 4 Vehicles | 131 (16.8%) | 129 (12.2%) |
| 5 or more Vehicles | 44 (5.6%) | 44 (4.2%) |
| Total | 782 (100.0%) | 1,058 (100.0%) |
Commute Time in East Dundee
The most frequently occuring commute durations in East Dundee are 20 to 24 minutes (388 commuters, 21.8%), 30 to 34 minutes (347 commuters, 19.5%), and 15 to 19 minutes (185 commuters, 10.4%).
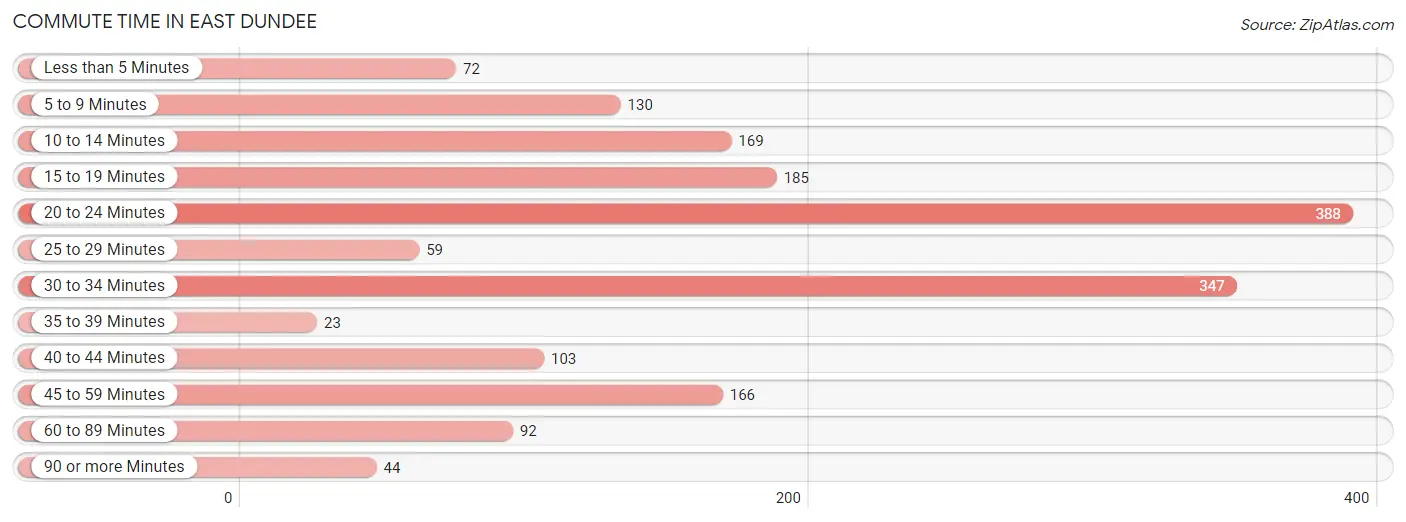
| Commute Time | # Commuters | % Commuters |
| Less than 5 Minutes | 72 | 4.1% |
| 5 to 9 Minutes | 130 | 7.3% |
| 10 to 14 Minutes | 169 | 9.5% |
| 15 to 19 Minutes | 185 | 10.4% |
| 20 to 24 Minutes | 388 | 21.8% |
| 25 to 29 Minutes | 59 | 3.3% |
| 30 to 34 Minutes | 347 | 19.5% |
| 35 to 39 Minutes | 23 | 1.3% |
| 40 to 44 Minutes | 103 | 5.8% |
| 45 to 59 Minutes | 166 | 9.3% |
| 60 to 89 Minutes | 92 | 5.2% |
| 90 or more Minutes | 44 | 2.5% |
Commute Time by Sex in East Dundee
The most common commute times in East Dundee are 20 to 24 minutes (117 commuters, 15.2%) for males and 20 to 24 minutes (271 commuters, 26.9%) for females.
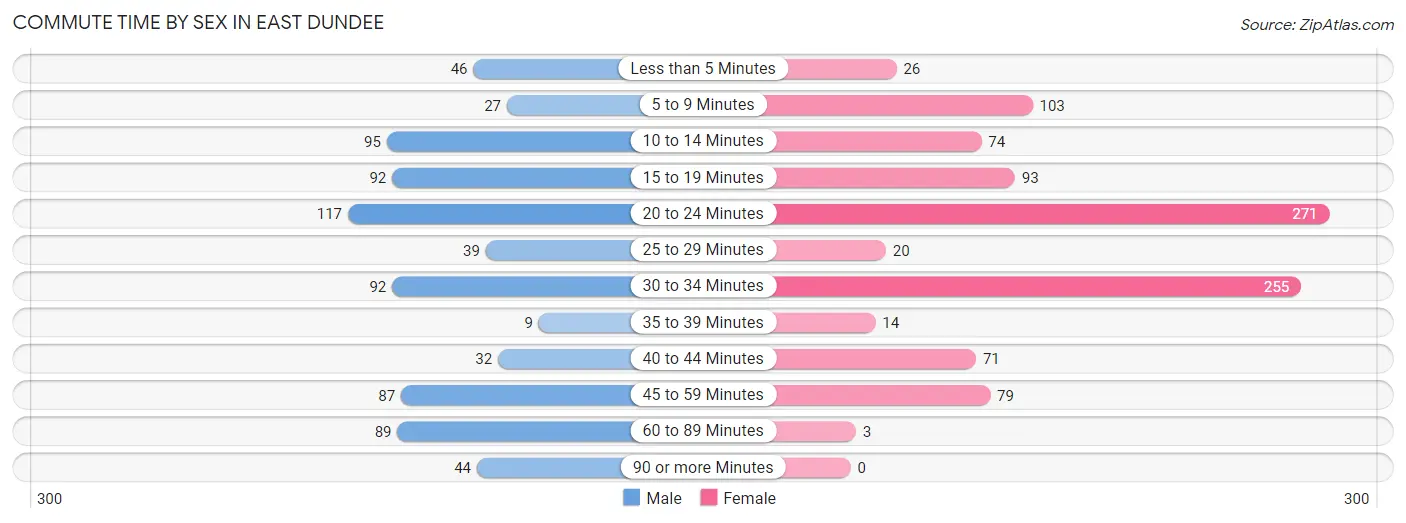
| Commute Time | Male | Female |
| Less than 5 Minutes | 46 (6.0%) | 26 (2.6%) |
| 5 to 9 Minutes | 27 (3.5%) | 103 (10.2%) |
| 10 to 14 Minutes | 95 (12.3%) | 74 (7.3%) |
| 15 to 19 Minutes | 92 (12.0%) | 93 (9.2%) |
| 20 to 24 Minutes | 117 (15.2%) | 271 (26.9%) |
| 25 to 29 Minutes | 39 (5.1%) | 20 (2.0%) |
| 30 to 34 Minutes | 92 (12.0%) | 255 (25.3%) |
| 35 to 39 Minutes | 9 (1.2%) | 14 (1.4%) |
| 40 to 44 Minutes | 32 (4.2%) | 71 (7.0%) |
| 45 to 59 Minutes | 87 (11.3%) | 79 (7.8%) |
| 60 to 89 Minutes | 89 (11.6%) | 3 (0.3%) |
| 90 or more Minutes | 44 (5.7%) | 0 (0.0%) |
Time of Departure to Work by Sex in East Dundee
The most frequent times of departure to work in East Dundee are 7:30 AM to 7:59 AM (132, 17.2%) for males and 7:00 AM to 7:29 AM (130, 12.9%) for females.
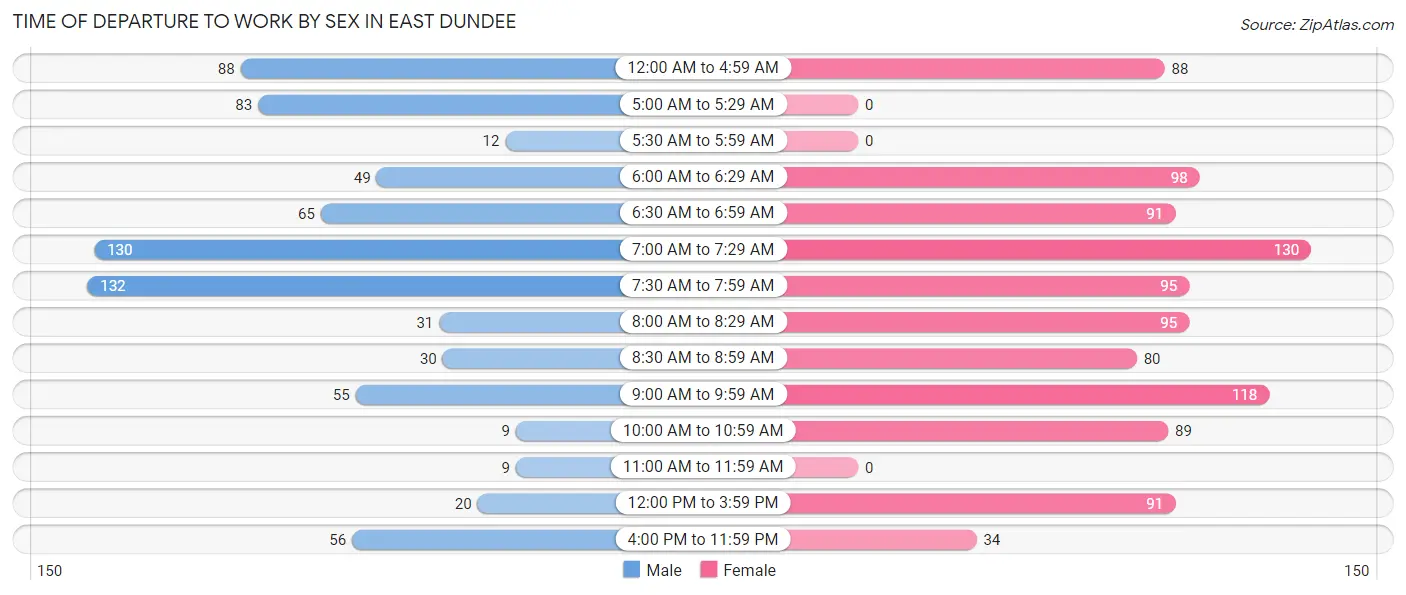
| Time of Departure | Male | Female |
| 12:00 AM to 4:59 AM | 88 (11.4%) | 88 (8.7%) |
| 5:00 AM to 5:29 AM | 83 (10.8%) | 0 (0.0%) |
| 5:30 AM to 5:59 AM | 12 (1.6%) | 0 (0.0%) |
| 6:00 AM to 6:29 AM | 49 (6.4%) | 98 (9.7%) |
| 6:30 AM to 6:59 AM | 65 (8.5%) | 91 (9.0%) |
| 7:00 AM to 7:29 AM | 130 (16.9%) | 130 (12.9%) |
| 7:30 AM to 7:59 AM | 132 (17.2%) | 95 (9.4%) |
| 8:00 AM to 8:29 AM | 31 (4.0%) | 95 (9.4%) |
| 8:30 AM to 8:59 AM | 30 (3.9%) | 80 (7.9%) |
| 9:00 AM to 9:59 AM | 55 (7.1%) | 118 (11.7%) |
| 10:00 AM to 10:59 AM | 9 (1.2%) | 89 (8.8%) |
| 11:00 AM to 11:59 AM | 9 (1.2%) | 0 (0.0%) |
| 12:00 PM to 3:59 PM | 20 (2.6%) | 91 (9.0%) |
| 4:00 PM to 11:59 PM | 56 (7.3%) | 34 (3.4%) |
| Total | 769 (100.0%) | 1,009 (100.0%) |
Housing Occupancy in East Dundee
Occupancy by Ownership in East Dundee
Of the total 1,595 dwellings in East Dundee, owner-occupied units account for 1,138 (71.4%), while renter-occupied units make up 457 (28.6%).
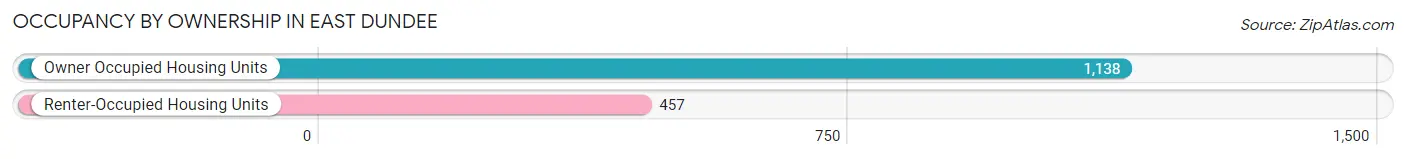
| Occupancy | # Housing Units | % Housing Units |
| Owner Occupied Housing Units | 1,138 | 71.4% |
| Renter-Occupied Housing Units | 457 | 28.6% |
| Total Occupied Housing Units | 1,595 | 100.0% |
Occupancy by Household Size in East Dundee
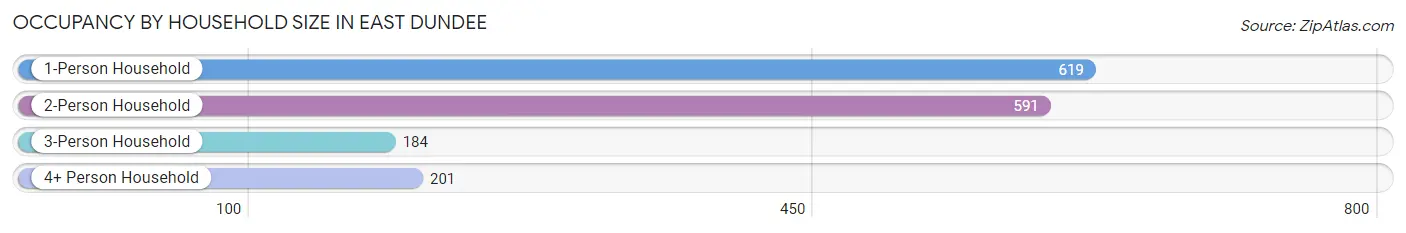
| Household Size | # Housing Units | % Housing Units |
| 1-Person Household | 619 | 38.8% |
| 2-Person Household | 591 | 37.0% |
| 3-Person Household | 184 | 11.5% |
| 4+ Person Household | 201 | 12.6% |
| Total Housing Units | 1,595 | 100.0% |
Occupancy by Ownership by Household Size in East Dundee
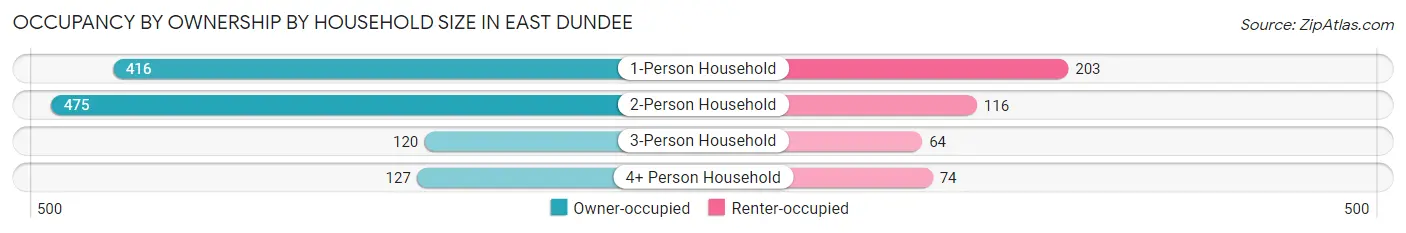
| Household Size | Owner-occupied | Renter-occupied |
| 1-Person Household | 416 (67.2%) | 203 (32.8%) |
| 2-Person Household | 475 (80.4%) | 116 (19.6%) |
| 3-Person Household | 120 (65.2%) | 64 (34.8%) |
| 4+ Person Household | 127 (63.2%) | 74 (36.8%) |
| Total Housing Units | 1,138 (71.4%) | 457 (28.6%) |
Occupancy by Educational Attainment in East Dundee
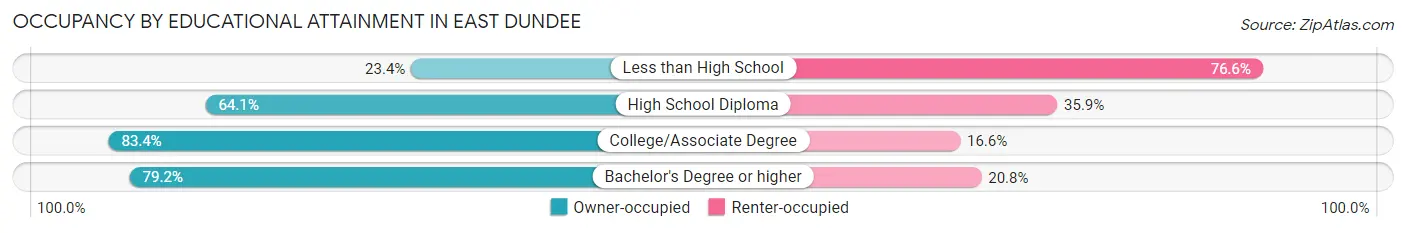
| Household Size | Owner-occupied | Renter-occupied |
| Less than High School | 32 (23.4%) | 105 (76.6%) |
| High School Diploma | 295 (64.1%) | 165 (35.9%) |
| College/Associate Degree | 416 (83.4%) | 83 (16.6%) |
| Bachelor's Degree or higher | 395 (79.2%) | 104 (20.8%) |
Occupancy by Age of Householder in East Dundee
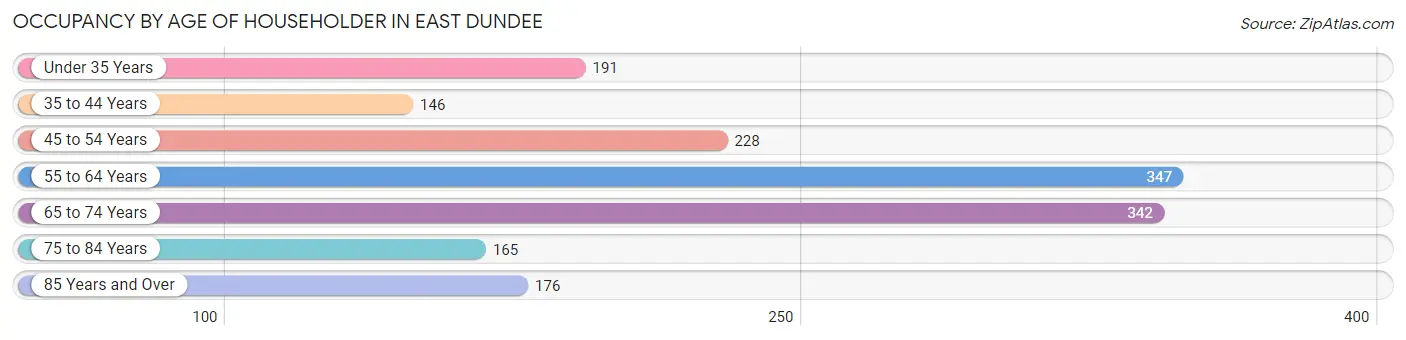
| Age Bracket | # Households | % Households |
| Under 35 Years | 191 | 12.0% |
| 35 to 44 Years | 146 | 9.1% |
| 45 to 54 Years | 228 | 14.3% |
| 55 to 64 Years | 347 | 21.8% |
| 65 to 74 Years | 342 | 21.4% |
| 75 to 84 Years | 165 | 10.3% |
| 85 Years and Over | 176 | 11.0% |
| Total | 1,595 | 100.0% |
Housing Finances in East Dundee
Median Income by Occupancy in East Dundee

| Occupancy Type | # Households | Median Income |
| Owner-Occupied | 1,138 (71.4%) | $90,000 |
| Renter-Occupied | 457 (28.6%) | $28,377 |
| Average | 1,595 (100.0%) | $71,116 |
Occupancy by Householder Income Bracket in East Dundee
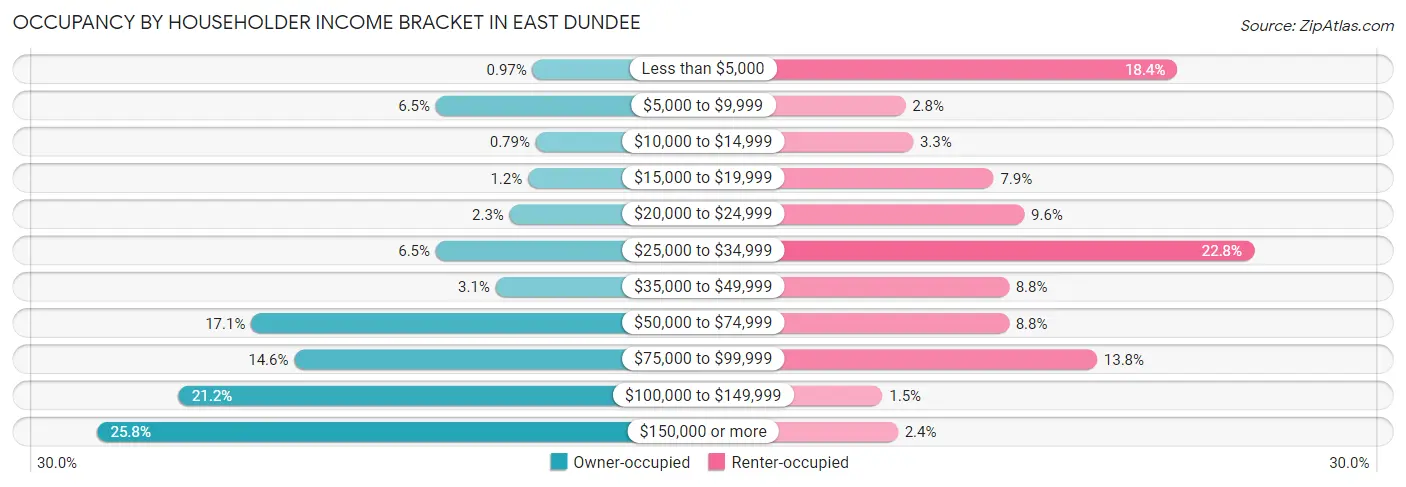
| Income Bracket | Owner-occupied | Renter-occupied |
| Less than $5,000 | 11 (1.0%) | 84 (18.4%) |
| $5,000 to $9,999 | 74 (6.5%) | 13 (2.8%) |
| $10,000 to $14,999 | 9 (0.8%) | 15 (3.3%) |
| $15,000 to $19,999 | 14 (1.2%) | 36 (7.9%) |
| $20,000 to $24,999 | 26 (2.3%) | 44 (9.6%) |
| $25,000 to $34,999 | 74 (6.5%) | 104 (22.8%) |
| $35,000 to $49,999 | 35 (3.1%) | 40 (8.7%) |
| $50,000 to $74,999 | 194 (17.1%) | 40 (8.7%) |
| $75,000 to $99,999 | 166 (14.6%) | 63 (13.8%) |
| $100,000 to $149,999 | 241 (21.2%) | 7 (1.5%) |
| $150,000 or more | 294 (25.8%) | 11 (2.4%) |
| Total | 1,138 (100.0%) | 457 (100.0%) |
Monthly Housing Cost Tiers in East Dundee
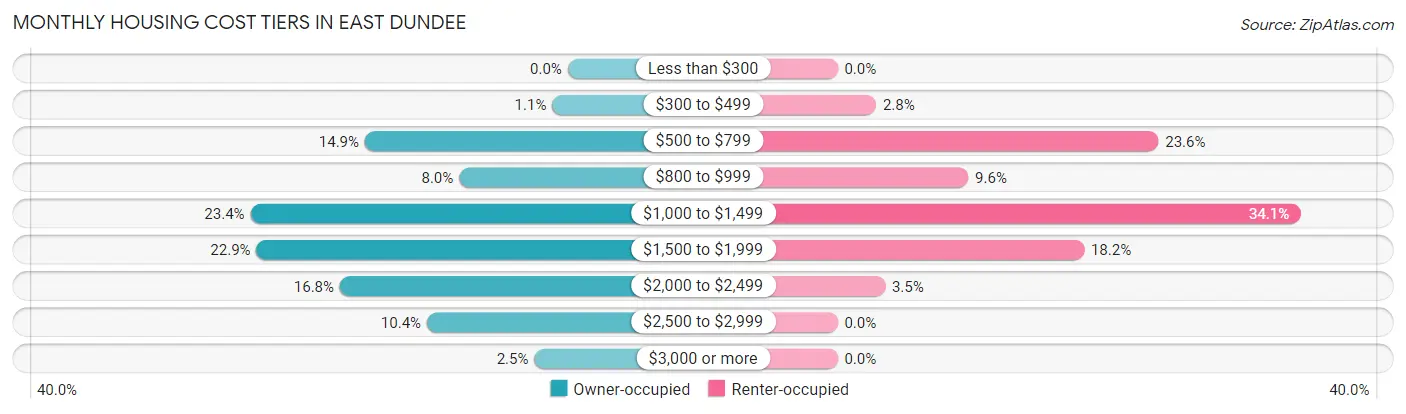
| Monthly Cost | Owner-occupied | Renter-occupied |
| Less than $300 | 0 (0.0%) | 0 (0.0%) |
| $300 to $499 | 13 (1.1%) | 13 (2.8%) |
| $500 to $799 | 170 (14.9%) | 108 (23.6%) |
| $800 to $999 | 91 (8.0%) | 44 (9.6%) |
| $1,000 to $1,499 | 266 (23.4%) | 156 (34.1%) |
| $1,500 to $1,999 | 261 (22.9%) | 83 (18.2%) |
| $2,000 to $2,499 | 191 (16.8%) | 16 (3.5%) |
| $2,500 to $2,999 | 118 (10.4%) | 0 (0.0%) |
| $3,000 or more | 28 (2.5%) | 0 (0.0%) |
| Total | 1,138 (100.0%) | 457 (100.0%) |
Physical Housing Characteristics in East Dundee
Housing Structures in East Dundee
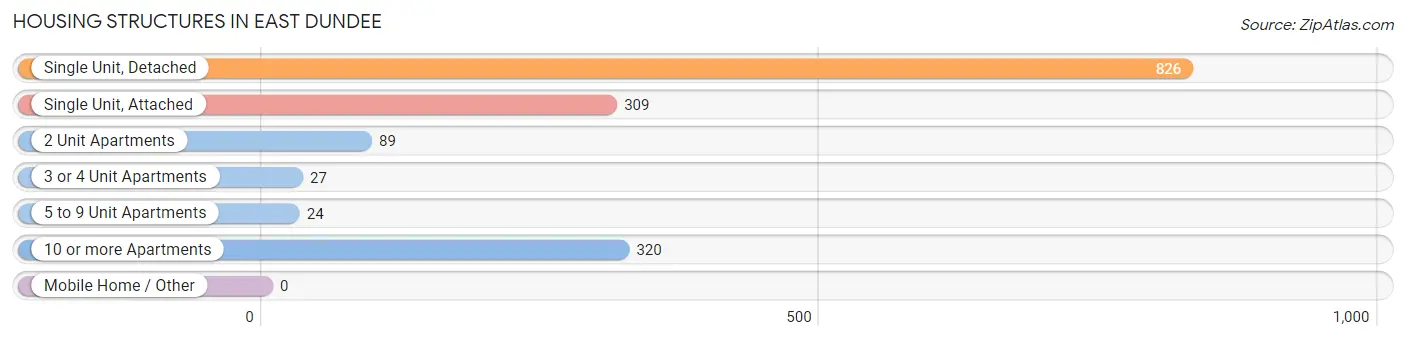
| Structure Type | # Housing Units | % Housing Units |
| Single Unit, Detached | 826 | 51.8% |
| Single Unit, Attached | 309 | 19.4% |
| 2 Unit Apartments | 89 | 5.6% |
| 3 or 4 Unit Apartments | 27 | 1.7% |
| 5 to 9 Unit Apartments | 24 | 1.5% |
| 10 or more Apartments | 320 | 20.1% |
| Mobile Home / Other | 0 | 0.0% |
| Total | 1,595 | 100.0% |
Housing Structures by Occupancy in East Dundee
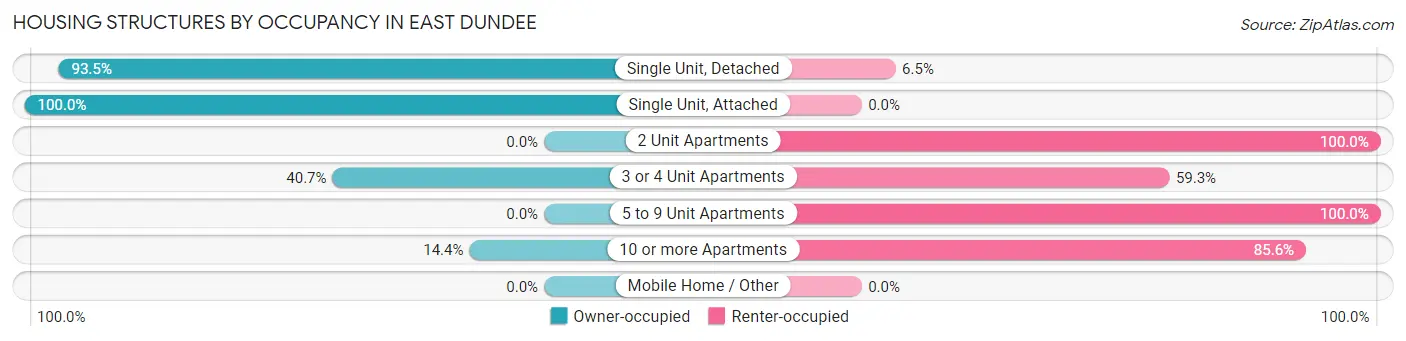
| Structure Type | Owner-occupied | Renter-occupied |
| Single Unit, Detached | 772 (93.5%) | 54 (6.5%) |
| Single Unit, Attached | 309 (100.0%) | 0 (0.0%) |
| 2 Unit Apartments | 0 (0.0%) | 89 (100.0%) |
| 3 or 4 Unit Apartments | 11 (40.7%) | 16 (59.3%) |
| 5 to 9 Unit Apartments | 0 (0.0%) | 24 (100.0%) |
| 10 or more Apartments | 46 (14.4%) | 274 (85.6%) |
| Mobile Home / Other | 0 (0.0%) | 0 (0.0%) |
| Total | 1,138 (71.4%) | 457 (28.6%) |
Housing Structures by Number of Rooms in East Dundee
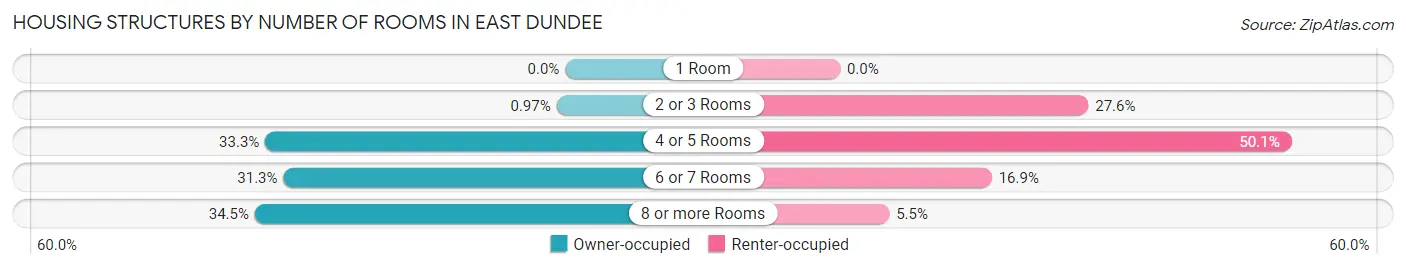
| Number of Rooms | Owner-occupied | Renter-occupied |
| 1 Room | 0 (0.0%) | 0 (0.0%) |
| 2 or 3 Rooms | 11 (1.0%) | 126 (27.6%) |
| 4 or 5 Rooms | 379 (33.3%) | 229 (50.1%) |
| 6 or 7 Rooms | 356 (31.3%) | 77 (16.9%) |
| 8 or more Rooms | 392 (34.4%) | 25 (5.5%) |
| Total | 1,138 (100.0%) | 457 (100.0%) |
Housing Structure by Heating Type in East Dundee
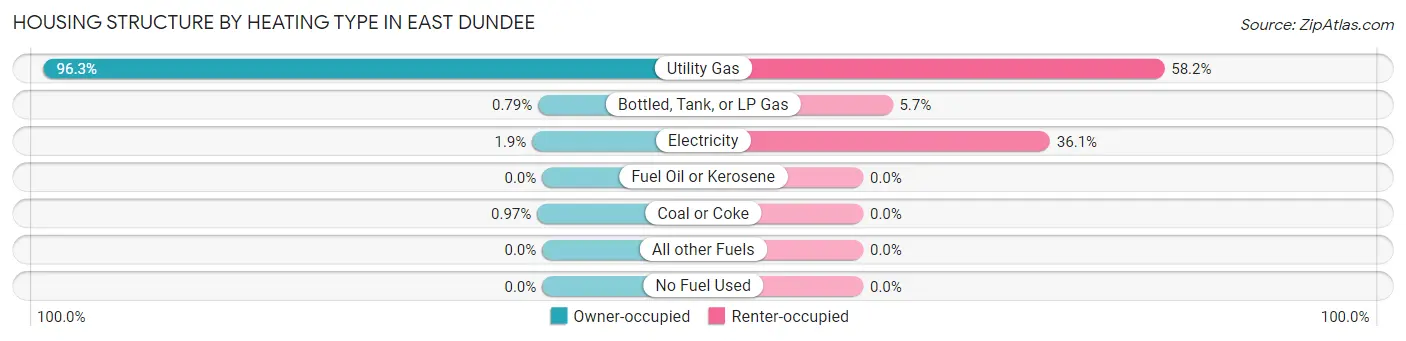
| Heating Type | Owner-occupied | Renter-occupied |
| Utility Gas | 1,096 (96.3%) | 266 (58.2%) |
| Bottled, Tank, or LP Gas | 9 (0.8%) | 26 (5.7%) |
| Electricity | 22 (1.9%) | 165 (36.1%) |
| Fuel Oil or Kerosene | 0 (0.0%) | 0 (0.0%) |
| Coal or Coke | 11 (1.0%) | 0 (0.0%) |
| All other Fuels | 0 (0.0%) | 0 (0.0%) |
| No Fuel Used | 0 (0.0%) | 0 (0.0%) |
| Total | 1,138 (100.0%) | 457 (100.0%) |
Household Vehicle Usage in East Dundee
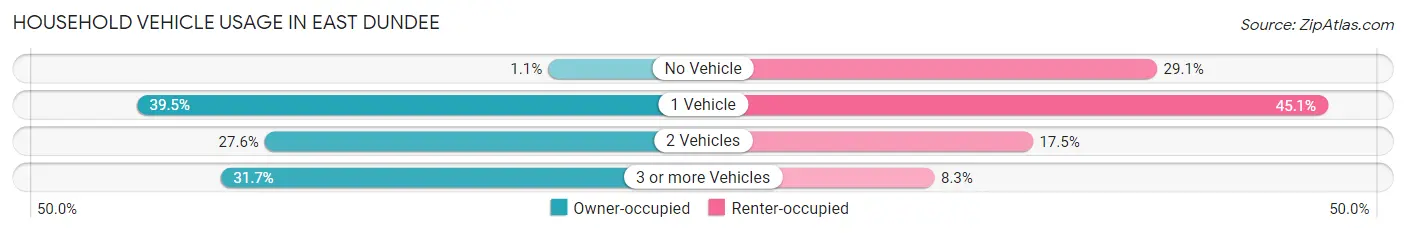
| Vehicles per Household | Owner-occupied | Renter-occupied |
| No Vehicle | 13 (1.1%) | 133 (29.1%) |
| 1 Vehicle | 450 (39.5%) | 206 (45.1%) |
| 2 Vehicles | 314 (27.6%) | 80 (17.5%) |
| 3 or more Vehicles | 361 (31.7%) | 38 (8.3%) |
| Total | 1,138 (100.0%) | 457 (100.0%) |
Real Estate & Mortgages in East Dundee
Real Estate and Mortgage Overview in East Dundee
| Characteristic | Without Mortgage | With Mortgage |
| Housing Units | 346 | 792 |
| Median Property Value | $229,200 | $257,800 |
| Median Household Income | $69,750 | $251 |
| Monthly Housing Costs | $802 | $28 |
| Real Estate Taxes | $4,965 | $0 |
Property Value by Mortgage Status in East Dundee
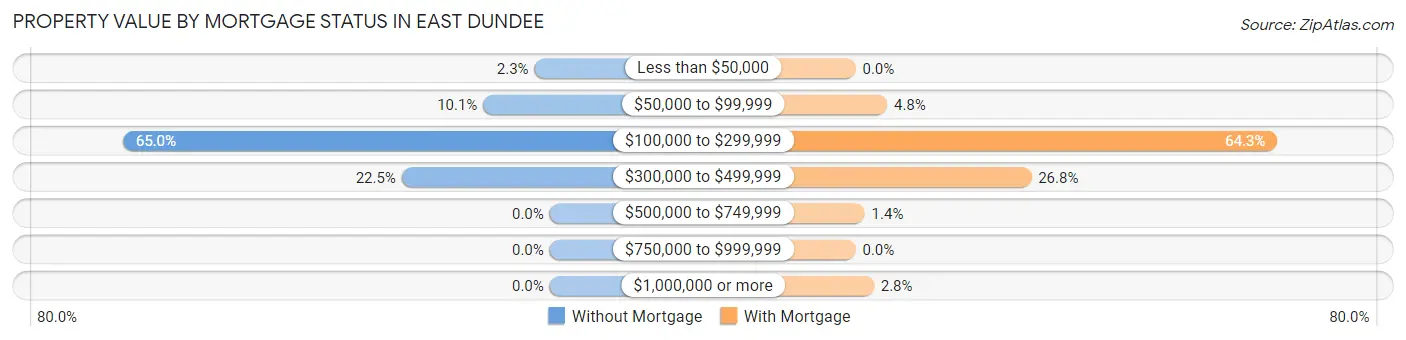
| Property Value | Without Mortgage | With Mortgage |
| Less than $50,000 | 8 (2.3%) | 0 (0.0%) |
| $50,000 to $99,999 | 35 (10.1%) | 38 (4.8%) |
| $100,000 to $299,999 | 225 (65.0%) | 509 (64.3%) |
| $300,000 to $499,999 | 78 (22.5%) | 212 (26.8%) |
| $500,000 to $749,999 | 0 (0.0%) | 11 (1.4%) |
| $750,000 to $999,999 | 0 (0.0%) | 0 (0.0%) |
| $1,000,000 or more | 0 (0.0%) | 22 (2.8%) |
| Total | 346 (100.0%) | 792 (100.0%) |
Household Income by Mortgage Status in East Dundee
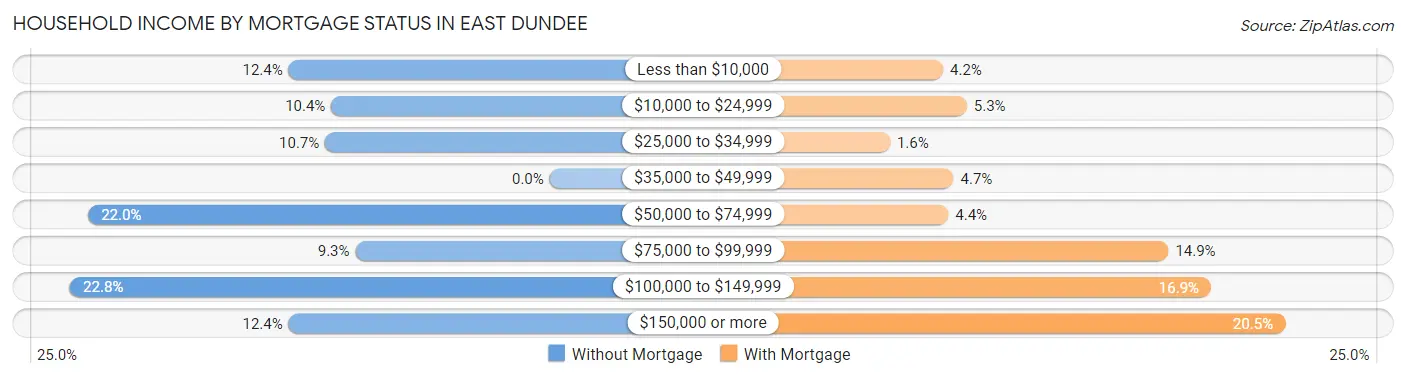
| Household Income | Without Mortgage | With Mortgage |
| Less than $10,000 | 43 (12.4%) | 33 (4.2%) |
| $10,000 to $24,999 | 36 (10.4%) | 42 (5.3%) |
| $25,000 to $34,999 | 37 (10.7%) | 13 (1.6%) |
| $35,000 to $49,999 | 0 (0.0%) | 37 (4.7%) |
| $50,000 to $74,999 | 76 (22.0%) | 35 (4.4%) |
| $75,000 to $99,999 | 32 (9.2%) | 118 (14.9%) |
| $100,000 to $149,999 | 79 (22.8%) | 134 (16.9%) |
| $150,000 or more | 43 (12.4%) | 162 (20.4%) |
| Total | 346 (100.0%) | 792 (100.0%) |
Property Value to Household Income Ratio in East Dundee
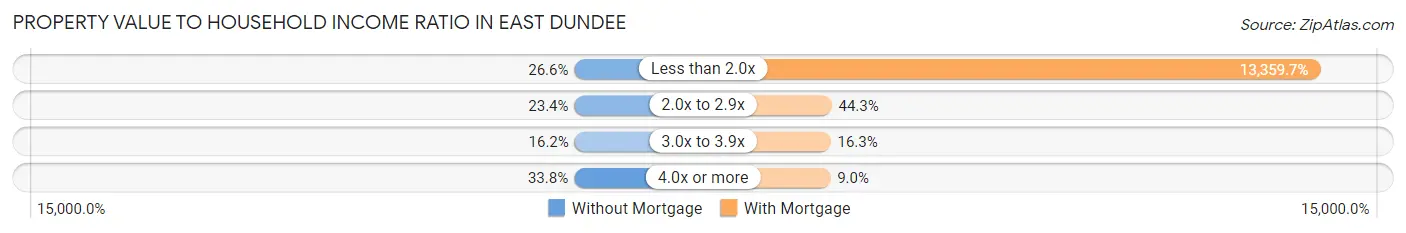
| Value-to-Income Ratio | Without Mortgage | With Mortgage |
| Less than 2.0x | 92 (26.6%) | 105,809 (13,359.7%) |
| 2.0x to 2.9x | 81 (23.4%) | 351 (44.3%) |
| 3.0x to 3.9x | 56 (16.2%) | 129 (16.3%) |
| 4.0x or more | 117 (33.8%) | 71 (9.0%) |
| Total | 346 (100.0%) | 792 (100.0%) |
Real Estate Taxes by Mortgage Status in East Dundee
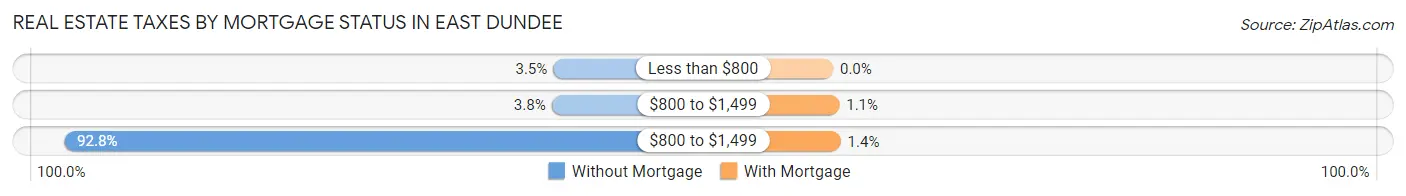
| Property Taxes | Without Mortgage | With Mortgage |
| Less than $800 | 12 (3.5%) | 0 (0.0%) |
| $800 to $1,499 | 13 (3.8%) | 9 (1.1%) |
| $800 to $1,499 | 321 (92.8%) | 11 (1.4%) |
| Total | 346 (100.0%) | 792 (100.0%) |
Health & Disability in East Dundee
Health Insurance Coverage by Age in East Dundee
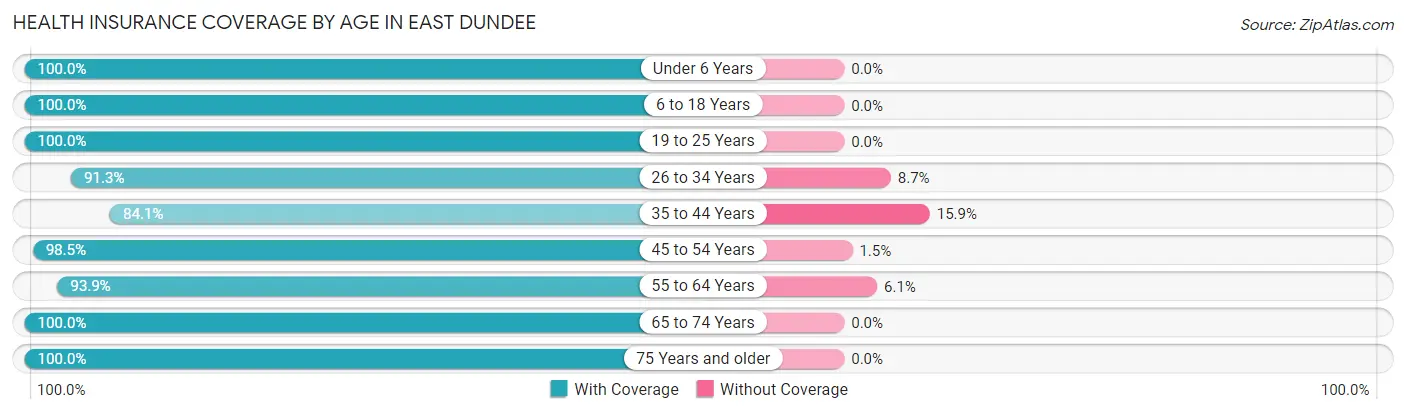
| Age Bracket | With Coverage | Without Coverage |
| Under 6 Years | 107 (100.0%) | 0 (0.0%) |
| 6 to 18 Years | 185 (100.0%) | 0 (0.0%) |
| 19 to 25 Years | 334 (100.0%) | 0 (0.0%) |
| 26 to 34 Years | 305 (91.3%) | 29 (8.7%) |
| 35 to 44 Years | 232 (84.1%) | 44 (15.9%) |
| 45 to 54 Years | 390 (98.5%) | 6 (1.5%) |
| 55 to 64 Years | 552 (93.9%) | 36 (6.1%) |
| 65 to 74 Years | 491 (100.0%) | 0 (0.0%) |
| 75 Years and older | 446 (100.0%) | 0 (0.0%) |
| Total | 3,042 (96.4%) | 115 (3.6%) |
Health Insurance Coverage by Citizenship Status in East Dundee
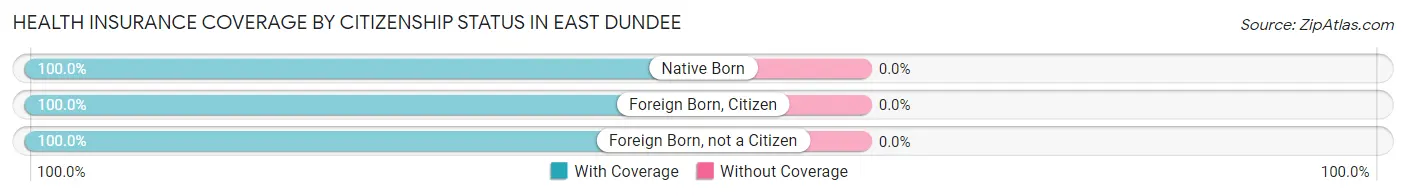
| Citizenship Status | With Coverage | Without Coverage |
| Native Born | 107 (100.0%) | 0 (0.0%) |
| Foreign Born, Citizen | 185 (100.0%) | 0 (0.0%) |
| Foreign Born, not a Citizen | 334 (100.0%) | 0 (0.0%) |
Health Insurance Coverage by Household Income in East Dundee
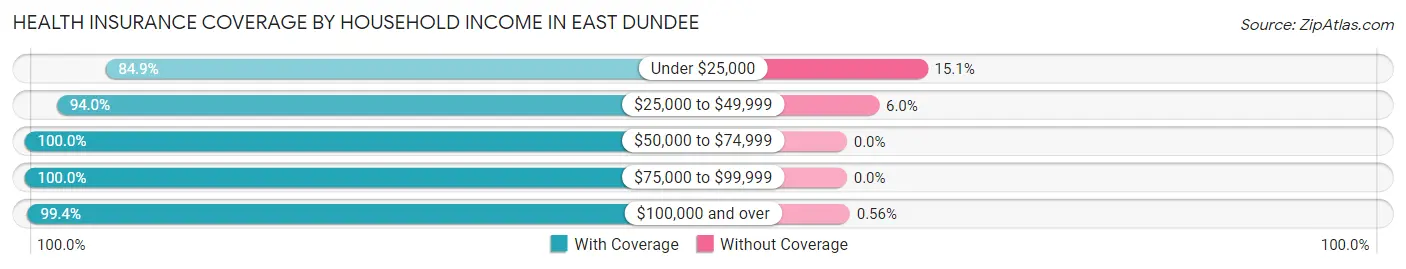
| Household Income | With Coverage | Without Coverage |
| Under $25,000 | 488 (84.9%) | 87 (15.1%) |
| $25,000 to $49,999 | 311 (94.0%) | 20 (6.0%) |
| $50,000 to $74,999 | 400 (100.0%) | 0 (0.0%) |
| $75,000 to $99,999 | 429 (100.0%) | 0 (0.0%) |
| $100,000 and over | 1,414 (99.4%) | 8 (0.6%) |
Public vs Private Health Insurance Coverage by Age in East Dundee
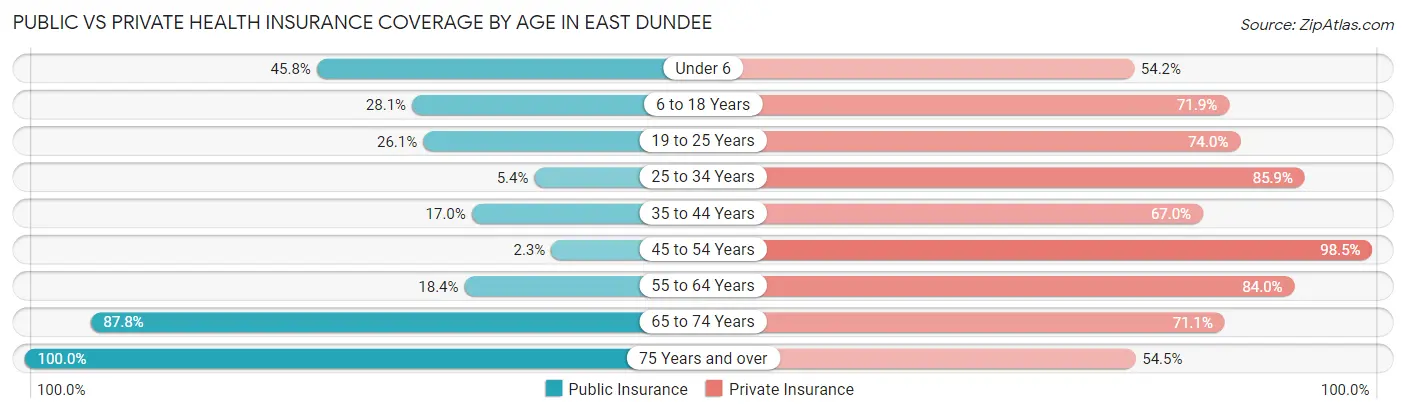
| Age Bracket | Public Insurance | Private Insurance |
| Under 6 | 49 (45.8%) | 58 (54.2%) |
| 6 to 18 Years | 52 (28.1%) | 133 (71.9%) |
| 19 to 25 Years | 87 (26.1%) | 247 (74.0%) |
| 25 to 34 Years | 18 (5.4%) | 287 (85.9%) |
| 35 to 44 Years | 47 (17.0%) | 185 (67.0%) |
| 45 to 54 Years | 9 (2.3%) | 390 (98.5%) |
| 55 to 64 Years | 108 (18.4%) | 494 (84.0%) |
| 65 to 74 Years | 431 (87.8%) | 349 (71.1%) |
| 75 Years and over | 446 (100.0%) | 243 (54.5%) |
| Total | 1,247 (39.5%) | 2,386 (75.6%) |
Disability Status by Sex by Age in East Dundee
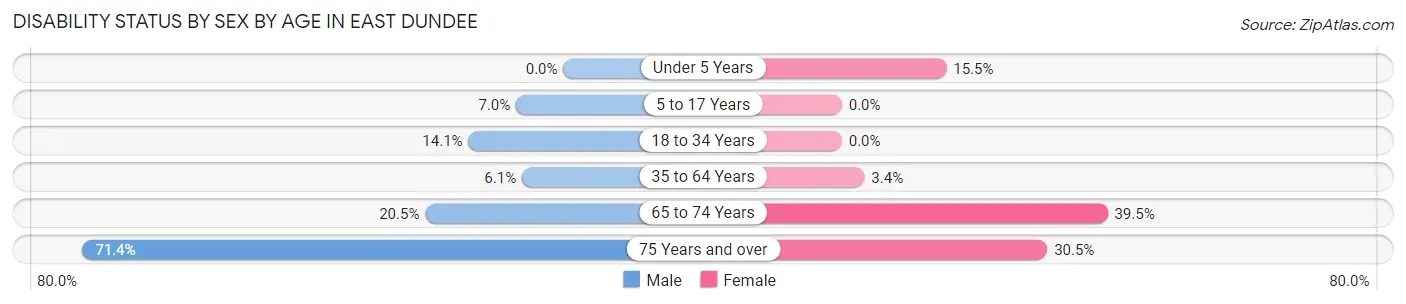
| Age Bracket | Male | Female |
| Under 5 Years | 0 (0.0%) | 9 (15.5%) |
| 5 to 17 Years | 9 (7.0%) | 0 (0.0%) |
| 18 to 34 Years | 33 (14.1%) | 0 (0.0%) |
| 35 to 64 Years | 39 (6.1%) | 21 (3.4%) |
| 65 to 74 Years | 56 (20.5%) | 86 (39.5%) |
| 75 Years and over | 75 (71.4%) | 104 (30.5%) |
Disability Class by Sex by Age in East Dundee
Disability Class: Hearing Difficulty
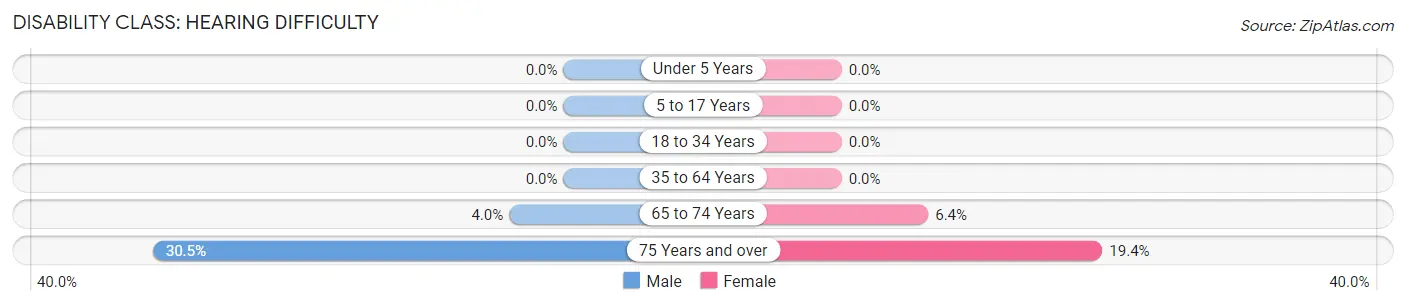
| Age Bracket | Male | Female |
| Under 5 Years | 0 (0.0%) | 0 (0.0%) |
| 5 to 17 Years | 0 (0.0%) | 0 (0.0%) |
| 18 to 34 Years | 0 (0.0%) | 0 (0.0%) |
| 35 to 64 Years | 0 (0.0%) | 0 (0.0%) |
| 65 to 74 Years | 11 (4.0%) | 14 (6.4%) |
| 75 Years and over | 32 (30.5%) | 66 (19.4%) |
Disability Class: Vision Difficulty
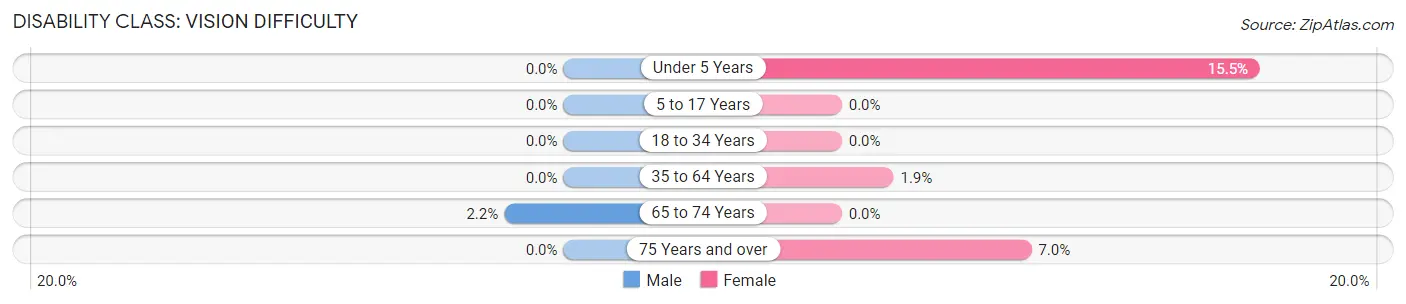
| Age Bracket | Male | Female |
| Under 5 Years | 0 (0.0%) | 9 (15.5%) |
| 5 to 17 Years | 0 (0.0%) | 0 (0.0%) |
| 18 to 34 Years | 0 (0.0%) | 0 (0.0%) |
| 35 to 64 Years | 0 (0.0%) | 12 (1.9%) |
| 65 to 74 Years | 6 (2.2%) | 0 (0.0%) |
| 75 Years and over | 0 (0.0%) | 24 (7.0%) |
Disability Class: Cognitive Difficulty
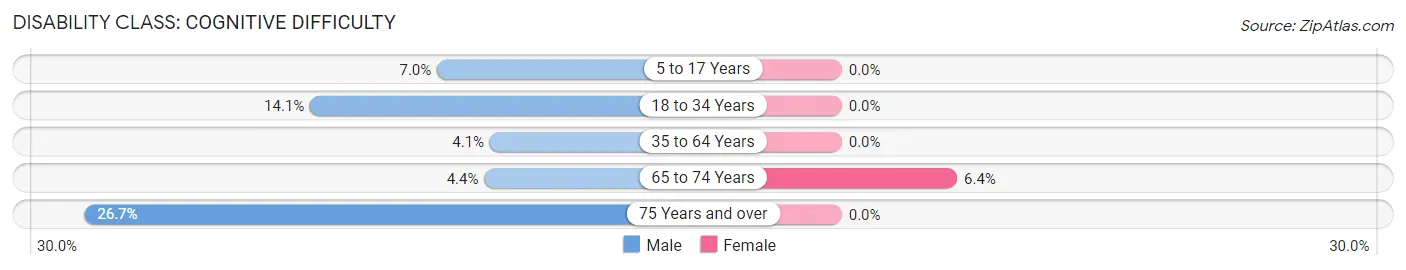
| Age Bracket | Male | Female |
| 5 to 17 Years | 9 (7.0%) | 0 (0.0%) |
| 18 to 34 Years | 33 (14.1%) | 0 (0.0%) |
| 35 to 64 Years | 26 (4.1%) | 0 (0.0%) |
| 65 to 74 Years | 12 (4.4%) | 14 (6.4%) |
| 75 Years and over | 28 (26.7%) | 0 (0.0%) |
Disability Class: Ambulatory Difficulty
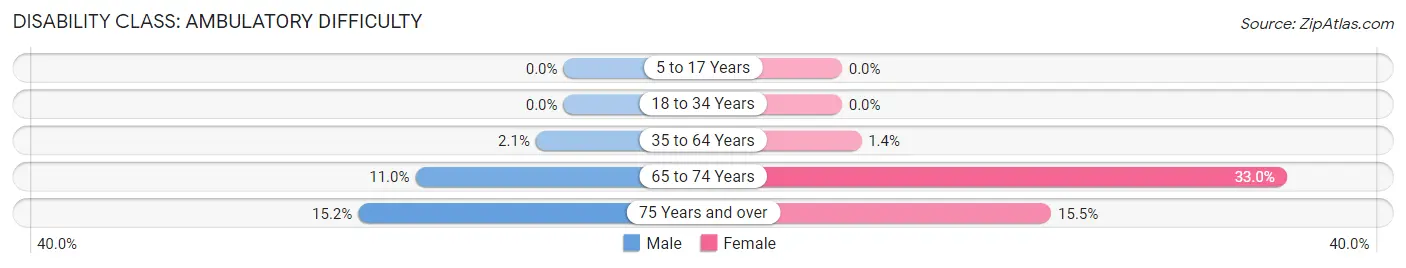
| Age Bracket | Male | Female |
| 5 to 17 Years | 0 (0.0%) | 0 (0.0%) |
| 18 to 34 Years | 0 (0.0%) | 0 (0.0%) |
| 35 to 64 Years | 13 (2.1%) | 9 (1.4%) |
| 65 to 74 Years | 30 (11.0%) | 72 (33.0%) |
| 75 Years and over | 16 (15.2%) | 53 (15.5%) |
Disability Class: Self-Care Difficulty
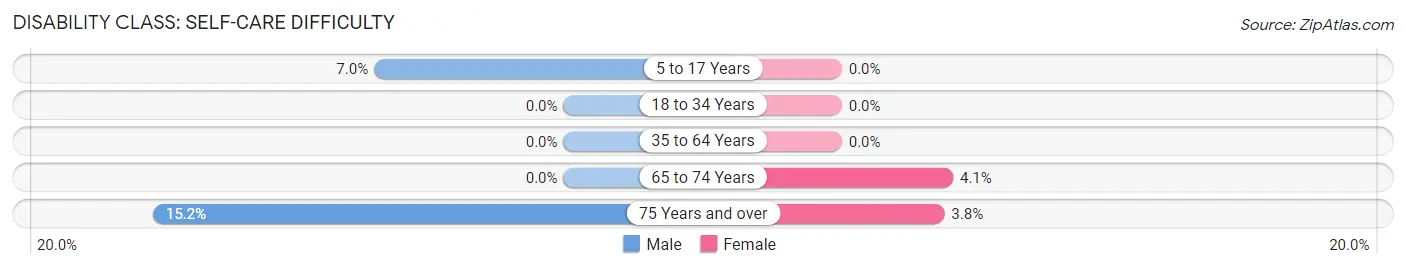
| Age Bracket | Male | Female |
| 5 to 17 Years | 9 (7.0%) | 0 (0.0%) |
| 18 to 34 Years | 0 (0.0%) | 0 (0.0%) |
| 35 to 64 Years | 0 (0.0%) | 0 (0.0%) |
| 65 to 74 Years | 0 (0.0%) | 9 (4.1%) |
| 75 Years and over | 16 (15.2%) | 13 (3.8%) |
Technology Access in East Dundee
Computing Device Access in East Dundee
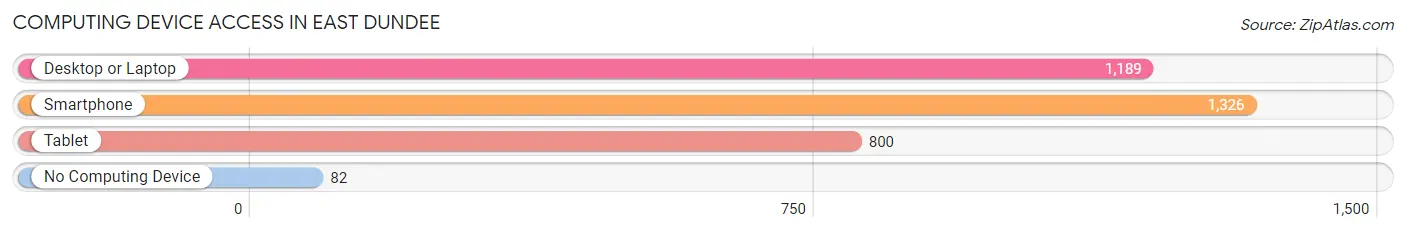
| Device Type | # Households | % Households |
| Desktop or Laptop | 1,189 | 74.6% |
| Smartphone | 1,326 | 83.1% |
| Tablet | 800 | 50.2% |
| No Computing Device | 82 | 5.1% |
| Total | 1,595 | 100.0% |
Internet Access in East Dundee
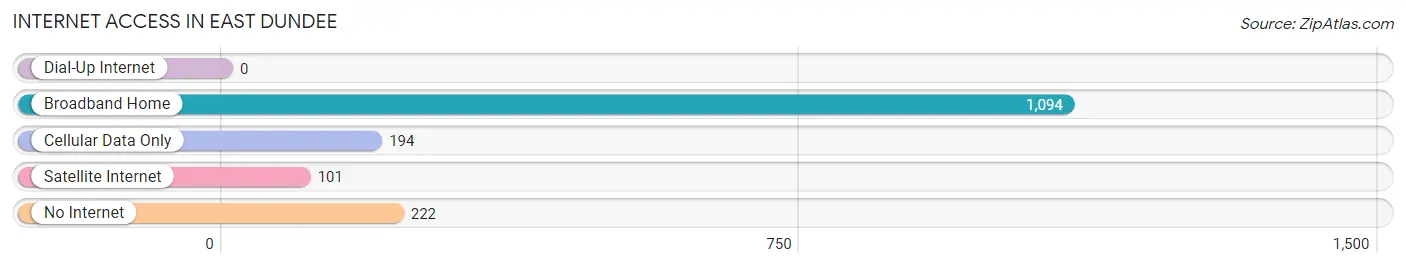
| Internet Type | # Households | % Households |
| Dial-Up Internet | 0 | 0.0% |
| Broadband Home | 1,094 | 68.6% |
| Cellular Data Only | 194 | 12.2% |
| Satellite Internet | 101 | 6.3% |
| No Internet | 222 | 13.9% |
| Total | 1,595 | 100.0% |
East Dundee Summary
History
East Dundee is a village located in Kane County, Illinois, United States. It is a suburb of Chicago, located about 40 miles northwest of the city. The village was first settled in the 1830s by German immigrants, and was incorporated in 1871.
East Dundee was originally part of the larger Dundee Township, which was established in 1849. The village was named after the Scottish town of Dundee, and was originally known as “East Dundee” to distinguish it from the other Dundee in the area. The village was officially incorporated in 1871, and the first mayor was elected in 1872.
The village grew slowly in the late 19th century, and by the turn of the century, it had a population of about 500. The village was primarily agricultural, with some small businesses and industries. In the early 20th century, the village began to grow more rapidly, and by the 1950s, the population had grown to over 2,000.
Geography
East Dundee is located in Kane County, Illinois, about 40 miles northwest of Chicago. The village is situated on the Fox River, and is bordered by the villages of Carpentersville, West Dundee, Sleepy Hollow, and Gilberts. The village covers an area of about 2.5 square miles, and has a population of about 3,500.
The village is located in a flat, open area, with some rolling hills in the northern part of the village. The Fox River runs through the village, and there are several small lakes and ponds in the area. The village is located in a temperate climate, with hot summers and cold winters.
Economy
East Dundee’s economy is primarily based on small businesses and industries. The village is home to several small manufacturing companies, as well as a number of retail stores and restaurants. The village also has a number of professional services, such as accounting, legal, and medical offices.
The village is also home to several large employers, including the East Dundee Industrial Park, which is home to several manufacturing companies. The village also has a number of small businesses, such as auto repair shops, hair salons, and other services.
Demographics
As of the 2010 census, East Dundee had a population of 3,541. The population is primarily white (90.2%), with a small Hispanic population (4.2%). The median household income is $63,917, and the median home value is $219,400.
The village is served by two public school districts, Community Unit School District 300 and Dundee-Crown High School District 300. The village also has a number of private schools, including St. Catherine of Siena Catholic School and East Dundee Christian Academy.
Conclusion
East Dundee is a small village located in Kane County, Illinois, about 40 miles northwest of Chicago. The village was first settled in the 1830s by German immigrants, and was incorporated in 1871. The village has a population of about 3,500, and is primarily white. The economy is based on small businesses and industries, and the village is served by two public school districts.
Common Questions
What is Per Capita Income in East Dundee?
Per Capita income in East Dundee is $59,855.
What is the Median Family Income in East Dundee?
Median Family Income in East Dundee is $99,868.
What is the Median Household income in East Dundee?
Median Household Income in East Dundee is $71,116.
What is Income or Wage Gap in East Dundee?
Income or Wage Gap in East Dundee is 46.0%.
Women in East Dundee earn 54.0 cents for every dollar earned by a man.
What is Inequality or Gini Index in East Dundee?
Inequality or Gini Index in East Dundee is 0.57.
What is the Total Population of East Dundee?
Total Population of East Dundee is 3,157.
What is the Total Male Population of East Dundee?
Total Male Population of East Dundee is 1,424.
What is the Total Female Population of East Dundee?
Total Female Population of East Dundee is 1,733.
What is the Ratio of Males per 100 Females in East Dundee?
There are 82.17 Males per 100 Females in East Dundee.
What is the Ratio of Females per 100 Males in East Dundee?
There are 121.70 Females per 100 Males in East Dundee.
What is the Median Population Age in East Dundee?
Median Population Age in East Dundee is 54.4 Years.
What is the Average Family Size in East Dundee
Average Family Size in East Dundee is 2.6 People.
What is the Average Household Size in East Dundee
Average Household Size in East Dundee is 2.0 People.
How Large is the Labor Force in East Dundee?
There are 1,935 People in the Labor Forcein in East Dundee.
What is the Percentage of People in the Labor Force in East Dundee?
66.2% of People are in the Labor Force in East Dundee.
What is the Unemployment Rate in East Dundee?
Unemployment Rate in East Dundee is 2.1%.