Countryside, IL Map & Demographics
Countryside Map
Countryside Overview
$51,722
PER CAPITA INCOME
$117,931
AVG FAMILY INCOME
$78,603
AVG HOUSEHOLD INCOME
32.1%
WAGE / INCOME GAP [ % ]
67.9¢/ $1
WAGE / INCOME GAP [ $ ]
0.46
INEQUALITY / GINI INDEX
6,322
TOTAL POPULATION
2,966
MALE POPULATION
3,356
FEMALE POPULATION
88.38
MALES / 100 FEMALES
113.15
FEMALES / 100 MALES
47.9
MEDIAN AGE
2.9
AVG FAMILY SIZE
2.2
AVG HOUSEHOLD SIZE
3,831
LABOR FORCE [ PEOPLE ]
70.4%
PERCENT IN LABOR FORCE
7.8%
UNEMPLOYMENT RATE
Income in Countryside
Income Overview in Countryside
Per Capita Income in Countryside is $51,722, while median incomes of families and households are $117,931 and $78,603 respectively.
| Characteristic | Number | Measure |
| Per Capita Income | 6,322 | $51,722 |
| Median Family Income | 1,727 | $117,931 |
| Mean Family Income | 1,727 | $145,862 |
| Median Household Income | 2,803 | $78,603 |
| Mean Household Income | 2,803 | $116,468 |
| Income Deficit | 1,727 | $0 |
| Wage / Income Gap (%) | 6,322 | 32.08% |
| Wage / Income Gap ($) | 6,322 | 67.92¢ per $1 |
| Gini / Inequality Index | 6,322 | 0.46 |
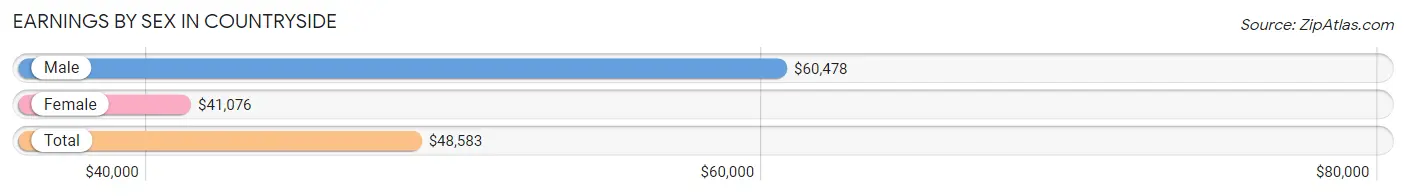
Earnings by Sex in Countryside
Average Earnings in Countryside are $48,583, $60,478 for men and $41,076 for women, a difference of 32.1%.
| Sex | Number | Average Earnings |
| Male | 1,998 (49.9%) | $60,478 |
| Female | 2,005 (50.1%) | $41,076 |
| Total | 4,003 (100.0%) | $48,583 |
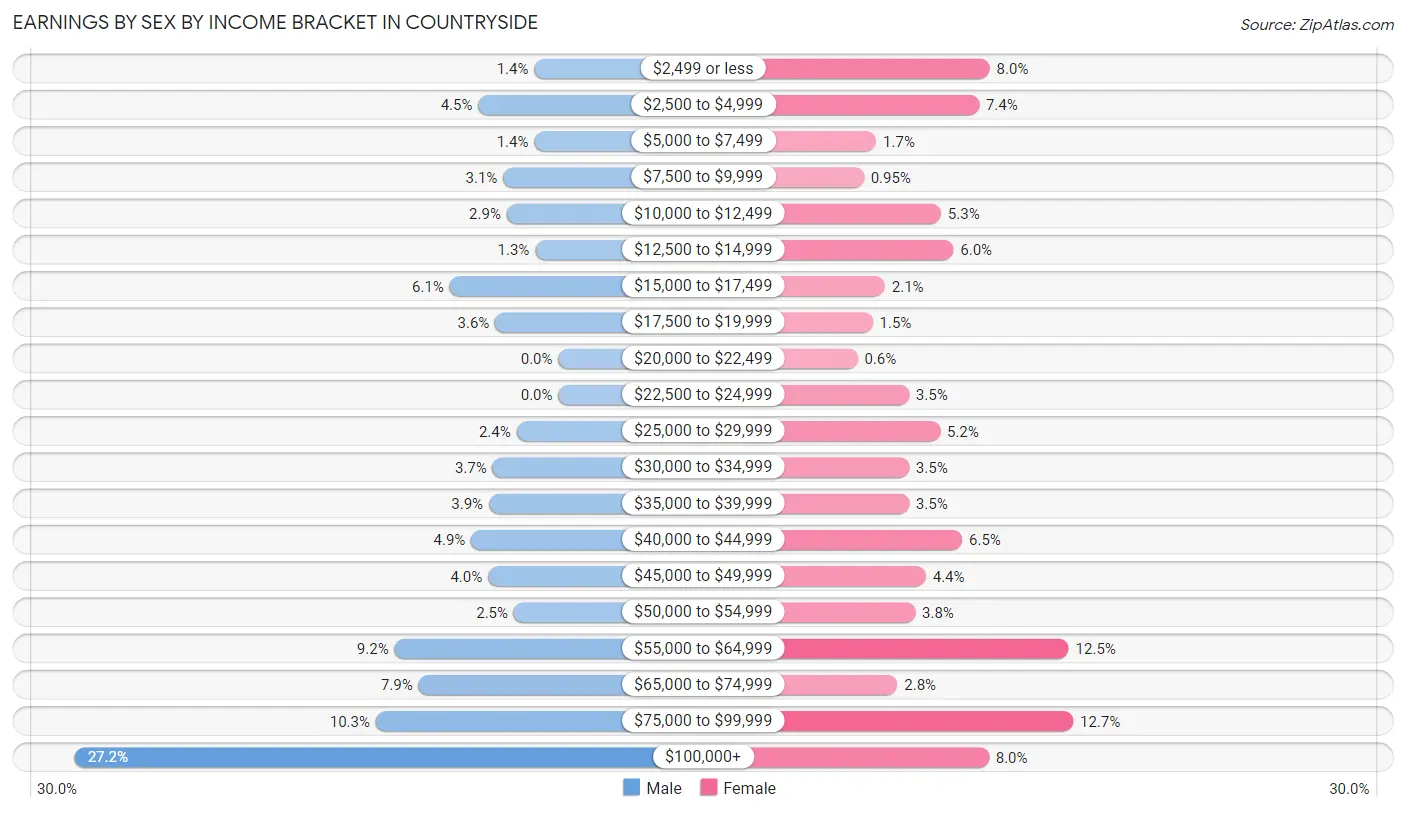
Earnings by Sex by Income Bracket in Countryside
The most common earnings brackets in Countryside are $100,000+ for men (543 | 27.2%) and $75,000 to $99,999 for women (255 | 12.7%).
| Income | Male | Female |
| $2,499 or less | 27 (1.3%) | 161 (8.0%) |
| $2,500 to $4,999 | 90 (4.5%) | 149 (7.4%) |
| $5,000 to $7,499 | 27 (1.3%) | 33 (1.7%) |
| $7,500 to $9,999 | 62 (3.1%) | 19 (0.9%) |
| $10,000 to $12,499 | 58 (2.9%) | 106 (5.3%) |
| $12,500 to $14,999 | 26 (1.3%) | 120 (6.0%) |
| $15,000 to $17,499 | 122 (6.1%) | 43 (2.1%) |
| $17,500 to $19,999 | 71 (3.5%) | 29 (1.5%) |
| $20,000 to $22,499 | 0 (0.0%) | 12 (0.6%) |
| $22,500 to $24,999 | 0 (0.0%) | 70 (3.5%) |
| $25,000 to $29,999 | 47 (2.4%) | 105 (5.2%) |
| $30,000 to $34,999 | 74 (3.7%) | 70 (3.5%) |
| $35,000 to $39,999 | 78 (3.9%) | 70 (3.5%) |
| $40,000 to $44,999 | 98 (4.9%) | 130 (6.5%) |
| $45,000 to $49,999 | 79 (4.0%) | 89 (4.4%) |
| $50,000 to $54,999 | 50 (2.5%) | 77 (3.8%) |
| $55,000 to $64,999 | 184 (9.2%) | 250 (12.5%) |
| $65,000 to $74,999 | 157 (7.9%) | 57 (2.8%) |
| $75,000 to $99,999 | 205 (10.3%) | 255 (12.7%) |
| $100,000+ | 543 (27.2%) | 160 (8.0%) |
| Total | 1,998 (100.0%) | 2,005 (100.0%) |
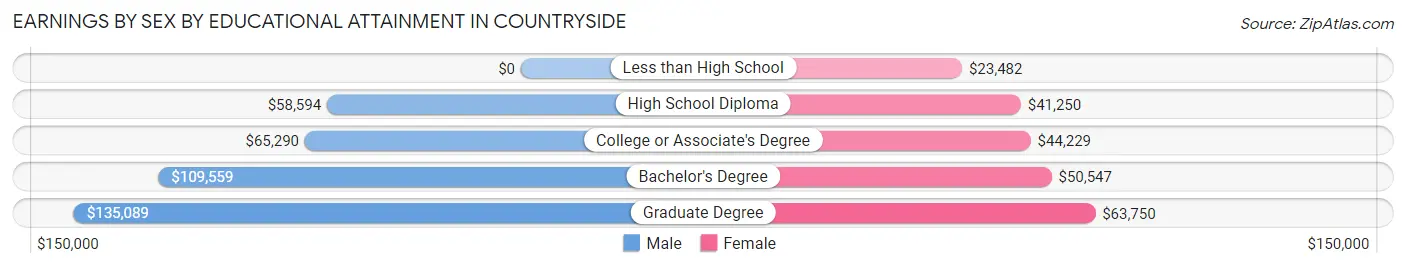
Earnings by Sex by Educational Attainment in Countryside
Average earnings in Countryside are $66,413 for men and $49,087 for women, a difference of 26.1%. Men with an educational attainment of graduate degree enjoy the highest average annual earnings of $135,089, while those with high school diploma education earn the least with $58,594. Women with an educational attainment of graduate degree earn the most with the average annual earnings of $63,750, while those with less than high school education have the smallest earnings of $23,482.
| Educational Attainment | Male Income | Female Income |
| Less than High School | - | - |
| High School Diploma | $58,594 | $41,250 |
| College or Associate's Degree | $65,290 | $44,229 |
| Bachelor's Degree | $109,559 | $50,547 |
| Graduate Degree | $135,089 | $63,750 |
| Total | $66,413 | $49,087 |
Family Income in Countryside
Family Income Brackets in Countryside
According to the Countryside family income data, there are 401 families falling into the $100,000 to $149,999 income range, which is the most common income bracket and makes up 23.2% of all families.
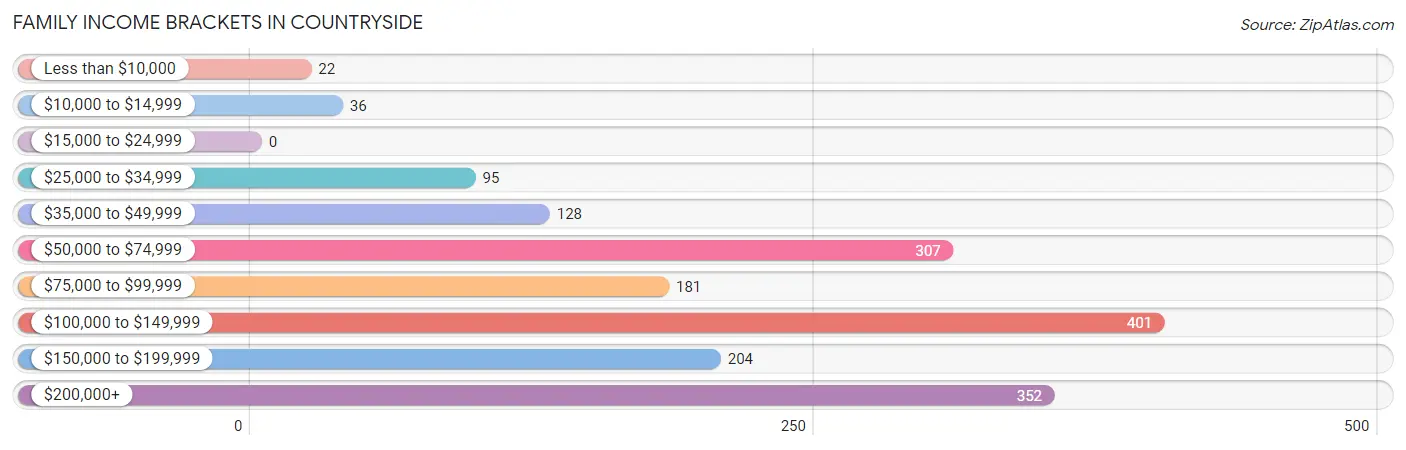
| Income Bracket | # Families | % Families |
| Less than $10,000 | 22 | 1.3% |
| $10,000 to $14,999 | 36 | 2.1% |
| $15,000 to $24,999 | 0 | 0.0% |
| $25,000 to $34,999 | 95 | 5.5% |
| $35,000 to $49,999 | 128 | 7.4% |
| $50,000 to $74,999 | 307 | 17.8% |
| $75,000 to $99,999 | 181 | 10.5% |
| $100,000 to $149,999 | 401 | 23.2% |
| $150,000 to $199,999 | 204 | 11.8% |
| $200,000+ | 352 | 20.4% |
Family Income by Famaliy Size in Countryside
4-person families (324 | 18.8%) account for the highest median family income in Countryside with $197,763 per family, while 4-person families (324 | 18.8%) have the highest median income of $49,441 per family member.
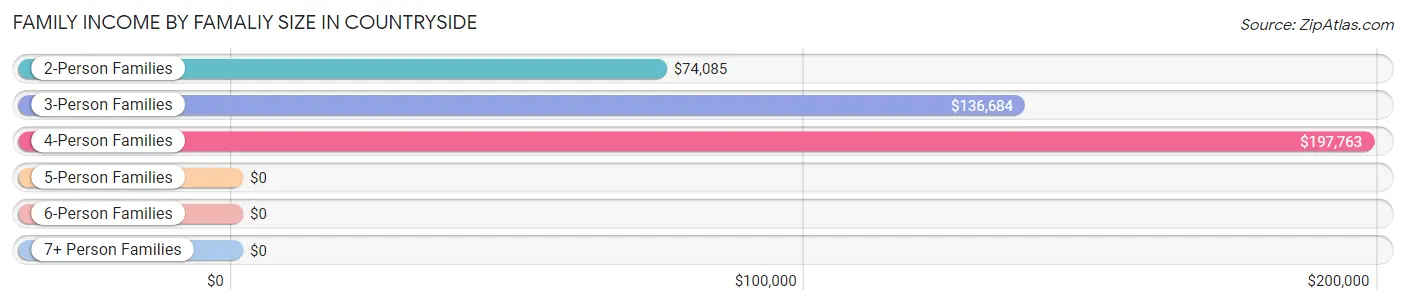
| Income Bracket | # Families | Median Income |
| 2-Person Families | 887 (51.4%) | $74,085 |
| 3-Person Families | 368 (21.3%) | $136,684 |
| 4-Person Families | 324 (18.8%) | $197,763 |
| 5-Person Families | 81 (4.7%) | $0 |
| 6-Person Families | 57 (3.3%) | $0 |
| 7+ Person Families | 10 (0.6%) | $0 |
| Total | 1,727 (100.0%) | $117,931 |
Family Income by Number of Earners in Countryside
The median family income in Countryside is $117,931, with families comprising 3+ earners (327) having the highest median family income of $212,841, while families with no earners (249) have the lowest median family income of $75,875, accounting for 18.9% and 14.4% of families, respectively.
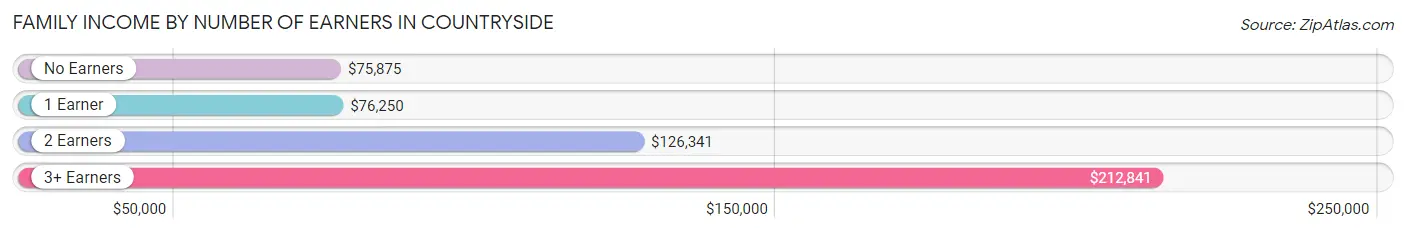
| Number of Earners | # Families | Median Income |
| No Earners | 249 (14.4%) | $75,875 |
| 1 Earner | 505 (29.2%) | $76,250 |
| 2 Earners | 646 (37.4%) | $126,341 |
| 3+ Earners | 327 (18.9%) | $212,841 |
| Total | 1,727 (100.0%) | $117,931 |
Household Income in Countryside
Household Income Brackets in Countryside
With 572 households falling in the category, the $50,000 to $74,999 income range is the most frequent in Countryside, accounting for 20.4% of all households. In contrast, only 56 households (2.0%) fall into the $10,000 to $14,999 income bracket, making it the least populous group.
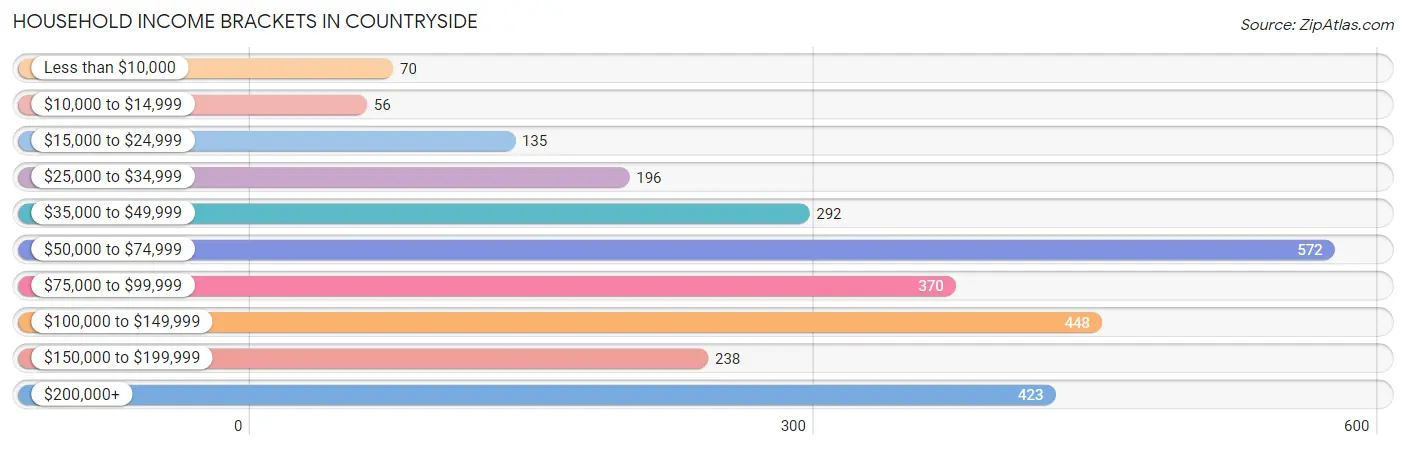
| Income Bracket | # Households | % Households |
| Less than $10,000 | 70 | 2.5% |
| $10,000 to $14,999 | 56 | 2.0% |
| $15,000 to $24,999 | 135 | 4.8% |
| $25,000 to $34,999 | 196 | 7.0% |
| $35,000 to $49,999 | 292 | 10.4% |
| $50,000 to $74,999 | 572 | 20.4% |
| $75,000 to $99,999 | 370 | 13.2% |
| $100,000 to $149,999 | 448 | 16.0% |
| $150,000 to $199,999 | 238 | 8.5% |
| $200,000+ | 423 | 15.1% |
Household Income by Householder Age in Countryside
The median household income in Countryside is $78,603, with the highest median household income of $106,806 found in the 45 to 64 years age bracket for the primary householder. A total of 1,253 households (44.7%) fall into this category. Meanwhile, the 15 to 24 years age bracket for the primary householder has the lowest median household income of $55,595, with 120 households (4.3%) in this group.
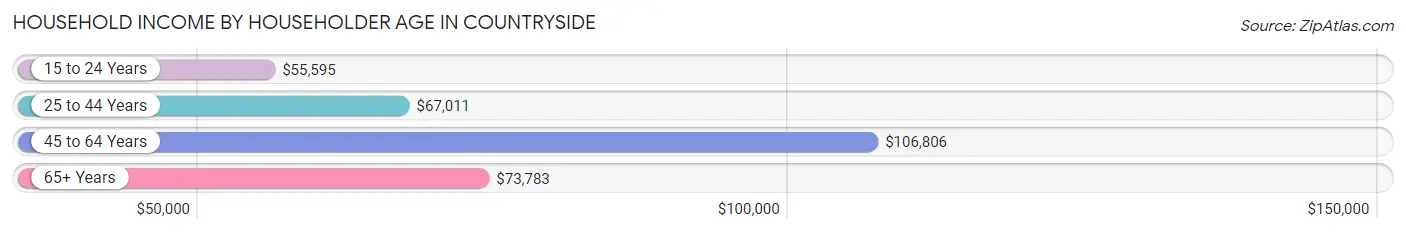
| Income Bracket | # Households | Median Income |
| 15 to 24 Years | 120 (4.3%) | $55,595 |
| 25 to 44 Years | 711 (25.4%) | $67,011 |
| 45 to 64 Years | 1,253 (44.7%) | $106,806 |
| 65+ Years | 719 (25.7%) | $73,783 |
| Total | 2,803 (100.0%) | $78,603 |
Poverty in Countryside
Income Below Poverty by Sex and Age in Countryside
With 5.5% poverty level for males and 9.4% for females among the residents of Countryside, 12 to 14 year old males and 6 to 11 year old females are the most vulnerable to poverty, with 50 males (32.1%) and 79 females (56.4%) in their respective age groups living below the poverty level.
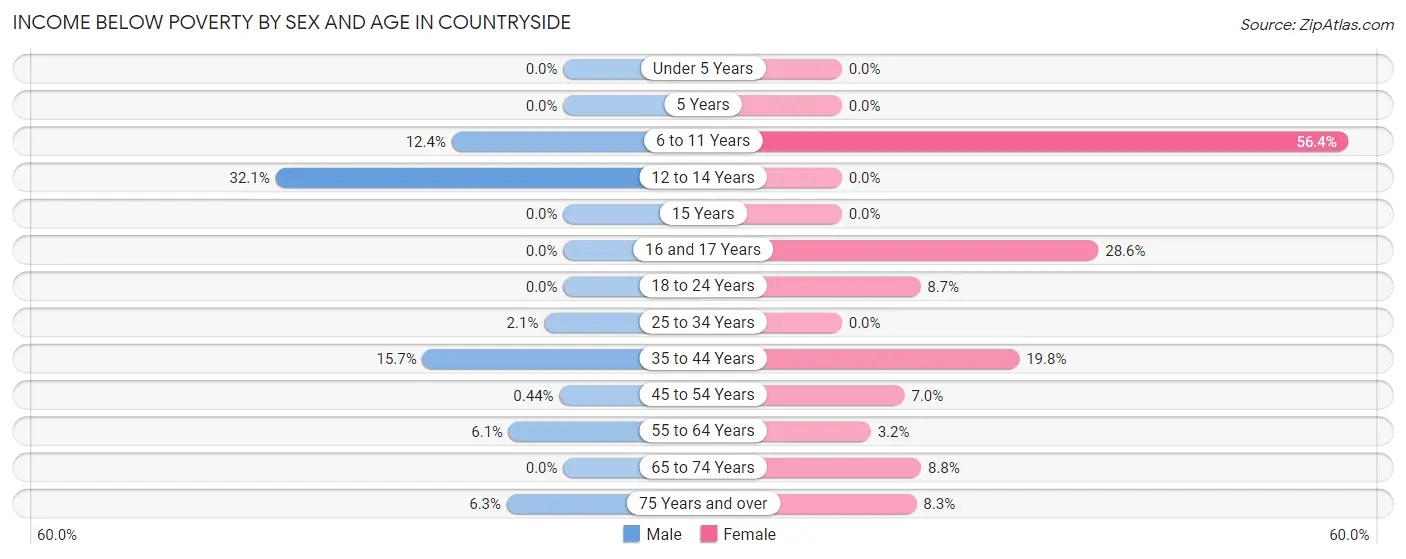
| Age Bracket | Male | Female |
| Under 5 Years | 0 (0.0%) | 0 (0.0%) |
| 5 Years | 0 (0.0%) | 0 (0.0%) |
| 6 to 11 Years | 22 (12.4%) | 79 (56.4%) |
| 12 to 14 Years | 50 (32.1%) | 0 (0.0%) |
| 15 Years | 0 (0.0%) | 0 (0.0%) |
| 16 and 17 Years | 0 (0.0%) | 40 (28.6%) |
| 18 to 24 Years | 0 (0.0%) | 27 (8.7%) |
| 25 to 34 Years | 10 (2.1%) | 0 (0.0%) |
| 35 to 44 Years | 37 (15.7%) | 50 (19.8%) |
| 45 to 54 Years | 2 (0.4%) | 33 (7.0%) |
| 55 to 64 Years | 33 (6.1%) | 18 (3.2%) |
| 65 to 74 Years | 0 (0.0%) | 41 (8.8%) |
| 75 Years and over | 10 (6.3%) | 28 (8.3%) |
| Total | 164 (5.5%) | 316 (9.4%) |
Income Above Poverty by Sex and Age in Countryside
According to the poverty statistics in Countryside, males aged under 5 years and females aged under 5 years are the age groups that are most secure financially, with 100.0% of males and 100.0% of females in these age groups living above the poverty line.
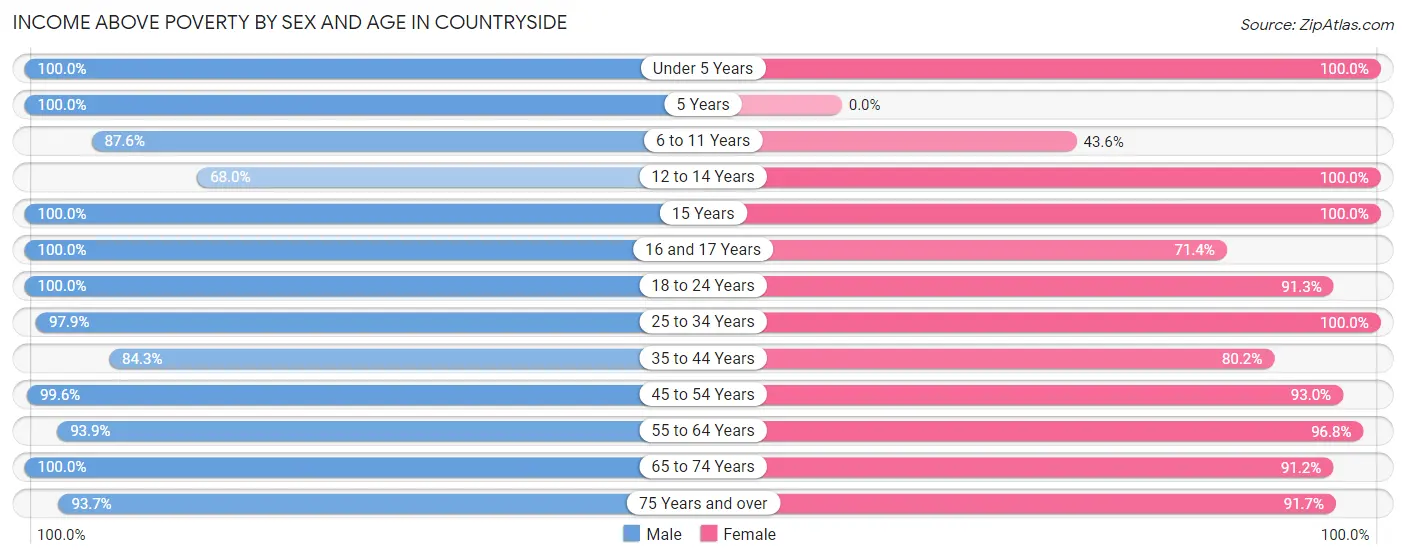
| Age Bracket | Male | Female |
| Under 5 Years | 77 (100.0%) | 130 (100.0%) |
| 5 Years | 9 (100.0%) | 0 (0.0%) |
| 6 to 11 Years | 155 (87.6%) | 61 (43.6%) |
| 12 to 14 Years | 106 (67.9%) | 102 (100.0%) |
| 15 Years | 20 (100.0%) | 69 (100.0%) |
| 16 and 17 Years | 84 (100.0%) | 100 (71.4%) |
| 18 to 24 Years | 268 (100.0%) | 282 (91.3%) |
| 25 to 34 Years | 459 (97.9%) | 380 (100.0%) |
| 35 to 44 Years | 199 (84.3%) | 203 (80.2%) |
| 45 to 54 Years | 448 (99.6%) | 439 (93.0%) |
| 55 to 64 Years | 512 (93.9%) | 541 (96.8%) |
| 65 to 74 Years | 316 (100.0%) | 424 (91.2%) |
| 75 Years and over | 149 (93.7%) | 309 (91.7%) |
| Total | 2,802 (94.5%) | 3,040 (90.6%) |
Income Below Poverty Among Married-Couple Families in Countryside
The poverty statistics for married-couple families in Countryside show that 1.9% or 23 of the total 1,184 families live below the poverty line. Families with no children have the highest poverty rate of 3.2%, comprising of 23 families. On the other hand, families with 1 or 2 children have the lowest poverty rate of 0.0%, which includes 0 families.
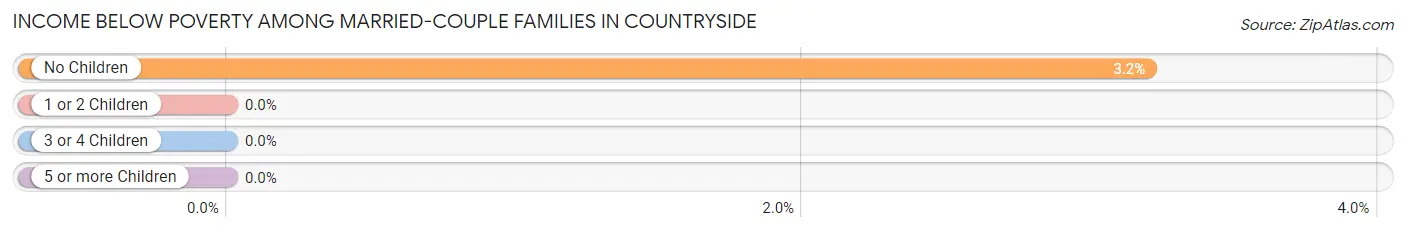
| Children | Above Poverty | Below Poverty |
| No Children | 696 (96.8%) | 23 (3.2%) |
| 1 or 2 Children | 408 (100.0%) | 0 (0.0%) |
| 3 or 4 Children | 57 (100.0%) | 0 (0.0%) |
| 5 or more Children | 0 (0.0%) | 0 (0.0%) |
| Total | 1,161 (98.1%) | 23 (1.9%) |
Income Below Poverty Among Single-Parent Households in Countryside
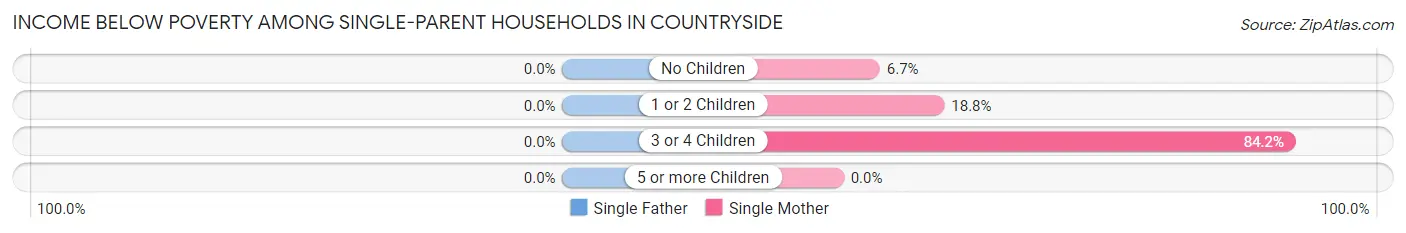
| Children | Single Father | Single Mother |
| No Children | 0 (0.0%) | 13 (6.7%) |
| 1 or 2 Children | 0 (0.0%) | 24 (18.8%) |
| 3 or 4 Children | 0 (0.0%) | 48 (84.2%) |
| 5 or more Children | 0 (0.0%) | 0 (0.0%) |
| Total | 0 (0.0%) | 85 (22.5%) |
Income Below Poverty Among Married-Couple vs Single-Parent Households in Countryside
The poverty data for Countryside shows that 23 of the married-couple family households (1.9%) and 85 of the single-parent households (15.7%) are living below the poverty level. Within the married-couple family households, those with no children have the highest poverty rate, with 23 households (3.2%) falling below the poverty line. Among the single-parent households, those with 3 or 4 children have the highest poverty rate, with 48 household (84.2%) living below poverty.
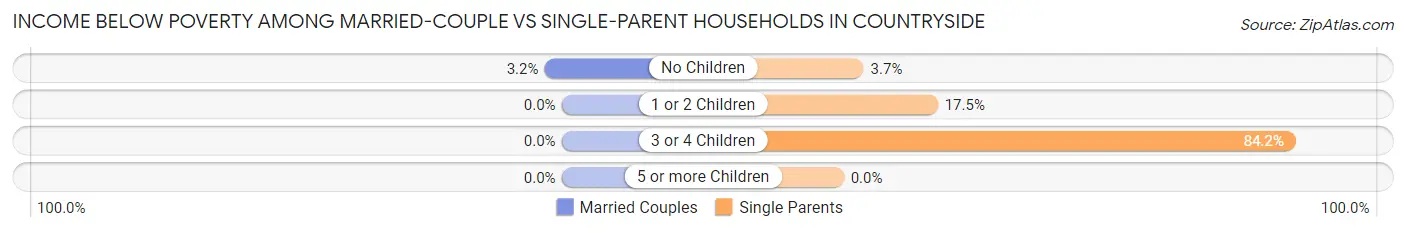
| Children | Married-Couple Families | Single-Parent Households |
| No Children | 23 (3.2%) | 13 (3.7%) |
| 1 or 2 Children | 0 (0.0%) | 24 (17.5%) |
| 3 or 4 Children | 0 (0.0%) | 48 (84.2%) |
| 5 or more Children | 0 (0.0%) | 0 (0.0%) |
| Total | 23 (1.9%) | 85 (15.7%) |
Race in Countryside
The most populous races in Countryside are White / Caucasian (5,045 | 79.8%), Hispanic or Latino (1,250 | 19.8%), and Some other Race (478 | 7.6%).
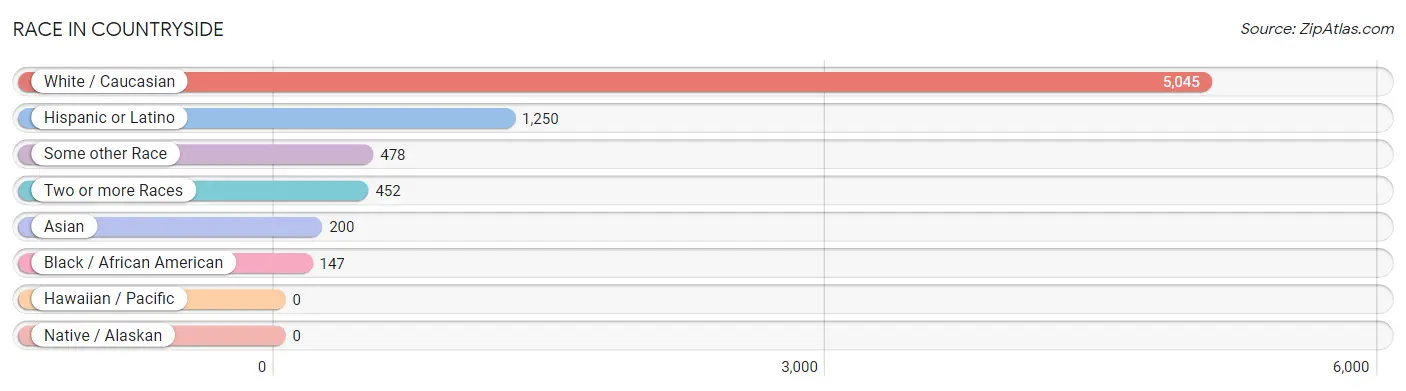
| Race | # Population | % Population |
| Asian | 200 | 3.2% |
| Black / African American | 147 | 2.3% |
| Hawaiian / Pacific | 0 | 0.0% |
| Hispanic or Latino | 1,250 | 19.8% |
| Native / Alaskan | 0 | 0.0% |
| White / Caucasian | 5,045 | 79.8% |
| Two or more Races | 452 | 7.1% |
| Some other Race | 478 | 7.6% |
| Total | 6,322 | 100.0% |
Ancestry in Countryside
The most populous ancestries reported in Countryside are Polish (1,049 | 16.6%), Irish (1,047 | 16.6%), Mexican (1,018 | 16.1%), Italian (907 | 14.3%), and German (806 | 12.8%), together accounting for 76.4% of all Countryside residents.
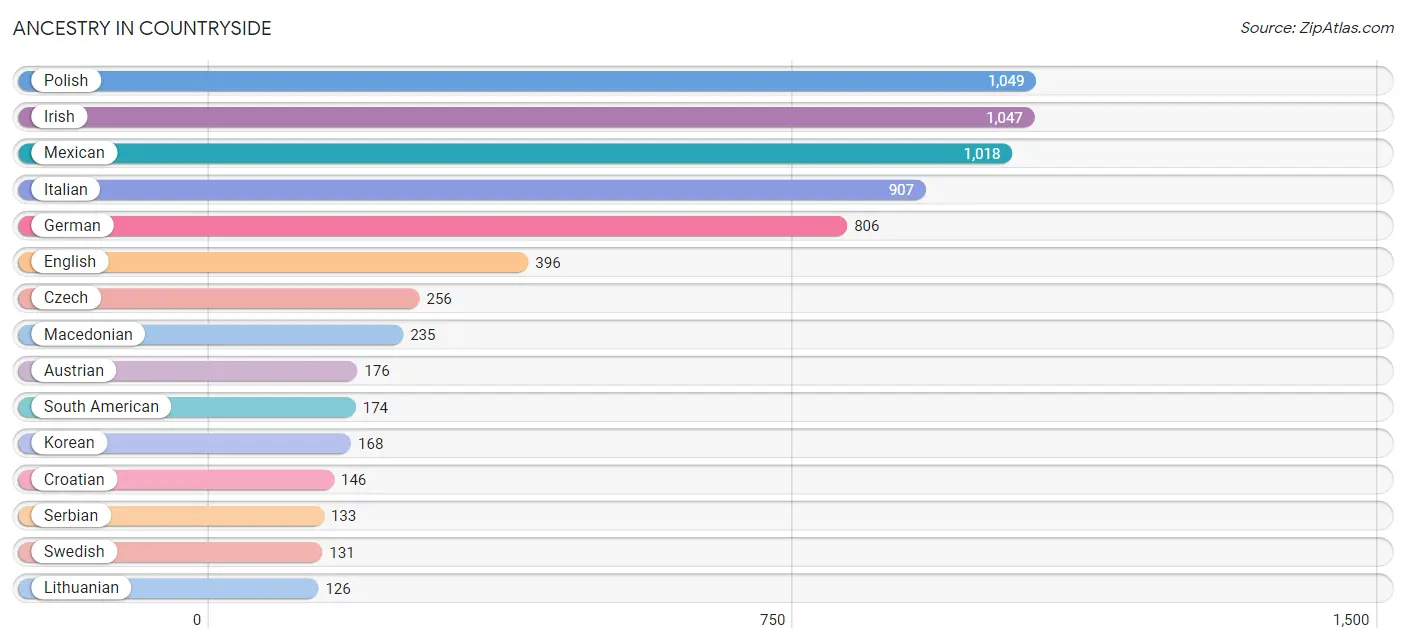
| Ancestry | # Population | % Population |
| American | 105 | 1.7% |
| Austrian | 176 | 2.8% |
| Burmese | 51 | 0.8% |
| Canadian | 5 | 0.1% |
| Colombian | 37 | 0.6% |
| Croatian | 146 | 2.3% |
| Czech | 256 | 4.1% |
| Czechoslovakian | 15 | 0.2% |
| Dutch | 69 | 1.1% |
| Eastern European | 18 | 0.3% |
| Ecuadorian | 116 | 1.8% |
| English | 396 | 6.3% |
| European | 44 | 0.7% |
| Finnish | 11 | 0.2% |
| French | 17 | 0.3% |
| German | 806 | 12.8% |
| Greek | 32 | 0.5% |
| Hungarian | 20 | 0.3% |
| Indian (Asian) | 52 | 0.8% |
| Irish | 1,047 | 16.6% |
| Italian | 907 | 14.3% |
| Korean | 168 | 2.7% |
| Lithuanian | 126 | 2.0% |
| Macedonian | 235 | 3.7% |
| Mexican | 1,018 | 16.1% |
| Northern European | 61 | 1.0% |
| Norwegian | 5 | 0.1% |
| Peruvian | 10 | 0.2% |
| Polish | 1,049 | 16.6% |
| Puerto Rican | 44 | 0.7% |
| Romanian | 8 | 0.1% |
| Russian | 36 | 0.6% |
| Scandinavian | 51 | 0.8% |
| Scotch-Irish | 23 | 0.4% |
| Scottish | 59 | 0.9% |
| Serbian | 133 | 2.1% |
| Slovak | 72 | 1.1% |
| Slovene | 16 | 0.3% |
| South American | 174 | 2.8% |
| Swedish | 131 | 2.1% |
| Thai | 43 | 0.7% |
| Turkish | 38 | 0.6% |
| Ukrainian | 26 | 0.4% |
| Welsh | 15 | 0.2% |
| Yugoslavian | 84 | 1.3% | View All 45 Rows |
Immigrants in Countryside
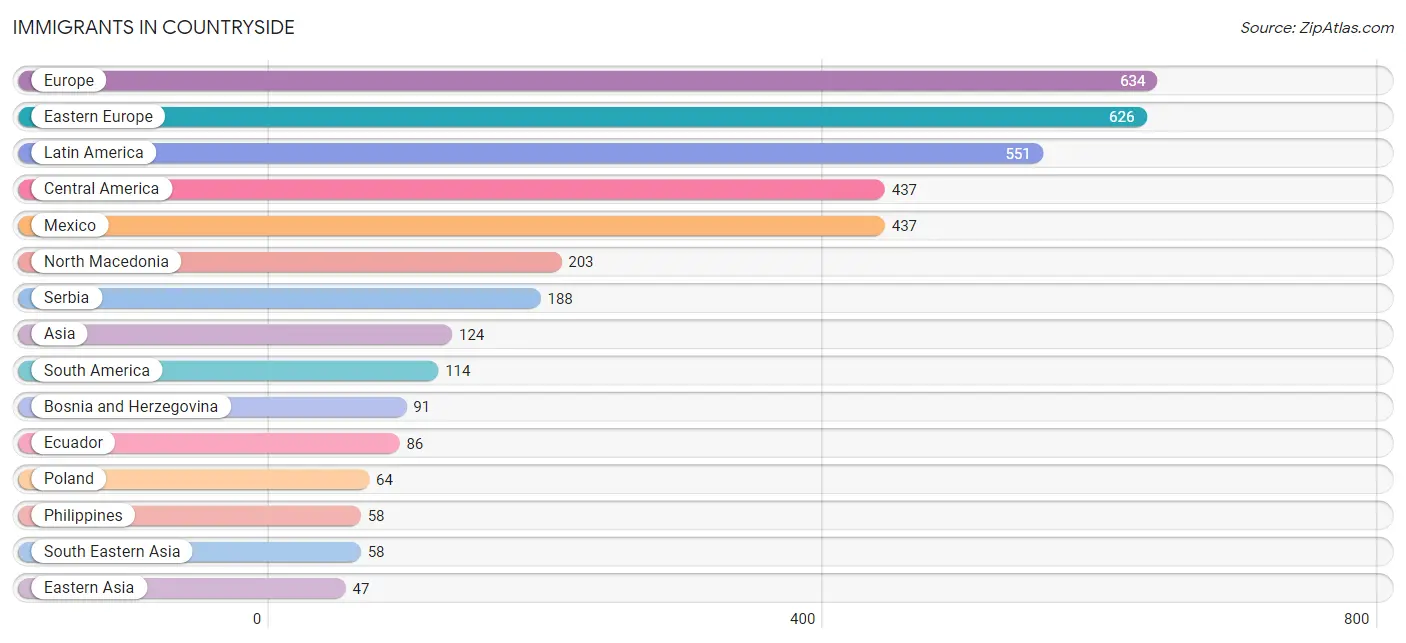
The most numerous immigrant groups reported in Countryside came from Europe (634 | 10.0%), Eastern Europe (626 | 9.9%), Latin America (551 | 8.7%), Central America (437 | 6.9%), and Mexico (437 | 6.9%), together accounting for 42.5% of all Countryside residents.
| Immigration Origin | # Population | % Population |
| Asia | 124 | 2.0% |
| Bosnia and Herzegovina | 91 | 1.4% |
| Canada | 9 | 0.1% |
| Central America | 437 | 6.9% |
| China | 36 | 0.6% |
| Colombia | 18 | 0.3% |
| Croatia | 36 | 0.6% |
| Eastern Asia | 47 | 0.7% |
| Eastern Europe | 626 | 9.9% |
| Ecuador | 86 | 1.4% |
| Europe | 634 | 10.0% |
| Italy | 8 | 0.1% |
| Korea | 11 | 0.2% |
| Latin America | 551 | 8.7% |
| Mexico | 437 | 6.9% |
| North Macedonia | 203 | 3.2% |
| Peru | 10 | 0.2% |
| Philippines | 58 | 0.9% |
| Poland | 64 | 1.0% |
| Russia | 17 | 0.3% |
| Serbia | 188 | 3.0% |
| South America | 114 | 1.8% |
| South Eastern Asia | 58 | 0.9% |
| Southern Europe | 8 | 0.1% |
| Turkey | 19 | 0.3% |
| Ukraine | 16 | 0.3% |
| Western Asia | 19 | 0.3% | View All 27 Rows |
Sex and Age in Countryside
Sex and Age in Countryside
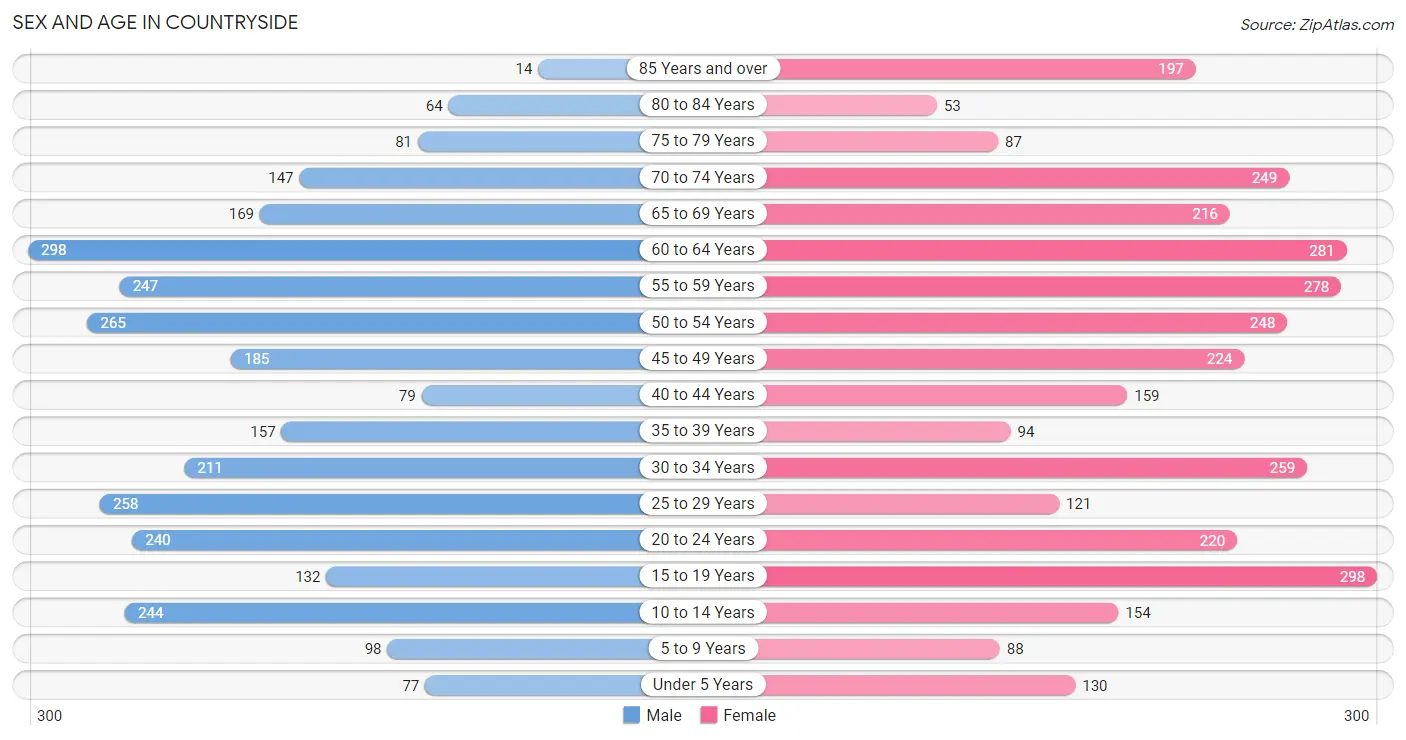
The most populous age groups in Countryside are 60 to 64 Years (298 | 10.1%) for men and 15 to 19 Years (298 | 8.9%) for women.
| Age Bracket | Male | Female |
| Under 5 Years | 77 (2.6%) | 130 (3.9%) |
| 5 to 9 Years | 98 (3.3%) | 88 (2.6%) |
| 10 to 14 Years | 244 (8.2%) | 154 (4.6%) |
| 15 to 19 Years | 132 (4.4%) | 298 (8.9%) |
| 20 to 24 Years | 240 (8.1%) | 220 (6.6%) |
| 25 to 29 Years | 258 (8.7%) | 121 (3.6%) |
| 30 to 34 Years | 211 (7.1%) | 259 (7.7%) |
| 35 to 39 Years | 157 (5.3%) | 94 (2.8%) |
| 40 to 44 Years | 79 (2.7%) | 159 (4.7%) |
| 45 to 49 Years | 185 (6.2%) | 224 (6.7%) |
| 50 to 54 Years | 265 (8.9%) | 248 (7.4%) |
| 55 to 59 Years | 247 (8.3%) | 278 (8.3%) |
| 60 to 64 Years | 298 (10.1%) | 281 (8.4%) |
| 65 to 69 Years | 169 (5.7%) | 216 (6.4%) |
| 70 to 74 Years | 147 (5.0%) | 249 (7.4%) |
| 75 to 79 Years | 81 (2.7%) | 87 (2.6%) |
| 80 to 84 Years | 64 (2.2%) | 53 (1.6%) |
| 85 Years and over | 14 (0.5%) | 197 (5.9%) |
| Total | 2,966 (100.0%) | 3,356 (100.0%) |
Families and Households in Countryside
Median Family Size in Countryside
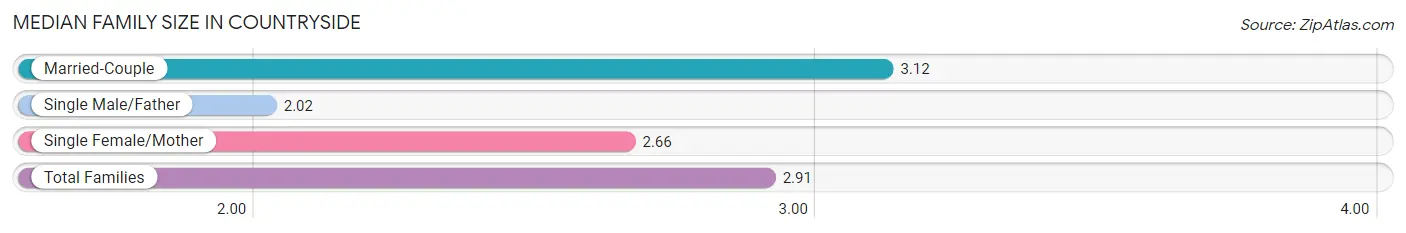
The median family size in Countryside is 2.91 persons per family, with married-couple families (1,184 | 68.6%) accounting for the largest median family size of 3.12 persons per family. On the other hand, single male/father families (165 | 9.6%) represent the smallest median family size with 2.02 persons per family.
| Family Type | # Families | Family Size |
| Married-Couple | 1,184 (68.6%) | 3.12 |
| Single Male/Father | 165 (9.6%) | 2.02 |
| Single Female/Mother | 378 (21.9%) | 2.66 |
| Total Families | 1,727 (100.0%) | 2.91 |
Median Household Size in Countryside
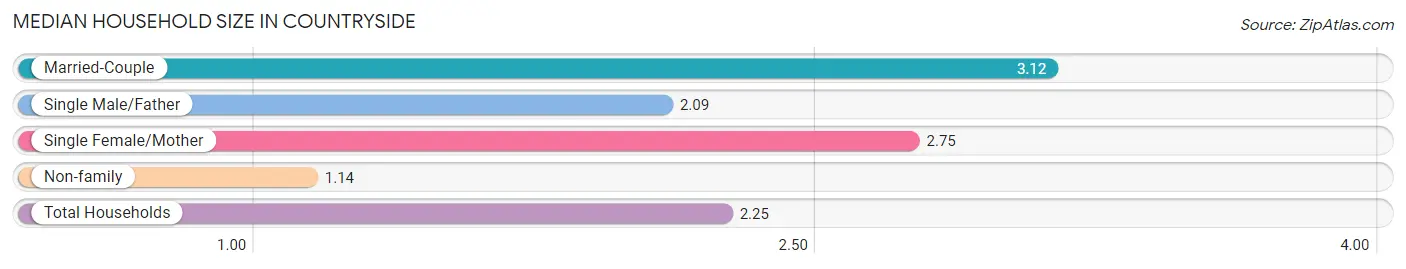
The median household size in Countryside is 2.25 persons per household, with married-couple households (1,184 | 42.2%) accounting for the largest median household size of 3.12 persons per household. non-family households (1,076 | 38.4%) represent the smallest median household size with 1.14 persons per household.
| Household Type | # Households | Household Size |
| Married-Couple | 1,184 (42.2%) | 3.12 |
| Single Male/Father | 165 (5.9%) | 2.09 |
| Single Female/Mother | 378 (13.5%) | 2.75 |
| Non-family | 1,076 (38.4%) | 1.14 |
| Total Households | 2,803 (100.0%) | 2.25 |
Household Size by Marriage Status in Countryside
Out of a total of 2,803 households in Countryside, 1,727 (61.6%) are family households, while 1,076 (38.4%) are nonfamily households. The most numerous type of family households are 2-person households, comprising 881, and the most common type of nonfamily households are 1-person households, comprising 946.
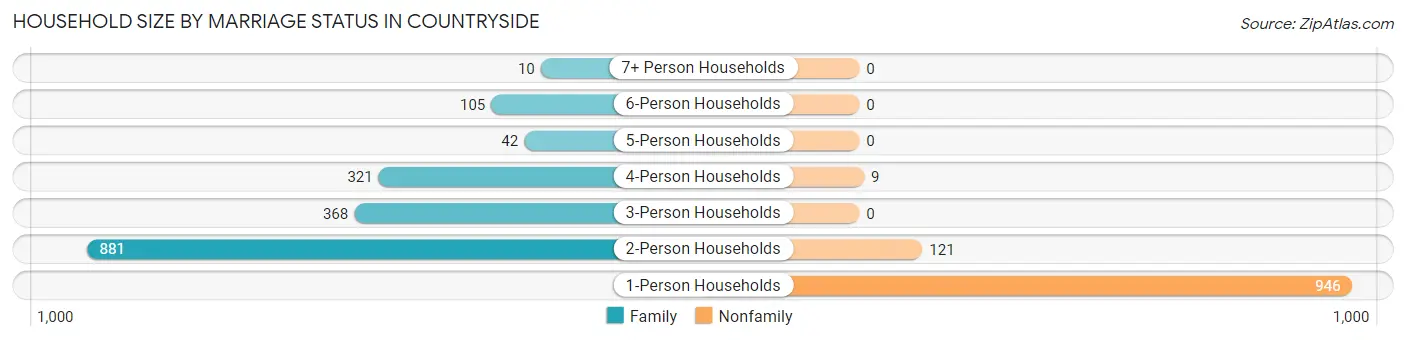
| Household Size | Family Households | Nonfamily Households |
| 1-Person Households | - | 946 (33.8%) |
| 2-Person Households | 881 (31.4%) | 121 (4.3%) |
| 3-Person Households | 368 (13.1%) | 0 (0.0%) |
| 4-Person Households | 321 (11.5%) | 9 (0.3%) |
| 5-Person Households | 42 (1.5%) | 0 (0.0%) |
| 6-Person Households | 105 (3.7%) | 0 (0.0%) |
| 7+ Person Households | 10 (0.4%) | 0 (0.0%) |
| Total | 1,727 (61.6%) | 1,076 (38.4%) |
Female Fertility in Countryside
Fertility by Age in Countryside
Average fertility rate in Countryside is 73.0 births per 1,000 women. Women in the age bracket of 20 to 34 years have the highest fertility rate with 138.0 births per 1,000 women. Women in the age bracket of 20 to 34 years acount for 81.4% of all women with births.
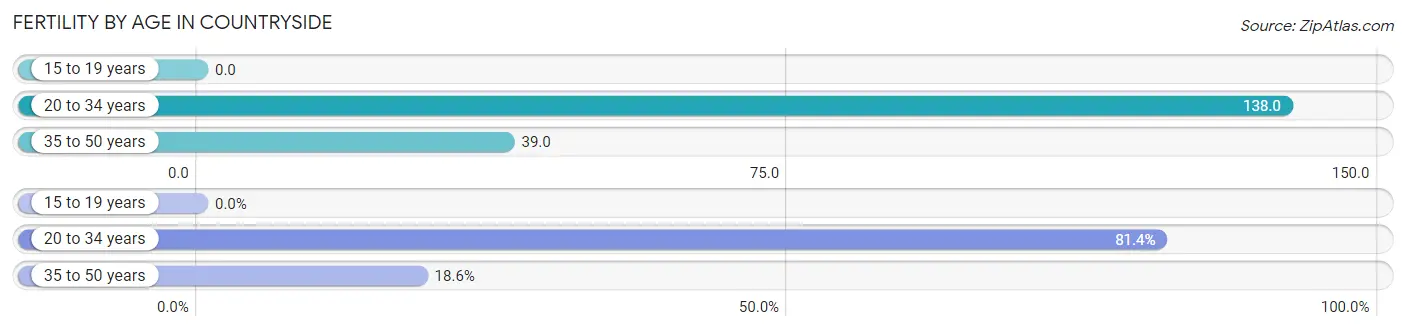
| Age Bracket | Women with Births | Births / 1,000 Women |
| 15 to 19 years | 0 (0.0%) | 0.0 |
| 20 to 34 years | 83 (81.4%) | 138.0 |
| 35 to 50 years | 19 (18.6%) | 39.0 |
| Total | 102 (100.0%) | 73.0 |
Fertility by Age by Marriage Status in Countryside
73.5% of women with births (102) in Countryside are married. The highest percentage of unmarried women with births falls into 20 to 34 years age bracket with 32.5% of them unmarried at the time of birth, while the lowest percentage of unmarried women with births belong to 35 to 50 years age bracket with 0.0% of them unmarried.
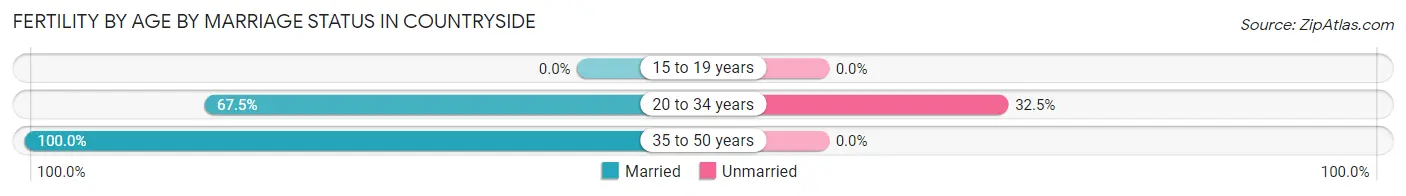
| Age Bracket | Married | Unmarried |
| 15 to 19 years | 0 (0.0%) | 0 (0.0%) |
| 20 to 34 years | 56 (67.5%) | 27 (32.5%) |
| 35 to 50 years | 19 (100.0%) | 0 (0.0%) |
| Total | 75 (73.5%) | 27 (26.5%) |
Fertility by Education in Countryside
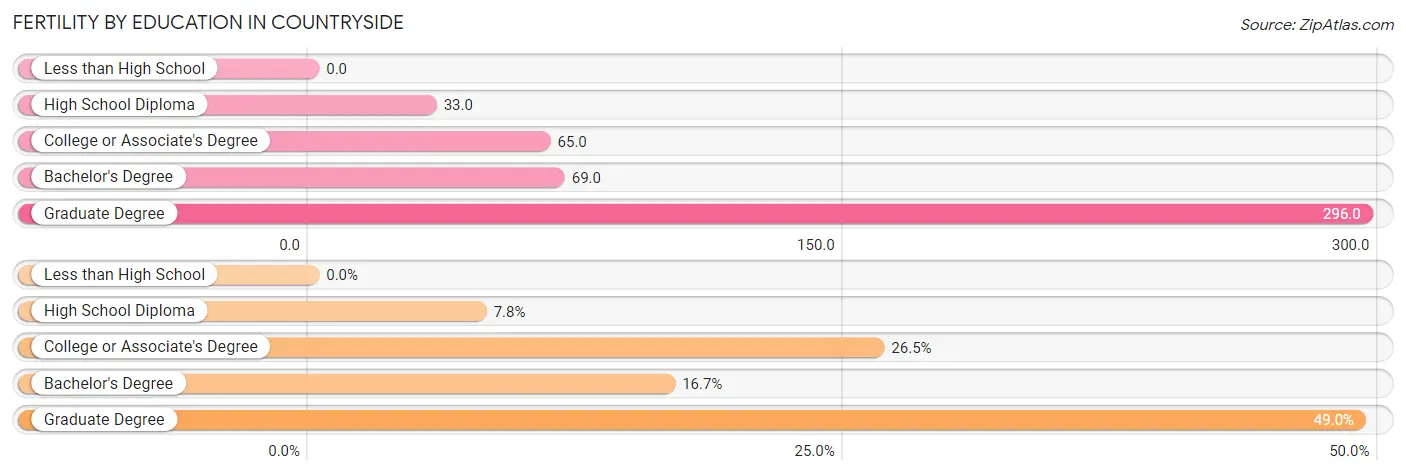
| Educational Attainment | Women with Births | Births / 1,000 Women |
| Less than High School | 0 (0.0%) | 0.0 |
| High School Diploma | 8 (7.8%) | 33.0 |
| College or Associate's Degree | 27 (26.5%) | 65.0 |
| Bachelor's Degree | 17 (16.7%) | 69.0 |
| Graduate Degree | 50 (49.0%) | 296.0 |
| Total | 102 (100.0%) | 73.0 |
Fertility by Education by Marriage Status in Countryside
26.5% of women with births in Countryside are unmarried. Women with the educational attainment of high school diploma are most likely to be married with 100.0% of them married at childbirth, while women with the educational attainment of college or associate's degree are least likely to be married with 100.0% of them unmarried at childbirth.
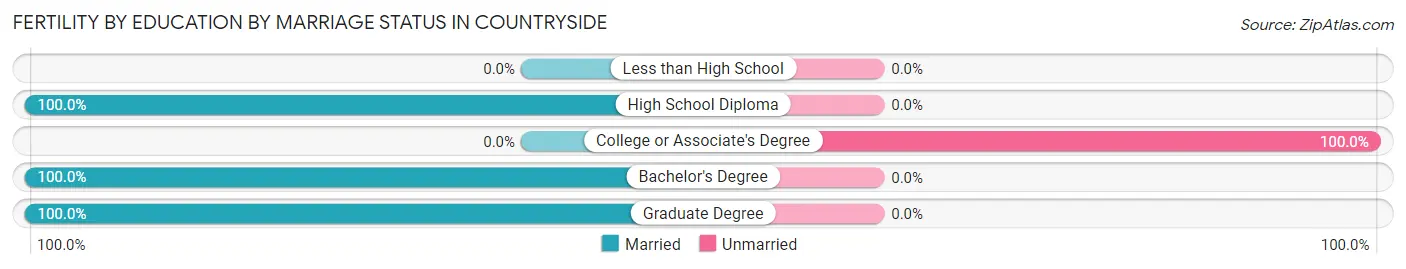
| Educational Attainment | Married | Unmarried |
| Less than High School | 0 (0.0%) | 0 (0.0%) |
| High School Diploma | 8 (100.0%) | 0 (0.0%) |
| College or Associate's Degree | 0 (0.0%) | 27 (100.0%) |
| Bachelor's Degree | 17 (100.0%) | 0 (0.0%) |
| Graduate Degree | 50 (100.0%) | 0 (0.0%) |
| Total | 75 (73.5%) | 27 (26.5%) |
Employment Characteristics in Countryside
Employment by Class of Employer in Countryside
Among the 3,386 employed individuals in Countryside, private company employees (2,454 | 72.5%), not-for-profit organizations (398 | 11.7%), and self-employed (incorporated) (215 | 6.4%) make up the most common classes of employment.
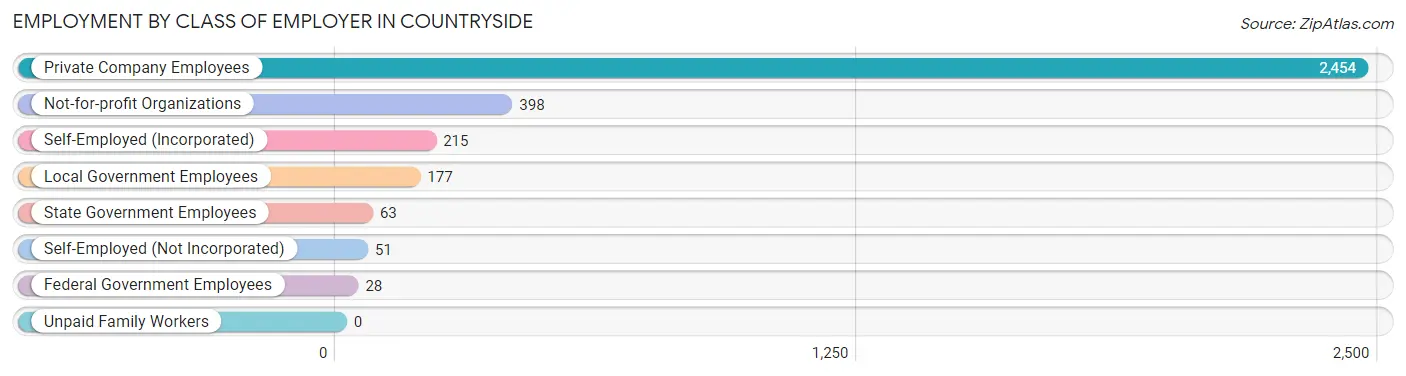
| Employer Class | # Employees | % Employees |
| Private Company Employees | 2,454 | 72.5% |
| Self-Employed (Incorporated) | 215 | 6.4% |
| Self-Employed (Not Incorporated) | 51 | 1.5% |
| Not-for-profit Organizations | 398 | 11.7% |
| Local Government Employees | 177 | 5.2% |
| State Government Employees | 63 | 1.9% |
| Federal Government Employees | 28 | 0.8% |
| Unpaid Family Workers | 0 | 0.0% |
| Total | 3,386 | 100.0% |
Employment Status by Age in Countryside
According to the labor force statistics for Countryside, out of the total population over 16 years of age (5,442), 70.4% or 3,831 individuals are in the labor force, with 7.8% or 299 of them unemployed. The age group with the highest labor force participation rate is 25 to 29 years, with 96.6% or 366 individuals in the labor force. Within the labor force, the 16 to 19 years age range has the highest percentage of unemployed individuals, with 52.3% or 137 of them being unemployed.
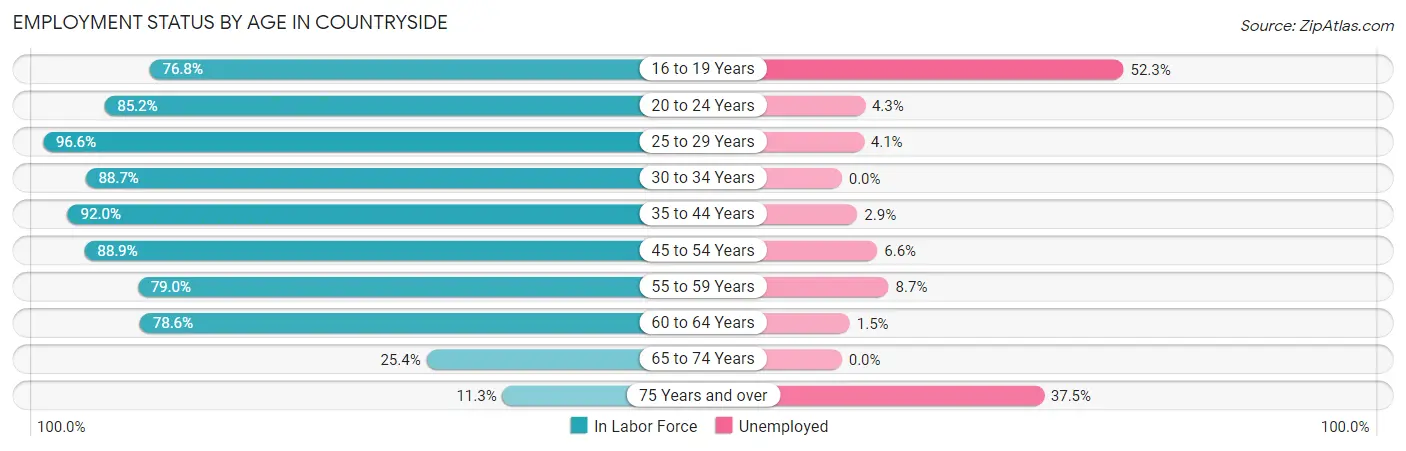
| Age Bracket | In Labor Force | Unemployed |
| 16 to 19 Years | 262 (76.8%) | 137 (52.3%) |
| 20 to 24 Years | 392 (85.2%) | 17 (4.3%) |
| 25 to 29 Years | 366 (96.6%) | 15 (4.1%) |
| 30 to 34 Years | 417 (88.7%) | 0 (0.0%) |
| 35 to 44 Years | 450 (92.0%) | 13 (2.9%) |
| 45 to 54 Years | 820 (88.9%) | 54 (6.6%) |
| 55 to 59 Years | 415 (79.0%) | 36 (8.7%) |
| 60 to 64 Years | 455 (78.6%) | 7 (1.5%) |
| 65 to 74 Years | 198 (25.4%) | 0 (0.0%) |
| 75 Years and over | 56 (11.3%) | 21 (37.5%) |
| Total | 3,831 (70.4%) | 299 (7.8%) |
Employment Status by Educational Attainment in Countryside
According to labor force statistics for Countryside, 86.9% of individuals (2,923) out of the total population between 25 and 64 years of age (3,364) are in the labor force, with 4.3% or 126 of them being unemployed. The group with the highest labor force participation rate are those with the educational attainment of bachelor's degree or higher, with 93.3% or 1,225 individuals in the labor force. Within the labor force, individuals with less than high school education have the highest percentage of unemployment, with 31.1% or 90 of them being unemployed.
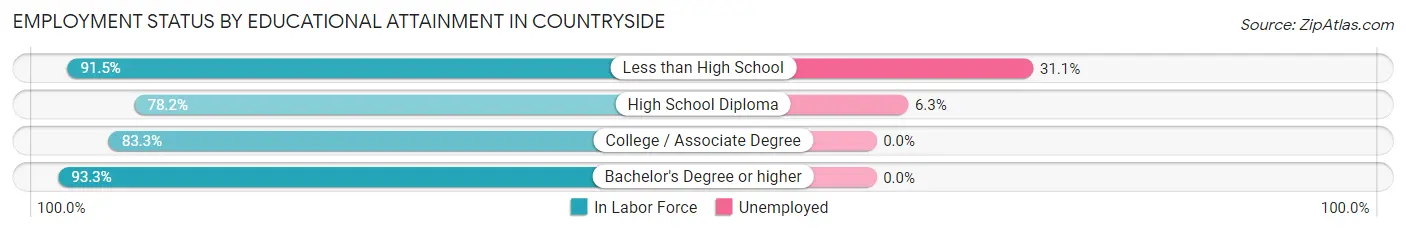
| Educational Attainment | In Labor Force | Unemployed |
| Less than High School | 289 (91.5%) | 98 (31.1%) |
| High School Diploma | 554 (78.2%) | 45 (6.3%) |
| College / Associate Degree | 855 (83.3%) | 0 (0.0%) |
| Bachelor's Degree or higher | 1,225 (93.3%) | 0 (0.0%) |
| Total | 2,923 (86.9%) | 145 (4.3%) |
Employment Occupations by Sex in Countryside
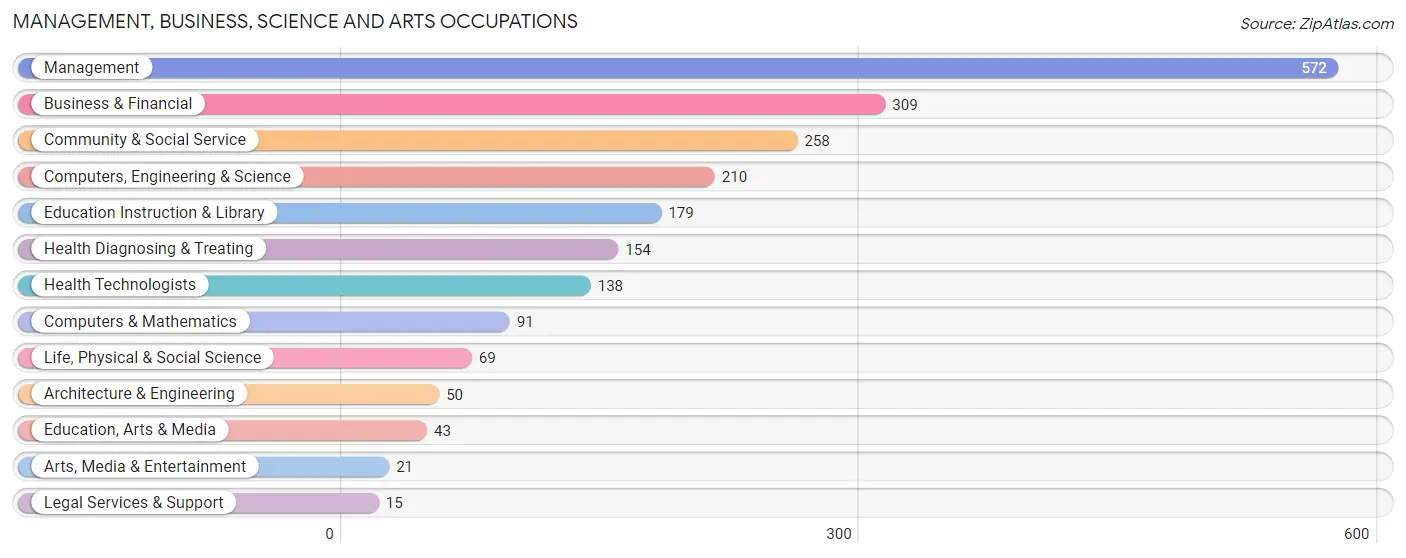
Management, Business, Science and Arts Occupations
The most common Management, Business, Science and Arts occupations in Countryside are Management (572 | 16.2%), Business & Financial (309 | 8.7%), Community & Social Service (258 | 7.3%), Computers, Engineering & Science (210 | 5.9%), and Education Instruction & Library (179 | 5.1%).
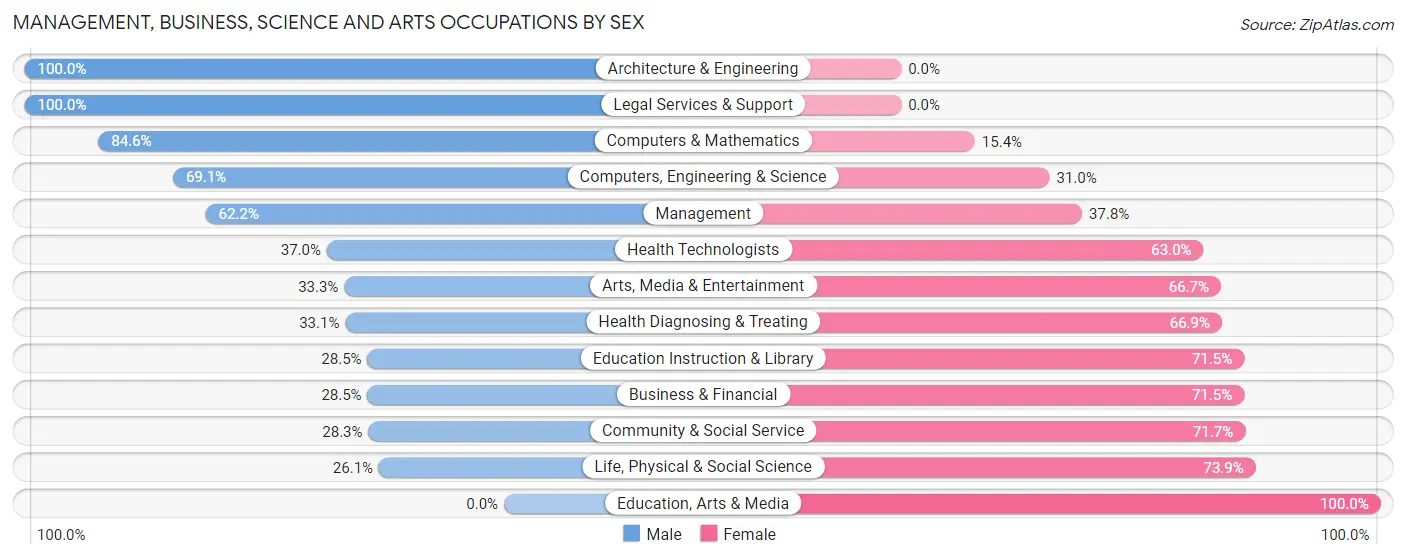
Management, Business, Science and Arts Occupations by Sex
Within the Management, Business, Science and Arts occupations in Countryside, the most male-oriented occupations are Architecture & Engineering (100.0%), Legal Services & Support (100.0%), and Computers & Mathematics (84.6%), while the most female-oriented occupations are Education, Arts & Media (100.0%), Life, Physical & Social Science (73.9%), and Community & Social Service (71.7%).
| Occupation | Male | Female |
| Management | 356 (62.2%) | 216 (37.8%) |
| Business & Financial | 88 (28.5%) | 221 (71.5%) |
| Computers, Engineering & Science | 145 (69.1%) | 65 (30.9%) |
| Computers & Mathematics | 77 (84.6%) | 14 (15.4%) |
| Architecture & Engineering | 50 (100.0%) | 0 (0.0%) |
| Life, Physical & Social Science | 18 (26.1%) | 51 (73.9%) |
| Community & Social Service | 73 (28.3%) | 185 (71.7%) |
| Education, Arts & Media | 0 (0.0%) | 43 (100.0%) |
| Legal Services & Support | 15 (100.0%) | 0 (0.0%) |
| Education Instruction & Library | 51 (28.5%) | 128 (71.5%) |
| Arts, Media & Entertainment | 7 (33.3%) | 14 (66.7%) |
| Health Diagnosing & Treating | 51 (33.1%) | 103 (66.9%) |
| Health Technologists | 51 (37.0%) | 87 (63.0%) |
| Total (Category) | 713 (47.4%) | 790 (52.6%) |
| Total (Overall) | 1,778 (50.3%) | 1,753 (49.6%) |
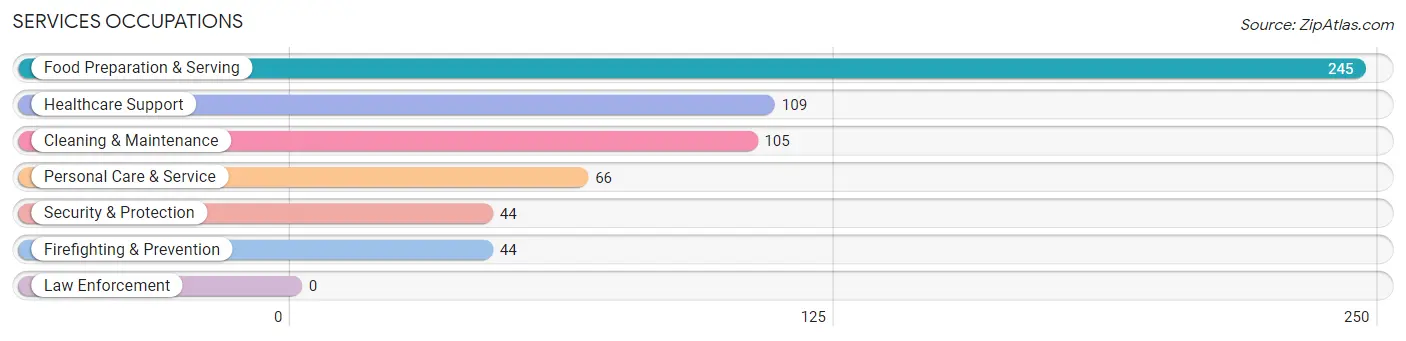
Services Occupations
The most common Services occupations in Countryside are Food Preparation & Serving (245 | 6.9%), Healthcare Support (109 | 3.1%), Cleaning & Maintenance (105 | 3.0%), Personal Care & Service (66 | 1.9%), and Security & Protection (44 | 1.3%).
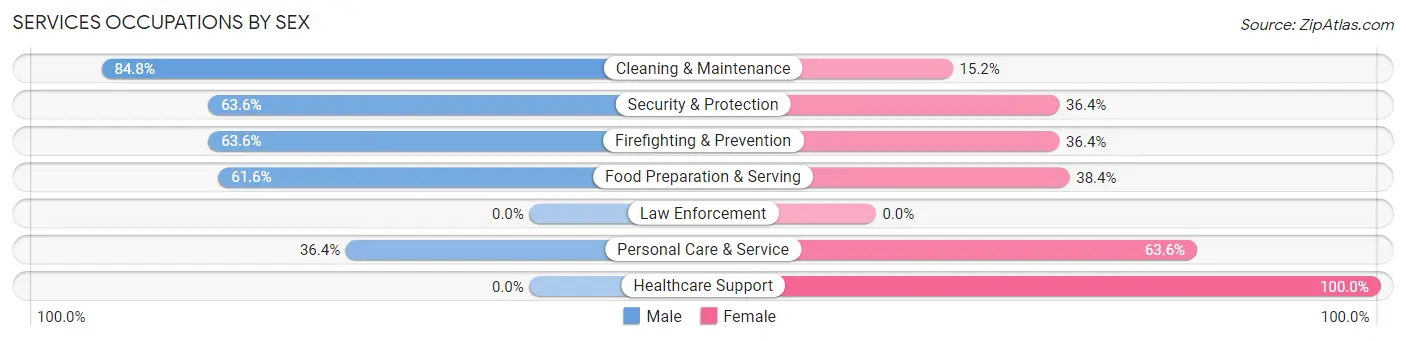
Services Occupations by Sex
Within the Services occupations in Countryside, the most male-oriented occupations are Cleaning & Maintenance (84.8%), Security & Protection (63.6%), and Firefighting & Prevention (63.6%), while the most female-oriented occupations are Healthcare Support (100.0%), Personal Care & Service (63.6%), and Food Preparation & Serving (38.4%).
| Occupation | Male | Female |
| Healthcare Support | 0 (0.0%) | 109 (100.0%) |
| Security & Protection | 28 (63.6%) | 16 (36.4%) |
| Firefighting & Prevention | 28 (63.6%) | 16 (36.4%) |
| Law Enforcement | 0 (0.0%) | 0 (0.0%) |
| Food Preparation & Serving | 151 (61.6%) | 94 (38.4%) |
| Cleaning & Maintenance | 89 (84.8%) | 16 (15.2%) |
| Personal Care & Service | 24 (36.4%) | 42 (63.6%) |
| Total (Category) | 292 (51.3%) | 277 (48.7%) |
| Total (Overall) | 1,778 (50.3%) | 1,753 (49.6%) |
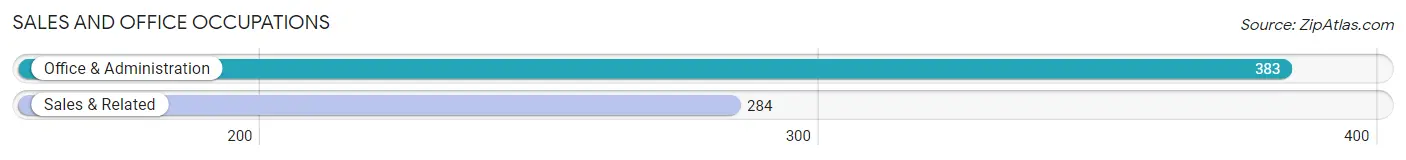
Sales and Office Occupations
The most common Sales and Office occupations in Countryside are Office & Administration (383 | 10.8%), and Sales & Related (284 | 8.0%).
Sales and Office Occupations by Sex
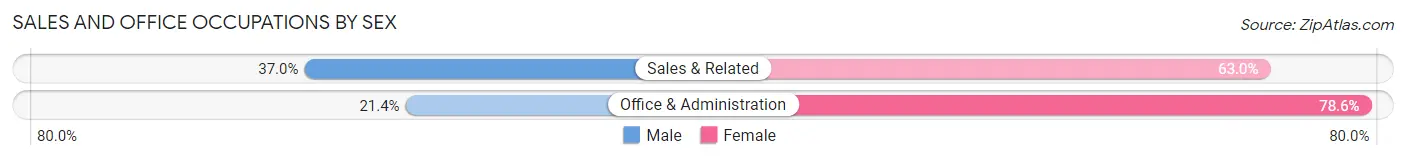
| Occupation | Male | Female |
| Sales & Related | 105 (37.0%) | 179 (63.0%) |
| Office & Administration | 82 (21.4%) | 301 (78.6%) |
| Total (Category) | 187 (28.0%) | 480 (72.0%) |
| Total (Overall) | 1,778 (50.3%) | 1,753 (49.6%) |
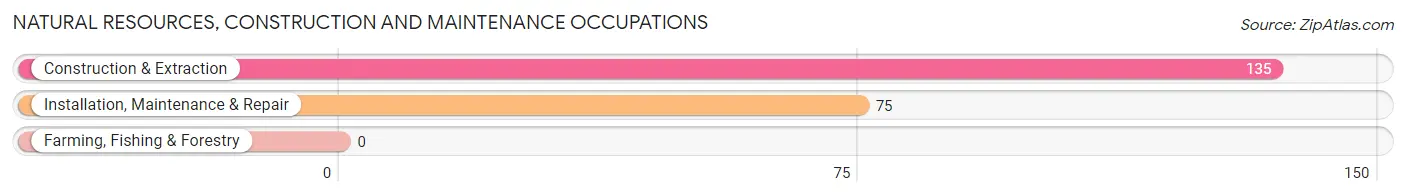
Natural Resources, Construction and Maintenance Occupations
The most common Natural Resources, Construction and Maintenance occupations in Countryside are Construction & Extraction (135 | 3.8%), and Installation, Maintenance & Repair (75 | 2.1%).
Natural Resources, Construction and Maintenance Occupations by Sex
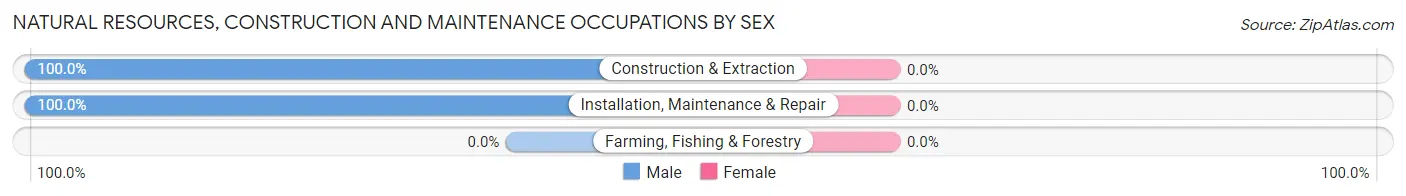
| Occupation | Male | Female |
| Farming, Fishing & Forestry | 0 (0.0%) | 0 (0.0%) |
| Construction & Extraction | 135 (100.0%) | 0 (0.0%) |
| Installation, Maintenance & Repair | 75 (100.0%) | 0 (0.0%) |
| Total (Category) | 210 (100.0%) | 0 (0.0%) |
| Total (Overall) | 1,778 (50.3%) | 1,753 (49.6%) |
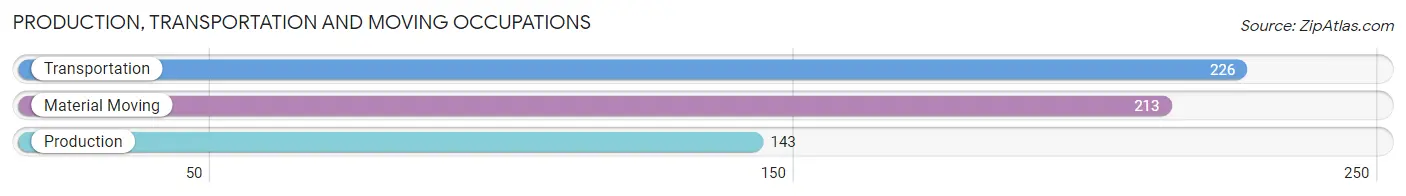
Production, Transportation and Moving Occupations
The most common Production, Transportation and Moving occupations in Countryside are Transportation (226 | 6.4%), Material Moving (213 | 6.0%), and Production (143 | 4.1%).
Production, Transportation and Moving Occupations by Sex
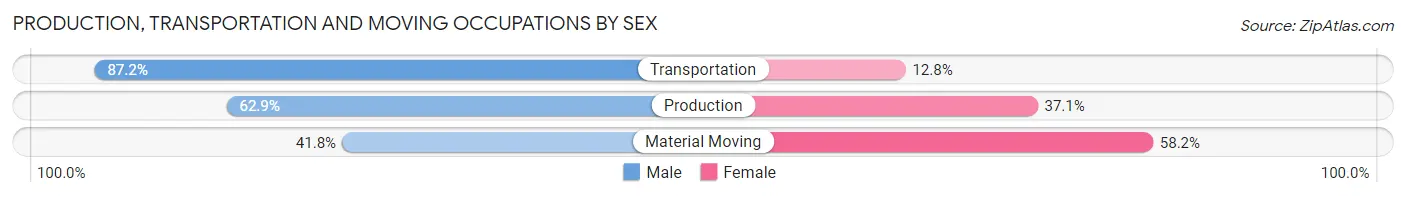
| Occupation | Male | Female |
| Production | 90 (62.9%) | 53 (37.1%) |
| Transportation | 197 (87.2%) | 29 (12.8%) |
| Material Moving | 89 (41.8%) | 124 (58.2%) |
| Total (Category) | 376 (64.6%) | 206 (35.4%) |
| Total (Overall) | 1,778 (50.3%) | 1,753 (49.6%) |
Employment Industries by Sex in Countryside
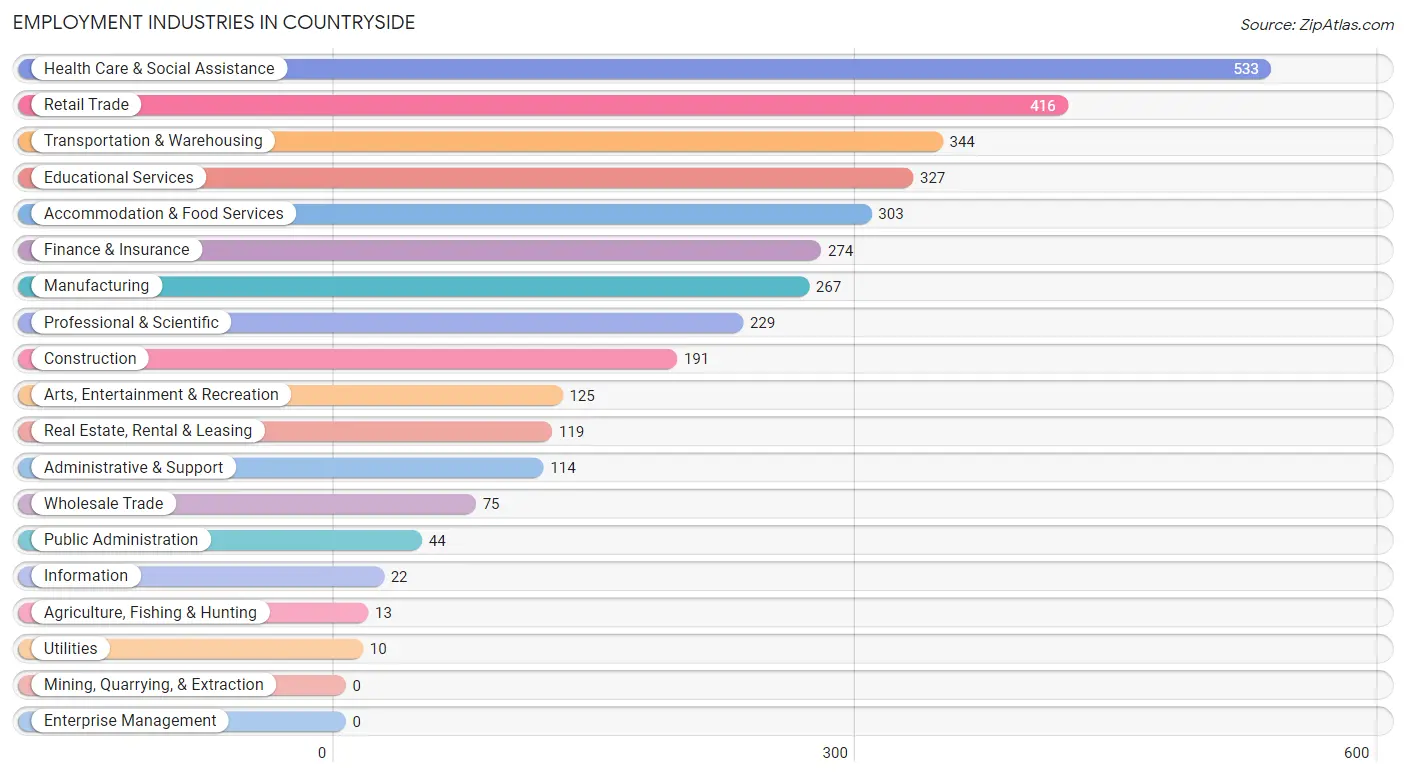
Employment Industries in Countryside
The major employment industries in Countryside include Health Care & Social Assistance (533 | 15.1%), Retail Trade (416 | 11.8%), Transportation & Warehousing (344 | 9.7%), Educational Services (327 | 9.3%), and Accommodation & Food Services (303 | 8.6%).
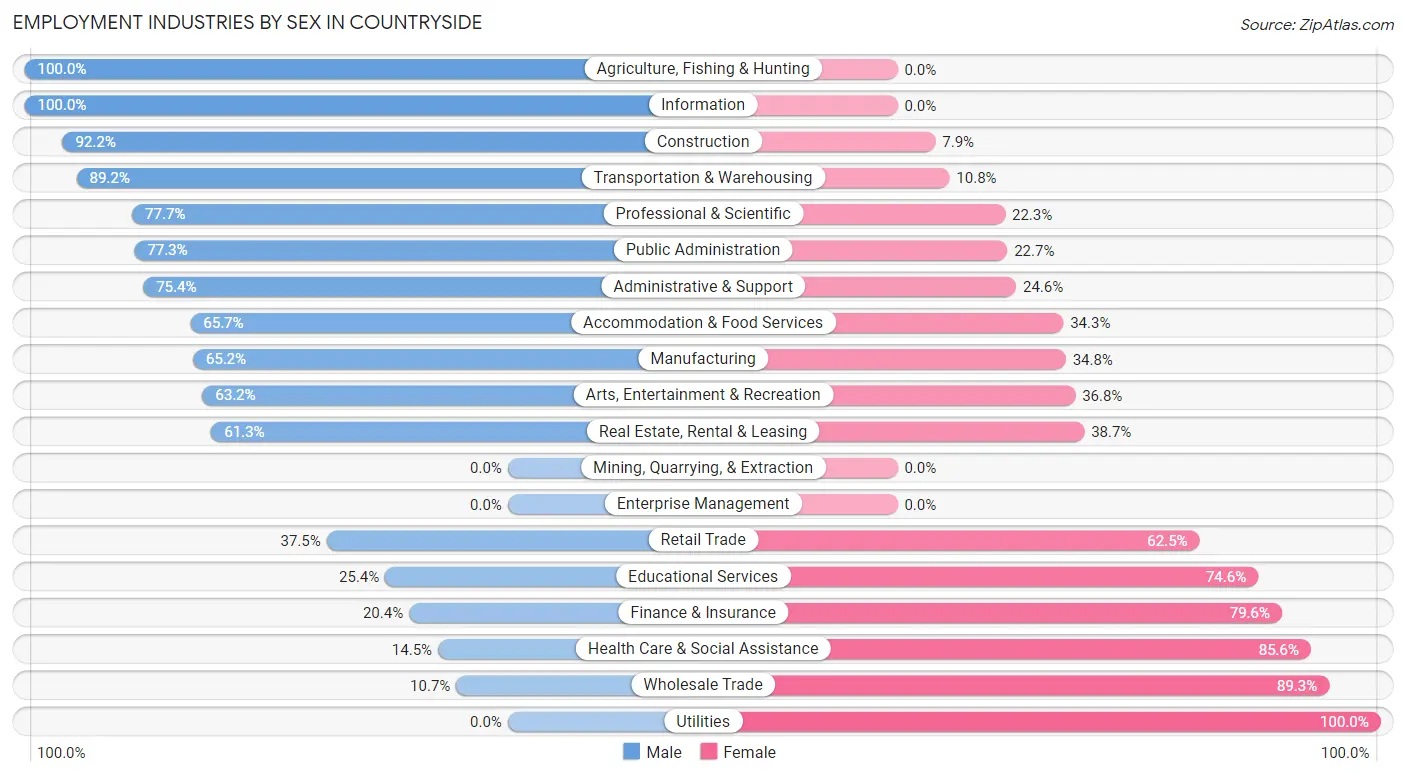
Employment Industries by Sex in Countryside
The Countryside industries that see more men than women are Agriculture, Fishing & Hunting (100.0%), Information (100.0%), and Construction (92.1%), whereas the industries that tend to have a higher number of women are Utilities (100.0%), Wholesale Trade (89.3%), and Health Care & Social Assistance (85.6%).
| Industry | Male | Female |
| Agriculture, Fishing & Hunting | 13 (100.0%) | 0 (0.0%) |
| Mining, Quarrying, & Extraction | 0 (0.0%) | 0 (0.0%) |
| Construction | 176 (92.1%) | 15 (7.9%) |
| Manufacturing | 174 (65.2%) | 93 (34.8%) |
| Wholesale Trade | 8 (10.7%) | 67 (89.3%) |
| Retail Trade | 156 (37.5%) | 260 (62.5%) |
| Transportation & Warehousing | 307 (89.2%) | 37 (10.8%) |
| Utilities | 0 (0.0%) | 10 (100.0%) |
| Information | 22 (100.0%) | 0 (0.0%) |
| Finance & Insurance | 56 (20.4%) | 218 (79.6%) |
| Real Estate, Rental & Leasing | 73 (61.3%) | 46 (38.7%) |
| Professional & Scientific | 178 (77.7%) | 51 (22.3%) |
| Enterprise Management | 0 (0.0%) | 0 (0.0%) |
| Administrative & Support | 86 (75.4%) | 28 (24.6%) |
| Educational Services | 83 (25.4%) | 244 (74.6%) |
| Health Care & Social Assistance | 77 (14.4%) | 456 (85.6%) |
| Arts, Entertainment & Recreation | 79 (63.2%) | 46 (36.8%) |
| Accommodation & Food Services | 199 (65.7%) | 104 (34.3%) |
| Public Administration | 34 (77.3%) | 10 (22.7%) |
| Total | 1,778 (50.3%) | 1,753 (49.6%) |
Education in Countryside
School Enrollment in Countryside
The most common levels of schooling among the 1,269 students in Countryside are high school (358 | 28.2%), college / undergraduate (357 | 28.1%), and middle school (231 | 18.2%).
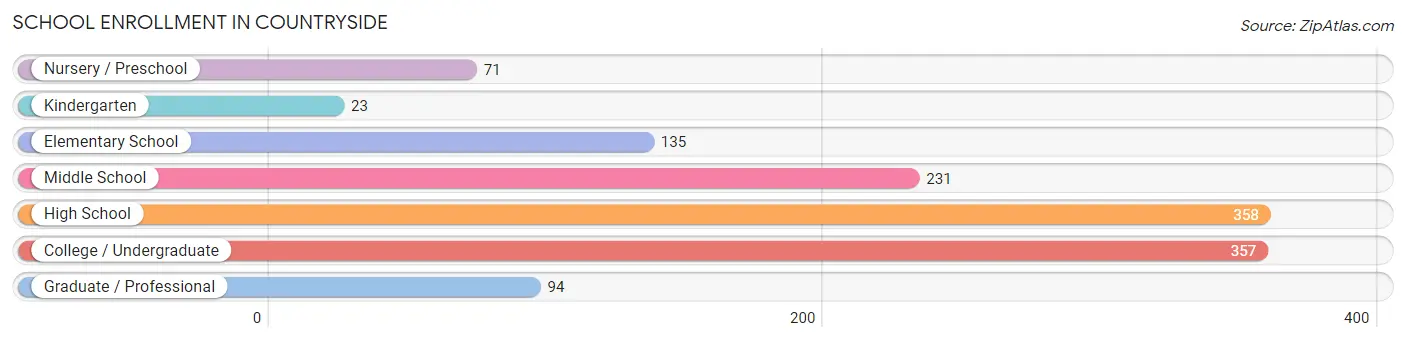
| School Level | # Students | % Students |
| Nursery / Preschool | 71 | 5.6% |
| Kindergarten | 23 | 1.8% |
| Elementary School | 135 | 10.6% |
| Middle School | 231 | 18.2% |
| High School | 358 | 28.2% |
| College / Undergraduate | 357 | 28.1% |
| Graduate / Professional | 94 | 7.4% |
| Total | 1,269 | 100.0% |
School Enrollment by Age by Funding Source in Countryside
Out of a total of 1,269 students who are enrolled in schools in Countryside, 336 (26.5%) attend a private institution, while the remaining 933 (73.5%) are enrolled in public schools. The age group of 3 to 4 year olds has the highest likelihood of being enrolled in private schools, with 71 (100.0% in the age bracket) enrolled. Conversely, the age group of 15 to 17 year olds has the lowest likelihood of being enrolled in a private school, with 275 (100.0% in the age bracket) attending a public institution.
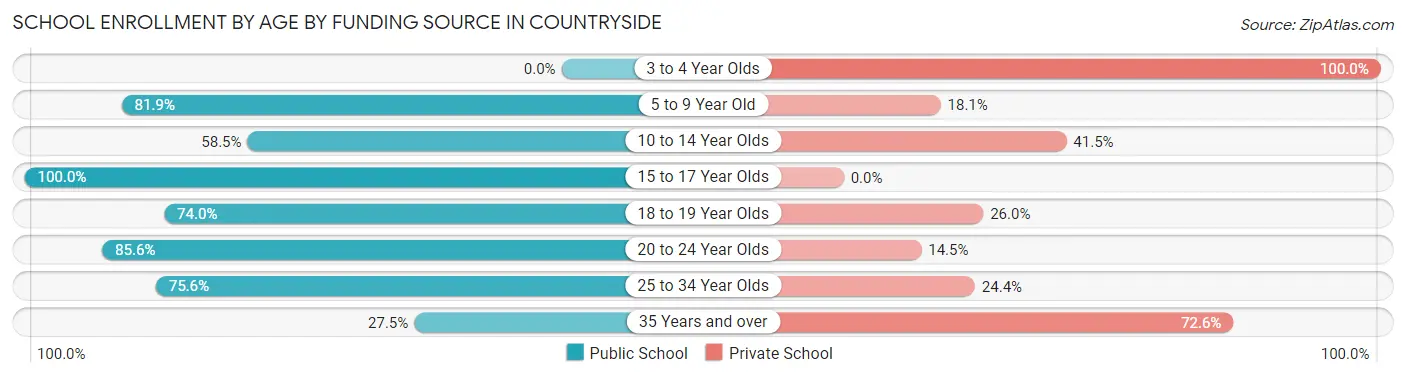
| Age Bracket | Public School | Private School |
| 3 to 4 Year Olds | 0 (0.0%) | 71 (100.0%) |
| 5 to 9 Year Old | 118 (81.9%) | 26 (18.1%) |
| 10 to 14 Year Olds | 165 (58.5%) | 117 (41.5%) |
| 15 to 17 Year Olds | 275 (100.0%) | 0 (0.0%) |
| 18 to 19 Year Olds | 74 (74.0%) | 26 (26.0%) |
| 20 to 24 Year Olds | 219 (85.6%) | 37 (14.4%) |
| 25 to 34 Year Olds | 68 (75.6%) | 22 (24.4%) |
| 35 Years and over | 14 (27.5%) | 37 (72.6%) |
| Total | 933 (73.5%) | 336 (26.5%) |
Educational Attainment by Field of Study in Countryside
Business (309 | 16.4%), science & technology (295 | 15.6%), psychology (198 | 10.5%), education (191 | 10.1%), and social sciences (170 | 9.0%) are the most common fields of study among 1,886 individuals in Countryside who have obtained a bachelor's degree or higher.
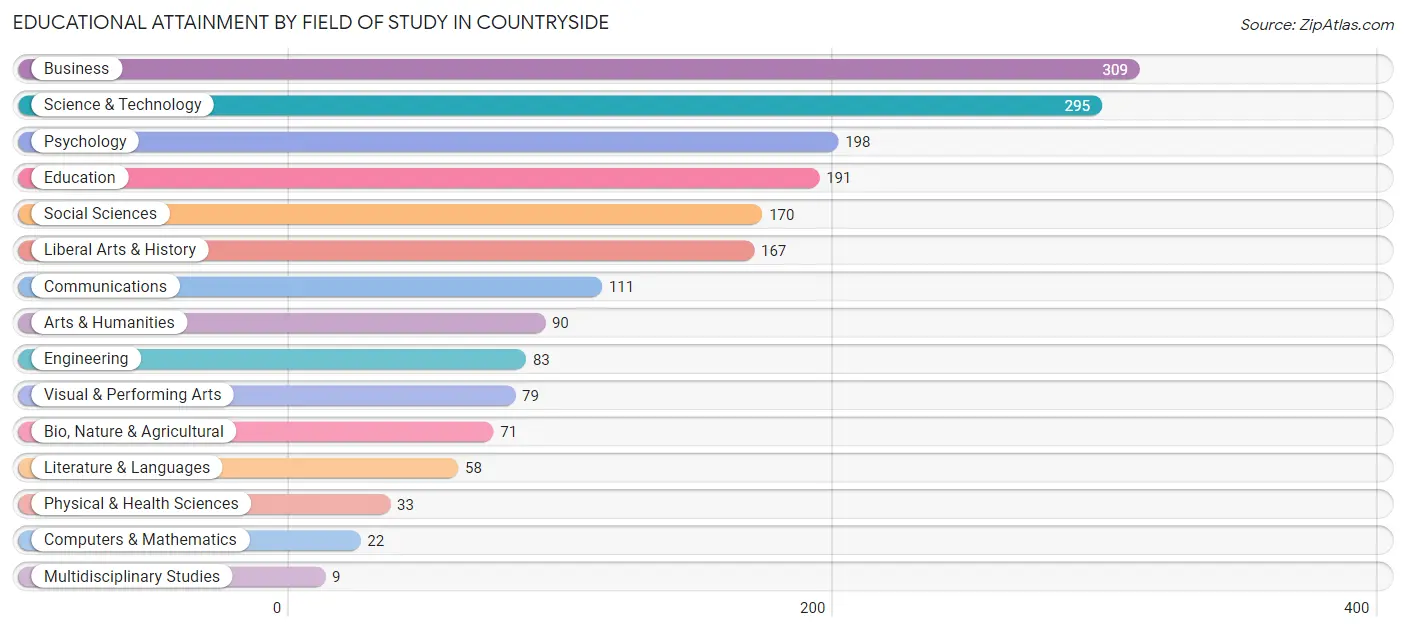
| Field of Study | # Graduates | % Graduates |
| Computers & Mathematics | 22 | 1.2% |
| Bio, Nature & Agricultural | 71 | 3.8% |
| Physical & Health Sciences | 33 | 1.8% |
| Psychology | 198 | 10.5% |
| Social Sciences | 170 | 9.0% |
| Engineering | 83 | 4.4% |
| Multidisciplinary Studies | 9 | 0.5% |
| Science & Technology | 295 | 15.6% |
| Business | 309 | 16.4% |
| Education | 191 | 10.1% |
| Literature & Languages | 58 | 3.1% |
| Liberal Arts & History | 167 | 8.8% |
| Visual & Performing Arts | 79 | 4.2% |
| Communications | 111 | 5.9% |
| Arts & Humanities | 90 | 4.8% |
| Total | 1,886 | 100.0% |
Transportation & Commute in Countryside
Vehicle Availability by Sex in Countryside
The most prevalent vehicle ownership categories in Countryside are males with 2 vehicles (669, accounting for 38.9%) and females with 2 vehicles (590, making up 40.3%).
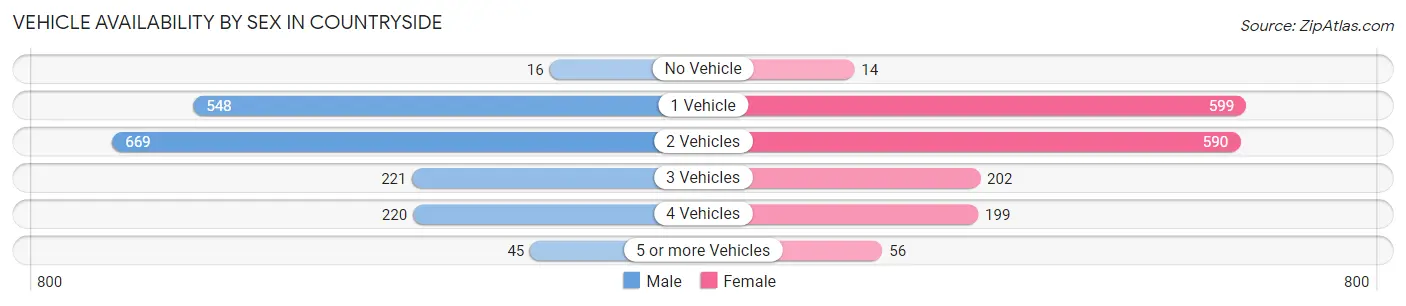
| Vehicles Available | Male | Female |
| No Vehicle | 16 (0.9%) | 14 (0.8%) |
| 1 Vehicle | 548 (31.9%) | 599 (36.1%) |
| 2 Vehicles | 669 (38.9%) | 590 (35.5%) |
| 3 Vehicles | 221 (12.9%) | 202 (12.2%) |
| 4 Vehicles | 220 (12.8%) | 199 (12.0%) |
| 5 or more Vehicles | 45 (2.6%) | 56 (3.4%) |
| Total | 1,719 (100.0%) | 1,660 (100.0%) |
Commute Time in Countryside
The most frequently occuring commute durations in Countryside are 30 to 34 minutes (457 commuters, 15.0%), 10 to 14 minutes (387 commuters, 12.7%), and 45 to 59 minutes (358 commuters, 11.7%).
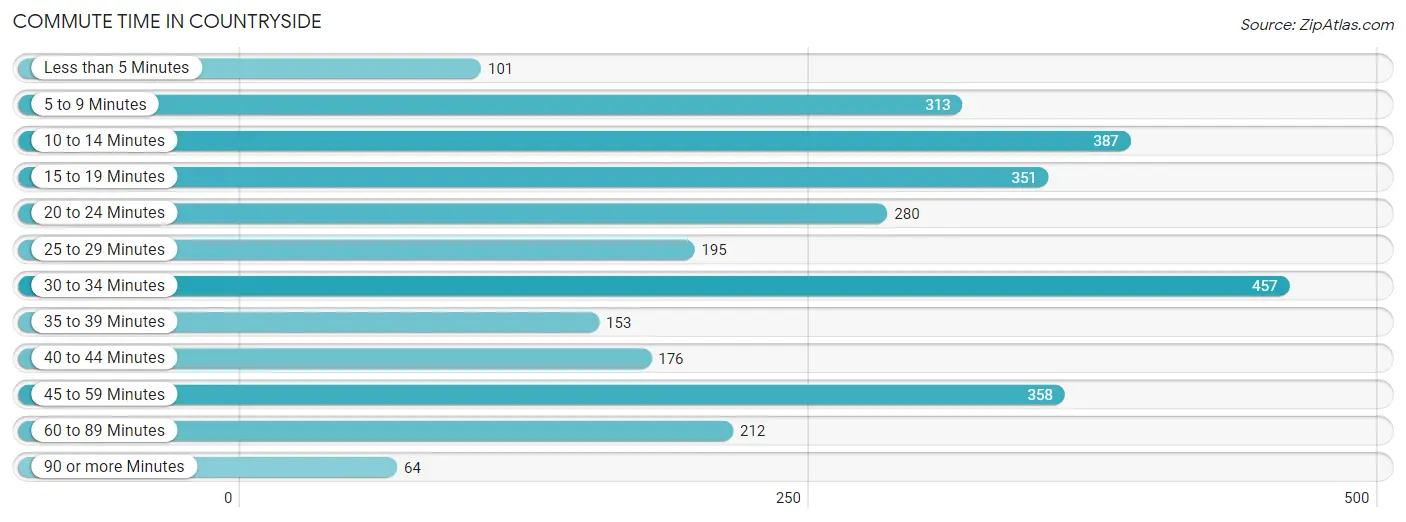
| Commute Time | # Commuters | % Commuters |
| Less than 5 Minutes | 101 | 3.3% |
| 5 to 9 Minutes | 313 | 10.3% |
| 10 to 14 Minutes | 387 | 12.7% |
| 15 to 19 Minutes | 351 | 11.5% |
| 20 to 24 Minutes | 280 | 9.2% |
| 25 to 29 Minutes | 195 | 6.4% |
| 30 to 34 Minutes | 457 | 15.0% |
| 35 to 39 Minutes | 153 | 5.0% |
| 40 to 44 Minutes | 176 | 5.8% |
| 45 to 59 Minutes | 358 | 11.7% |
| 60 to 89 Minutes | 212 | 7.0% |
| 90 or more Minutes | 64 | 2.1% |
Commute Time by Sex in Countryside
The most common commute times in Countryside are 30 to 34 minutes (360 commuters, 23.0%) for males and 10 to 14 minutes (313 commuters, 21.1%) for females.
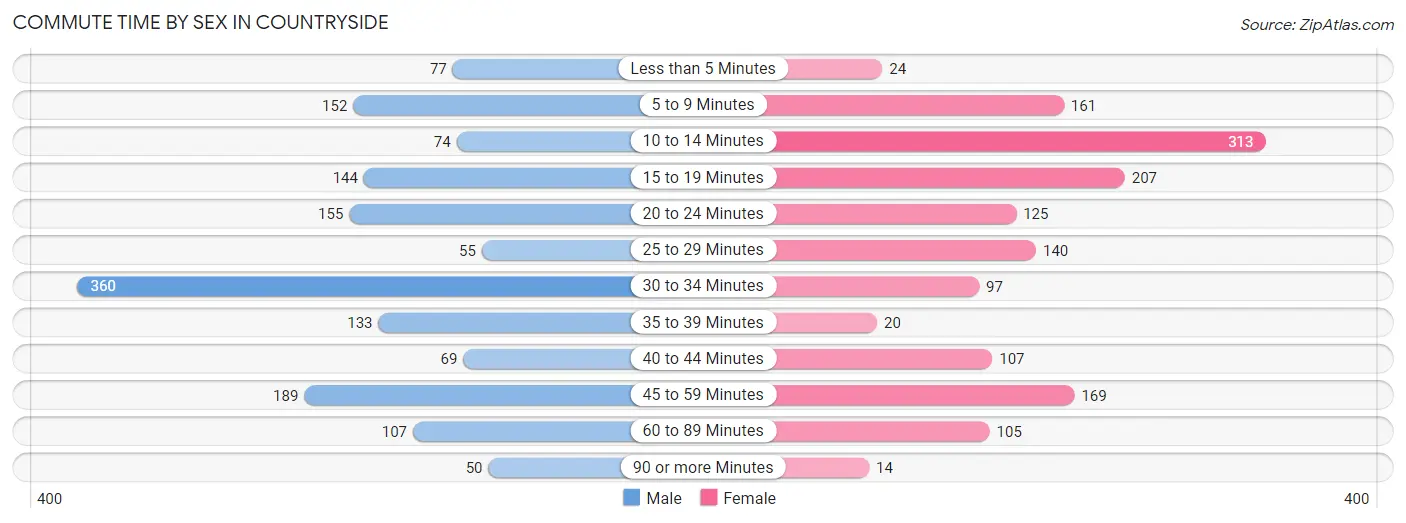
| Commute Time | Male | Female |
| Less than 5 Minutes | 77 (4.9%) | 24 (1.6%) |
| 5 to 9 Minutes | 152 (9.7%) | 161 (10.9%) |
| 10 to 14 Minutes | 74 (4.7%) | 313 (21.1%) |
| 15 to 19 Minutes | 144 (9.2%) | 207 (14.0%) |
| 20 to 24 Minutes | 155 (9.9%) | 125 (8.4%) |
| 25 to 29 Minutes | 55 (3.5%) | 140 (9.5%) |
| 30 to 34 Minutes | 360 (23.0%) | 97 (6.6%) |
| 35 to 39 Minutes | 133 (8.5%) | 20 (1.3%) |
| 40 to 44 Minutes | 69 (4.4%) | 107 (7.2%) |
| 45 to 59 Minutes | 189 (12.1%) | 169 (11.4%) |
| 60 to 89 Minutes | 107 (6.8%) | 105 (7.1%) |
| 90 or more Minutes | 50 (3.2%) | 14 (0.9%) |
Time of Departure to Work by Sex in Countryside
The most frequent times of departure to work in Countryside are 12:00 AM to 4:59 AM (238, 15.2%) for males and 7:30 AM to 7:59 AM (277, 18.7%) for females.
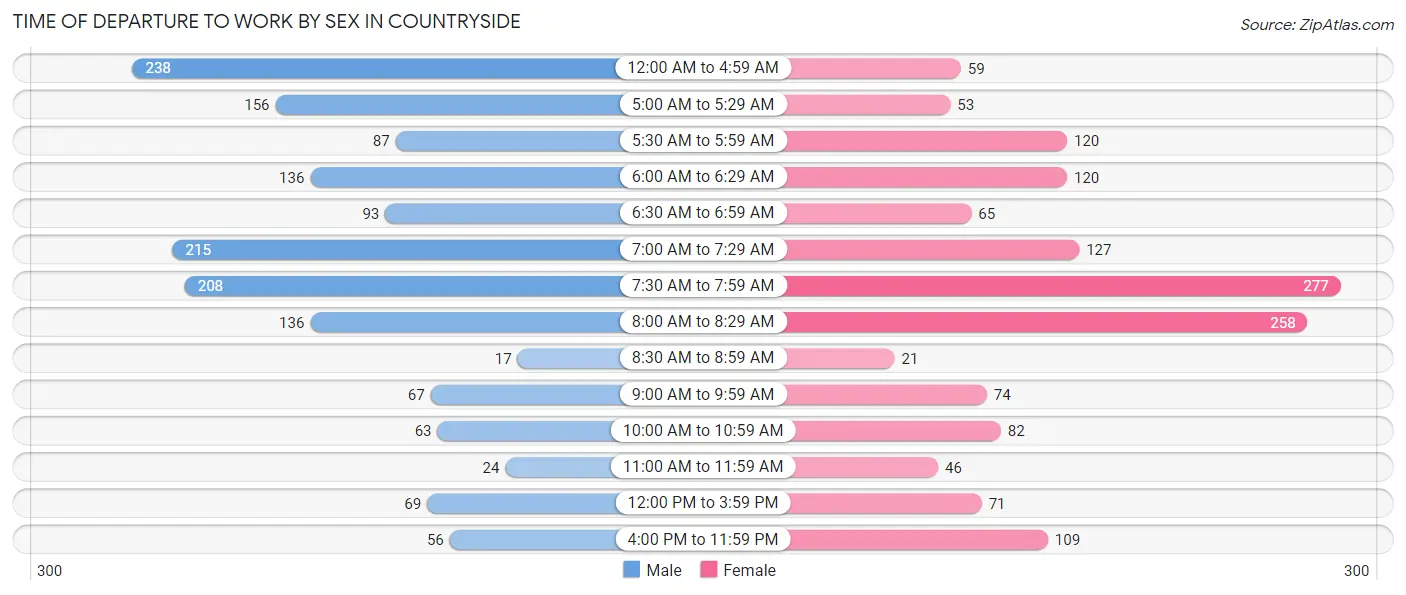
| Time of Departure | Male | Female |
| 12:00 AM to 4:59 AM | 238 (15.2%) | 59 (4.0%) |
| 5:00 AM to 5:29 AM | 156 (10.0%) | 53 (3.6%) |
| 5:30 AM to 5:59 AM | 87 (5.6%) | 120 (8.1%) |
| 6:00 AM to 6:29 AM | 136 (8.7%) | 120 (8.1%) |
| 6:30 AM to 6:59 AM | 93 (5.9%) | 65 (4.4%) |
| 7:00 AM to 7:29 AM | 215 (13.7%) | 127 (8.6%) |
| 7:30 AM to 7:59 AM | 208 (13.3%) | 277 (18.7%) |
| 8:00 AM to 8:29 AM | 136 (8.7%) | 258 (17.4%) |
| 8:30 AM to 8:59 AM | 17 (1.1%) | 21 (1.4%) |
| 9:00 AM to 9:59 AM | 67 (4.3%) | 74 (5.0%) |
| 10:00 AM to 10:59 AM | 63 (4.0%) | 82 (5.5%) |
| 11:00 AM to 11:59 AM | 24 (1.5%) | 46 (3.1%) |
| 12:00 PM to 3:59 PM | 69 (4.4%) | 71 (4.8%) |
| 4:00 PM to 11:59 PM | 56 (3.6%) | 109 (7.3%) |
| Total | 1,565 (100.0%) | 1,482 (100.0%) |
Housing Occupancy in Countryside
Occupancy by Ownership in Countryside
Of the total 2,803 dwellings in Countryside, owner-occupied units account for 1,940 (69.2%), while renter-occupied units make up 863 (30.8%).
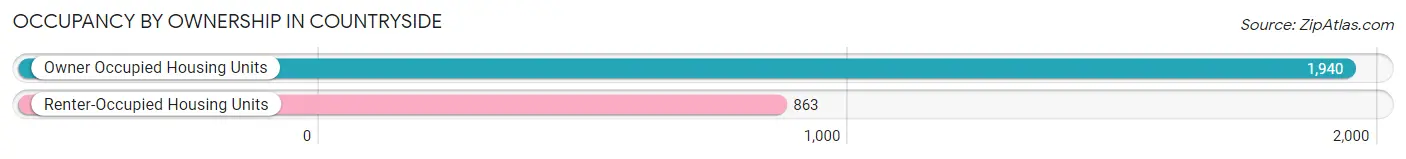
| Occupancy | # Housing Units | % Housing Units |
| Owner Occupied Housing Units | 1,940 | 69.2% |
| Renter-Occupied Housing Units | 863 | 30.8% |
| Total Occupied Housing Units | 2,803 | 100.0% |
Occupancy by Household Size in Countryside
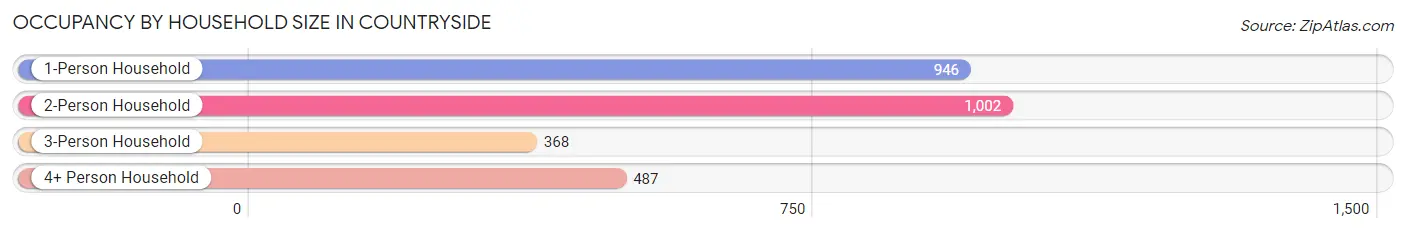
| Household Size | # Housing Units | % Housing Units |
| 1-Person Household | 946 | 33.8% |
| 2-Person Household | 1,002 | 35.7% |
| 3-Person Household | 368 | 13.1% |
| 4+ Person Household | 487 | 17.4% |
| Total Housing Units | 2,803 | 100.0% |
Occupancy by Ownership by Household Size in Countryside
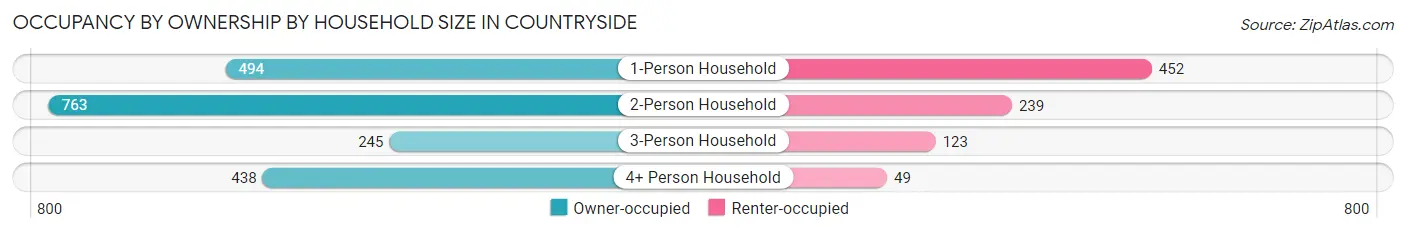
| Household Size | Owner-occupied | Renter-occupied |
| 1-Person Household | 494 (52.2%) | 452 (47.8%) |
| 2-Person Household | 763 (76.1%) | 239 (23.8%) |
| 3-Person Household | 245 (66.6%) | 123 (33.4%) |
| 4+ Person Household | 438 (89.9%) | 49 (10.1%) |
| Total Housing Units | 1,940 (69.2%) | 863 (30.8%) |
Occupancy by Educational Attainment in Countryside
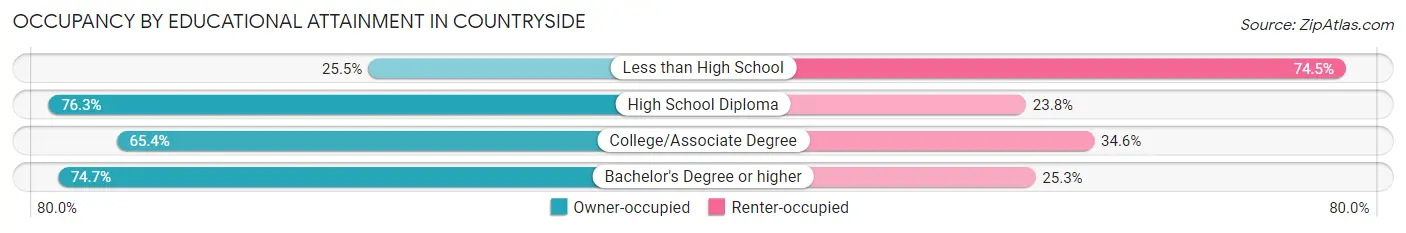
| Household Size | Owner-occupied | Renter-occupied |
| Less than High School | 37 (25.5%) | 108 (74.5%) |
| High School Diploma | 459 (76.2%) | 143 (23.7%) |
| College/Associate Degree | 651 (65.4%) | 344 (34.6%) |
| Bachelor's Degree or higher | 793 (74.7%) | 268 (25.3%) |
Occupancy by Age of Householder in Countryside
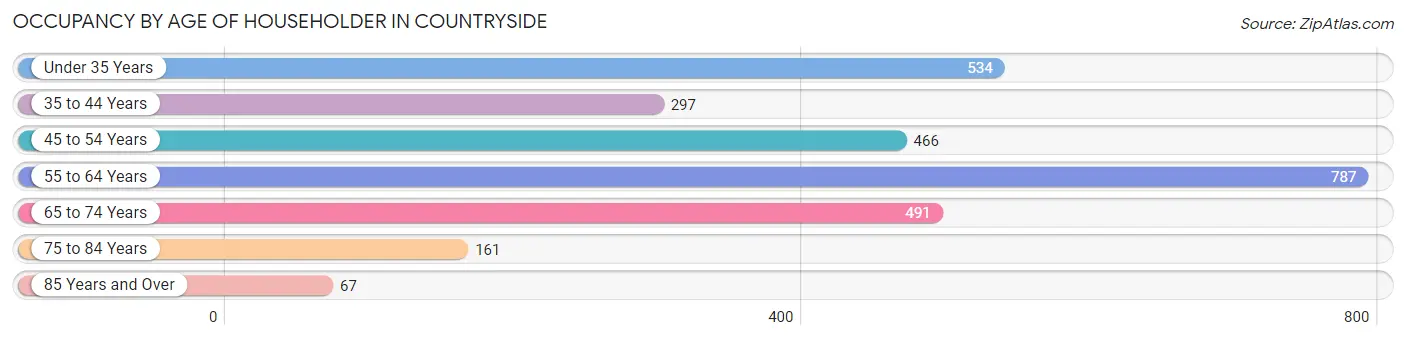
| Age Bracket | # Households | % Households |
| Under 35 Years | 534 | 19.1% |
| 35 to 44 Years | 297 | 10.6% |
| 45 to 54 Years | 466 | 16.6% |
| 55 to 64 Years | 787 | 28.1% |
| 65 to 74 Years | 491 | 17.5% |
| 75 to 84 Years | 161 | 5.7% |
| 85 Years and Over | 67 | 2.4% |
| Total | 2,803 | 100.0% |
Housing Finances in Countryside
Median Income by Occupancy in Countryside
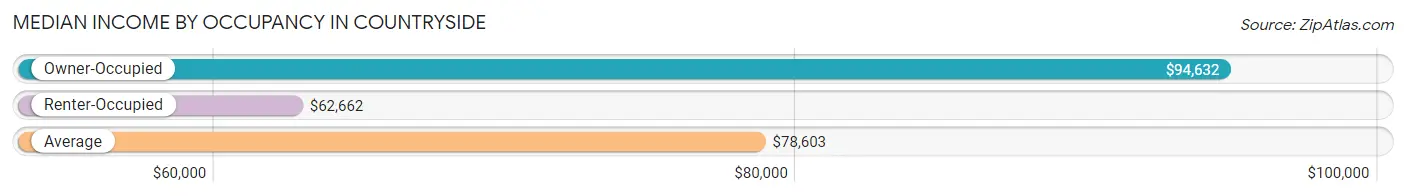
| Occupancy Type | # Households | Median Income |
| Owner-Occupied | 1,940 (69.2%) | $94,632 |
| Renter-Occupied | 863 (30.8%) | $62,662 |
| Average | 2,803 (100.0%) | $78,603 |
Occupancy by Householder Income Bracket in Countryside
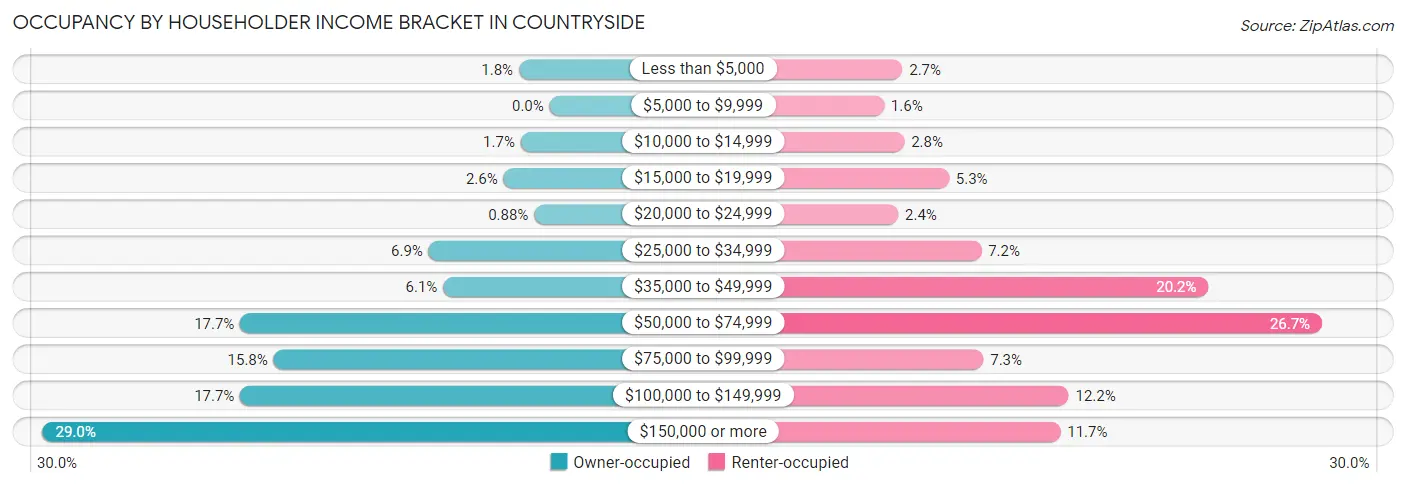
| Income Bracket | Owner-occupied | Renter-occupied |
| Less than $5,000 | 34 (1.8%) | 23 (2.7%) |
| $5,000 to $9,999 | 0 (0.0%) | 14 (1.6%) |
| $10,000 to $14,999 | 32 (1.7%) | 24 (2.8%) |
| $15,000 to $19,999 | 51 (2.6%) | 46 (5.3%) |
| $20,000 to $24,999 | 17 (0.9%) | 21 (2.4%) |
| $25,000 to $34,999 | 134 (6.9%) | 62 (7.2%) |
| $35,000 to $49,999 | 118 (6.1%) | 174 (20.2%) |
| $50,000 to $74,999 | 343 (17.7%) | 230 (26.7%) |
| $75,000 to $99,999 | 306 (15.8%) | 63 (7.3%) |
| $100,000 to $149,999 | 343 (17.7%) | 105 (12.2%) |
| $150,000 or more | 562 (29.0%) | 101 (11.7%) |
| Total | 1,940 (100.0%) | 863 (100.0%) |
Monthly Housing Cost Tiers in Countryside
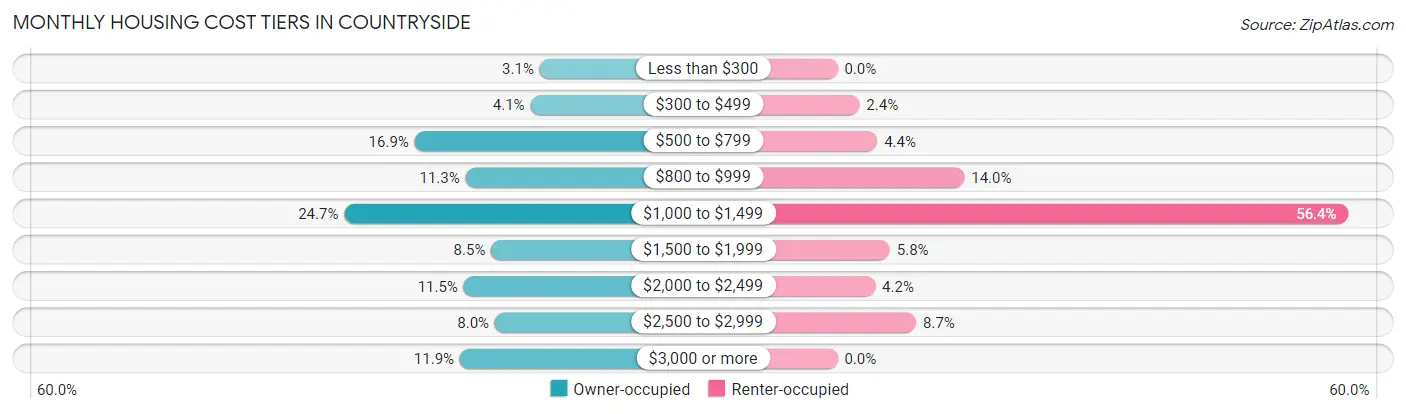
| Monthly Cost | Owner-occupied | Renter-occupied |
| Less than $300 | 60 (3.1%) | 0 (0.0%) |
| $300 to $499 | 80 (4.1%) | 21 (2.4%) |
| $500 to $799 | 328 (16.9%) | 38 (4.4%) |
| $800 to $999 | 219 (11.3%) | 121 (14.0%) |
| $1,000 to $1,499 | 479 (24.7%) | 487 (56.4%) |
| $1,500 to $1,999 | 164 (8.5%) | 50 (5.8%) |
| $2,000 to $2,499 | 223 (11.5%) | 36 (4.2%) |
| $2,500 to $2,999 | 156 (8.0%) | 75 (8.7%) |
| $3,000 or more | 231 (11.9%) | 0 (0.0%) |
| Total | 1,940 (100.0%) | 863 (100.0%) |
Physical Housing Characteristics in Countryside
Housing Structures in Countryside
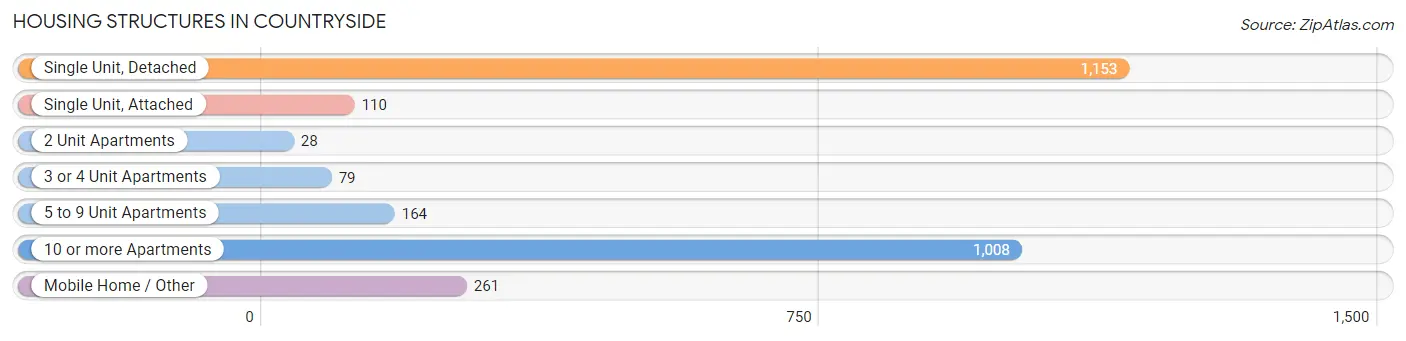
| Structure Type | # Housing Units | % Housing Units |
| Single Unit, Detached | 1,153 | 41.1% |
| Single Unit, Attached | 110 | 3.9% |
| 2 Unit Apartments | 28 | 1.0% |
| 3 or 4 Unit Apartments | 79 | 2.8% |
| 5 to 9 Unit Apartments | 164 | 5.9% |
| 10 or more Apartments | 1,008 | 36.0% |
| Mobile Home / Other | 261 | 9.3% |
| Total | 2,803 | 100.0% |
Housing Structures by Occupancy in Countryside
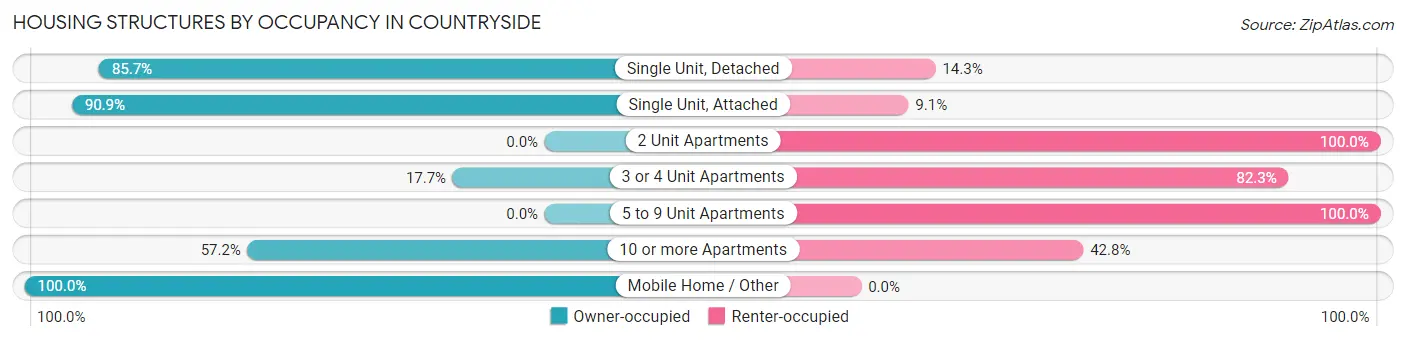
| Structure Type | Owner-occupied | Renter-occupied |
| Single Unit, Detached | 988 (85.7%) | 165 (14.3%) |
| Single Unit, Attached | 100 (90.9%) | 10 (9.1%) |
| 2 Unit Apartments | 0 (0.0%) | 28 (100.0%) |
| 3 or 4 Unit Apartments | 14 (17.7%) | 65 (82.3%) |
| 5 to 9 Unit Apartments | 0 (0.0%) | 164 (100.0%) |
| 10 or more Apartments | 577 (57.2%) | 431 (42.8%) |
| Mobile Home / Other | 261 (100.0%) | 0 (0.0%) |
| Total | 1,940 (69.2%) | 863 (30.8%) |
Housing Structures by Number of Rooms in Countryside
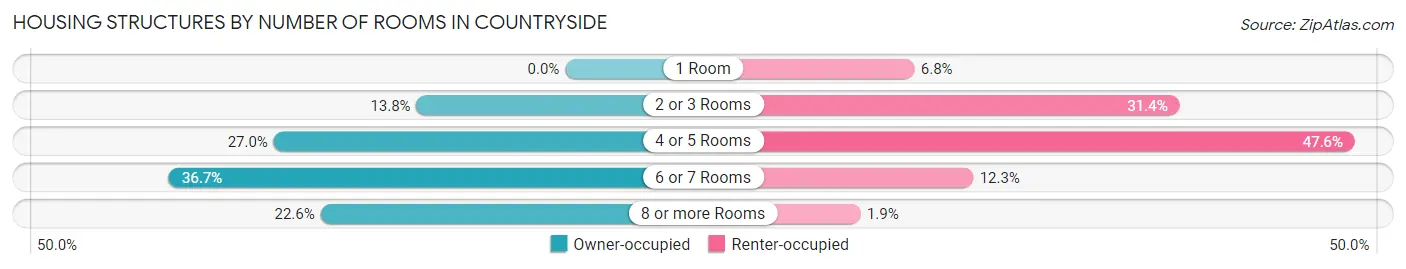
| Number of Rooms | Owner-occupied | Renter-occupied |
| 1 Room | 0 (0.0%) | 59 (6.8%) |
| 2 or 3 Rooms | 267 (13.8%) | 271 (31.4%) |
| 4 or 5 Rooms | 523 (27.0%) | 411 (47.6%) |
| 6 or 7 Rooms | 711 (36.6%) | 106 (12.3%) |
| 8 or more Rooms | 439 (22.6%) | 16 (1.8%) |
| Total | 1,940 (100.0%) | 863 (100.0%) |
Housing Structure by Heating Type in Countryside
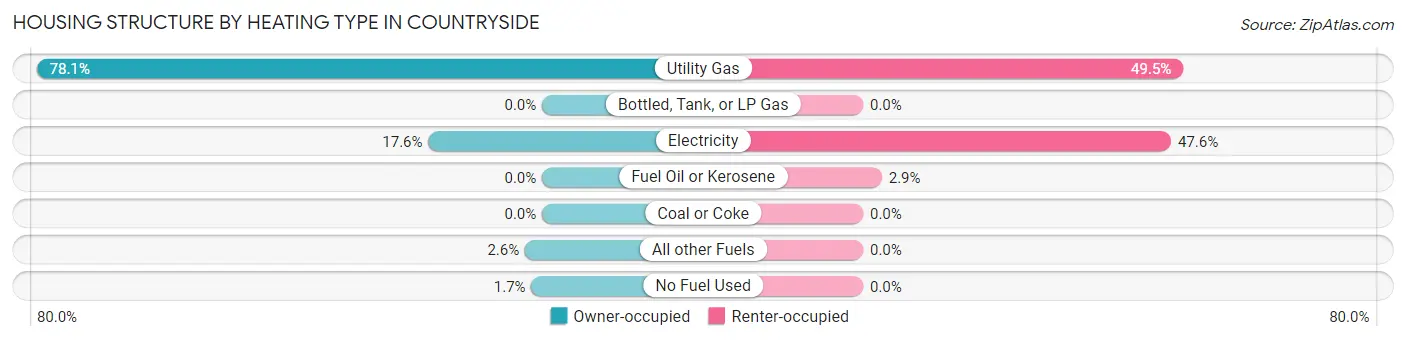
| Heating Type | Owner-occupied | Renter-occupied |
| Utility Gas | 1,516 (78.1%) | 427 (49.5%) |
| Bottled, Tank, or LP Gas | 0 (0.0%) | 0 (0.0%) |
| Electricity | 341 (17.6%) | 411 (47.6%) |
| Fuel Oil or Kerosene | 0 (0.0%) | 25 (2.9%) |
| Coal or Coke | 0 (0.0%) | 0 (0.0%) |
| All other Fuels | 51 (2.6%) | 0 (0.0%) |
| No Fuel Used | 32 (1.7%) | 0 (0.0%) |
| Total | 1,940 (100.0%) | 863 (100.0%) |
Household Vehicle Usage in Countryside
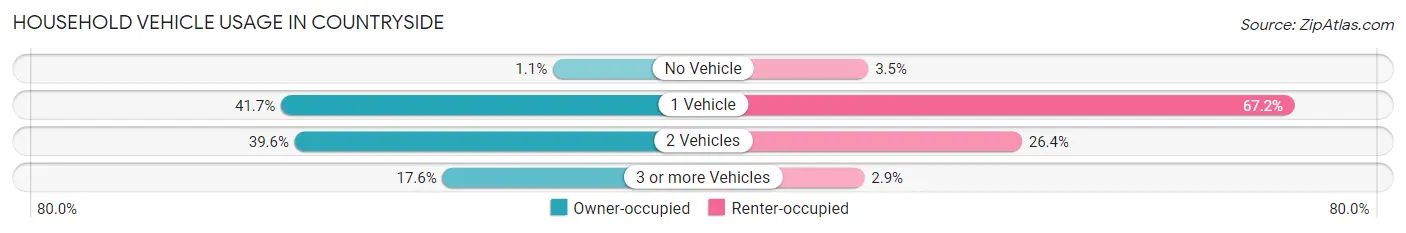
| Vehicles per Household | Owner-occupied | Renter-occupied |
| No Vehicle | 21 (1.1%) | 30 (3.5%) |
| 1 Vehicle | 809 (41.7%) | 580 (67.2%) |
| 2 Vehicles | 769 (39.6%) | 228 (26.4%) |
| 3 or more Vehicles | 341 (17.6%) | 25 (2.9%) |
| Total | 1,940 (100.0%) | 863 (100.0%) |
Real Estate & Mortgages in Countryside
Real Estate and Mortgage Overview in Countryside
| Characteristic | Without Mortgage | With Mortgage |
| Housing Units | 841 | 1,099 |
| Median Property Value | $213,100 | $326,500 |
| Median Household Income | $94,750 | $370 |
| Monthly Housing Costs | $846 | $196 |
| Real Estate Taxes | $5,375 | $127 |
Property Value by Mortgage Status in Countryside
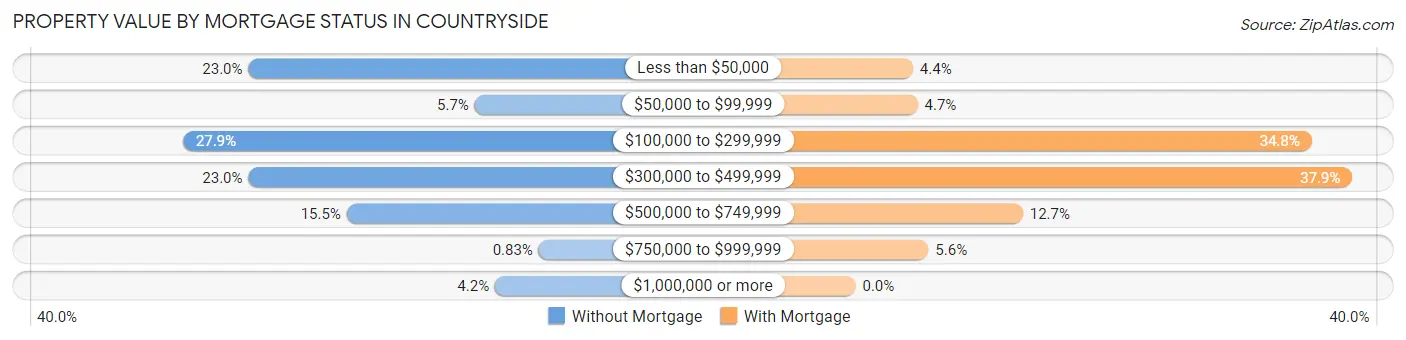
| Property Value | Without Mortgage | With Mortgage |
| Less than $50,000 | 193 (23.0%) | 48 (4.4%) |
| $50,000 to $99,999 | 48 (5.7%) | 52 (4.7%) |
| $100,000 to $299,999 | 235 (27.9%) | 382 (34.8%) |
| $300,000 to $499,999 | 193 (23.0%) | 416 (37.9%) |
| $500,000 to $749,999 | 130 (15.5%) | 140 (12.7%) |
| $750,000 to $999,999 | 7 (0.8%) | 61 (5.6%) |
| $1,000,000 or more | 35 (4.2%) | 0 (0.0%) |
| Total | 841 (100.0%) | 1,099 (100.0%) |
Household Income by Mortgage Status in Countryside
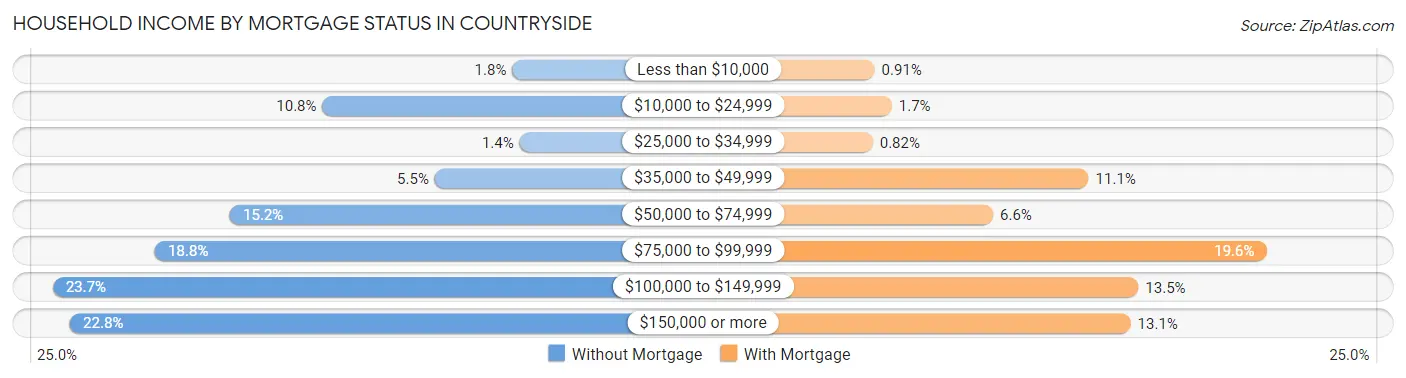
| Household Income | Without Mortgage | With Mortgage |
| Less than $10,000 | 15 (1.8%) | 10 (0.9%) |
| $10,000 to $24,999 | 91 (10.8%) | 19 (1.7%) |
| $25,000 to $34,999 | 12 (1.4%) | 9 (0.8%) |
| $35,000 to $49,999 | 46 (5.5%) | 122 (11.1%) |
| $50,000 to $74,999 | 128 (15.2%) | 72 (6.6%) |
| $75,000 to $99,999 | 158 (18.8%) | 215 (19.6%) |
| $100,000 to $149,999 | 199 (23.7%) | 148 (13.5%) |
| $150,000 or more | 192 (22.8%) | 144 (13.1%) |
| Total | 841 (100.0%) | 1,099 (100.0%) |
Property Value to Household Income Ratio in Countryside
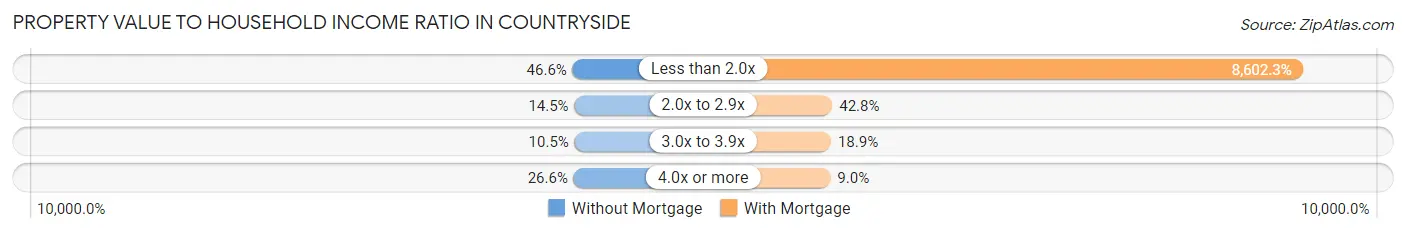
| Value-to-Income Ratio | Without Mortgage | With Mortgage |
| Less than 2.0x | 392 (46.6%) | 94,539 (8,602.3%) |
| 2.0x to 2.9x | 122 (14.5%) | 470 (42.8%) |
| 3.0x to 3.9x | 88 (10.5%) | 208 (18.9%) |
| 4.0x or more | 224 (26.6%) | 99 (9.0%) |
| Total | 841 (100.0%) | 1,099 (100.0%) |
Real Estate Taxes by Mortgage Status in Countryside
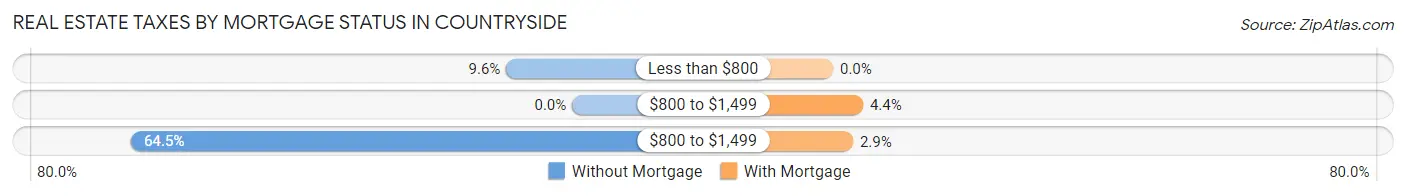
| Property Taxes | Without Mortgage | With Mortgage |
| Less than $800 | 81 (9.6%) | 0 (0.0%) |
| $800 to $1,499 | 0 (0.0%) | 48 (4.4%) |
| $800 to $1,499 | 542 (64.4%) | 32 (2.9%) |
| Total | 841 (100.0%) | 1,099 (100.0%) |
Health & Disability in Countryside
Health Insurance Coverage by Age in Countryside
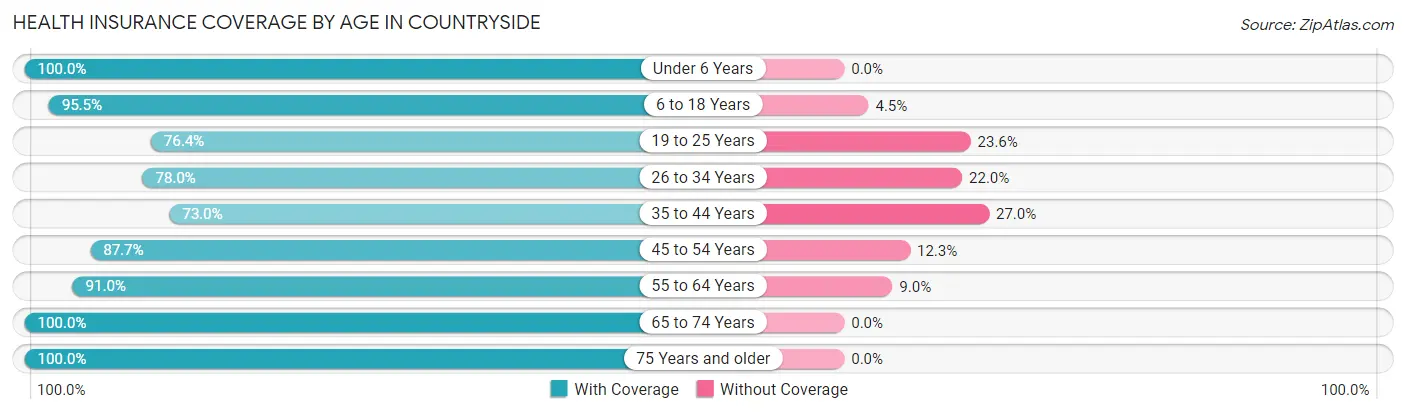
| Age Bracket | With Coverage | Without Coverage |
| Under 6 Years | 216 (100.0%) | 0 (0.0%) |
| 6 to 18 Years | 930 (95.5%) | 44 (4.5%) |
| 19 to 25 Years | 412 (76.4%) | 127 (23.6%) |
| 26 to 34 Years | 625 (78.0%) | 176 (22.0%) |
| 35 to 44 Years | 357 (73.0%) | 132 (27.0%) |
| 45 to 54 Years | 809 (87.7%) | 113 (12.3%) |
| 55 to 64 Years | 1,005 (91.0%) | 99 (9.0%) |
| 65 to 74 Years | 781 (100.0%) | 0 (0.0%) |
| 75 Years and older | 496 (100.0%) | 0 (0.0%) |
| Total | 5,631 (89.1%) | 691 (10.9%) |
Health Insurance Coverage by Citizenship Status in Countryside
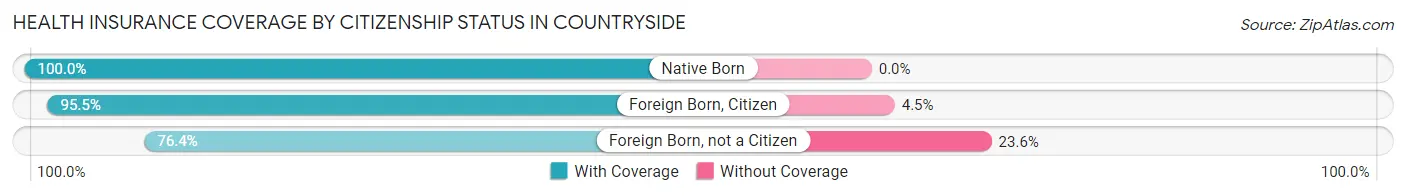
| Citizenship Status | With Coverage | Without Coverage |
| Native Born | 216 (100.0%) | 0 (0.0%) |
| Foreign Born, Citizen | 930 (95.5%) | 44 (4.5%) |
| Foreign Born, not a Citizen | 412 (76.4%) | 127 (23.6%) |
Health Insurance Coverage by Household Income in Countryside
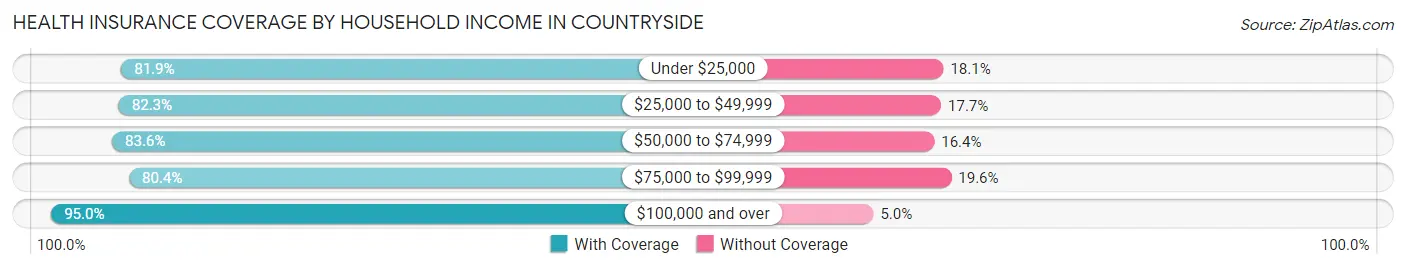
| Household Income | With Coverage | Without Coverage |
| Under $25,000 | 262 (81.9%) | 58 (18.1%) |
| $25,000 to $49,999 | 755 (82.3%) | 162 (17.7%) |
| $50,000 to $74,999 | 851 (83.6%) | 167 (16.4%) |
| $75,000 to $99,999 | 550 (80.4%) | 134 (19.6%) |
| $100,000 and over | 3,193 (95.0%) | 168 (5.0%) |
Public vs Private Health Insurance Coverage by Age in Countryside
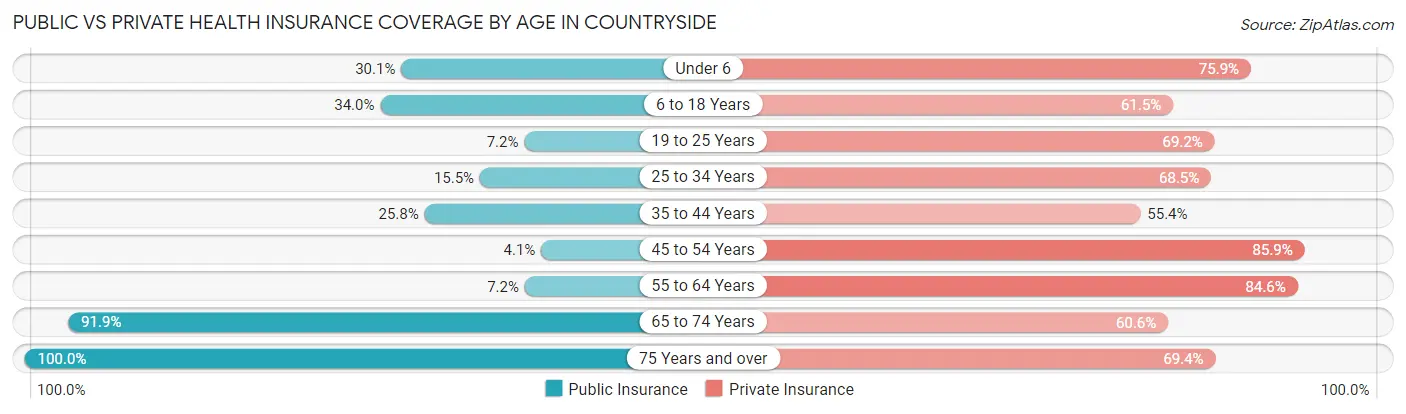
| Age Bracket | Public Insurance | Private Insurance |
| Under 6 | 65 (30.1%) | 164 (75.9%) |
| 6 to 18 Years | 331 (34.0%) | 599 (61.5%) |
| 19 to 25 Years | 39 (7.2%) | 373 (69.2%) |
| 25 to 34 Years | 124 (15.5%) | 549 (68.5%) |
| 35 to 44 Years | 126 (25.8%) | 271 (55.4%) |
| 45 to 54 Years | 38 (4.1%) | 792 (85.9%) |
| 55 to 64 Years | 79 (7.2%) | 934 (84.6%) |
| 65 to 74 Years | 718 (91.9%) | 473 (60.6%) |
| 75 Years and over | 496 (100.0%) | 344 (69.4%) |
| Total | 2,016 (31.9%) | 4,499 (71.2%) |
Disability Status by Sex by Age in Countryside
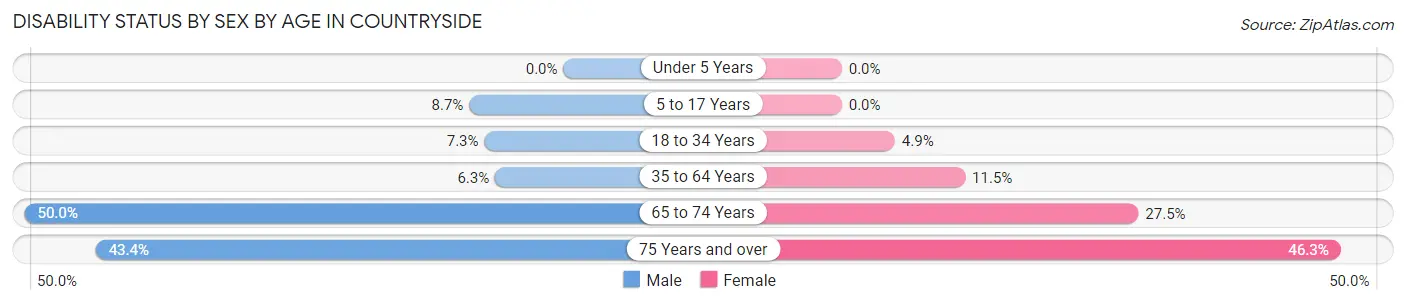
| Age Bracket | Male | Female |
| Under 5 Years | 0 (0.0%) | 0 (0.0%) |
| 5 to 17 Years | 39 (8.7%) | 0 (0.0%) |
| 18 to 34 Years | 54 (7.3%) | 34 (4.9%) |
| 35 to 64 Years | 78 (6.3%) | 147 (11.5%) |
| 65 to 74 Years | 158 (50.0%) | 128 (27.5%) |
| 75 Years and over | 69 (43.4%) | 156 (46.3%) |
Disability Class by Sex by Age in Countryside
Disability Class: Hearing Difficulty
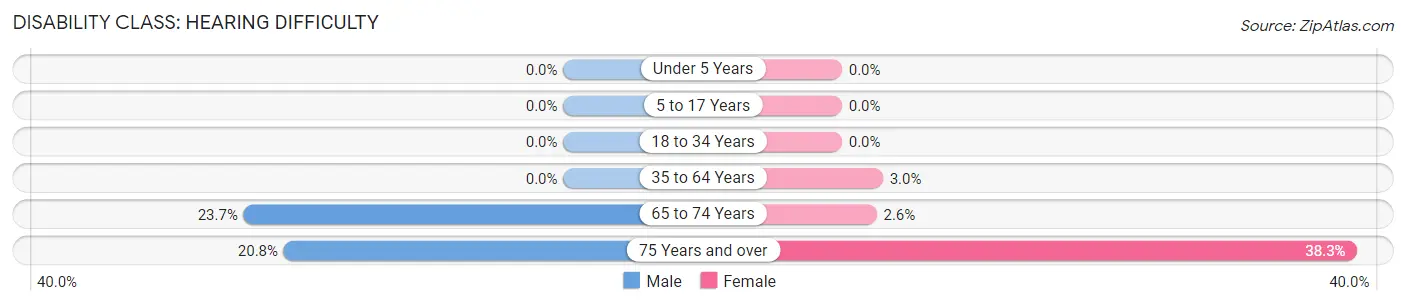
| Age Bracket | Male | Female |
| Under 5 Years | 0 (0.0%) | 0 (0.0%) |
| 5 to 17 Years | 0 (0.0%) | 0 (0.0%) |
| 18 to 34 Years | 0 (0.0%) | 0 (0.0%) |
| 35 to 64 Years | 0 (0.0%) | 39 (3.0%) |
| 65 to 74 Years | 75 (23.7%) | 12 (2.6%) |
| 75 Years and over | 33 (20.7%) | 129 (38.3%) |
Disability Class: Vision Difficulty
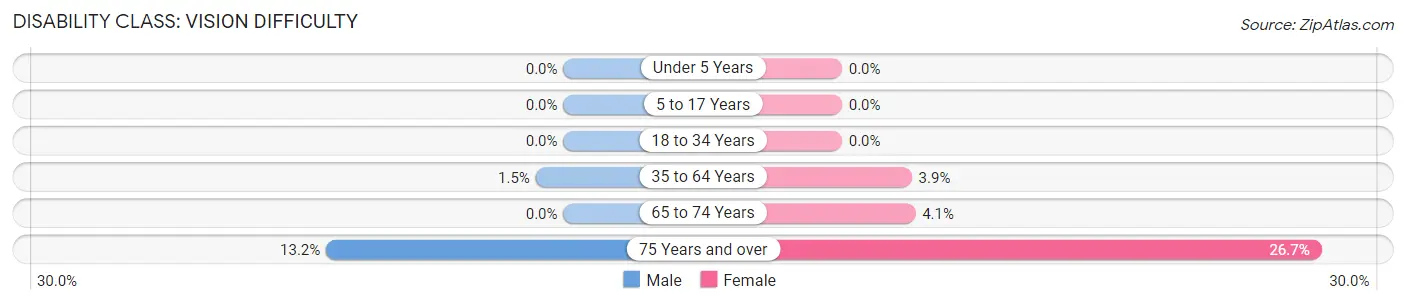
| Age Bracket | Male | Female |
| Under 5 Years | 0 (0.0%) | 0 (0.0%) |
| 5 to 17 Years | 0 (0.0%) | 0 (0.0%) |
| 18 to 34 Years | 0 (0.0%) | 0 (0.0%) |
| 35 to 64 Years | 19 (1.5%) | 50 (3.9%) |
| 65 to 74 Years | 0 (0.0%) | 19 (4.1%) |
| 75 Years and over | 21 (13.2%) | 90 (26.7%) |
Disability Class: Cognitive Difficulty
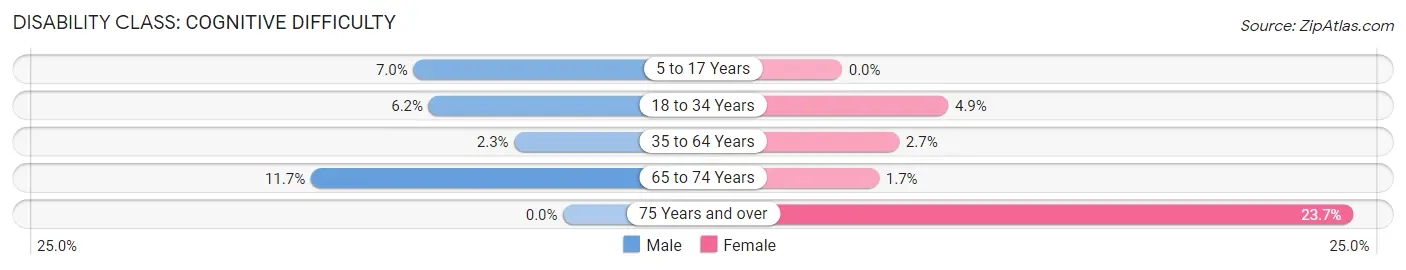
| Age Bracket | Male | Female |
| 5 to 17 Years | 31 (7.0%) | 0 (0.0%) |
| 18 to 34 Years | 46 (6.2%) | 34 (4.9%) |
| 35 to 64 Years | 28 (2.3%) | 34 (2.6%) |
| 65 to 74 Years | 37 (11.7%) | 8 (1.7%) |
| 75 Years and over | 0 (0.0%) | 80 (23.7%) |
Disability Class: Ambulatory Difficulty
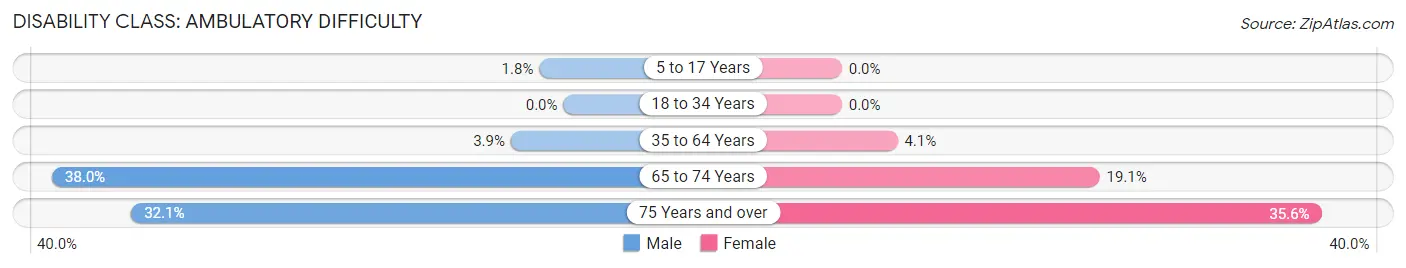
| Age Bracket | Male | Female |
| 5 to 17 Years | 8 (1.8%) | 0 (0.0%) |
| 18 to 34 Years | 0 (0.0%) | 0 (0.0%) |
| 35 to 64 Years | 48 (3.9%) | 53 (4.1%) |
| 65 to 74 Years | 120 (38.0%) | 89 (19.1%) |
| 75 Years and over | 51 (32.1%) | 120 (35.6%) |
Disability Class: Self-Care Difficulty
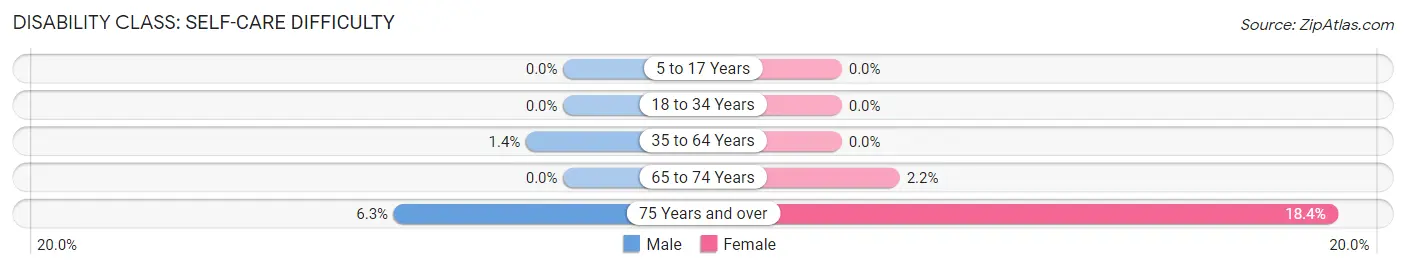
| Age Bracket | Male | Female |
| 5 to 17 Years | 0 (0.0%) | 0 (0.0%) |
| 18 to 34 Years | 0 (0.0%) | 0 (0.0%) |
| 35 to 64 Years | 17 (1.4%) | 0 (0.0%) |
| 65 to 74 Years | 0 (0.0%) | 10 (2.1%) |
| 75 Years and over | 10 (6.3%) | 62 (18.4%) |
Technology Access in Countryside
Computing Device Access in Countryside
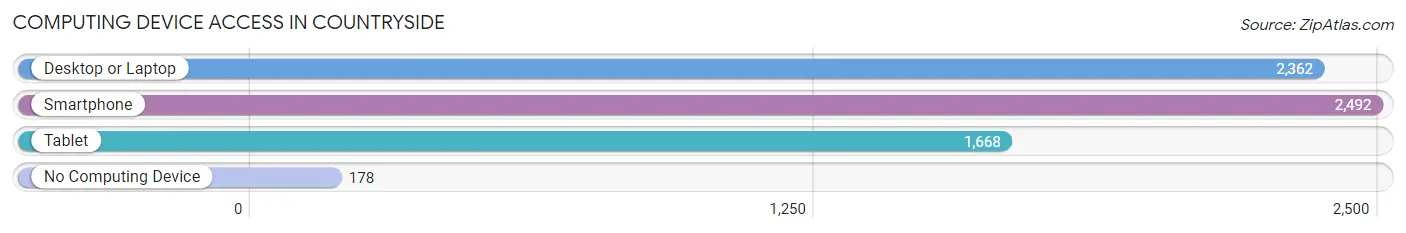
| Device Type | # Households | % Households |
| Desktop or Laptop | 2,362 | 84.3% |
| Smartphone | 2,492 | 88.9% |
| Tablet | 1,668 | 59.5% |
| No Computing Device | 178 | 6.4% |
| Total | 2,803 | 100.0% |
Internet Access in Countryside
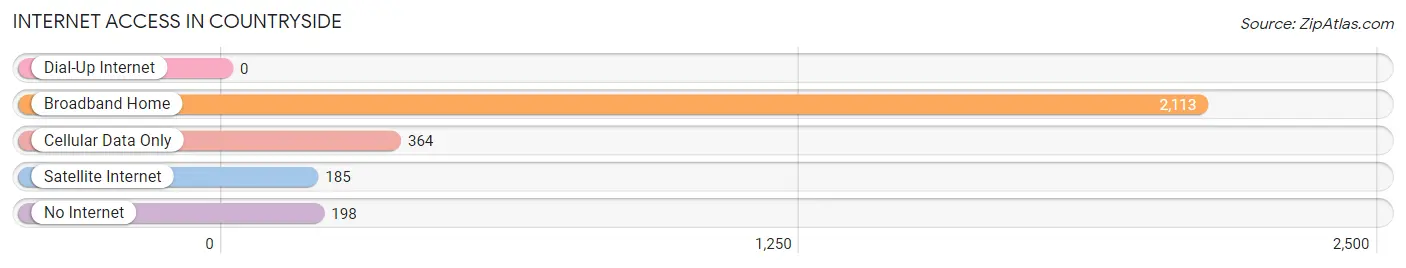
| Internet Type | # Households | % Households |
| Dial-Up Internet | 0 | 0.0% |
| Broadband Home | 2,113 | 75.4% |
| Cellular Data Only | 364 | 13.0% |
| Satellite Internet | 185 | 6.6% |
| No Internet | 198 | 7.1% |
| Total | 2,803 | 100.0% |
Countryside Summary
Countryside, Illinois is a small village located in Cook County, Illinois, United States. The village is located approximately 25 miles southwest of downtown Chicago. As of the 2010 census, the population of Countryside was 5,972.
Geography
Countryside is located at 41°45'17" North, 87°50'17" West (41.754722, -87.838333). According to the United States Census Bureau, the village has a total area of 2.2 square miles, all of it land.
History
Countryside was first settled in the early 1800s by German immigrants. The village was originally known as “Hoffman’s Grove” after the first settler, John Hoffman. In 1868, the village was renamed “Countryside” by the postmaster, who thought the name was more appropriate for the rural area.
In the late 1800s, Countryside began to grow as a farming community. The village was incorporated in 1957.
Economy
Countryside’s economy is largely based on agriculture and small businesses. The village is home to several small businesses, including restaurants, retail stores, and professional services.
The village is also home to several large employers, including the Countryside Country Club, the Countryside Fire Protection District, and the Countryside Public Library.
Demographics
As of the 2010 census, the population of Countryside was 5,972. The racial makeup of the village was 87.3% White, 4.2% African American, 0.3% Native American, 3.2% Asian, and 4.9% from other races. Hispanic or Latino of any race were 8.7% of the population.
The median household income in Countryside was $68,958, and the median family income was $77,917. The per capita income for the village was $30,945. About 4.2% of families and 5.3% of the population were below the poverty line, including 6.3% of those under age 18 and 4.2% of those age 65 or over.
Education
Countryside is served by the LaGrange-Countryside School District 105. The district operates two elementary schools, one middle school, and one high school. The village is also home to several private schools, including St. Cletus Catholic School and Countryside Montessori School.
Conclusion
Countryside, Illinois is a small village located in Cook County, Illinois, United States. The village is located approximately 25 miles southwest of downtown Chicago. As of the 2010 census, the population of Countryside was 5,972. The village was first settled in the early 1800s by German immigrants and was originally known as “Hoffman’s Grove.” Countryside’s economy is largely based on agriculture and small businesses. The racial makeup of the village was 87.3% White, 4.2% African American, 0.3% Native American, 3.2% Asian, and 4.9% from other races. The median household income in Countryside was $68,958, and the median family income was $77,917. The village is served by the LaGrange-Countryside School District 105.
Common Questions
What is Per Capita Income in Countryside?
Per Capita income in Countryside is $51,722.
What is the Median Family Income in Countryside?
Median Family Income in Countryside is $117,931.
What is the Median Household income in Countryside?
Median Household Income in Countryside is $78,603.
What is Income or Wage Gap in Countryside?
Income or Wage Gap in Countryside is 32.1%.
Women in Countryside earn 67.9 cents for every dollar earned by a man.
What is Inequality or Gini Index in Countryside?
Inequality or Gini Index in Countryside is 0.46.
What is the Total Population of Countryside?
Total Population of Countryside is 6,322.
What is the Total Male Population of Countryside?
Total Male Population of Countryside is 2,966.
What is the Total Female Population of Countryside?
Total Female Population of Countryside is 3,356.
What is the Ratio of Males per 100 Females in Countryside?
There are 88.38 Males per 100 Females in Countryside.
What is the Ratio of Females per 100 Males in Countryside?
There are 113.15 Females per 100 Males in Countryside.
What is the Median Population Age in Countryside?
Median Population Age in Countryside is 47.9 Years.
What is the Average Family Size in Countryside
Average Family Size in Countryside is 2.9 People.
What is the Average Household Size in Countryside
Average Household Size in Countryside is 2.2 People.
How Large is the Labor Force in Countryside?
There are 3,831 People in the Labor Forcein in Countryside.
What is the Percentage of People in the Labor Force in Countryside?
70.4% of People are in the Labor Force in Countryside.
What is the Unemployment Rate in Countryside?
Unemployment Rate in Countryside is 7.8%.