Old Mill Creek, IL Map & Demographics
Old Mill Creek Map
Old Mill Creek Overview
$59,462
PER CAPITA INCOME
$108,750
AVG FAMILY INCOME
$69,688
AVG HOUSEHOLD INCOME
29.6%
WAGE / INCOME GAP [ % ]
70.4¢/ $1
WAGE / INCOME GAP [ $ ]
0.51
INEQUALITY / GINI INDEX
122
TOTAL POPULATION
66
MALE POPULATION
56
FEMALE POPULATION
117.86
MALES / 100 FEMALES
84.85
FEMALES / 100 MALES
49.5
MEDIAN AGE
2.9
AVG FAMILY SIZE
2.2
AVG HOUSEHOLD SIZE
57
LABOR FORCE [ PEOPLE ]
59.4%
PERCENT IN LABOR FORCE
3.6%
UNEMPLOYMENT RATE
Income in Old Mill Creek
Income Overview in Old Mill Creek
Per Capita Income in Old Mill Creek is $59,462, while median incomes of families and households are $108,750 and $69,688 respectively.
| Characteristic | Number | Measure |
| Per Capita Income | 122 | $59,462 |
| Median Family Income | 32 | $108,750 |
| Mean Family Income | 32 | $175,706 |
| Median Household Income | 55 | $69,688 |
| Mean Household Income | 55 | $129,736 |
| Income Deficit | 32 | $0 |
| Wage / Income Gap (%) | 122 | 29.61% |
| Wage / Income Gap ($) | 122 | 70.39¢ per $1 |
| Gini / Inequality Index | 122 | 0.51 |
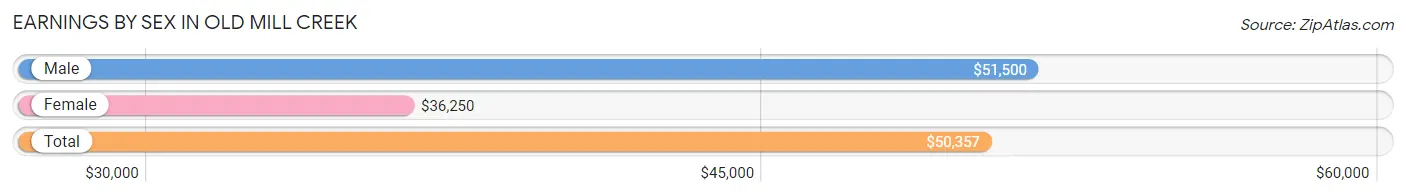
Earnings by Sex in Old Mill Creek
Average Earnings in Old Mill Creek are $50,357, $51,500 for men and $36,250 for women, a difference of 29.6%.
| Sex | Number | Average Earnings |
| Male | 40 (66.7%) | $51,500 |
| Female | 20 (33.3%) | $36,250 |
| Total | 60 (100.0%) | $50,357 |
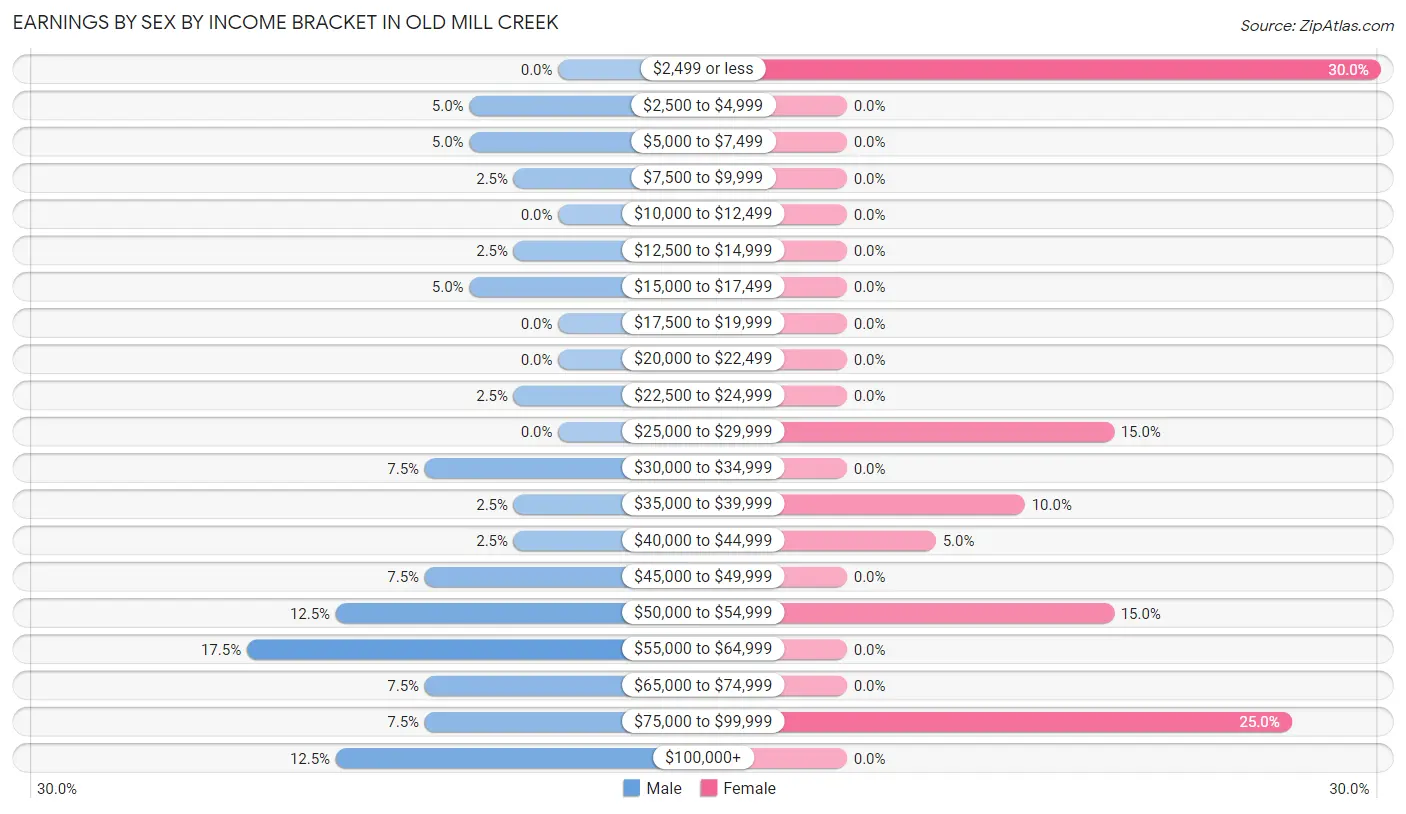
Earnings by Sex by Income Bracket in Old Mill Creek
The most common earnings brackets in Old Mill Creek are $55,000 to $64,999 for men (7 | 17.5%) and $2,499 or less for women (6 | 30.0%).
| Income | Male | Female |
| $2,499 or less | 0 (0.0%) | 6 (30.0%) |
| $2,500 to $4,999 | 2 (5.0%) | 0 (0.0%) |
| $5,000 to $7,499 | 2 (5.0%) | 0 (0.0%) |
| $7,500 to $9,999 | 1 (2.5%) | 0 (0.0%) |
| $10,000 to $12,499 | 0 (0.0%) | 0 (0.0%) |
| $12,500 to $14,999 | 1 (2.5%) | 0 (0.0%) |
| $15,000 to $17,499 | 2 (5.0%) | 0 (0.0%) |
| $17,500 to $19,999 | 0 (0.0%) | 0 (0.0%) |
| $20,000 to $22,499 | 0 (0.0%) | 0 (0.0%) |
| $22,500 to $24,999 | 1 (2.5%) | 0 (0.0%) |
| $25,000 to $29,999 | 0 (0.0%) | 3 (15.0%) |
| $30,000 to $34,999 | 3 (7.5%) | 0 (0.0%) |
| $35,000 to $39,999 | 1 (2.5%) | 2 (10.0%) |
| $40,000 to $44,999 | 1 (2.5%) | 1 (5.0%) |
| $45,000 to $49,999 | 3 (7.5%) | 0 (0.0%) |
| $50,000 to $54,999 | 5 (12.5%) | 3 (15.0%) |
| $55,000 to $64,999 | 7 (17.5%) | 0 (0.0%) |
| $65,000 to $74,999 | 3 (7.5%) | 0 (0.0%) |
| $75,000 to $99,999 | 3 (7.5%) | 5 (25.0%) |
| $100,000+ | 5 (12.5%) | 0 (0.0%) |
| Total | 40 (100.0%) | 20 (100.0%) |
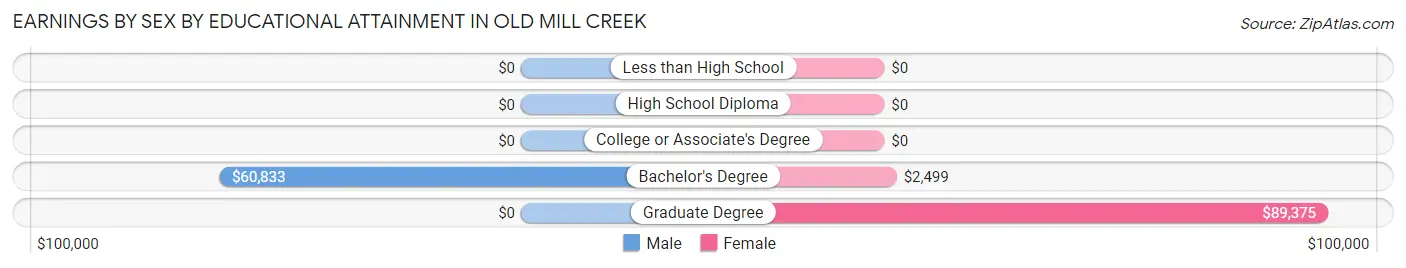
Earnings by Sex by Educational Attainment in Old Mill Creek
Average earnings in Old Mill Creek are $52,000 for men and $36,875 for women, a difference of 29.1%. Men with an educational attainment of bachelor's degree enjoy the highest average annual earnings of $60,833, while those with bachelor's degree education earn the least with $60,833. Women with an educational attainment of graduate degree earn the most with the average annual earnings of $89,375, while those with bachelor's degree education have the smallest earnings of $2,499.
| Educational Attainment | Male Income | Female Income |
| Less than High School | - | - |
| High School Diploma | - | - |
| College or Associate's Degree | - | - |
| Bachelor's Degree | $60,833 | $2,499 |
| Graduate Degree | - | - |
| Total | $52,000 | $36,875 |
Family Income in Old Mill Creek
Family Income Brackets in Old Mill Creek
According to the Old Mill Creek family income data, there are 9 families falling into the $100,000 to $149,999 income range, which is the most common income bracket and makes up 28.1% of all families.
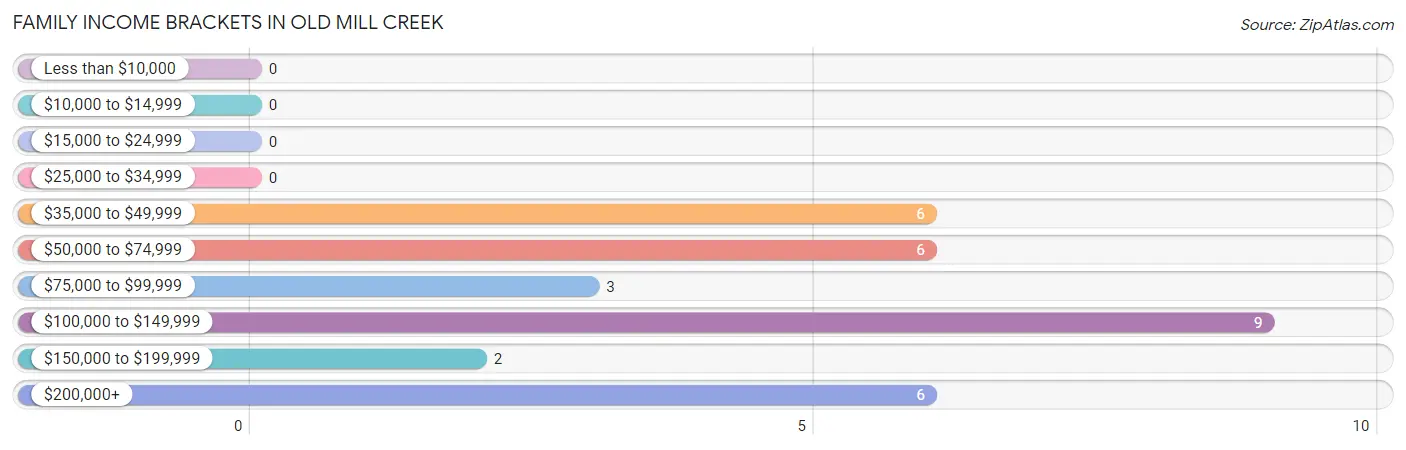
| Income Bracket | # Families | % Families |
| Less than $10,000 | 0 | 0.0% |
| $10,000 to $14,999 | 0 | 0.0% |
| $15,000 to $24,999 | 0 | 0.0% |
| $25,000 to $34,999 | 0 | 0.0% |
| $35,000 to $49,999 | 6 | 18.8% |
| $50,000 to $74,999 | 6 | 18.8% |
| $75,000 to $99,999 | 3 | 9.4% |
| $100,000 to $149,999 | 9 | 28.1% |
| $150,000 to $199,999 | 2 | 6.3% |
| $200,000+ | 6 | 18.8% |
Family Income by Famaliy Size in Old Mill Creek
2-person families (20 | 62.5%) account for the highest median family income in Old Mill Creek with $121,250 per family, while 2-person families (20 | 62.5%) have the highest median income of $60,625 per family member.
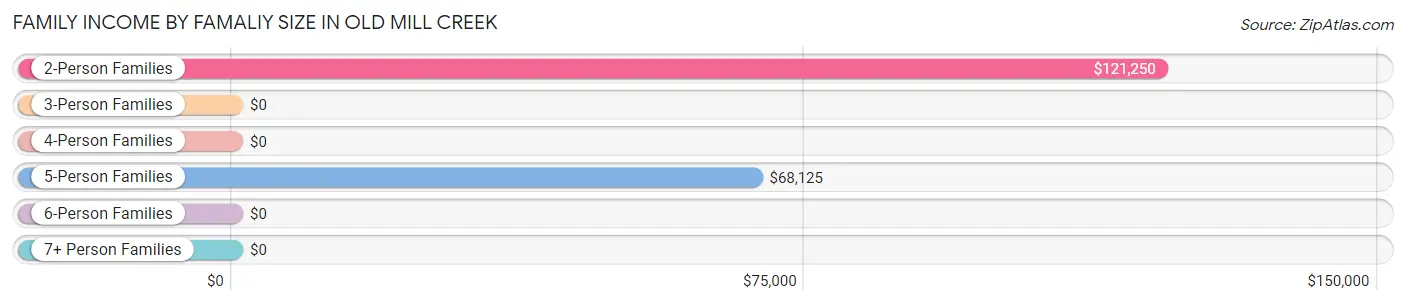
| Income Bracket | # Families | Median Income |
| 2-Person Families | 20 (62.5%) | $121,250 |
| 3-Person Families | 3 (9.4%) | $0 |
| 4-Person Families | 5 (15.6%) | $0 |
| 5-Person Families | 3 (9.4%) | $68,125 |
| 6-Person Families | 0 (0.0%) | $0 |
| 7+ Person Families | 1 (3.1%) | $0 |
| Total | 32 (100.0%) | $108,750 |
Family Income by Number of Earners in Old Mill Creek
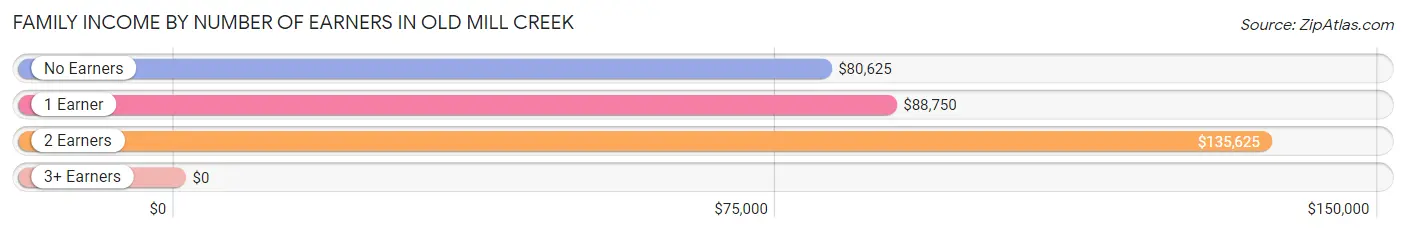
| Number of Earners | # Families | Median Income |
| No Earners | 9 (28.1%) | $80,625 |
| 1 Earner | 12 (37.5%) | $88,750 |
| 2 Earners | 8 (25.0%) | $135,625 |
| 3+ Earners | 3 (9.4%) | $0 |
| Total | 32 (100.0%) | $108,750 |
Household Income in Old Mill Creek
Household Income Brackets in Old Mill Creek
With 18 households falling in the category, the $50,000 to $74,999 income range is the most frequent in Old Mill Creek, accounting for 32.7% of all households.
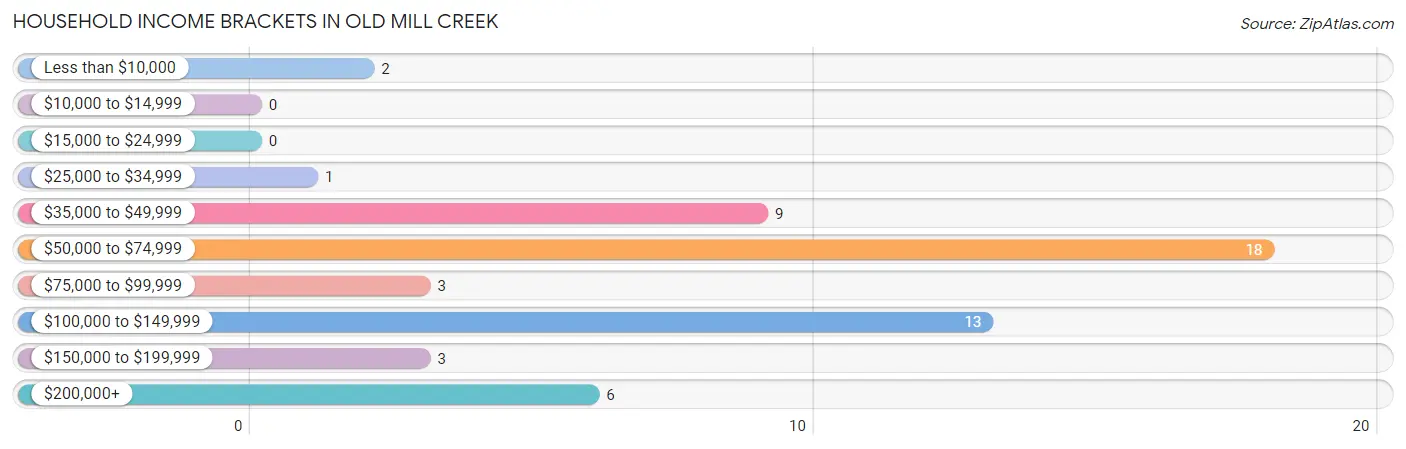
| Income Bracket | # Households | % Households |
| Less than $10,000 | 2 | 3.6% |
| $10,000 to $14,999 | 0 | 0.0% |
| $15,000 to $24,999 | 0 | 0.0% |
| $25,000 to $34,999 | 1 | 1.8% |
| $35,000 to $49,999 | 9 | 16.4% |
| $50,000 to $74,999 | 18 | 32.7% |
| $75,000 to $99,999 | 3 | 5.5% |
| $100,000 to $149,999 | 13 | 23.6% |
| $150,000 to $199,999 | 3 | 5.5% |
| $200,000+ | 6 | 10.9% |
Household Income by Householder Age in Old Mill Creek
The median household income in Old Mill Creek is $69,688, with the highest median household income of $82,500 found in the 65+ years age bracket for the primary householder. A total of 28 households (50.9%) fall into this category. Meanwhile, the 15 to 24 years age bracket for the primary householder has the lowest median household income of $0, with 2 households (3.6%) in this group.
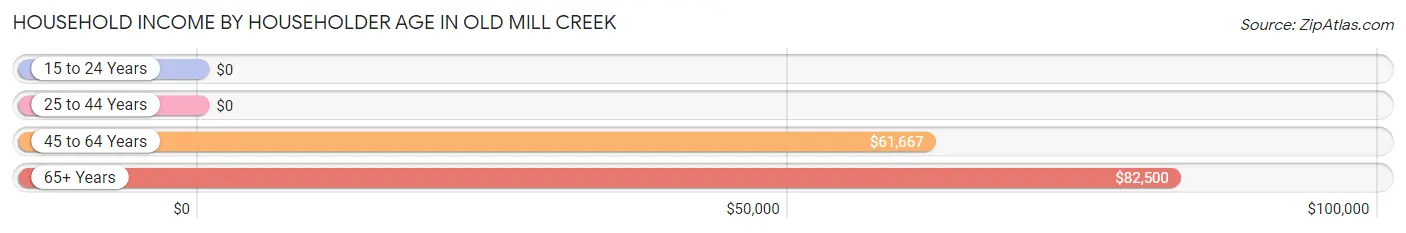
| Income Bracket | # Households | Median Income |
| 15 to 24 Years | 2 (3.6%) | $0 |
| 25 to 44 Years | 9 (16.4%) | $0 |
| 45 to 64 Years | 16 (29.1%) | $61,667 |
| 65+ Years | 28 (50.9%) | $82,500 |
| Total | 55 (100.0%) | $69,688 |
Poverty in Old Mill Creek
Income Below Poverty by Sex and Age in Old Mill Creek
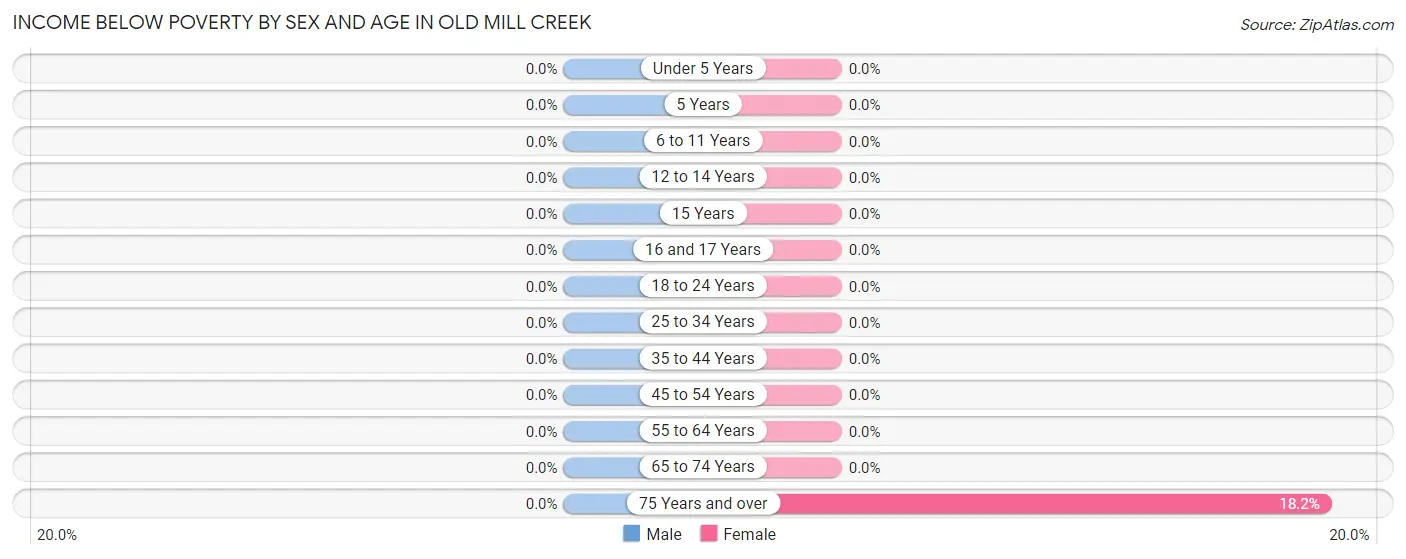
| Age Bracket | Male | Female |
| Under 5 Years | 0 (0.0%) | 0 (0.0%) |
| 5 Years | 0 (0.0%) | 0 (0.0%) |
| 6 to 11 Years | 0 (0.0%) | 0 (0.0%) |
| 12 to 14 Years | 0 (0.0%) | 0 (0.0%) |
| 15 Years | 0 (0.0%) | 0 (0.0%) |
| 16 and 17 Years | 0 (0.0%) | 0 (0.0%) |
| 18 to 24 Years | 0 (0.0%) | 0 (0.0%) |
| 25 to 34 Years | 0 (0.0%) | 0 (0.0%) |
| 35 to 44 Years | 0 (0.0%) | 0 (0.0%) |
| 45 to 54 Years | 0 (0.0%) | 0 (0.0%) |
| 55 to 64 Years | 0 (0.0%) | 0 (0.0%) |
| 65 to 74 Years | 0 (0.0%) | 0 (0.0%) |
| 75 Years and over | 0 (0.0%) | 2 (18.2%) |
| Total | 0 (0.0%) | 2 (3.6%) |
Income Above Poverty by Sex and Age in Old Mill Creek
According to the poverty statistics in Old Mill Creek, males aged under 5 years and females aged under 5 years are the age groups that are most secure financially, with 100.0% of males and 100.0% of females in these age groups living above the poverty line.
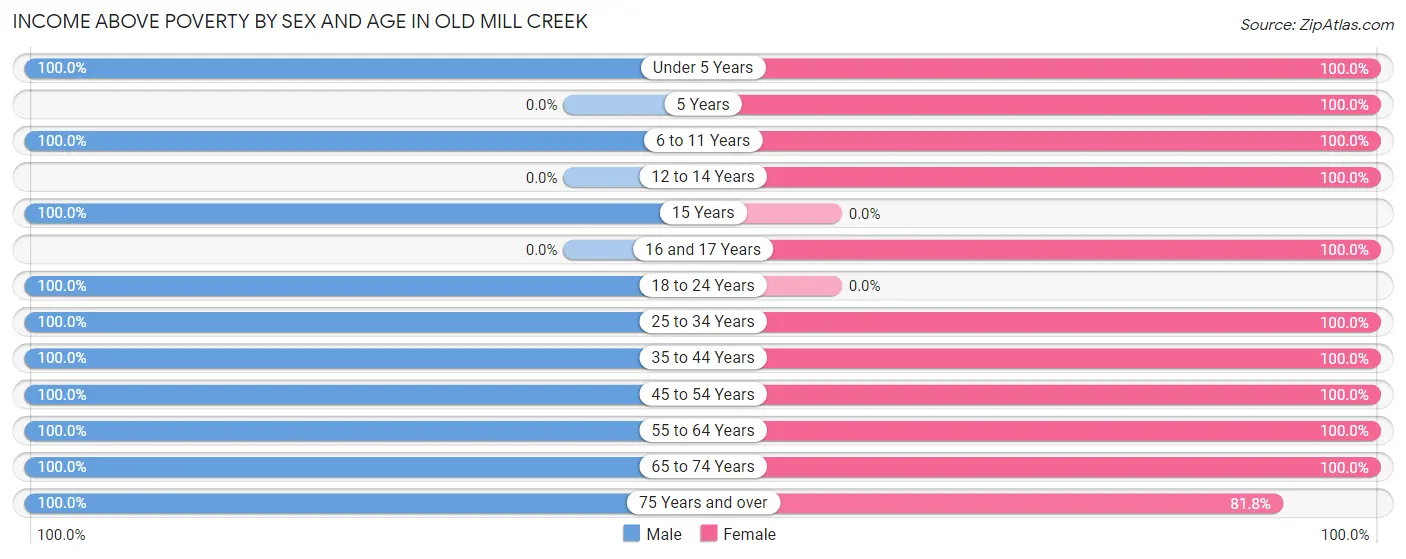
| Age Bracket | Male | Female |
| Under 5 Years | 9 (100.0%) | 4 (100.0%) |
| 5 Years | 0 (0.0%) | 1 (100.0%) |
| 6 to 11 Years | 4 (100.0%) | 4 (100.0%) |
| 12 to 14 Years | 0 (0.0%) | 2 (100.0%) |
| 15 Years | 2 (100.0%) | 0 (0.0%) |
| 16 and 17 Years | 0 (0.0%) | 1 (100.0%) |
| 18 to 24 Years | 4 (100.0%) | 0 (0.0%) |
| 25 to 34 Years | 6 (100.0%) | 5 (100.0%) |
| 35 to 44 Years | 6 (100.0%) | 9 (100.0%) |
| 45 to 54 Years | 11 (100.0%) | 1 (100.0%) |
| 55 to 64 Years | 5 (100.0%) | 6 (100.0%) |
| 65 to 74 Years | 12 (100.0%) | 12 (100.0%) |
| 75 Years and over | 7 (100.0%) | 9 (81.8%) |
| Total | 66 (100.0%) | 54 (96.4%) |
Income Below Poverty Among Married-Couple Families in Old Mill Creek
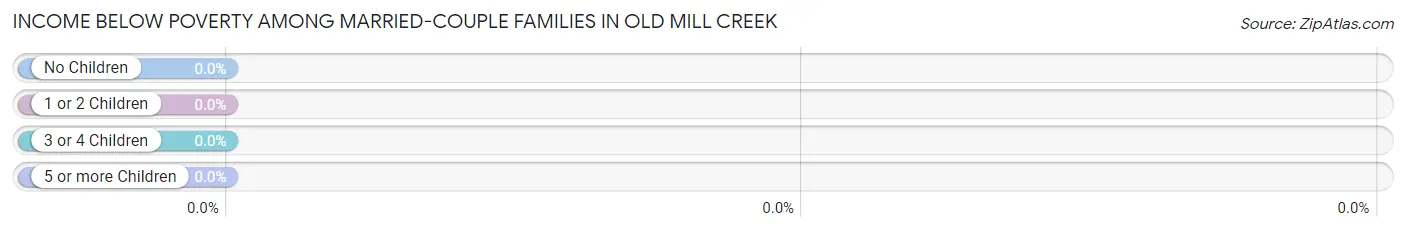
| Children | Above Poverty | Below Poverty |
| No Children | 19 (100.0%) | 0 (0.0%) |
| 1 or 2 Children | 4 (100.0%) | 0 (0.0%) |
| 3 or 4 Children | 2 (100.0%) | 0 (0.0%) |
| 5 or more Children | 1 (100.0%) | 0 (0.0%) |
| Total | 26 (100.0%) | 0 (0.0%) |
Income Below Poverty Among Single-Parent Households in Old Mill Creek
| Children | Single Father | Single Mother |
| No Children | 0 (0.0%) | 0 (0.0%) |
| 1 or 2 Children | 0 (0.0%) | 0 (0.0%) |
| 3 or 4 Children | 0 (0.0%) | 0 (0.0%) |
| 5 or more Children | 0 (0.0%) | 0 (0.0%) |
| Total | 0 (0.0%) | 0 (0.0%) |
Income Below Poverty Among Married-Couple vs Single-Parent Households in Old Mill Creek
| Children | Married-Couple Families | Single-Parent Households |
| No Children | 0 (0.0%) | 0 (0.0%) |
| 1 or 2 Children | 0 (0.0%) | 0 (0.0%) |
| 3 or 4 Children | 0 (0.0%) | 0 (0.0%) |
| 5 or more Children | 0 (0.0%) | 0 (0.0%) |
| Total | 0 (0.0%) | 0 (0.0%) |
Race in Old Mill Creek
The most populous races in Old Mill Creek are White / Caucasian (110 | 90.2%), Hispanic or Latino (10 | 8.2%), and Some other Race (10 | 8.2%).
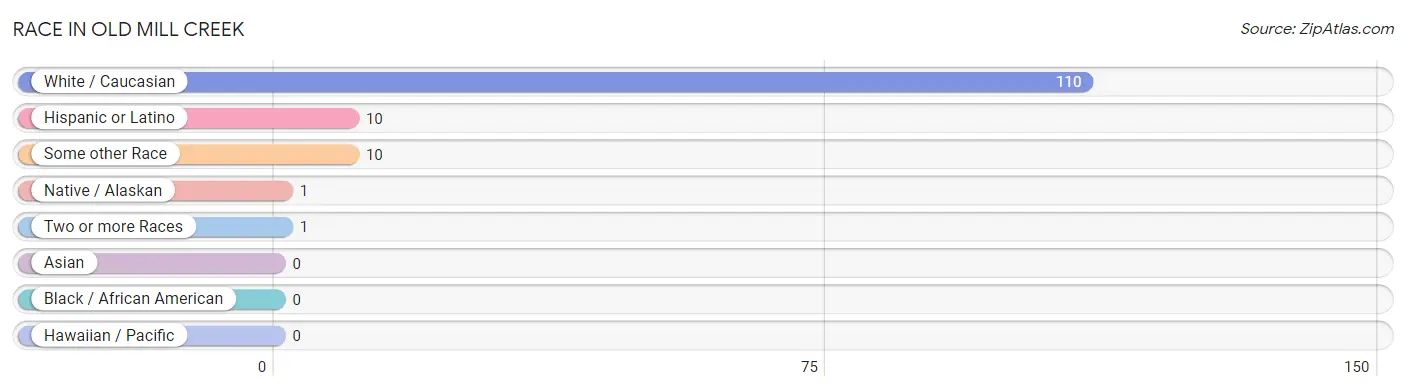
| Race | # Population | % Population |
| Asian | 0 | 0.0% |
| Black / African American | 0 | 0.0% |
| Hawaiian / Pacific | 0 | 0.0% |
| Hispanic or Latino | 10 | 8.2% |
| Native / Alaskan | 1 | 0.8% |
| White / Caucasian | 110 | 90.2% |
| Two or more Races | 1 | 0.8% |
| Some other Race | 10 | 8.2% |
| Total | 122 | 100.0% |
Ancestry in Old Mill Creek
The most populous ancestries reported in Old Mill Creek are English (23 | 18.9%), German (21 | 17.2%), Irish (14 | 11.5%), Italian (12 | 9.8%), and Mexican (10 | 8.2%), together accounting for 65.6% of all Old Mill Creek residents.
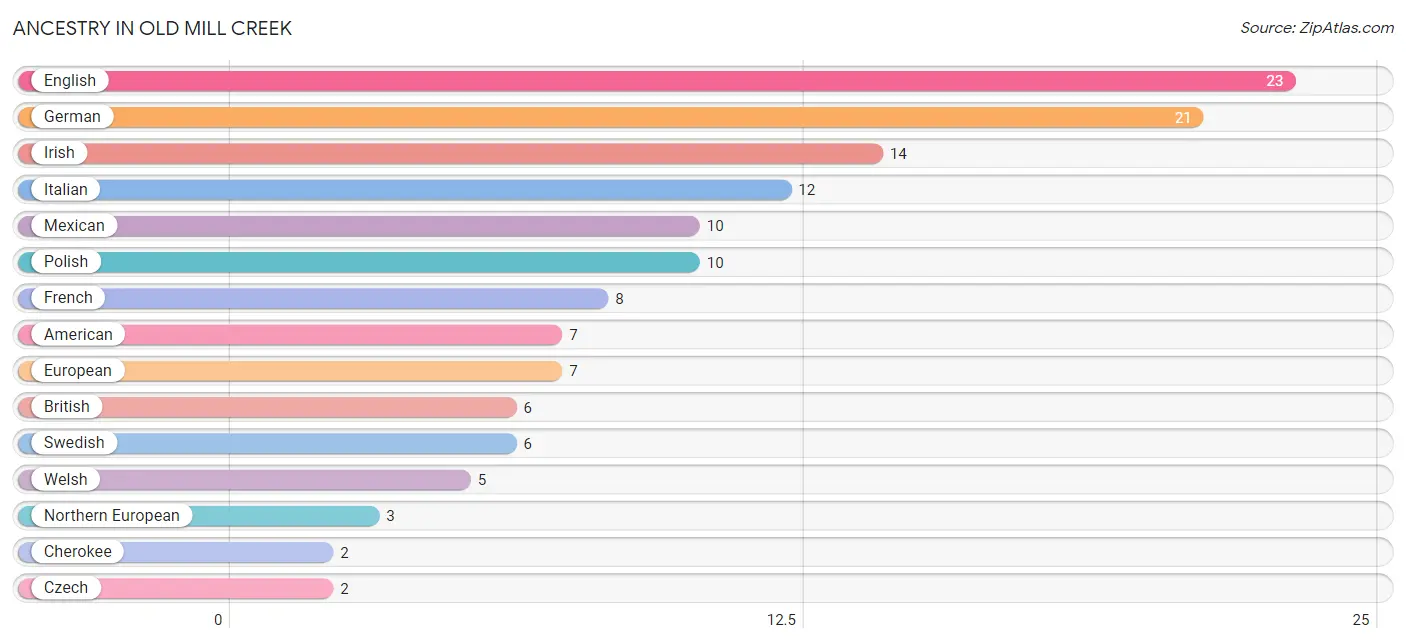
| Ancestry | # Population | % Population |
| American | 7 | 5.7% |
| British | 6 | 4.9% |
| Cherokee | 2 | 1.6% |
| Czech | 2 | 1.6% |
| English | 23 | 18.9% |
| European | 7 | 5.7% |
| French | 8 | 6.6% |
| German | 21 | 17.2% |
| Hungarian | 1 | 0.8% |
| Irish | 14 | 11.5% |
| Italian | 12 | 9.8% |
| Mexican | 10 | 8.2% |
| Northern European | 3 | 2.5% |
| Norwegian | 2 | 1.6% |
| Polish | 10 | 8.2% |
| Scotch-Irish | 2 | 1.6% |
| Swedish | 6 | 4.9% |
| Welsh | 5 | 4.1% | View All 18 Rows |
Immigrants in Old Mill Creek
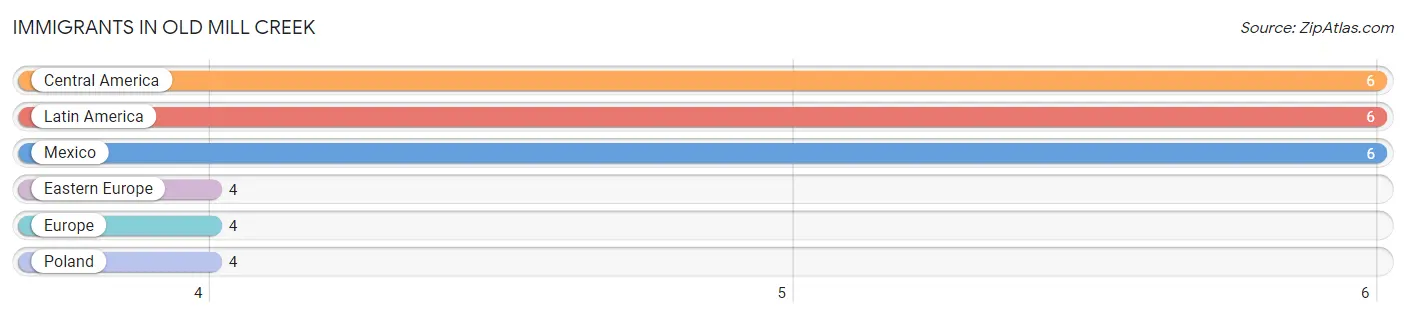
The most numerous immigrant groups reported in Old Mill Creek came from Central America (6 | 4.9%), Latin America (6 | 4.9%), Mexico (6 | 4.9%), Eastern Europe (4 | 3.3%), and Europe (4 | 3.3%), together accounting for 21.3% of all Old Mill Creek residents.
| Immigration Origin | # Population | % Population |
| Central America | 6 | 4.9% |
| Eastern Europe | 4 | 3.3% |
| Europe | 4 | 3.3% |
| Latin America | 6 | 4.9% |
| Mexico | 6 | 4.9% |
| Poland | 4 | 3.3% | View All 6 Rows |
Sex and Age in Old Mill Creek
Sex and Age in Old Mill Creek
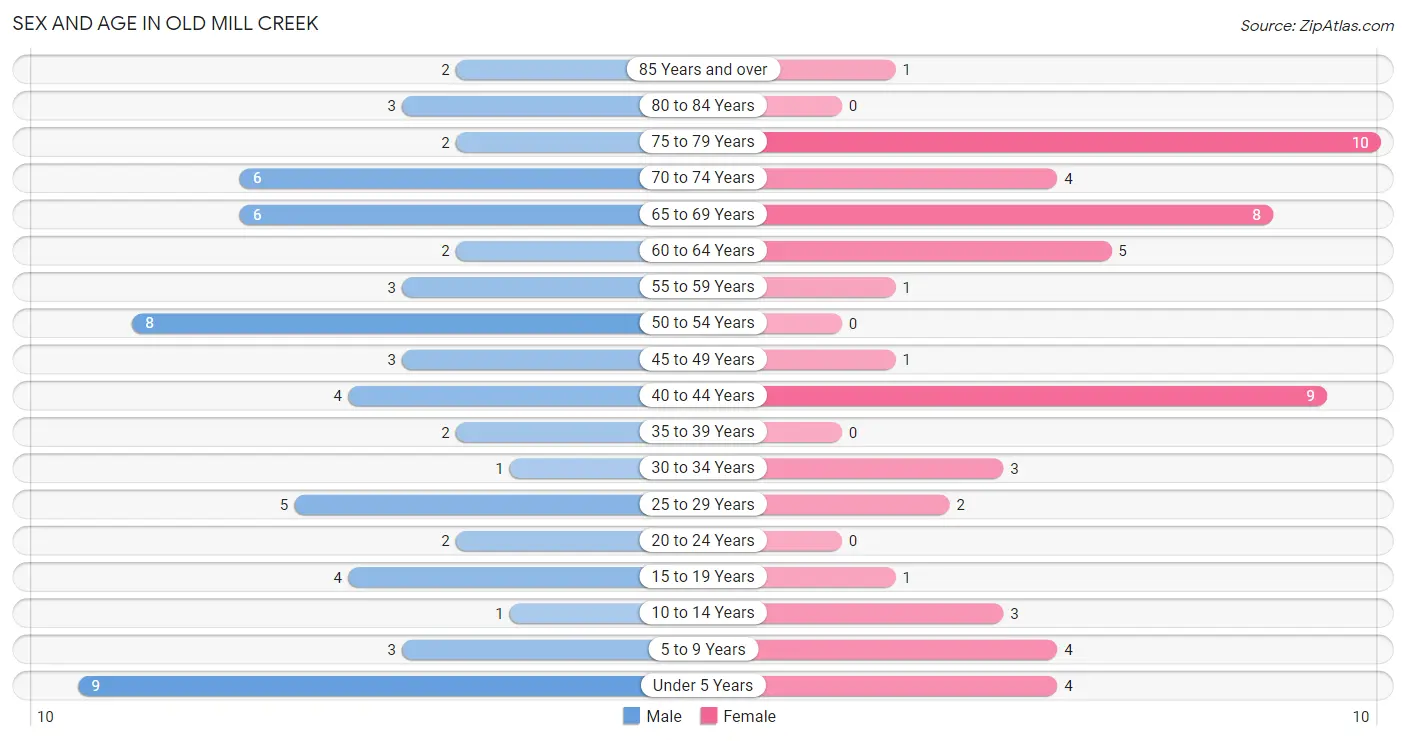
The most populous age groups in Old Mill Creek are Under 5 Years (9 | 13.6%) for men and 75 to 79 Years (10 | 17.9%) for women.
| Age Bracket | Male | Female |
| Under 5 Years | 9 (13.6%) | 4 (7.1%) |
| 5 to 9 Years | 3 (4.5%) | 4 (7.1%) |
| 10 to 14 Years | 1 (1.5%) | 3 (5.4%) |
| 15 to 19 Years | 4 (6.1%) | 1 (1.8%) |
| 20 to 24 Years | 2 (3.0%) | 0 (0.0%) |
| 25 to 29 Years | 5 (7.6%) | 2 (3.6%) |
| 30 to 34 Years | 1 (1.5%) | 3 (5.4%) |
| 35 to 39 Years | 2 (3.0%) | 0 (0.0%) |
| 40 to 44 Years | 4 (6.1%) | 9 (16.1%) |
| 45 to 49 Years | 3 (4.5%) | 1 (1.8%) |
| 50 to 54 Years | 8 (12.1%) | 0 (0.0%) |
| 55 to 59 Years | 3 (4.5%) | 1 (1.8%) |
| 60 to 64 Years | 2 (3.0%) | 5 (8.9%) |
| 65 to 69 Years | 6 (9.1%) | 8 (14.3%) |
| 70 to 74 Years | 6 (9.1%) | 4 (7.1%) |
| 75 to 79 Years | 2 (3.0%) | 10 (17.9%) |
| 80 to 84 Years | 3 (4.5%) | 0 (0.0%) |
| 85 Years and over | 2 (3.0%) | 1 (1.8%) |
| Total | 66 (100.0%) | 56 (100.0%) |
Families and Households in Old Mill Creek
Median Family Size in Old Mill Creek
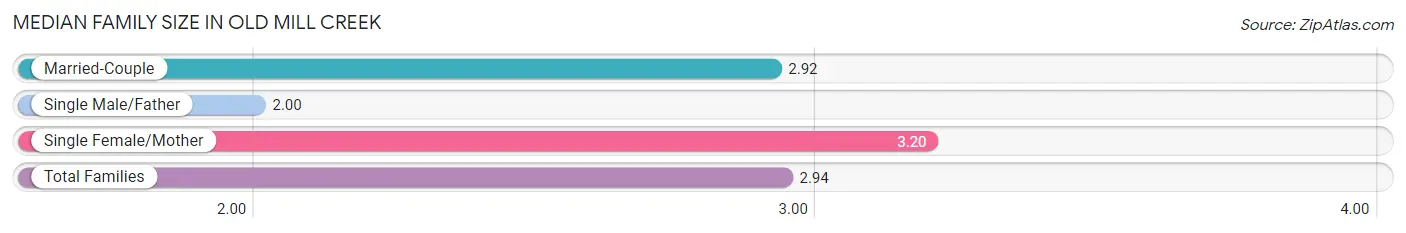
The median family size in Old Mill Creek is 2.94 persons per family, with single female/mother families (5 | 15.6%) accounting for the largest median family size of 3.2 persons per family. On the other hand, single male/father families (1 | 3.1%) represent the smallest median family size with 2.00 persons per family.
| Family Type | # Families | Family Size |
| Married-Couple | 26 (81.2%) | 2.92 |
| Single Male/Father | 1 (3.1%) | 2.00 |
| Single Female/Mother | 5 (15.6%) | 3.20 |
| Total Families | 32 (100.0%) | 2.94 |
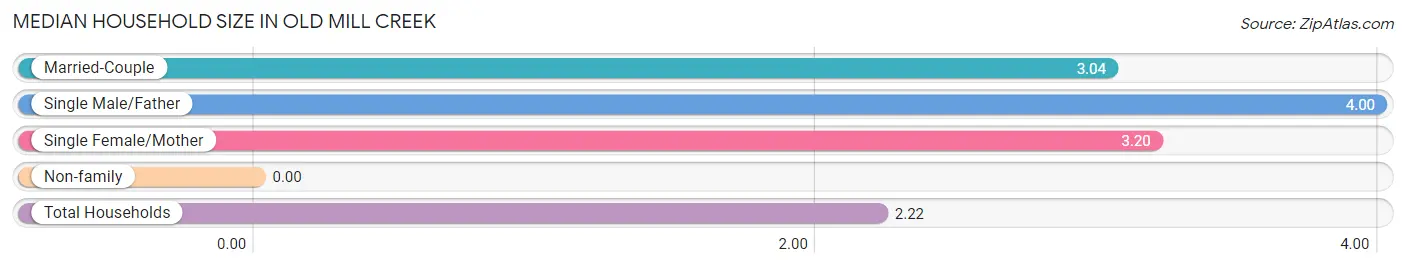
Median Household Size in Old Mill Creek
| Household Type | # Households | Household Size |
| Married-Couple | 26 (47.3%) | 3.04 |
| Single Male/Father | 1 (1.8%) | 4.00 |
| Single Female/Mother | 5 (9.1%) | 3.20 |
| Non-family | 23 (41.8%) | - |
| Total Households | 55 (100.0%) | 2.22 |
Household Size by Marriage Status in Old Mill Creek
Out of a total of 55 households in Old Mill Creek, 32 (58.2%) are family households, while 23 (41.8%) are nonfamily households. The most numerous type of family households are 2-person households, comprising 19, and the most common type of nonfamily households are 1-person households, comprising 23.
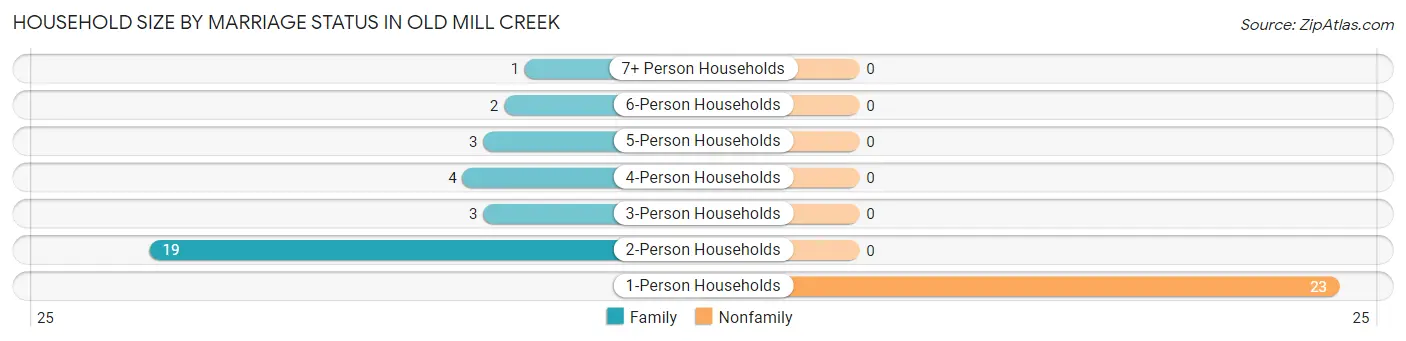
| Household Size | Family Households | Nonfamily Households |
| 1-Person Households | - | 23 (41.8%) |
| 2-Person Households | 19 (34.5%) | 0 (0.0%) |
| 3-Person Households | 3 (5.4%) | 0 (0.0%) |
| 4-Person Households | 4 (7.3%) | 0 (0.0%) |
| 5-Person Households | 3 (5.4%) | 0 (0.0%) |
| 6-Person Households | 2 (3.6%) | 0 (0.0%) |
| 7+ Person Households | 1 (1.8%) | 0 (0.0%) |
| Total | 32 (58.2%) | 23 (41.8%) |
Female Fertility in Old Mill Creek
Fertility by Age in Old Mill Creek
Average fertility rate in Old Mill Creek is 63.0 births per 1,000 women. Women in the age bracket of 20 to 34 years have the highest fertility rate with 200.0 births per 1,000 women. Women in the age bracket of 20 to 34 years acount for 100.0% of all women with births.
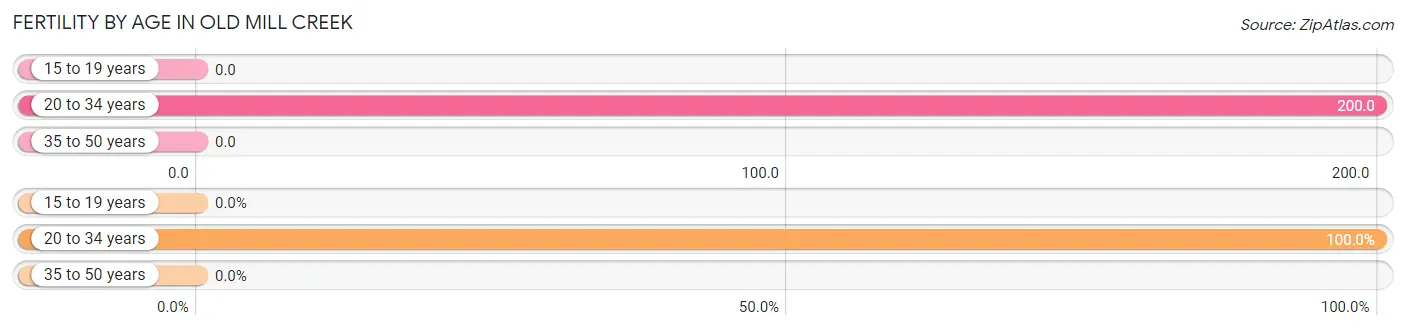
| Age Bracket | Women with Births | Births / 1,000 Women |
| 15 to 19 years | 0 (0.0%) | 0.0 |
| 20 to 34 years | 1 (100.0%) | 200.0 |
| 35 to 50 years | 0 (0.0%) | 0.0 |
| Total | 1 (100.0%) | 63.0 |
Fertility by Age by Marriage Status in Old Mill Creek
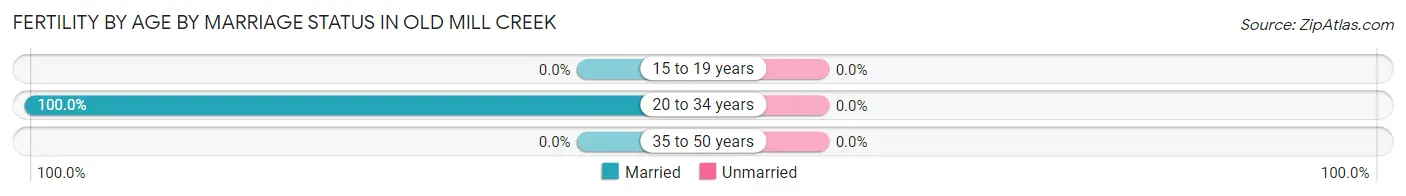
| Age Bracket | Married | Unmarried |
| 15 to 19 years | 0 (0.0%) | 0 (0.0%) |
| 20 to 34 years | 1 (100.0%) | 0 (0.0%) |
| 35 to 50 years | 0 (0.0%) | 0 (0.0%) |
| Total | 1 (100.0%) | 0 (0.0%) |
Fertility by Education in Old Mill Creek
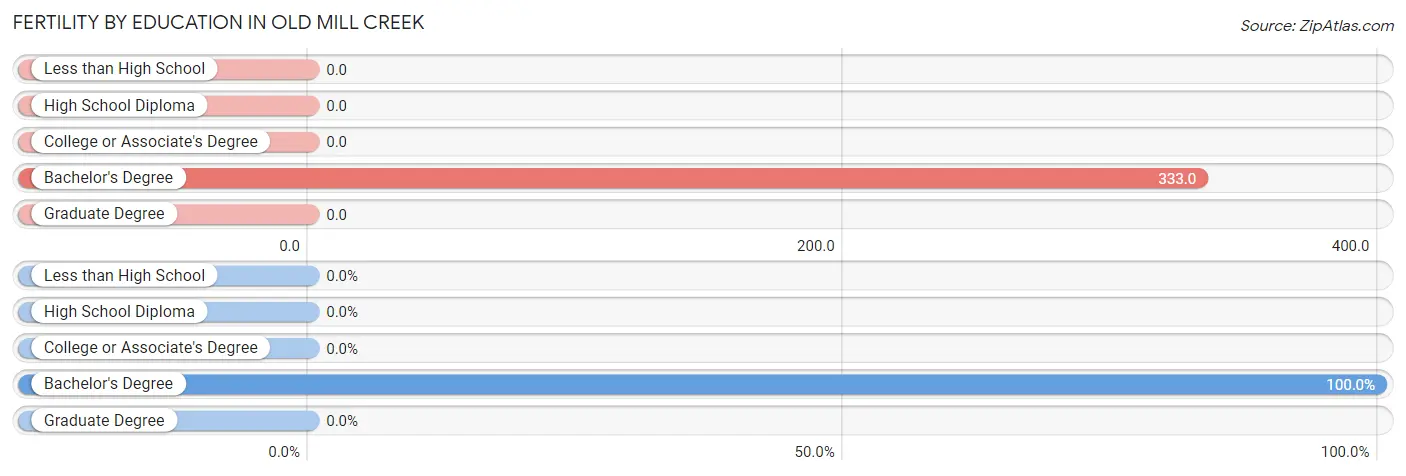
| Educational Attainment | Women with Births | Births / 1,000 Women |
| Less than High School | 0 (0.0%) | 0.0 |
| High School Diploma | 0 (0.0%) | 0.0 |
| College or Associate's Degree | 0 (0.0%) | 0.0 |
| Bachelor's Degree | 1 (100.0%) | 333.0 |
| Graduate Degree | 0 (0.0%) | 0.0 |
| Total | 1 (100.0%) | 63.0 |
Fertility by Education by Marriage Status in Old Mill Creek
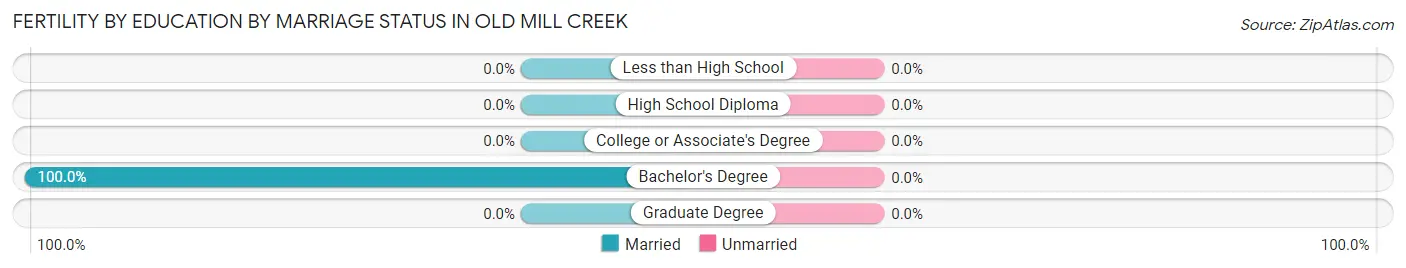
| Educational Attainment | Married | Unmarried |
| Less than High School | 0 (0.0%) | 0 (0.0%) |
| High School Diploma | 0 (0.0%) | 0 (0.0%) |
| College or Associate's Degree | 0 (0.0%) | 0 (0.0%) |
| Bachelor's Degree | 1 (100.0%) | 0 (0.0%) |
| Graduate Degree | 0 (0.0%) | 0 (0.0%) |
| Total | 1 (100.0%) | 0 (0.0%) |
Employment Characteristics in Old Mill Creek
Employment by Class of Employer in Old Mill Creek
Among the 55 employed individuals in Old Mill Creek, private company employees (31 | 56.4%), self-employed (not incorporated) (6 | 10.9%), and federal government employees (5 | 9.1%) make up the most common classes of employment.
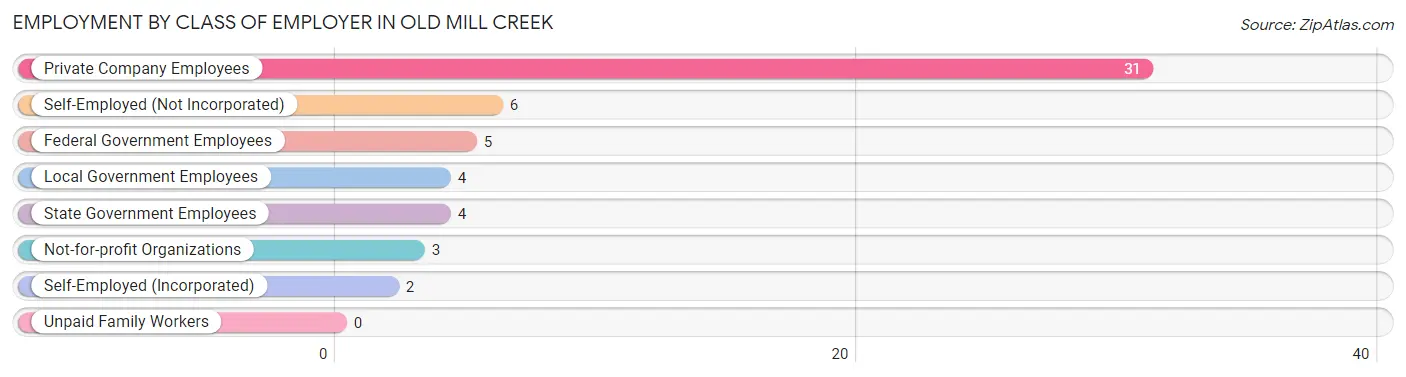
| Employer Class | # Employees | % Employees |
| Private Company Employees | 31 | 56.4% |
| Self-Employed (Incorporated) | 2 | 3.6% |
| Self-Employed (Not Incorporated) | 6 | 10.9% |
| Not-for-profit Organizations | 3 | 5.4% |
| Local Government Employees | 4 | 7.3% |
| State Government Employees | 4 | 7.3% |
| Federal Government Employees | 5 | 9.1% |
| Unpaid Family Workers | 0 | 0.0% |
| Total | 55 | 100.0% |
Employment Status by Age in Old Mill Creek
According to the labor force statistics for Old Mill Creek, out of the total population over 16 years of age (96), 59.4% or 57 individuals are in the labor force, with 3.6% or 2 of them unemployed. The age group with the highest labor force participation rate is 20 to 24 years, with 100.0% or 2 individuals in the labor force. Within the labor force, the 16 to 19 years age range has the highest percentage of unemployed individuals, with 100.0% or 2 of them being unemployed.
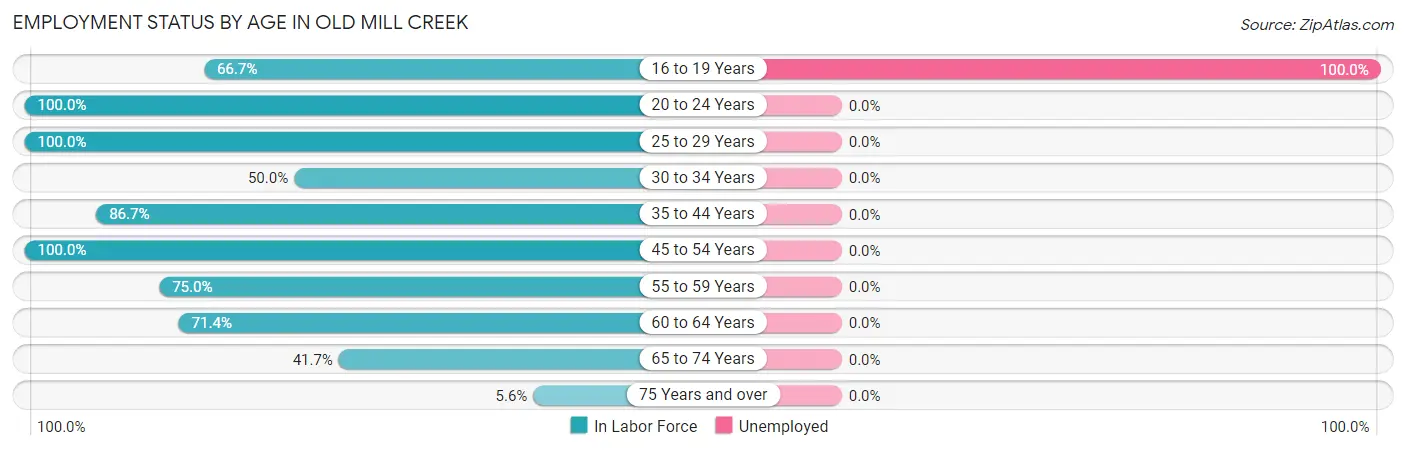
| Age Bracket | In Labor Force | Unemployed |
| 16 to 19 Years | 2 (66.7%) | 2 (100.0%) |
| 20 to 24 Years | 2 (100.0%) | 0 (0.0%) |
| 25 to 29 Years | 7 (100.0%) | 0 (0.0%) |
| 30 to 34 Years | 2 (50.0%) | 0 (0.0%) |
| 35 to 44 Years | 13 (86.7%) | 0 (0.0%) |
| 45 to 54 Years | 12 (100.0%) | 0 (0.0%) |
| 55 to 59 Years | 3 (75.0%) | 0 (0.0%) |
| 60 to 64 Years | 5 (71.4%) | 0 (0.0%) |
| 65 to 74 Years | 10 (41.7%) | 0 (0.0%) |
| 75 Years and over | 1 (5.6%) | 0 (0.0%) |
| Total | 57 (59.4%) | 2 (3.6%) |
Employment Status by Educational Attainment in Old Mill Creek
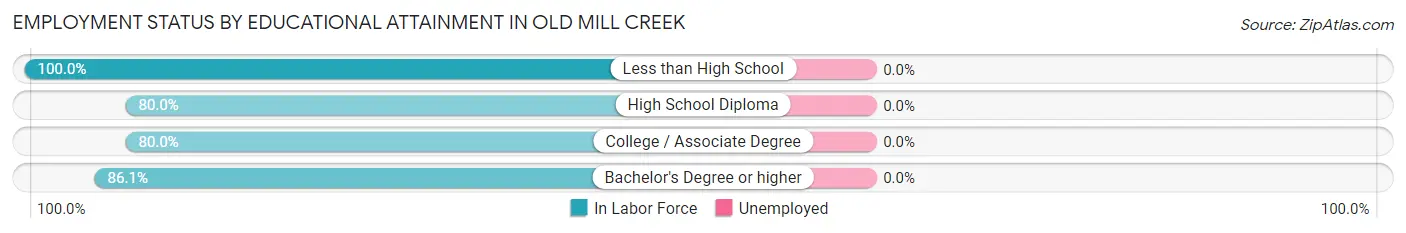
| Educational Attainment | In Labor Force | Unemployed |
| Less than High School | 3 (100.0%) | 0 (0.0%) |
| High School Diploma | 4 (80.0%) | 0 (0.0%) |
| College / Associate Degree | 4 (80.0%) | 0 (0.0%) |
| Bachelor's Degree or higher | 31 (86.1%) | 0 (0.0%) |
| Total | 42 (85.7%) | 0 (0.0%) |
Employment Occupations by Sex in Old Mill Creek
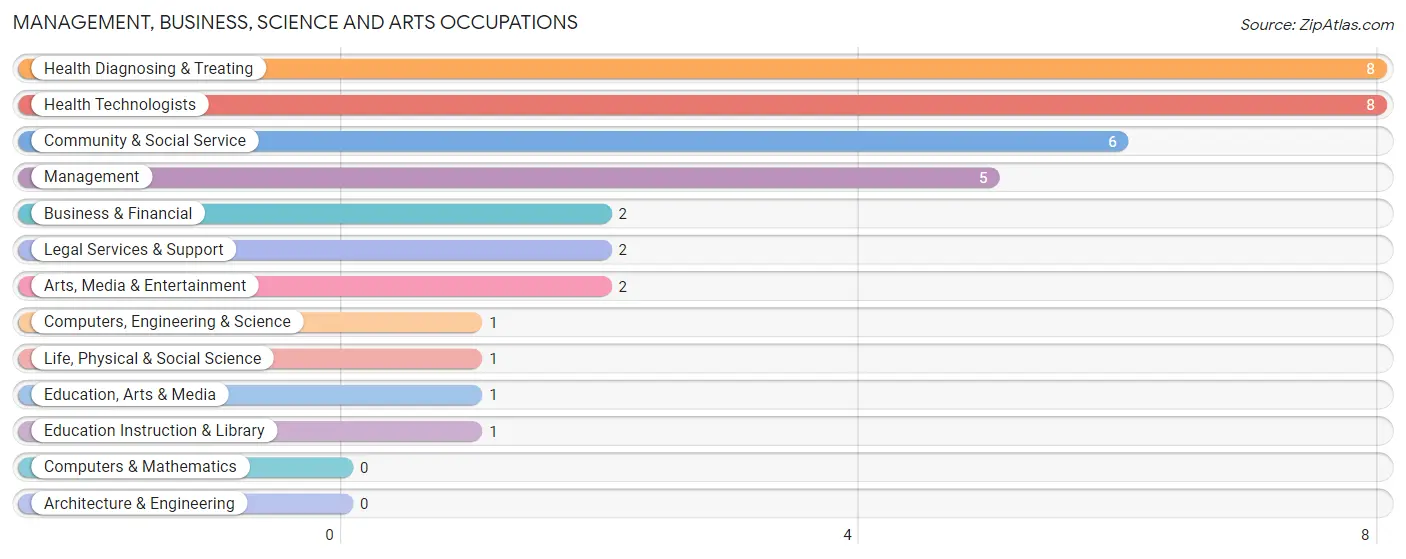
Management, Business, Science and Arts Occupations
The most common Management, Business, Science and Arts occupations in Old Mill Creek are Health Diagnosing & Treating (8 | 15.1%), Health Technologists (8 | 15.1%), Community & Social Service (6 | 11.3%), Management (5 | 9.4%), and Business & Financial (2 | 3.8%).
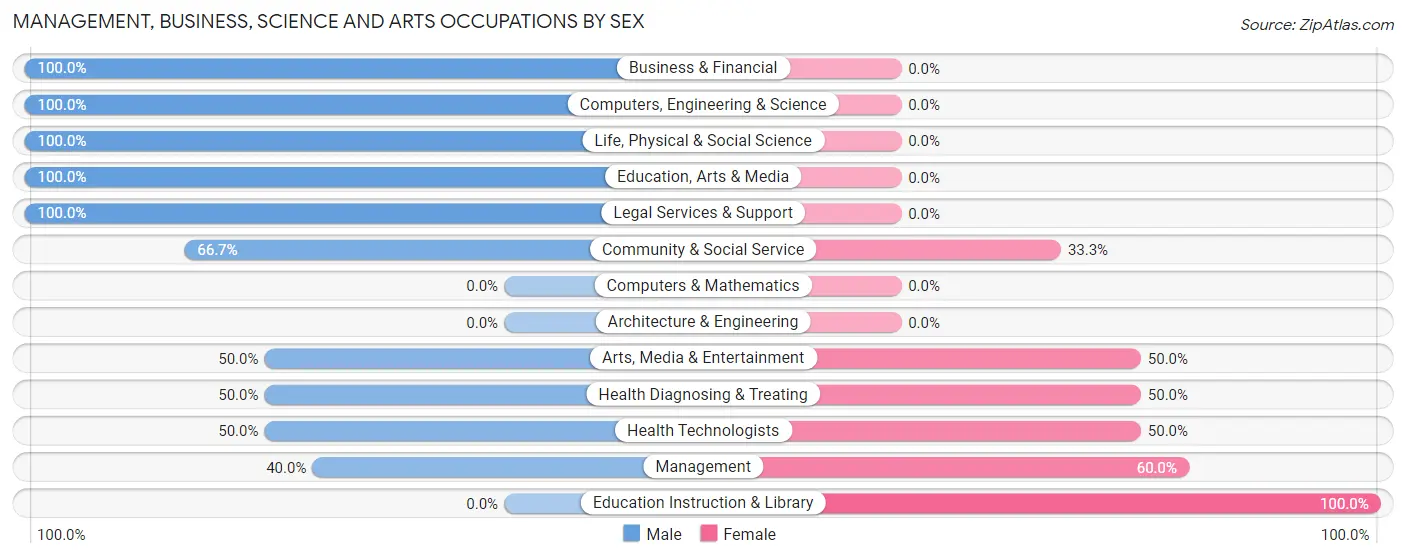
Management, Business, Science and Arts Occupations by Sex
Within the Management, Business, Science and Arts occupations in Old Mill Creek, the most male-oriented occupations are Business & Financial (100.0%), Computers, Engineering & Science (100.0%), and Life, Physical & Social Science (100.0%), while the most female-oriented occupations are Education Instruction & Library (100.0%), Management (60.0%), and Arts, Media & Entertainment (50.0%).
| Occupation | Male | Female |
| Management | 2 (40.0%) | 3 (60.0%) |
| Business & Financial | 2 (100.0%) | 0 (0.0%) |
| Computers, Engineering & Science | 1 (100.0%) | 0 (0.0%) |
| Computers & Mathematics | 0 (0.0%) | 0 (0.0%) |
| Architecture & Engineering | 0 (0.0%) | 0 (0.0%) |
| Life, Physical & Social Science | 1 (100.0%) | 0 (0.0%) |
| Community & Social Service | 4 (66.7%) | 2 (33.3%) |
| Education, Arts & Media | 1 (100.0%) | 0 (0.0%) |
| Legal Services & Support | 2 (100.0%) | 0 (0.0%) |
| Education Instruction & Library | 0 (0.0%) | 1 (100.0%) |
| Arts, Media & Entertainment | 1 (50.0%) | 1 (50.0%) |
| Health Diagnosing & Treating | 4 (50.0%) | 4 (50.0%) |
| Health Technologists | 4 (50.0%) | 4 (50.0%) |
| Total (Category) | 13 (59.1%) | 9 (40.9%) |
| Total (Overall) | 38 (71.7%) | 15 (28.3%) |
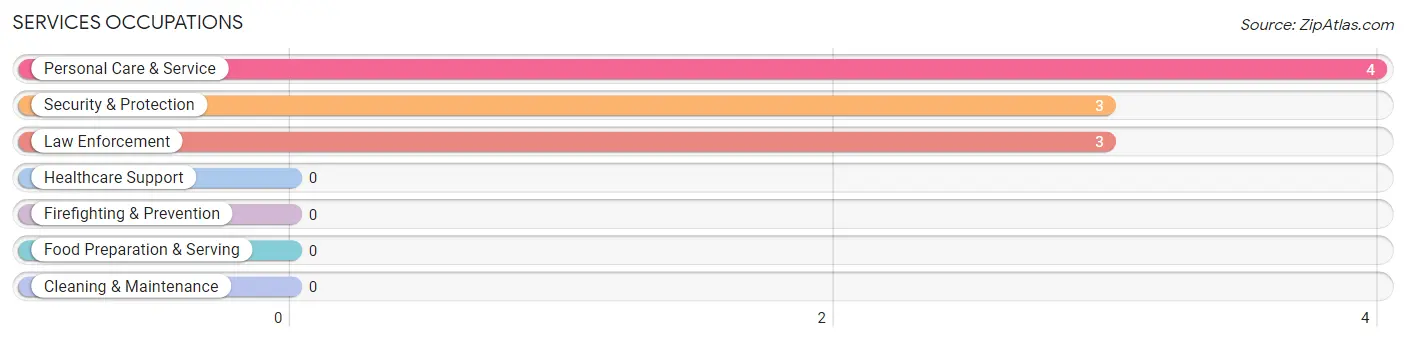
Services Occupations
The most common Services occupations in Old Mill Creek are Personal Care & Service (4 | 7.5%), Security & Protection (3 | 5.7%), and Law Enforcement (3 | 5.7%).
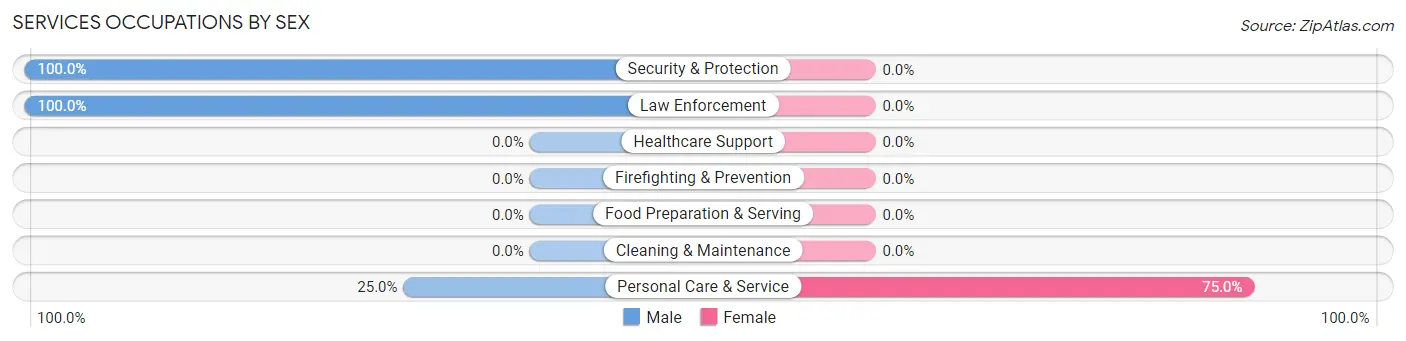
Services Occupations by Sex
| Occupation | Male | Female |
| Healthcare Support | 0 (0.0%) | 0 (0.0%) |
| Security & Protection | 3 (100.0%) | 0 (0.0%) |
| Firefighting & Prevention | 0 (0.0%) | 0 (0.0%) |
| Law Enforcement | 3 (100.0%) | 0 (0.0%) |
| Food Preparation & Serving | 0 (0.0%) | 0 (0.0%) |
| Cleaning & Maintenance | 0 (0.0%) | 0 (0.0%) |
| Personal Care & Service | 1 (25.0%) | 3 (75.0%) |
| Total (Category) | 4 (57.1%) | 3 (42.9%) |
| Total (Overall) | 38 (71.7%) | 15 (28.3%) |
Sales and Office Occupations
The most common Sales and Office occupations in Old Mill Creek are Sales & Related (9 | 17.0%), and Office & Administration (2 | 3.8%).
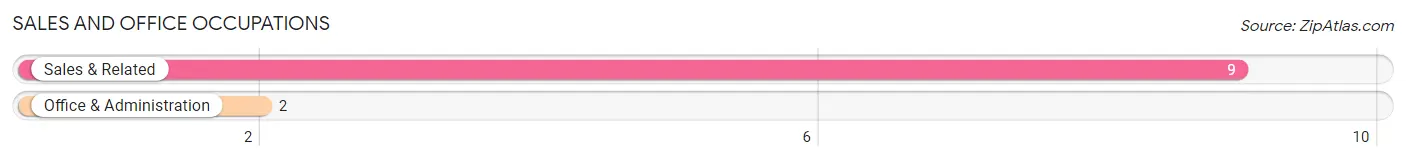
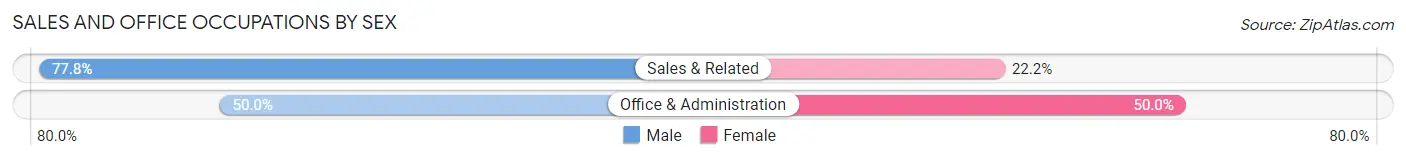
Sales and Office Occupations by Sex
| Occupation | Male | Female |
| Sales & Related | 7 (77.8%) | 2 (22.2%) |
| Office & Administration | 1 (50.0%) | 1 (50.0%) |
| Total (Category) | 8 (72.7%) | 3 (27.3%) |
| Total (Overall) | 38 (71.7%) | 15 (28.3%) |
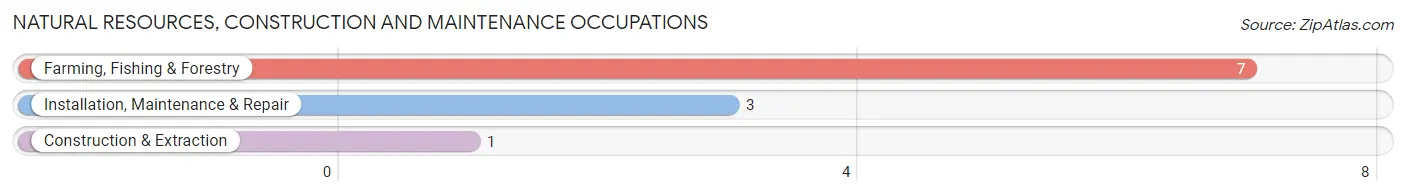
Natural Resources, Construction and Maintenance Occupations
The most common Natural Resources, Construction and Maintenance occupations in Old Mill Creek are Farming, Fishing & Forestry (7 | 13.2%), Installation, Maintenance & Repair (3 | 5.7%), and Construction & Extraction (1 | 1.9%).
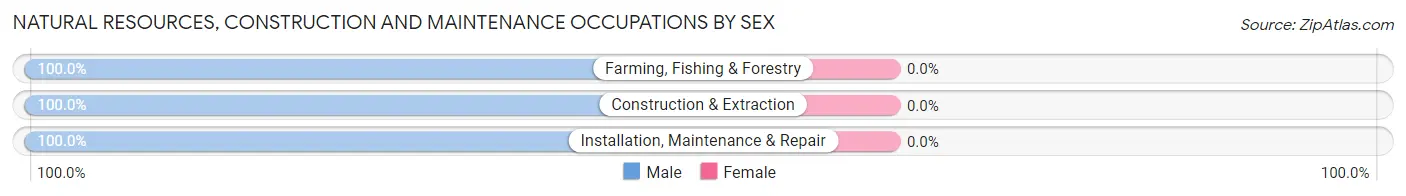
Natural Resources, Construction and Maintenance Occupations by Sex
| Occupation | Male | Female |
| Farming, Fishing & Forestry | 7 (100.0%) | 0 (0.0%) |
| Construction & Extraction | 1 (100.0%) | 0 (0.0%) |
| Installation, Maintenance & Repair | 3 (100.0%) | 0 (0.0%) |
| Total (Category) | 11 (100.0%) | 0 (0.0%) |
| Total (Overall) | 38 (71.7%) | 15 (28.3%) |
Production, Transportation and Moving Occupations
The most common Production, Transportation and Moving occupations in Old Mill Creek are , and Material Moving (2 | 3.8%).
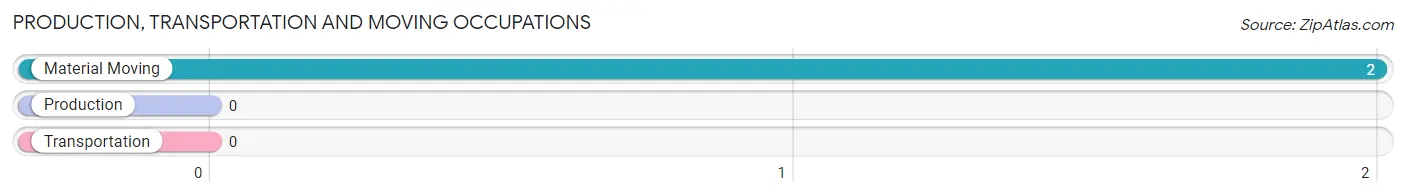
Production, Transportation and Moving Occupations by Sex
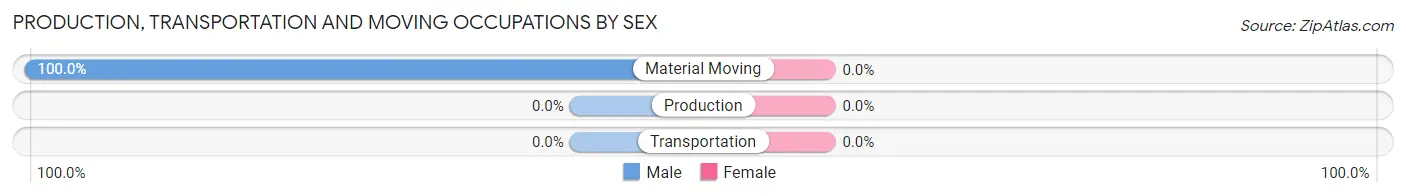
| Occupation | Male | Female |
| Production | 0 (0.0%) | 0 (0.0%) |
| Transportation | 0 (0.0%) | 0 (0.0%) |
| Material Moving | 2 (100.0%) | 0 (0.0%) |
| Total (Category) | 2 (100.0%) | 0 (0.0%) |
| Total (Overall) | 38 (71.7%) | 15 (28.3%) |
Employment Industries by Sex in Old Mill Creek
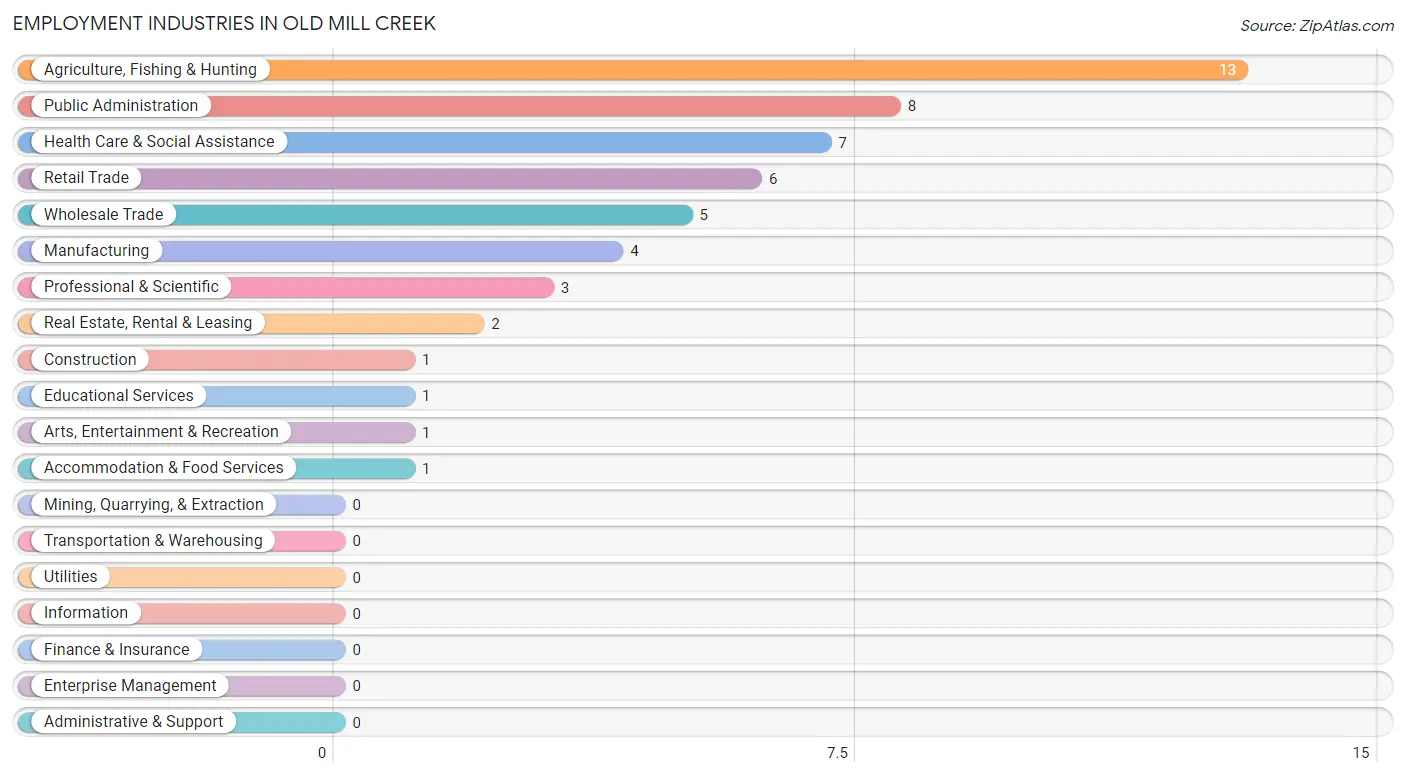
Employment Industries in Old Mill Creek
The major employment industries in Old Mill Creek include Agriculture, Fishing & Hunting (13 | 24.5%), Public Administration (8 | 15.1%), Health Care & Social Assistance (7 | 13.2%), Retail Trade (6 | 11.3%), and Wholesale Trade (5 | 9.4%).
Employment Industries by Sex in Old Mill Creek
The Old Mill Creek industries that see more men than women are Construction (100.0%), Wholesale Trade (100.0%), and Real Estate, Rental & Leasing (100.0%), whereas the industries that tend to have a higher number of women are Educational Services (100.0%), Accommodation & Food Services (100.0%), and Retail Trade (83.3%).
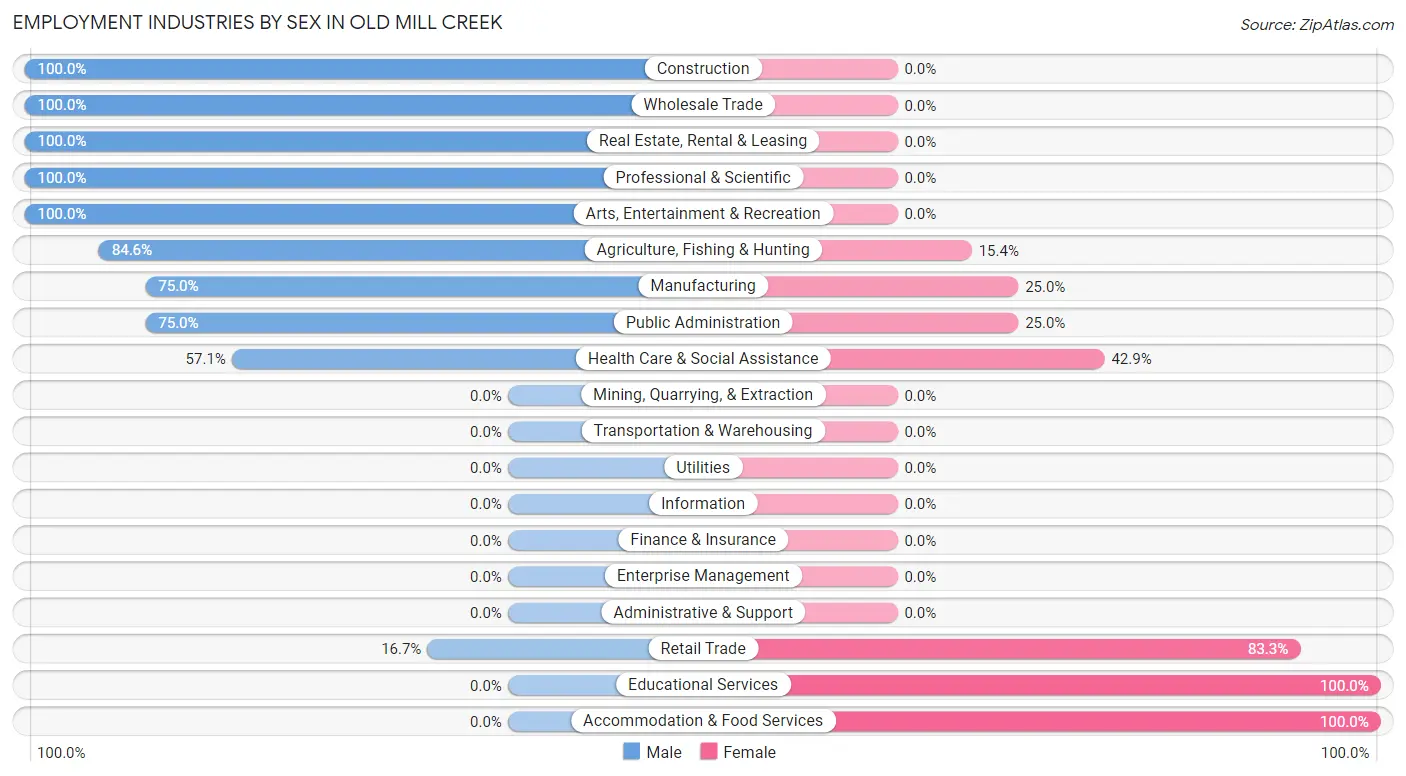
| Industry | Male | Female |
| Agriculture, Fishing & Hunting | 11 (84.6%) | 2 (15.4%) |
| Mining, Quarrying, & Extraction | 0 (0.0%) | 0 (0.0%) |
| Construction | 1 (100.0%) | 0 (0.0%) |
| Manufacturing | 3 (75.0%) | 1 (25.0%) |
| Wholesale Trade | 5 (100.0%) | 0 (0.0%) |
| Retail Trade | 1 (16.7%) | 5 (83.3%) |
| Transportation & Warehousing | 0 (0.0%) | 0 (0.0%) |
| Utilities | 0 (0.0%) | 0 (0.0%) |
| Information | 0 (0.0%) | 0 (0.0%) |
| Finance & Insurance | 0 (0.0%) | 0 (0.0%) |
| Real Estate, Rental & Leasing | 2 (100.0%) | 0 (0.0%) |
| Professional & Scientific | 3 (100.0%) | 0 (0.0%) |
| Enterprise Management | 0 (0.0%) | 0 (0.0%) |
| Administrative & Support | 0 (0.0%) | 0 (0.0%) |
| Educational Services | 0 (0.0%) | 1 (100.0%) |
| Health Care & Social Assistance | 4 (57.1%) | 3 (42.9%) |
| Arts, Entertainment & Recreation | 1 (100.0%) | 0 (0.0%) |
| Accommodation & Food Services | 0 (0.0%) | 1 (100.0%) |
| Public Administration | 6 (75.0%) | 2 (25.0%) |
| Total | 38 (71.7%) | 15 (28.3%) |
Education in Old Mill Creek
School Enrollment in Old Mill Creek
The most common levels of schooling among the 18 students in Old Mill Creek are elementary school (6 | 33.3%), middle school (4 | 22.2%), and nursery / preschool (3 | 16.7%).
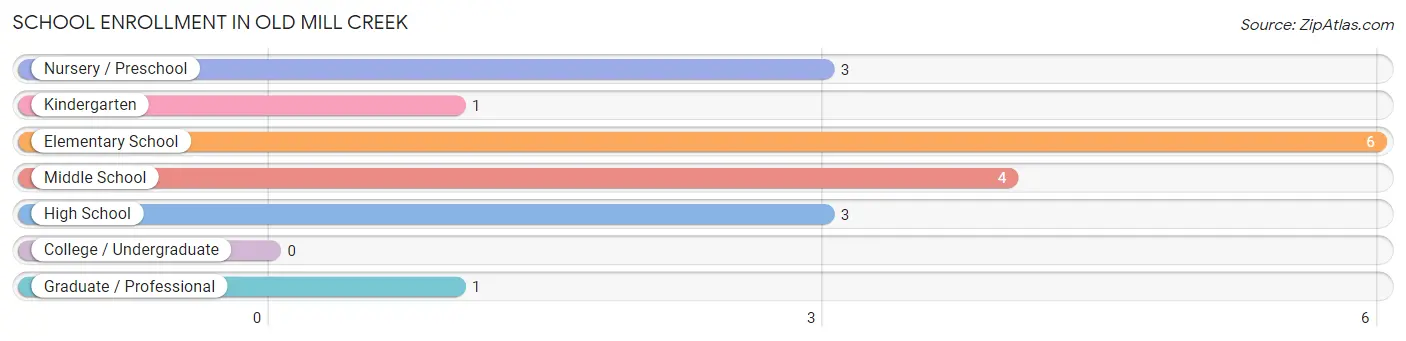
| School Level | # Students | % Students |
| Nursery / Preschool | 3 | 16.7% |
| Kindergarten | 1 | 5.6% |
| Elementary School | 6 | 33.3% |
| Middle School | 4 | 22.2% |
| High School | 3 | 16.7% |
| College / Undergraduate | 0 | 0.0% |
| Graduate / Professional | 1 | 5.6% |
| Total | 18 | 100.0% |
School Enrollment by Age by Funding Source in Old Mill Creek
Out of a total of 18 students who are enrolled in schools in Old Mill Creek, 8 (44.4%) attend a private institution, while the remaining 10 (55.6%) are enrolled in public schools. The age group of 3 to 4 year olds has the highest likelihood of being enrolled in private schools, with 3 (100.0% in the age bracket) enrolled. Conversely, the age group of 10 to 14 year olds has the lowest likelihood of being enrolled in a private school, with 4 (100.0% in the age bracket) attending a public institution.
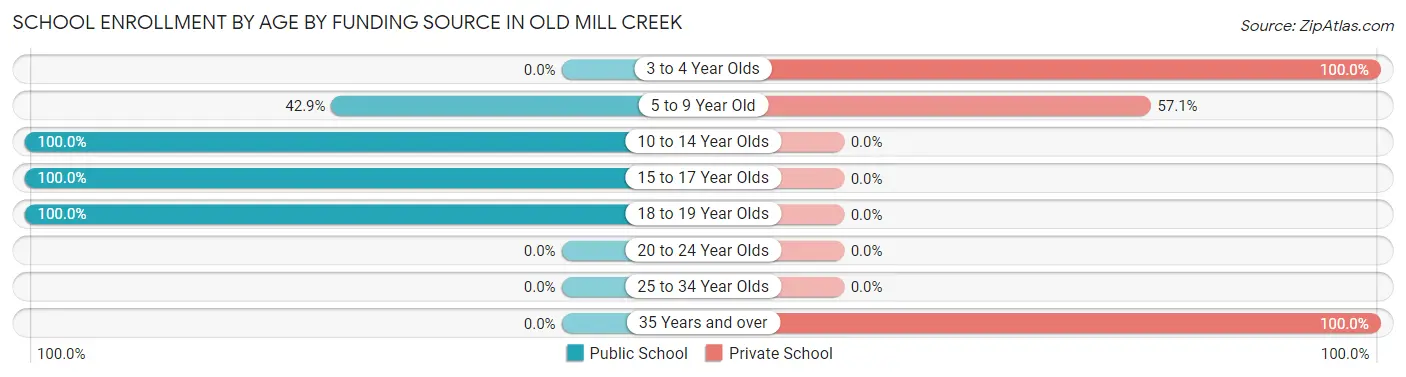
| Age Bracket | Public School | Private School |
| 3 to 4 Year Olds | 0 (0.0%) | 3 (100.0%) |
| 5 to 9 Year Old | 3 (42.9%) | 4 (57.1%) |
| 10 to 14 Year Olds | 4 (100.0%) | 0 (0.0%) |
| 15 to 17 Year Olds | 1 (100.0%) | 0 (0.0%) |
| 18 to 19 Year Olds | 2 (100.0%) | 0 (0.0%) |
| 20 to 24 Year Olds | 0 (0.0%) | 0 (0.0%) |
| 25 to 34 Year Olds | 0 (0.0%) | 0 (0.0%) |
| 35 Years and over | 0 (0.0%) | 1 (100.0%) |
| Total | 10 (55.6%) | 8 (44.4%) |
Educational Attainment by Field of Study in Old Mill Creek
Bio, nature & agricultural (17 | 24.3%), physical & health sciences (8 | 11.4%), social sciences (8 | 11.4%), science & technology (7 | 10.0%), and business (6 | 8.6%) are the most common fields of study among 70 individuals in Old Mill Creek who have obtained a bachelor's degree or higher.
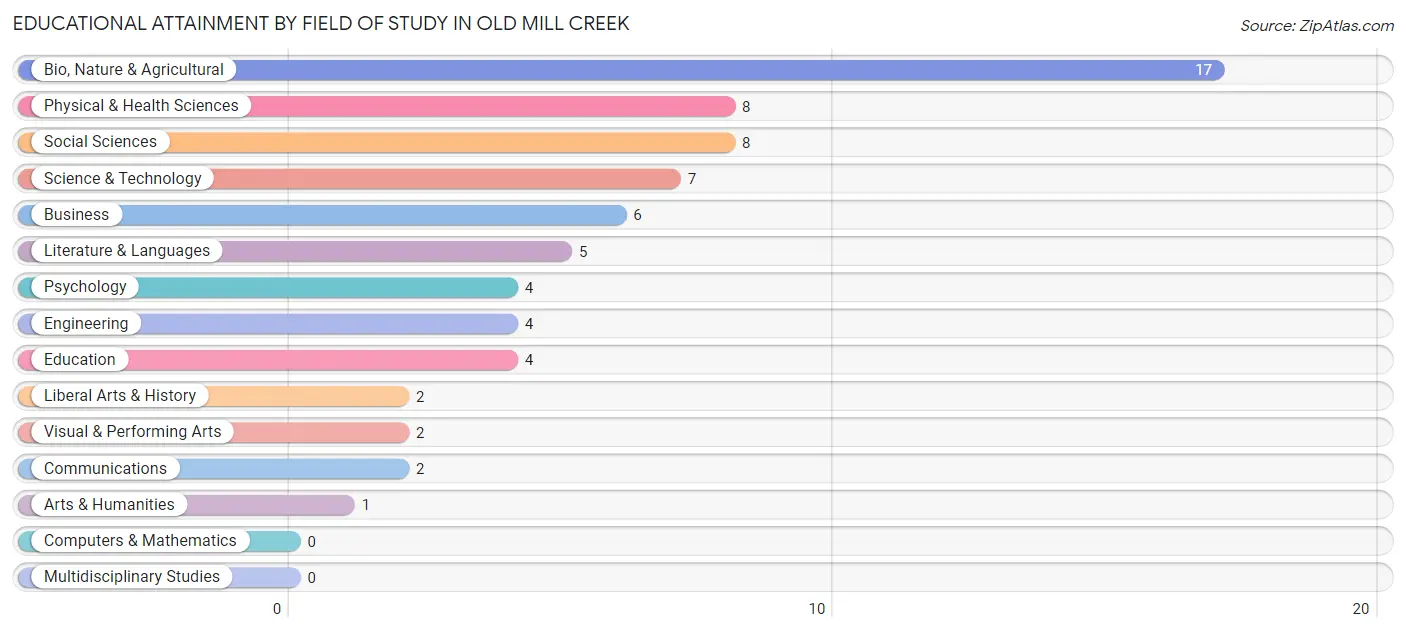
| Field of Study | # Graduates | % Graduates |
| Computers & Mathematics | 0 | 0.0% |
| Bio, Nature & Agricultural | 17 | 24.3% |
| Physical & Health Sciences | 8 | 11.4% |
| Psychology | 4 | 5.7% |
| Social Sciences | 8 | 11.4% |
| Engineering | 4 | 5.7% |
| Multidisciplinary Studies | 0 | 0.0% |
| Science & Technology | 7 | 10.0% |
| Business | 6 | 8.6% |
| Education | 4 | 5.7% |
| Literature & Languages | 5 | 7.1% |
| Liberal Arts & History | 2 | 2.9% |
| Visual & Performing Arts | 2 | 2.9% |
| Communications | 2 | 2.9% |
| Arts & Humanities | 1 | 1.4% |
| Total | 70 | 100.0% |
Transportation & Commute in Old Mill Creek
Vehicle Availability by Sex in Old Mill Creek
The most prevalent vehicle ownership categories in Old Mill Creek are males with 2 vehicles (14, accounting for 35.0%) and females with 2 vehicles (5, making up 93.3%).
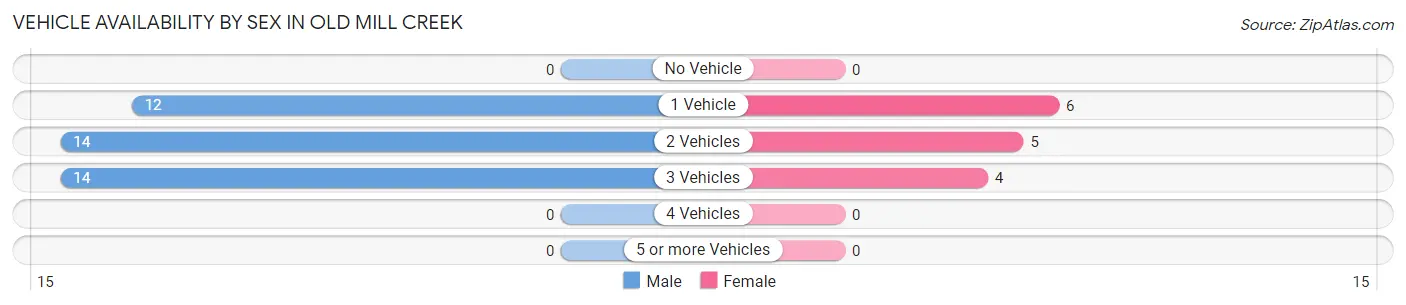
| Vehicles Available | Male | Female |
| No Vehicle | 0 (0.0%) | 0 (0.0%) |
| 1 Vehicle | 12 (30.0%) | 6 (40.0%) |
| 2 Vehicles | 14 (35.0%) | 5 (33.3%) |
| 3 Vehicles | 14 (35.0%) | 4 (26.7%) |
| 4 Vehicles | 0 (0.0%) | 0 (0.0%) |
| 5 or more Vehicles | 0 (0.0%) | 0 (0.0%) |
| Total | 40 (100.0%) | 15 (100.0%) |
Commute Time in Old Mill Creek
The most frequently occuring commute durations in Old Mill Creek are 20 to 24 minutes (10 commuters, 22.7%), 10 to 14 minutes (8 commuters, 18.2%), and 5 to 9 minutes (7 commuters, 15.9%).
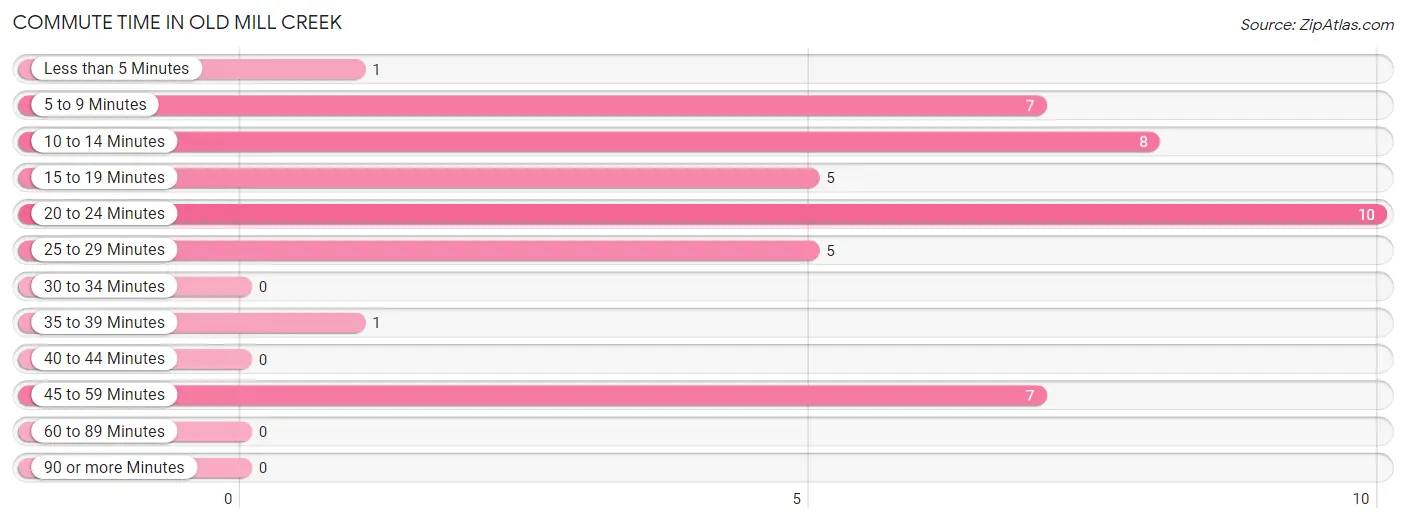
| Commute Time | # Commuters | % Commuters |
| Less than 5 Minutes | 1 | 2.3% |
| 5 to 9 Minutes | 7 | 15.9% |
| 10 to 14 Minutes | 8 | 18.2% |
| 15 to 19 Minutes | 5 | 11.4% |
| 20 to 24 Minutes | 10 | 22.7% |
| 25 to 29 Minutes | 5 | 11.4% |
| 30 to 34 Minutes | 0 | 0.0% |
| 35 to 39 Minutes | 1 | 2.3% |
| 40 to 44 Minutes | 0 | 0.0% |
| 45 to 59 Minutes | 7 | 15.9% |
| 60 to 89 Minutes | 0 | 0.0% |
| 90 or more Minutes | 0 | 0.0% |
Commute Time by Sex in Old Mill Creek
The most common commute times in Old Mill Creek are 20 to 24 minutes (10 commuters, 31.2%) for males and 25 to 29 minutes (4 commuters, 33.3%) for females.
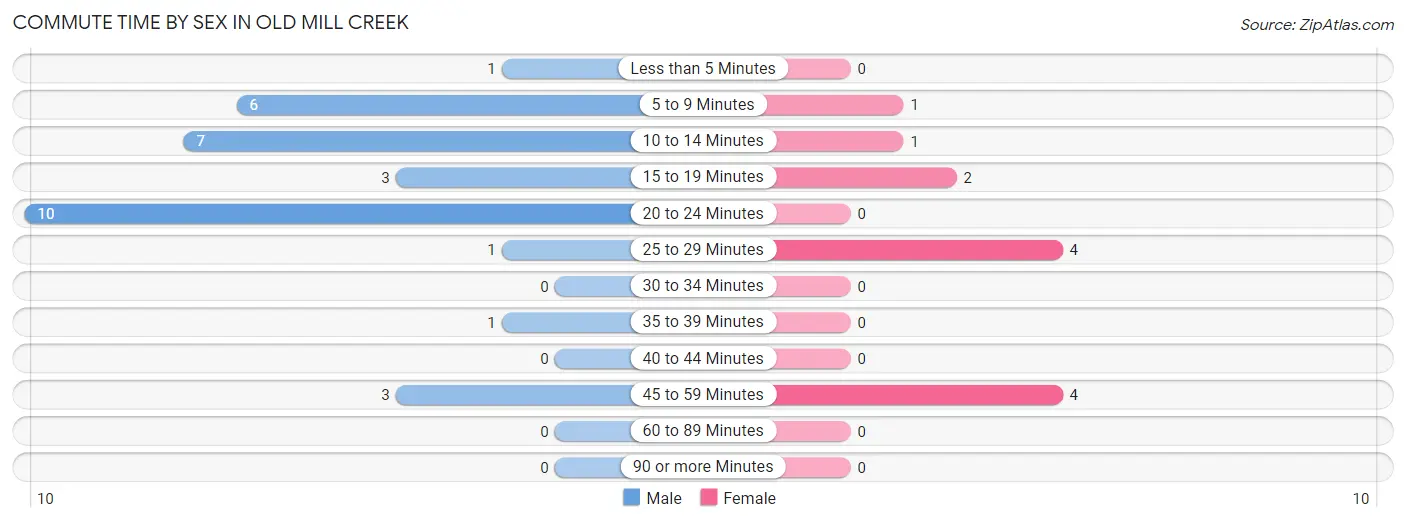
| Commute Time | Male | Female |
| Less than 5 Minutes | 1 (3.1%) | 0 (0.0%) |
| 5 to 9 Minutes | 6 (18.8%) | 1 (8.3%) |
| 10 to 14 Minutes | 7 (21.9%) | 1 (8.3%) |
| 15 to 19 Minutes | 3 (9.4%) | 2 (16.7%) |
| 20 to 24 Minutes | 10 (31.2%) | 0 (0.0%) |
| 25 to 29 Minutes | 1 (3.1%) | 4 (33.3%) |
| 30 to 34 Minutes | 0 (0.0%) | 0 (0.0%) |
| 35 to 39 Minutes | 1 (3.1%) | 0 (0.0%) |
| 40 to 44 Minutes | 0 (0.0%) | 0 (0.0%) |
| 45 to 59 Minutes | 3 (9.4%) | 4 (33.3%) |
| 60 to 89 Minutes | 0 (0.0%) | 0 (0.0%) |
| 90 or more Minutes | 0 (0.0%) | 0 (0.0%) |
Time of Departure to Work by Sex in Old Mill Creek
The most frequent times of departure to work in Old Mill Creek are 7:00 AM to 7:29 AM (8, 25.0%) for males and 11:00 AM to 11:59 AM (4, 33.3%) for females.
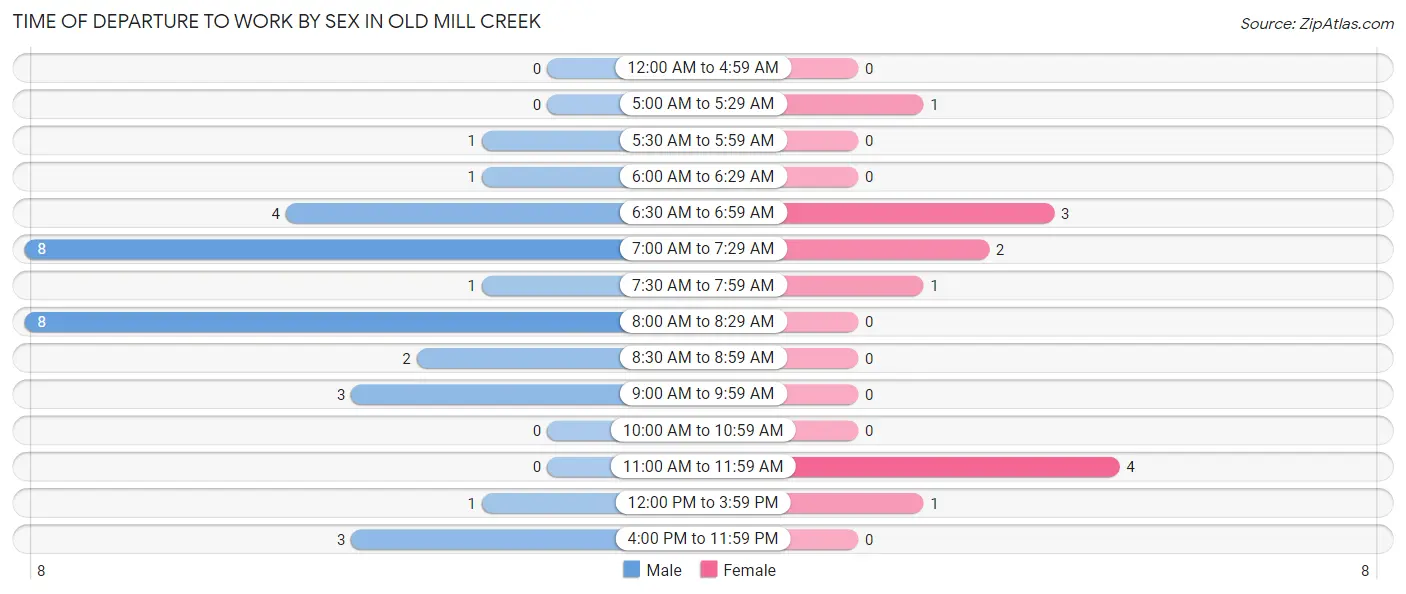
| Time of Departure | Male | Female |
| 12:00 AM to 4:59 AM | 0 (0.0%) | 0 (0.0%) |
| 5:00 AM to 5:29 AM | 0 (0.0%) | 1 (8.3%) |
| 5:30 AM to 5:59 AM | 1 (3.1%) | 0 (0.0%) |
| 6:00 AM to 6:29 AM | 1 (3.1%) | 0 (0.0%) |
| 6:30 AM to 6:59 AM | 4 (12.5%) | 3 (25.0%) |
| 7:00 AM to 7:29 AM | 8 (25.0%) | 2 (16.7%) |
| 7:30 AM to 7:59 AM | 1 (3.1%) | 1 (8.3%) |
| 8:00 AM to 8:29 AM | 8 (25.0%) | 0 (0.0%) |
| 8:30 AM to 8:59 AM | 2 (6.2%) | 0 (0.0%) |
| 9:00 AM to 9:59 AM | 3 (9.4%) | 0 (0.0%) |
| 10:00 AM to 10:59 AM | 0 (0.0%) | 0 (0.0%) |
| 11:00 AM to 11:59 AM | 0 (0.0%) | 4 (33.3%) |
| 12:00 PM to 3:59 PM | 1 (3.1%) | 1 (8.3%) |
| 4:00 PM to 11:59 PM | 3 (9.4%) | 0 (0.0%) |
| Total | 32 (100.0%) | 12 (100.0%) |
Housing Occupancy in Old Mill Creek
Occupancy by Ownership in Old Mill Creek
Of the total 55 dwellings in Old Mill Creek, owner-occupied units account for 21 (38.2%), while renter-occupied units make up 34 (61.8%).
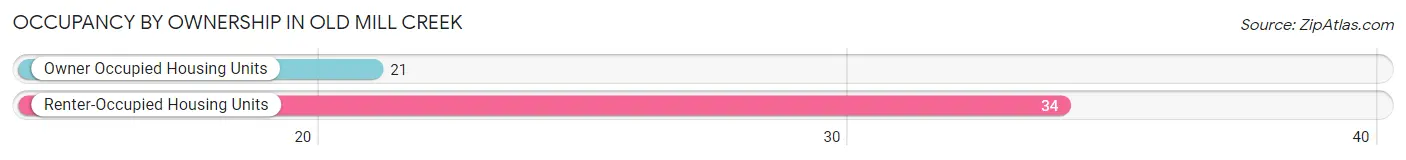
| Occupancy | # Housing Units | % Housing Units |
| Owner Occupied Housing Units | 21 | 38.2% |
| Renter-Occupied Housing Units | 34 | 61.8% |
| Total Occupied Housing Units | 55 | 100.0% |
Occupancy by Household Size in Old Mill Creek
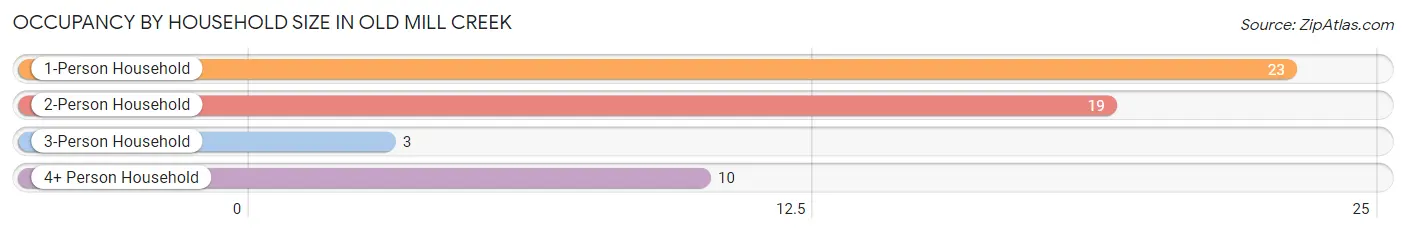
| Household Size | # Housing Units | % Housing Units |
| 1-Person Household | 23 | 41.8% |
| 2-Person Household | 19 | 34.5% |
| 3-Person Household | 3 | 5.4% |
| 4+ Person Household | 10 | 18.2% |
| Total Housing Units | 55 | 100.0% |
Occupancy by Ownership by Household Size in Old Mill Creek
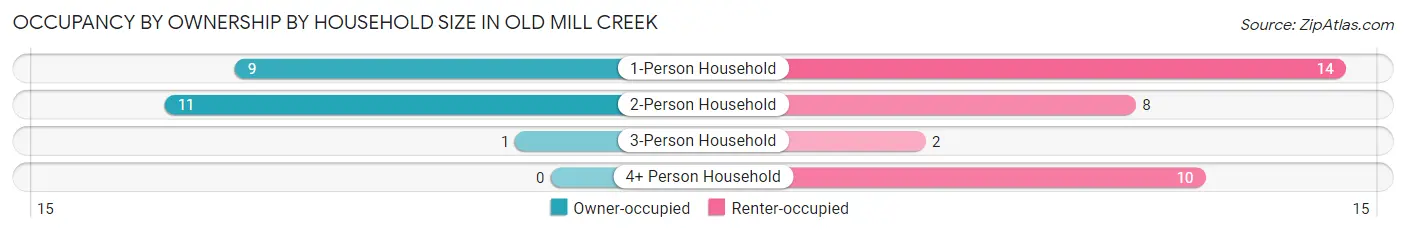
| Household Size | Owner-occupied | Renter-occupied |
| 1-Person Household | 9 (39.1%) | 14 (60.9%) |
| 2-Person Household | 11 (57.9%) | 8 (42.1%) |
| 3-Person Household | 1 (33.3%) | 2 (66.7%) |
| 4+ Person Household | 0 (0.0%) | 10 (100.0%) |
| Total Housing Units | 21 (38.2%) | 34 (61.8%) |
Occupancy by Educational Attainment in Old Mill Creek
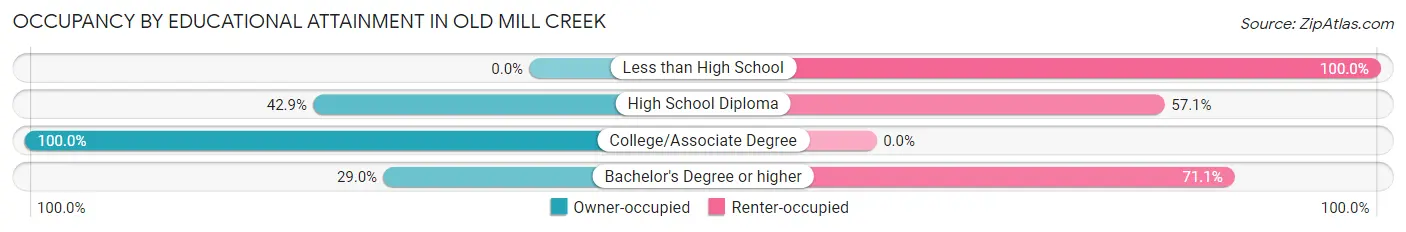
| Household Size | Owner-occupied | Renter-occupied |
| Less than High School | 0 (0.0%) | 3 (100.0%) |
| High School Diploma | 3 (42.9%) | 4 (57.1%) |
| College/Associate Degree | 7 (100.0%) | 0 (0.0%) |
| Bachelor's Degree or higher | 11 (28.9%) | 27 (71.1%) |
Occupancy by Age of Householder in Old Mill Creek
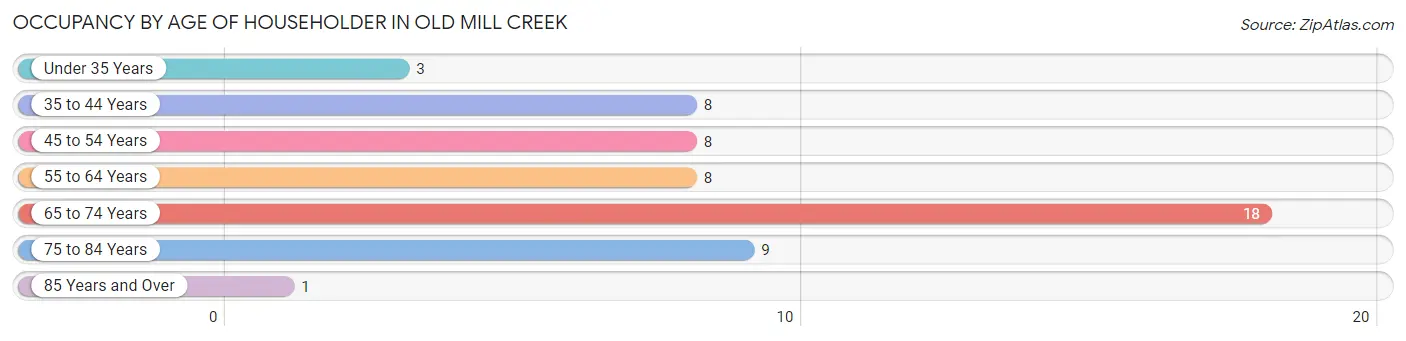
| Age Bracket | # Households | % Households |
| Under 35 Years | 3 | 5.4% |
| 35 to 44 Years | 8 | 14.5% |
| 45 to 54 Years | 8 | 14.5% |
| 55 to 64 Years | 8 | 14.5% |
| 65 to 74 Years | 18 | 32.7% |
| 75 to 84 Years | 9 | 16.4% |
| 85 Years and Over | 1 | 1.8% |
| Total | 55 | 100.0% |
Housing Finances in Old Mill Creek
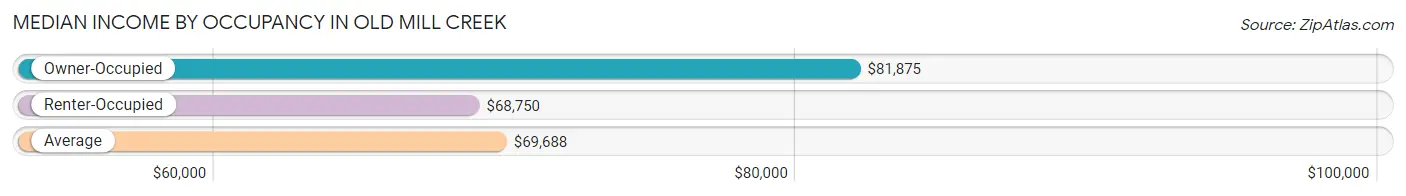
Median Income by Occupancy in Old Mill Creek
| Occupancy Type | # Households | Median Income |
| Owner-Occupied | 21 (38.2%) | $81,875 |
| Renter-Occupied | 34 (61.8%) | $68,750 |
| Average | 55 (100.0%) | $69,688 |
Occupancy by Householder Income Bracket in Old Mill Creek
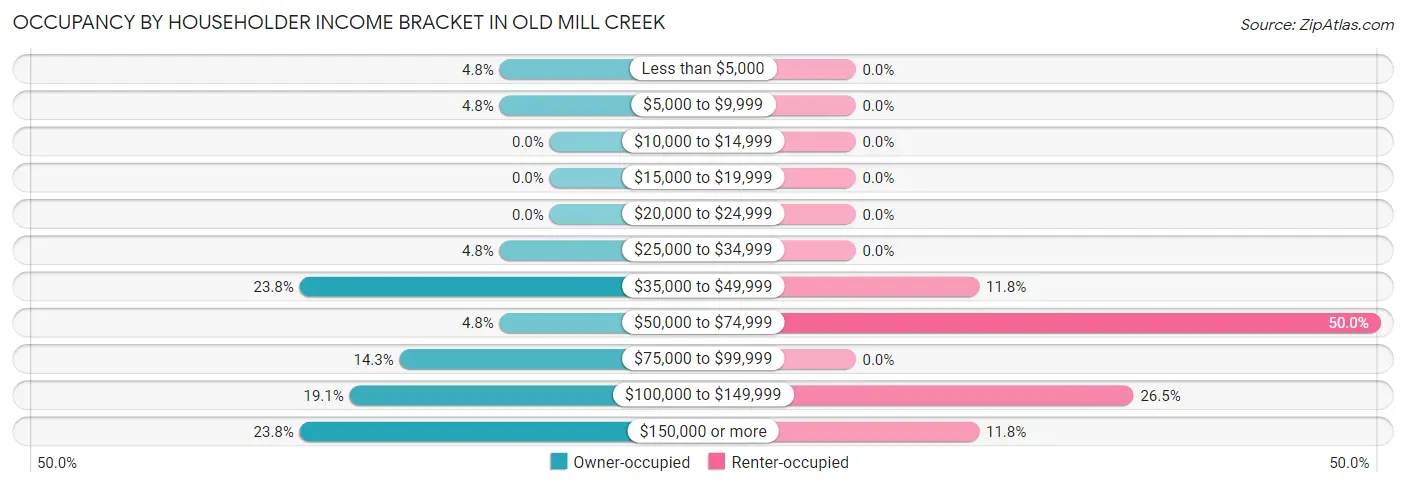
| Income Bracket | Owner-occupied | Renter-occupied |
| Less than $5,000 | 1 (4.8%) | 0 (0.0%) |
| $5,000 to $9,999 | 1 (4.8%) | 0 (0.0%) |
| $10,000 to $14,999 | 0 (0.0%) | 0 (0.0%) |
| $15,000 to $19,999 | 0 (0.0%) | 0 (0.0%) |
| $20,000 to $24,999 | 0 (0.0%) | 0 (0.0%) |
| $25,000 to $34,999 | 1 (4.8%) | 0 (0.0%) |
| $35,000 to $49,999 | 5 (23.8%) | 4 (11.8%) |
| $50,000 to $74,999 | 1 (4.8%) | 17 (50.0%) |
| $75,000 to $99,999 | 3 (14.3%) | 0 (0.0%) |
| $100,000 to $149,999 | 4 (19.1%) | 9 (26.5%) |
| $150,000 or more | 5 (23.8%) | 4 (11.8%) |
| Total | 21 (100.0%) | 34 (100.0%) |
Monthly Housing Cost Tiers in Old Mill Creek
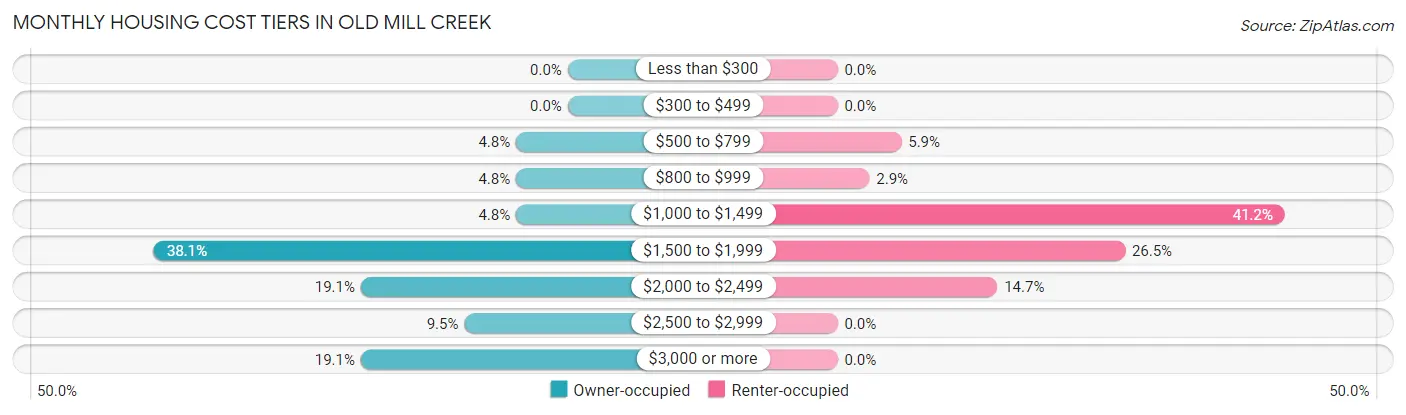
| Monthly Cost | Owner-occupied | Renter-occupied |
| Less than $300 | 0 (0.0%) | 0 (0.0%) |
| $300 to $499 | 0 (0.0%) | 0 (0.0%) |
| $500 to $799 | 1 (4.8%) | 2 (5.9%) |
| $800 to $999 | 1 (4.8%) | 1 (2.9%) |
| $1,000 to $1,499 | 1 (4.8%) | 14 (41.2%) |
| $1,500 to $1,999 | 8 (38.1%) | 9 (26.5%) |
| $2,000 to $2,499 | 4 (19.1%) | 5 (14.7%) |
| $2,500 to $2,999 | 2 (9.5%) | 0 (0.0%) |
| $3,000 or more | 4 (19.1%) | 0 (0.0%) |
| Total | 21 (100.0%) | 34 (100.0%) |
Physical Housing Characteristics in Old Mill Creek
Housing Structures in Old Mill Creek
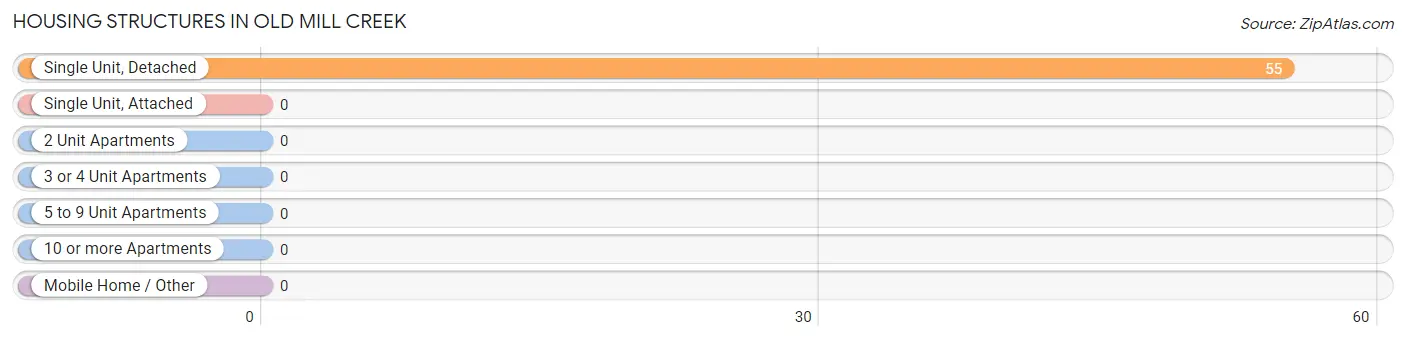
| Structure Type | # Housing Units | % Housing Units |
| Single Unit, Detached | 55 | 100.0% |
| Single Unit, Attached | 0 | 0.0% |
| 2 Unit Apartments | 0 | 0.0% |
| 3 or 4 Unit Apartments | 0 | 0.0% |
| 5 to 9 Unit Apartments | 0 | 0.0% |
| 10 or more Apartments | 0 | 0.0% |
| Mobile Home / Other | 0 | 0.0% |
| Total | 55 | 100.0% |
Housing Structures by Occupancy in Old Mill Creek
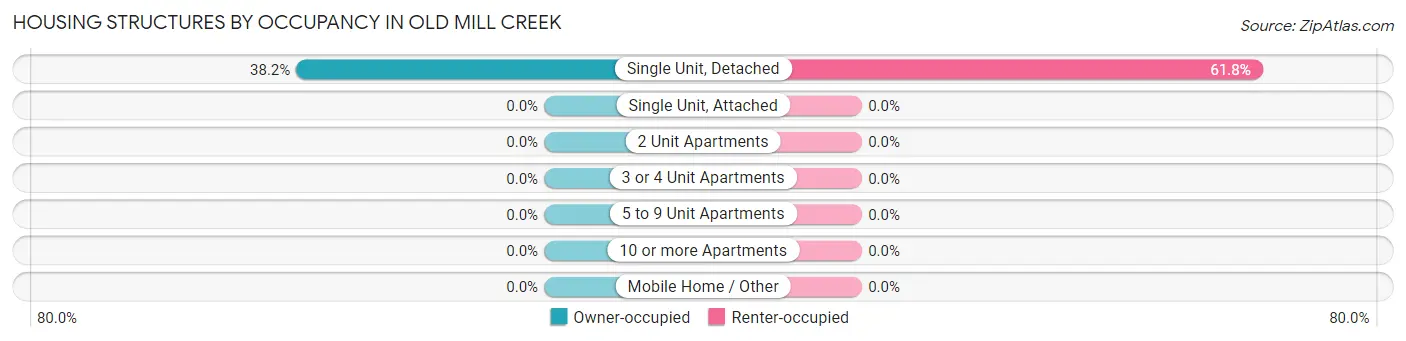
| Structure Type | Owner-occupied | Renter-occupied |
| Single Unit, Detached | 21 (38.2%) | 34 (61.8%) |
| Single Unit, Attached | 0 (0.0%) | 0 (0.0%) |
| 2 Unit Apartments | 0 (0.0%) | 0 (0.0%) |
| 3 or 4 Unit Apartments | 0 (0.0%) | 0 (0.0%) |
| 5 to 9 Unit Apartments | 0 (0.0%) | 0 (0.0%) |
| 10 or more Apartments | 0 (0.0%) | 0 (0.0%) |
| Mobile Home / Other | 0 (0.0%) | 0 (0.0%) |
| Total | 21 (38.2%) | 34 (61.8%) |
Housing Structures by Number of Rooms in Old Mill Creek
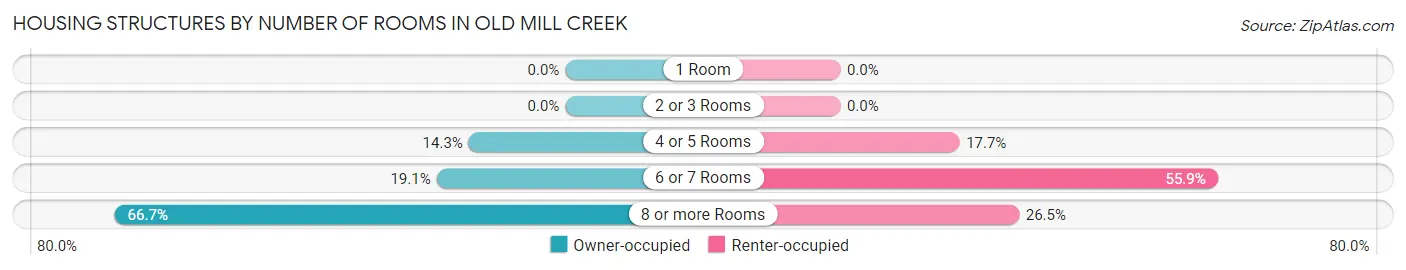
| Number of Rooms | Owner-occupied | Renter-occupied |
| 1 Room | 0 (0.0%) | 0 (0.0%) |
| 2 or 3 Rooms | 0 (0.0%) | 0 (0.0%) |
| 4 or 5 Rooms | 3 (14.3%) | 6 (17.6%) |
| 6 or 7 Rooms | 4 (19.1%) | 19 (55.9%) |
| 8 or more Rooms | 14 (66.7%) | 9 (26.5%) |
| Total | 21 (100.0%) | 34 (100.0%) |
Housing Structure by Heating Type in Old Mill Creek
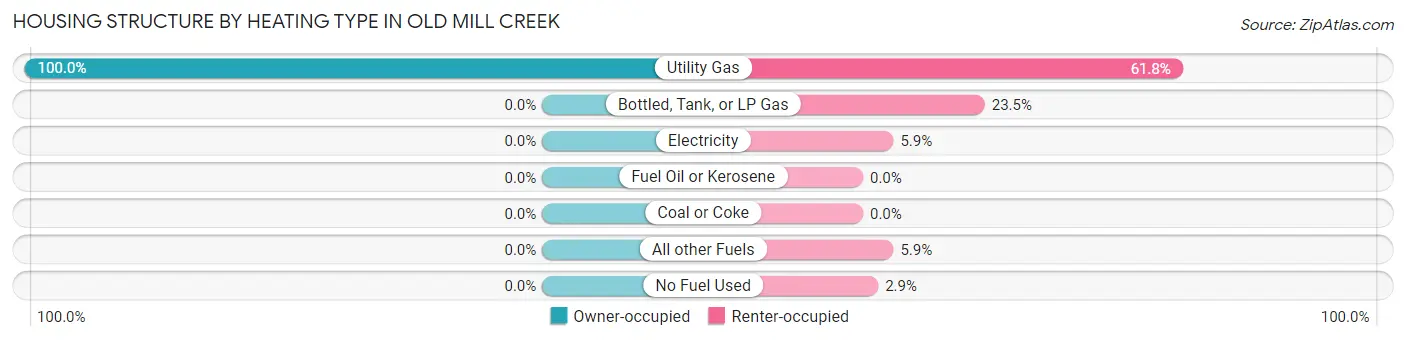
| Heating Type | Owner-occupied | Renter-occupied |
| Utility Gas | 21 (100.0%) | 21 (61.8%) |
| Bottled, Tank, or LP Gas | 0 (0.0%) | 8 (23.5%) |
| Electricity | 0 (0.0%) | 2 (5.9%) |
| Fuel Oil or Kerosene | 0 (0.0%) | 0 (0.0%) |
| Coal or Coke | 0 (0.0%) | 0 (0.0%) |
| All other Fuels | 0 (0.0%) | 2 (5.9%) |
| No Fuel Used | 0 (0.0%) | 1 (2.9%) |
| Total | 21 (100.0%) | 34 (100.0%) |
Household Vehicle Usage in Old Mill Creek
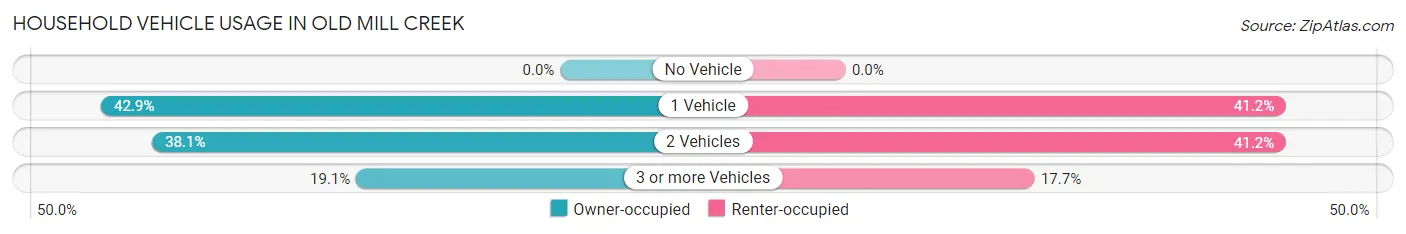
| Vehicles per Household | Owner-occupied | Renter-occupied |
| No Vehicle | 0 (0.0%) | 0 (0.0%) |
| 1 Vehicle | 9 (42.9%) | 14 (41.2%) |
| 2 Vehicles | 8 (38.1%) | 14 (41.2%) |
| 3 or more Vehicles | 4 (19.1%) | 6 (17.6%) |
| Total | 21 (100.0%) | 34 (100.0%) |
Real Estate & Mortgages in Old Mill Creek
Real Estate and Mortgage Overview in Old Mill Creek
| Characteristic | Without Mortgage | With Mortgage |
| Housing Units | 7 | 14 |
| Median Property Value | $781,300 | $340,000 |
| Median Household Income | - | - |
| Monthly Housing Costs | $1,501 | $4 |
| Real Estate Taxes | $10,001 | $0 |
Property Value by Mortgage Status in Old Mill Creek
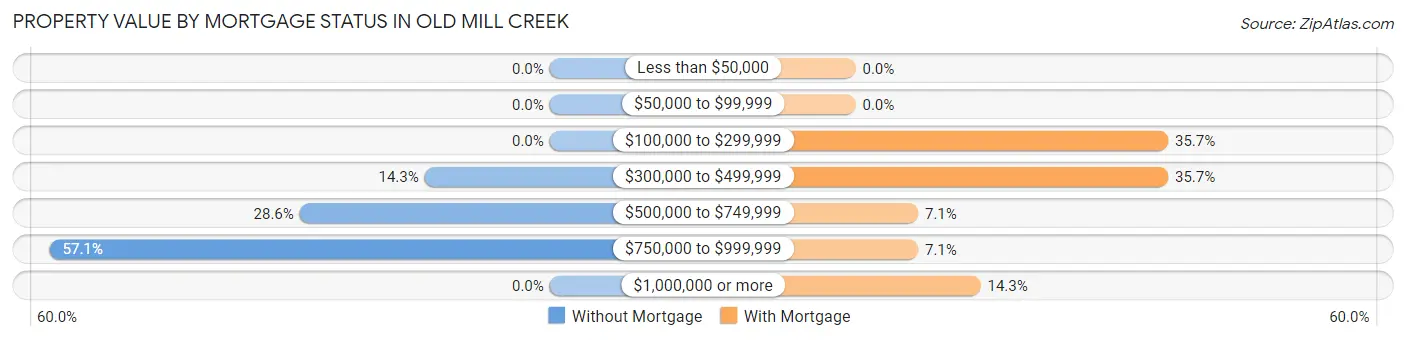
| Property Value | Without Mortgage | With Mortgage |
| Less than $50,000 | 0 (0.0%) | 0 (0.0%) |
| $50,000 to $99,999 | 0 (0.0%) | 0 (0.0%) |
| $100,000 to $299,999 | 0 (0.0%) | 5 (35.7%) |
| $300,000 to $499,999 | 1 (14.3%) | 5 (35.7%) |
| $500,000 to $749,999 | 2 (28.6%) | 1 (7.1%) |
| $750,000 to $999,999 | 4 (57.1%) | 1 (7.1%) |
| $1,000,000 or more | 0 (0.0%) | 2 (14.3%) |
| Total | 7 (100.0%) | 14 (100.0%) |
Household Income by Mortgage Status in Old Mill Creek
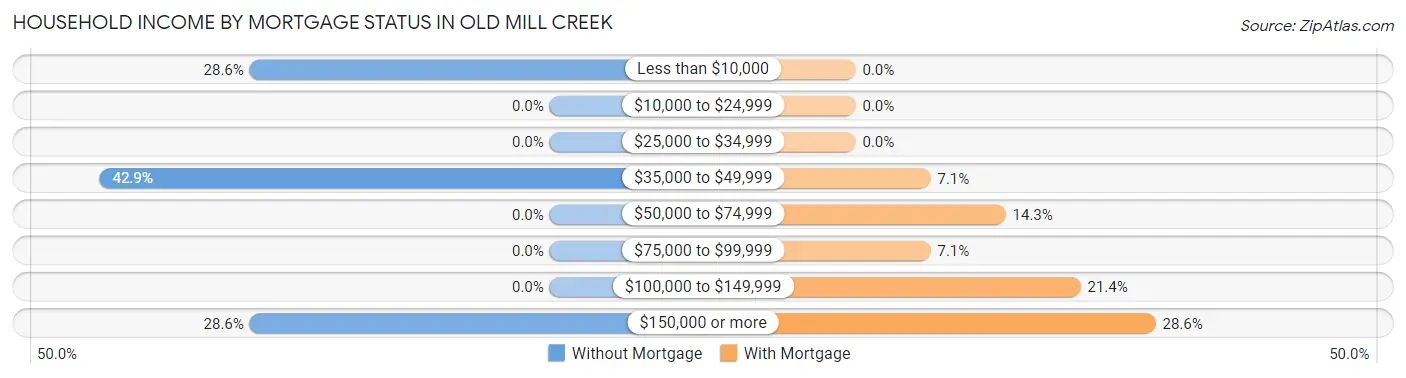
| Household Income | Without Mortgage | With Mortgage |
| Less than $10,000 | 2 (28.6%) | 0 (0.0%) |
| $10,000 to $24,999 | 0 (0.0%) | 0 (0.0%) |
| $25,000 to $34,999 | 0 (0.0%) | 0 (0.0%) |
| $35,000 to $49,999 | 3 (42.9%) | 1 (7.1%) |
| $50,000 to $74,999 | 0 (0.0%) | 2 (14.3%) |
| $75,000 to $99,999 | 0 (0.0%) | 1 (7.1%) |
| $100,000 to $149,999 | 0 (0.0%) | 3 (21.4%) |
| $150,000 or more | 2 (28.6%) | 4 (28.6%) |
| Total | 7 (100.0%) | 14 (100.0%) |
Property Value to Household Income Ratio in Old Mill Creek
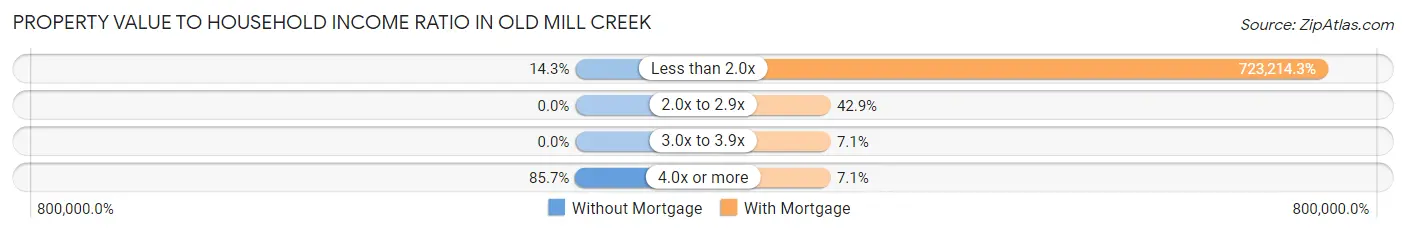
| Value-to-Income Ratio | Without Mortgage | With Mortgage |
| Less than 2.0x | 1 (14.3%) | 101,250 (723,214.3%) |
| 2.0x to 2.9x | 0 (0.0%) | 6 (42.9%) |
| 3.0x to 3.9x | 0 (0.0%) | 1 (7.1%) |
| 4.0x or more | 6 (85.7%) | 1 (7.1%) |
| Total | 7 (100.0%) | 14 (100.0%) |
Real Estate Taxes by Mortgage Status in Old Mill Creek

| Property Taxes | Without Mortgage | With Mortgage |
| Less than $800 | 0 (0.0%) | 0 (0.0%) |
| $800 to $1,499 | 0 (0.0%) | 0 (0.0%) |
| $800 to $1,499 | 7 (100.0%) | 0 (0.0%) |
| Total | 7 (100.0%) | 14 (100.0%) |
Health & Disability in Old Mill Creek
Health Insurance Coverage by Age in Old Mill Creek
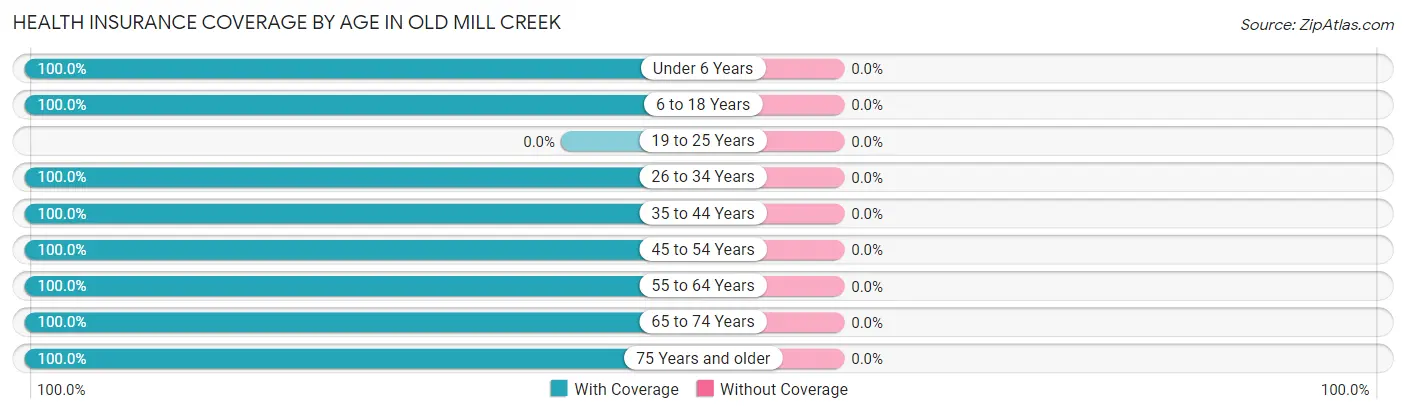
| Age Bracket | With Coverage | Without Coverage |
| Under 6 Years | 14 (100.0%) | 0 (0.0%) |
| 6 to 18 Years | 15 (100.0%) | 0 (0.0%) |
| 19 to 25 Years | 0 (0.0%) | 0 (0.0%) |
| 26 to 34 Years | 11 (100.0%) | 0 (0.0%) |
| 35 to 44 Years | 15 (100.0%) | 0 (0.0%) |
| 45 to 54 Years | 12 (100.0%) | 0 (0.0%) |
| 55 to 64 Years | 11 (100.0%) | 0 (0.0%) |
| 65 to 74 Years | 24 (100.0%) | 0 (0.0%) |
| 75 Years and older | 18 (100.0%) | 0 (0.0%) |
| Total | 120 (100.0%) | 0 (0.0%) |
Health Insurance Coverage by Citizenship Status in Old Mill Creek

| Citizenship Status | With Coverage | Without Coverage |
| Native Born | 14 (100.0%) | 0 (0.0%) |
| Foreign Born, Citizen | 15 (100.0%) | 0 (0.0%) |
| Foreign Born, not a Citizen | 0 (0.0%) | 0 (0.0%) |
Health Insurance Coverage by Household Income in Old Mill Creek
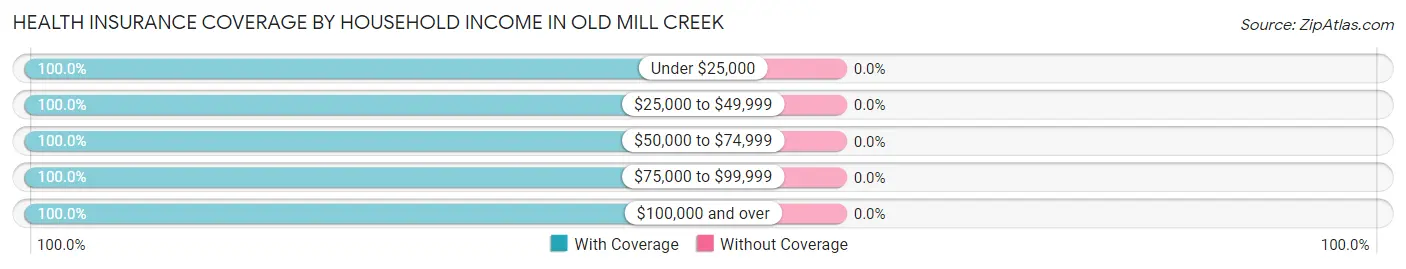
| Household Income | With Coverage | Without Coverage |
| Under $25,000 | 2 (100.0%) | 0 (0.0%) |
| $25,000 to $49,999 | 14 (100.0%) | 0 (0.0%) |
| $50,000 to $74,999 | 52 (100.0%) | 0 (0.0%) |
| $75,000 to $99,999 | 6 (100.0%) | 0 (0.0%) |
| $100,000 and over | 46 (100.0%) | 0 (0.0%) |
Public vs Private Health Insurance Coverage by Age in Old Mill Creek
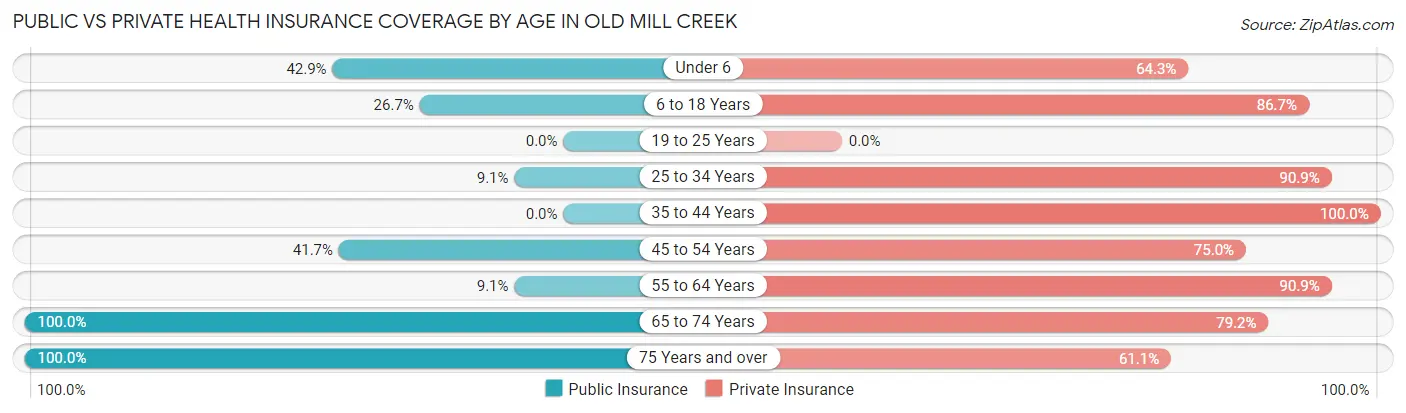
| Age Bracket | Public Insurance | Private Insurance |
| Under 6 | 6 (42.9%) | 9 (64.3%) |
| 6 to 18 Years | 4 (26.7%) | 13 (86.7%) |
| 19 to 25 Years | 0 (0.0%) | 0 (0.0%) |
| 25 to 34 Years | 1 (9.1%) | 10 (90.9%) |
| 35 to 44 Years | 0 (0.0%) | 15 (100.0%) |
| 45 to 54 Years | 5 (41.7%) | 9 (75.0%) |
| 55 to 64 Years | 1 (9.1%) | 10 (90.9%) |
| 65 to 74 Years | 24 (100.0%) | 19 (79.2%) |
| 75 Years and over | 18 (100.0%) | 11 (61.1%) |
| Total | 59 (49.2%) | 96 (80.0%) |
Disability Status by Sex by Age in Old Mill Creek
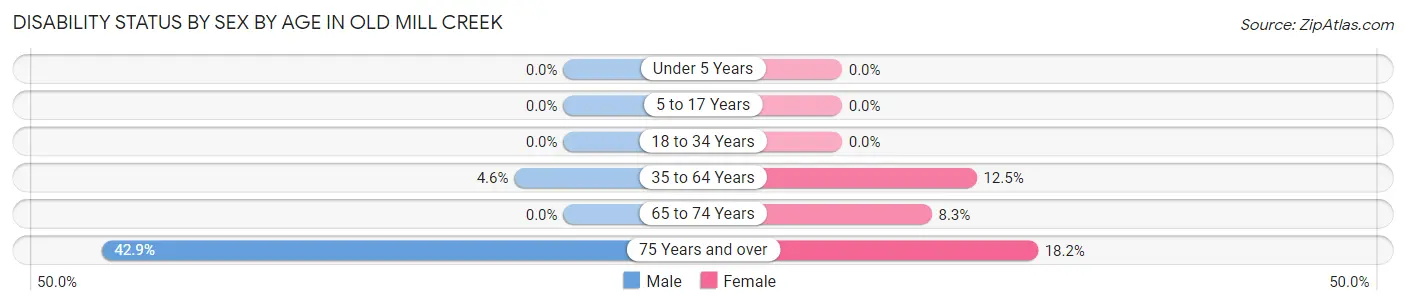
| Age Bracket | Male | Female |
| Under 5 Years | 0 (0.0%) | 0 (0.0%) |
| 5 to 17 Years | 0 (0.0%) | 0 (0.0%) |
| 18 to 34 Years | 0 (0.0%) | 0 (0.0%) |
| 35 to 64 Years | 1 (4.5%) | 2 (12.5%) |
| 65 to 74 Years | 0 (0.0%) | 1 (8.3%) |
| 75 Years and over | 3 (42.9%) | 2 (18.2%) |
Disability Class by Sex by Age in Old Mill Creek
Disability Class: Hearing Difficulty
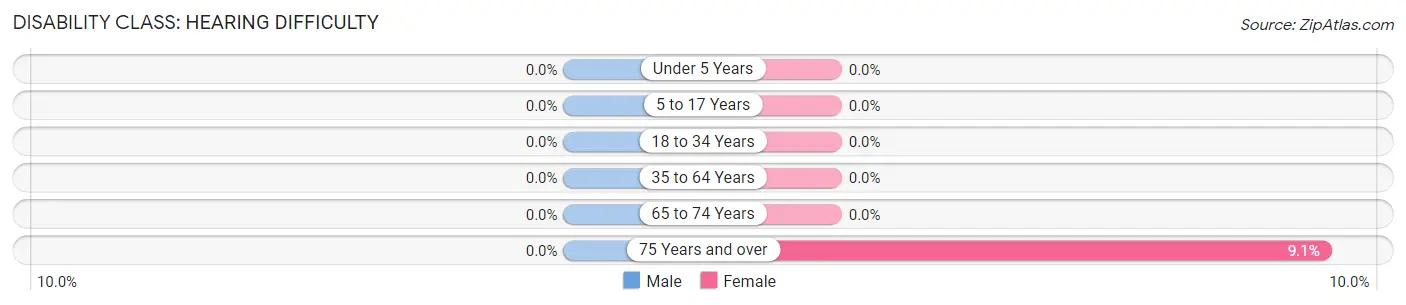
| Age Bracket | Male | Female |
| Under 5 Years | 0 (0.0%) | 0 (0.0%) |
| 5 to 17 Years | 0 (0.0%) | 0 (0.0%) |
| 18 to 34 Years | 0 (0.0%) | 0 (0.0%) |
| 35 to 64 Years | 0 (0.0%) | 0 (0.0%) |
| 65 to 74 Years | 0 (0.0%) | 0 (0.0%) |
| 75 Years and over | 0 (0.0%) | 1 (9.1%) |
Disability Class: Vision Difficulty
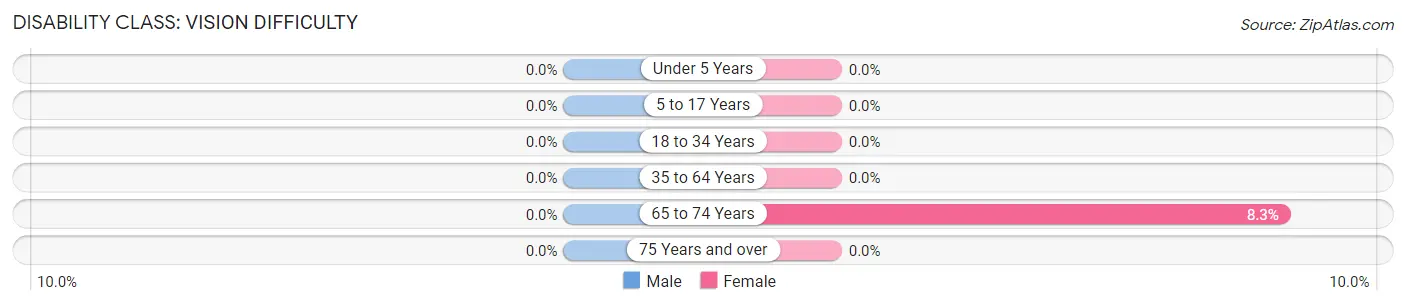
| Age Bracket | Male | Female |
| Under 5 Years | 0 (0.0%) | 0 (0.0%) |
| 5 to 17 Years | 0 (0.0%) | 0 (0.0%) |
| 18 to 34 Years | 0 (0.0%) | 0 (0.0%) |
| 35 to 64 Years | 0 (0.0%) | 0 (0.0%) |
| 65 to 74 Years | 0 (0.0%) | 1 (8.3%) |
| 75 Years and over | 0 (0.0%) | 0 (0.0%) |
Disability Class: Cognitive Difficulty
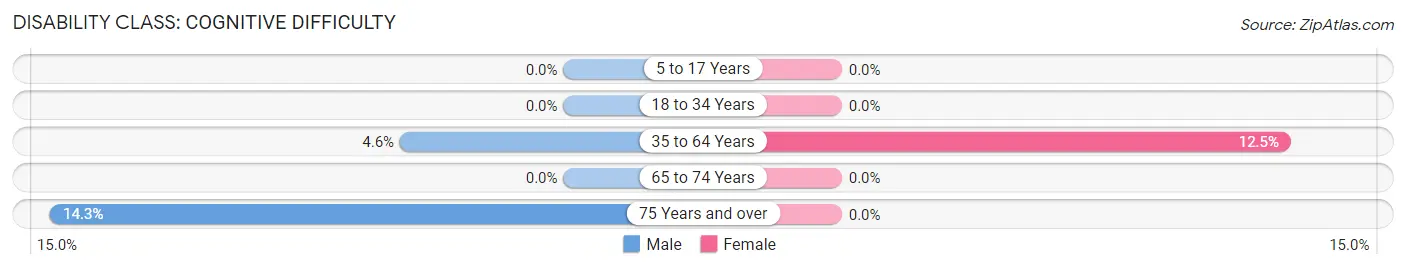
| Age Bracket | Male | Female |
| 5 to 17 Years | 0 (0.0%) | 0 (0.0%) |
| 18 to 34 Years | 0 (0.0%) | 0 (0.0%) |
| 35 to 64 Years | 1 (4.5%) | 2 (12.5%) |
| 65 to 74 Years | 0 (0.0%) | 0 (0.0%) |
| 75 Years and over | 1 (14.3%) | 0 (0.0%) |
Disability Class: Ambulatory Difficulty
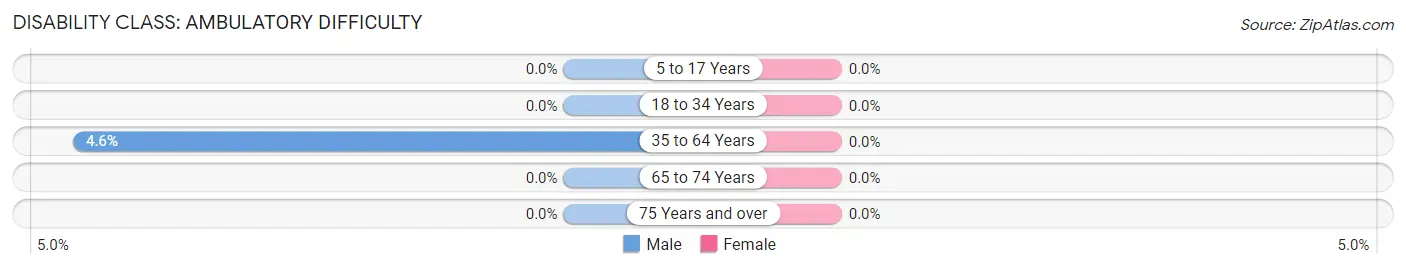
| Age Bracket | Male | Female |
| 5 to 17 Years | 0 (0.0%) | 0 (0.0%) |
| 18 to 34 Years | 0 (0.0%) | 0 (0.0%) |
| 35 to 64 Years | 1 (4.5%) | 0 (0.0%) |
| 65 to 74 Years | 0 (0.0%) | 0 (0.0%) |
| 75 Years and over | 0 (0.0%) | 0 (0.0%) |
Disability Class: Self-Care Difficulty
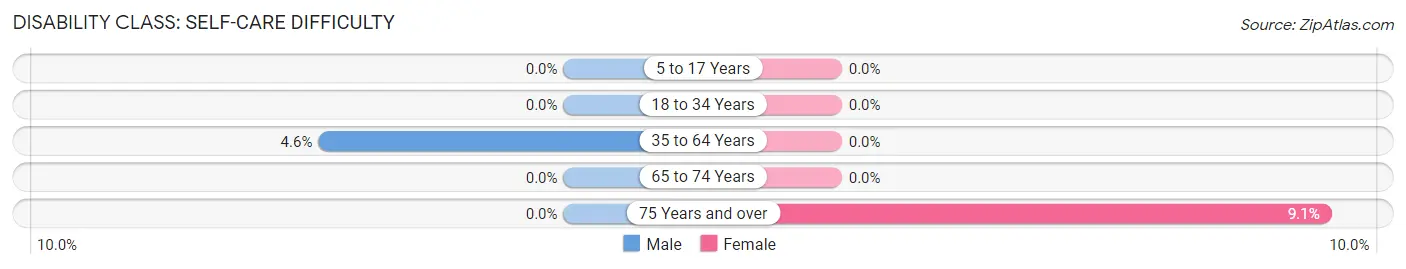
| Age Bracket | Male | Female |
| 5 to 17 Years | 0 (0.0%) | 0 (0.0%) |
| 18 to 34 Years | 0 (0.0%) | 0 (0.0%) |
| 35 to 64 Years | 1 (4.5%) | 0 (0.0%) |
| 65 to 74 Years | 0 (0.0%) | 0 (0.0%) |
| 75 Years and over | 0 (0.0%) | 1 (9.1%) |
Technology Access in Old Mill Creek
Computing Device Access in Old Mill Creek
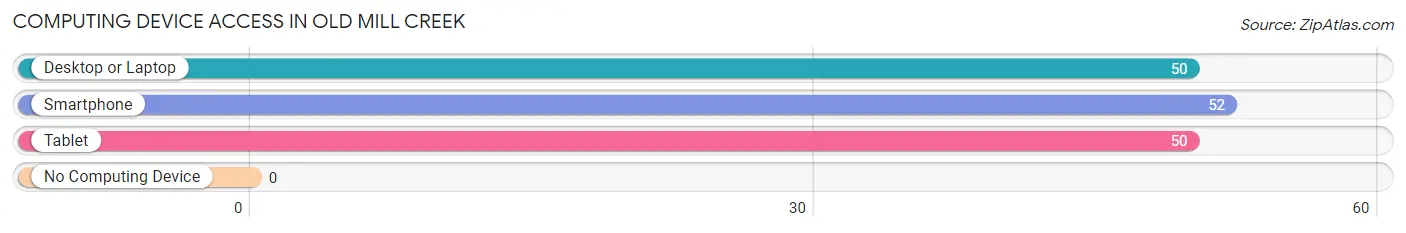
| Device Type | # Households | % Households |
| Desktop or Laptop | 50 | 90.9% |
| Smartphone | 52 | 94.6% |
| Tablet | 50 | 90.9% |
| No Computing Device | 0 | 0.0% |
| Total | 55 | 100.0% |
Internet Access in Old Mill Creek
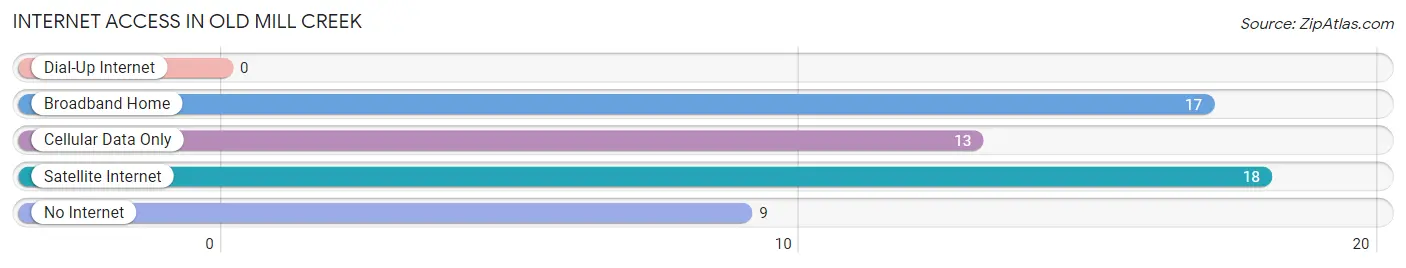
| Internet Type | # Households | % Households |
| Dial-Up Internet | 0 | 0.0% |
| Broadband Home | 17 | 30.9% |
| Cellular Data Only | 13 | 23.6% |
| Satellite Internet | 18 | 32.7% |
| No Internet | 9 | 16.4% |
| Total | 55 | 100.0% |
Old Mill Creek Summary
Mill Creek, Illinois is a small village located in Lake County, Illinois. It is situated on the banks of the Mill Creek, a tributary of the Des Plaines River. The village is located approximately 40 miles north of Chicago and is part of the Chicago metropolitan area. The population of Mill Creek was 1,845 at the 2010 census.
History
Mill Creek was first settled in the early 1800s by a group of settlers from New England. The settlers were attracted to the area due to its abundance of natural resources, including timber, fish, and game. The settlers built a sawmill on the banks of the Mill Creek, which gave the village its name. The sawmill was used to produce lumber for the construction of homes and other buildings in the area.
In 1836, the village was officially incorporated as the Village of Mill Creek. The village was a popular destination for tourists and vacationers due to its proximity to Chicago and its natural beauty. The village was also home to a number of businesses, including a general store, a blacksmith shop, and a hotel.
In the late 1800s, the village began to experience a period of growth and development. The village was connected to the Chicago and North Western Railway in 1887, which allowed for increased trade and commerce. The village also experienced a population boom, with the population increasing from 1,000 in 1890 to 1,500 in 1900.
In the early 1900s, the village continued to experience growth and development. The village was connected to the Chicago, Milwaukee, and St. Paul Railroad in 1906, which further increased trade and commerce. The village also experienced a population boom, with the population increasing from 1,500 in 1900 to 2,000 in 1910.
In the mid-1900s, the village experienced a period of decline. The population decreased from 2,000 in 1910 to 1,500 in 1950. The decline was due to the decline of the railroad industry and the rise of the automobile industry.
Geography
Mill Creek is located in Lake County, Illinois. It is situated on the banks of the Mill Creek, a tributary of the Des Plaines River. The village is located approximately 40 miles north of Chicago and is part of the Chicago metropolitan area. The village is bordered by the villages of Libertyville to the north, Grayslake to the east, and Gurnee to the south.
The village has a total area of 1.2 square miles, all of which is land. The village is located in a flat, low-lying area. The terrain is mostly flat, with some rolling hills. The village is located in a temperate climate, with hot summers and cold winters.
Economy
The economy of Mill Creek is largely based on tourism and retail. The village is home to a number of small businesses, including restaurants, shops, and other retail establishments. The village is also home to a number of small manufacturing companies.
The village is also home to a number of large employers, including the Lake County Forest Preserve District, the Lake County Health Department, and the Lake County Sheriff's Office. The village is also home to a number of educational institutions, including the College of Lake County and the University of Illinois at Chicago.
Demographics
As of the 2010 census, the population of Mill Creek was 1,845. The population is largely white (94.2%), with small percentages of African American (2.2%), Asian (1.2%), and Hispanic (1.4%) residents. The median household income is $63,750, and the median home value is $220,000.
The village is served by the Mill Creek School District, which includes two elementary schools, one middle school, and one high school. The village is also home to a number of churches, including the Mill Creek United Methodist Church and the Mill Creek Baptist Church.
Conclusion
Mill Creek, Illinois is a small village located in Lake County, Illinois. It is situated on the banks of the Mill Creek, a tributary of the Des Plaines River. The village is located approximately 40 miles north of Chicago and is part of the Chicago metropolitan area. The population of Mill Creek was 1,845 at the 2010 census. The village has a largely white population, with small percentages of African American, Asian, and Hispanic residents. The economy of Mill Creek is largely based on tourism and retail, and the village is home to a number of small businesses, large employers, and educational institutions.
Common Questions
What is Per Capita Income in Old Mill Creek?
Per Capita income in Old Mill Creek is $59,462.
What is the Median Family Income in Old Mill Creek?
Median Family Income in Old Mill Creek is $108,750.
What is the Median Household income in Old Mill Creek?
Median Household Income in Old Mill Creek is $69,688.
What is Income or Wage Gap in Old Mill Creek?
Income or Wage Gap in Old Mill Creek is 29.6%.
Women in Old Mill Creek earn 70.4 cents for every dollar earned by a man.
What is Inequality or Gini Index in Old Mill Creek?
Inequality or Gini Index in Old Mill Creek is 0.51.
What is the Total Population of Old Mill Creek?
Total Population of Old Mill Creek is 122.
What is the Total Male Population of Old Mill Creek?
Total Male Population of Old Mill Creek is 66.
What is the Total Female Population of Old Mill Creek?
Total Female Population of Old Mill Creek is 56.
What is the Ratio of Males per 100 Females in Old Mill Creek?
There are 117.86 Males per 100 Females in Old Mill Creek.
What is the Ratio of Females per 100 Males in Old Mill Creek?
There are 84.85 Females per 100 Males in Old Mill Creek.
What is the Median Population Age in Old Mill Creek?
Median Population Age in Old Mill Creek is 49.5 Years.
What is the Average Family Size in Old Mill Creek
Average Family Size in Old Mill Creek is 2.9 People.
What is the Average Household Size in Old Mill Creek
Average Household Size in Old Mill Creek is 2.2 People.
How Large is the Labor Force in Old Mill Creek?
There are 57 People in the Labor Forcein in Old Mill Creek.
What is the Percentage of People in the Labor Force in Old Mill Creek?
59.4% of People are in the Labor Force in Old Mill Creek.
What is the Unemployment Rate in Old Mill Creek?
Unemployment Rate in Old Mill Creek is 3.6%.