Rosemont, IL Map & Demographics
Rosemont Map
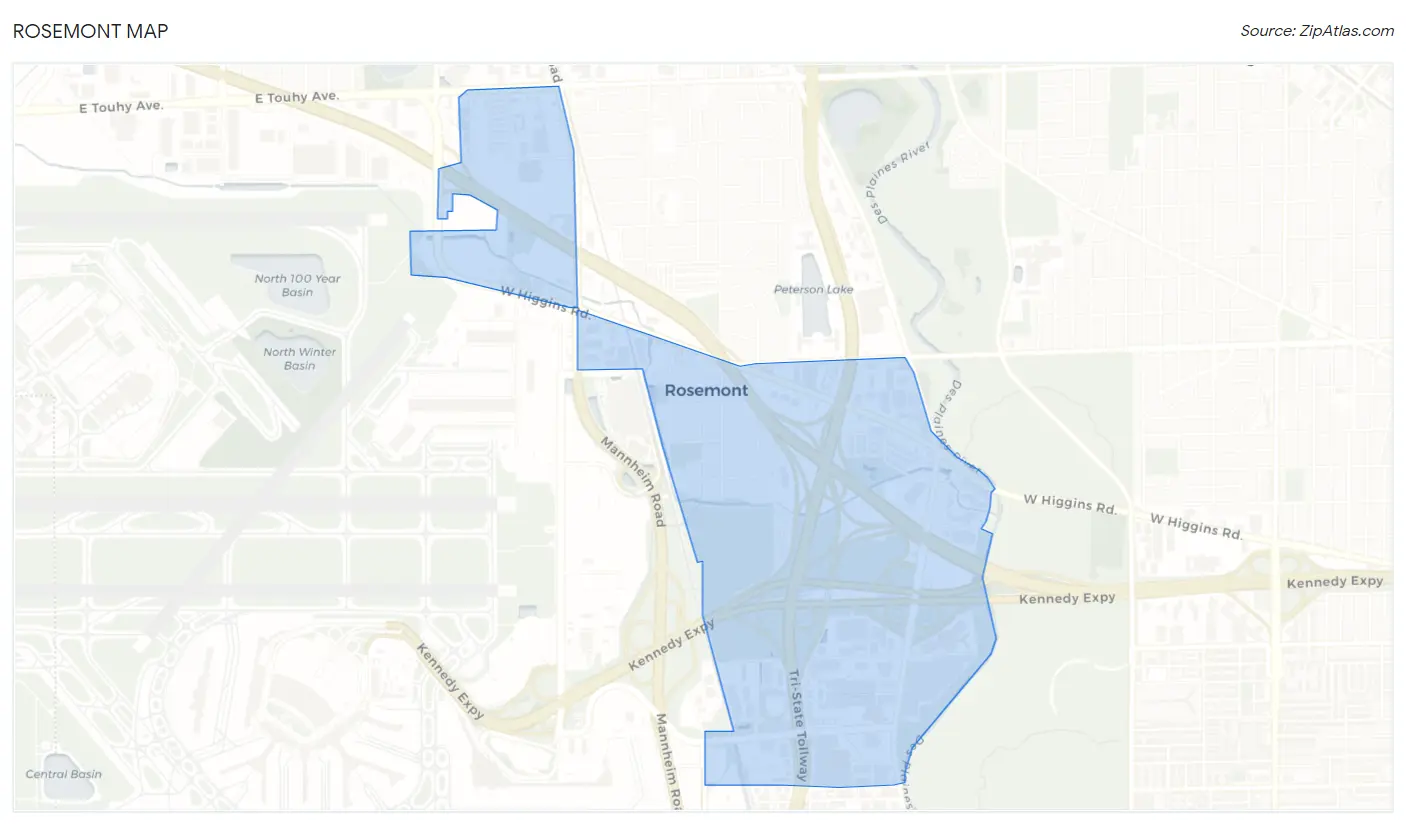
Rosemont Overview
$36,230
PER CAPITA INCOME
$86,291
AVG FAMILY INCOME
$70,455
AVG HOUSEHOLD INCOME
30.9%
WAGE / INCOME GAP [ % ]
69.1¢/ $1
WAGE / INCOME GAP [ $ ]
0.41
INEQUALITY / GINI INDEX
3,864
TOTAL POPULATION
2,065
MALE POPULATION
1,799
FEMALE POPULATION
114.79
MALES / 100 FEMALES
87.12
FEMALES / 100 MALES
42.5
MEDIAN AGE
3.1
AVG FAMILY SIZE
2.4
AVG HOUSEHOLD SIZE
2,232
LABOR FORCE [ PEOPLE ]
68.2%
PERCENT IN LABOR FORCE
4.3%
UNEMPLOYMENT RATE
Income in Rosemont
Income Overview in Rosemont
Per Capita Income in Rosemont is $36,230, while median incomes of families and households are $86,291 and $70,455 respectively.
| Characteristic | Number | Measure |
| Per Capita Income | 3,864 | $36,230 |
| Median Family Income | 973 | $86,291 |
| Mean Family Income | 973 | $101,907 |
| Median Household Income | 1,582 | $70,455 |
| Mean Household Income | 1,582 | $87,525 |
| Income Deficit | 973 | $0 |
| Wage / Income Gap (%) | 3,864 | 30.94% |
| Wage / Income Gap ($) | 3,864 | 69.06¢ per $1 |
| Gini / Inequality Index | 3,864 | 0.41 |
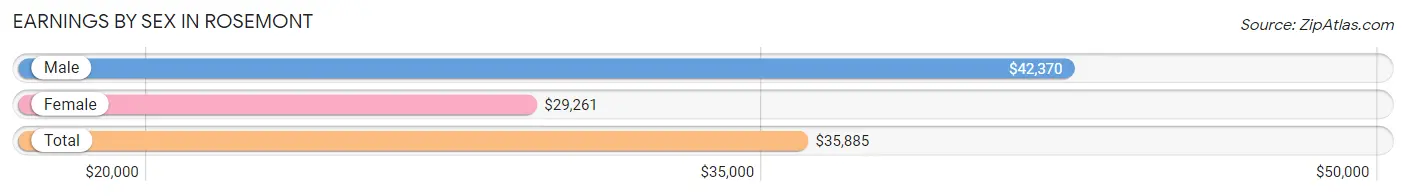
Earnings by Sex in Rosemont
Average Earnings in Rosemont are $35,885, $42,370 for men and $29,261 for women, a difference of 30.9%.
| Sex | Number | Average Earnings |
| Male | 1,361 (57.9%) | $42,370 |
| Female | 988 (42.1%) | $29,261 |
| Total | 2,349 (100.0%) | $35,885 |
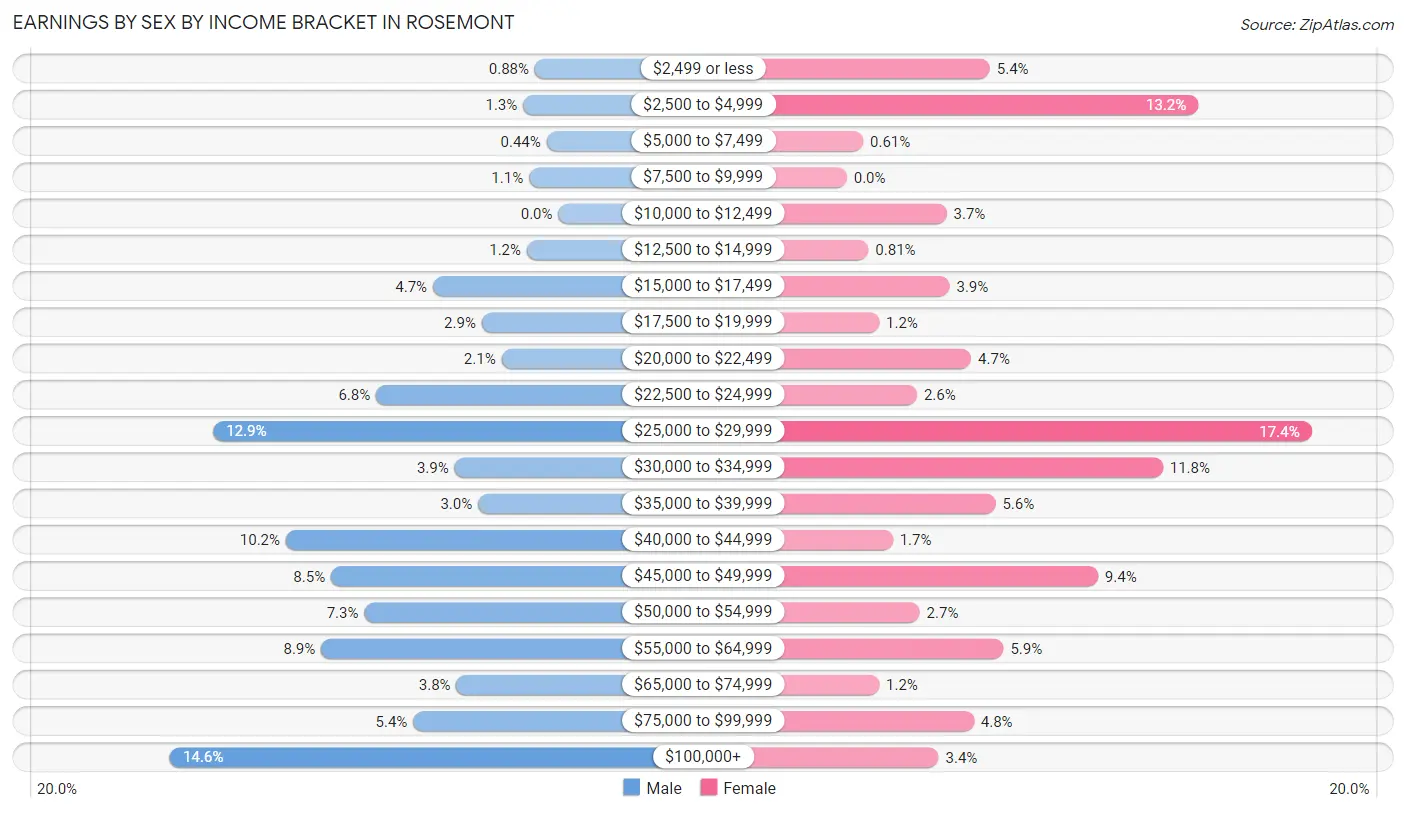
Earnings by Sex by Income Bracket in Rosemont
The most common earnings brackets in Rosemont are $100,000+ for men (198 | 14.5%) and $25,000 to $29,999 for women (172 | 17.4%).
| Income | Male | Female |
| $2,499 or less | 12 (0.9%) | 53 (5.4%) |
| $2,500 to $4,999 | 18 (1.3%) | 130 (13.2%) |
| $5,000 to $7,499 | 6 (0.4%) | 6 (0.6%) |
| $7,500 to $9,999 | 15 (1.1%) | 0 (0.0%) |
| $10,000 to $12,499 | 0 (0.0%) | 37 (3.7%) |
| $12,500 to $14,999 | 16 (1.2%) | 8 (0.8%) |
| $15,000 to $17,499 | 64 (4.7%) | 38 (3.8%) |
| $17,500 to $19,999 | 39 (2.9%) | 12 (1.2%) |
| $20,000 to $22,499 | 29 (2.1%) | 46 (4.7%) |
| $22,500 to $24,999 | 93 (6.8%) | 26 (2.6%) |
| $25,000 to $29,999 | 176 (12.9%) | 172 (17.4%) |
| $30,000 to $34,999 | 53 (3.9%) | 117 (11.8%) |
| $35,000 to $39,999 | 41 (3.0%) | 55 (5.6%) |
| $40,000 to $44,999 | 139 (10.2%) | 17 (1.7%) |
| $45,000 to $49,999 | 116 (8.5%) | 93 (9.4%) |
| $50,000 to $54,999 | 99 (7.3%) | 27 (2.7%) |
| $55,000 to $64,999 | 121 (8.9%) | 58 (5.9%) |
| $65,000 to $74,999 | 52 (3.8%) | 12 (1.2%) |
| $75,000 to $99,999 | 74 (5.4%) | 47 (4.8%) |
| $100,000+ | 198 (14.5%) | 34 (3.4%) |
| Total | 1,361 (100.0%) | 988 (100.0%) |
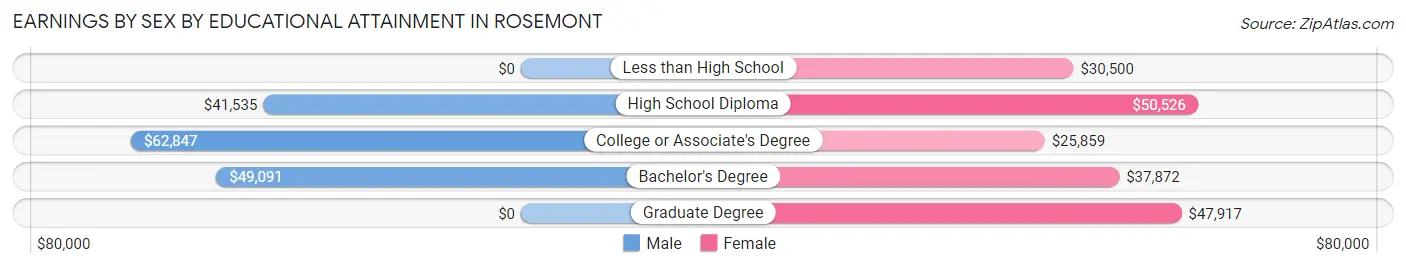
Earnings by Sex by Educational Attainment in Rosemont
Average earnings in Rosemont are $45,633 for men and $31,438 for women, a difference of 31.1%. Men with an educational attainment of college or associate's degree enjoy the highest average annual earnings of $62,847, while those with high school diploma education earn the least with $41,535. Women with an educational attainment of high school diploma earn the most with the average annual earnings of $50,526, while those with college or associate's degree education have the smallest earnings of $25,859.
| Educational Attainment | Male Income | Female Income |
| Less than High School | - | - |
| High School Diploma | $41,535 | $50,526 |
| College or Associate's Degree | $62,847 | $25,859 |
| Bachelor's Degree | $49,091 | $37,872 |
| Graduate Degree | - | - |
| Total | $45,633 | $31,438 |
Family Income in Rosemont
Family Income Brackets in Rosemont
According to the Rosemont family income data, there are 270 families falling into the $75,000 to $99,999 income range, which is the most common income bracket and makes up 27.8% of all families.
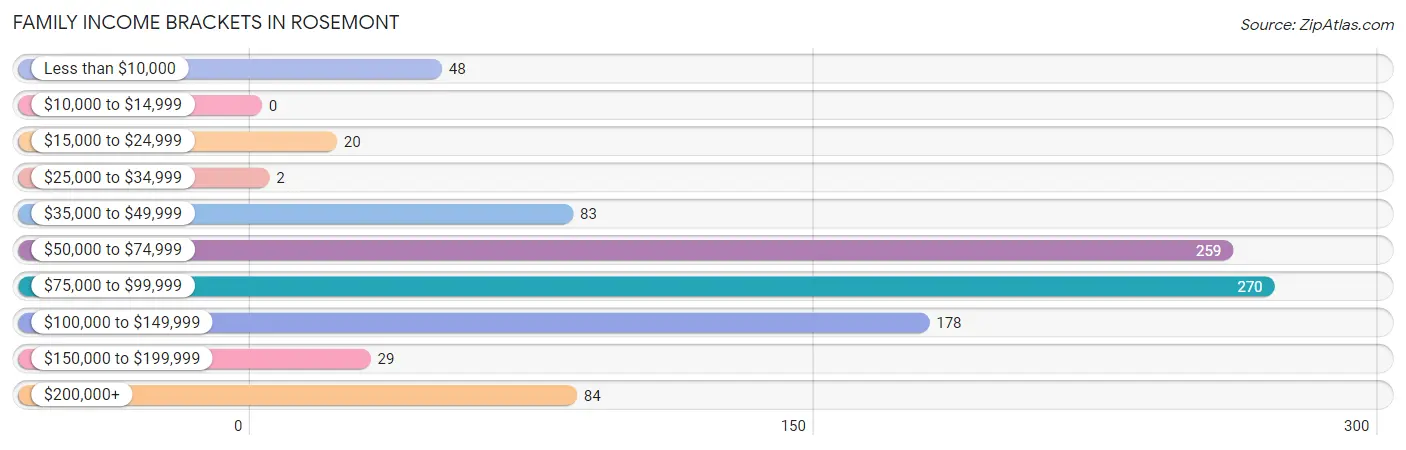
| Income Bracket | # Families | % Families |
| Less than $10,000 | 48 | 4.9% |
| $10,000 to $14,999 | 0 | 0.0% |
| $15,000 to $24,999 | 20 | 2.1% |
| $25,000 to $34,999 | 2 | 0.2% |
| $35,000 to $49,999 | 83 | 8.5% |
| $50,000 to $74,999 | 259 | 26.6% |
| $75,000 to $99,999 | 270 | 27.7% |
| $100,000 to $149,999 | 178 | 18.3% |
| $150,000 to $199,999 | 29 | 3.0% |
| $200,000+ | 84 | 8.6% |
Family Income by Famaliy Size in Rosemont
5-person families (41 | 4.2%) account for the highest median family income in Rosemont with $202,344 per family, while 5-person families (41 | 4.2%) have the highest median income of $40,469 per family member.
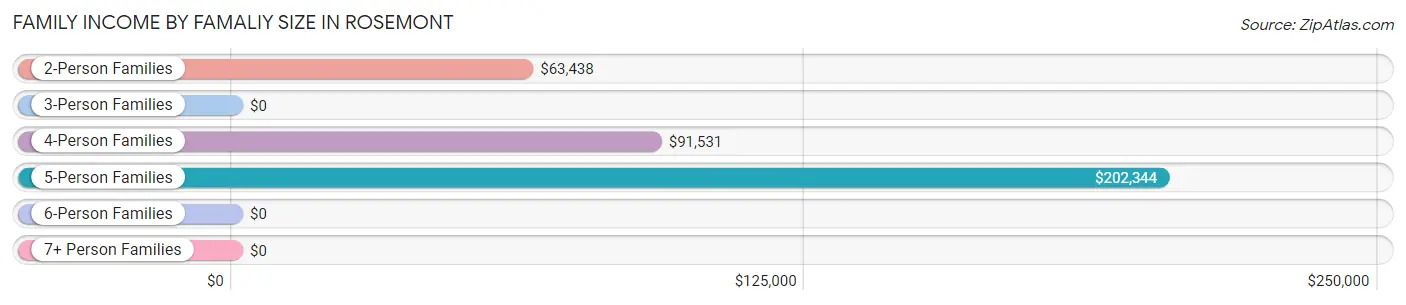
| Income Bracket | # Families | Median Income |
| 2-Person Families | 421 (43.3%) | $63,438 |
| 3-Person Families | 157 (16.1%) | $0 |
| 4-Person Families | 354 (36.4%) | $91,531 |
| 5-Person Families | 41 (4.2%) | $202,344 |
| 6-Person Families | 0 (0.0%) | $0 |
| 7+ Person Families | 0 (0.0%) | $0 |
| Total | 973 (100.0%) | $86,291 |
Family Income by Number of Earners in Rosemont
The median family income in Rosemont is $86,291, with families comprising 3+ earners (193) having the highest median family income of $97,917, while families with no earners (133) have the lowest median family income of $55,424, accounting for 19.8% and 13.7% of families, respectively.
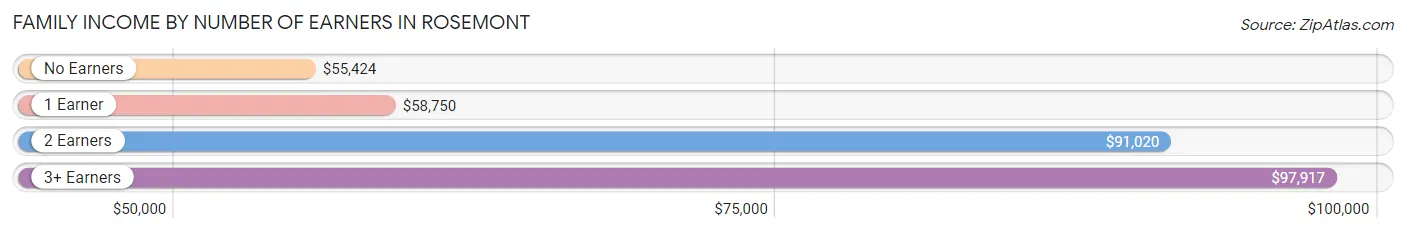
| Number of Earners | # Families | Median Income |
| No Earners | 133 (13.7%) | $55,424 |
| 1 Earner | 261 (26.8%) | $58,750 |
| 2 Earners | 386 (39.7%) | $91,020 |
| 3+ Earners | 193 (19.8%) | $97,917 |
| Total | 973 (100.0%) | $86,291 |
Household Income in Rosemont
Household Income Brackets in Rosemont
With 410 households falling in the category, the $50,000 to $74,999 income range is the most frequent in Rosemont, accounting for 25.9% of all households. In contrast, only 17 households (1.1%) fall into the $10,000 to $14,999 income bracket, making it the least populous group.
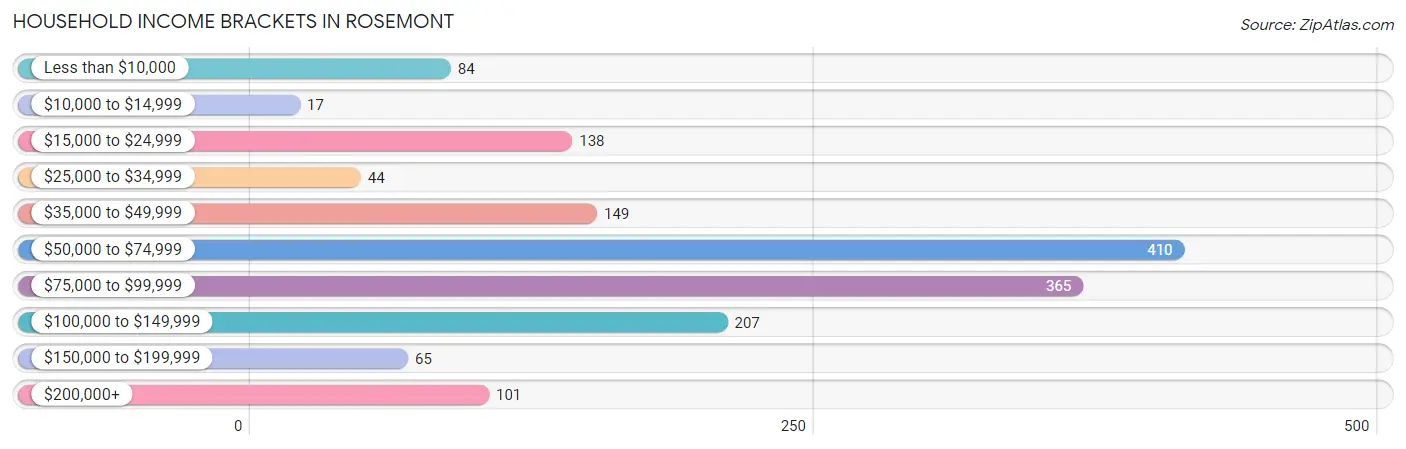
| Income Bracket | # Households | % Households |
| Less than $10,000 | 84 | 5.3% |
| $10,000 to $14,999 | 17 | 1.1% |
| $15,000 to $24,999 | 138 | 8.7% |
| $25,000 to $34,999 | 44 | 2.8% |
| $35,000 to $49,999 | 149 | 9.4% |
| $50,000 to $74,999 | 410 | 25.9% |
| $75,000 to $99,999 | 365 | 23.1% |
| $100,000 to $149,999 | 207 | 13.1% |
| $150,000 to $199,999 | 65 | 4.1% |
| $200,000+ | 101 | 6.4% |
Household Income by Householder Age in Rosemont
The median household income in Rosemont is $70,455, with the highest median household income of $85,761 found in the 45 to 64 years age bracket for the primary householder. A total of 588 households (37.2%) fall into this category. Meanwhile, the 65+ years age bracket for the primary householder has the lowest median household income of $42,250, with 380 households (24.0%) in this group.
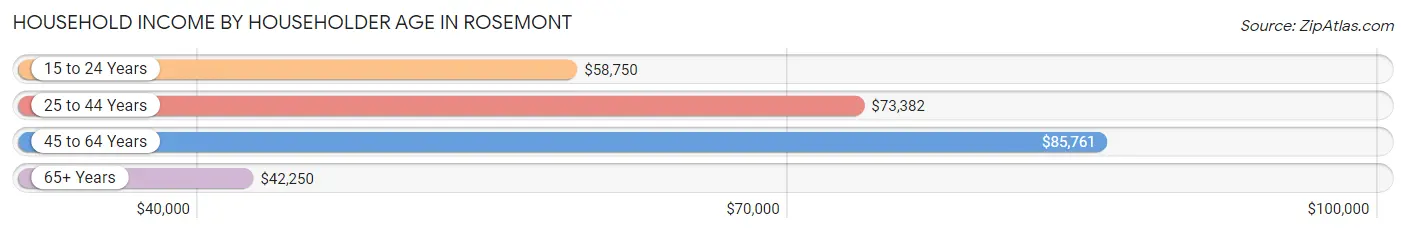
| Income Bracket | # Households | Median Income |
| 15 to 24 Years | 56 (3.5%) | $58,750 |
| 25 to 44 Years | 558 (35.3%) | $73,382 |
| 45 to 64 Years | 588 (37.2%) | $85,761 |
| 65+ Years | 380 (24.0%) | $42,250 |
| Total | 1,582 (100.0%) | $70,455 |
Poverty in Rosemont
Income Below Poverty by Sex and Age in Rosemont
With 6.9% poverty level for males and 5.8% for females among the residents of Rosemont, 5 year old males and 65 to 74 year old females are the most vulnerable to poverty, with 27 males (100.0%) and 24 females (16.0%) in their respective age groups living below the poverty level.
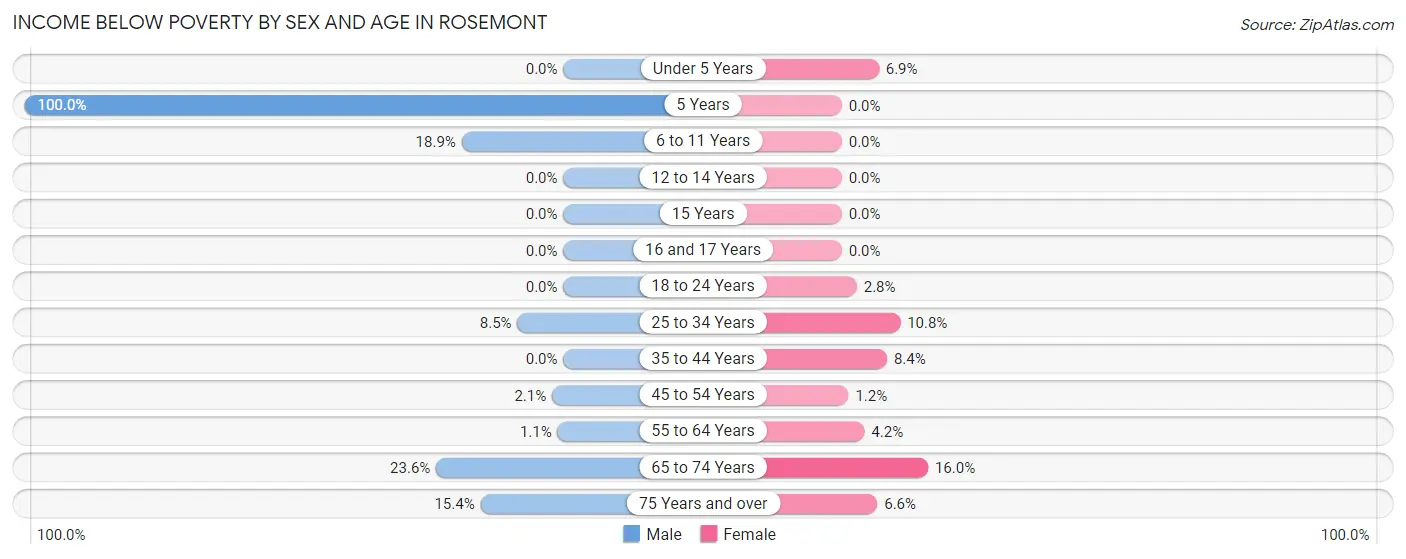
| Age Bracket | Male | Female |
| Under 5 Years | 0 (0.0%) | 7 (6.9%) |
| 5 Years | 27 (100.0%) | 0 (0.0%) |
| 6 to 11 Years | 27 (18.9%) | 0 (0.0%) |
| 12 to 14 Years | 0 (0.0%) | 0 (0.0%) |
| 15 Years | 0 (0.0%) | 0 (0.0%) |
| 16 and 17 Years | 0 (0.0%) | 0 (0.0%) |
| 18 to 24 Years | 0 (0.0%) | 6 (2.8%) |
| 25 to 34 Years | 23 (8.5%) | 31 (10.8%) |
| 35 to 44 Years | 0 (0.0%) | 16 (8.4%) |
| 45 to 54 Years | 6 (2.1%) | 4 (1.2%) |
| 55 to 64 Years | 4 (1.1%) | 10 (4.2%) |
| 65 to 74 Years | 34 (23.6%) | 24 (16.0%) |
| 75 Years and over | 20 (15.4%) | 6 (6.6%) |
| Total | 141 (6.9%) | 104 (5.8%) |
Income Above Poverty by Sex and Age in Rosemont
According to the poverty statistics in Rosemont, males aged under 5 years and females aged 6 to 11 years are the age groups that are most secure financially, with 100.0% of males and 100.0% of females in these age groups living above the poverty line.
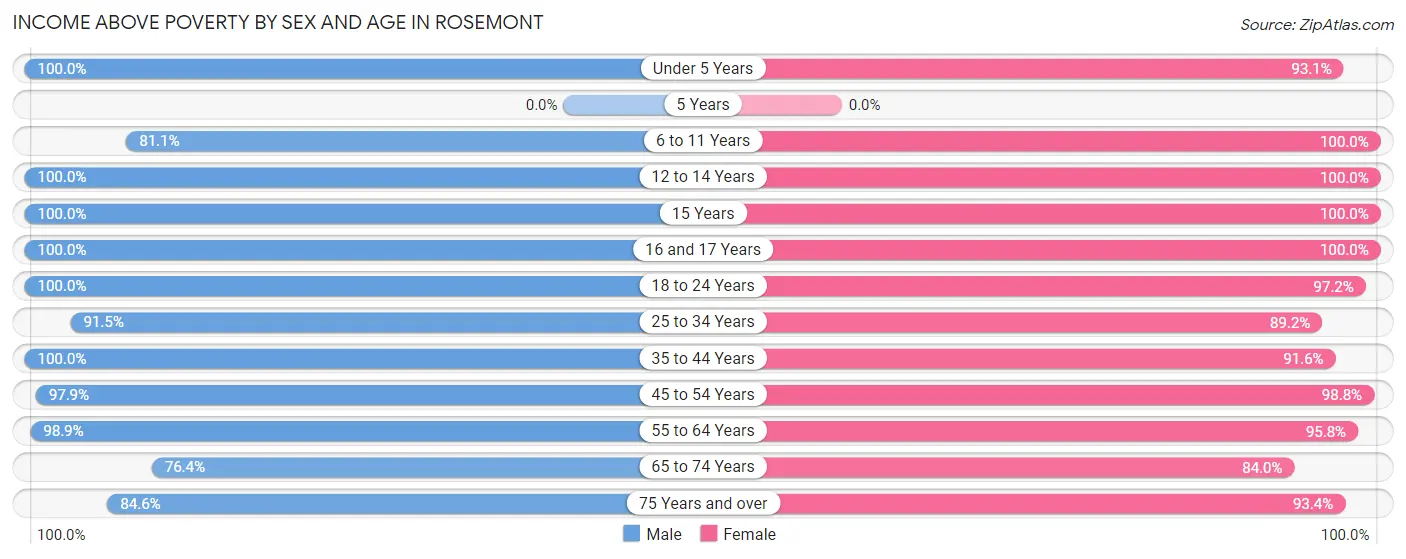
| Age Bracket | Male | Female |
| Under 5 Years | 75 (100.0%) | 95 (93.1%) |
| 5 Years | 0 (0.0%) | 0 (0.0%) |
| 6 to 11 Years | 116 (81.1%) | 81 (100.0%) |
| 12 to 14 Years | 56 (100.0%) | 25 (100.0%) |
| 15 Years | 17 (100.0%) | 66 (100.0%) |
| 16 and 17 Years | 84 (100.0%) | 31 (100.0%) |
| 18 to 24 Years | 138 (100.0%) | 210 (97.2%) |
| 25 to 34 Years | 247 (91.5%) | 255 (89.2%) |
| 35 to 44 Years | 315 (100.0%) | 175 (91.6%) |
| 45 to 54 Years | 280 (97.9%) | 318 (98.8%) |
| 55 to 64 Years | 369 (98.9%) | 228 (95.8%) |
| 65 to 74 Years | 110 (76.4%) | 126 (84.0%) |
| 75 Years and over | 110 (84.6%) | 85 (93.4%) |
| Total | 1,917 (93.1%) | 1,695 (94.2%) |
Income Below Poverty Among Married-Couple Families in Rosemont
The poverty statistics for married-couple families in Rosemont show that 4.7% or 36 of the total 760 families live below the poverty line. Families with no children have the highest poverty rate of 6.2%, comprising of 29 families. On the other hand, families with 3 or 4 children have the lowest poverty rate of 0.0%, which includes 0 families.
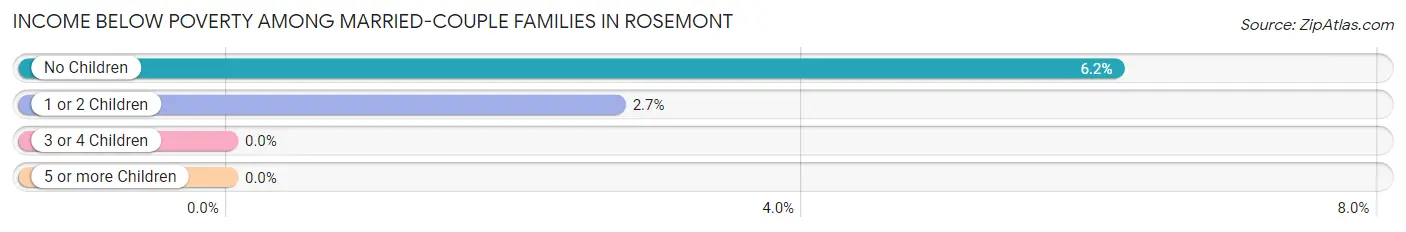
| Children | Above Poverty | Below Poverty |
| No Children | 441 (93.8%) | 29 (6.2%) |
| 1 or 2 Children | 252 (97.3%) | 7 (2.7%) |
| 3 or 4 Children | 31 (100.0%) | 0 (0.0%) |
| 5 or more Children | 0 (0.0%) | 0 (0.0%) |
| Total | 724 (95.3%) | 36 (4.7%) |
Income Below Poverty Among Single-Parent Households in Rosemont
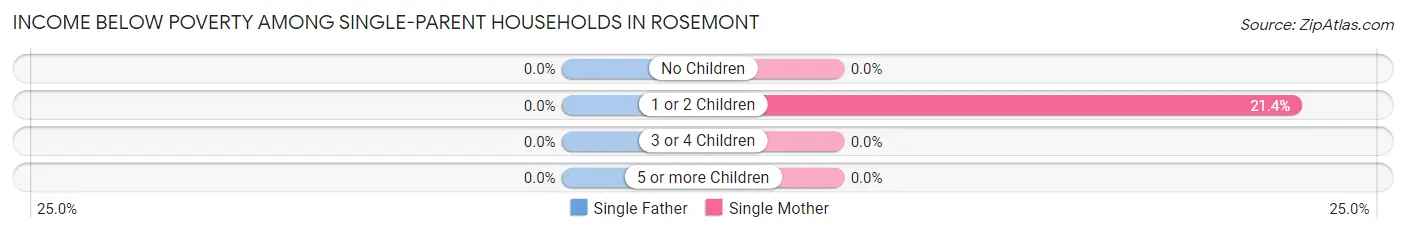
| Children | Single Father | Single Mother |
| No Children | 0 (0.0%) | 0 (0.0%) |
| 1 or 2 Children | 0 (0.0%) | 19 (21.3%) |
| 3 or 4 Children | 0 (0.0%) | 0 (0.0%) |
| 5 or more Children | 0 (0.0%) | 0 (0.0%) |
| Total | 0 (0.0%) | 19 (16.8%) |
Income Below Poverty Among Married-Couple vs Single-Parent Households in Rosemont
The poverty data for Rosemont shows that 36 of the married-couple family households (4.7%) and 19 of the single-parent households (8.9%) are living below the poverty level. Within the married-couple family households, those with no children have the highest poverty rate, with 29 households (6.2%) falling below the poverty line. Among the single-parent households, those with 1 or 2 children have the highest poverty rate, with 19 household (16.8%) living below poverty.
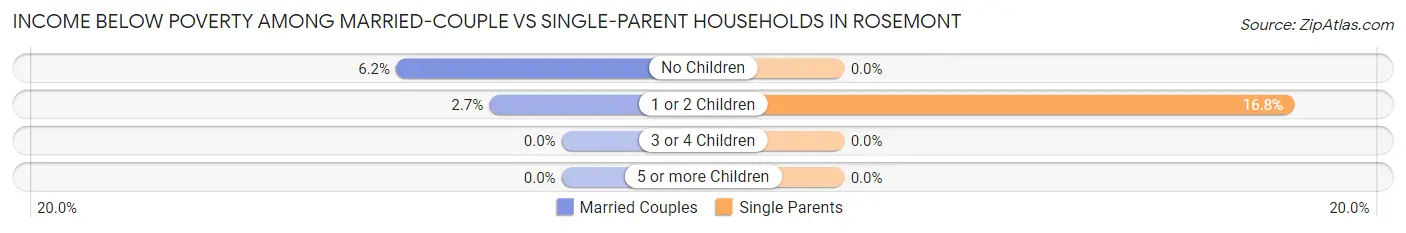
| Children | Married-Couple Families | Single-Parent Households |
| No Children | 29 (6.2%) | 0 (0.0%) |
| 1 or 2 Children | 7 (2.7%) | 19 (16.8%) |
| 3 or 4 Children | 0 (0.0%) | 0 (0.0%) |
| 5 or more Children | 0 (0.0%) | 0 (0.0%) |
| Total | 36 (4.7%) | 19 (8.9%) |
Race in Rosemont
The most populous races in Rosemont are White / Caucasian (2,846 | 73.7%), Hispanic or Latino (1,770 | 45.8%), and Two or more Races (574 | 14.9%).
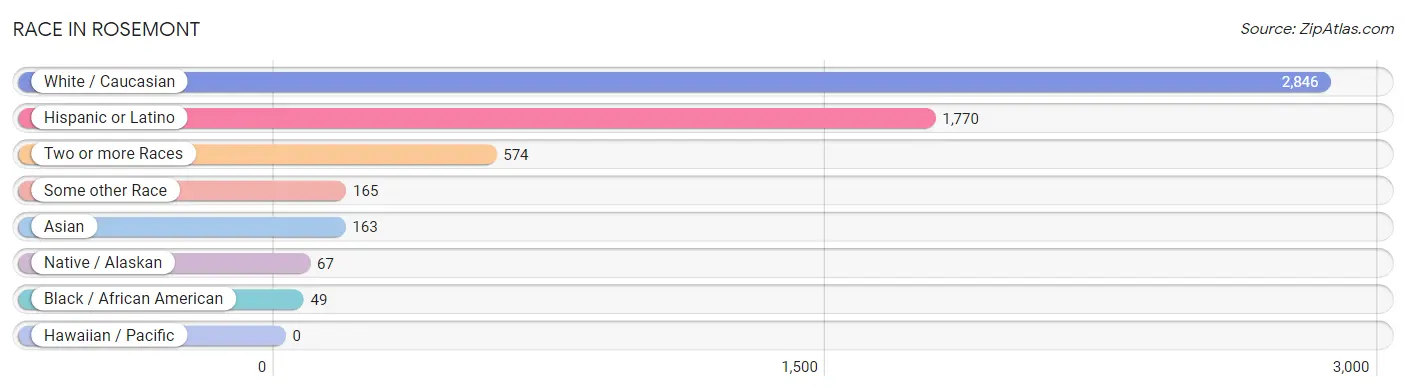
| Race | # Population | % Population |
| Asian | 163 | 4.2% |
| Black / African American | 49 | 1.3% |
| Hawaiian / Pacific | 0 | 0.0% |
| Hispanic or Latino | 1,770 | 45.8% |
| Native / Alaskan | 67 | 1.7% |
| White / Caucasian | 2,846 | 73.7% |
| Two or more Races | 574 | 14.9% |
| Some other Race | 165 | 4.3% |
| Total | 3,864 | 100.0% |
Ancestry in Rosemont
The most populous ancestries reported in Rosemont are Mexican (1,348 | 34.9%), Italian (364 | 9.4%), German (342 | 8.8%), South American (320 | 8.3%), and Ecuadorian (308 | 8.0%), together accounting for 69.4% of all Rosemont residents.
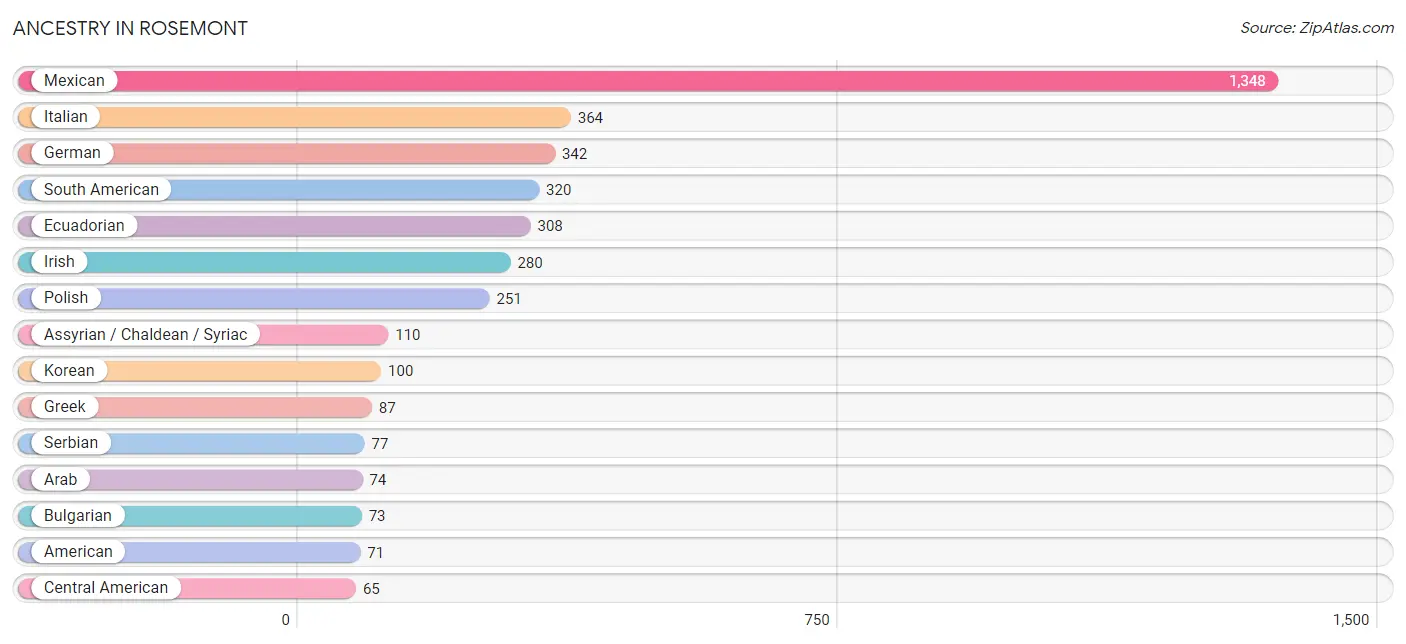
| Ancestry | # Population | % Population |
| American | 71 | 1.8% |
| Arab | 74 | 1.9% |
| Assyrian / Chaldean / Syriac | 110 | 2.9% |
| Austrian | 6 | 0.2% |
| Bhutanese | 12 | 0.3% |
| British | 8 | 0.2% |
| Bulgarian | 73 | 1.9% |
| Central American | 65 | 1.7% |
| Cherokee | 9 | 0.2% |
| Cuban | 6 | 0.2% |
| Czech | 30 | 0.8% |
| Danish | 50 | 1.3% |
| Eastern European | 3 | 0.1% |
| Ecuadorian | 308 | 8.0% |
| English | 40 | 1.0% |
| European | 4 | 0.1% |
| French | 12 | 0.3% |
| German | 342 | 8.8% |
| Greek | 87 | 2.2% |
| Guatemalan | 54 | 1.4% |
| Hungarian | 7 | 0.2% |
| Indian (Asian) | 5 | 0.1% |
| Iraqi | 5 | 0.1% |
| Irish | 280 | 7.2% |
| Italian | 364 | 9.4% |
| Jordanian | 5 | 0.1% |
| Korean | 100 | 2.6% |
| Mexican | 1,348 | 34.9% |
| Mexican American Indian | 16 | 0.4% |
| Moroccan | 30 | 0.8% |
| Norwegian | 40 | 1.0% |
| Palestinian | 21 | 0.5% |
| Polish | 251 | 6.5% |
| Portuguese | 7 | 0.2% |
| Puerto Rican | 18 | 0.5% |
| Romanian | 5 | 0.1% |
| Russian | 16 | 0.4% |
| Salvadoran | 11 | 0.3% |
| Scottish | 8 | 0.2% |
| Serbian | 77 | 2.0% |
| South African | 7 | 0.2% |
| South American | 320 | 8.3% |
| Spanish | 5 | 0.1% |
| Subsaharan African | 7 | 0.2% |
| Swedish | 55 | 1.4% |
| Swiss | 5 | 0.1% |
| Thai | 10 | 0.3% |
| Ukrainian | 26 | 0.7% |
| Venezuelan | 12 | 0.3% |
| Yugoslavian | 62 | 1.6% | View All 50 Rows |
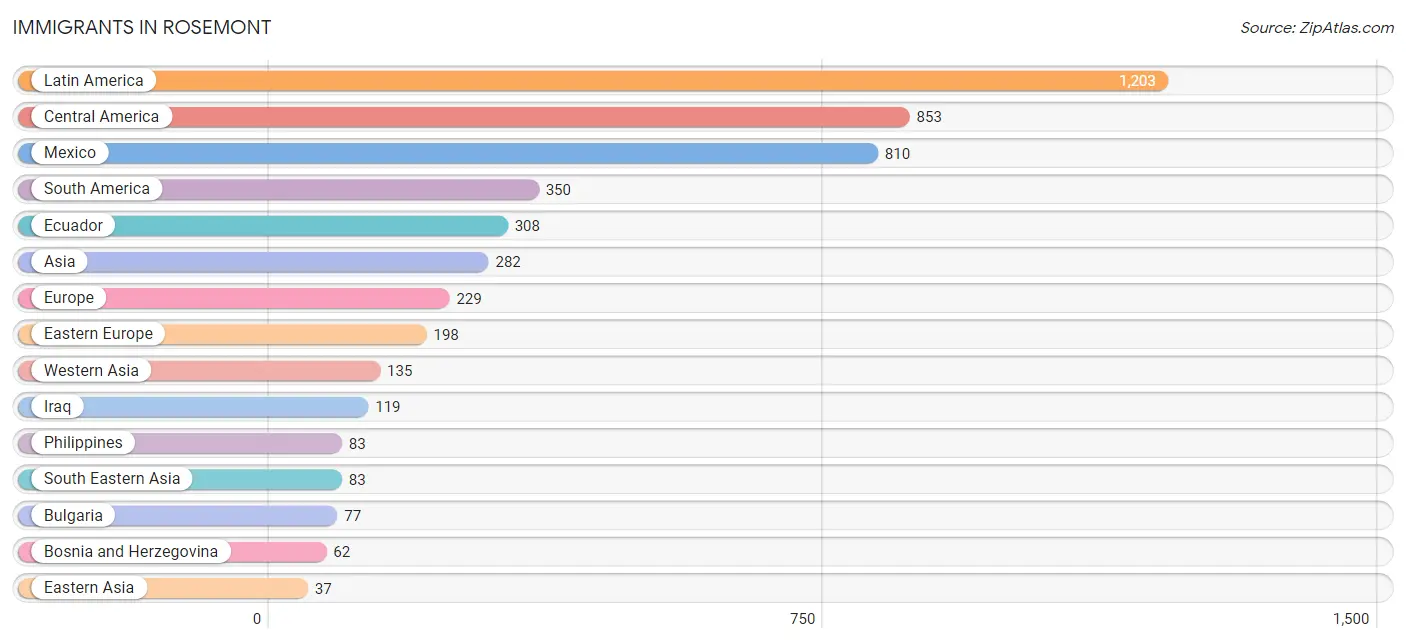
Immigrants in Rosemont
The most numerous immigrant groups reported in Rosemont came from Latin America (1,203 | 31.1%), Central America (853 | 22.1%), Mexico (810 | 21.0%), South America (350 | 9.1%), and Ecuador (308 | 8.0%), together accounting for 91.2% of all Rosemont residents.
| Immigration Origin | # Population | % Population |
| Africa | 22 | 0.6% |
| Asia | 282 | 7.3% |
| Australia | 5 | 0.1% |
| Bosnia and Herzegovina | 62 | 1.6% |
| Bulgaria | 77 | 2.0% |
| Canada | 2 | 0.1% |
| Central America | 853 | 22.1% |
| Colombia | 30 | 0.8% |
| Denmark | 4 | 0.1% |
| Eastern Asia | 37 | 1.0% |
| Eastern Europe | 198 | 5.1% |
| Ecuador | 308 | 8.0% |
| El Salvador | 6 | 0.2% |
| Europe | 229 | 5.9% |
| Germany | 15 | 0.4% |
| Greece | 11 | 0.3% |
| Guatemala | 37 | 1.0% |
| India | 20 | 0.5% |
| Iraq | 119 | 3.1% |
| Italy | 1 | 0.0% |
| Japan | 12 | 0.3% |
| Jordan | 16 | 0.4% |
| Korea | 25 | 0.6% |
| Latin America | 1,203 | 31.1% |
| Mexico | 810 | 21.0% |
| Morocco | 22 | 0.6% |
| Northern Africa | 22 | 0.6% |
| Northern Europe | 4 | 0.1% |
| Oceania | 5 | 0.1% |
| Pakistan | 3 | 0.1% |
| Philippines | 83 | 2.1% |
| Poland | 33 | 0.9% |
| South America | 350 | 9.1% |
| South Central Asia | 27 | 0.7% |
| South Eastern Asia | 83 | 2.1% |
| Southern Europe | 12 | 0.3% |
| Ukraine | 26 | 0.7% |
| Venezuela | 12 | 0.3% |
| Western Asia | 135 | 3.5% |
| Western Europe | 15 | 0.4% | View All 40 Rows |
Sex and Age in Rosemont
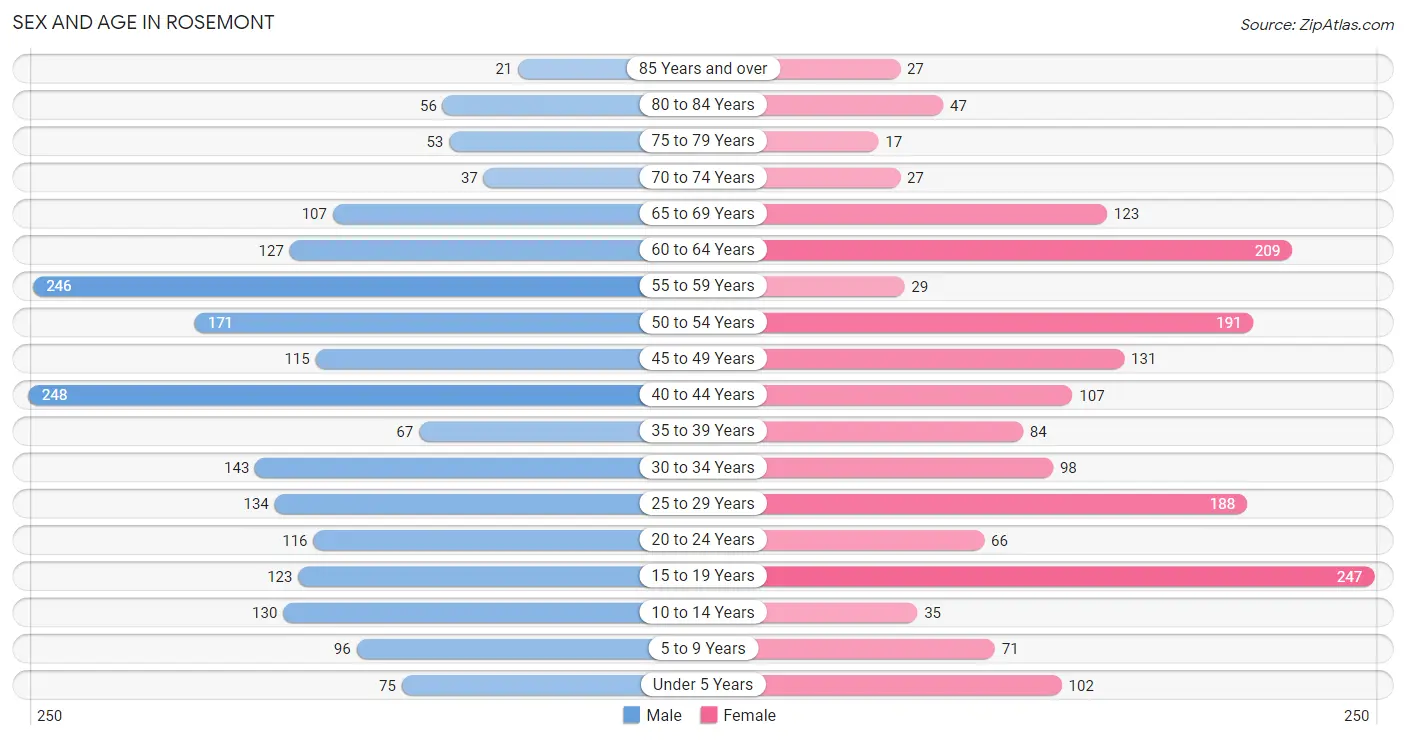
Sex and Age in Rosemont
The most populous age groups in Rosemont are 40 to 44 Years (248 | 12.0%) for men and 15 to 19 Years (247 | 13.7%) for women.
| Age Bracket | Male | Female |
| Under 5 Years | 75 (3.6%) | 102 (5.7%) |
| 5 to 9 Years | 96 (4.6%) | 71 (4.0%) |
| 10 to 14 Years | 130 (6.3%) | 35 (1.9%) |
| 15 to 19 Years | 123 (6.0%) | 247 (13.7%) |
| 20 to 24 Years | 116 (5.6%) | 66 (3.7%) |
| 25 to 29 Years | 134 (6.5%) | 188 (10.4%) |
| 30 to 34 Years | 143 (6.9%) | 98 (5.4%) |
| 35 to 39 Years | 67 (3.2%) | 84 (4.7%) |
| 40 to 44 Years | 248 (12.0%) | 107 (5.9%) |
| 45 to 49 Years | 115 (5.6%) | 131 (7.3%) |
| 50 to 54 Years | 171 (8.3%) | 191 (10.6%) |
| 55 to 59 Years | 246 (11.9%) | 29 (1.6%) |
| 60 to 64 Years | 127 (6.1%) | 209 (11.6%) |
| 65 to 69 Years | 107 (5.2%) | 123 (6.8%) |
| 70 to 74 Years | 37 (1.8%) | 27 (1.5%) |
| 75 to 79 Years | 53 (2.6%) | 17 (0.9%) |
| 80 to 84 Years | 56 (2.7%) | 47 (2.6%) |
| 85 Years and over | 21 (1.0%) | 27 (1.5%) |
| Total | 2,065 (100.0%) | 1,799 (100.0%) |
Families and Households in Rosemont
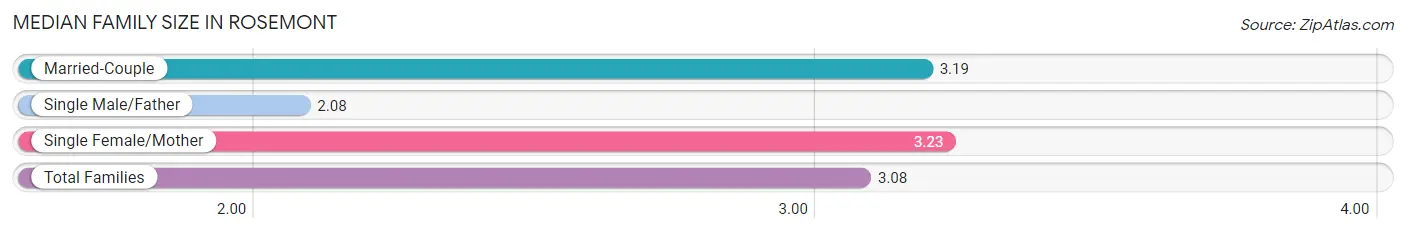
Median Family Size in Rosemont
The median family size in Rosemont is 3.08 persons per family, with single female/mother families (113 | 11.6%) accounting for the largest median family size of 3.23 persons per family. On the other hand, single male/father families (100 | 10.3%) represent the smallest median family size with 2.08 persons per family.
| Family Type | # Families | Family Size |
| Married-Couple | 760 (78.1%) | 3.19 |
| Single Male/Father | 100 (10.3%) | 2.08 |
| Single Female/Mother | 113 (11.6%) | 3.23 |
| Total Families | 973 (100.0%) | 3.08 |
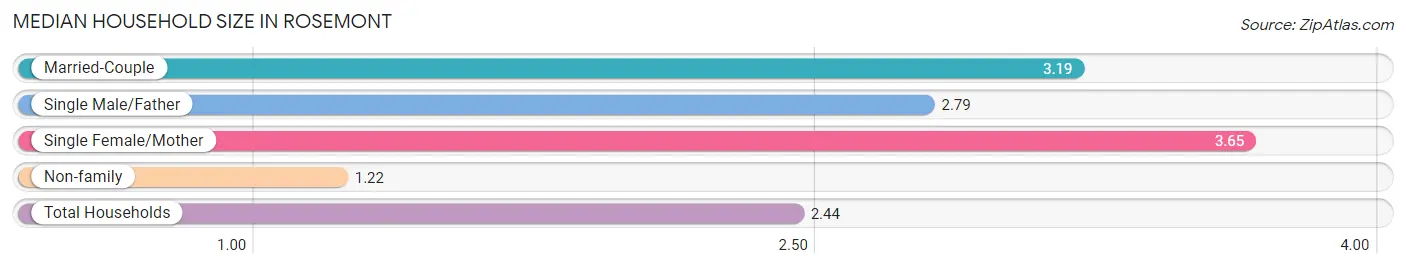
Median Household Size in Rosemont
The median household size in Rosemont is 2.44 persons per household, with single female/mother households (113 | 7.1%) accounting for the largest median household size of 3.65 persons per household. non-family households (609 | 38.5%) represent the smallest median household size with 1.22 persons per household.
| Household Type | # Households | Household Size |
| Married-Couple | 760 (48.0%) | 3.19 |
| Single Male/Father | 100 (6.3%) | 2.79 |
| Single Female/Mother | 113 (7.1%) | 3.65 |
| Non-family | 609 (38.5%) | 1.22 |
| Total Households | 1,582 (100.0%) | 2.44 |
Household Size by Marriage Status in Rosemont
Out of a total of 1,582 households in Rosemont, 973 (61.5%) are family households, while 609 (38.5%) are nonfamily households. The most numerous type of family households are 2-person households, comprising 353, and the most common type of nonfamily households are 1-person households, comprising 539.
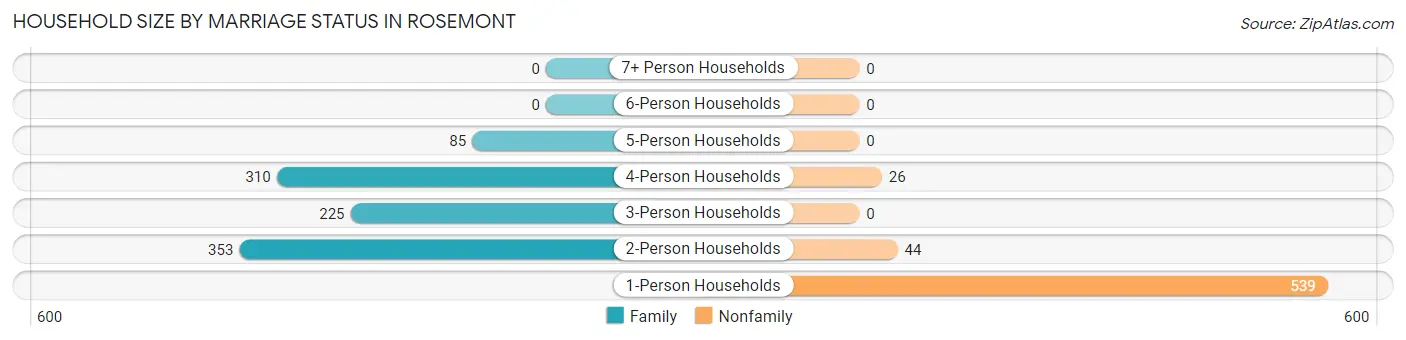
| Household Size | Family Households | Nonfamily Households |
| 1-Person Households | - | 539 (34.1%) |
| 2-Person Households | 353 (22.3%) | 44 (2.8%) |
| 3-Person Households | 225 (14.2%) | 0 (0.0%) |
| 4-Person Households | 310 (19.6%) | 26 (1.6%) |
| 5-Person Households | 85 (5.4%) | 0 (0.0%) |
| 6-Person Households | 0 (0.0%) | 0 (0.0%) |
| 7+ Person Households | 0 (0.0%) | 0 (0.0%) |
| Total | 973 (61.5%) | 609 (38.5%) |
Female Fertility in Rosemont
Fertility by Age in Rosemont
Average fertility rate in Rosemont is 46.0 births per 1,000 women. Women in the age bracket of 35 to 50 years have the highest fertility rate with 58.0 births per 1,000 women. Women in the age bracket of 35 to 50 years acount for 47.7% of all women with births.
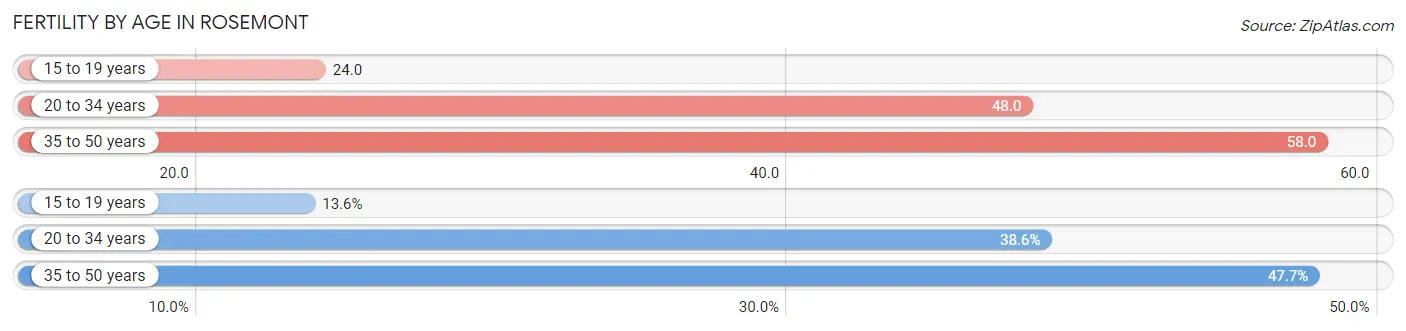
| Age Bracket | Women with Births | Births / 1,000 Women |
| 15 to 19 years | 6 (13.6%) | 24.0 |
| 20 to 34 years | 17 (38.6%) | 48.0 |
| 35 to 50 years | 21 (47.7%) | 58.0 |
| Total | 44 (100.0%) | 46.0 |
Fertility by Age by Marriage Status in Rosemont
54.5% of women with births (44) in Rosemont are married. The highest percentage of unmarried women with births falls into 15 to 19 years age bracket with 100.0% of them unmarried at the time of birth, while the lowest percentage of unmarried women with births belong to 20 to 34 years age bracket with 35.3% of them unmarried.
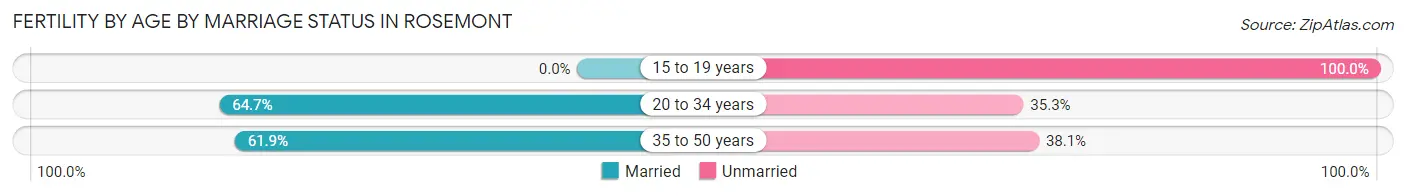
| Age Bracket | Married | Unmarried |
| 15 to 19 years | 0 (0.0%) | 6 (100.0%) |
| 20 to 34 years | 11 (64.7%) | 6 (35.3%) |
| 35 to 50 years | 13 (61.9%) | 8 (38.1%) |
| Total | 24 (54.5%) | 20 (45.5%) |
Fertility by Education in Rosemont
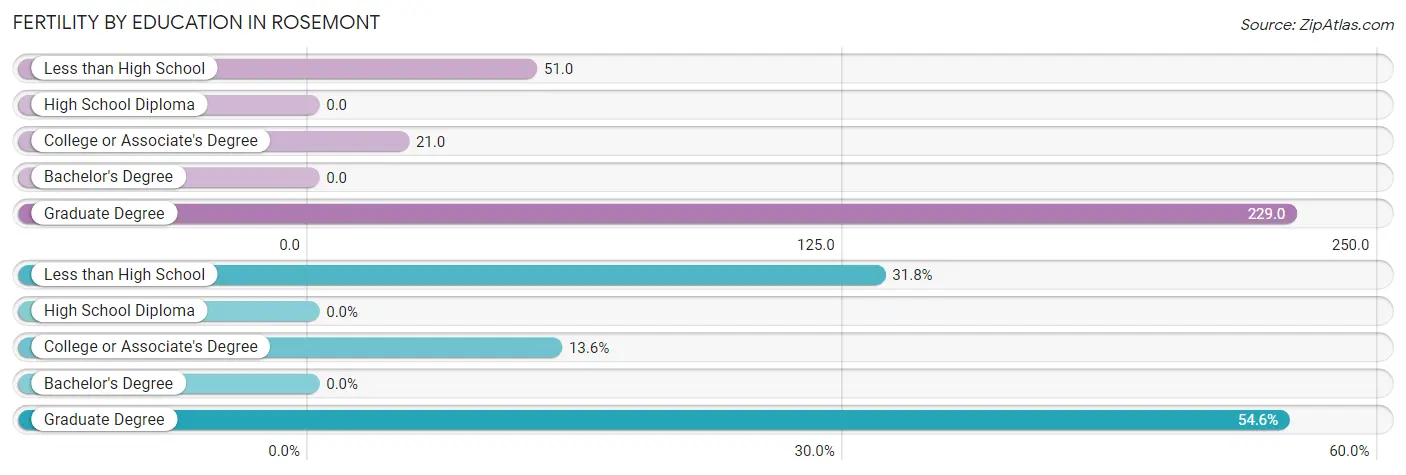
| Educational Attainment | Women with Births | Births / 1,000 Women |
| Less than High School | 14 (31.8%) | 51.0 |
| High School Diploma | 0 (0.0%) | 0.0 |
| College or Associate's Degree | 6 (13.6%) | 21.0 |
| Bachelor's Degree | 0 (0.0%) | 0.0 |
| Graduate Degree | 24 (54.5%) | 229.0 |
| Total | 44 (100.0%) | 46.0 |
Fertility by Education by Marriage Status in Rosemont
45.5% of women with births in Rosemont are unmarried. Women with the educational attainment of graduate degree are most likely to be married with 100.0% of them married at childbirth, while women with the educational attainment of less than high school are least likely to be married with 100.0% of them unmarried at childbirth.
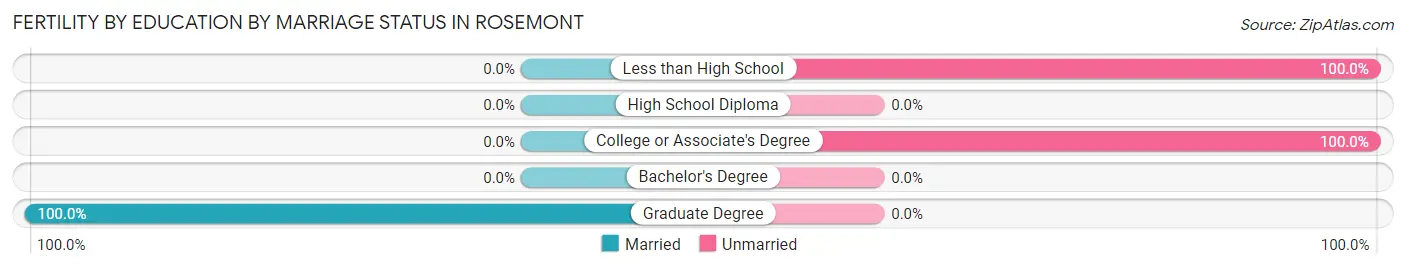
| Educational Attainment | Married | Unmarried |
| Less than High School | 0 (0.0%) | 14 (100.0%) |
| High School Diploma | 0 (0.0%) | 0 (0.0%) |
| College or Associate's Degree | 0 (0.0%) | 6 (100.0%) |
| Bachelor's Degree | 0 (0.0%) | 0 (0.0%) |
| Graduate Degree | 24 (100.0%) | 0 (0.0%) |
| Total | 24 (54.5%) | 20 (45.5%) |
Employment Characteristics in Rosemont
Employment by Class of Employer in Rosemont
Among the 2,077 employed individuals in Rosemont, private company employees (1,681 | 80.9%), local government employees (180 | 8.7%), and self-employed (incorporated) (63 | 3.0%) make up the most common classes of employment.
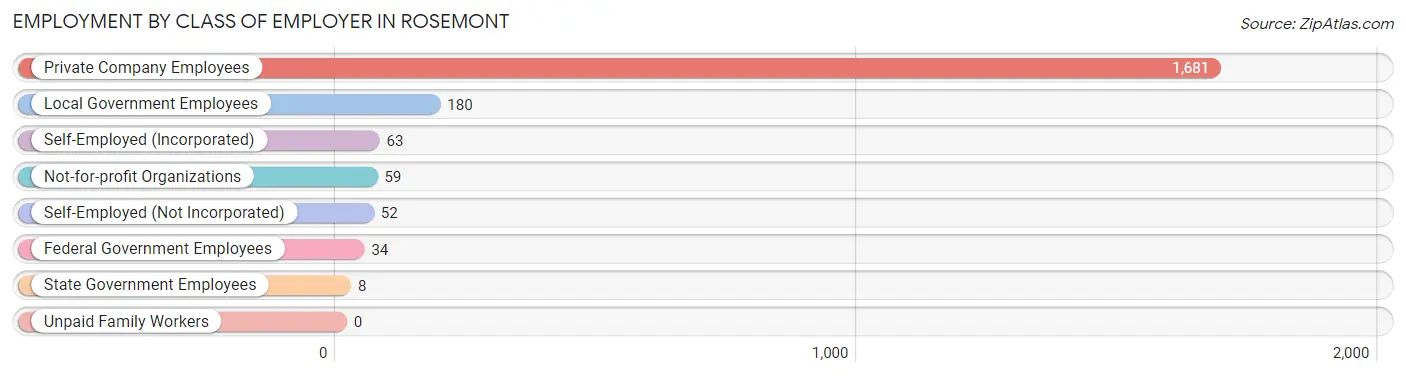
| Employer Class | # Employees | % Employees |
| Private Company Employees | 1,681 | 80.9% |
| Self-Employed (Incorporated) | 63 | 3.0% |
| Self-Employed (Not Incorporated) | 52 | 2.5% |
| Not-for-profit Organizations | 59 | 2.8% |
| Local Government Employees | 180 | 8.7% |
| State Government Employees | 8 | 0.4% |
| Federal Government Employees | 34 | 1.6% |
| Unpaid Family Workers | 0 | 0.0% |
| Total | 2,077 | 100.0% |
Employment Status by Age in Rosemont
According to the labor force statistics for Rosemont, out of the total population over 16 years of age (3,272), 68.2% or 2,232 individuals are in the labor force, with 4.3% or 96 of them unemployed. The age group with the highest labor force participation rate is 30 to 34 years, with 100.0% or 241 individuals in the labor force. Within the labor force, the 75 years and over age range has the highest percentage of unemployed individuals, with 36.8% or 7 of them being unemployed.
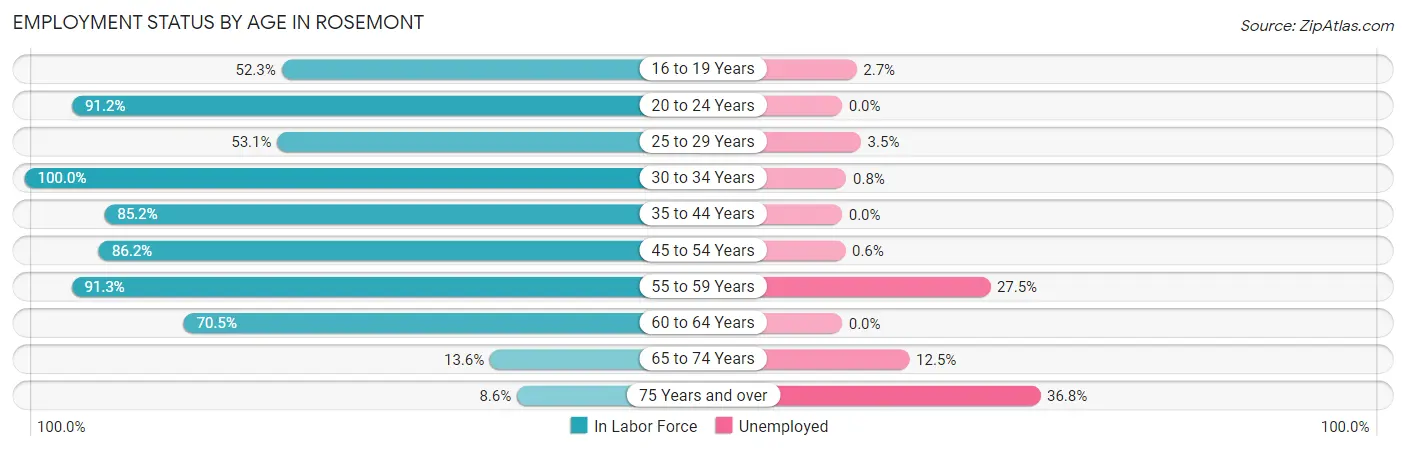
| Age Bracket | In Labor Force | Unemployed |
| 16 to 19 Years | 150 (52.3%) | 4 (2.7%) |
| 20 to 24 Years | 166 (91.2%) | 0 (0.0%) |
| 25 to 29 Years | 171 (53.1%) | 6 (3.5%) |
| 30 to 34 Years | 241 (100.0%) | 2 (0.8%) |
| 35 to 44 Years | 431 (85.2%) | 0 (0.0%) |
| 45 to 54 Years | 524 (86.2%) | 3 (0.6%) |
| 55 to 59 Years | 251 (91.3%) | 69 (27.5%) |
| 60 to 64 Years | 237 (70.5%) | 0 (0.0%) |
| 65 to 74 Years | 40 (13.6%) | 5 (12.5%) |
| 75 Years and over | 19 (8.6%) | 7 (36.8%) |
| Total | 2,232 (68.2%) | 96 (4.3%) |
Employment Status by Educational Attainment in Rosemont
According to labor force statistics for Rosemont, 81.1% of individuals (1,856) out of the total population between 25 and 64 years of age (2,288) are in the labor force, with 4.3% or 80 of them being unemployed. The group with the highest labor force participation rate are those with the educational attainment of bachelor's degree or higher, with 92.0% or 509 individuals in the labor force. Within the labor force, individuals with less than high school education have the highest percentage of unemployment, with 15.0% or 56 of them being unemployed.
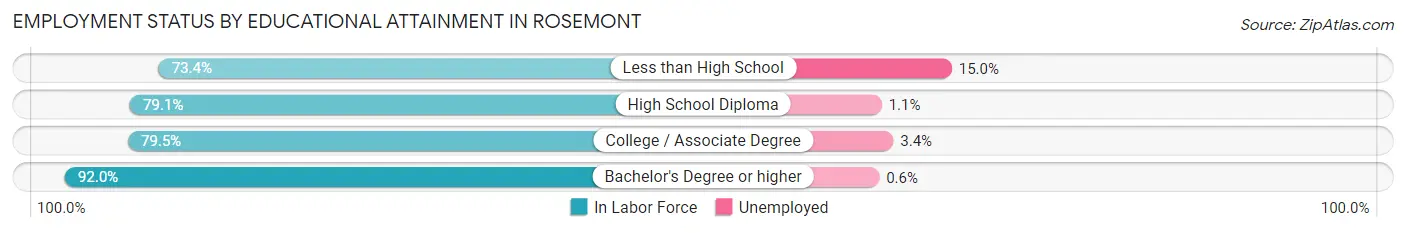
| Educational Attainment | In Labor Force | Unemployed |
| Less than High School | 373 (73.4%) | 76 (15.0%) |
| High School Diploma | 531 (79.1%) | 7 (1.1%) |
| College / Associate Degree | 442 (79.5%) | 19 (3.4%) |
| Bachelor's Degree or higher | 509 (92.0%) | 3 (0.6%) |
| Total | 1,856 (81.1%) | 98 (4.3%) |
Employment Occupations by Sex in Rosemont
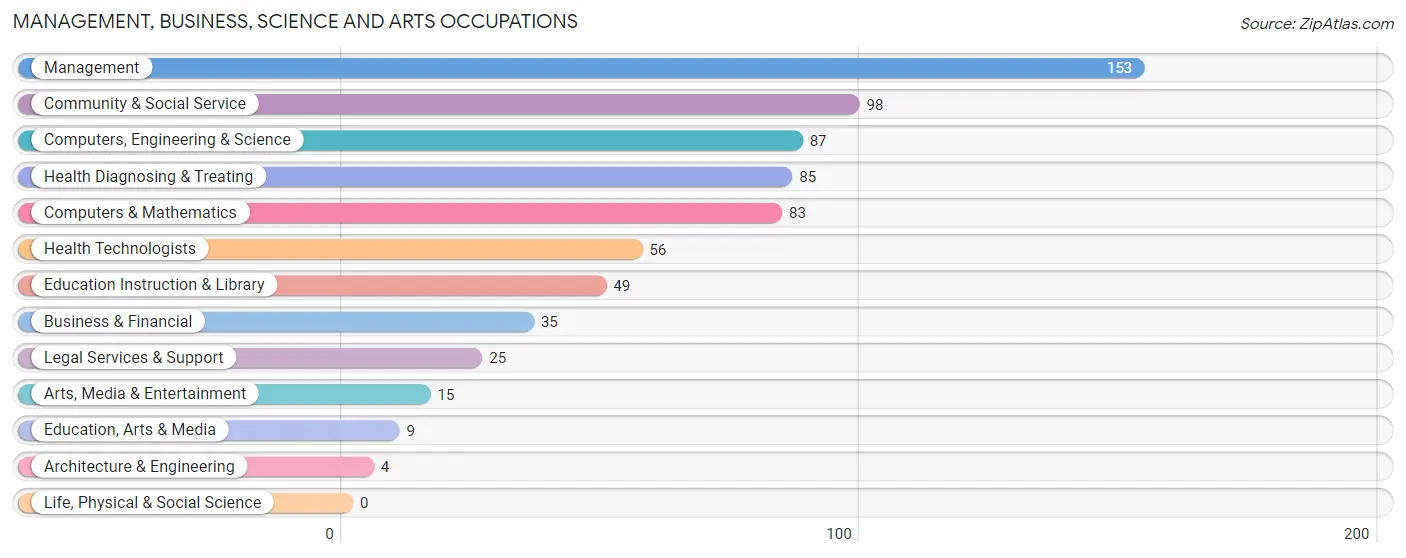
Management, Business, Science and Arts Occupations
The most common Management, Business, Science and Arts occupations in Rosemont are Management (153 | 7.2%), Community & Social Service (98 | 4.6%), Computers, Engineering & Science (87 | 4.1%), Health Diagnosing & Treating (85 | 4.0%), and Computers & Mathematics (83 | 3.9%).
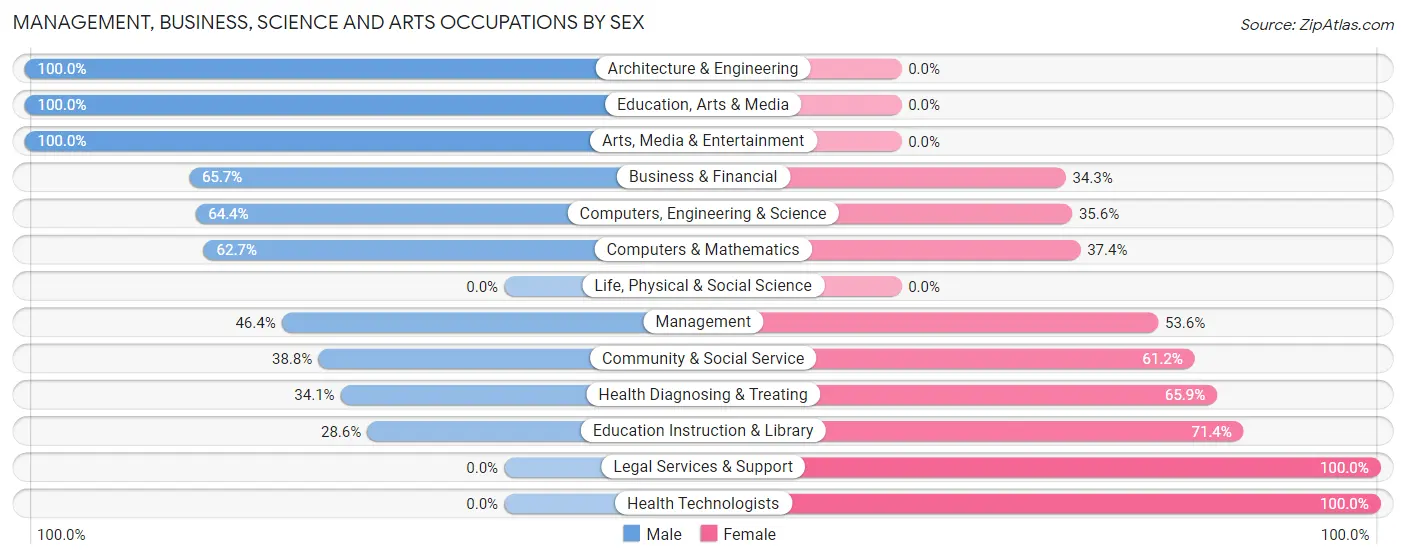
Management, Business, Science and Arts Occupations by Sex
Within the Management, Business, Science and Arts occupations in Rosemont, the most male-oriented occupations are Architecture & Engineering (100.0%), Education, Arts & Media (100.0%), and Arts, Media & Entertainment (100.0%), while the most female-oriented occupations are Legal Services & Support (100.0%), Health Technologists (100.0%), and Education Instruction & Library (71.4%).
| Occupation | Male | Female |
| Management | 71 (46.4%) | 82 (53.6%) |
| Business & Financial | 23 (65.7%) | 12 (34.3%) |
| Computers, Engineering & Science | 56 (64.4%) | 31 (35.6%) |
| Computers & Mathematics | 52 (62.6%) | 31 (37.3%) |
| Architecture & Engineering | 4 (100.0%) | 0 (0.0%) |
| Life, Physical & Social Science | 0 (0.0%) | 0 (0.0%) |
| Community & Social Service | 38 (38.8%) | 60 (61.2%) |
| Education, Arts & Media | 9 (100.0%) | 0 (0.0%) |
| Legal Services & Support | 0 (0.0%) | 25 (100.0%) |
| Education Instruction & Library | 14 (28.6%) | 35 (71.4%) |
| Arts, Media & Entertainment | 15 (100.0%) | 0 (0.0%) |
| Health Diagnosing & Treating | 29 (34.1%) | 56 (65.9%) |
| Health Technologists | 0 (0.0%) | 56 (100.0%) |
| Total (Category) | 217 (47.4%) | 241 (52.6%) |
| Total (Overall) | 1,243 (58.3%) | 891 (41.7%) |
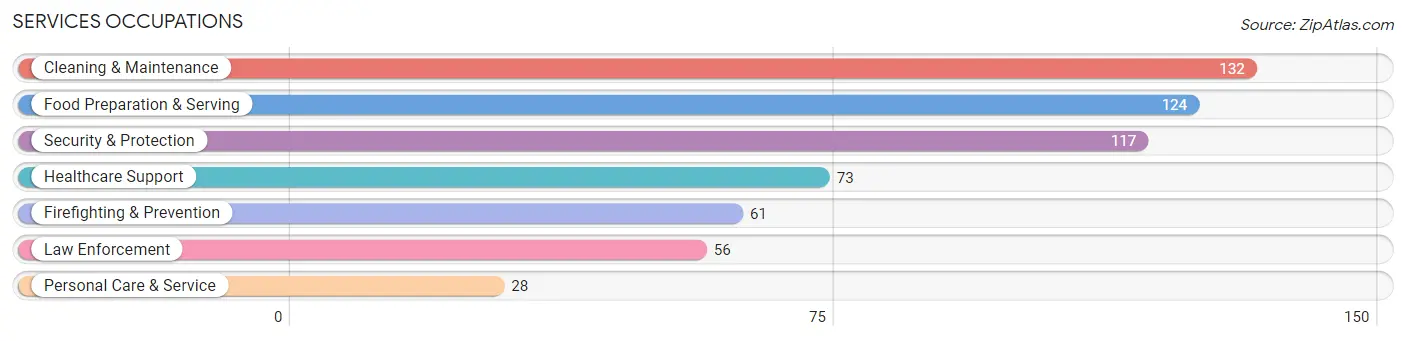
Services Occupations
The most common Services occupations in Rosemont are Cleaning & Maintenance (132 | 6.2%), Food Preparation & Serving (124 | 5.8%), Security & Protection (117 | 5.5%), Healthcare Support (73 | 3.4%), and Firefighting & Prevention (61 | 2.9%).
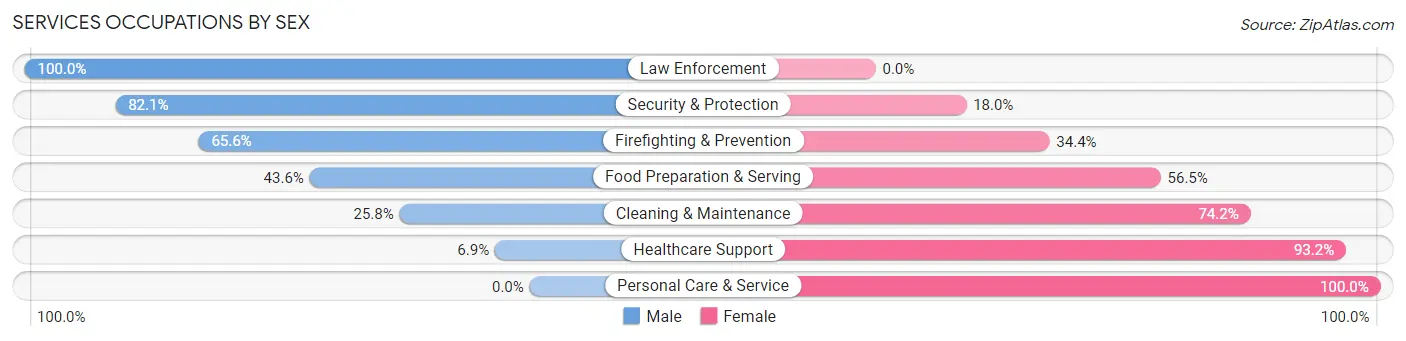
Services Occupations by Sex
Within the Services occupations in Rosemont, the most male-oriented occupations are Law Enforcement (100.0%), Security & Protection (82.1%), and Firefighting & Prevention (65.6%), while the most female-oriented occupations are Personal Care & Service (100.0%), Healthcare Support (93.1%), and Cleaning & Maintenance (74.2%).
| Occupation | Male | Female |
| Healthcare Support | 5 (6.9%) | 68 (93.1%) |
| Security & Protection | 96 (82.1%) | 21 (17.9%) |
| Firefighting & Prevention | 40 (65.6%) | 21 (34.4%) |
| Law Enforcement | 56 (100.0%) | 0 (0.0%) |
| Food Preparation & Serving | 54 (43.5%) | 70 (56.5%) |
| Cleaning & Maintenance | 34 (25.8%) | 98 (74.2%) |
| Personal Care & Service | 0 (0.0%) | 28 (100.0%) |
| Total (Category) | 189 (39.9%) | 285 (60.1%) |
| Total (Overall) | 1,243 (58.3%) | 891 (41.7%) |
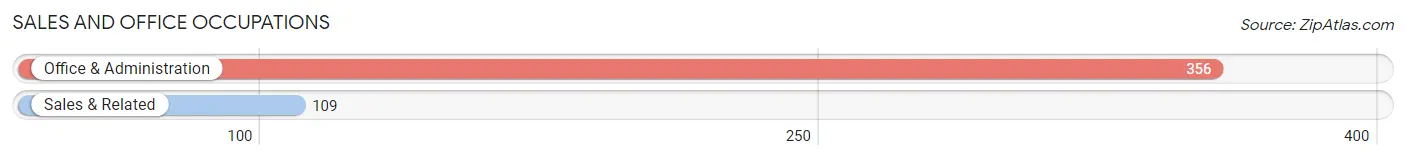
Sales and Office Occupations
The most common Sales and Office occupations in Rosemont are Office & Administration (356 | 16.7%), and Sales & Related (109 | 5.1%).
Sales and Office Occupations by Sex
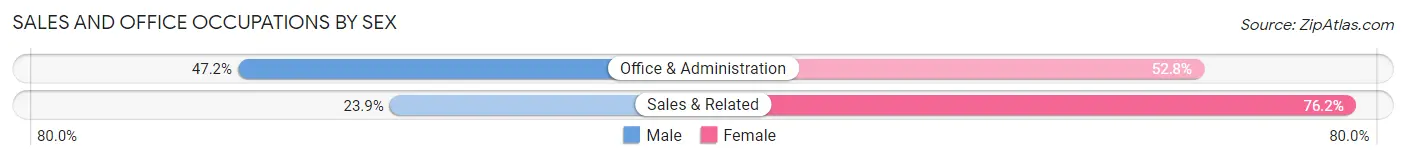
| Occupation | Male | Female |
| Sales & Related | 26 (23.8%) | 83 (76.1%) |
| Office & Administration | 168 (47.2%) | 188 (52.8%) |
| Total (Category) | 194 (41.7%) | 271 (58.3%) |
| Total (Overall) | 1,243 (58.3%) | 891 (41.7%) |
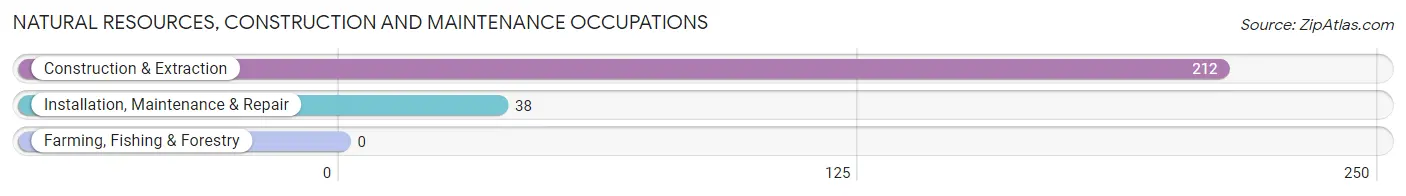
Natural Resources, Construction and Maintenance Occupations
The most common Natural Resources, Construction and Maintenance occupations in Rosemont are Construction & Extraction (212 | 9.9%), and Installation, Maintenance & Repair (38 | 1.8%).
Natural Resources, Construction and Maintenance Occupations by Sex
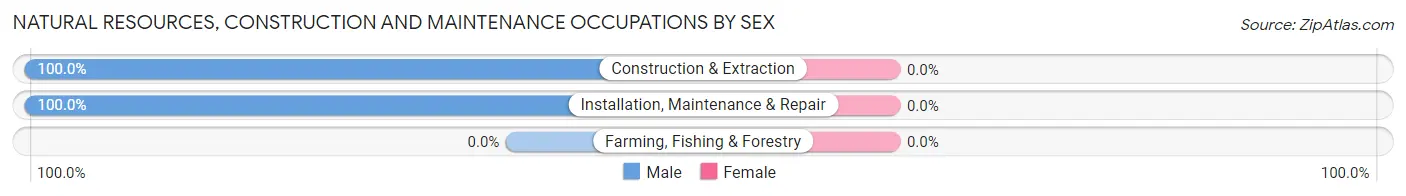
| Occupation | Male | Female |
| Farming, Fishing & Forestry | 0 (0.0%) | 0 (0.0%) |
| Construction & Extraction | 212 (100.0%) | 0 (0.0%) |
| Installation, Maintenance & Repair | 38 (100.0%) | 0 (0.0%) |
| Total (Category) | 250 (100.0%) | 0 (0.0%) |
| Total (Overall) | 1,243 (58.3%) | 891 (41.7%) |
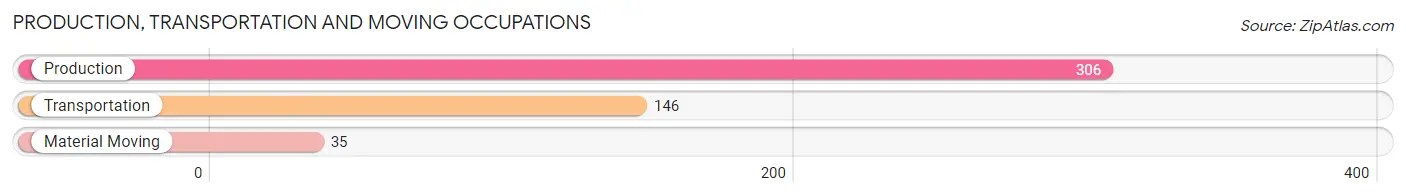
Production, Transportation and Moving Occupations
The most common Production, Transportation and Moving occupations in Rosemont are Production (306 | 14.3%), Transportation (146 | 6.8%), and Material Moving (35 | 1.6%).
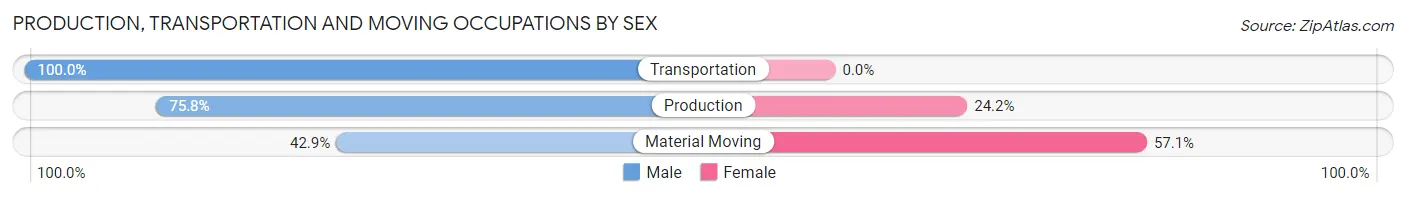
Production, Transportation and Moving Occupations by Sex
| Occupation | Male | Female |
| Production | 232 (75.8%) | 74 (24.2%) |
| Transportation | 146 (100.0%) | 0 (0.0%) |
| Material Moving | 15 (42.9%) | 20 (57.1%) |
| Total (Category) | 393 (80.7%) | 94 (19.3%) |
| Total (Overall) | 1,243 (58.3%) | 891 (41.7%) |
Employment Industries by Sex in Rosemont
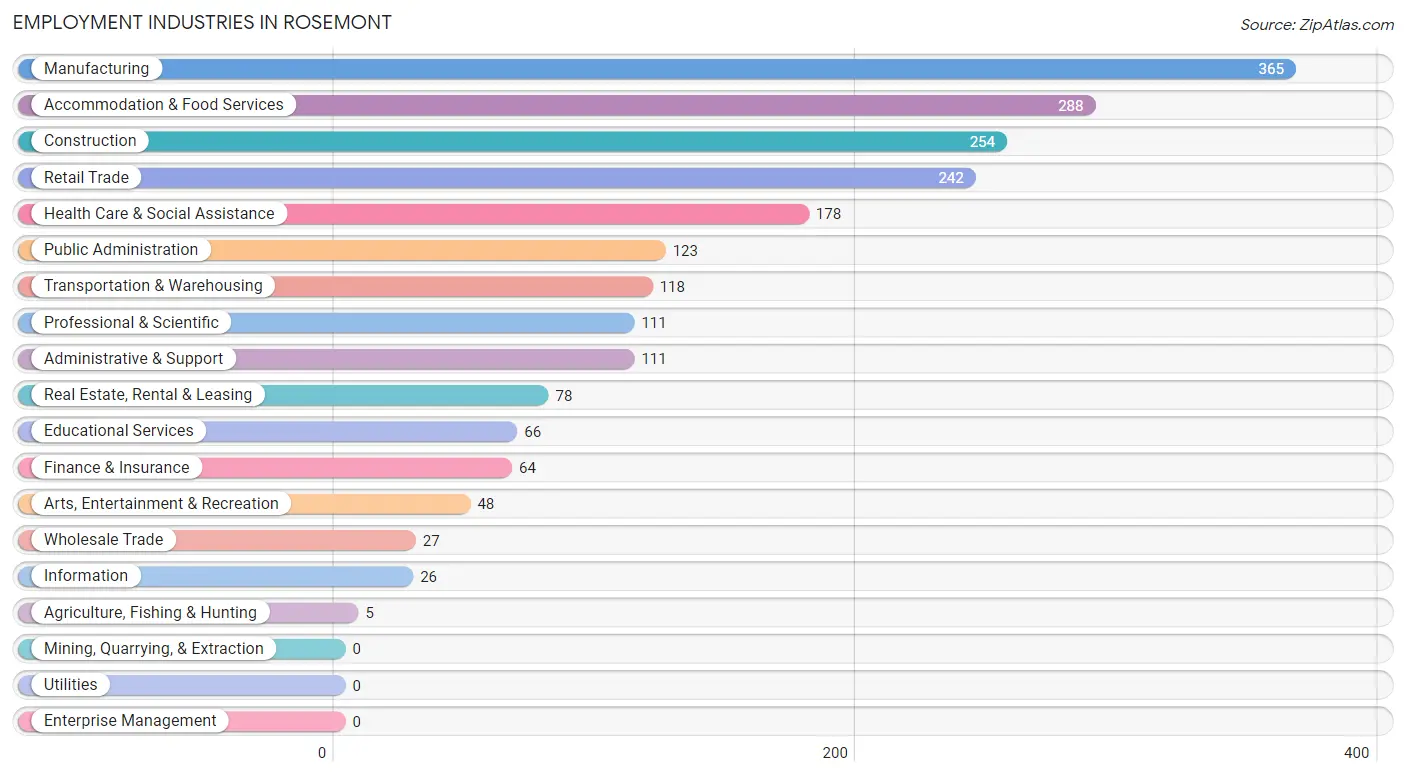
Employment Industries in Rosemont
The major employment industries in Rosemont include Manufacturing (365 | 17.1%), Accommodation & Food Services (288 | 13.5%), Construction (254 | 11.9%), Retail Trade (242 | 11.3%), and Health Care & Social Assistance (178 | 8.3%).
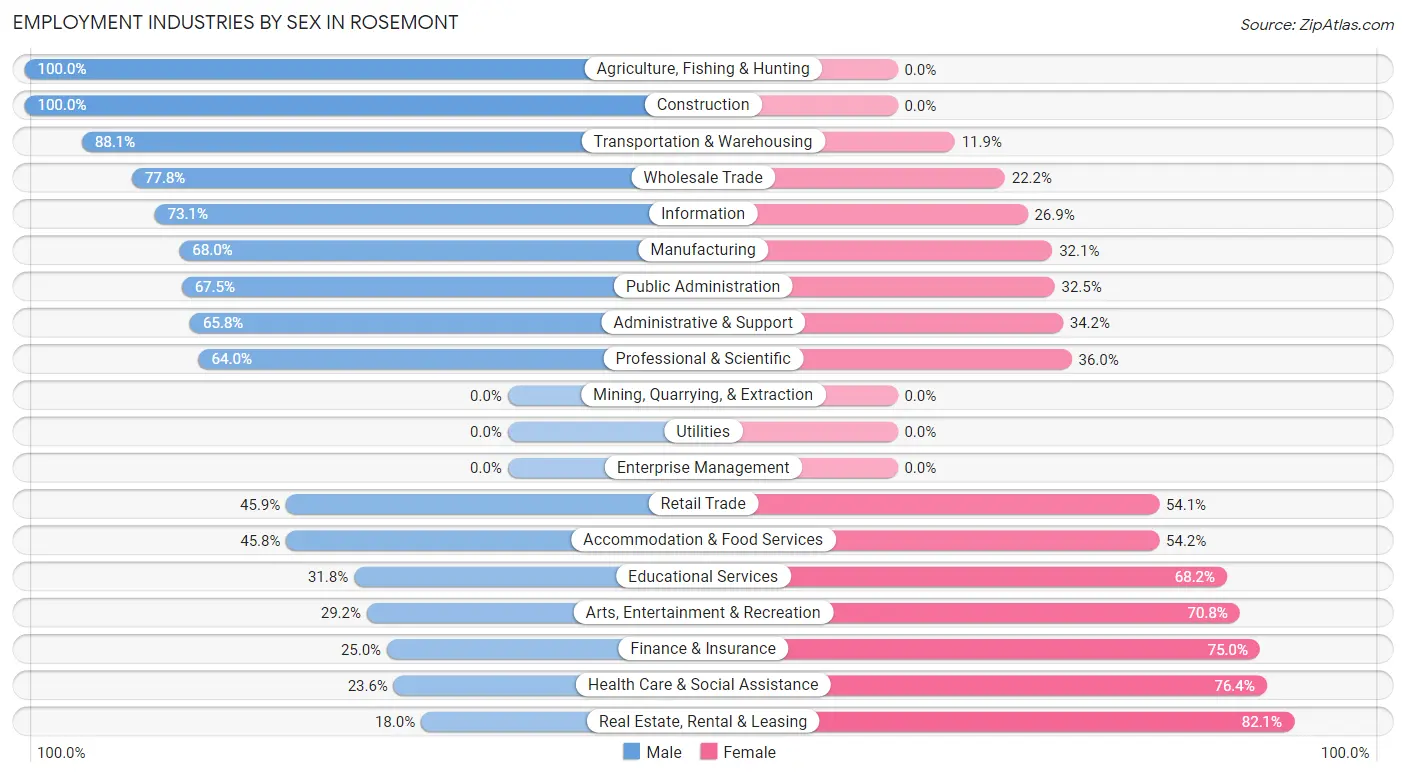
Employment Industries by Sex in Rosemont
The Rosemont industries that see more men than women are Agriculture, Fishing & Hunting (100.0%), Construction (100.0%), and Transportation & Warehousing (88.1%), whereas the industries that tend to have a higher number of women are Real Estate, Rental & Leasing (82.1%), Health Care & Social Assistance (76.4%), and Finance & Insurance (75.0%).
| Industry | Male | Female |
| Agriculture, Fishing & Hunting | 5 (100.0%) | 0 (0.0%) |
| Mining, Quarrying, & Extraction | 0 (0.0%) | 0 (0.0%) |
| Construction | 254 (100.0%) | 0 (0.0%) |
| Manufacturing | 248 (67.9%) | 117 (32.1%) |
| Wholesale Trade | 21 (77.8%) | 6 (22.2%) |
| Retail Trade | 111 (45.9%) | 131 (54.1%) |
| Transportation & Warehousing | 104 (88.1%) | 14 (11.9%) |
| Utilities | 0 (0.0%) | 0 (0.0%) |
| Information | 19 (73.1%) | 7 (26.9%) |
| Finance & Insurance | 16 (25.0%) | 48 (75.0%) |
| Real Estate, Rental & Leasing | 14 (17.9%) | 64 (82.1%) |
| Professional & Scientific | 71 (64.0%) | 40 (36.0%) |
| Enterprise Management | 0 (0.0%) | 0 (0.0%) |
| Administrative & Support | 73 (65.8%) | 38 (34.2%) |
| Educational Services | 21 (31.8%) | 45 (68.2%) |
| Health Care & Social Assistance | 42 (23.6%) | 136 (76.4%) |
| Arts, Entertainment & Recreation | 14 (29.2%) | 34 (70.8%) |
| Accommodation & Food Services | 132 (45.8%) | 156 (54.2%) |
| Public Administration | 83 (67.5%) | 40 (32.5%) |
| Total | 1,243 (58.3%) | 891 (41.7%) |
Education in Rosemont
School Enrollment in Rosemont
The most common levels of schooling among the 773 students in Rosemont are high school (295 | 38.2%), middle school (175 | 22.6%), and college / undergraduate (126 | 16.3%).
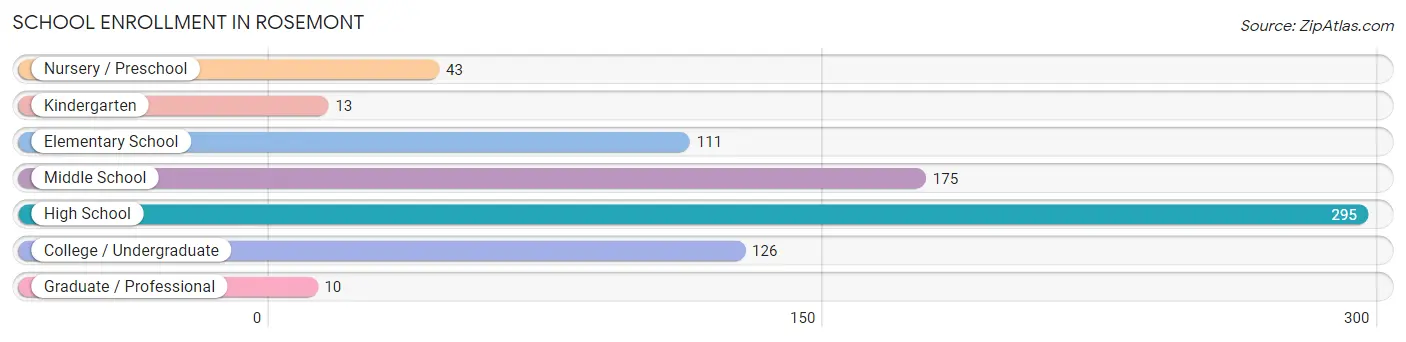
| School Level | # Students | % Students |
| Nursery / Preschool | 43 | 5.6% |
| Kindergarten | 13 | 1.7% |
| Elementary School | 111 | 14.4% |
| Middle School | 175 | 22.6% |
| High School | 295 | 38.2% |
| College / Undergraduate | 126 | 16.3% |
| Graduate / Professional | 10 | 1.3% |
| Total | 773 | 100.0% |
School Enrollment by Age by Funding Source in Rosemont
Out of a total of 773 students who are enrolled in schools in Rosemont, 39 (5.0%) attend a private institution, while the remaining 734 (95.0%) are enrolled in public schools. The age group of 25 to 34 year olds has the highest likelihood of being enrolled in private schools, with 12 (29.3% in the age bracket) enrolled. Conversely, the age group of 3 to 4 year olds has the lowest likelihood of being enrolled in a private school, with 16 (100.0% in the age bracket) attending a public institution.
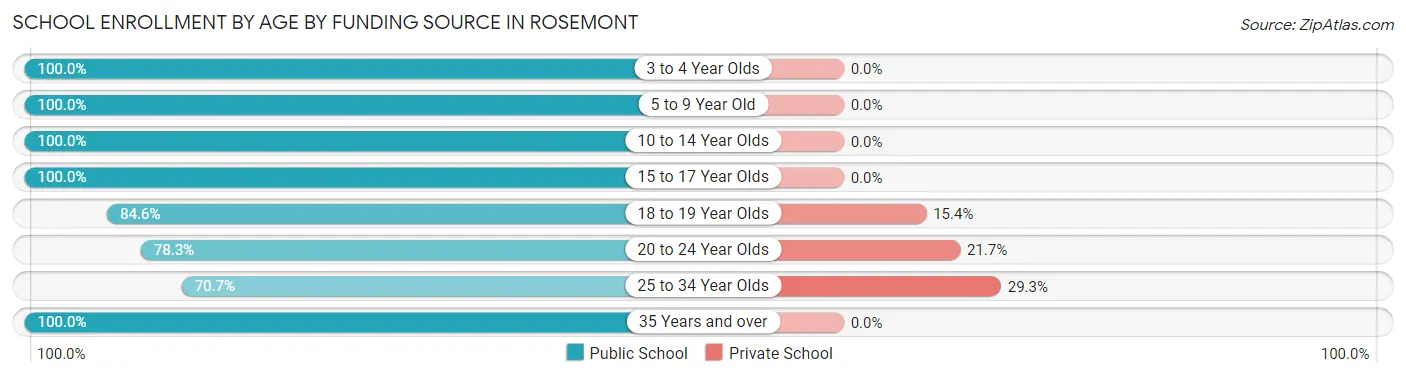
| Age Bracket | Public School | Private School |
| 3 to 4 Year Olds | 16 (100.0%) | 0 (0.0%) |
| 5 to 9 Year Old | 167 (100.0%) | 0 (0.0%) |
| 10 to 14 Year Olds | 165 (100.0%) | 0 (0.0%) |
| 15 to 17 Year Olds | 198 (100.0%) | 0 (0.0%) |
| 18 to 19 Year Olds | 77 (84.6%) | 14 (15.4%) |
| 20 to 24 Year Olds | 47 (78.3%) | 13 (21.7%) |
| 25 to 34 Year Olds | 29 (70.7%) | 12 (29.3%) |
| 35 Years and over | 35 (100.0%) | 0 (0.0%) |
| Total | 734 (95.0%) | 39 (5.0%) |
Educational Attainment by Field of Study in Rosemont
Business (182 | 27.7%), social sciences (106 | 16.1%), science & technology (99 | 15.1%), education (80 | 12.2%), and arts & humanities (38 | 5.8%) are the most common fields of study among 657 individuals in Rosemont who have obtained a bachelor's degree or higher.
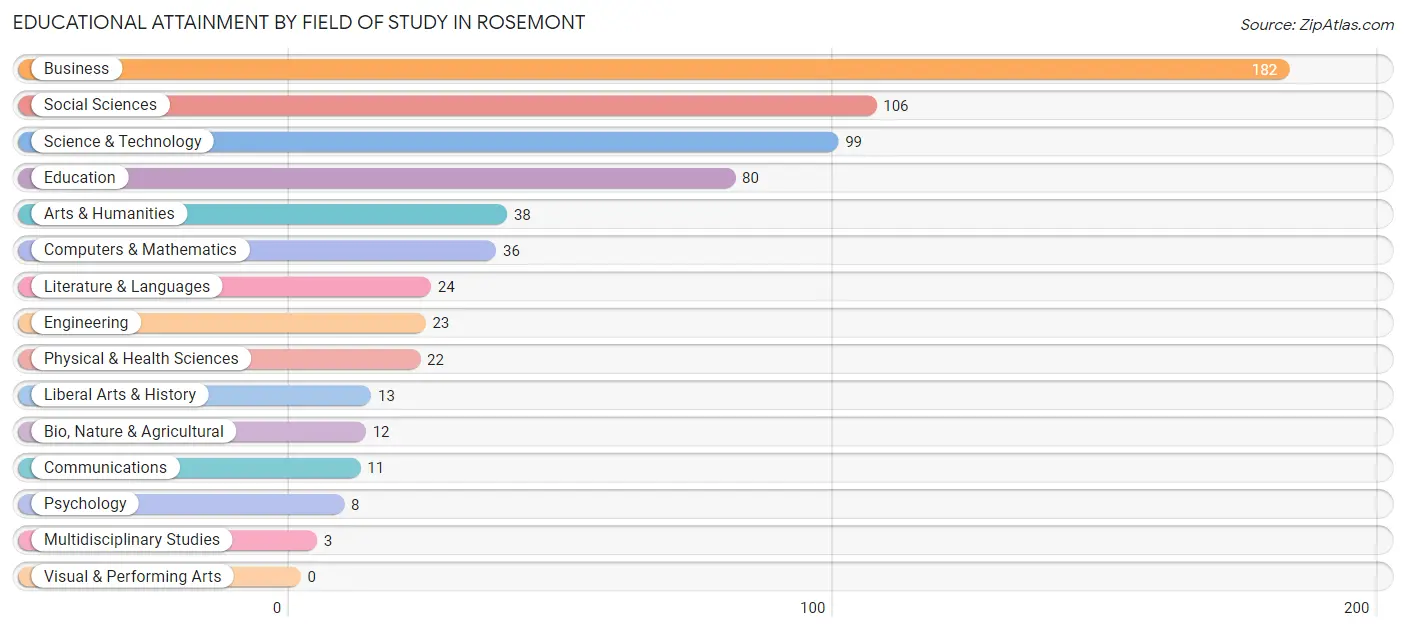
| Field of Study | # Graduates | % Graduates |
| Computers & Mathematics | 36 | 5.5% |
| Bio, Nature & Agricultural | 12 | 1.8% |
| Physical & Health Sciences | 22 | 3.4% |
| Psychology | 8 | 1.2% |
| Social Sciences | 106 | 16.1% |
| Engineering | 23 | 3.5% |
| Multidisciplinary Studies | 3 | 0.5% |
| Science & Technology | 99 | 15.1% |
| Business | 182 | 27.7% |
| Education | 80 | 12.2% |
| Literature & Languages | 24 | 3.6% |
| Liberal Arts & History | 13 | 2.0% |
| Visual & Performing Arts | 0 | 0.0% |
| Communications | 11 | 1.7% |
| Arts & Humanities | 38 | 5.8% |
| Total | 657 | 100.0% |
Transportation & Commute in Rosemont
Vehicle Availability by Sex in Rosemont
The most prevalent vehicle ownership categories in Rosemont are males with 1 vehicle (623, accounting for 50.1%) and females with 1 vehicle (362, making up 74.7%).
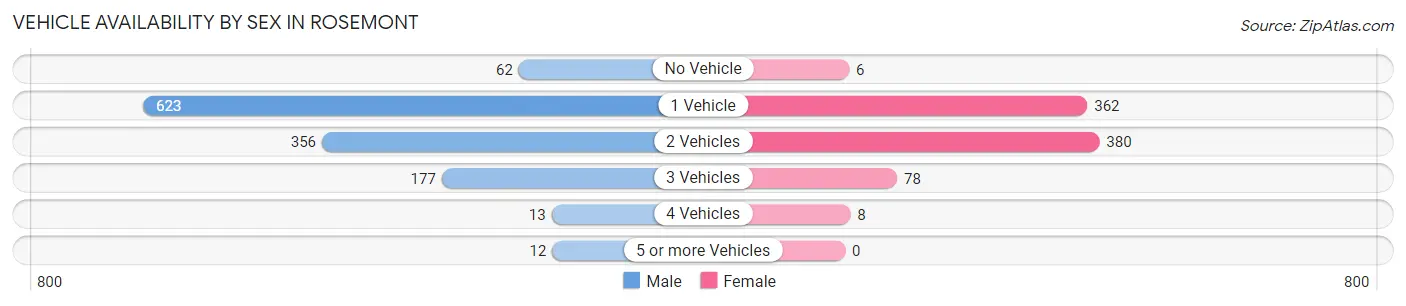
| Vehicles Available | Male | Female |
| No Vehicle | 62 (5.0%) | 6 (0.7%) |
| 1 Vehicle | 623 (50.1%) | 362 (43.4%) |
| 2 Vehicles | 356 (28.6%) | 380 (45.6%) |
| 3 Vehicles | 177 (14.2%) | 78 (9.3%) |
| 4 Vehicles | 13 (1.1%) | 8 (1.0%) |
| 5 or more Vehicles | 12 (1.0%) | 0 (0.0%) |
| Total | 1,243 (100.0%) | 834 (100.0%) |
Commute Time in Rosemont
The most frequently occuring commute durations in Rosemont are 15 to 19 minutes (404 commuters, 20.0%), 10 to 14 minutes (295 commuters, 14.6%), and 30 to 34 minutes (261 commuters, 13.0%).
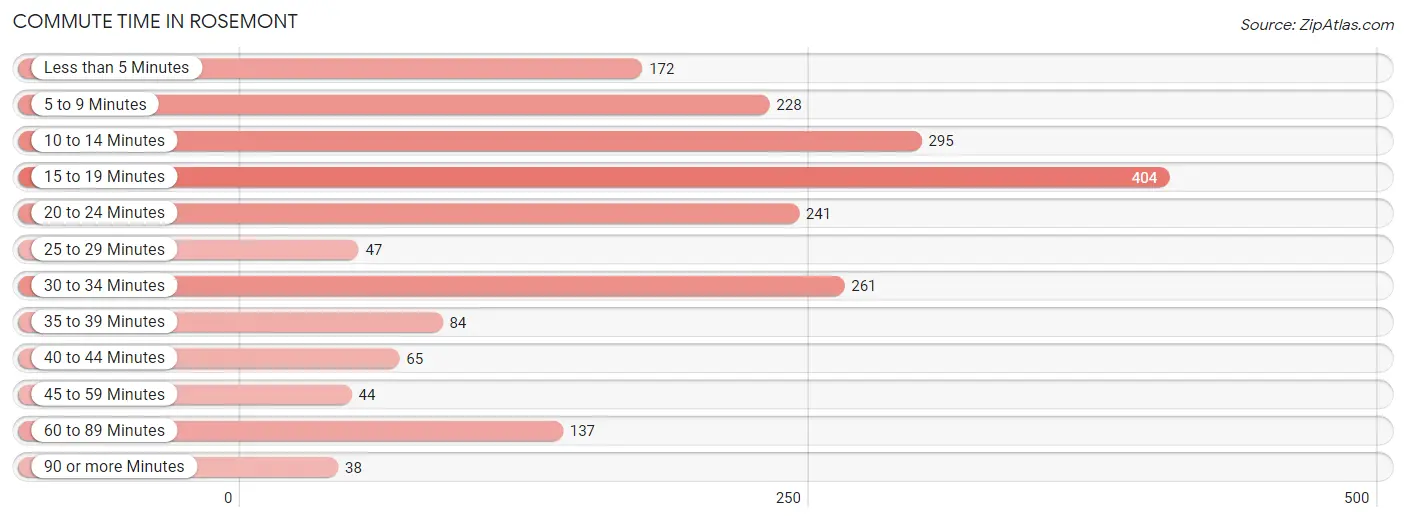
| Commute Time | # Commuters | % Commuters |
| Less than 5 Minutes | 172 | 8.5% |
| 5 to 9 Minutes | 228 | 11.3% |
| 10 to 14 Minutes | 295 | 14.6% |
| 15 to 19 Minutes | 404 | 20.0% |
| 20 to 24 Minutes | 241 | 11.9% |
| 25 to 29 Minutes | 47 | 2.3% |
| 30 to 34 Minutes | 261 | 13.0% |
| 35 to 39 Minutes | 84 | 4.2% |
| 40 to 44 Minutes | 65 | 3.2% |
| 45 to 59 Minutes | 44 | 2.2% |
| 60 to 89 Minutes | 137 | 6.8% |
| 90 or more Minutes | 38 | 1.9% |
Commute Time by Sex in Rosemont
The most common commute times in Rosemont are 15 to 19 minutes (288 commuters, 23.2%) for males and 20 to 24 minutes (156 commuters, 20.1%) for females.
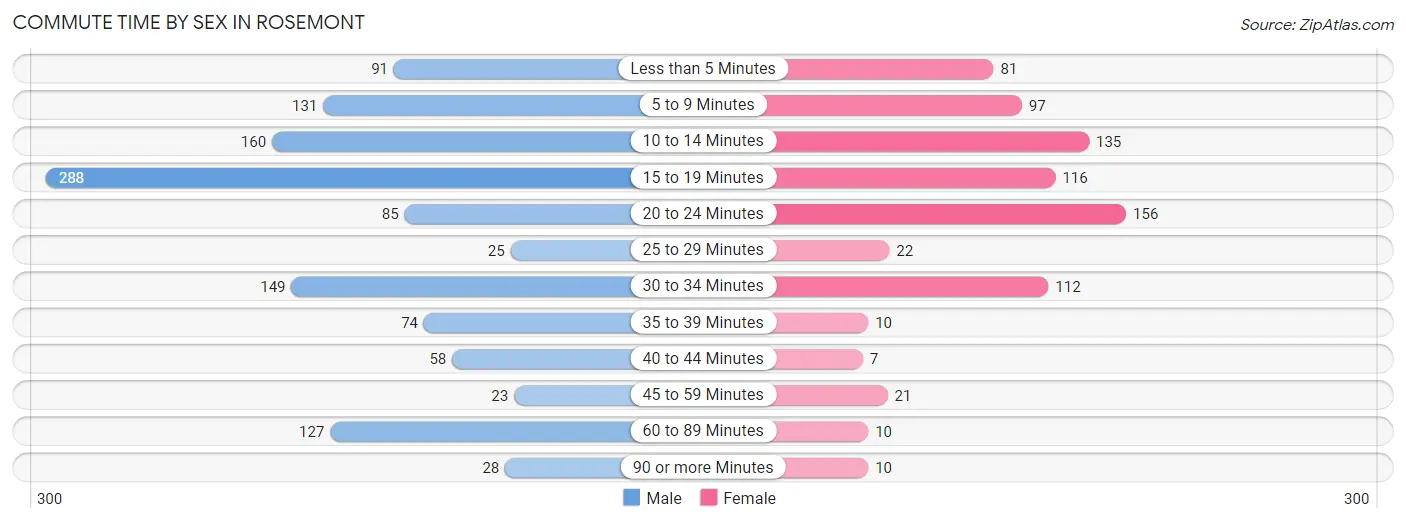
| Commute Time | Male | Female |
| Less than 5 Minutes | 91 (7.3%) | 81 (10.4%) |
| 5 to 9 Minutes | 131 (10.6%) | 97 (12.5%) |
| 10 to 14 Minutes | 160 (12.9%) | 135 (17.4%) |
| 15 to 19 Minutes | 288 (23.2%) | 116 (14.9%) |
| 20 to 24 Minutes | 85 (6.9%) | 156 (20.1%) |
| 25 to 29 Minutes | 25 (2.0%) | 22 (2.8%) |
| 30 to 34 Minutes | 149 (12.0%) | 112 (14.4%) |
| 35 to 39 Minutes | 74 (6.0%) | 10 (1.3%) |
| 40 to 44 Minutes | 58 (4.7%) | 7 (0.9%) |
| 45 to 59 Minutes | 23 (1.9%) | 21 (2.7%) |
| 60 to 89 Minutes | 127 (10.2%) | 10 (1.3%) |
| 90 or more Minutes | 28 (2.3%) | 10 (1.3%) |
Time of Departure to Work by Sex in Rosemont
The most frequent times of departure to work in Rosemont are 7:00 AM to 7:29 AM (294, 23.7%) for males and 7:00 AM to 7:29 AM (197, 25.4%) for females.
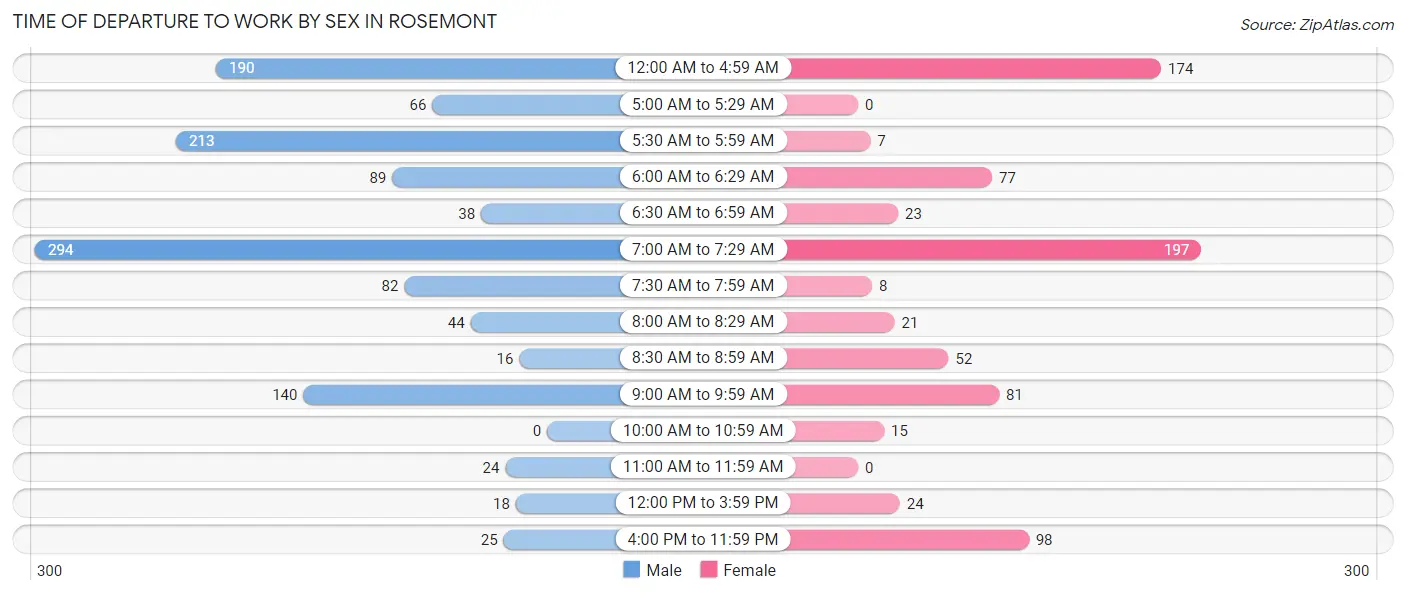
| Time of Departure | Male | Female |
| 12:00 AM to 4:59 AM | 190 (15.3%) | 174 (22.4%) |
| 5:00 AM to 5:29 AM | 66 (5.3%) | 0 (0.0%) |
| 5:30 AM to 5:59 AM | 213 (17.2%) | 7 (0.9%) |
| 6:00 AM to 6:29 AM | 89 (7.2%) | 77 (9.9%) |
| 6:30 AM to 6:59 AM | 38 (3.1%) | 23 (3.0%) |
| 7:00 AM to 7:29 AM | 294 (23.7%) | 197 (25.4%) |
| 7:30 AM to 7:59 AM | 82 (6.6%) | 8 (1.0%) |
| 8:00 AM to 8:29 AM | 44 (3.5%) | 21 (2.7%) |
| 8:30 AM to 8:59 AM | 16 (1.3%) | 52 (6.7%) |
| 9:00 AM to 9:59 AM | 140 (11.3%) | 81 (10.4%) |
| 10:00 AM to 10:59 AM | 0 (0.0%) | 15 (1.9%) |
| 11:00 AM to 11:59 AM | 24 (1.9%) | 0 (0.0%) |
| 12:00 PM to 3:59 PM | 18 (1.5%) | 24 (3.1%) |
| 4:00 PM to 11:59 PM | 25 (2.0%) | 98 (12.6%) |
| Total | 1,239 (100.0%) | 777 (100.0%) |
Housing Occupancy in Rosemont
Occupancy by Ownership in Rosemont
Of the total 1,582 dwellings in Rosemont, owner-occupied units account for 350 (22.1%), while renter-occupied units make up 1,232 (77.9%).
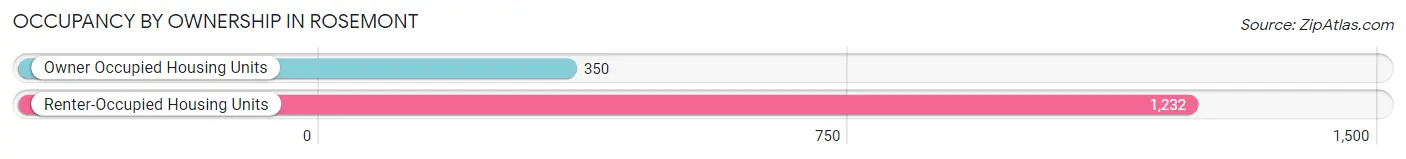
| Occupancy | # Housing Units | % Housing Units |
| Owner Occupied Housing Units | 350 | 22.1% |
| Renter-Occupied Housing Units | 1,232 | 77.9% |
| Total Occupied Housing Units | 1,582 | 100.0% |
Occupancy by Household Size in Rosemont
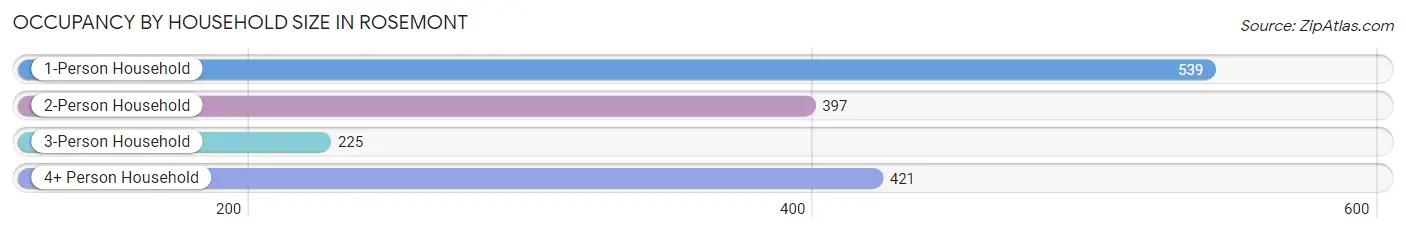
| Household Size | # Housing Units | % Housing Units |
| 1-Person Household | 539 | 34.1% |
| 2-Person Household | 397 | 25.1% |
| 3-Person Household | 225 | 14.2% |
| 4+ Person Household | 421 | 26.6% |
| Total Housing Units | 1,582 | 100.0% |
Occupancy by Ownership by Household Size in Rosemont
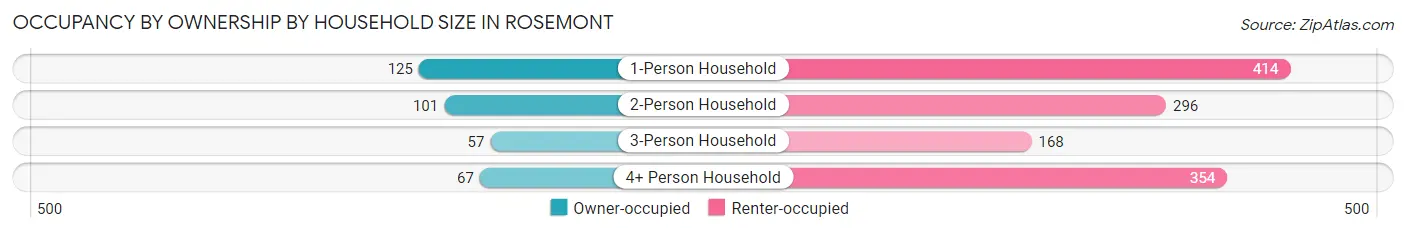
| Household Size | Owner-occupied | Renter-occupied |
| 1-Person Household | 125 (23.2%) | 414 (76.8%) |
| 2-Person Household | 101 (25.4%) | 296 (74.6%) |
| 3-Person Household | 57 (25.3%) | 168 (74.7%) |
| 4+ Person Household | 67 (15.9%) | 354 (84.1%) |
| Total Housing Units | 350 (22.1%) | 1,232 (77.9%) |
Occupancy by Educational Attainment in Rosemont
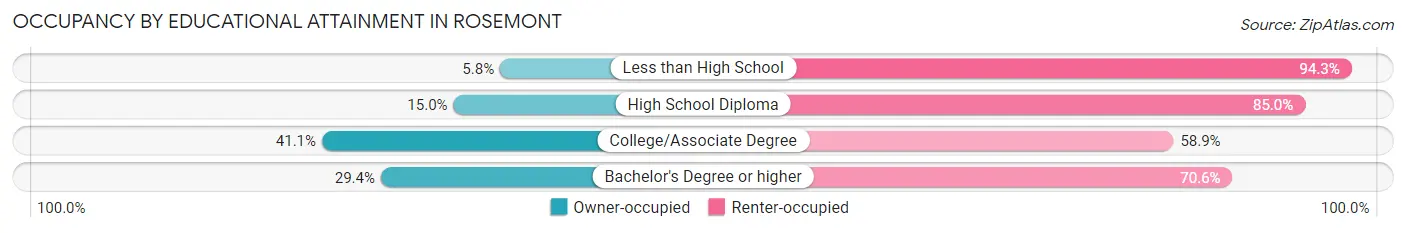
| Household Size | Owner-occupied | Renter-occupied |
| Less than High School | 18 (5.8%) | 295 (94.3%) |
| High School Diploma | 86 (15.0%) | 488 (85.0%) |
| College/Associate Degree | 147 (41.1%) | 211 (58.9%) |
| Bachelor's Degree or higher | 99 (29.4%) | 238 (70.6%) |
Occupancy by Age of Householder in Rosemont
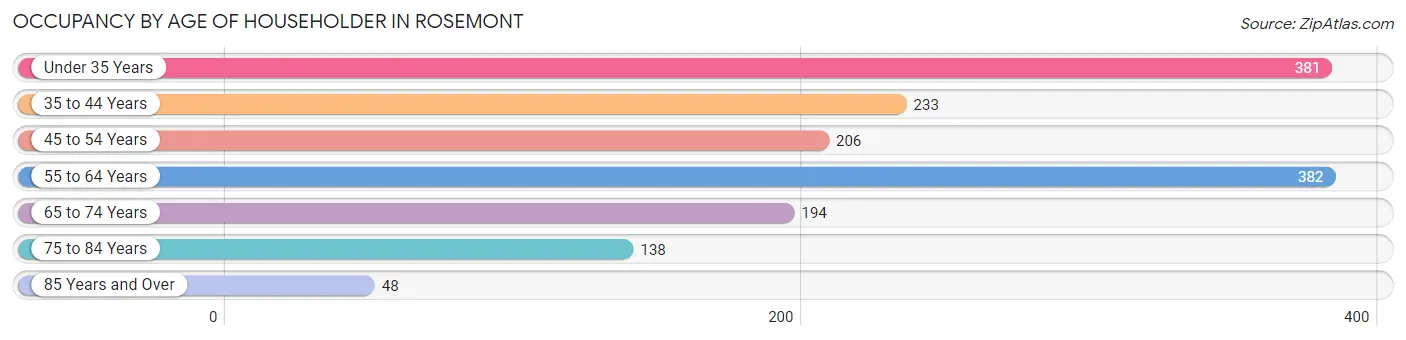
| Age Bracket | # Households | % Households |
| Under 35 Years | 381 | 24.1% |
| 35 to 44 Years | 233 | 14.7% |
| 45 to 54 Years | 206 | 13.0% |
| 55 to 64 Years | 382 | 24.1% |
| 65 to 74 Years | 194 | 12.3% |
| 75 to 84 Years | 138 | 8.7% |
| 85 Years and Over | 48 | 3.0% |
| Total | 1,582 | 100.0% |
Housing Finances in Rosemont
Median Income by Occupancy in Rosemont
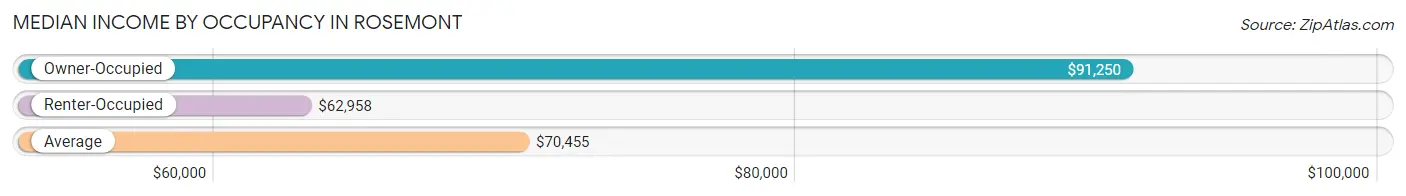
| Occupancy Type | # Households | Median Income |
| Owner-Occupied | 350 (22.1%) | $91,250 |
| Renter-Occupied | 1,232 (77.9%) | $62,958 |
| Average | 1,582 (100.0%) | $70,455 |
Occupancy by Householder Income Bracket in Rosemont
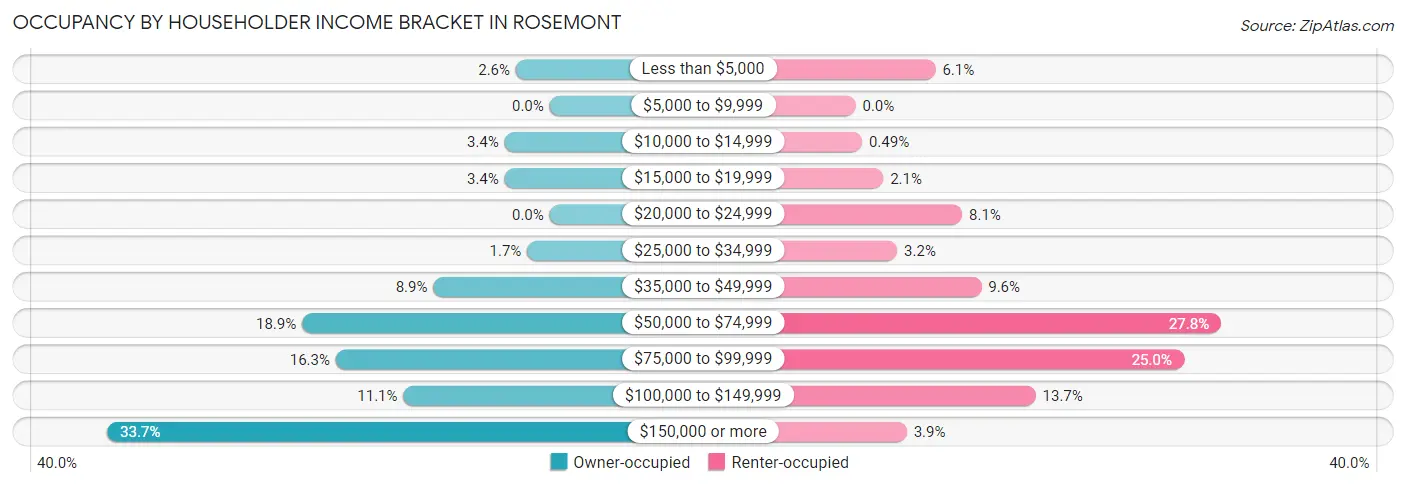
| Income Bracket | Owner-occupied | Renter-occupied |
| Less than $5,000 | 9 (2.6%) | 75 (6.1%) |
| $5,000 to $9,999 | 0 (0.0%) | 0 (0.0%) |
| $10,000 to $14,999 | 12 (3.4%) | 6 (0.5%) |
| $15,000 to $19,999 | 12 (3.4%) | 26 (2.1%) |
| $20,000 to $24,999 | 0 (0.0%) | 100 (8.1%) |
| $25,000 to $34,999 | 6 (1.7%) | 39 (3.2%) |
| $35,000 to $49,999 | 31 (8.9%) | 118 (9.6%) |
| $50,000 to $74,999 | 66 (18.9%) | 343 (27.8%) |
| $75,000 to $99,999 | 57 (16.3%) | 308 (25.0%) |
| $100,000 to $149,999 | 39 (11.1%) | 169 (13.7%) |
| $150,000 or more | 118 (33.7%) | 48 (3.9%) |
| Total | 350 (100.0%) | 1,232 (100.0%) |
Monthly Housing Cost Tiers in Rosemont
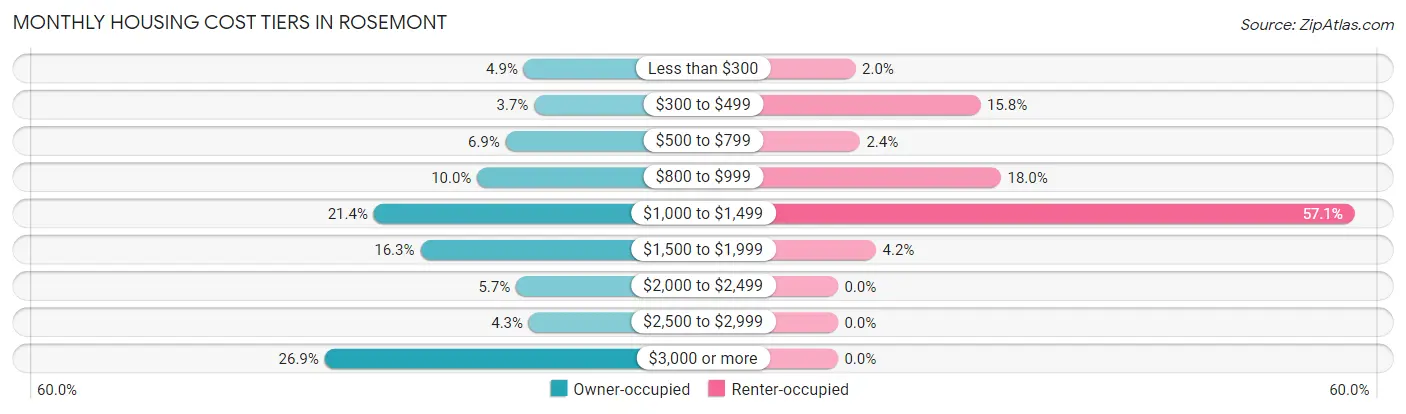
| Monthly Cost | Owner-occupied | Renter-occupied |
| Less than $300 | 17 (4.9%) | 24 (1.9%) |
| $300 to $499 | 13 (3.7%) | 194 (15.8%) |
| $500 to $799 | 24 (6.9%) | 30 (2.4%) |
| $800 to $999 | 35 (10.0%) | 222 (18.0%) |
| $1,000 to $1,499 | 75 (21.4%) | 704 (57.1%) |
| $1,500 to $1,999 | 57 (16.3%) | 52 (4.2%) |
| $2,000 to $2,499 | 20 (5.7%) | 0 (0.0%) |
| $2,500 to $2,999 | 15 (4.3%) | 0 (0.0%) |
| $3,000 or more | 94 (26.9%) | 0 (0.0%) |
| Total | 350 (100.0%) | 1,232 (100.0%) |
Physical Housing Characteristics in Rosemont
Housing Structures in Rosemont
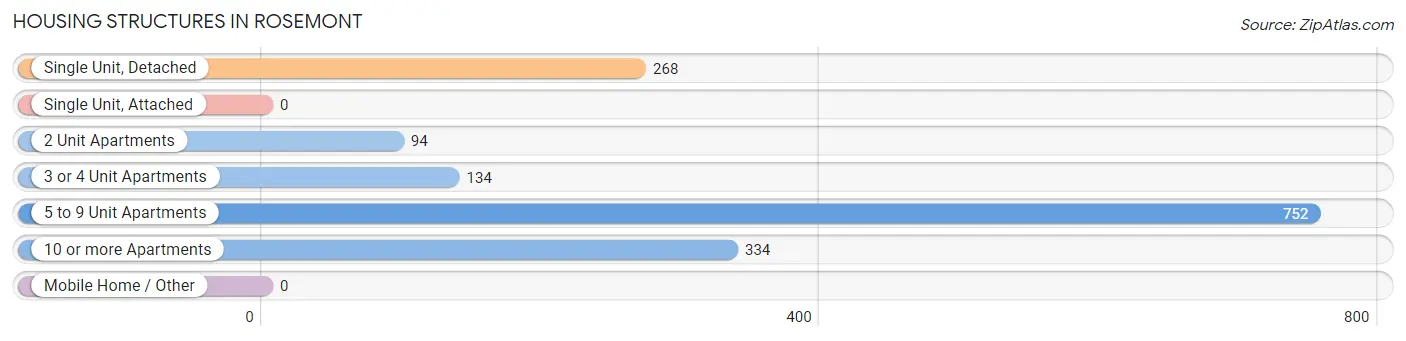
| Structure Type | # Housing Units | % Housing Units |
| Single Unit, Detached | 268 | 16.9% |
| Single Unit, Attached | 0 | 0.0% |
| 2 Unit Apartments | 94 | 5.9% |
| 3 or 4 Unit Apartments | 134 | 8.5% |
| 5 to 9 Unit Apartments | 752 | 47.5% |
| 10 or more Apartments | 334 | 21.1% |
| Mobile Home / Other | 0 | 0.0% |
| Total | 1,582 | 100.0% |
Housing Structures by Occupancy in Rosemont
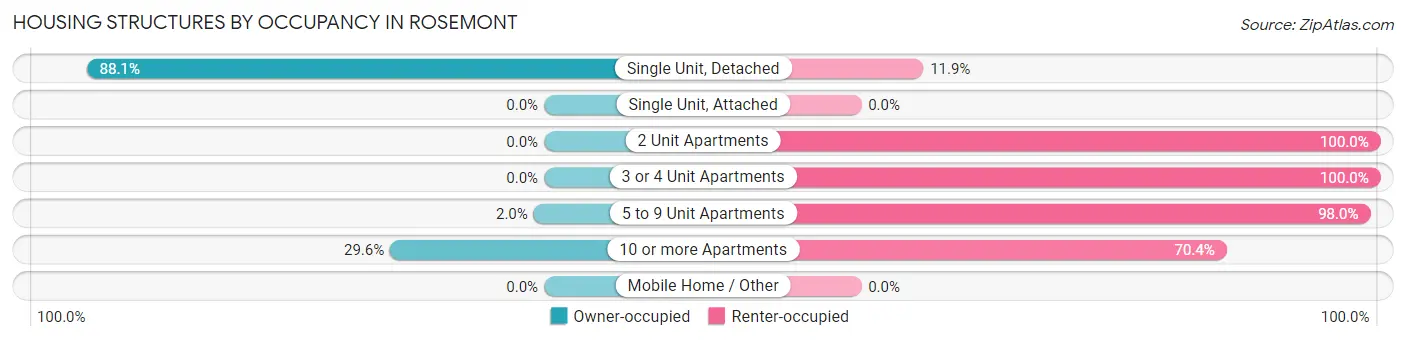
| Structure Type | Owner-occupied | Renter-occupied |
| Single Unit, Detached | 236 (88.1%) | 32 (11.9%) |
| Single Unit, Attached | 0 (0.0%) | 0 (0.0%) |
| 2 Unit Apartments | 0 (0.0%) | 94 (100.0%) |
| 3 or 4 Unit Apartments | 0 (0.0%) | 134 (100.0%) |
| 5 to 9 Unit Apartments | 15 (2.0%) | 737 (98.0%) |
| 10 or more Apartments | 99 (29.6%) | 235 (70.4%) |
| Mobile Home / Other | 0 (0.0%) | 0 (0.0%) |
| Total | 350 (22.1%) | 1,232 (77.9%) |
Housing Structures by Number of Rooms in Rosemont
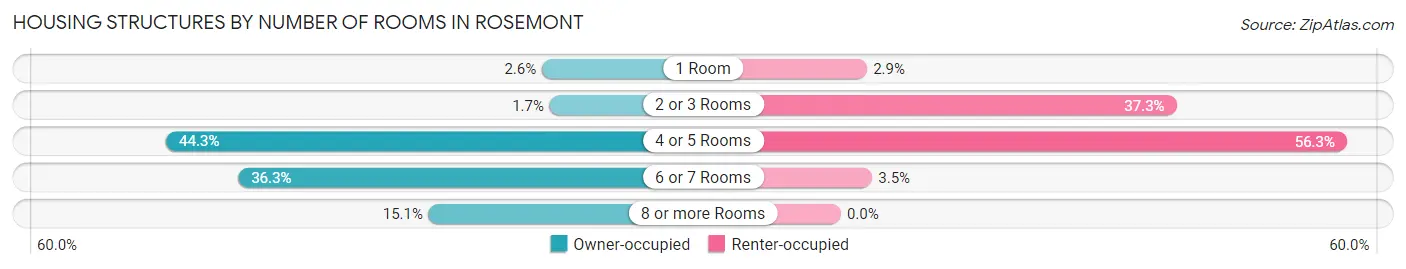
| Number of Rooms | Owner-occupied | Renter-occupied |
| 1 Room | 9 (2.6%) | 36 (2.9%) |
| 2 or 3 Rooms | 6 (1.7%) | 460 (37.3%) |
| 4 or 5 Rooms | 155 (44.3%) | 693 (56.2%) |
| 6 or 7 Rooms | 127 (36.3%) | 43 (3.5%) |
| 8 or more Rooms | 53 (15.1%) | 0 (0.0%) |
| Total | 350 (100.0%) | 1,232 (100.0%) |
Housing Structure by Heating Type in Rosemont
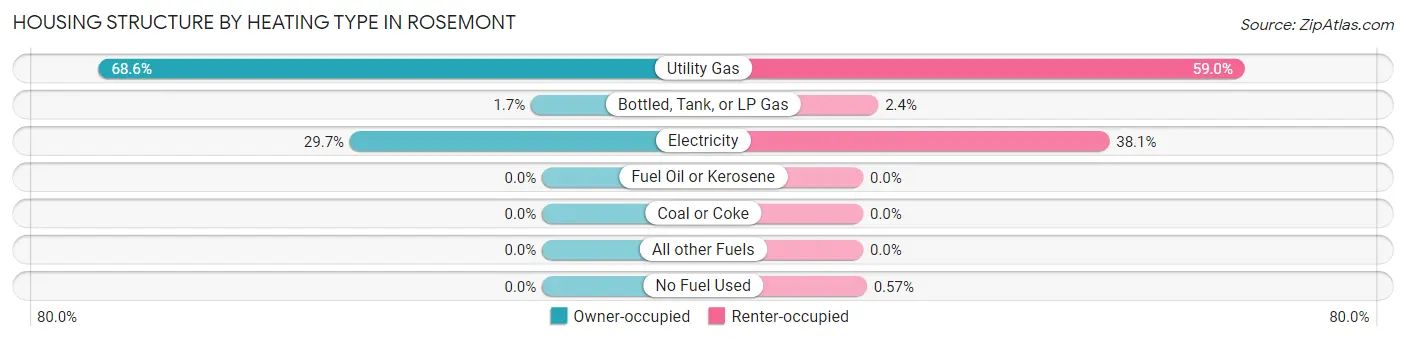
| Heating Type | Owner-occupied | Renter-occupied |
| Utility Gas | 240 (68.6%) | 727 (59.0%) |
| Bottled, Tank, or LP Gas | 6 (1.7%) | 29 (2.4%) |
| Electricity | 104 (29.7%) | 469 (38.1%) |
| Fuel Oil or Kerosene | 0 (0.0%) | 0 (0.0%) |
| Coal or Coke | 0 (0.0%) | 0 (0.0%) |
| All other Fuels | 0 (0.0%) | 0 (0.0%) |
| No Fuel Used | 0 (0.0%) | 7 (0.6%) |
| Total | 350 (100.0%) | 1,232 (100.0%) |
Household Vehicle Usage in Rosemont
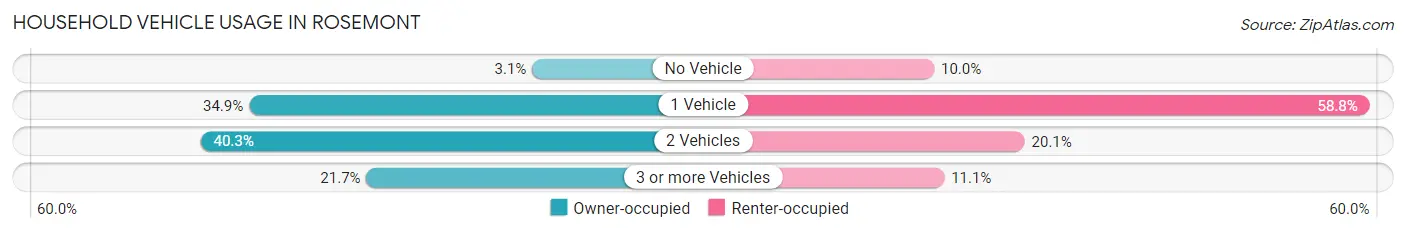
| Vehicles per Household | Owner-occupied | Renter-occupied |
| No Vehicle | 11 (3.1%) | 123 (10.0%) |
| 1 Vehicle | 122 (34.9%) | 724 (58.8%) |
| 2 Vehicles | 141 (40.3%) | 248 (20.1%) |
| 3 or more Vehicles | 76 (21.7%) | 137 (11.1%) |
| Total | 350 (100.0%) | 1,232 (100.0%) |
Real Estate & Mortgages in Rosemont
Real Estate and Mortgage Overview in Rosemont
| Characteristic | Without Mortgage | With Mortgage |
| Housing Units | 117 | 233 |
| Median Property Value | $352,300 | $428,400 |
| Median Household Income | $52,031 | $103 |
| Monthly Housing Costs | $919 | $94 |
| Real Estate Taxes | $8,050 | $0 |
Property Value by Mortgage Status in Rosemont
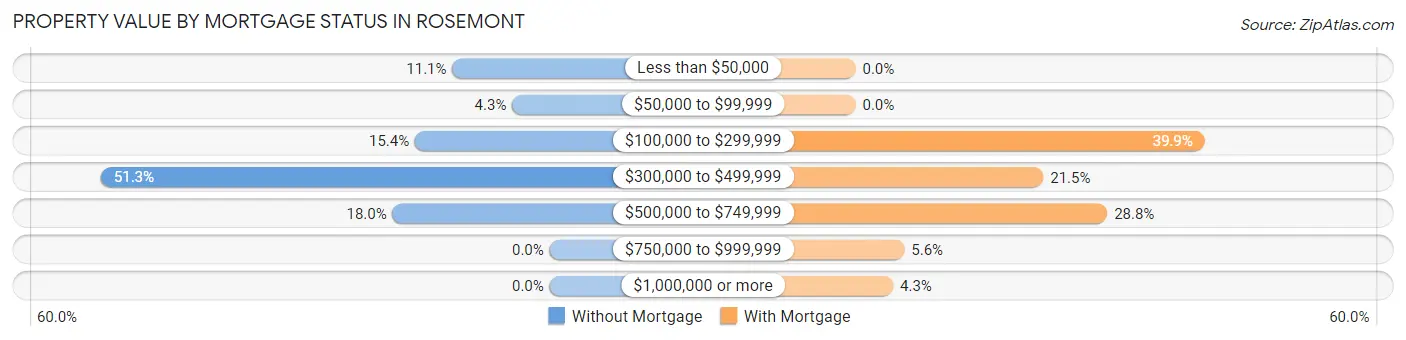
| Property Value | Without Mortgage | With Mortgage |
| Less than $50,000 | 13 (11.1%) | 0 (0.0%) |
| $50,000 to $99,999 | 5 (4.3%) | 0 (0.0%) |
| $100,000 to $299,999 | 18 (15.4%) | 93 (39.9%) |
| $300,000 to $499,999 | 60 (51.3%) | 50 (21.5%) |
| $500,000 to $749,999 | 21 (17.9%) | 67 (28.8%) |
| $750,000 to $999,999 | 0 (0.0%) | 13 (5.6%) |
| $1,000,000 or more | 0 (0.0%) | 10 (4.3%) |
| Total | 117 (100.0%) | 233 (100.0%) |
Household Income by Mortgage Status in Rosemont
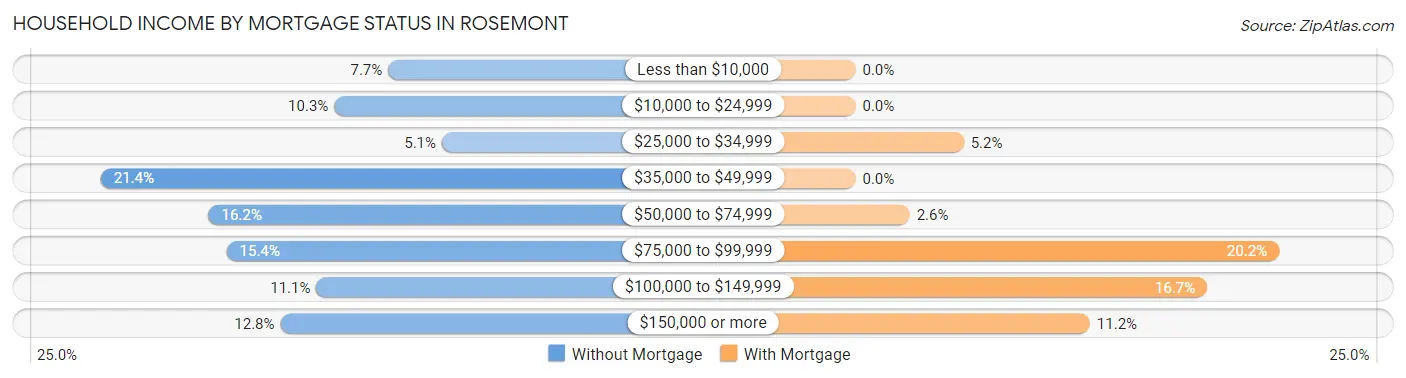
| Household Income | Without Mortgage | With Mortgage |
| Less than $10,000 | 9 (7.7%) | 0 (0.0%) |
| $10,000 to $24,999 | 12 (10.3%) | 0 (0.0%) |
| $25,000 to $34,999 | 6 (5.1%) | 12 (5.1%) |
| $35,000 to $49,999 | 25 (21.4%) | 0 (0.0%) |
| $50,000 to $74,999 | 19 (16.2%) | 6 (2.6%) |
| $75,000 to $99,999 | 18 (15.4%) | 47 (20.2%) |
| $100,000 to $149,999 | 13 (11.1%) | 39 (16.7%) |
| $150,000 or more | 15 (12.8%) | 26 (11.2%) |
| Total | 117 (100.0%) | 233 (100.0%) |
Property Value to Household Income Ratio in Rosemont
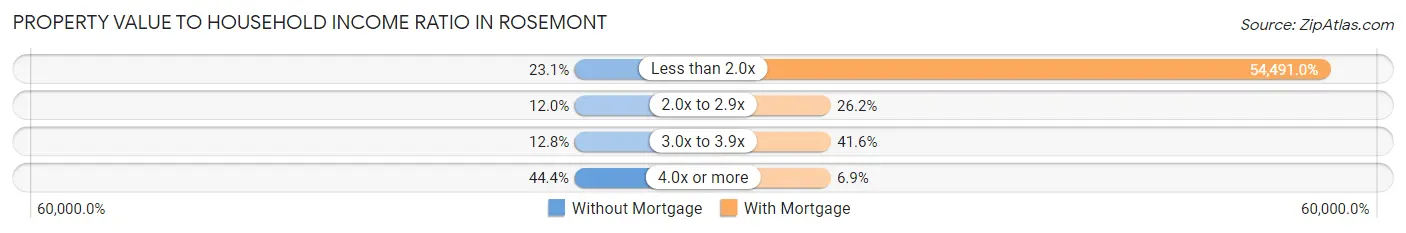
| Value-to-Income Ratio | Without Mortgage | With Mortgage |
| Less than 2.0x | 27 (23.1%) | 126,964 (54,491.0%) |
| 2.0x to 2.9x | 14 (12.0%) | 61 (26.2%) |
| 3.0x to 3.9x | 15 (12.8%) | 97 (41.6%) |
| 4.0x or more | 52 (44.4%) | 16 (6.9%) |
| Total | 117 (100.0%) | 233 (100.0%) |
Real Estate Taxes by Mortgage Status in Rosemont
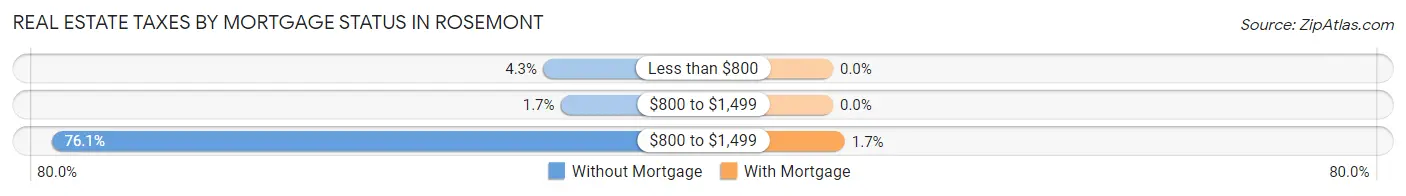
| Property Taxes | Without Mortgage | With Mortgage |
| Less than $800 | 5 (4.3%) | 0 (0.0%) |
| $800 to $1,499 | 2 (1.7%) | 0 (0.0%) |
| $800 to $1,499 | 89 (76.1%) | 4 (1.7%) |
| Total | 117 (100.0%) | 233 (100.0%) |
Health & Disability in Rosemont
Health Insurance Coverage by Age in Rosemont
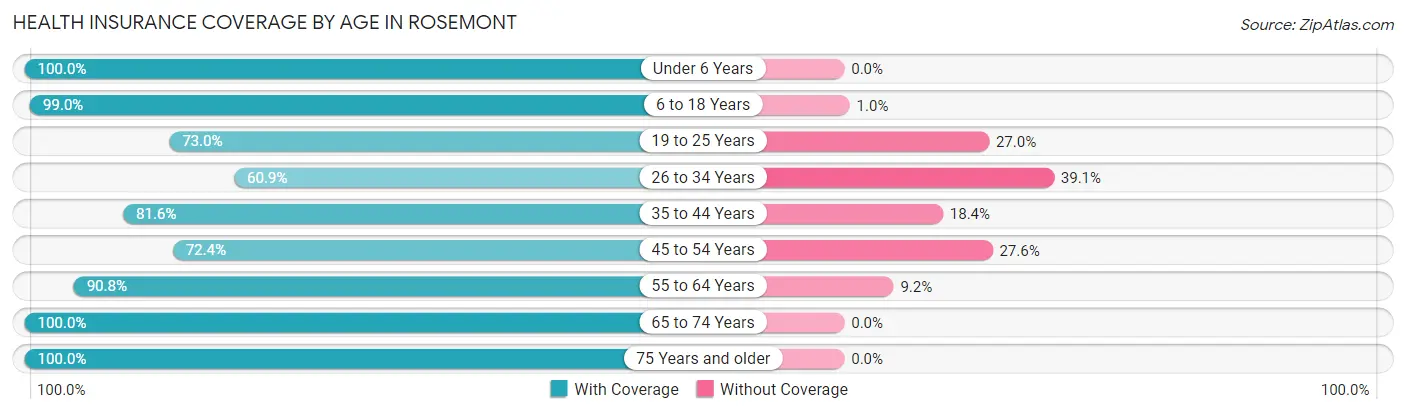
| Age Bracket | With Coverage | Without Coverage |
| Under 6 Years | 204 (100.0%) | 0 (0.0%) |
| 6 to 18 Years | 594 (99.0%) | 6 (1.0%) |
| 19 to 25 Years | 276 (73.0%) | 102 (27.0%) |
| 26 to 34 Years | 265 (60.9%) | 170 (39.1%) |
| 35 to 44 Years | 413 (81.6%) | 93 (18.4%) |
| 45 to 54 Years | 440 (72.4%) | 168 (27.6%) |
| 55 to 64 Years | 555 (90.8%) | 56 (9.2%) |
| 65 to 74 Years | 294 (100.0%) | 0 (0.0%) |
| 75 Years and older | 221 (100.0%) | 0 (0.0%) |
| Total | 3,262 (84.6%) | 595 (15.4%) |
Health Insurance Coverage by Citizenship Status in Rosemont
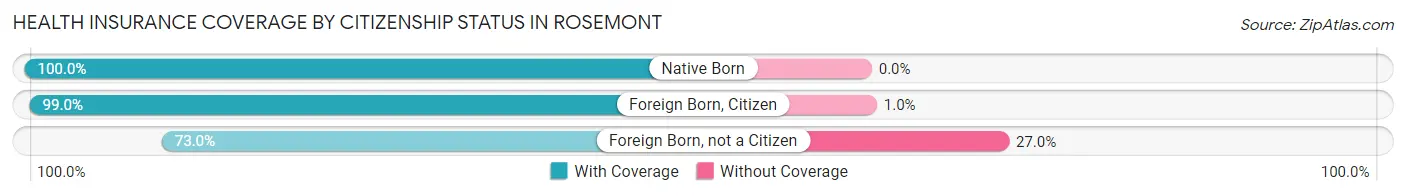
| Citizenship Status | With Coverage | Without Coverage |
| Native Born | 204 (100.0%) | 0 (0.0%) |
| Foreign Born, Citizen | 594 (99.0%) | 6 (1.0%) |
| Foreign Born, not a Citizen | 276 (73.0%) | 102 (27.0%) |
Health Insurance Coverage by Household Income in Rosemont
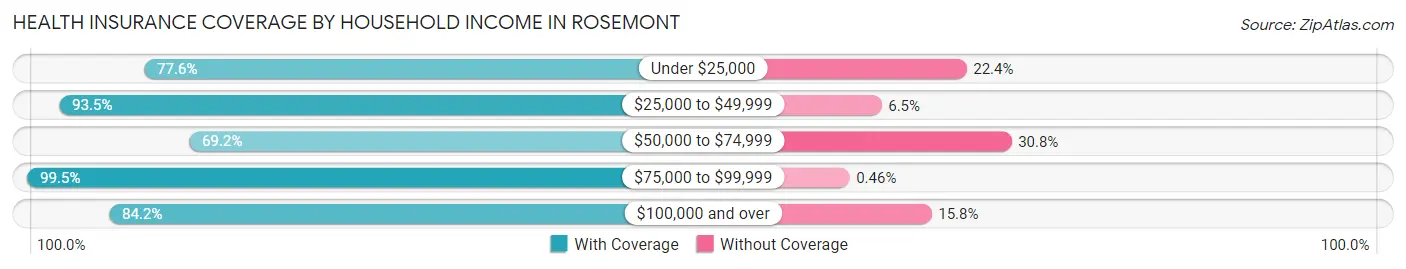
| Household Income | With Coverage | Without Coverage |
| Under $25,000 | 281 (77.6%) | 81 (22.4%) |
| $25,000 to $49,999 | 246 (93.5%) | 17 (6.5%) |
| $50,000 to $74,999 | 701 (69.2%) | 312 (30.8%) |
| $75,000 to $99,999 | 1,077 (99.5%) | 5 (0.5%) |
| $100,000 and over | 957 (84.2%) | 180 (15.8%) |
Public vs Private Health Insurance Coverage by Age in Rosemont
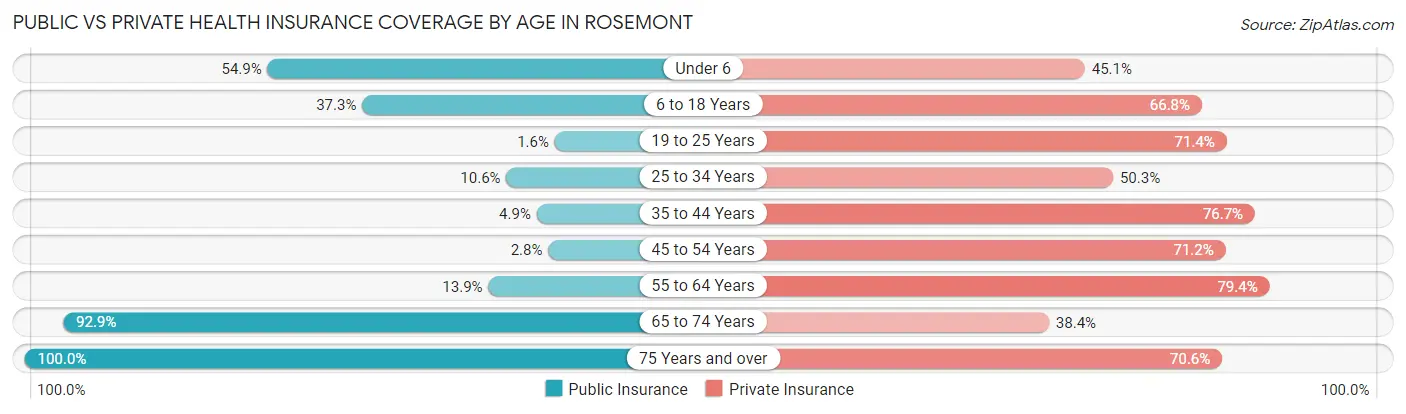
| Age Bracket | Public Insurance | Private Insurance |
| Under 6 | 112 (54.9%) | 92 (45.1%) |
| 6 to 18 Years | 224 (37.3%) | 401 (66.8%) |
| 19 to 25 Years | 6 (1.6%) | 270 (71.4%) |
| 25 to 34 Years | 46 (10.6%) | 219 (50.3%) |
| 35 to 44 Years | 25 (4.9%) | 388 (76.7%) |
| 45 to 54 Years | 17 (2.8%) | 433 (71.2%) |
| 55 to 64 Years | 85 (13.9%) | 485 (79.4%) |
| 65 to 74 Years | 273 (92.9%) | 113 (38.4%) |
| 75 Years and over | 221 (100.0%) | 156 (70.6%) |
| Total | 1,009 (26.2%) | 2,557 (66.3%) |
Disability Status by Sex by Age in Rosemont
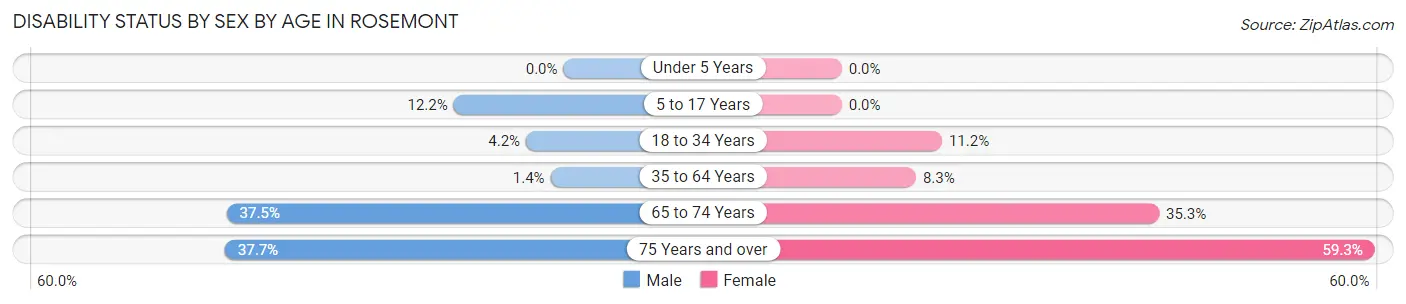
| Age Bracket | Male | Female |
| Under 5 Years | 0 (0.0%) | 0 (0.0%) |
| 5 to 17 Years | 40 (12.2%) | 0 (0.0%) |
| 18 to 34 Years | 17 (4.2%) | 56 (11.2%) |
| 35 to 64 Years | 14 (1.4%) | 62 (8.3%) |
| 65 to 74 Years | 54 (37.5%) | 53 (35.3%) |
| 75 Years and over | 49 (37.7%) | 54 (59.3%) |
Disability Class by Sex by Age in Rosemont
Disability Class: Hearing Difficulty
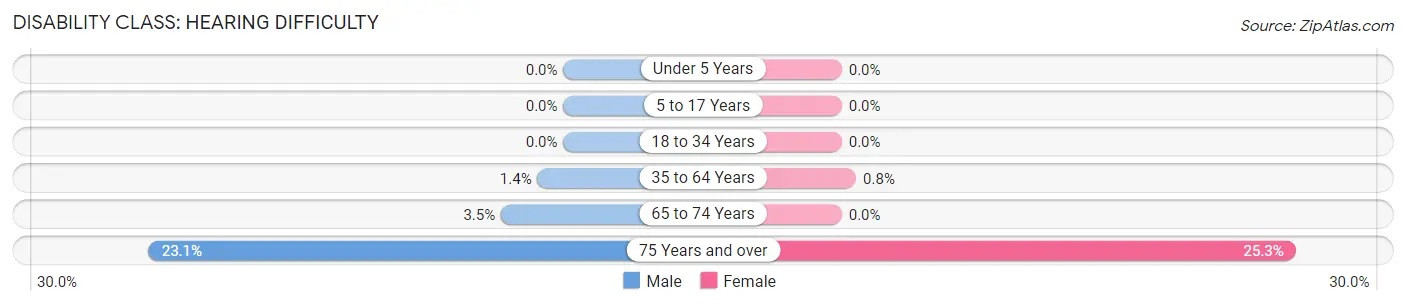
| Age Bracket | Male | Female |
| Under 5 Years | 0 (0.0%) | 0 (0.0%) |
| 5 to 17 Years | 0 (0.0%) | 0 (0.0%) |
| 18 to 34 Years | 0 (0.0%) | 0 (0.0%) |
| 35 to 64 Years | 14 (1.4%) | 6 (0.8%) |
| 65 to 74 Years | 5 (3.5%) | 0 (0.0%) |
| 75 Years and over | 30 (23.1%) | 23 (25.3%) |
Disability Class: Vision Difficulty
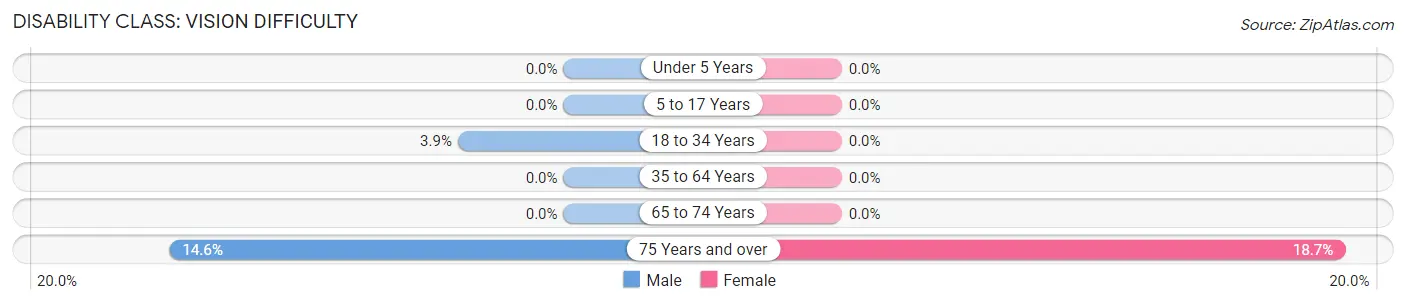
| Age Bracket | Male | Female |
| Under 5 Years | 0 (0.0%) | 0 (0.0%) |
| 5 to 17 Years | 0 (0.0%) | 0 (0.0%) |
| 18 to 34 Years | 16 (3.9%) | 0 (0.0%) |
| 35 to 64 Years | 0 (0.0%) | 0 (0.0%) |
| 65 to 74 Years | 0 (0.0%) | 0 (0.0%) |
| 75 Years and over | 19 (14.6%) | 17 (18.7%) |
Disability Class: Cognitive Difficulty
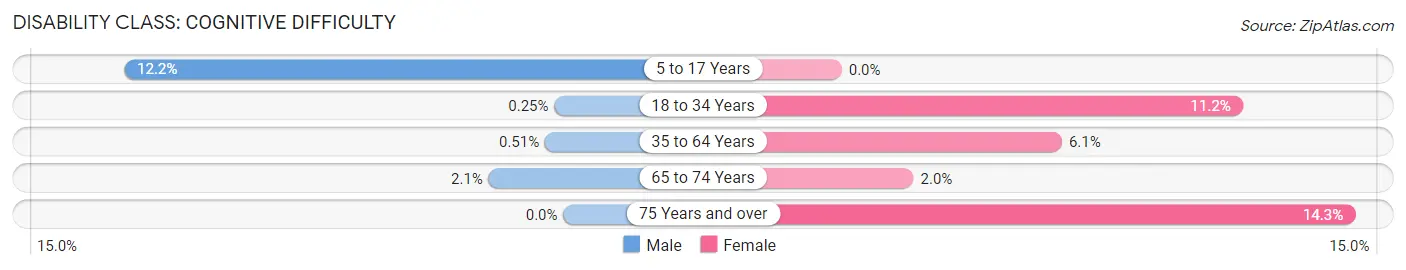
| Age Bracket | Male | Female |
| 5 to 17 Years | 40 (12.2%) | 0 (0.0%) |
| 18 to 34 Years | 1 (0.3%) | 56 (11.2%) |
| 35 to 64 Years | 5 (0.5%) | 46 (6.1%) |
| 65 to 74 Years | 3 (2.1%) | 3 (2.0%) |
| 75 Years and over | 0 (0.0%) | 13 (14.3%) |
Disability Class: Ambulatory Difficulty
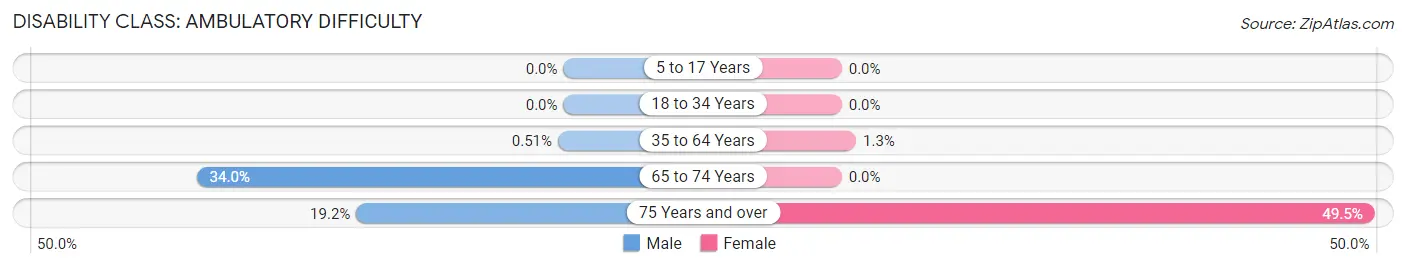
| Age Bracket | Male | Female |
| 5 to 17 Years | 0 (0.0%) | 0 (0.0%) |
| 18 to 34 Years | 0 (0.0%) | 0 (0.0%) |
| 35 to 64 Years | 5 (0.5%) | 10 (1.3%) |
| 65 to 74 Years | 49 (34.0%) | 0 (0.0%) |
| 75 Years and over | 25 (19.2%) | 45 (49.4%) |
Disability Class: Self-Care Difficulty
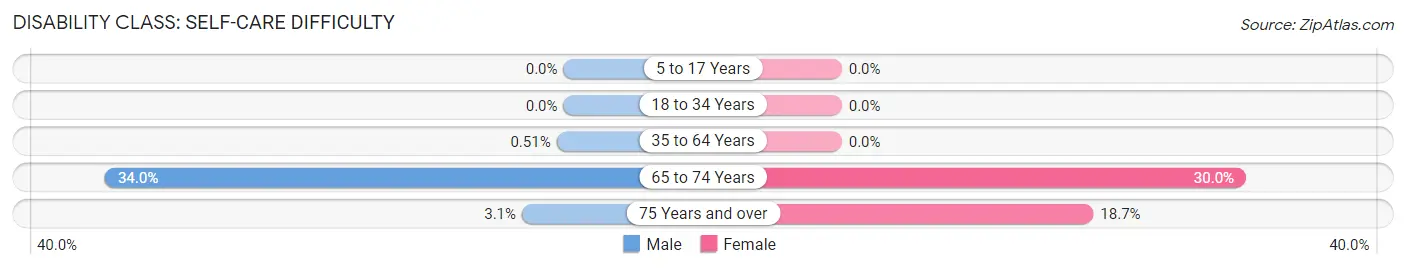
| Age Bracket | Male | Female |
| 5 to 17 Years | 0 (0.0%) | 0 (0.0%) |
| 18 to 34 Years | 0 (0.0%) | 0 (0.0%) |
| 35 to 64 Years | 5 (0.5%) | 0 (0.0%) |
| 65 to 74 Years | 49 (34.0%) | 45 (30.0%) |
| 75 Years and over | 4 (3.1%) | 17 (18.7%) |
Technology Access in Rosemont
Computing Device Access in Rosemont
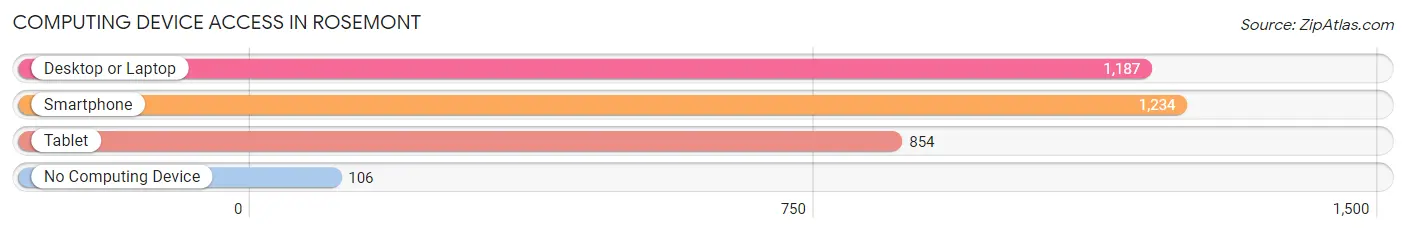
| Device Type | # Households | % Households |
| Desktop or Laptop | 1,187 | 75.0% |
| Smartphone | 1,234 | 78.0% |
| Tablet | 854 | 54.0% |
| No Computing Device | 106 | 6.7% |
| Total | 1,582 | 100.0% |
Internet Access in Rosemont
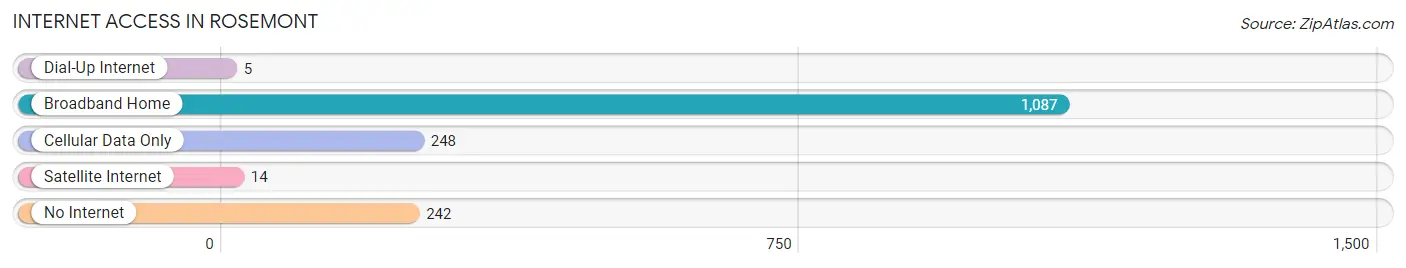
| Internet Type | # Households | % Households |
| Dial-Up Internet | 5 | 0.3% |
| Broadband Home | 1,087 | 68.7% |
| Cellular Data Only | 248 | 15.7% |
| Satellite Internet | 14 | 0.9% |
| No Internet | 242 | 15.3% |
| Total | 1,582 | 100.0% |
Rosemont Summary
Rosemont, Illinois is a village located in Cook County, Illinois, United States. It is a suburb of Chicago, located approximately 17 miles northwest of the city. The village is situated near O'Hare International Airport and is home to the Allstate Arena, the Donald E. Stephens Convention Center, and the Rosemont Theatre. As of the 2010 census, the village had a population of 4,202.
History
Rosemont was first settled in 1834 by German and Irish immigrants. The village was originally known as the "Mud Lake Settlement" due to its location near a shallow lake. In 1851, the village was renamed Rosemont after the Rosemont Land Company, which was formed to develop the area.
In the late 19th century, Rosemont was a popular summer resort for wealthy Chicagoans. The village was incorporated in 1956 and experienced rapid growth in the following decades. In the 1970s, the village began to develop into a commercial and entertainment hub, with the construction of the Donald E. Stephens Convention Center and the Rosemont Theatre.
Geography
Rosemont is located in northeastern Illinois, approximately 17 miles northwest of Chicago. The village is situated in Cook County, near O'Hare International Airport. The village covers an area of 2.2 square miles, with a population density of 1,890 people per square mile.
The village is bordered by the Des Plaines River to the east, the Tri-State Tollway to the west, and the O'Hare Airport to the south. The village is also home to the Rosemont Park District, which includes the Rosemont Park, the Rosemont Sports Complex, and the Rosemont Golf Course.
Economy
Rosemont is a major commercial and entertainment hub in the Chicago metropolitan area. The village is home to the Donald E. Stephens Convention Center, the Allstate Arena, the Rosemont Theatre, and the Fashion Outlets of Chicago. The village is also home to a number of corporate headquarters, including the headquarters of the American Academy of Orthopaedic Surgeons, the American College of Healthcare Executives, and the American Society of Anesthesiologists.
The village is also home to a number of hotels, restaurants, and retail stores. The village is served by the Metra commuter rail line, which provides access to downtown Chicago.
Demographics
As of the 2010 census, the village had a population of 4,202. The racial makeup of the village was 79.2% White, 8.3% African American, 0.2% Native American, 5.2% Asian, and 6.9% from other races. Hispanic or Latino of any race were 16.2% of the population.
The median household income in the village was $50,977, and the median family income was $62,917. The per capita income in the village was $30,945. About 5.2% of families and 7.2% of the population were below the poverty line.
Common Questions
What is Per Capita Income in Rosemont?
Per Capita income in Rosemont is $36,230.
What is the Median Family Income in Rosemont?
Median Family Income in Rosemont is $86,291.
What is the Median Household income in Rosemont?
Median Household Income in Rosemont is $70,455.
What is Income or Wage Gap in Rosemont?
Income or Wage Gap in Rosemont is 30.9%.
Women in Rosemont earn 69.1 cents for every dollar earned by a man.
What is Inequality or Gini Index in Rosemont?
Inequality or Gini Index in Rosemont is 0.41.
What is the Total Population of Rosemont?
Total Population of Rosemont is 3,864.
What is the Total Male Population of Rosemont?
Total Male Population of Rosemont is 2,065.
What is the Total Female Population of Rosemont?
Total Female Population of Rosemont is 1,799.
What is the Ratio of Males per 100 Females in Rosemont?
There are 114.79 Males per 100 Females in Rosemont.
What is the Ratio of Females per 100 Males in Rosemont?
There are 87.12 Females per 100 Males in Rosemont.
What is the Median Population Age in Rosemont?
Median Population Age in Rosemont is 42.5 Years.
What is the Average Family Size in Rosemont
Average Family Size in Rosemont is 3.1 People.
What is the Average Household Size in Rosemont
Average Household Size in Rosemont is 2.4 People.
How Large is the Labor Force in Rosemont?
There are 2,232 People in the Labor Forcein in Rosemont.
What is the Percentage of People in the Labor Force in Rosemont?
68.2% of People are in the Labor Force in Rosemont.
What is the Unemployment Rate in Rosemont?
Unemployment Rate in Rosemont is 4.3%.